46
IWBRA, May2006 1 Chordal Graphs in Computational Biology – New Insights and Applications Teresa Przytycka NIH / NLM / NCBI
| Date post: | 03-Aug-2018 |
| Category: |
Documents |
| Upload: | phungkhanh |
| View: | 231 times |
| Download: | 0 times |
IWBRA, May2006 1
Chordal Graphs in
Computational Biology –
New Insights and
Applications
Teresa Przytycka
NIH / NLM / NCBI
IWBRA, May2006 2
Overview
Chordal graphs - definitions and properties
Classical application to perfect phylogeny
New applications
Intron evolution
Understanding evolution of multi-domain
proteins
Static and dynamic decomposition of protein
complexes
Conclusions
IWBRA, May2006 3
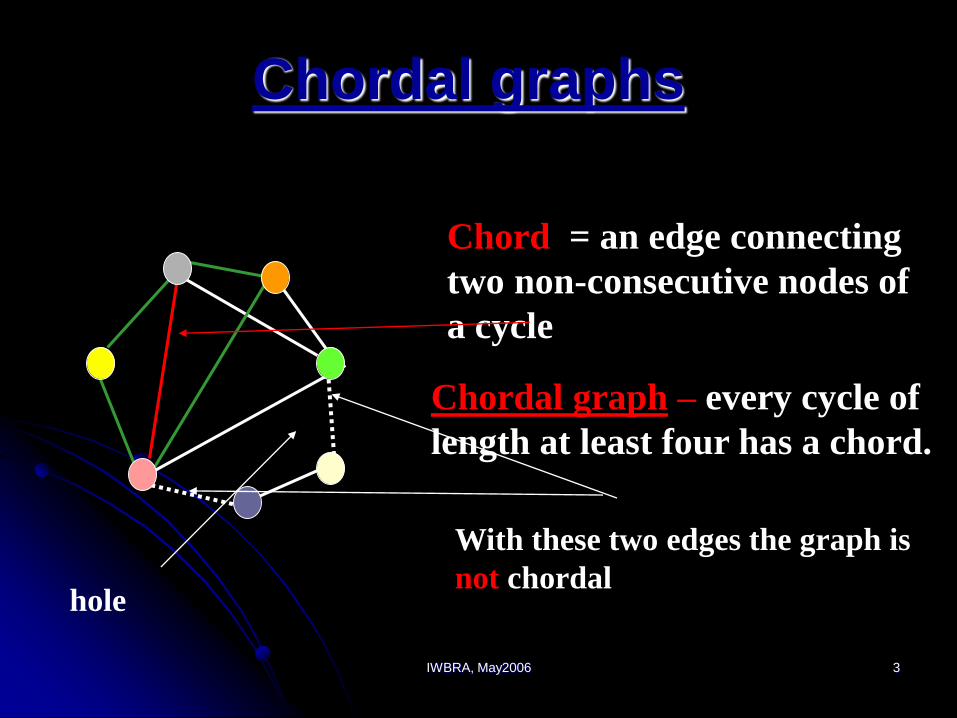
Chord = an edge connecting
two non-consecutive nodes of
a cycle
Chordal graph – every cycle of
length at least four has a chord.
With these two edges the graph is
not chordalhole
Chordal graphs
IWBRA, May2006 4
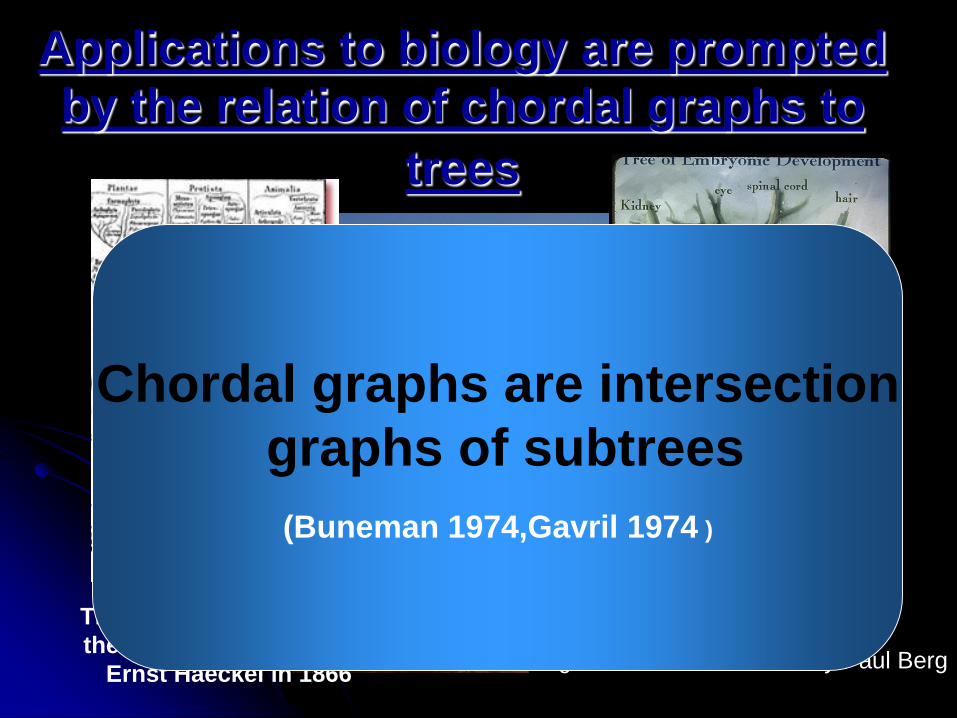
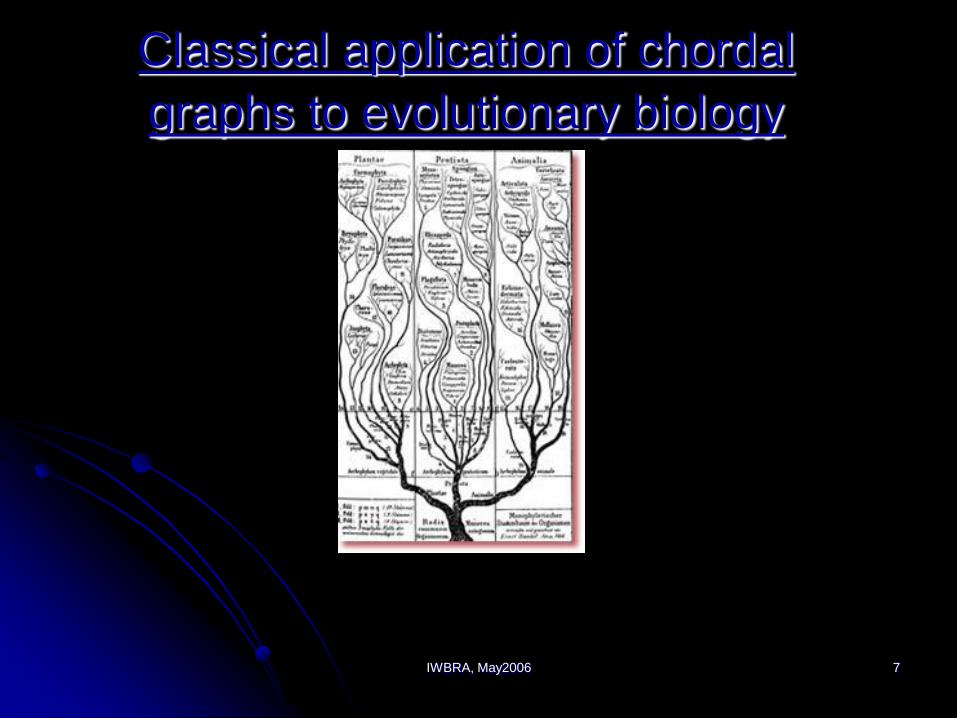
Applications to biology are prompted
by the relation of chordal graphs to
trees
The "tree of life" drawn by
the evolutionary biologist
Ernst Haeckel in 1866
Tree representing
Embryonic Development
Figure from lecture notes by Paul Berg
Chordal graphs are intersection
graphs of subtrees
(Buneman 1974,Gavril 1974 )
IWBRA, May2006 5
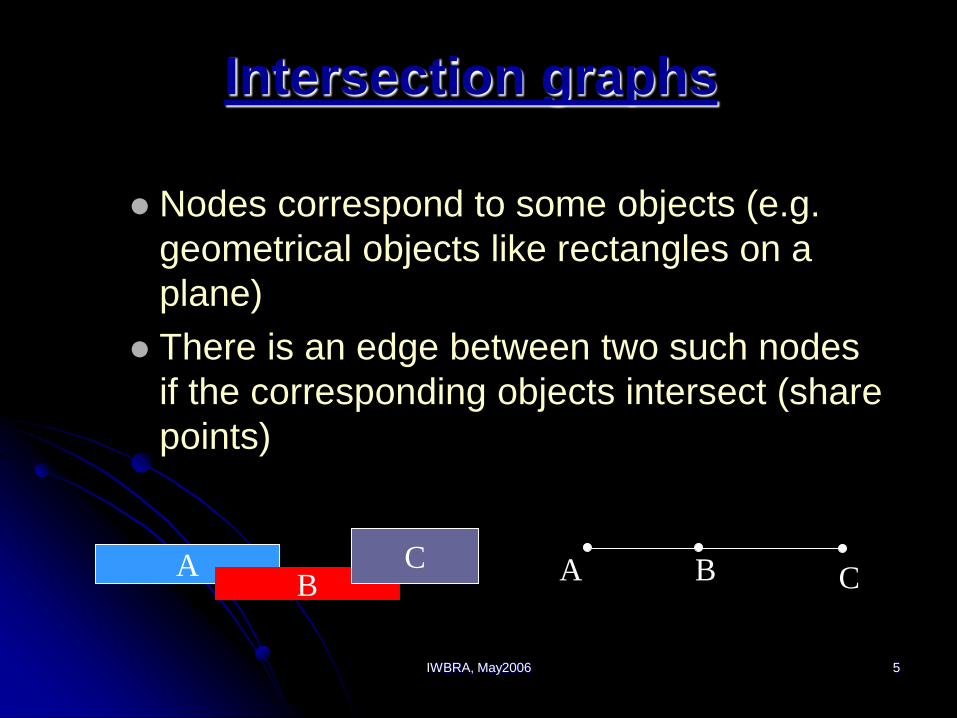
Intersection graphs
Nodes correspond to some objects (e.g.
geometrical objects like rectangles on a
plane)
There is an edge between two such nodes
if the corresponding objects intersect (share
points)
AB
CCA B
IWBRA, May2006 6
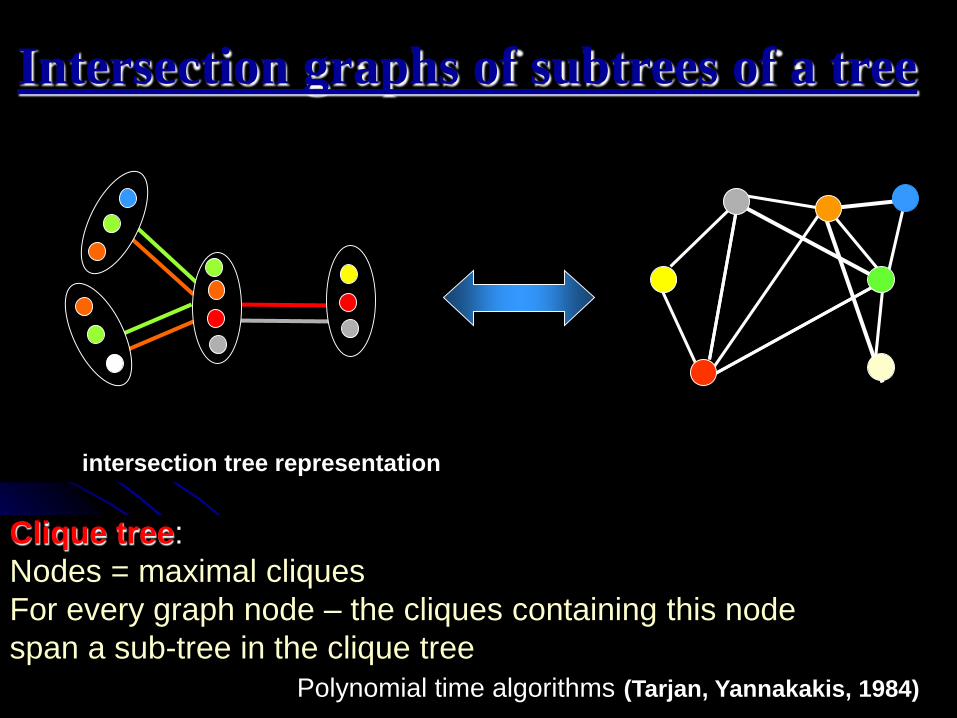
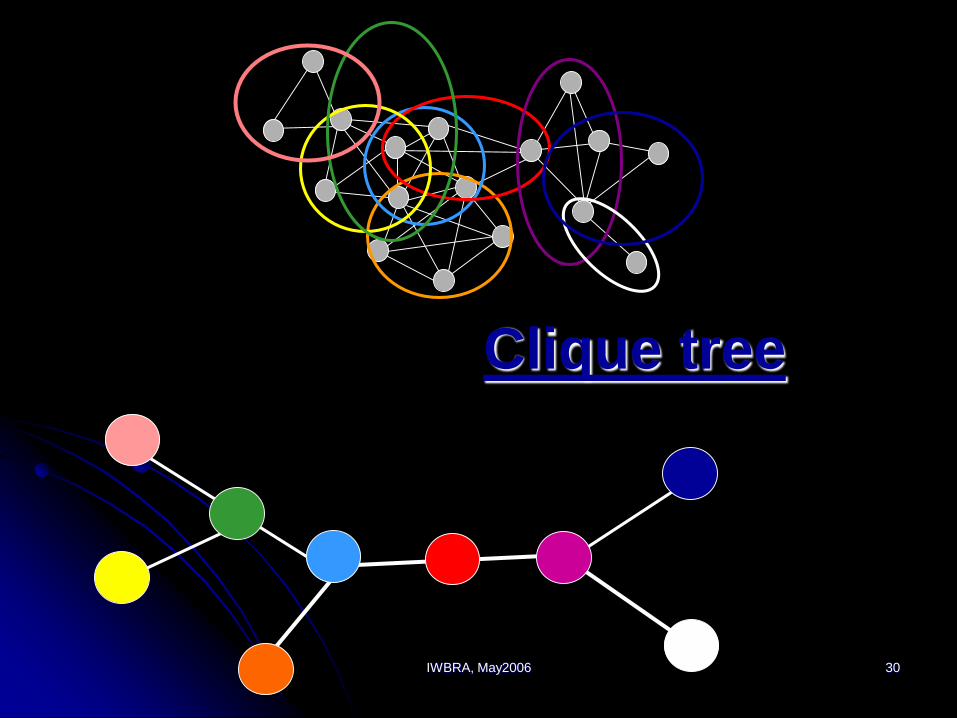
Intersection graphs of subtrees of a tree
Clique tree:
Nodes = maximal cliques
For every graph node – the cliques containing this node
span a sub-tree in the clique tree
Polynomial time algorithms (Tarjan, Yannakakis, 1984)
intersection tree representation
IWBRA, May2006 7
Classical application of chordal
graphs to evolutionary biology
IWBRA, May2006 8
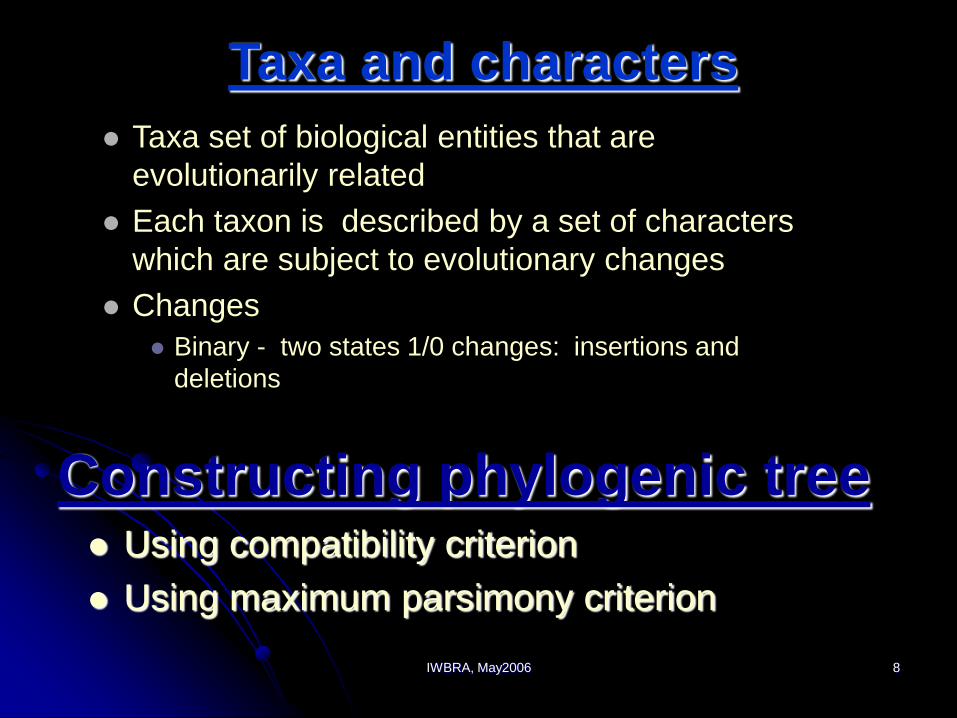
Taxa and characters
Taxa set of biological entities that are
evolutionarily related
Each taxon is described by a set of characters
which are subject to evolutionary changes
Changes
Binary - two states 1/0 changes: insertions and
deletions
Using compatibility criterion
Using maximum parsimony criterion
Constructing phylogenic tree
IWBRA, May2006 9
For any character and any state
nodes with given character state
occupy connected subtree
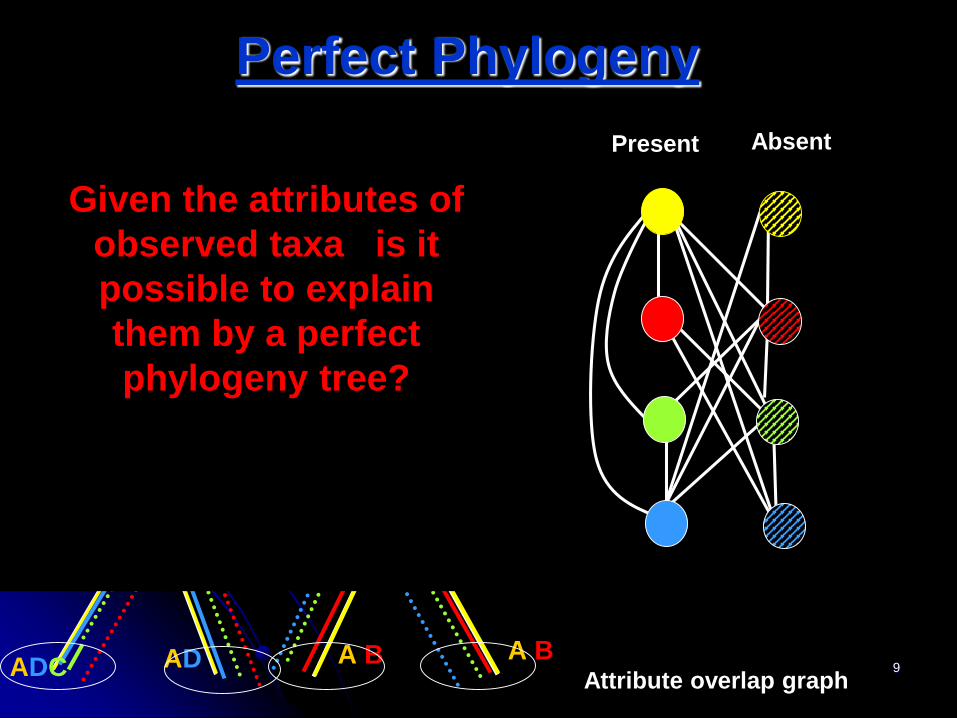
Perfect Phylogeny
AD
AD
A B
A
A B
A B
ADC
Present Absent
Attribute overlap graph
Given the attributes of
observed taxa is it
possible to explain
them by a perfect
phylogeny tree?
IWBRA, May2006 10
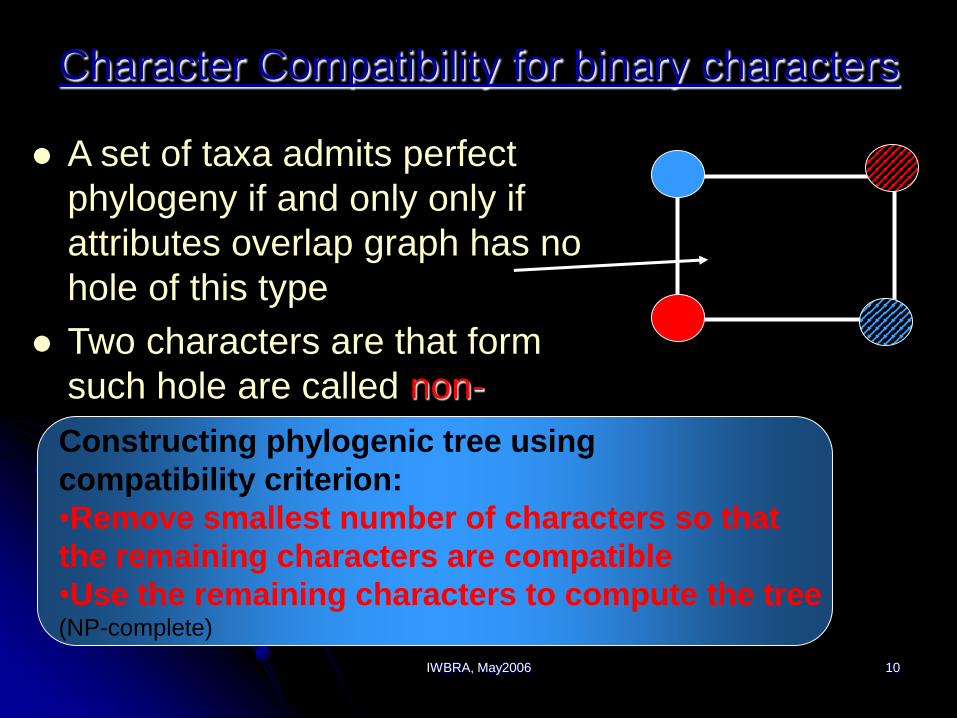
Character Compatibility for binary characters
A set of taxa admits perfect
phylogeny if and only only if
attributes overlap graph has no
hole of this type
Two characters are that form
such hole are called non-
compatibleConstructing phylogenic tree using
compatibility criterion:
•Remove smallest number of characters so that
the remaining characters are compatible
•Use the remaining characters to compute the tree(NP-complete)
IWBRA, May2006 11
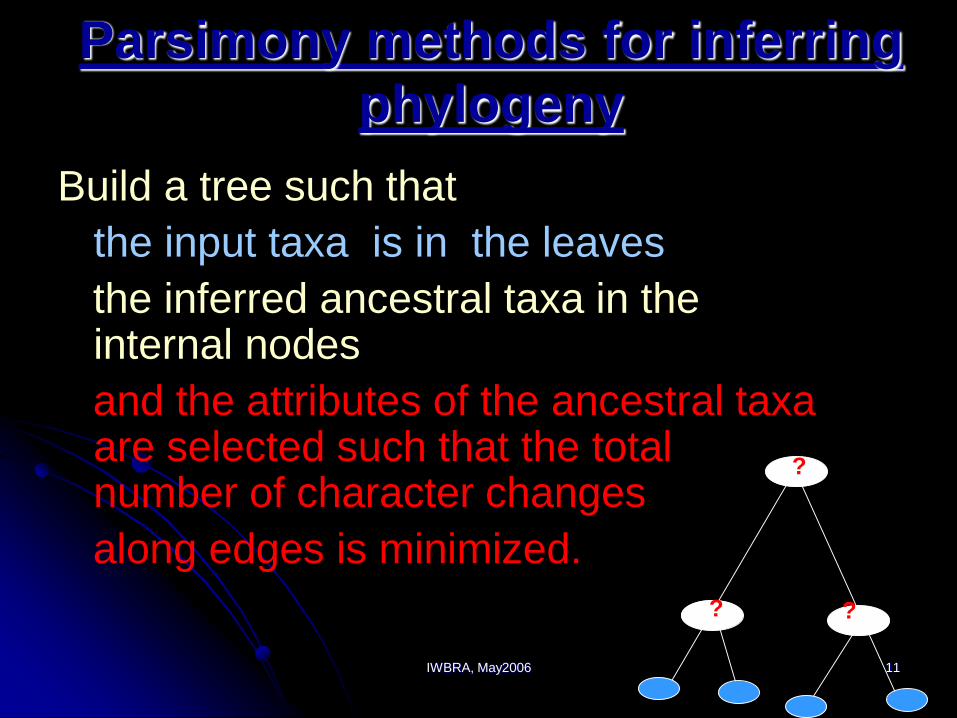
Parsimony methods for inferring
phylogeny
Build a tree such that
the input taxa is in the leaves
the inferred ancestral taxa in the internal nodes
and the attributes of the ancestral taxa are selected such that the total number of character changes
along edges is minimized.
?
? ?
IWBRA, May2006 12
Dollo parsimony
Only one insertion per character
Multiple deletions possible
Appropriate for complex characters that
are hard to gain but possible to lose
IWBRA, May2006 13
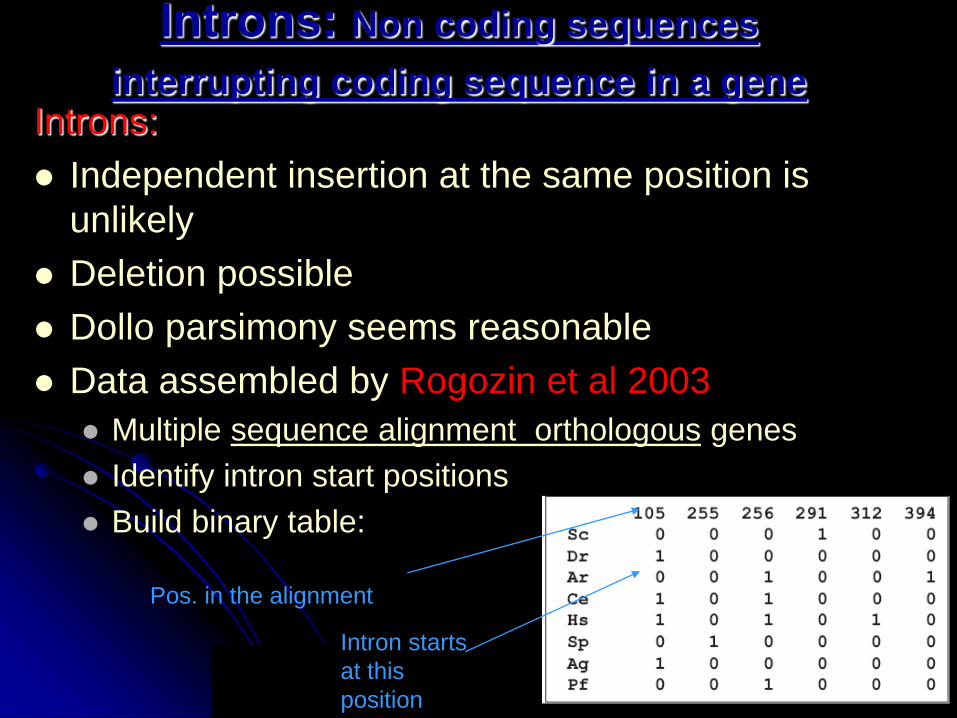
Introns: Non coding sequences
interrupting coding sequence in a gene
Pos. in the alignment
Intron starts
at this
position
Introns:
Independent insertion at the same position is
unlikely
Deletion possible
Dollo parsimony seems reasonable
Data assembled by Rogozin et al 2003
Multiple sequence alignment orthologous genes
Identify intron start positions
Build binary table:
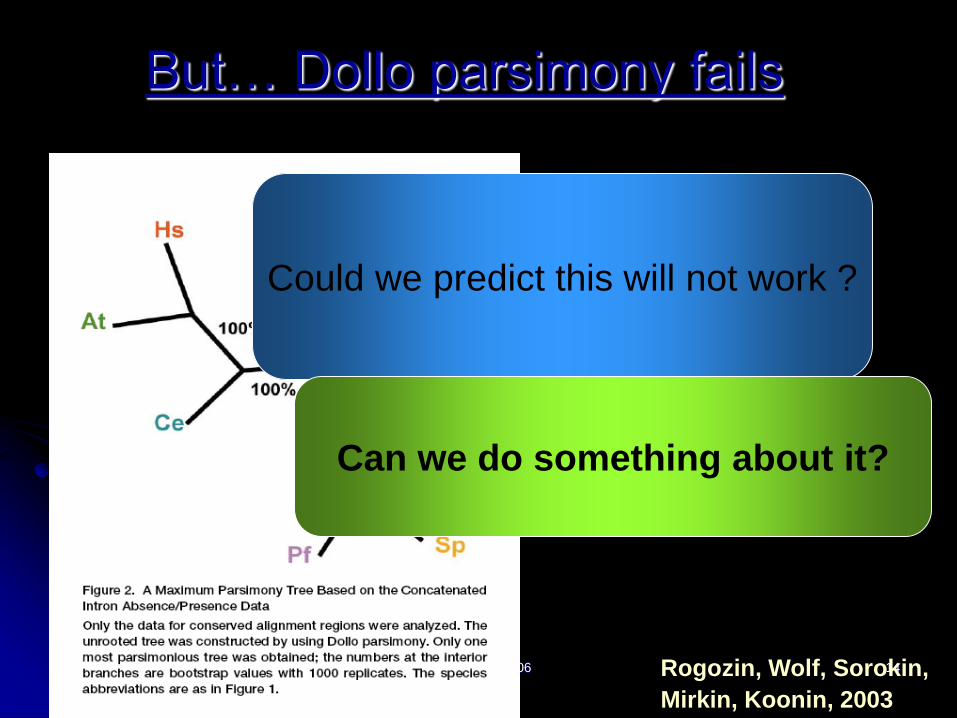
IWBRA, May2006 14Rogozin, Wolf, Sorokin,
Mirkin, Koonin, 2003
But… Dollo parsimony fails
Dollo tree
constructed
based on intron
data
Could we predict this will not work ?
Can we do something about it?
IWBRA, May2006 15
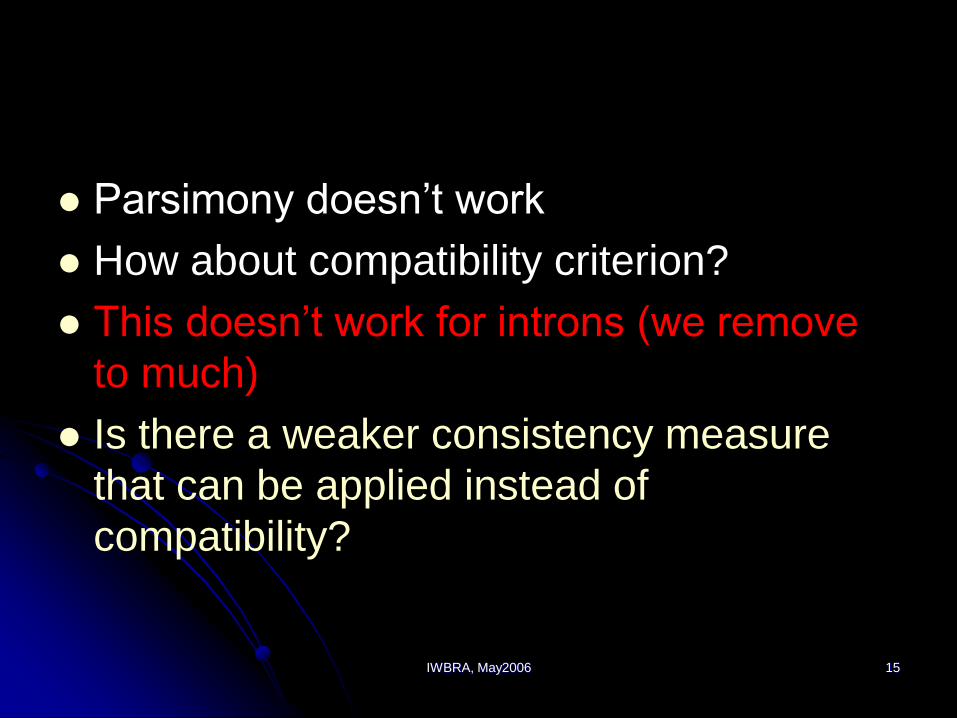
Parsimony doesn’t work
How about compatibility criterion?
This doesn’t work for introns (we remove
to much)
Is there a weaker consistency measure
that can be applied instead of
compatibility?
IWBRA, May2006 16
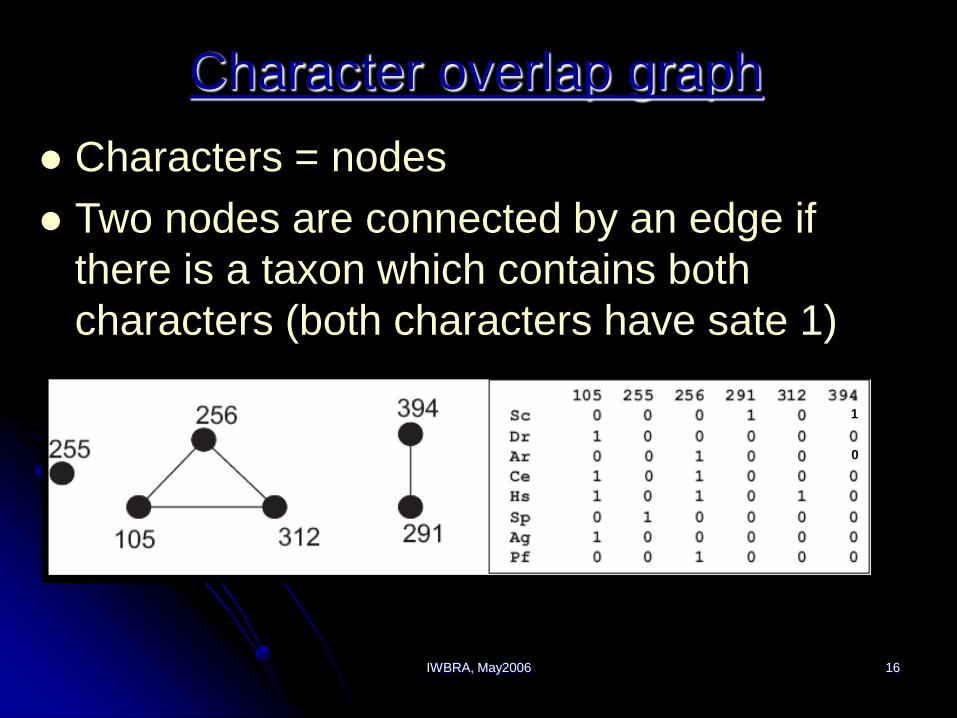
Character overlap graph
Characters = nodes
Two nodes are connected by an edge if
there is a taxon which contains both
characters (both characters have sate 1)
10
1
0
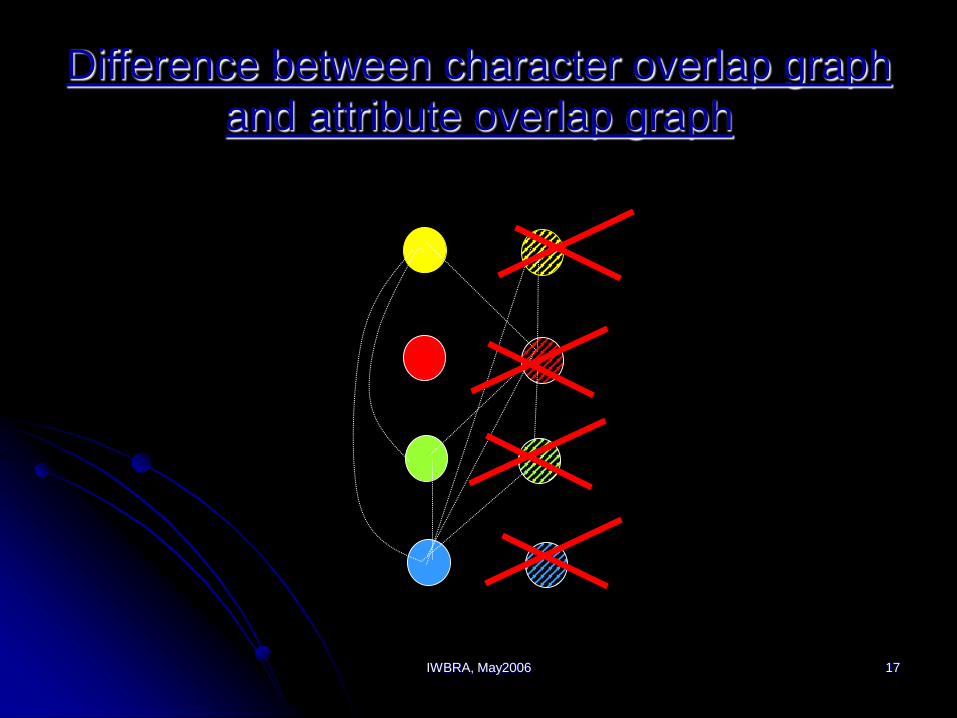
IWBRA, May2006 17
Difference between character overlap graph
and attribute overlap graph
IWBRA, May2006 18
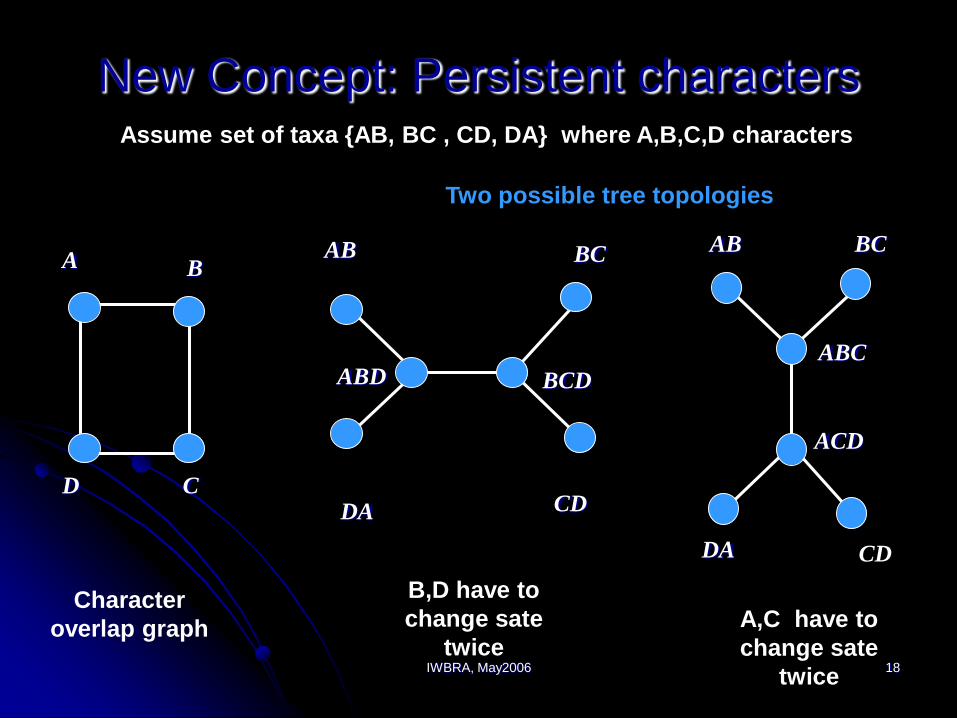
New Concept: Persistent charactersAssume set of taxa {AB, BC , CD, DA} where A,B,C,D characters
D
A B
C
Character
overlap graph
AB
DA CD
ABD BCD
BC
B,D have to
change sate
twice
BCAB
CDDA
ACD
ABC
A,C have to
change sate
twice
Two possible tree topologies
IWBRA, May2006 19
Persistent characters
A character is persistent if it does not belong to a hole.
A set of characters is persistent if and only if the character overlap graph is chordal
Property: a set of characters where each character can change its state at most twice (insertion first and then deletion) is persistent
Thus persistency is a weaker assumption than compatibility
Przytycka RECOMB 2006
IWBRA, May2006 20
Removing non-persistent
characters
Remove smallest number of character so that
character overlap graph is chordal
Construct the tree from the remaining data.
Problem: Finding such minimal set is NP-
complete; so is finding all holes.
Heuristic approach: consider only squares and
remove them in a greedy way.
For the intron data, enough characters were
preserved to build the tree Przytycka, RECOMB 2006
IWBRA, May2006 21
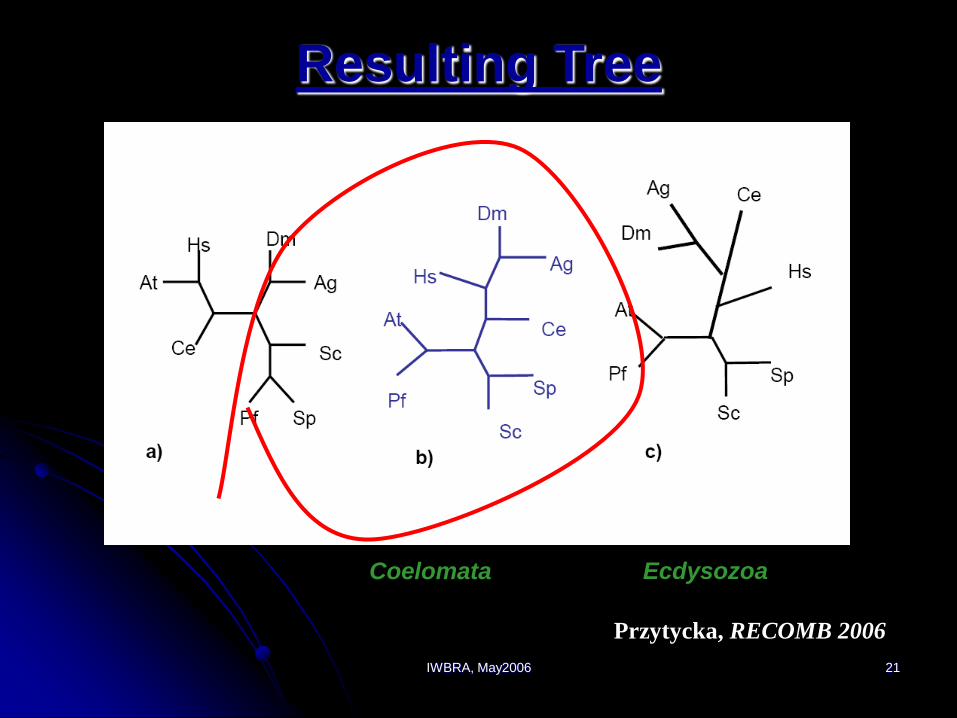
Resulting Tree
Coelomata Ecdysozoa
Przytycka, RECOMB 2006
IWBRA, May2006 22
Coelomata: traditional
Ecdysozoa:
Aguinaldo et al. 1997
Girbet et al. 2000
Peterson and Eernisse 2001
Mallatt and Winchell 2002
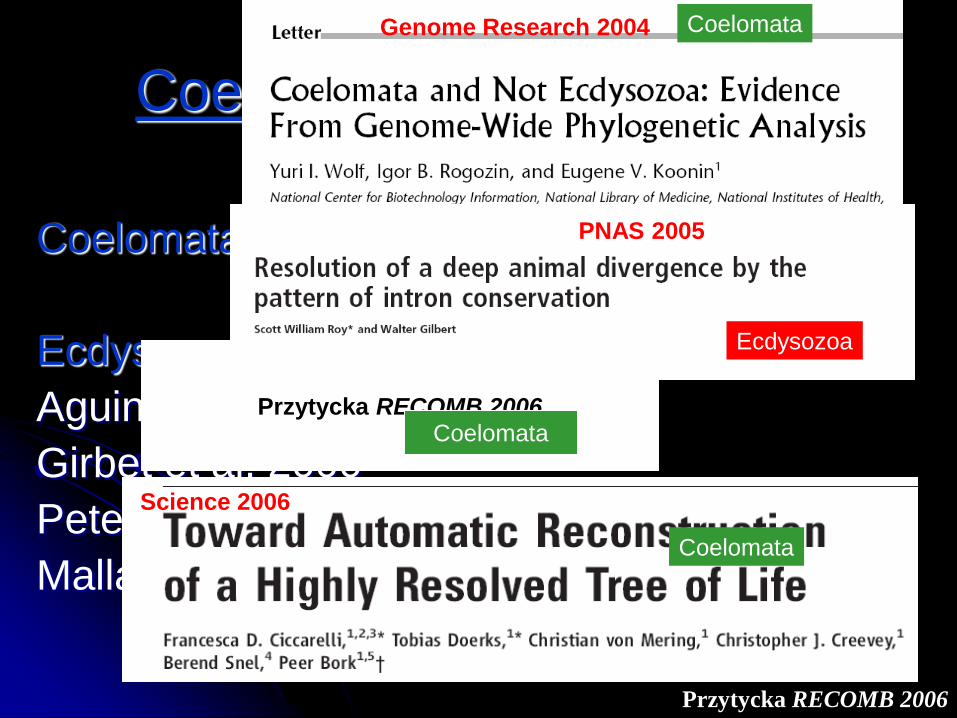
Coelomata or Ecdysozoa?
Genome Research 2004 Coelomata
Ecdysozoa !!
Science 2006
Coelomata
Przytycka RECOMB 2006
PNAS 2005
Ecdysozoa
Przytycka RECOMB 2006Coelomata
IWBRA, May2006 23
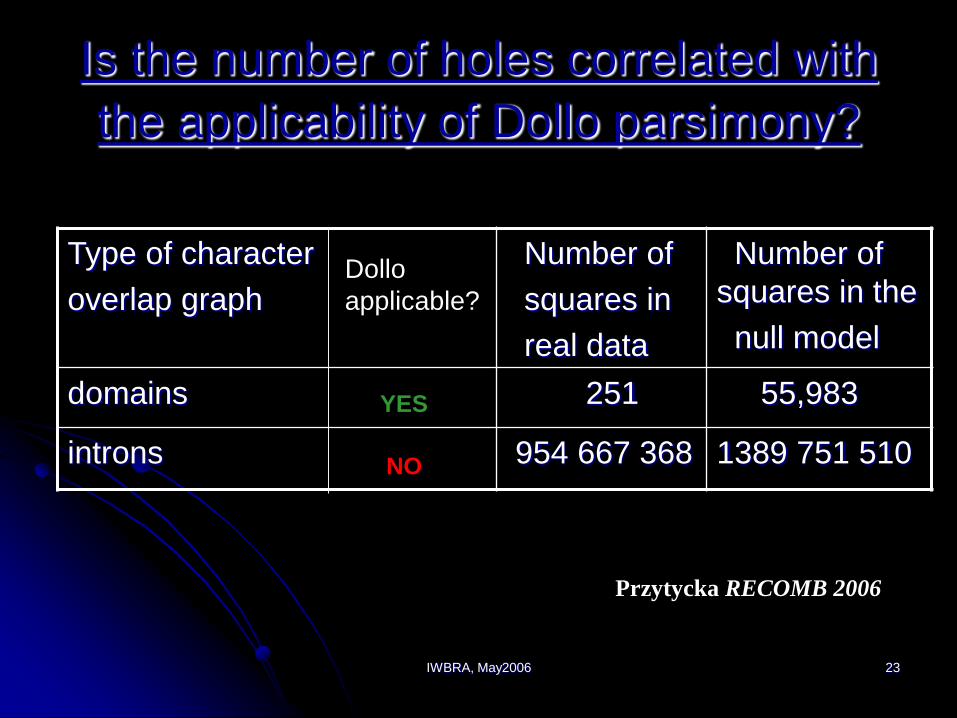
Is the number of holes correlated with
the applicability of Dollo parsimony?
Type of character
overlap graph
Number of
squares in
real data
Number of
squares in the
null model
domains 251 55,983
introns 954 667 368 1389 751 510
Dollo
applicable?
YES
NO
Przytycka RECOMB 2006
IWBRA, May2006 24
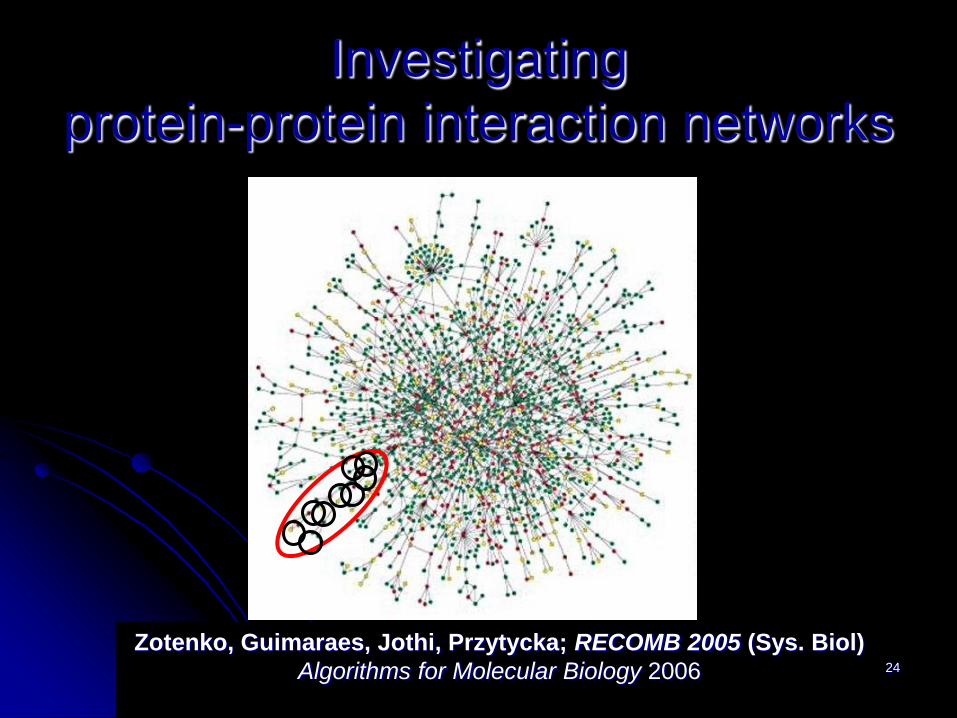
Investigating
protein-protein interaction networks
Zotenko, Guimaraes, Jothi, Przytycka; RECOMB 2005 (Sys. Biol)
Algorithms for Molecular Biology 2006
IWBRA, May2006 25
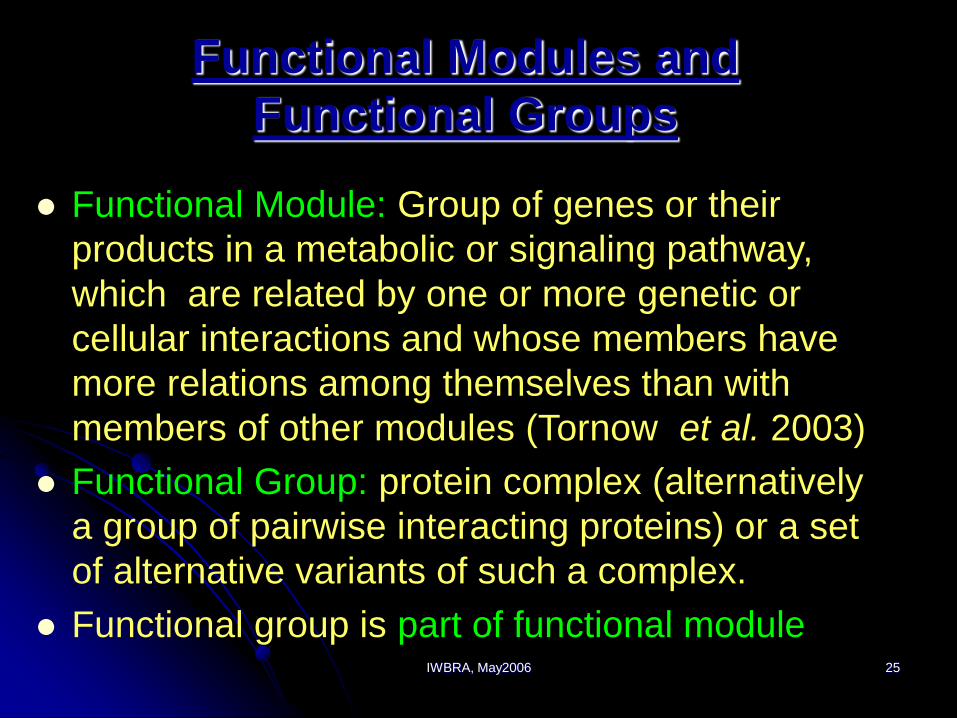
Functional Modules and
Functional Groups
Functional Module: Group of genes or their
products in a metabolic or signaling pathway,
which are related by one or more genetic or
cellular interactions and whose members have
more relations among themselves than with
members of other modules (Tornow et al. 2003)
Functional Group: protein complex (alternatively
a group of pairwise interacting proteins) or a set
of alternative variants of such a complex.
Functional group is part of functional module
IWBRA, May2006 26
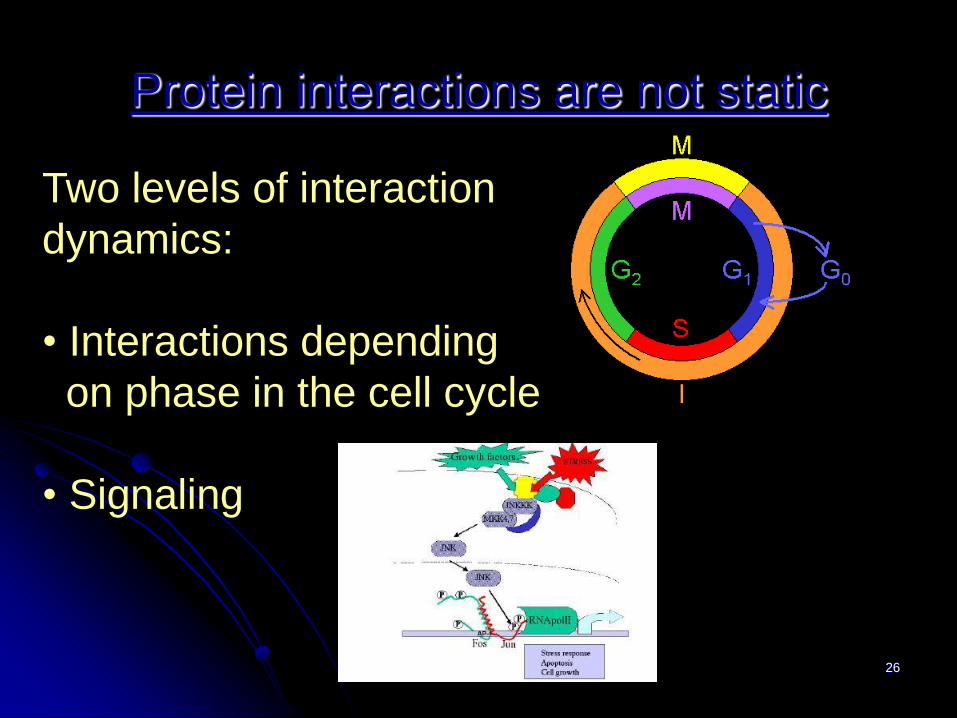
Protein interactions are not static
Two levels of interaction
dynamics:
• Interactions depending
on phase in the cell cycle
• Signaling
IWBRA, May2006 27
Challenge
Within a subnetwork (functional module)
assumed to contain molecules involved in a
dynamic process (like signaling pathway),
identify functional groups and partial order
of their formation
IWBRA, May2006 28
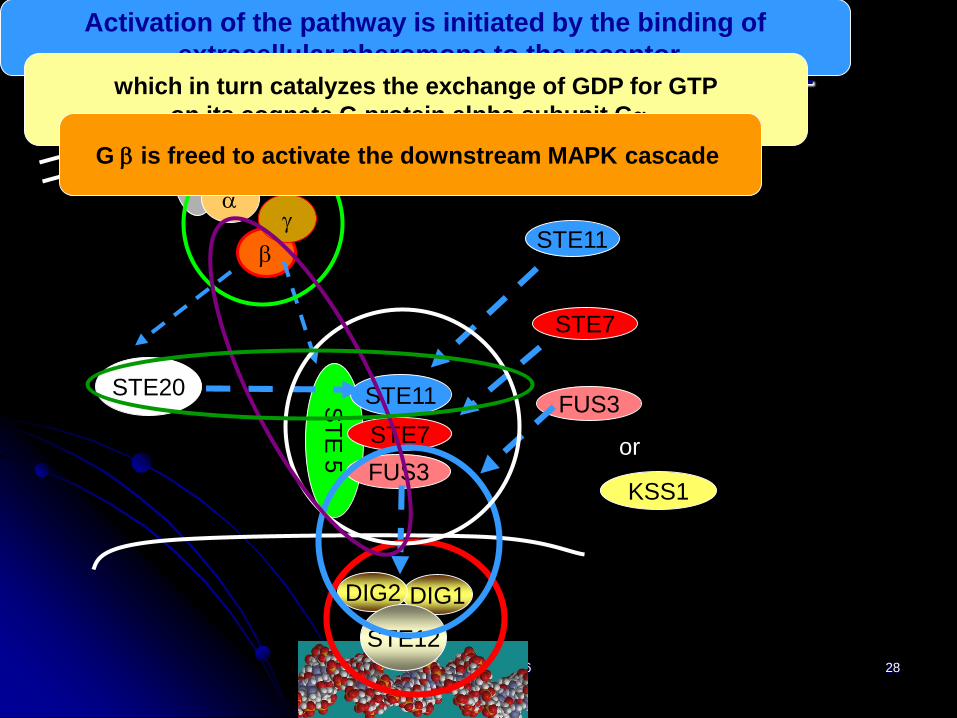
Pheromone signaling pathway
recepto
ra
b
g
ST
E 5
STE11
STE7
FUS3
STE11
STE7
FUS3
DIG1DIG2
STE12
KSS1
or
STE20
Activation of the pathway is initiated by the binding of
extracellular pheromone to the receptorwhich in turn catalyzes the exchange of GDP for GTP
on its cognate G protein alpha subunit Ga.
G b is freed to activate the downstream MAPK cascade
IWBRA, May2006 29
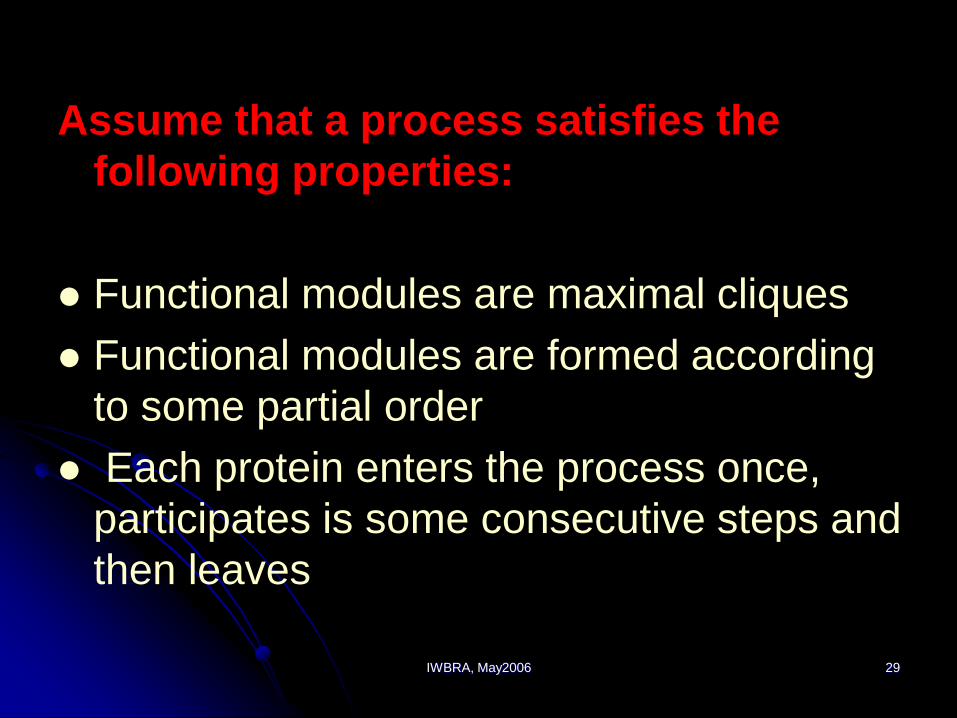
Assume that a process satisfies the
following properties:
Functional modules are maximal cliques
Functional modules are formed according
to some partial order
Each protein enters the process once,
participates is some consecutive steps and
then leaves
IWBRA, May2006 30
Clique tree
IWBRA, May2006 31
Is protein interaction network chordal?
Not really
Consider smaller subnetworks like
functional modules
Is such subnetwork chordal?
Not necessarily but if it is not it is typically
close to it!
Furthermore, the places where they
violates chordality tend to be of interest.
IWBRA, May2006 32
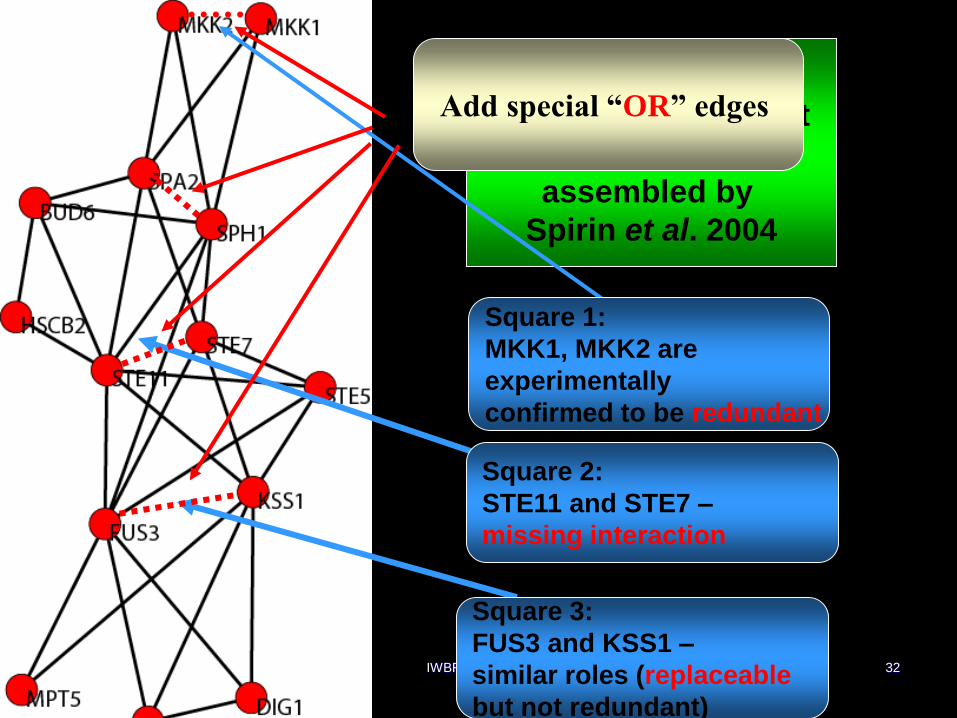
I
Pheromone pathway
from high throughput
data;
assembled by
Spirin et al. 2004
Square 1:
MKK1, MKK2 are
experimentally
confirmed to be redundant
Square 2:
STE11 and STE7 –
missing interaction
Square 3:
FUS3 and KSS1 –
similar roles (replaceable
but not redundant)
Add special “OR” edges
IWBRA, May2006 33
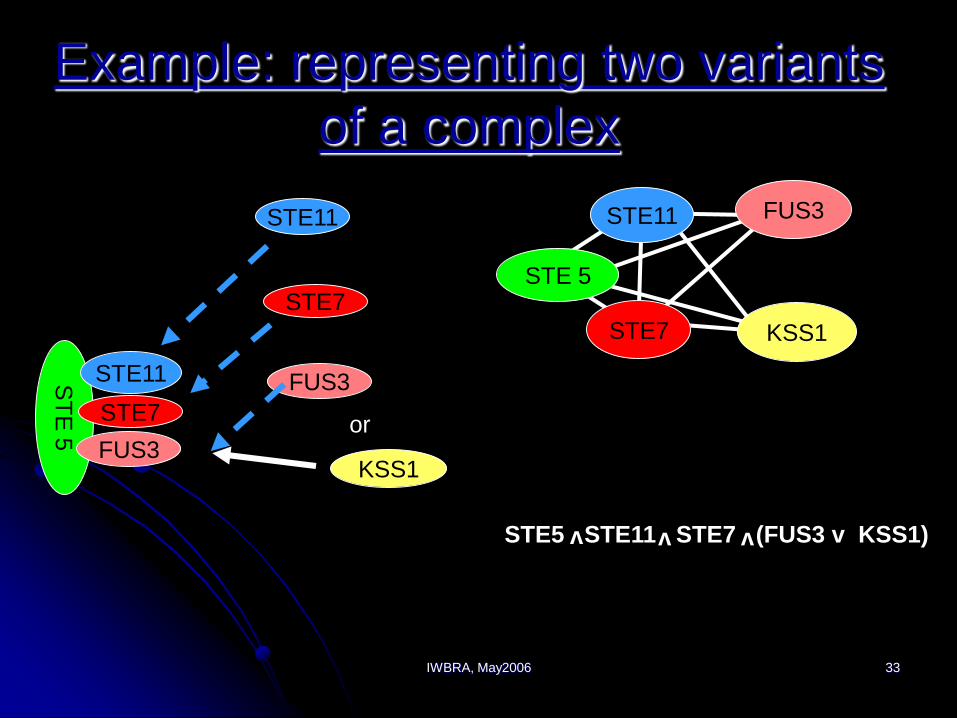
Example: representing two variants
of a complex
ST
E 5
STE11
STE7
FUS3
STE11
STE7
FUS3
KSS1
or
STE11
STE7
FUS3
KSS1
STE 5
STE5 STE11 STE7 (FUS3 v KSS1)vv v
IWBRA, May2006 34
10
1
23
4
56
7
8
9
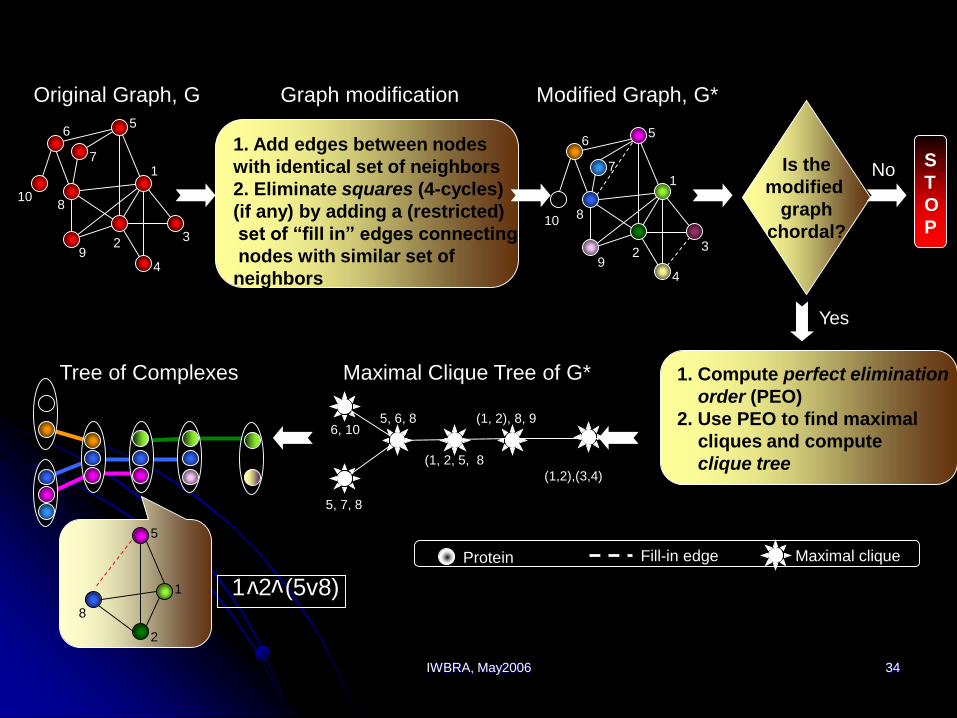
Original Graph, G
Is the
modified
graph
chordal?
S
T
O
P
1. Compute perfect elimination
order (PEO)
2. Use PEO to find maximal
cliques and compute
clique tree
Yes
No
Tree of Complexes
1. Add edges between nodes
with identical set of neighbors
2. Eliminate squares (4-cycles)
(if any) by adding a (restricted)
set of “fill in” edges connecting
nodes with similar set of
neighbors
Graph modification Modified Graph, G*
1
23
4
6
8
9
5
7
10
Maximal cliqueProtein Fill-in edge
Maximal Clique Tree of G*
6, 105, 6, 8
5, 7, 8
(1, 2, 5, 8
(1, 2), 8, 9
(1,2),(3,4)
1 2 (5v8)
vv
1
5
2
8
IWBRA, May2006 35
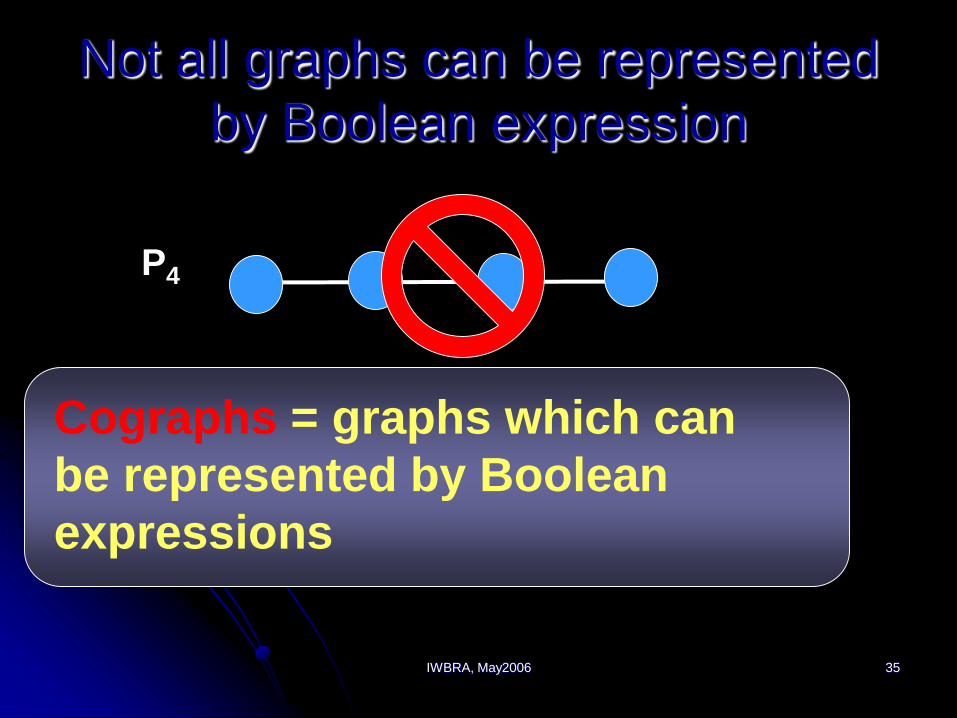
Not all graphs can be represented
by Boolean expression
P4
Cographs = graphs which can
be represented by Boolean
expressions
IWBRA, May2006 36
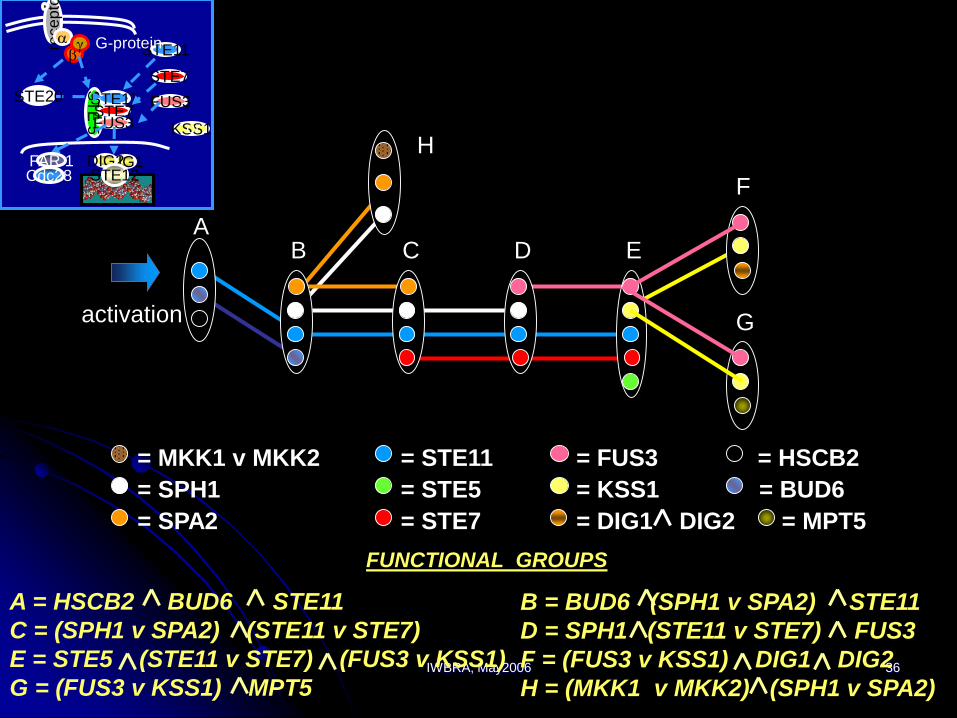
H
B = BUD6 (SPH1 v SPA2) STE11
D = SPH1 (STE11 v STE7) FUS3
F = (FUS3 v KSS1) DIG1 DIG2
H = (MKK1 v MKK2) (SPH1 v SPA2)
activation
B DC E
F
G
A
= FUS3 = HSCB2
= KSS1 = BUD6
= DIG1 DIG2 = MPT5
= STE11
= STE5
= STE7
= MKK1 v MKK2
= SPH1
= SPA2
FUNCTIONAL GROUPS
A = HSCB2 BUD6 STE11
C = (SPH1 v SPA2) (STE11 v STE7)
E = STE5 (STE11 v STE7) (FUS3 v KSS1)
G = (FUS3 v KSS1) MPT5
rece
pto
rabg
ST
E 5
STE11STE7FUS3
STE11
STE7
FUS3
DIG1DIG2STE12
G-protein
KSS1or
STE20
FAR 1Cdc28
IWBRA, May2006 37
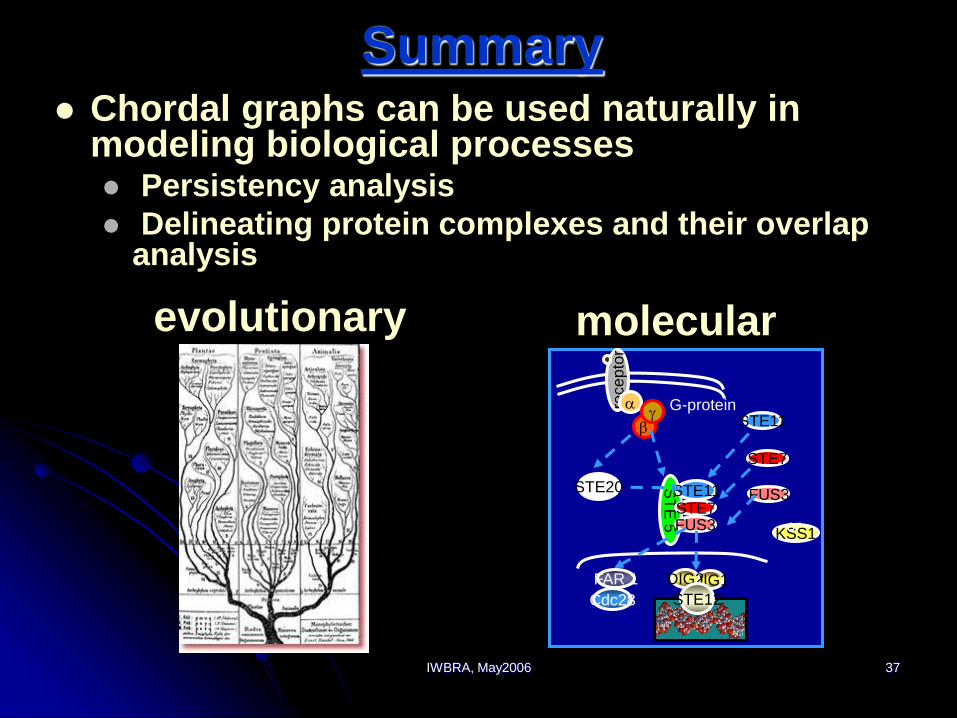
Summary Chordal graphs can be used naturally in
modeling biological processes Persistency analysis
Delineating protein complexes and their overlap analysis
evolutionary molecular
rece
pto
r
a
bg
ST
E 5
STE11STE7FUS3
STE11
STE7
FUS3
DIG1DIG2
STE12
G-protein
KSS1or
STE20
FAR 1
Cdc28
IWBRA, May2006 38
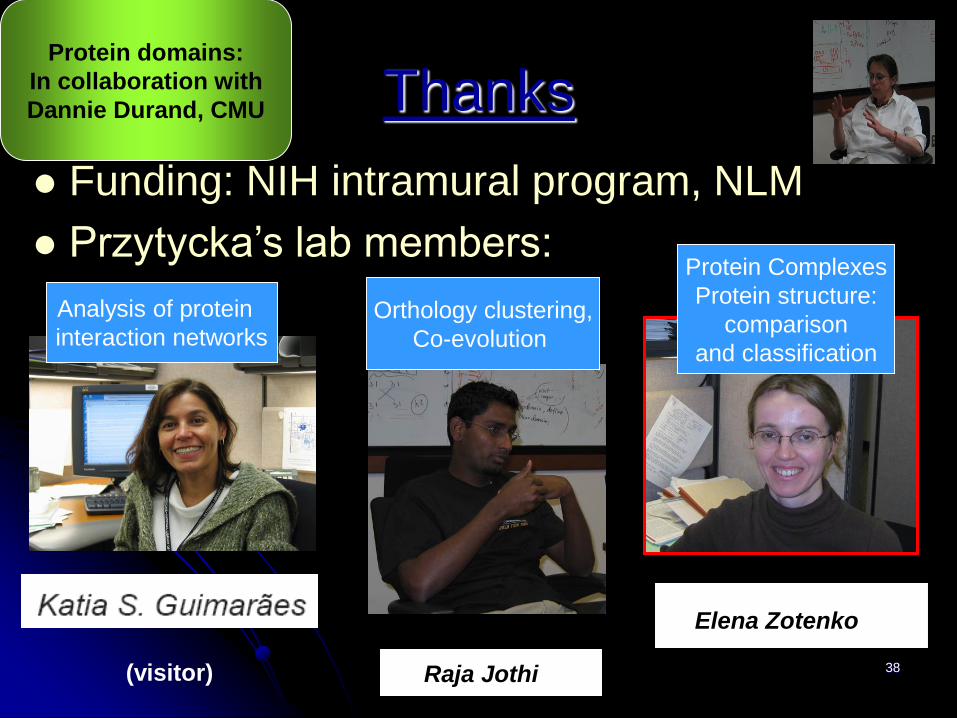
Thanks
Funding: NIH intramural program, NLM
Przytycka’s lab members:
Elena Zotenko
Raja Jothi
Analysis of protein
interaction networksOrthology clustering,
Co-evolution
Protein Complexes
Protein structure:
comparison
and classification
(visitor)
Protein domains:
In collaboration with
Dannie Durand, CMU
IWBRA, May2006 39
Protein domains
DOMAINS:
• Building blocks for large proteins.
• Evolutionary units.
• Can fold independently and carry some
specific function
IWBRA, May2006 40
Domain level evolution
Protein architecture is described by the
set of its domains (we ignore the order)
Operations: insertion and deletions
Assumptions
IWBRA, May2006 41
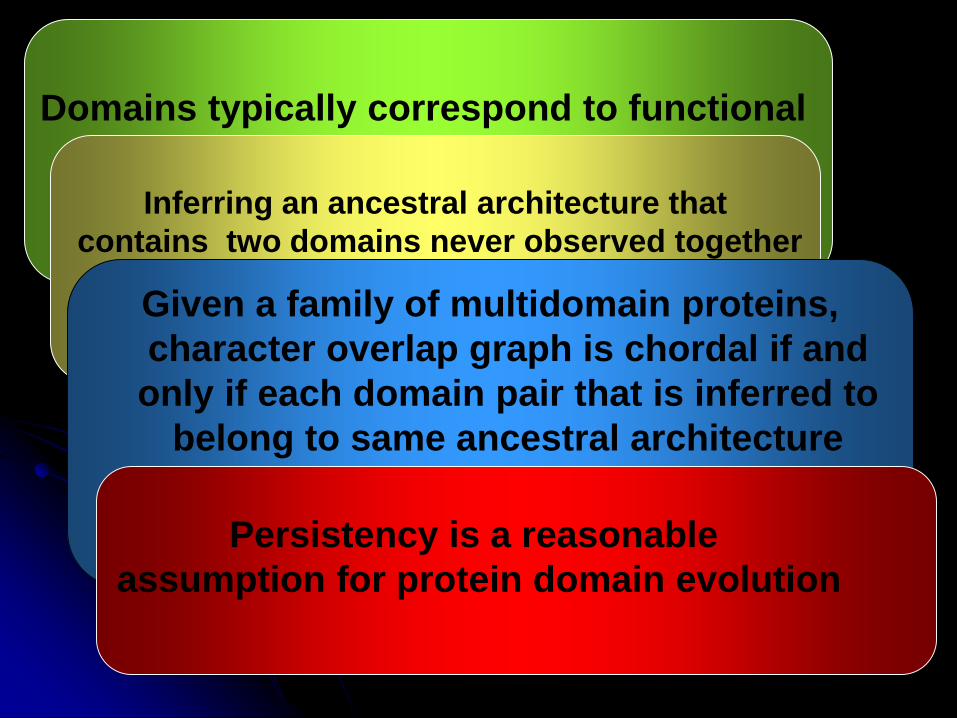
Domains typically correspond to functional
units and multidomain proteins bring
these units together for greater efficiency.Inferring an ancestral architecture that
contains two domains never observed together
is equivalent to inferring a
non-supported functional relationshipGiven a family of multidomain proteins,
character overlap graph is chordal if and
only if each domain pair that is inferred to
belong to same ancestral architecture
must have been observed in some
contemporary protein architectureIf each domain has been inserted
only once we expect the
character overlap graph to be chordal
Persistency is a reasonable
assumption for protein domain evolution
IWBRA, May2006 42
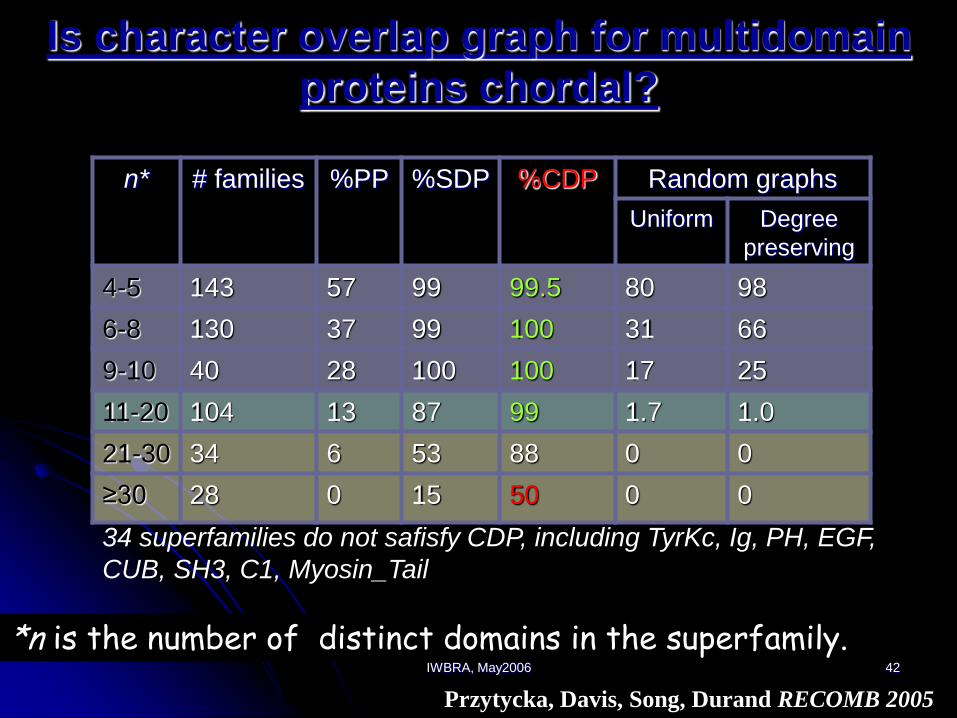
Is character overlap graph for multidomain
proteins chordal?
n* # families %PP %SDP %CDP Random graphs
Uniform Degree
preserving
4-5 143 57 99 99.5 80 98
6-8 130 37 99 100 31 66
9-10 40 28 100 100 17 25
11-20 104 13 87 99 1.7 1.0
21-30 34 6 53 88 0 0
≥30 28 0 15 50 0 0
*n is the number of distinct domains in the superfamily.
34 superfamilies do not safisfy CDP, including TyrKc, Ig, PH, EGF,
CUB, SH3, C1, Myosin_Tail
Przytycka, Davis, Song, Durand RECOMB 2005
IWBRA, May2006 43
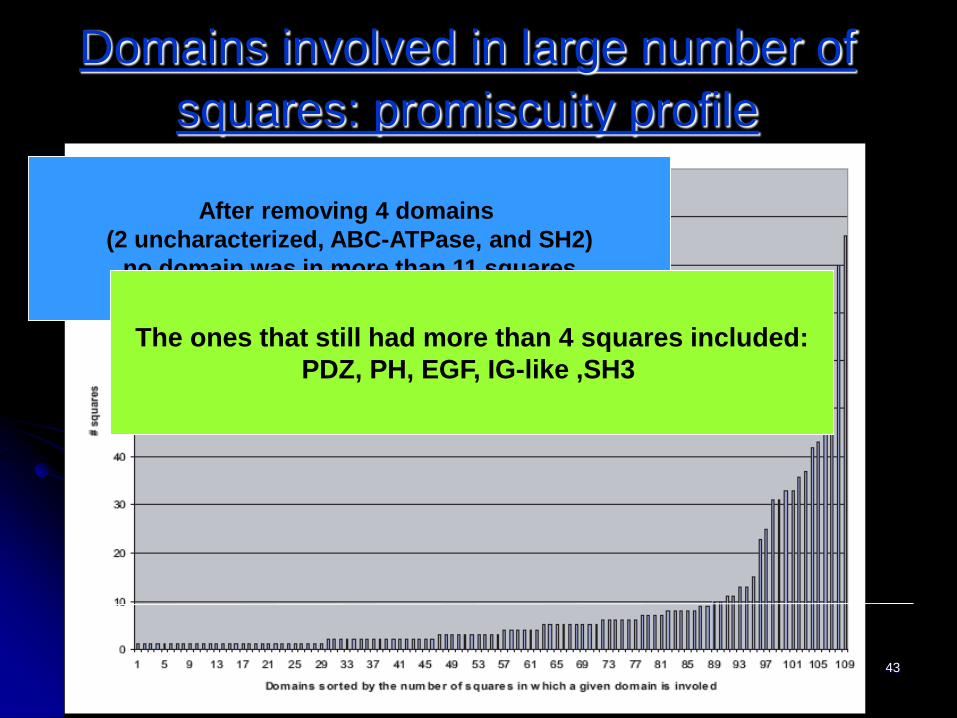
Domains involved in large number of
squares: promiscuity profile
After removing 4 domains
(2 uncharacterized, ABC-ATPase, and SH2)
no domain was in more than 11 squares
The ones that still had more than 4 squares included:
PDZ, PH, EGF, IG-like ,SH3
IWBRA, May2006 44
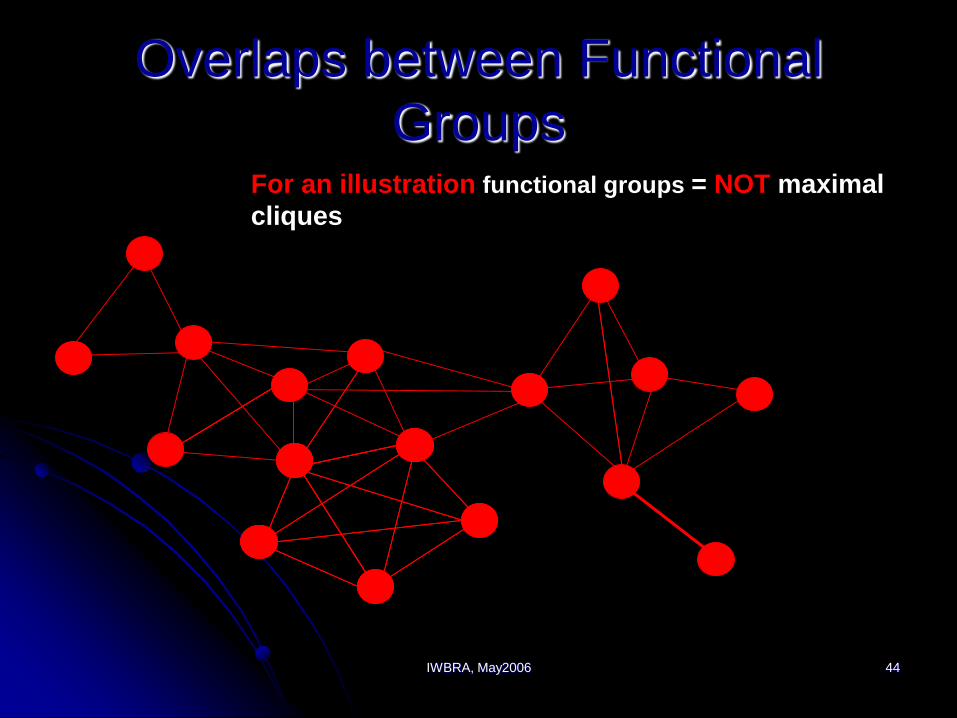
Overlaps between Functional
GroupsFor an illustration functional groups = NOT maximal
cliques
IWBRA, May2006 45
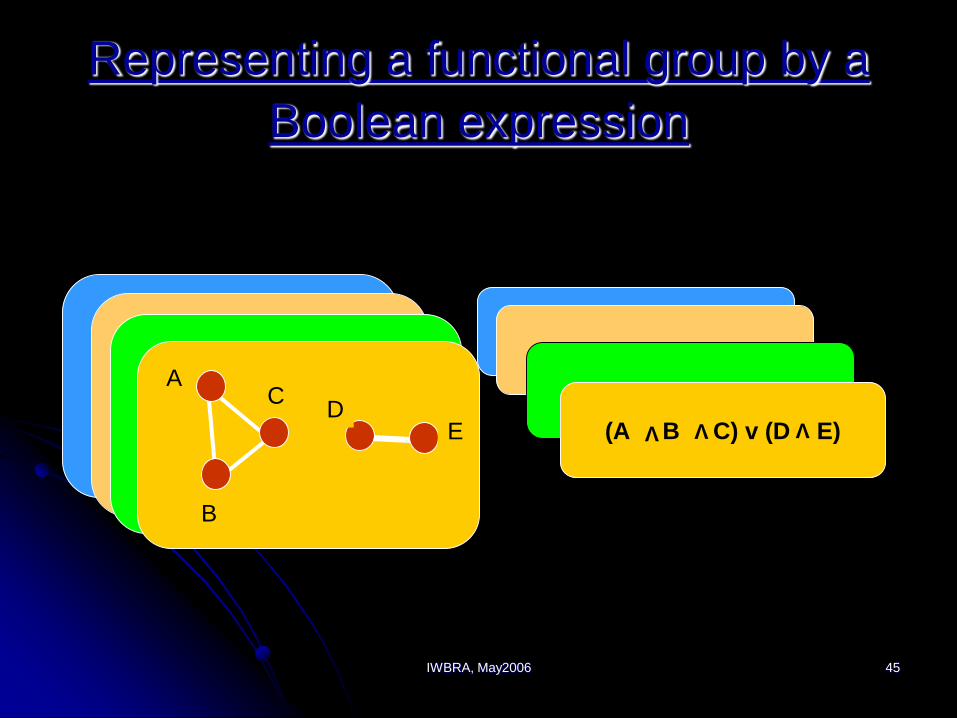
Representing a functional group by a
Boolean expression
A BA B
VA B
A v B
A
C
BA (B v C)
V
B
D
AC
E (A B C) v (D E)
V V V
IWBRA, May2006 46
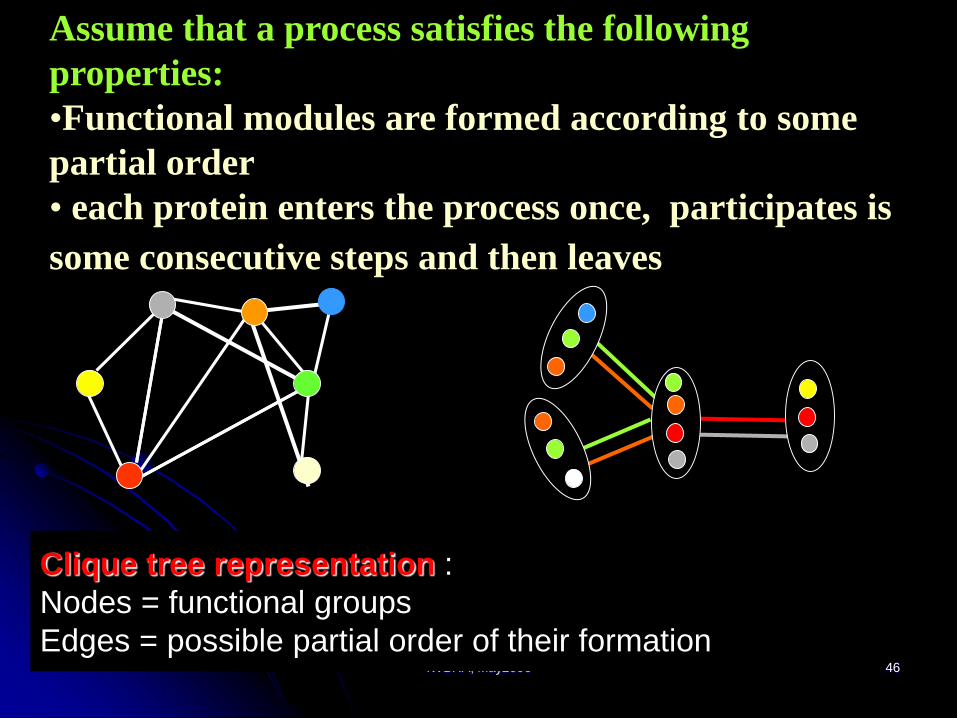
Clique tree representation :
Nodes = functional groups
Edges = possible partial order of their formation
Assume that a process satisfies the following
properties:
•Functional modules are formed according to some
partial order
• each protein enters the process once, participates is
some consecutive steps and then leaves

![STUDY OF CHORDAL GRAPHS - Aligarh Muslim Universityir.amu.ac.in/1313/1/T 6506.pdf · 2015. 7. 8. · Sliidv ofChordal Graphs Absract The results of Comeil [7] motivate the study of](https://static.documents.pub/doc/80x56/60315d2bf0e4554efd007c09/study-of-chordal-graphs-aligarh-muslim-6506pdf-2015-7-8-sliidv-ofchordal.jpg)


