28
US LNG Exports Chris Pedersen LNG Pricing Analyst - Americas
No content below the line No content below the line
US LNG Exports Chris Pedersen
LNG Pricing Analyst - Americas
No content below the line No content below the line
© 2016 by S&P Global Platts, a division of S&P Global Inc. All rights reserved.
The names “S&P Global Platts” and “Platts” and the logo are trademarks of S&P Global Inc. Any commercial use of the S&P Global
Platts logo must be granted in writing by S&P Global Inc.
You may view or otherwise use the information, prices, indices, assessments and other related information, graphs, tables and
images (“Data”) in this material only for your personal and internal use only. You may not publish, reproduce, extract, distribute,
retransmit, resell, create any derivative work from and/or otherwise provide access to the Data or any portion thereof to any person
(either within or outside your company, including as part of or via any internal electronic system or intranet), firm or entity, including
any subsidiary, parent, or other entity that is affiliated with your company, without S&P Global Platts’ prior written consent.
S&P Global Platts, its affiliates and their third-party licensors do not guarantee the adequacy, accuracy, timeliness and/or
completeness of the Data or any component thereof or any communications (whether written, oral, electronic or other format), with
respect thereto and shall not be subject to any damages or liability, including but not limited to any indirect, special, incidental,
punitive or consequential damages. Users of the Data should not rely on the information therein in making any investment, trading,
risk management or other decision.
Any queries or requests pursuant to this notice should be addressed to S&P Global Inc. via email at [email protected].
Disclaimer
No content below the line No content below the line
Agenda
3
• Global LNG
• Infrastructure capabilities
• Supply
• Demand
• US LNG
• Liquefaction Capacity
• US LNG deliveries
• Pricing Mechanisms for Global & US LNG
• Evolution of contracts/prices
No content below the line No content below the line
Putting global LNG in perspective
Private & Confidential 4
• Global Natural Gas Demand: ~122 Tcf or 335 Bcf/d (2015)
• Lower-48 US Natural Gas Demand: ~27.1 Tcf or 74Bcf/d (2016)
• Global LNG Demand: ~11.7 Tcf or 32 Bcf/d (2015)
• Roughly 70% of all gas is consumed in the country it is produced.
• Since 2000, LNG demand has grown about 6.6% a year, compared to
2.8% for natural gas.
• About 114 countries use natural gas as a fuel source, while only 37
nations import LNG.
Source: Platts Analytics’ Eclipse Data, IGU, IEA, CIA World Fact Book

No content below the line No content below the line
Global LNG infrastructure
Private & Confidential 5
Liquefaction
Global LNG Liquefaction Capacity: 301.5 MTPA or 38.6 Bcf/d
2015 utilization rate: 81%
LNG Exporting Countries: 19
LNG Re-Exporting Countries: 10
Regasification
Global LNG Regasification Capacity: 757 MTPA or 96.9 Bcf/d
2015 utilization rate: 32%
LNG importing countries: 37
Source: Platts Analytics’ Eclipse Data, IGU
No content below the line No content below the line
Natural gas/LNG to play a larger role in the future
Private & Confidential 6
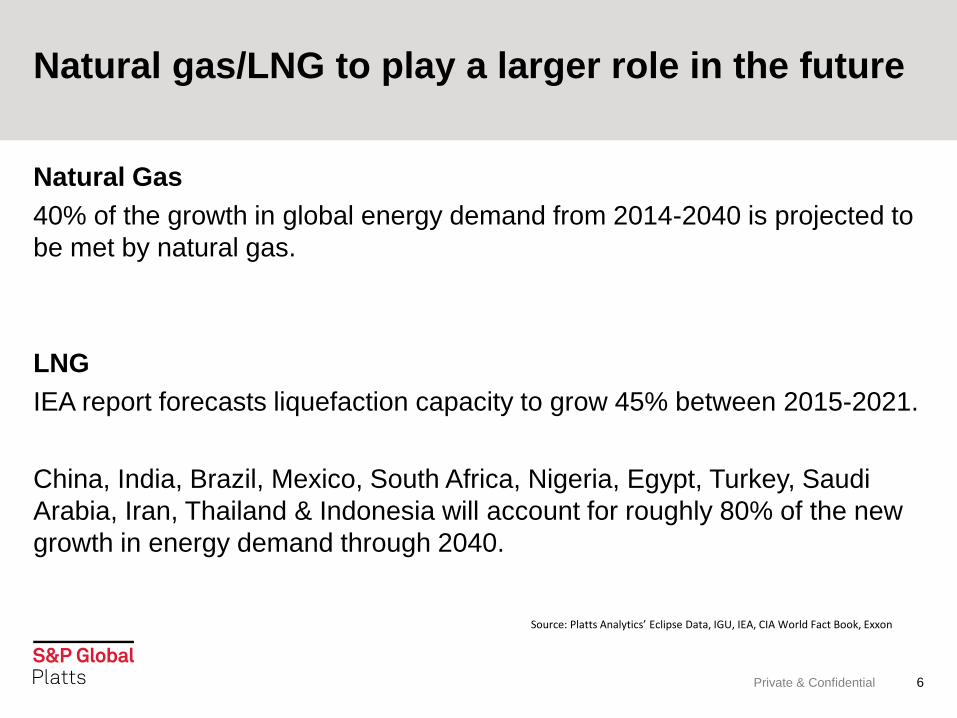
Natural Gas
40% of the growth in global energy demand from 2014-2040 is projected to
be met by natural gas.
LNG
IEA report forecasts liquefaction capacity to grow 45% between 2015-2021.
China, India, Brazil, Mexico, South Africa, Nigeria, Egypt, Turkey, Saudi
Arabia, Iran, Thailand & Indonesia will account for roughly 80% of the new
growth in energy demand through 2040.
Source: Platts Analytics’ Eclipse Data, IGU, IEA, CIA World Fact Book, Exxon

No content below the line No content below the line
Natural Gas
7
0
1000
2000
3000
4000
5000
6000
Asia Pacific Middle East Europe Americas Africa
LNG exports by region
Vo
lum
e (
Bcf
)
Year to Sep 2015 Year to Sep 2016
Source: Platts Analytics’ Eclipse Data

No content below the line No content below the line
Natural Gas
8
0
500
1000
1500
2000
2500
3000
3500
4000
4500
Qatar Australia Malaysia Indonesia United States
LNG exports by country
Year to Sep 2015 Year to Sep 2016
Source: Platts Analytics’ Eclipse Data
Vo
lum
e (
Bcf
)

No content below the line No content below the line
Natural Gas
9
0
500
1000
1500
2000
2500
3000
3500
4000
4500
Japan South Korea Middle East SouthAmerica
Europe China
LNG imports by country
Year to Sep 2015 Year to Sep 2016
Vo
lum
e (
Bcf
)
No content below the line No content below the line
Natural Gas
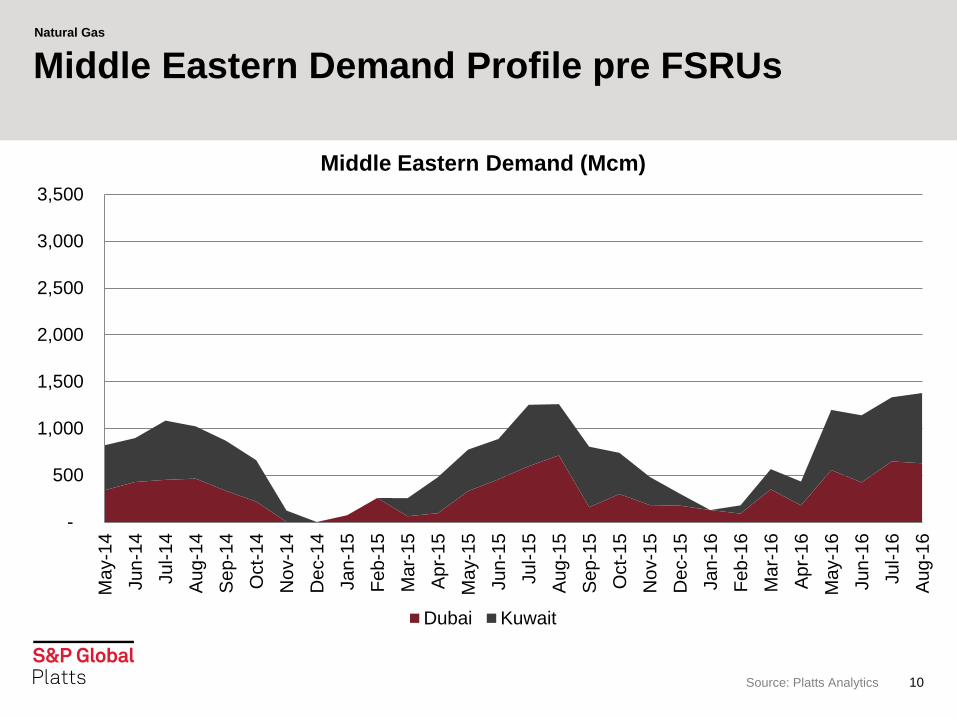
Source: Platts Analytics 10
Middle Eastern Demand Profile pre FSRUs
-
500
1,000
1,500
2,000
2,500
3,000
3,500
Ma
y-1
4
Ju
n-1
4
Ju
l-1
4
Au
g-1
4
Se
p-1
4
Oct-
14
No
v-1
4
De
c-1
4
Ja
n-1
5
Fe
b-1
5
Ma
r-1
5
Ap
r-1
5
Ma
y-1
5
Ju
n-1
5
Ju
l-1
5
Au
g-1
5
Se
p-1
5
Oct-
15
No
v-1
5
De
c-1
5
Ja
n-1
6
Fe
b-1
6
Ma
r-1
6
Ap
r-1
6
Ma
y-1
6
Ju
n-1
6
Ju
l-1
6
Au
g-1
6
Middle Eastern Demand (Mcm)
Dubai Kuwait
No content below the line No content below the line
Natural Gas
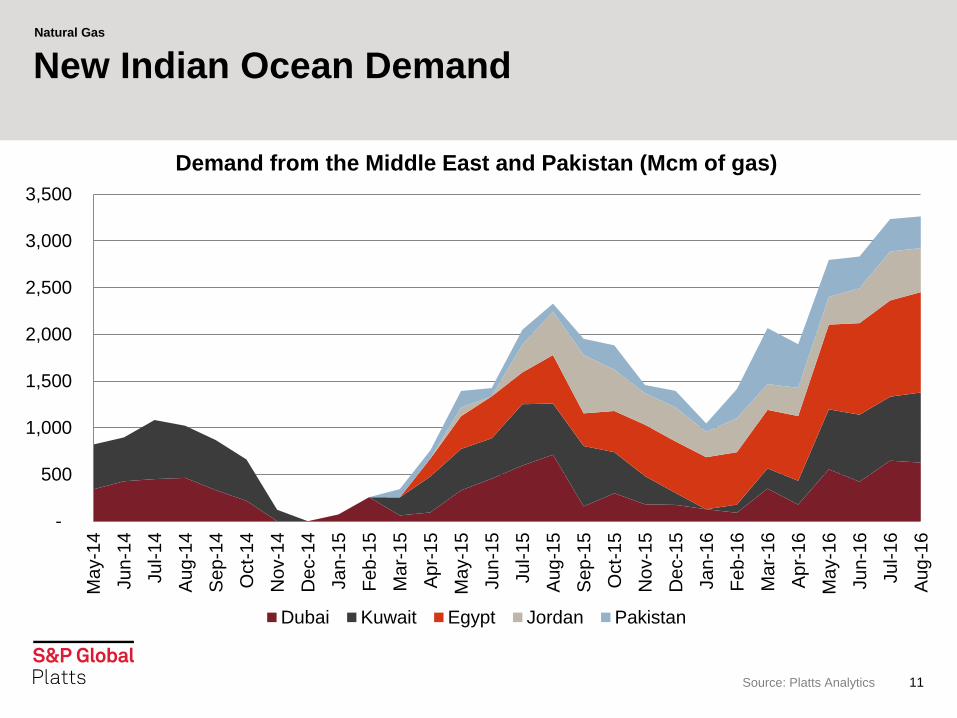
Source: Platts Analytics 11
New Indian Ocean Demand
-
500
1,000
1,500
2,000
2,500
3,000
3,500
Ma
y-1
4
Ju
n-1
4
Ju
l-1
4
Au
g-1
4
Se
p-1
4
Oct-
14
No
v-1
4
De
c-1
4
Ja
n-1
5
Fe
b-1
5
Ma
r-1
5
Ap
r-1
5
Ma
y-1
5
Ju
n-1
5
Ju
l-1
5
Au
g-1
5
Se
p-1
5
Oct-
15
No
v-1
5
Dec-1
5
Ja
n-1
6
Fe
b-1
6
Ma
r-1
6
Ap
r-1
6
Ma
y-1
6
Ju
n-1
6
Ju
l-1
6
Au
g-1
6
Demand from the Middle East and Pakistan (Mcm of gas)
Dubai Kuwait Egypt Jordan Pakistan

No content below the line No content below the line
Natural Gas
Source: Platts. Private & Confidential. 12
New Indian Ocean Demand
-
1,000
2,000
3,000
4,000
5,000
6,000
Middle Eastern and South Asian Demand (Mcm of gas)
India Dubai Kuwait Egypt Jordan Pakistan

No content below the line No content below the line
Natural Gas
13
-8
-7
-6
-5
-4
-3
-2
-1
0
1
2
20
14
20
16
20
18
20
20
20
22
20
24
20
26
20
28
20
30
20
32
20
34
20
36
20
38
20
40
US LNG Export Overview AEO 2005 US Net Natural Gas Imports AEO 2016 US Net Natural Gas Imports
0
1
2
3
4
5
6
7
8
9
10
20
02
20
04
20
06
20
08
20
10
20
12
20
14
20
16
20
18
20
20
20
22
20
24
Source: EIA Annual Energy Outlook 2005 & 2016
Pipeline LNG

No content below the line No content below the line
Natural Gas
0
2
4
6
8
10
12
14
16
18
20
2010 2011 2012 2013 2014 2015 2016
$/M
MB
tu
Regional Gas Prices
JKM NBP Henry Hub
Private & Confidential 14
Market prices reflect change
Tight period Supply growth
Source: Platts Analytics’ Bentek Data & Eclipse Data
No content below the line No content below the line
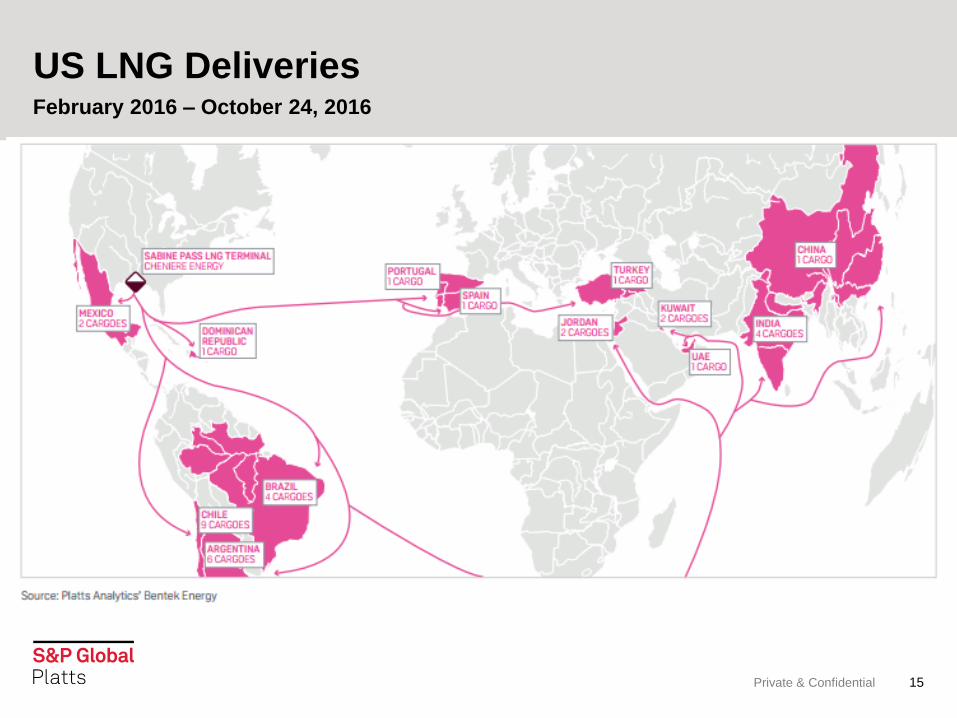
US LNG Deliveries
Private & Confidential 15
February 2016 – October 24, 2016
No content below the line No content below the line
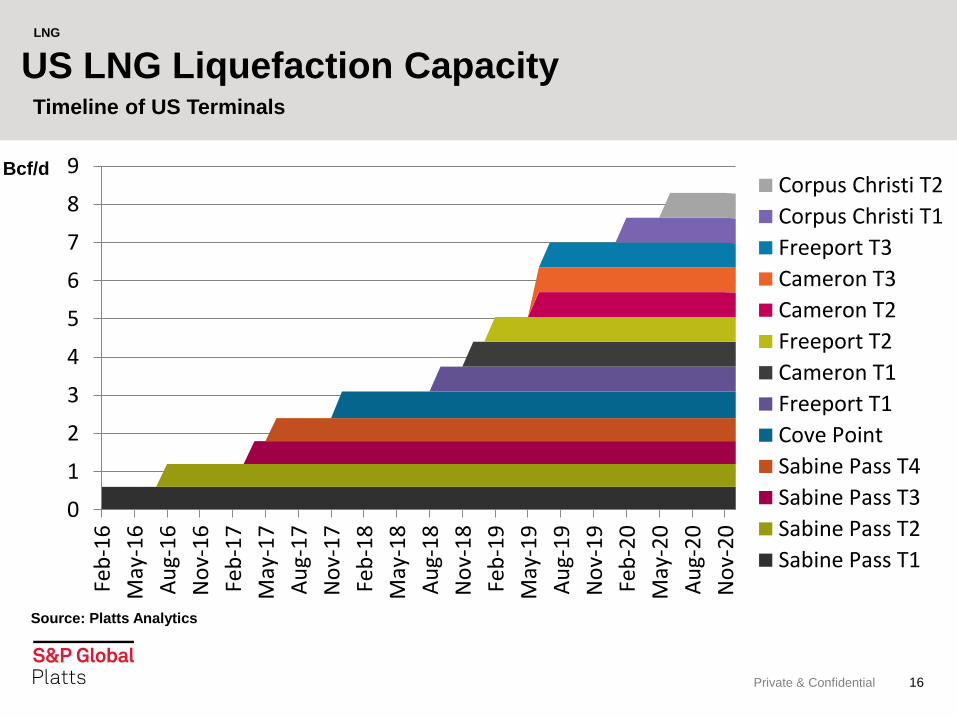
US LNG Liquefaction Capacity
Private & Confidential 16
Timeline of US Terminals
LNG
0
1
2
3
4
5
6
7
8
9
Feb
-16
May
-16
Au
g-1
6
No
v-1
6
Feb
-17
May
-17
Au
g-1
7
No
v-1
7
Feb
-18
May
-18
Au
g-1
8
No
v-1
8
Feb
-19
May
-19
Au
g-1
9
No
v-1
9
Feb
-20
May
-20
Au
g-2
0
No
v-2
0
Corpus Christi T2
Corpus Christi T1
Freeport T3
Cameron T3
Cameron T2
Freeport T2
Cameron T1
Freeport T1
Cove Point
Sabine Pass T4
Sabine Pass T3
Sabine Pass T2
Sabine Pass T1
Bcf/d
Source: Platts Analytics
No content below the line No content below the line
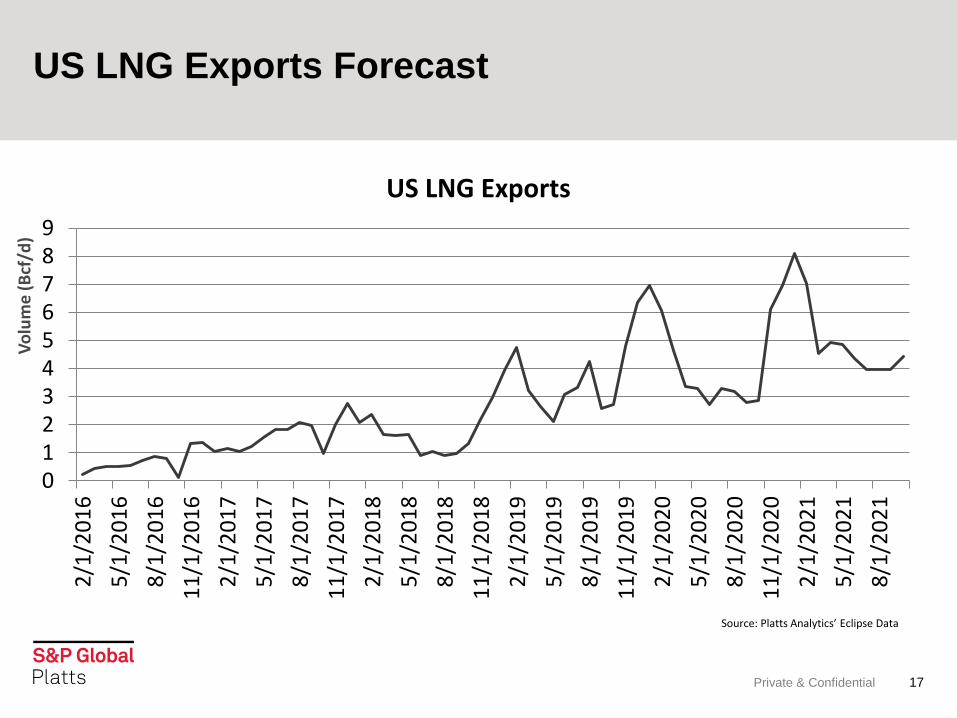
US LNG Exports Forecast
Private & Confidential 17
0123456789
2/1
/20
16
5/1
/20
16
8/1
/20
16
11
/1/2
01
6
2/1
/20
17
5/1
/20
17
8/1
/20
17
11
/1/2
01
7
2/1
/20
18
5/1
/20
18
8/1
/20
18
11
/1/2
01
8
2/1
/20
19
5/1
/20
19
8/1
/20
19
11
/1/2
01
9
2/1
/20
20
5/1
/20
20
8/1
/20
20
11
/1/2
02
0
2/1
/20
21
5/1
/20
21
8/1
/20
21
US LNG Exports
Source: Platts Analytics’ Eclipse Data
Vo
lum
e (
Bcf
/d)
No content below the line No content below the line
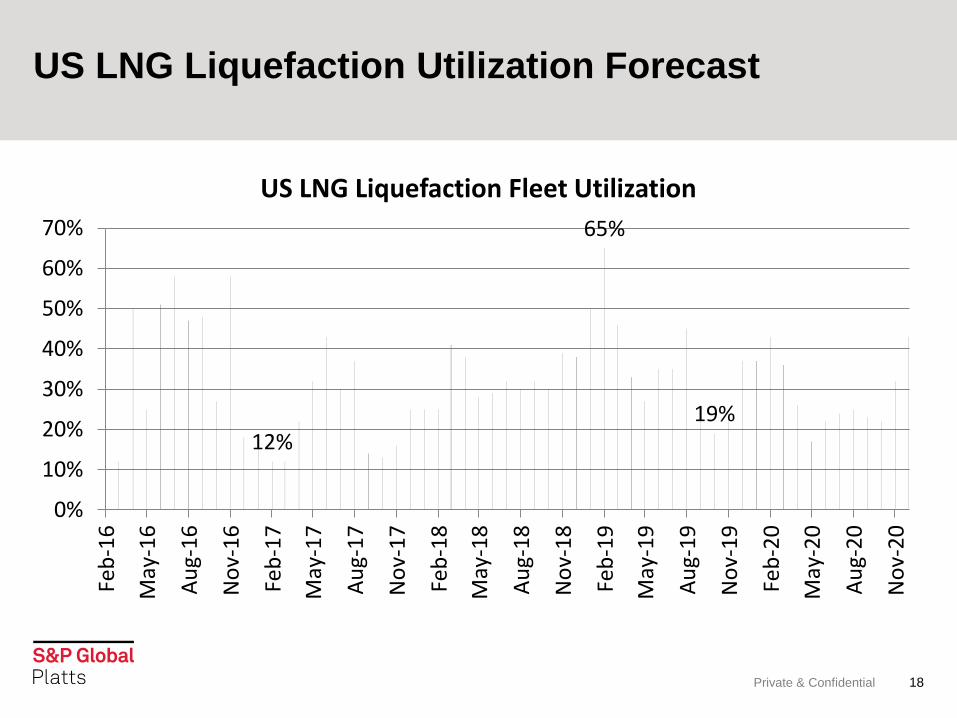
US LNG Liquefaction Utilization Forecast
Private & Confidential 18
12%
65%
19%
0%
10%
20%
30%
40%
50%
60%
70%
Feb
-16
May
-16
Au
g-1
6
No
v-1
6
Feb
-17
May
-17
Au
g-1
7
No
v-1
7
Feb
-18
May
-18
Au
g-1
8
No
v-1
8
Feb
-19
May
-19
Au
g-1
9
No
v-1
9
Feb
-20
May
-20
Au
g-2
0
No
v-2
0
US LNG Liquefaction Fleet Utilization
No content below the line No content below the line
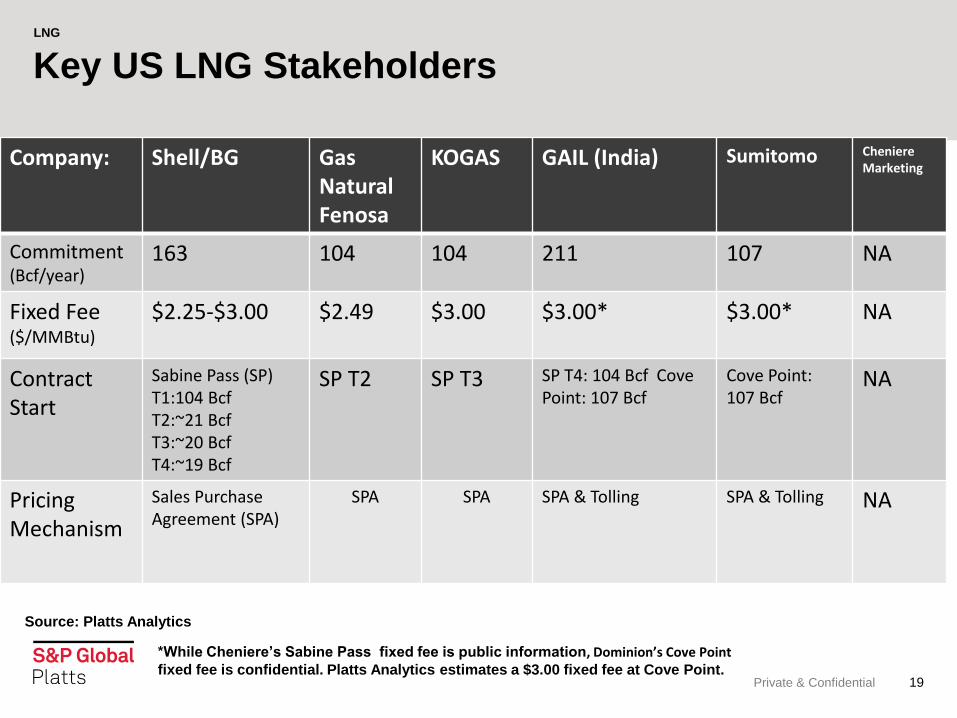
Key US LNG Stakeholders
Private & Confidential 19
Company: Shell/BG Gas Natural Fenosa
KOGAS GAIL (India) Sumitomo Cheniere Marketing
Commitment (Bcf/year)
163 104 104 211 107 NA
Fixed Fee ($/MMBtu)
$2.25-$3.00 $2.49
$3.00 $3.00* $3.00* NA
Contract Start
Sabine Pass (SP) T1:104 Bcf T2:~21 Bcf T3:~20 Bcf T4:~19 Bcf
SP T2 SP T3 SP T4: 104 Bcf Cove Point: 107 Bcf
Cove Point: 107 Bcf
NA
Pricing Mechanism
Sales Purchase Agreement (SPA)
SPA
SPA
SPA & Tolling SPA & Tolling
NA
LNG
*While Cheniere’s Sabine Pass fixed fee is public information, Dominion’s Cove Point fixed fee is confidential. Platts Analytics estimates a $3.00 fixed fee at Cove Point.
Source: Platts Analytics

No content below the line No content below the line
LNG Pricing Mechanisms
Private & Confidential 20
Oil-Indexed
Example: 13% of Brent or JCC
Gas Hub-Linked
Example: Henry Hub plus 15%, contracts based off of differentials of NBP or TTF
Benchmarks
Example: Platts JKM™
Assessments
Example: Platts GCM, EAM, NWE, DES West India
No content below the line No content below the line
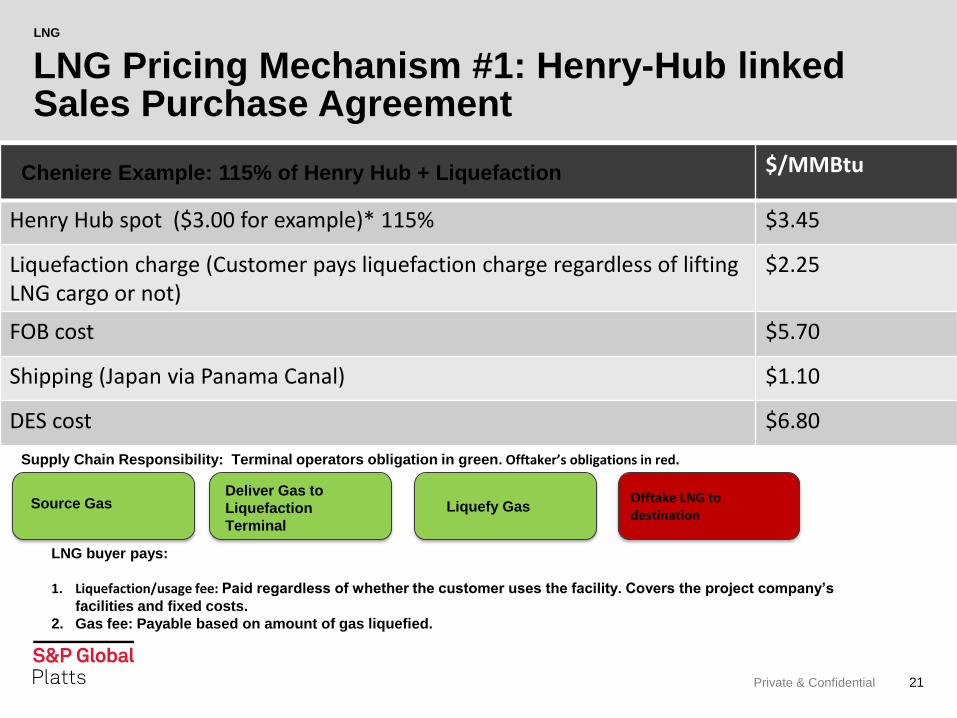
Private & Confidential 21
$/MMBtu
Henry Hub spot ($3.00 for example)* 115% $3.45
Liquefaction charge (Customer pays liquefaction charge regardless of lifting LNG cargo or not)
$2.25
FOB cost $5.70
Shipping (Japan via Panama Canal) $1.10
DES cost $6.80
LNG Pricing Mechanism #1: Henry-Hub linked Sales Purchase Agreement
Cheniere Example: 115% of Henry Hub + Liquefaction
LNG
Supply Chain Responsibility: Terminal operators obligation in green. Offtaker’s obligations in red.
Source Gas Deliver Gas to
Liquefaction
Terminal
Liquefy Gas Offtake LNG to destination
LNG buyer pays:
1. Liquefaction/usage fee: Paid regardless of whether the customer uses the facility. Covers the project company’s
facilities and fixed costs.
2. Gas fee: Payable based on amount of gas liquefied.
No content below the line No content below the line
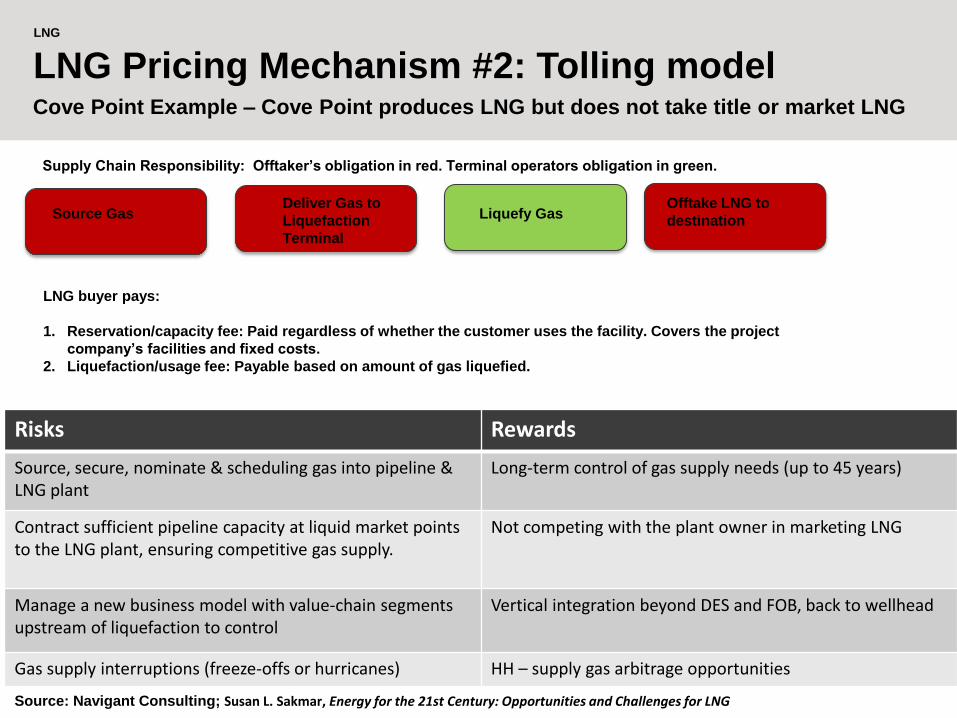
LNG Pricing Mechanism #2: Tolling model
Private & Confidential 22
Cove Point Example – Cove Point produces LNG but does not take title or market LNG
LNG
Risks Rewards
Source, secure, nominate & scheduling gas into pipeline & LNG plant
Long-term control of gas supply needs (up to 45 years)
Contract sufficient pipeline capacity at liquid market points to the LNG plant, ensuring competitive gas supply.
Not competing with the plant owner in marketing LNG
Manage a new business model with value-chain segments upstream of liquefaction to control
Vertical integration beyond DES and FOB, back to wellhead
Gas supply interruptions (freeze-offs or hurricanes) HH – supply gas arbitrage opportunities
Supply Chain Responsibility: Offtaker’s obligation in red. Terminal operators obligation in green.
Source Gas Deliver Gas to
Liquefaction
Terminal
Liquefy Gas Offtake LNG to
destination
LNG buyer pays:
1. Reservation/capacity fee: Paid regardless of whether the customer uses the facility. Covers the project
company’s facilities and fixed costs.
2. Liquefaction/usage fee: Payable based on amount of gas liquefied.
Source: Navigant Consulting; Susan L. Sakmar, Energy for the 21st Century: Opportunities and Challenges for LNG
No content below the line No content below the line
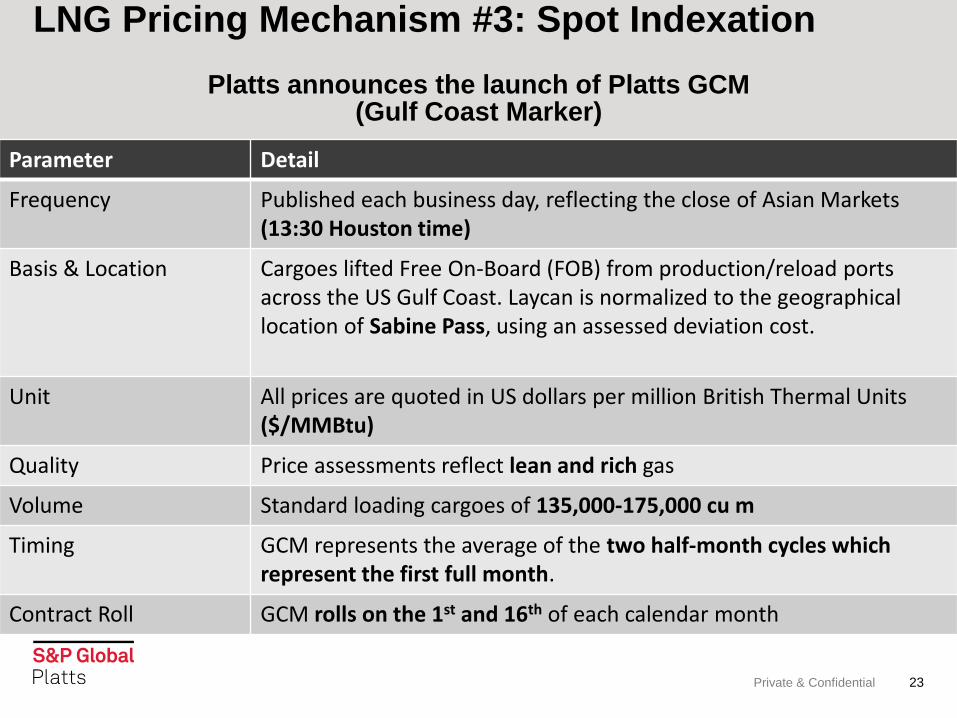
Platts announces the launch of Platts GCM
(Gulf Coast Marker)
Private & Confidential 23
LNG Pricing Mechanism #3: Spot Indexation
Parameter Detail
Frequency Published each business day, reflecting the close of Asian Markets (13:30 Houston time)
Basis & Location Cargoes lifted Free On-Board (FOB) from production/reload ports across the US Gulf Coast. Laycan is normalized to the geographical location of Sabine Pass, using an assessed deviation cost.
Unit All prices are quoted in US dollars per million British Thermal Units ($/MMBtu)
Quality Price assessments reflect lean and rich gas
Volume Standard loading cargoes of 135,000-175,000 cu m
Timing GCM represents the average of the two half-month cycles which represent the first full month.
Contract Roll GCM rolls on the 1st and 16th of each calendar month

No content below the line No content below the line
Natural Gas
Edit Footer in Headers & Footers 24
GCM currently a “netback” assessment
Freight Rates $/MMBtu
Japan/Korea South China/Taiwan
West India
SW Europe NW Europe
Argentina
Brazil
US Gulf Coast (Most Economic)
$1.09 $1.29 $1.19 $0.46 $0.46 $0.63 $0.50
Shipping rates of August 25, 2016

No content below the line No content below the line
Natural Gas
25
Continuous Pricing and Market Coverage
• As each market closes, information is passed onto the next desk in the following time-zone,
allowing for continuous price and market data gathering
• Allows for wider survey of market participants; portfolio players, traders, end-users etc..
Houston:
Gulf Coast
marker
assessed
at 13:30;
LNG Daily
published;
intel sent to
Singapore/
Tokyo
London: Atlantic
markers assessed
at 16:30; intel sent
to Houston Singapore: Platts
JKM™ and West
India assessed at
16:30; intel sent to
London
Source: Platts Analytics’ Eclipse Data, IGU, IEA, CIA World Fact Book
No content below the line No content below the line
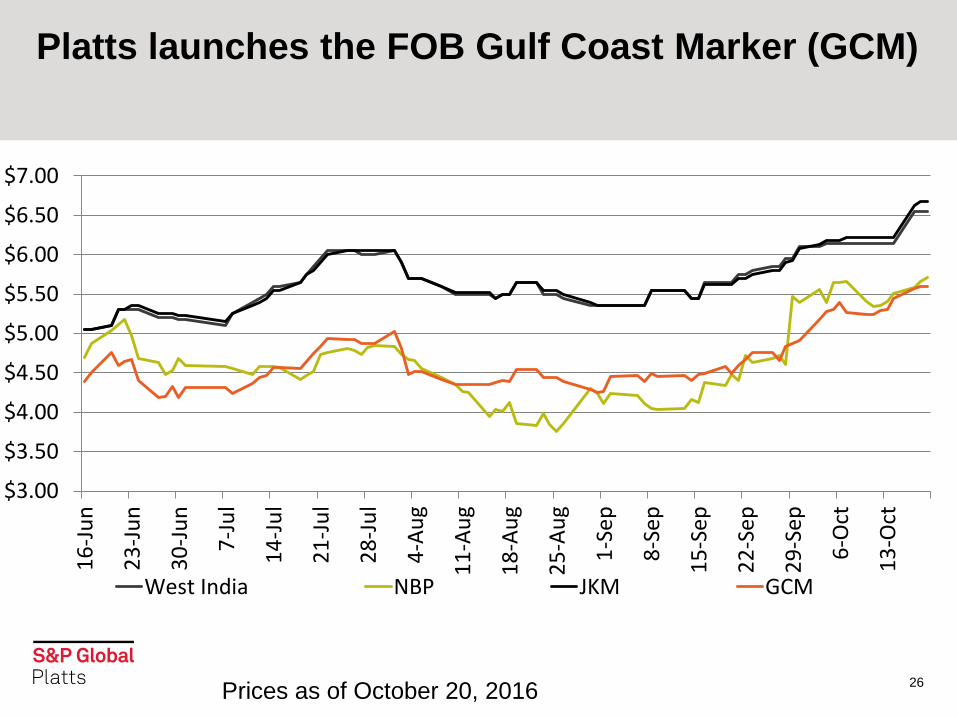
26
$3.00
$3.50
$4.00
$4.50
$5.00
$5.50
$6.00
$6.50
$7.00
16
-Ju
n
23
-Ju
n
30
-Ju
n
7-J
ul
14
-Ju
l
21
-Ju
l
28
-Ju
l
4-A
ug
11
-Au
g
18
-Au
g
25
-Au
g
1-S
ep
8-S
ep
15
-Sep
22
-Sep
29
-Sep
6-O
ct
13
-Oct
West India NBP JKM GCM
Prices as of October 20, 2016
Platts launches the FOB Gulf Coast Marker (GCM)
No content below the line No content below the line
Future LNG pricing mechanisms
Private & Confidential 27
- Up to 43% of total global LNG deliveries could be traded on a spot/short-
term basis by 2020, versus around 25% today

No content below the line No content below the line
Thank You Chris Pedersen Pricing Analyst – LNG Americas Managing Editor – LNG Daily S&P Global Platts [email protected]


