Selected Reaction Monitoring Christine A. Jelinek, Ph.D. Johns Hopkins University School of Medicine Department of Pharmacology and Molecular Sciences Middle Atlantic Mass Spectrometry Laboratory
Transcript
Selected Reaction Monitoring
Christine A. Jelinek, Ph.D.
Johns Hopkins University School of Medicine
Department of Pharmacology and Molecular Sciences
Middle Atlantic Mass Spectrometry Laboratory
Selected Reaction Monitoring Lecture Agenda
Selected Reaction Monitoring: Technique
Selected Reaction Monitoring: Instrumentation
Quantitation: Absolute vs. Relative
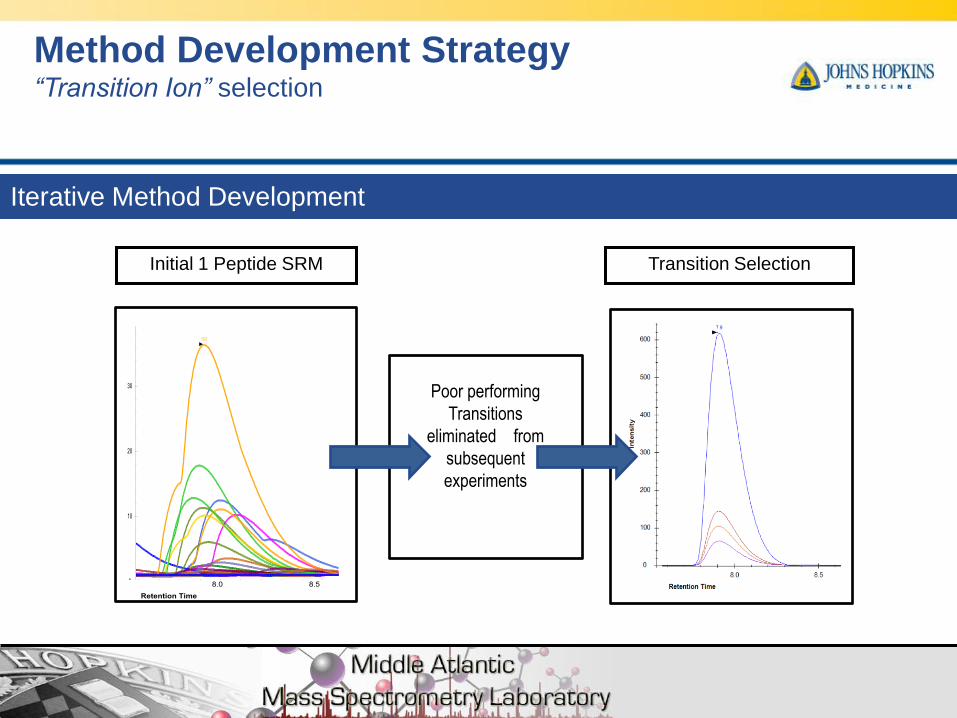
Selected Reaction Monitoring: Method Development
Selected Reaction Monitoring: Application
Selected Reaction Monitoring: Case Studies
Selected Reaction Monitoring:
Technique
Selected reaction monitoring (SRM)
Picotti P and Aebersold R Nat Methods 2012 9:555-566
SRM is a mass spectrometry technique for the detection and quantitation of
specific, pre-determined analytes
SRM selectively monitors specific analyte molecular ion and several fragment
ions generated from the analyte by collisional dissociation
Most effectively used in an LC-coupled MS system
Exploits the unique capabilities of triple quadrupole instruments to act as
mass filters
Originally applied to the measurement of small molecules
SRM allows for the measurement of proteins in low µg or high ng/mL range
November 27, 2012 5 5
Q1 Q2 Q3 Q0
RF only Collision Cell Scanning
RF/DC
Scanning
RF/DC RF only
Selected Reaction Monitoring Mass Spectrometric Assay
Elliott MH et al. J Mass Spectrom 2009 44:1637-1660
6
y11
y9
y7
G
A
G
Q
N
I
I
P
A
S
T
G
A
A
K
X
X
X
Each peptide has a unique mass
and unique sequence fragments Q1 passes only the
molecular mass
Q3 passes three
selected fragments
Selected Reaction Monitoring Mass Spectrometric Assay
Elliott MH et al. J Mass Spectrom 2009 44:1637-1660
November 27, 2012 7
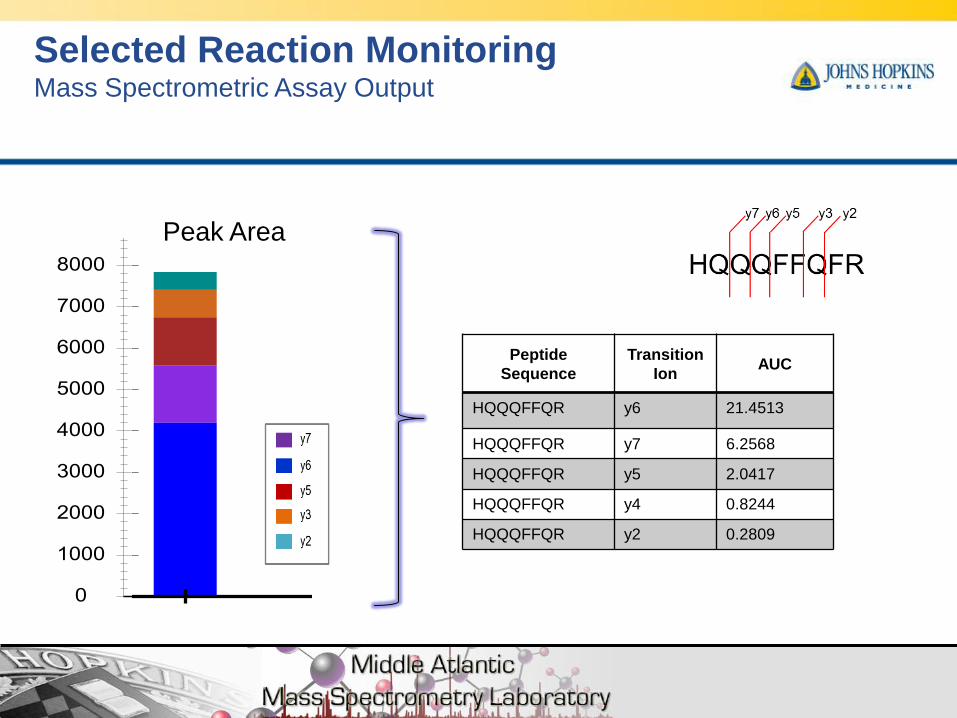
Selected Reaction Monitoring Mass Spectrometric Assay Output
7
Peak Area
November 27, 2012 8
Selected Reaction Monitoring Mass Spectrometric Assay Output
8
Peak Area
Peptide
Sequence
Transition
Ion AUC
HQQQFFQR y6 21.4513
HQQQFFQR y7 6.2568
HQQQFFQR y5 2.0417
HQQQFFQR y4 0.8244
HQQQFFQR y2 0.2809
9
Selected Reaction Monitoring Mass Spectrometric Assay Platform
Selectivity
Specificity
Sensitivity
Mass filters pass only targeted peptides
even when ion signal is below noise
Pre-select unique “transitions”
ions during detection
High duty cycle.
LODs 2-3 orders of magnitude
better than scanned spectra
Selected Reaction Monitoring:
Instrumentation
Selected Reaction Monitoring Using Triple Quadrapole Mass Spectrometers
Triple Quadrapole Mass Spectrometers
Jim Morrison of LaTrobe University, Australia first developed the QQQ
arrangement for the purpose of studying the photodissociation of gas-
phase ions.
The first triple-quadrupole mass spectrometer was developed at
Michigan State University by Dr. Christie Enke and graduate student
Richard Yost in the late 1970s.
Quantitation:
Absolute vs. Relative
Quantitation Strategies
Picotti P and Aebersold R Nat Methods 2012 9:555-566
Quantitation Labeling Quantitation
strategy
Relative (differential)
quantitation
Label-free
Metabolic stable-isotope
labeling
[15N]ammonium
sulfate
SILAC
Chemical stable-isotope
labeling
ICAT, iTRAQ
mTRAQ
Enzymatic stable-isotope labeling [18O]water
Absolute quantitation
Metabolic stable-isotope labeling QconCAT, PSAQ
Chemical stable-isotope labeling AQUA synthetic
peptides
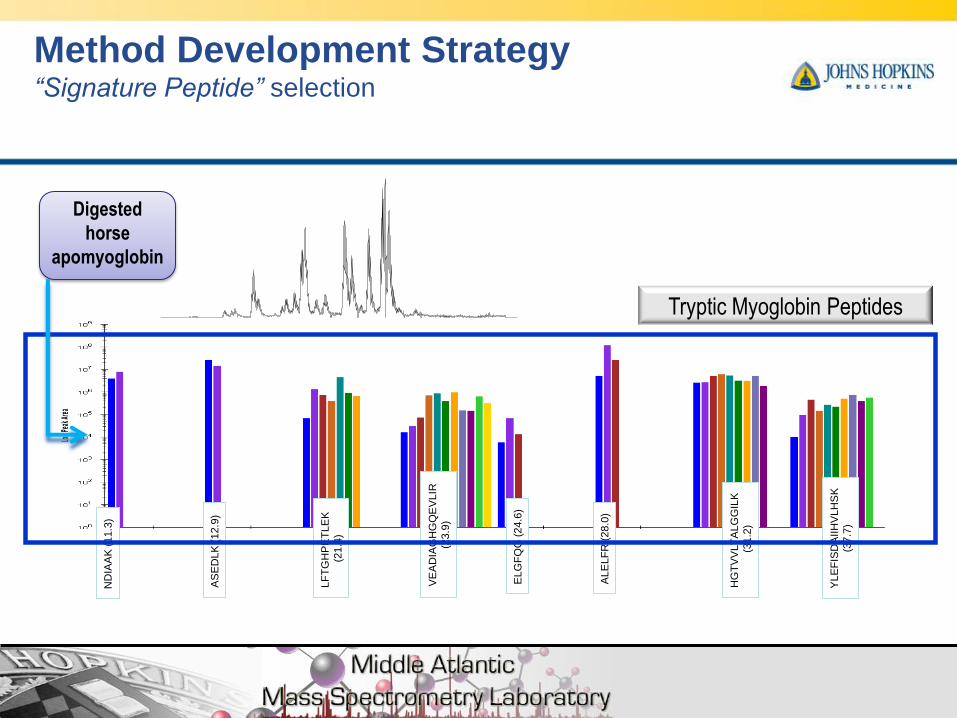
Method Development Strategy Peptide Standards
Labeled Standards:
PEPTIDE* LAGKPEPTIDEKLAG*
PEPTIDEK* …….KPEPTIDEK………*
Internal Standards:
Non-biomarker peptide present within sample
Used to minimize run-to-run variability from processing and instrumentation
Panel or single peptide can be selected
External Standards:
Heavy isotope labeled standards can be added to each sample
Panel of biomarker peptides, a single biomarker peptide, a panel of biomarker
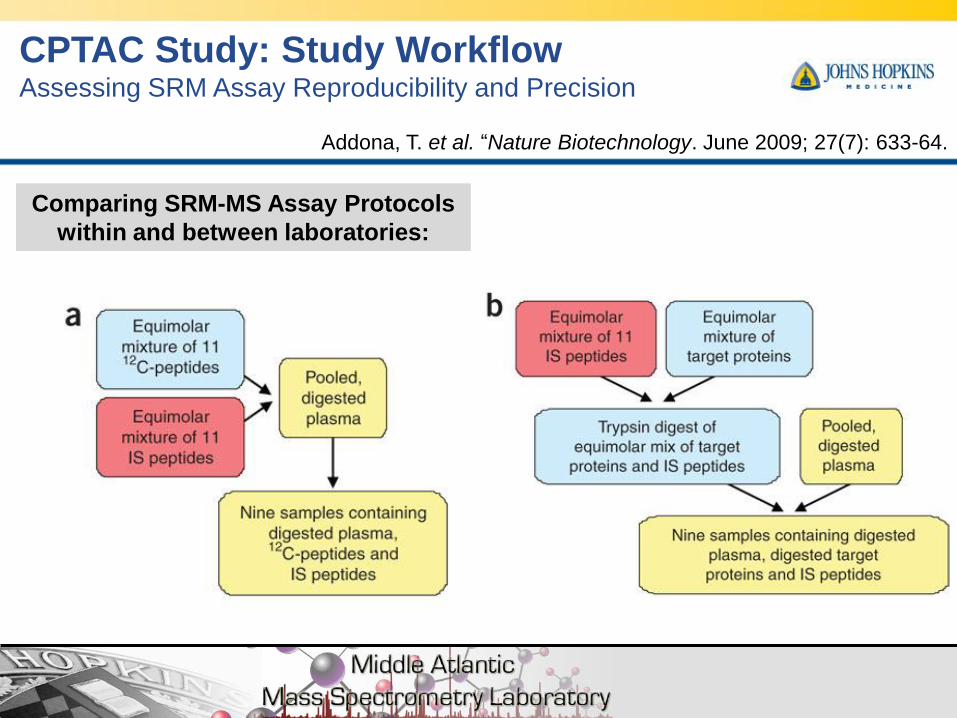
CPTAC Study: Study Workflow Assessing SRM Assay Reproducibility and Precision
Comparing SRM-MS Assay Protocols
within and between laboratories:
Addona, T. et al. “Nature Biotechnology. June 2009; 27(7): 633-64.
November 27, 2012 55
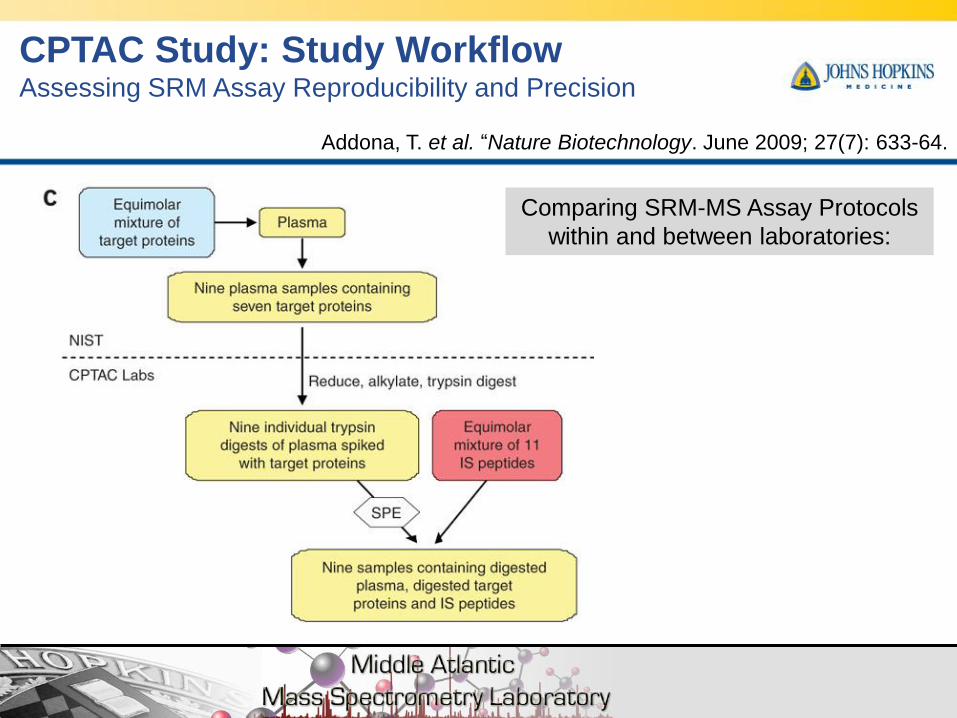
CPTAC Study: Study Workflow Assessing SRM Assay Reproducibility and Precision
Comparing SRM-MS Assay Protocols
within and between laboratories:
Addona, T. et al. “Nature Biotechnology. June 2009; 27(7): 633-64.
November 27, 2012 56 November 27, 2012 56
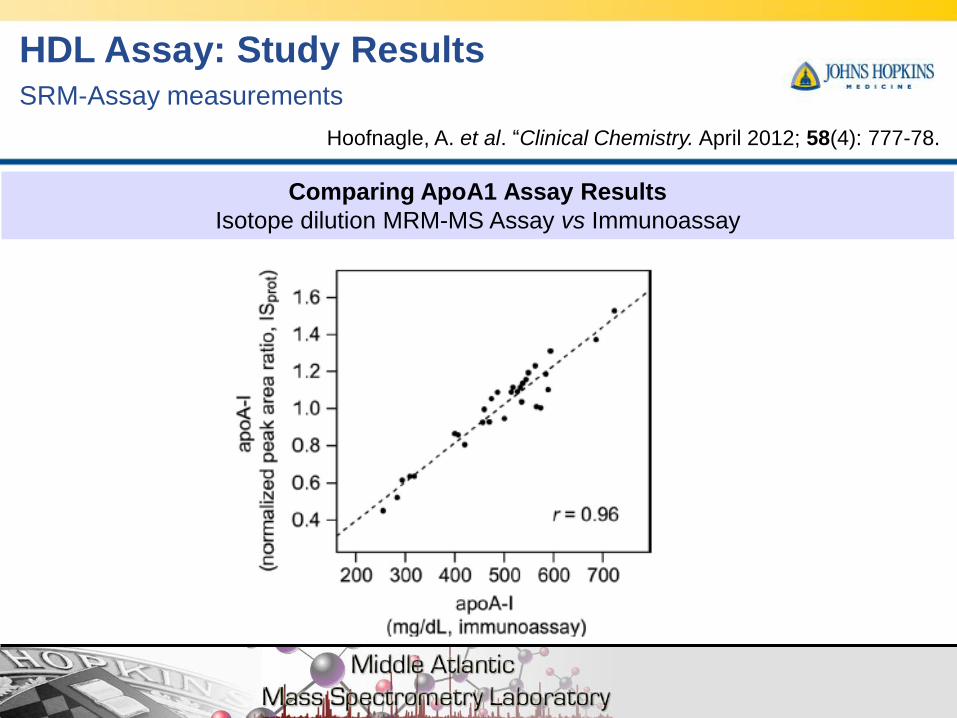
CPTAC Study: Study Results Assessing SRM Assay Reproducibility and Precision
Comparing SRM Assay Results
Intralaboratory Assay CVs
Addona, T. et al. “Nature Biotechnology. June 2009; 27(7): 633-64.
November 27, 2012 57 November 27, 2012 57
CPTAC Study: Study Results Assessing SRM Assay Reproducibility and Precision
Comparing SRM Assay Results
Intralaboratory Assay CVs
Addona, T. et al. “Nature Biotechnology. June 2009; 27(7): 633-64.
November 27, 2012 58 November 27, 2012 58
CPTAC Study: Study Results Assessing SRM Assay Reproducibility and Precision
Comparing SRM Assay Results
Intralaboratory Assay LOQs
Addona, T. et al. “Nature Biotechnology. June 2009; 27(7): 633-64.
59
CPTAC Study: Study Results Assessing SRM Assay Reproducibility and Precision
Reproducibility and Precision of the quantitative measurements for 9 of 10 peptides ranged from 4–14%, 4–13%, and 10–23%.
Intralaboratory CVs were predominantly <15% and <25% at the identical concentration for studies I/II and III, respectively.
Interlaboratory and intralaboratory CVs improved with increasing analyte concentration.
Under real plasma biomarker conditions (study III): o Performance was below that expected for clinical assays (<10–15%).
o Sensitivity was sufficiently low for verifying candidate biomarkers present in plasma with a concentration higher than 2–6 g/ml in plasma
o Assay demonstrated a linear dynamic range spanning three orders of magnitude
Addona, T. et al. “Nature Biotechnology. June 2009; 27(7): 633-64.
60
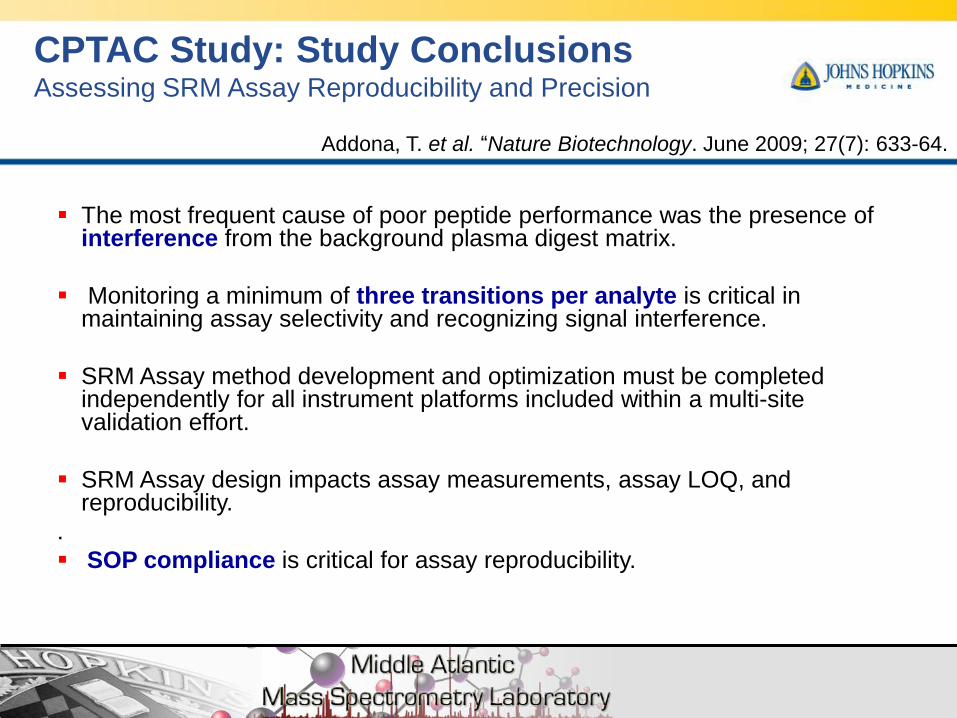
CPTAC Study: Study Conclusions Assessing SRM Assay Reproducibility and Precision
The most frequent cause of poor peptide performance was the presence of interference from the background plasma digest matrix.
Monitoring a minimum of three transitions per analyte is critical in maintaining assay selectivity and recognizing signal interference.
SRM Assay method development and optimization must be completed independently for all instrument platforms included within a multi-site validation effort.
SRM Assay design impacts assay measurements, assay LOQ, and reproducibility.
.
SOP compliance is critical for assay reproducibility.
Addona, T. et al. “Nature Biotechnology. June 2009; 27(7): 633-64.