ANALOGUES OF NITROFURAN ANTIBIOTICS ARE POTENT GROEL/ES PRO-DRUG INHIBITORS WITH EFFICACY AGAINST ENTEROCOCCUS FAECIUM, STAPHYLOCOCCUS AUREUS, AND ESCHERICHIA COLI Christopher Ryan Howe Submitted to the faculty of the University Graduate School in partial fulfillment of the requirements for the degree Master of Science in the Department of Biochemistry and Molecular Biology, Indiana University May 2020
Transcript
ANALOGUES OF NITROFURAN ANTIBIOTICS ARE POTENT GROEL/ES PRO-DRUG
INHIBITORS WITH EFFICACY AGAINST ENTEROCOCCUS FAECIUM,
STAPHYLOCOCCUS AUREUS, AND ESCHERICHIA COLI
Christopher Ryan Howe
Submitted to the faculty of the University Graduate School in partial fulfillment of the requirements
for the degree Master of Science
in the Department of Biochemistry and Molecular Biology, Indiana University
May 2020
ii
Accepted by the Graduate Faculty of Indiana University, in partial fulfillment of the requirements for the degree of Master of Science.
Master's Thesis Committee
______________________________________ Steven M. Johnson, Ph.D., Chair
The rise of antibiotic-resistant bacteria ................................................................. 1
Current antibiotic classes and a lack of antibiotic variety ...................................... 2
Mechanisms of resistance in ESKAPE pathogens and E. coli .............................. 5 Considerations for GroEL/ES chaperonin systems as antibacterial targets .......... 8 Previous studies to identify GroEL/ES inhibitors with anti-bacterial effects against the ESKAPE pathogens ................................................................ ……..11
RESULTS AND DISCUSSION ...................................................................................... 14
Development of hydroxyquinoline and nitrofuran compound series .................... 14 Identifying antibacterial efficacy of compound 1 analogues against ESKAPE pathogens and E. coli ........................................................................................ 15 Evaluating analogues for their ability to inhibit GroEL/ES-mediated refolding of substrate polypeptides in vitro ............................................................................ 17 Evaluating whether or not analogues inhibit GroEL ATPase functions ............... 21 Evaluating the effects of the E. coli NfsB type-1 nitroreductase on the ability of test compounds to inhibit GroEL/ES ............................................................... 23 Evaluating analogues for cytotoxicity to human colon and small intestinal cells ................................................................................................................... 27 Investigating the ability of E. coli to gain resistance to 17, nifuroxazide, and nitrofurantoin ...................................................................................................... 28
General synthetic methods ................................................................................ 35 General materials and methods for biochemical and cell-based experiments .... 50
ix
E. coli GroEL and GroES purification ................................................................. 50 Evaluation of compounds in the GroEL/ES-mediated dMDH refolding assays ............................................................................................................... 53 Counter-screening compounds for inhibition of native MDH enzymatic activity ................................................................................................................ 54 Evaluation of compounds in the GroEL/ES-mediated dMDH refolding assay and native MDH activity counter-screen in the presence of E. coli NfsB nitroreductase ........................................................................................... 55 Evaluation of compounds for inhibition in the GroEL/ES-mediated dRho refolding assay ................................................................................................... 56 Counter-screening compounds for inhibition of native rhodanese enzymatic activity ................................................................................................................ 57 Evaluation of compounds for inhibition in the GroEL-mediated ATPase assay ... 58
Evaluating compounds for inhibition of bacterial cell proliferation ....................... 59
Evaluating compounds for effects on the viability of healthy human colon (FHC) and small intestine (FHs 74 Int) cells ....................................................... 61 Evaluation of E. coli resistance generation against lead inhibitors ..................... .62
Control compounds, calculation of I/E/CC50 values, and statistical considerations .................................................................................................... 63
Figure 7 – Structures of hit-to-lead inhibitors 43, 44, and 1 ......................................... 12
Figure 8 – Structural similarity of 1 to known antibiotics and SAR strategy ................. 13 Figure 9 – Heat map of analogue potencies against ESKAPE and E. coli bacteria ..... 17
Figure 12 – GroEL/ES-dMDH refolding vs. ATPase inhibition ....................................... 22
Figure 13 – NTR1 and NTR2 bioactivation pathways .................................................... 24
Figure 14 – Chaperone refolding and native MDH enzymatic activity with and without NfsB ........................................................................................................................ 26
Figure 15 – GroEL/ES-dMDH refolding vs. bacterial growth inhibition .......................... 26 Figure 16 – FHC vs. FHs 74 Int cytotoxicity .................................................................. 28 Figure 17 – E. coli resistance generation against lead antibacterials ............................ 30 Figure 18 – E. coli permanent resistance against lead antibacterials ............................ 31 Figure 19 – Evaluation of E. coli cross-resistance against lead antibacterials ............... 32
xii
LIST OF SCHEMES
Scheme 1 – General protocol for synthesizing inhibitor analogs ...... ……………………14
xiii
LIST OF ABBREVIATIONS
ADP – Adenosine diphosphate ATP – Adenosine triphosphate BHI – Brain heart infusion media CC50 – Cytotoxicity concentration for half-maximal signal in human cell viability assays CH3CN– Acetonitrile Da – Dalton DMSO – Dimethyl sulfoxide EC50 – Effective concentration for half-maximal signal in bacterial proliferation assays EDTA – Ethylenediaminetetraacetic acid HPLC – High-performance liquid chromatography HSP – Heat shock protein IC50 – Inhibitory concentration for half-maximal signal in biochemical assays IPTG – Isopropyl β-D-1- thiogalactopyranoside kDa – Kilodalton LB – Luria Bertani broth MDH – Malate dehydrogenase MeOH – Methanol MS – Mass spectrometry NAD+ – Nicotinamide adenine dinucleotide (oxidized form) NADH – Nicotinamide adenine dinucleotide (reduced form) NfsA – nfsA nitroreductase gene variant NfsB – nfsB nitroreductase gene variant NMR – Nuclear magnetic resonance NTR1 – Nitroreductase 1 NTR2 – Nitroreductase 2 OD – Optical density PBS – Phosphate buffered saline Rho – Rhodanese SAR – Structure activity relationship TFA – Trifluoroacetic acid
1
INTRODUCTION
The rise of antibiotic-resistant bacteria
The emergence of antibiotic-resistant bacteria has become a significant threat to
human health. A 2019 CDC report titled “Antibiotic Resistance Threats in the United
States”1 touches on the dangers of the ESKAPE pathogens, which consist of Gram-
positive Enterococcus faecium and Staphylococcus aureus, as well as Gram-negative
Klebsiella pneumonia, Acinetobacter baumannii, Pseudomonas aeruginosa, and
Enterobacter species. These are a subset of bacteria that are prone to developing
resistance against commonly used antibiotics. The ESKAPE pathogens contribute to
approximately two-million infections in the U.S. per year, as well as nearly 23,000 annual
deaths.2 In addition to the ESKAPE pathogens, multiple strains of Gram-negative
Escherichia coli have also shown a tendency to threaten public health through antibiotic
resistance. One particular class of E. coli, the resistant Shiga-toxin producing (STEC)
pathogens, was noted as the chief cause of over 265,000 infections in the U.S., in 2018.3
It also appears that STEC infections have become more common over the past 20
years, as these pathogens were linked to far fewer (~110,000) U.S. infections in 1999.4
Although the majority of E. coli infections take place in the urinary tract (known as UTIs),
these infections can eventually spread to the kidneys and the bloodstream. This can
lead to painful symptoms, such as bloody urination and sepsis. The persistence of
ESKAPE and E. coli infections is quite alarming, as it offers the potential for long-term
health concerns in the community. Thus, it is crucial that novel antibiotics are developed
to combat their proliferation in susceptible populations, which include hospital patients
and the immunocompromised, among others.
2
Current antibiotic classes and a lack of antibiotic variety
In 1928, Sir Alexander Fleming discovered the first known antibiotic drug,
penicillin, which provides activity against bacterial cell wall synthesis by inhibiting D,D-
transpeptidase, a crosslinking enzyme.5 At the time of Fleming’s initial discovery,
penicillin could not be produced for the masses because of a lack of technological
means. That changed just 16 years later during World War II. A collaborative effort,
headed by the Allied Power pharmaceutical companies, sought to produce larger
quantities of penicillin for ailing soldiers. This initiative ultimately led to the production of
2.3 million doses of penicillin for D-Day in Normandy.5 Not only was this beneficial to the
war effort, but it also demonstrated that the world was ready to mass produce antibiotics
for public use.
The ability to mass produce penicillin prompted scientists to search for additional
classes of antibiotics with different protein targets. For instance, the sulfonamides were
discovered in the 1930’s.6 Sulfonamides are known for their ability to mimic para-
aminobenzoic acid (PABA), an intermediate in the bacterial folic acid synthesis pathway.
These antibiotics outcompete PABA for dihydropteroate synthetase, leading to
downstream inhibition of folic acid synthesis. In the 1940’s and 1950’s, tetracyclines and
macrolides were developed.7,8 These classes of antibiotics are primarily linked to
inhibition of bacterial peptide synthesis pathways. Tetracyclines bind to the 30S
ribosomal subunit to block aminoacyl-tRNA occupation of the A-site, whereas macrolides
bind to the 50S subunit to block the ongoing development of the growing peptide chain.
In the 1960’s, fluoroquinolones came into prominence as strong inhibitors of the major
bacterial transcription enzymes Topoisomerase IV and DNA gyrase.9 The general
scaffolds/structures for these antibiotics and their associated mechanisms of action are
shown in Figure 1A-D.10-12
3
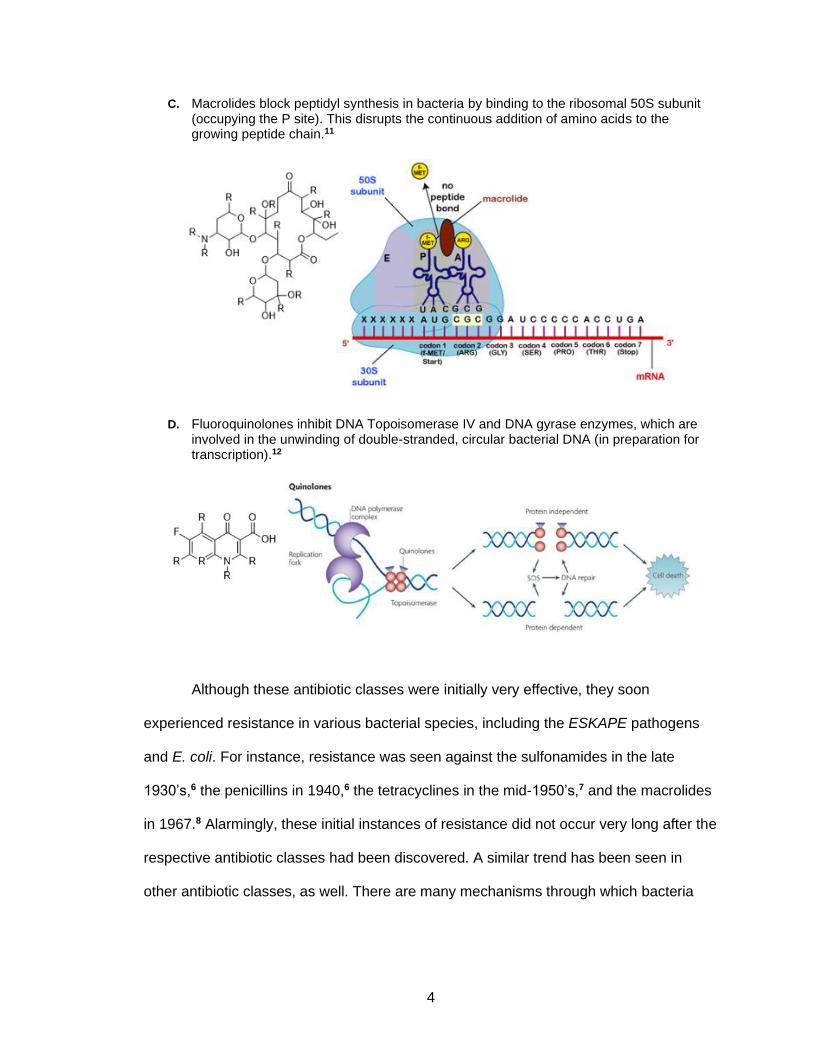
Figure 1 – Mechanisms of action for commonly used antibiotics General mechanisms of action of several current antibiotic classes. Associated “R” groups represent a variety of functional groups that are typically attached to these core scaffolds.
A. Sulfonamides mimic PABA, acting as an antagonist of dihydropteroate synthetase. As a result, they inhibit downstream folic acid synthesis in bacteria.
B. Tetracyclines block peptidyl synthesis in bacteria by binding to the ribosomal 30S subunit (occupying the A site). This prevents the delivery of the aminoacyl-tRNA component to the ribosome.10
4
C. Macrolides block peptidyl synthesis in bacteria by binding to the ribosomal 50S subunit (occupying the P site). This disrupts the continuous addition of amino acids to the growing peptide chain.11
D. Fluoroquinolones inhibit DNA Topoisomerase IV and DNA gyrase enzymes, which are involved in the unwinding of double-stranded, circular bacterial DNA (in preparation for transcription).12
Although these antibiotic classes were initially very effective, they soon
experienced resistance in various bacterial species, including the ESKAPE pathogens
and E. coli. For instance, resistance was seen against the sulfonamides in the late
1930’s,6 the penicillins in 1940,6 the tetracyclines in the mid-1950’s,7 and the macrolides
in 1967.8 Alarmingly, these initial instances of resistance did not occur very long after the
respective antibiotic classes had been discovered. A similar trend has been seen in
other antibiotic classes, as well. There are many mechanisms through which bacteria
5
develop antibiotic resistance, many of which are quite common across bacteria and are
discussed below.
Mechanisms of resistance in ESKAPE pathogens and E. coli
The ESKAPE pathogens and various strains of E. coli are prone to developing
antibiotic resistance through a variety of mechanisms. One such mechanism includes
synthesis of extended spectrum β-lactamases (e.g. AmpC in P. aeruginosa and E.
cloacae; TEM in E. coli and K. pneumoniae; CTX-M in K. pneumoniae, Enterobacter
species, E. coli). These specialized enzymes act to hydrolyze drugs with β-lactam rings
(penicillins, cephalosporins, etc.), thus rendering them ineffective.13,14 In addition,
pathogens can overexpress efflux pumps (e.g. AcrA-AcrB-TolC in E. coli, MexAB-OprM
in P. aeruginosa, AdeABC in A. baumannii), which are membrane-spanning machinery
used to remove toxic substances, including antibiotics, from the cytosol.13,14 Efflux
pumps have been linked to fluoroquinolone, tetracycline, macrolide, and β-lactam drug
resistance, among others.13,14 Bacteria can also mutate genes involved in the production
of porin structures (e.g. OmpF, OmpC, and PhoE in E. coli, as well as OprD in P.
aeruginosa).14 Polar antibiotics, such as the β-lactams, tetracyclines, and some
fluoroquinolones, require porins to bypass the highly lipophilic cell membrane and enter
the bacterial cell. Mutant porins significantly hinder this process, leading to reduced
antibiotic efficacy. In addition, bacteria can produce variants of the D,D-transpeptidase
enzyme, which typically drives the final cross-linking step in cell wall synthesis (D-
Ala4→mDAP3, where mDAP (meso-Diaminopimelic acid) is a derivative of lysine with an
epsilon-carboxy group substitution). Mutant forms of D,D-transpeptidase can be
produced (e.g. PBP2a in S. aureus, PBP5 in E. faecium)13,15-16, which typically fold in a
manner that shields the enzyme’s active site pocket from β-lactam drugs. Even
alternative forms of D,D-transpeptidase can be developed (e.g. L,D-transpeptidase in E.
6
faecium, as shown in Figure 2), containing different cross-linking substrates altogether
(L,D-transpeptidase links mDAP3→mDAP3, as opposed to D-Ala4
→mDAP3).17
In addition to acquired resistance, many bacteria are prone to intrinsic resistance.
For instance, Gram-negative bacteria are structurally less permeable to drugs than
Gram-positive pathogens, owing to their additional lipopolysaccharide (LPS) outer
membrane (Figure 3). 18-19 The lipopolysaccharide extensions undergo cross-linking, a
process that ultimately leads to decreased bacterial membrane fluidity and further
reduced cell penetrability (Figure 3).18,20 Several of the pathogens from this current
study are Gram-negative (notably K. pneumonia, A. baumannii, P. aeruginosa, E.
cloacae, and E. coli), indicating that they present this additional barrier in drug
development.
Figure 2 – L,D-transpeptidase vs. D,D-transpeptidase mechanism of action Illustration of the differences between L,D-transpeptidase (cysteine active site) and D,D-transpeptidase (serine active site) activity. L,D-transpeptidase initiates cross-linking between m-DAP3 and m-DAP3, whereas D,D-transpeptidase initiates cross-linking between D-Ala4 and m-DAP3. Bacteria can evade the activity of β-lactam antibiotics (which target D,D-transpeptidase), by producing the alternative L,D-transpeptidase form.13
7
Figure 3 – Gram-positive and Gram-negative bacteria structural differences Structural differences between the cell walls of Gram-positive and Gram-negative bacteria, which promote intrinsic resistance in Gram-negative forms.18
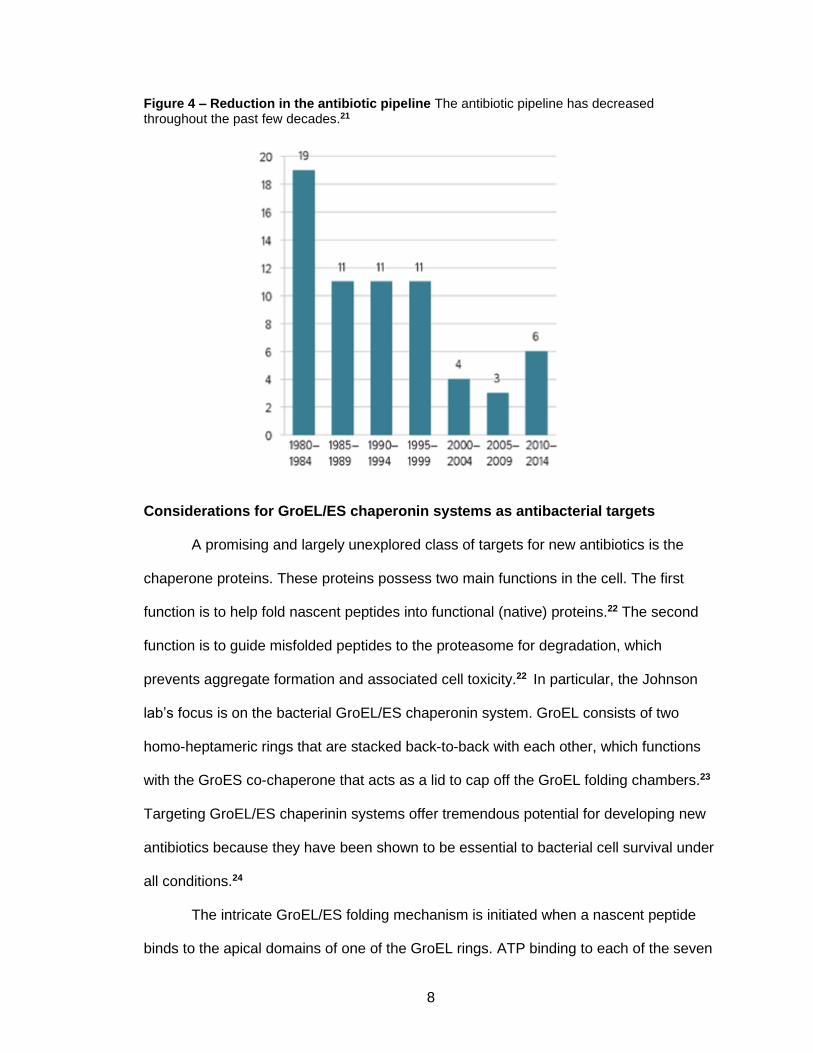
To make matters worse, antibiotics research has continued to decline in recent
decades, leading to a depleted drug pipeline. For instance, from 1980-1984, roughly 19
new molecules gained drug status.21 This dropped to just 6 molecules during the 2010-
2014 time frame (Figure 4).21 A perceived lack of monetary incentive has caused
pharmaceutical companies to veer away from this area of research in favor of more
profitable diseases.21 The diminished drug pipeline has created a scenario where there
are not enough new antibiotics to replace ones that have steadily lost efficacy due to
bacterial resistance. This indicates a necessity to develop new antibiotics that can target
novel protein systems central to all Gram-positive and Gram-negative species in order to
combat a broader spectrum of pathogens.
8
Figure 4 – Reduction in the antibiotic pipeline The antibiotic pipeline has decreased throughout the past few decades.21
Considerations for GroEL/ES chaperonin systems as antibacterial targets
A promising and largely unexplored class of targets for new antibiotics is the
chaperone proteins. These proteins possess two main functions in the cell. The first
function is to help fold nascent peptides into functional (native) proteins.22 The second
function is to guide misfolded peptides to the proteasome for degradation, which
prevents aggregate formation and associated cell toxicity.22 In particular, the Johnson
lab’s focus is on the bacterial GroEL/ES chaperonin system. GroEL consists of two
homo-heptameric rings that are stacked back-to-back with each other, which functions
with the GroES co-chaperone that acts as a lid to cap off the GroEL folding chambers.23
Targeting GroEL/ES chaperinin systems offer tremendous potential for developing new
antibiotics because they have been shown to be essential to bacterial cell survival under
all conditions.24
The intricate GroEL/ES folding mechanism is initiated when a nascent peptide
binds to the apical domains of one of the GroEL rings. ATP binding to each of the seven
9
subunits of this cis-ring creates an upward conformational shift in the apical domains,
allowing them to engage with the GroES co-chaperone.22 Binding of GroES causes a
greater conformational movement that releases the bound polypeptide substrate into the
now enclosed GroEL/ES chamber.22 The polypeptide is allowed to try and refold on its
own, sequestered from the outside cytoplasmic milieu, with ATP hydrolysis (~5-10 s)
acting as the timing mechanism. ATP hydrolysis in the cis-ring sends an allosteric signal
for ATP and another unfolded polypeptide substrate to then bind to the GroEL trans-
ring.22 This initiates the release of the GroES lid from the cis-ring, along with the
folded/native protein.25 If the protein is not in its native state, it can undergo the folding
process again or be targeted for degradation. A diagram of the GroEL/ES chaperone
structure is illustrated in Figure 5,26 with a diagram depicting the GroEL/ES-mediated
polypeptide substrate folding pathway in Figure 6.27
Figure 5 – GroEL/ES structure The structure of GroEL/ES, shown from both side views and top-down views Two GroEL rings are stacked on top of each other, and each contain an equatorial (blue), intermediate (green), and apical (red) domain. The GroES lid component is mobile and can translocate between GroEL apical domains.26
10
Figure 6 – GroEL/ES refolding pathway steps The functionality of GroEL/ES is shown, including individual steps in the chaperonin-mediated polypeptide substrate folding process. A GroEL cis-ring binds a nascent peptide via its apical domain. ATP then binds to the equatorial domain of that ring, creating an upward conformational shift. This conformational shift allows GroES to bind to the GroEL apical domains, which releases the peptide substrate into the chaperone chamber. An ~5-10 second ATP hydrolysis event acts as a timing mechanism for the peptide to fold itself. After ATP hydrolysis in the GroEL cis-ring, ATP and another substrate polypeptide then bind to the GroEL trans-ring. This causes the GroES lid to be released from the cis-ring, along with the potentially folded peptide.27
The universal role of GroEL/ES in bacterial cell survival (both Gram-positive and
Gram-negative forms) makes it a great target for exploitation by small-molecule
inhibitors. A potential caveat for this strategy could be off-target effects against HSP60,
the human isoform of bacterial GroEL, which share 48% sequence identity.28 Despite
significant homology between the two chaperones, ongoing studies continue to
emphasize the finding that even compounds that inhibit both bacterial GroEL/ES and
human HSP60/10 in vitro can be viable antibacterial candidates.28-32 In particular, the
Johnson lab has identified numerous known drugs and natural products that can target
both GroEL/ES and HSP60/10 in vitro, yet show low-to-no toxicity in cells or in vivo. For
instance, it was discovered that suramin, an antibiotic that has been used to treat
Trypanosoma brucei infections for over 100 years, is a potent GroEL/ES and HSP60/10
inhibitor in these in vitro assays. This is putatively because such inhibitors cannot
traverse the highly impermeable mitochondrial membrane to even interact with
HSP60/10 in the mitochondrial matrix of human cells.29
11
Previous studies to identify GroEL/ES inhibitors with anti-bacterial effects against
the ESKAPE pathogens
In 2014, the Johnson lab reported a study that identified 235 GroEL/ES inhibitors
from a high-throughput screen of 700,000 compounds.33 Subsequent screening and
med-chem development of two hit-to-lead series, based on scaffolds of 43 and 44
(Figure 7), identified lead compounds that were able to potently inhibit the proliferation
of E. faecium and S. aureus bacteria (both Gram-positive), but that were largely
ineffective against E. coli and the KAPE Gram-negative bacteria.28,31-32 However, from
initial antibacterials testing,28 compound 1 stood out as another hit inhibitor of interest.
Despite being only a moderate GroEL/ES inhibitor, 1 demonstrated weak-to-moderate
inhibition of two Gram-negative ESKAPE pathogens, K. pneumoniae and A.
baumannii.28 Furthermore, the scaffold of compound 1 resembles other known
antibiotics that are active against Gram-negative bacteria. For instance, 1 shares its
main hydroxyquinoline group (circled red in Figure 8) with nitroxoline, an antibiotic that
is currently used to treat E. coli-based urinary tract infections (UTI’s) and has also
demonstrated bioactivity against A. baumannii, P. aeruginosa, and K. pneumoniae.34
Furthermore, compound 1 shares its N-acyl hydrazone core component (circled blue in
Figure 8) with nitrofuran-based antibiotics such as nifuroxazide and nitrofurantoin, which
are used to treat E. coli-based UTI’s.35 The one aspect nifuroxazide and nitrofurantoin
possess that 1 does not, however, is a nitrofuran group (circled green, Figure 8), which
is known to be key to eliciting antibacterial effects.
12
Figure 7 – Structures of hit-to-lead inhibitors 43, 44, and 1 The structures of hit-to-lead antibacterial candidates 43, 44, and 1.
Table 1 – Assay results for high-throughput hits Previously reported biochemical and bacterial growth inhibition results for compounds 43, 44, and 1.28,31-32 While analogs of 43 and 44 were effective against Gram-positive bacteria (e.g. E. faecium and S. aureus), they were largely ineffective against Gram-negative bacteria. However, another hit identified from high-throughput screening, compound 1, showed weak-to-moderate inhibition of K. pneumonia and A. baumannii (Gram-negative bacteria).
Based on the similarities of compound 1 with nitroxoline (i.e. hydroxyquinoline)
and nifuroxazide/nitrofurantoin (N-acyl hydrazones, albeit with nitrofuran substructures),
I compiled a library of analogs that probed the structure-activity relationships (SAR) of
the cyclic/aryl substructures on both the right and left-hand sides of the N-acyl
hydrazone linker. The left side of these analogues contained either a nitrofuran group
(mimicking nifuroxazide and nitrofurantoin) or a hydroxyquinoline group (mimicking 1
and nitroxoline), generating two distinct series of compounds. For each series, 15 right
side R-groups were assessed that contain a diverse range of substructures including
some that were found to be effective with other GroEL/ES inhibitor scaffolds (see Figure
13
8 for the respective substructures). These analogues were tested in a panel of in vitro
assays for bacterial proliferation inhibition, GroEL/ES inhibition (both substrate folding
and ATPase functions), human cell cytotoxicity, and bacterial resistance towards lead
analogs. The results from testing analogs in this panel of biochemical and cell-based
experiments is presented below, with a discussion on SAR and the potential of these
series as GroEL/ES-targeting antibacterial candidates.
Figure 8 – Structural similarity of 1 to known antibiotics and SAR strategy Comparison of the structure of hit GroEL/ES inhibitor 1 with known antibiotics nitroxoline, nifuroxazide, and nitrofurantoin. The hydroxyquinoline group (circled in red) is shared between 1 and the Gram-negative inhibitor nitroxoline. Also, the N-acyl hydrazone core (circled in blue) is shared between 1 and known antibiotics nifuroxazide and nitrofurantoin. The additional nitrofuran group (circled in green) is a component that is unique to nifuroxazide and nitrofurantoin, but not present in 1. Analogues of compound 1 were synthesized where the N-acyl hydrazine linker was maintained constant, the right-hand R-substructures were varied as indicated, and the left-hand aryl substructure consisted of either hydroxyquinoline (mirroring 1 and nitroxoline) or nitrofuran (mirroring nifuroxazide and nitrofurantoin).
14
RESULTS AND DISCUSSION
Development of hydroxyquinoline and nitrofuran compound series
As discussed in the introduction, I investigated two primary series of compound 1
analogues in this study: (1) hydroxyquinolines (analogs 1-15) and (2) nitrofurans
(analogs 16-28 and also including nifuroxazide and nitrofurantoin). A third group of
analogues (29-42) was also investigated to determine which substructures of the
hydroxyquinoline and nitrofuran aryls were required for inhibitor potency in the
respective assays. Analogues were all synthesized through a one-step coupling reaction
between the respective aryl-aldehydes and hydrazides in DMSO, with HCl as a catalyst
(Scheme 1). After stirring overnight at room temperature, the final Schiff base products
were precipitated through the addition of water, and the solids were filtered and dried in
vacuo. Synthesized analogues were analyzed by RP-HPLC for purity and LC-MS and
1H-NMR for structural confirmation (complete characterization data can be found in the
Experimental section). While all compounds were found to be >95% pure using two
distinct sets of RP-HPLC conditions, for some analogues (e.g. 3, 4, 6, 9, 10, 17, 23), we
noticed a splitting of peaks in the 1H-NMR spectra. This phenomenon has previously
been studied and reported as resulting from hindered rotation around the CO-NH bond,
providing rotational isomers (rotamers).36 Thus, I believe that the purity of these
compounds is consistent with HPLC results being >95% pure.
Scheme 1 General protocol for synthesizing compound 1 analogs. Reaction mixtures were stirred overnight at room temperature, then the Schiff-base products were precipitated with water, filtered, and dried in vacuo.
15
Identifying antibacterial efficacy of compound 1 analogues against the ESKAPE
pathogens and E. coli
Analogues were initially tested for antibacterial activity against representative
strains of E. coli and the ESKAPE bacteria (refer to the Experimental section for strain
and vendor information for the respective bacteria). To determine compound efficacy,
bacterial proliferation assays were carried out in liquid media culture supplemented with
physiological concentrations of free calcium and magnesium cations. For these assays,
initial bacterial cultures (OD600=0.01) were exposed to test compounds in 8-point, 3-fold
dilution series (100 μM → 46 nM concentration range). After addition of compounds to
cultures, the plates were sealed with Breathe-Easy membranes and allowed to
incubate/grow to mid-log phase (OD600~0.4-0.6), whereupon final OD600 readings were
taken to assess for bacterial growth inhibition. An in-depth protocol for this common set
of proliferation assays is provided in the Experimental section, and calculated EC50
values are reported in Table 2A in the Appendix (log-transformed EC50 values with
standard deviations are presented in Table 2B). A heat map portraying inhibitor
potencies against the respective bacteria is presented in Figure 9 for easier visualization
of results, with darker cells representing the most potent analogues, and lighter cells
least potent inhibitors.
Results from the bacterial proliferation assays indicated that the hydroxyquinoline
analogues were largely ineffective against E. coli and the ESKAPE pathogens, as only a
few weak inhibitors (EC50 values below the 100 µM threshold) were discovered. This
was a disappointing result as, prior to initiating this study, I hypothesized that the metal-
chelating properties of the hydroxyquinoline substructure might allow these inhibitors to
act as siderophores that could be actively uptaken into bacteria, thus bypassing the
potential problems of having to passively diffuse across the impermeable LPS outer
membrane.37 Despite this setback, I was excited to see that many of the nitrofuran-
16
based analogs were much more effective at inhibiting bacterial growth. In particular, 16-
20, 22-24, and 26 were moderate to strong inhibitors of the Gram-positive E. faecium
and S. aureus bacteria. It appeared that analogues with bulkier R-groups were slightly
less effective than those with smaller R-groups. While antibacterial effects were limited
against the Gram-negative KAPE bacteria, what stood out was that several analogs with
small R-groups (16-20) were very potent against E. coli. Compounds 16 and 17 were
even more potent than nitroxoline, nifuroxazide, and nitrofurantoin, with EC50 values <1
μM. This was a significant finding, as previous Johnson group studies had failed to
identify lead analogs with significant efficacies against E. coli. As evidenced by the
results of compound 39, which has an unsubstituted furan ring, the nitro-group was
essential for antibacterial effects. This is putatively because nitrofuran antibiotics are
activated to reactive metabolites by nitroreductases in bacteria, which is discussed in
greater detail below. Since the Schiff base analogs were largely ineffective against the
KAPE bacteria, yet the hydroxyquinoline and nitrofuran aldehyde starting materials (40
and 41, respectively) were potent inhibitors of nearly all the bacteria (excluding P.
aeruginosa), it was evident that the imine bonds of the N-acyl hydrazine linkers were not
hydrolyzing to give the starting materials. As a result, inhibitor potencies likely owe to the
final products.
17
Figure 9 – Heat map of analogue potencies against ESKAPE and E. coli bacteria Shown is a heat map displaying relative antibacterial potencies (EC50 values) for analogues tested in all bacteria proliferation assays. Cells that are shaded dark blue are most potent, while those that are shaded lighter less potent to inactive (>100 μM). Nitrofurans with small R-groups, particularly analogues 16-20, are potent against E. faecium and S. aureus (Gram-positive bacteria), as well as E. coli (Gram-negative). Associated R-groups for the most potent inhibitors are indicated to the right.
Evaluating analogues for their ability to inhibit GroEL/ES-mediated refolding of
substrate polypeptides in vitro.
Since I found many potent inhibitors of bacterial growth that merited further
investigation, I next proceeded to evaluate their abilities to inhibit GroEL/ES-mediated
folding and ATPase functions. All test compounds were first evaluated in standard
GroEL/ES-mediated refolding assays that employ malate dehydrogenase (MDH) and
Rhodanese (Rho) as the denatured substrate reporter enzymes (detailed descriptions of
the assay protocols are presented in the Experimental section, with schematics
presented in Figure 10). These enzymes are efficiently folded by GroEL/ES in the
absence of inhibitors, and thus act as reporter enzymes to determine the degree of
18
inhibition against the bacterial chaperone. Inhibition was examined in the presence of
these two orthogonal substrates in order to support that GroEL/ES inhibitors were on-
target. To further support on-target effects against GroEL/ES, I counter-screened for
inhibition of the native MDH and Rho enzymatic reporter reactions, where test
compounds were added after the denatured MDH and Rho substrate enzymes were
completely refolded by GroEL/ES. Previous Johnson lab efforts have found that these
series of biochemical assays are highly effective at eliminating false-positives as
compounds rarely inhibit both reporter enzymes since their enzymatic read-outs are so
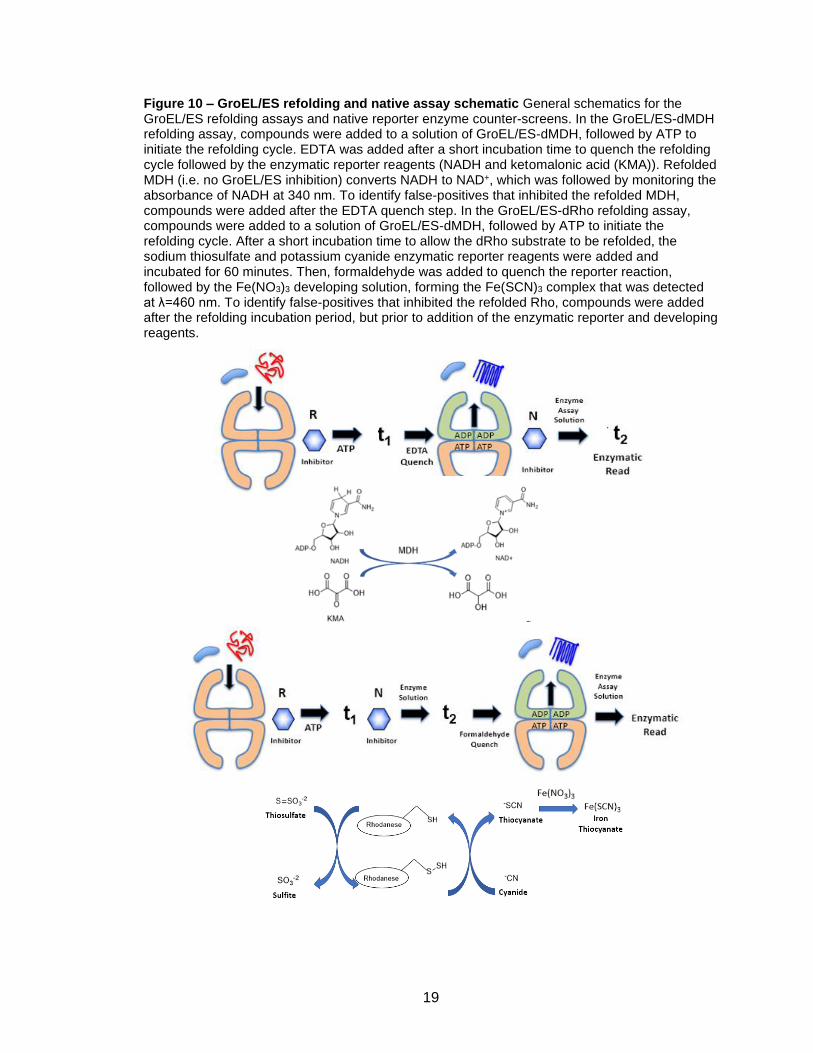
different from one another. Figure 10 presents general schematics for both the
GroEL/ES-mediated dMDH and dRho refolding assays and the native MDH and Rho
reporter counter-screens, with IC50 results presented in Table 3A in the Appendix. While
GroEL and GroES from E. coli were used as surrogates in these assays, I anticipate
inhibition results will translate to the chaperonin systems of the other ESKAPE bacteria
owing to their high sequence similarities: 60.2% with E. faecium; 56.8% with S. aureus;
96.4% with K. pneumonia; 75.5% with A. baumannii; 79.6% with P. aeruginosa; and
96.2% with E. cloacae. My lab is currently in the process of generating recombinant
versions of the respective ESKAPE bacteria GroEL and GroES proteins and will report
on such inhibition results in the future.
19
Figure 10 – GroEL/ES refolding and native assay schematic General schematics for the GroEL/ES refolding assays and native reporter enzyme counter-screens. In the GroEL/ES-dMDH refolding assay, compounds were added to a solution of GroEL/ES-dMDH, followed by ATP to initiate the refolding cycle. EDTA was added after a short incubation time to quench the refolding cycle followed by the enzymatic reporter reagents (NADH and ketomalonic acid (KMA)). Refolded MDH (i.e. no GroEL/ES inhibition) converts NADH to NAD+, which was followed by monitoring the absorbance of NADH at 340 nm. To identify false-positives that inhibited the refolded MDH, compounds were added after the EDTA quench step. In the GroEL/ES-dRho refolding assay, compounds were added to a solution of GroEL/ES-dMDH, followed by ATP to initiate the refolding cycle. After a short incubation time to allow the dRho substrate to be refolded, the sodium thiosulfate and potassium cyanide enzymatic reporter reagents were added and incubated for 60 minutes. Then, formaldehyde was added to quench the reporter reaction, followed by the Fe(NO3)3 developing solution, forming the Fe(SCN)3 complex that was detected at λ=460 nm. To identify false-positives that inhibited the refolded Rho, compounds were added after the refolding incubation period, but prior to addition of the enzymatic reporter and developing reagents.
20
Unfortunately, I found that the nitrofuran analogues were only weak-to-moderate
GroEL/ES inhibitors despite their being the most potent at inhibiting bacterial growth
(blue circles in Figure 11A). Conversely, the hydroxyquinoline analogues (yellow circles
in Figure 11A) were much stronger GroEL/ES inhibitors, although they were largely
inactive against bacteria. SAR indicated that analogues with larger R-groups were
generally more potent than those with smaller R-groups (Table 3A), which was a trend
generally contradictory to inhibitor potencies against bacteria. While the
hydroxyquinolines were slightly more potent in the GroEL/ES-mediated dRho compared
to dMDH refolding assays, this was likely because they had the coupled effects of also
being weak inhibitors of the native Rho reporter reaction; however, no compounds
inhibited native MDH, supporting on-target effects against GroEL/ES. That analogue 6
was more potent in the GroEL/ES-dRho refolding assay is an anomaly since it does not
inhibit the native Rho reporter reaction. Since analogs 29-39, which consist of R-groups
where various parts of the hydroxyquinoline substructure were pared away, were largely
inactive in all biochemical assays indicates the necessity for the complete
hydroxyquinoline moiety for inhibition.
21
Figure 11 – GroEL/ES refolding and native assay results Correlation plots demonstrate E. coli GroEL/ES-mediated refolding and native assays, using both MDH and Rho substrates. Single data points represent IC50 values for individual analogues. (A) Hydroxyquinolines were potent GroEL/ES inhibitors, whereas nitrofurans were weak-to-moderate GroEL/ES inhibitors. The majority of hydroxyquinoline inhibitors appeared to be slightly more potent in the GroEL/ES-mediated dRho assay, as opposed to the dMDH assay (Pearson correlation coefficient for inhibiting in both refolding assays is 0.905, p < 0.0001). One analogue, 6, was potent in the dRho assay but ineffective in the dMDH assay. (B) While several compounds were found to be weak inhibitors in the native Rho counter-screen, none inhibited native MDH, supporting on-target effects against GroEL/ES since they were strong inhibitors in the GroEL/ES-dMDH refolding assay.
Evaluating whether or not analogues inhibit GroEL ATPase functions.
Since ATPase events are common among many biological processes, inhibiting
GroEL/ES by competitively binding to the ATP sites could prove problematic for being
able to selectively target the chaperonin system. Thus, I next employed a well-
established GroEL ATPase assay using malachite green to monitor inorganic phosphate
liberated as ATP gets hydrolyzed by GroEL. Briefly, a solution of GroEL was incubated
with test compounds (8-point, 3-fold dilution series) and the assay initiated by addition of
ATP. After incubating for 45 minutes, the ATPase reaction was quenched by the addition
of EDTA. Malachite green was then added to the assay to bind and detect free
phosphates in solution, giving off a green colorimetric reaction (absorbance detection at
22
λ=600 nm). If analogues inhibited ATPase activity, then there would be no free
phosphates for malachite green to bind, leading to a yellow solution color (minimal
absorbance at 600 nm). The detailed procedure for this assay is presented in the
Experimental section. As indicated in Figure 12 (and IC50 results in Table 3A in the
Appendix), none of the analogues from either series inhibited the GroEL by blocking
ATP hydrolysis. Thus, I believe that these inhibitors bind to sites outside of the ATP
pockets. The Johnson lab is currently pursuing studies to identify these unknown binding
sites, which will be reported on in the future. While these results alleviate concerns about
non-selectively targeting other ATP-dependent proteins (at least as competitive ATP
inhibitors), I further assessed for off-target effects through a more definitive approach of
evaluating for cytotoxicity of analogues to human cells, as discussed further below.
Figure 12 – GroEL/ES-dMDH refolding vs. ATPase inhibition Correlation plot demonstrates that none of the GroEL/ES inhibitors (hydroxyquinolines or nitrofurans) inhibit the ability of GroEL to hydrolyze ATP.
23
Evaluating the effects of the E. coli NfsB type-1 nitroreductase on the ability of
test compounds to inhibit GroEL/ES
While in the previous section I discussed how the hydroxyquinolines were shown
to be potent GroEL/ES inhibitors, whereas nitrofurans were not, this interpretation is
complicated by the fact that nitrofuran-based compounds act as prodrugs in vivo – they
require metabolism by bacterial nitroreductases to generate reactive metabolites that are
associated with their antibacterial effects.38 Because the standard GroEL/ES-mediated
refolding assays and native substrate reporter counter-screens were conducted without
nitroreductases present, the nitrofuran analogues were not undergoing bioactivation
during these tests. This emphasized the need to re-examine analogues in modified
refolding and native assays that included a nitroreductase enzyme to activate the
nitrofuran analogs in situ.
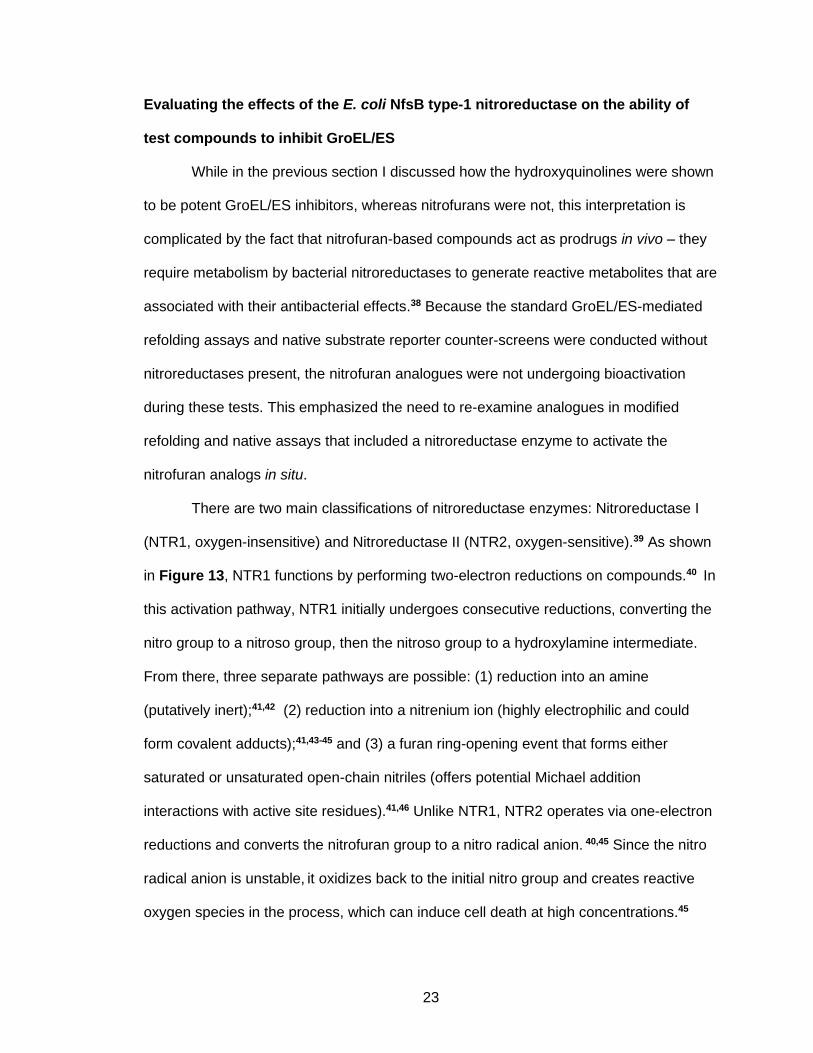
There are two main classifications of nitroreductase enzymes: Nitroreductase I
(NTR1, oxygen-insensitive) and Nitroreductase II (NTR2, oxygen-sensitive).39 As shown
in Figure 13, NTR1 functions by performing two-electron reductions on compounds.40 In
this activation pathway, NTR1 initially undergoes consecutive reductions, converting the
nitro group to a nitroso group, then the nitroso group to a hydroxylamine intermediate.
From there, three separate pathways are possible: (1) reduction into an amine
(putatively inert);41,42 (2) reduction into a nitrenium ion (highly electrophilic and could
form covalent adducts);41,43-45 and (3) a furan ring-opening event that forms either
saturated or unsaturated open-chain nitriles (offers potential Michael addition
interactions with active site residues).41,46 Unlike NTR1, NTR2 operates via one-electron
reductions and converts the nitrofuran group to a nitro radical anion. 40,45 Since the nitro
radical anion is unstable, it oxidizes back to the initial nitro group and creates reactive
oxygen species in the process, which can induce cell death at high concentrations.45
24
Figure 13 – NTR1 and NTR2 bioactivation pathways This is a diagram laying out the various pathways of nitrofuran activation that can take place under the influence of NTR1 and NTR2. NTR1 operates via 2-electron reductions, which leads to a hydroxylamine intermediate. From there, three pathways can take place: (1) further reduction to a potentially inert amine; (2) formation of an electrophilic nitrenium ion, which could possibly bind guanine bases in bacterial DNA; (3) nitrofuran ring-opening event that might prompt covalent modification of enzyme active site residues. NTR2 operates via 1-electron reductions. Because the initial reduction leads to an unstable nitro radical anion, it is quickly converted back to the nitro group. In the presence of oxygen, this conversion enables the transfer of a free radical to the oxygen molecule. This generates superoxide, which is a precursor to ROS generation.
The question then became whether to use NTR1 or NTR2 in the modified
GroEL/ES refolding and native assays. Because NTR2 is pertinent to bicyclic/polycyclic
nitro drug activation and NTR1 is pertinent to monocyclic nitro drug activation (as seen in
the nitrofuran analogues), NTR1 was selected.47 As an initial test to see whether or not
the activated nitrofuran metabolites would be more potent GroEL/ES inhibitors, we
purchased the E. coli NfsB type 1 nitroreductase (Sigma #N9284) and modified the
standard GroEL/ES-dMDH refolding and native MDH counter-screens to generate the
reactive metabolites in situ. Detailed protocols for these experiments are presented in
the Experimental section, with IC50 results presented in Table 4A in the Appendix, and
graphically shown in Figure 14. It was exciting to see that in the presence of NfsB, the
nitrofuran analogues exhibited dramatically increased inhibition of GroEL/ES refolding
25
functions. Since the IC50 values for the hydroxyquinoline (1-15) and other analogs
without any nitro groups (e.g. 29-42) were nearly identical in the presence and absence
of NfsB, this supports that increased inhibition was dependent on the nitrofuran moiety
and not other effects from the overall compound scaffold or NfsB itself. Furthermore,
that the activated nitrofurans were still inactive in the native MDH reporter counter-
screen indicates that the increased inhibitor effects were obtained through selectively
targeting GroEL/ES in the refolding assay. While the degree of potency shift varied
between the various analogues, eleven shifted to IC50 values of less than or equal to 10
μM. As a point of comparison, the most potent nitrofuran analogue in the absence of
NfsB had an IC50=20 μM, with three being completely inactive (IC50 >100 μM). Significant
potency shifts were observed for the most effective antibacterials (16-20). This shows
that some of the strongest antibacterial compounds were also strong GroEL/ES
inhibitors when exposed to a compatible nitroreductase enzyme. While activated
nifuroxazide and nitrofurantoin were only moderate GroEL/ES inhibitors in this assay,
this is perhaps not surprising as they are reported in the literature to be preferentially
activated by the other E. coli type 1 nitroreductase, NfsA. As the different nitrofuran
analogs would be expected to exhibit varying SAR for activation by NfsA and NfsB, it will
be important to test inhibitors in the presence of both to gain a more complete picture of
how inhibitors could be function in bacteria. Because of the limitations of employing only
NfsB and evaluating such a small number of nitrofuran analogues, it is difficult to
ascertain correlations between the nitrofurans inhibiting in the in situ NfsB-GroEL/ES-
dMDH refolding assay and inhibition of bacterial growth (Figure 15A-C). My lab is now
in the process of cloning and expressing the E. coli NfsA and NfsB nitroreductase
variants and developing an expanded panel of nitrofuran-based analogs. Furthermore,
investigating the nitroreductases of the various ESKAPE bacteria could provide a
26
stronger rationale for why these compounds are largely inactive against the KAPE
Gram-negative strains. Associated findings will be reported in future works.
Figure 14 – Chaperone refolding and native MDH enzymatic activity with and without NfsB Correlation plots indicate GroEL/ES inhibition potency shifts in the presence of NfsB. Addition of NfsB causes only the nitrofuran analogues to gain in potency against GroEL/ES.
Figure 15 – GroEL/ES-dMDH refolding vs. bacterial growth inhibition Correlation plots to identify potential on-target effects targeting GroEL/ES in E. faecium (A), S. aureus (B), and E. coli (C). While increasing inhibition by the nitrofurans in the in situ NfsB-GroEL/ES-dMDH refolding assay may provide more effective inhibition of S. aureus growth (an potentially E. faecium), more thorough studies will need to be conducted, testing a larger number of nitrofuran analogs in the presence of both NfsA and NfsB, to gain a clearer picture of whether or not compounds may be functioning on-target against GroEL/ES in bacteria.
27
Evaluating analogues for cytotoxicity to human colon and small intestinal cells
While in previous studies, I (as well as previous members) have employed
counter-screening with the human HSP60/10 chaperonin system, accumulating results
continually reinforce that inhibiting HSP60/10 in vitro is a poor indicator of potential off-
target toxicity to human cells.28-32 This is highlighted by the fact that we have identified
many known drugs and natural products that are potent HSP60/10 inhibitors in vitro, a
primary example of which is suramin, which has been safely used for over 100 years as
a first-line treatment for Trypanosoma brucei infections.29,48 In addition, as now identified
in this study, bioactivation of nitrofuran analogues (and the drug, nifuroxazide) by
nitroreductase enzymes greatly increases the degree of inhibition against GroEL/ES
refolding activity. This further complicates testing against human HSP60/10, since
human cells do not contain nitroreductases. Therefore, I feel the most appropriate initial
assessment of potential in vivo toxicity is to test compounds for cytotoxicity to human
cells in cell culture. Thus, to screen for potential cytotoxic effects, analogues were tested
in two Alamar Blue-based cell viability assays using human FHC colon cells and FHs 74
Int small intestinal cells. Briefly, I first grew cells to ~90% confluency, then sub-cultured
1,500 cells per well in the absence of test compounds for 24 h. Test compounds were
then added and the cultures were incubated for an additional 48 h, whereupon the
Alamar Blue reporter reagents were added and well fluorescence was monitored over
time. Alamar Blue contains resazurin (non-fluorescent), which is reduced to resorufin
(highly fluorescent) in the presence of healthy, viable cells. A detailed protocol is
presented in the Experimental section, with cell cytotoxicity CC50 values presented in
Table 5A in the Appendix. As observed in Figure 16, lead nitrofuran inhibitors were able
to selectively kill E. faecium, S. aureus, and E. coli bacteria with low-to-no cytotoxicity to
human cells (representative results are shown for human FHC colon cells, but FHs 74
Int results are similar). Intriguingly, the nitrofuran analogues were typically less toxic than
28
their hydroxyquinoline counterparts, putatively because they would need to be
metabolized to their active intermediates, yet human cells do not harbor nitroreductases.
Figure 16 – FHC vs. FHS 74 Int cytotoxicity Correlation plots demonstrate differences between compound cytotoxicity to human FHC colon cells and inhibition of the proliferation of E. faecium (A), S. aureus (B), and E. coli (C). It is clear that nitrofuran analogues are selective for inhibiting bacteria over FHC colon cells (results for cytotoxicity to human FHs 74 Int small intestine cells are similar, with CC50 values reported in Table 5A in the Appendix).
Investigating the ability of E. coli to gain resistance to 17, nifuroxazide, and
nitrofurantoin
As I discovered several nitrofuran-based analogs that selectively inhibited the
growth of E. faecium, S. aureus, and E. coli with minimal toxicity to human cells, I next
wanted to explore how easy it would be for bacteria to generate resistance to a lead
candidate. I examined the ability of E. coli to generate resistance to 17 (with nifuroxazide
and nitrofurantoin as controls), since resistance to nitrofuran-based antibiotics has been
well-characterized in this bacterium. While 17, nifuroxazide, and nitrofurantoin were all
potent inhibitors of E. coli proliferation, 17 was the most potent at inhibiting GroEL/ES in
the presence of NfsB, and thus may exhibit greater on-target effects in bacteria.
However, there are limitations in the above experiments, as they do not employ the NfsA
nitroreductase. To determine if there might be any difference in the ability of E. coli to
generate resistance to these three compounds with such distinct bioactivity profiles, I
29
employed a 12 day resistance assay as was previously reported with the biphenylamide
compound 44 analogues.32 A detailed protocol of this assay is presented in the
Experimental section. Briefly, a dilute culture of E. coli (OD600=0.01) was grown in the
presence of inhibitors (tested in dose-response in duplicates) for 24 h, then EC50 results
were determined from the OD600 readings of the wells. Over the course of 12 days, I
sequentially sub-cultured bacteria from the respective wells with the highest
concentration of inhibitors where bacteria grew to an OD600 >0.2, monitoring for
increases in EC50 values over time.
As shown in Figure 17, nifuroxazide and nitrofurantoin were initially more potent
than 17, putatively owing to their preferential activation by NfsA. However, E. coli quickly
developed intermediate resistance (within 3-5 days) such that all three inhibitors were
nearly equipotent in the 20-40 μM range. Literature precedence shows that resistance to
nitrofuran antibiotics typically occurs first through mutations affecting NfsA.49 That EC50
values generally plateaued in the 20-40 μM range is consistent with previous reports that
NfsB is still able to metabolize the nitrofuran moieties, allowing them to maintain efficacy;
however it may further indicate that it is more difficult for bacteria to generate resistance
through mutating this second nitroreductase. Thus, inhibitors that are preferentially
activated by NfsB, as may be the case for 17, might be more effective drug candidates
with respect to combatting the emergence of drug resistant strains, although this
remains to be shown. I note, though, that EC50 values continued to slowly increase over
time for all three compounds, with a particular jump in resistance seen for replicate 2 of
nitrofurantoin.
30
Figure 17 – E. coli resistance generation against lead antibacterials Evaluating the ability of E. coli to generate resistance to nifuroxazide (A), nitrofurantoin (B), and compound 17 (C) over time. The time-course plots show the change in EC50 values for each compound over the 12-day serial passage resistance assay (compound tested in duplicates, as indicated by the white triangles and black diamonds).
I next confirmed that the resistance generated by the replicate E. coli strains was
irreversible (i.e. putatively through permanent mutations of NfsA and NfsB, as previously
reported) as opposed to transient means (i.e. by up-regulating efflux pumps). To
accomplish this, I sub-cultured single colonies obtained from the replicate samples
where the bacteria exhibited the greatest degree of resistance to test compounds (day
12 samples for all compound replicates, except replicate 2 for nitrofurantoin, which was
taken at day 10), for 4 x 12 h serial passages in fresh media without any test compounds
present. I then performed another 24 h follow-up proliferation assay to determine EC50
values. As seen in Figure 18, the bacterial strains were still resistant to each of the
respective inhibitors they were generated from, supporting that resistance was
permanent. Previous studies have extensively characterized mutations affecting NfsA
and NfsB that E. coli acquire to generate resistance mechanisms against nitrofuran
antibiotics, and thus genotyping was not performed to further characterize the specific
resistance mechanisms for these strains, as they are likely the same.49
31
Figure 18 – E. coli permanent resistance against lead antibacterials Dose-response curves for nifuroxazide (A), nitrofurantoin (B), and compound 17 (C) for susceptible parent E. coli (shown in blue), the maximally-resistant strains developed to the respective test compounds (shown in orange), and follow-up proliferation assays for resistant strains tested after 4 x 12 h serial passaging in the absence of test compounds to account for possible reversible inhibition mechanisms (shown in purple).
As nifuroxazide, nitrofurantoin, and 17 displayed different inhibition and
resistance profiles with one another, I was curious to determine if the respective
resistant strains were cross-resistant with each of the other inhibitors. Intriguingly, while
the replicate strains that were initially resistant to nifuroxazide were cross-resistant to
both nitrofurantoin and 17 (Figure 19A), the nitrofurantoin-resistant strains were still
sensitive to nifuroxazide and 17 (Figure 19B), and the 17-resistant strains were
susceptible to nifuroxazide, but not nitrofurantoin (Figure 19C). Thus, it is evident that
strains that have generated resistance to one analogue are not necessarily cross-
resistant to other analogues. Further studies are warranted to see if combination therapy
with 2 or more inhibitor analogues might be synergistic and prevent or prolong the
emergence of resistant strains.
32
Figure 19 – Evaluation of E. coli cross-resistance against lead antibacterials Evaluation of cross-resistance between the respective resistant E. coli strains with nifuroxazide, nitrofurantoin, and 17. The three panels show dose-response curves for the three inhibitors tested against strains where resistance was initially generated to nifuroxazide (A), nitrofurantoin (B), and 17 (C). Results indicate that resistance generated to one inhibitor is not necessarily cross-resistant to the other inhibitors, potentially indicating different mechanisms of activation and/or targets.
33
CONCLUSIONS
In a previous high-throughput screen, hit compound 1 was identified as a
moderate GroEL/ES inhibitor with weak activity against two Gram-negative bacteria, K.
pneumoniae and A. baumannii. The structure of this hit inhibitor resembles known
antibiotics nitroxoline (i.e. shared hydroxyquinoline moiety) and nifuroxazide /
nitrofurantoin (i.e. shared N-acyl hydrazone core). The main difference between 1 and
nifuroxazide and nitrofurantoin is that the latter two possess a nitrofuran in place of
hydroxyquinoline group. With the goal of increasing inhibitor potency against GroEL/ES
and E. coli and the ESKAPE bacteria, while reducing cytotoxicity to human cells, I
developed two primary series of hydroxyquinoline and nitrofuran-bearing analogues.
These analogues possessed R-groups on the distal ends of the scaffolds of varying
sizes and chemical compositions to identify SAR profiles.
Results from bacterial proliferation testing demonstrated that the nitrofurans with
small R-groups (16-20) were potent inhibitors of E. faecium, S. aureus, and E. coli (with
maximum efficacy against E. coli). Initially, only the hydroxyquinolines were found to be
potent GroEL/ES inhibitors in traditional GroEL/ES-mediated substrate refolding assays,
whereas nitrofurans were only weak-to-moderate inhibitors. However, subsequent
testing in the presence of the E. coli NfsB nitroreductase indicated that the nitrofurans
act as prodrugs and their reactive metabolites can be potent GroEL/ES inhibitors. Lead
nitrofuran antibacterial analogs also exhibited minimal cytotoxicity to human FHC colon
and FHs 74 Int small intestinal cells. When evaluating E. coli resistance generation
against lead antibacterials (17, nifuroxazide, and nitrofurantoin), it was evident that all
three compounds experienced resistance, albeit to varying degrees. Nifuroxazide and
nitrofurantoin were shown to be most effective initially, however, they were found to
generate resistance in E. coli more rapidly than compound 17 did. This could potentially
be attributed to the two drugs being more reliant on NfsA for bioactivation than 17 (as
34
previous literature has pointed to NfsA mutations being a primary cause of early
nitrofuran drug resistance), or because 17 is a more potent inhibitor of GroEL/ES.
Resistance to each compound was revealed to be permanent in nature, as opposed to
transient (i.e. up-regulation of efflux pumps). Upon further examination, strains that were
able to generate resistance against one of the lead antibacterials were not necessarily
cross-resistant to the other inhibitors, which could indicate diverging mechanisms of
activation and/or targets. This may indicate that combination therapy with structurally
distinct analogs could prove synergistic and delay the onset of bacterial resistance.
35
EXPERIMENTAL
General synthetic methods
Unless otherwise stated, all chemicals were purchased from commercial
suppliers and used without further purification. Reaction progress was monitored by
thin-layer chromatography on silica gel 60 F254 coated glass plates (EM Sciences).
Flash chromatography was performed using a Biotage Isolera One flash
chromatography system and eluting through Biotage KP-Sil Zip or Snap silica gel
columns for normal-phase separations (hexanes:EtOAc gradients), or Snap KP-C18-HS
columns for reverse-phase separations (H2O:MeOH gradients). Reverse-phase high-
performance liquid chromatography (RP-HPLC) was performed using a Waters 1525
binary pump, 2489 tunable UV/Vis detector (254 and 280 nm detection), and 2707
autosampler. For preparatory HPLC purification, samples were chromatographically
separated using a Waters XSelect CSH C18 OBD prep column (part number
186005422, 130 Å pore size, 5 µm particle size, 19x150 mm), eluting with a H2O:CH3CN
gradient solvent system. Linear gradients were run from either 100:0, 80:20, or 60:40
A:B to 0:100 A:B (A = 95:5 H2O:CH3CN, 0.05% TFA; B = 5:95 H2O:CH3CN, 0.05% TFA.
Products from normal-phase separations were concentrated directly, and reverse-phase
separations were concentrated, diluted with H2O, frozen, and lyophilized. For primary
compound purity analyses (HPLC-1), samples were chromatographically separated
using a Waters XSelect CSH C18 column (part number 186005282, 130 Å pore size, 5
µm particle size, 3.0x150 mm), eluting with the above H2O:CH3CN gradient solvent
systems. For secondary purity analyses (HPLC-2) of final test compounds, samples
were chromatographically separated using a Waters XBridge C18 column (part number
186003132, 130 Å pore size, 5.0 µm particle size, 3.0x100 mm), eluting with a
H2O:MeOH gradient solvent system. Linear gradients were run from either 100:0, 80:20,
60:40, or 20:80 A:B to 0:100 A:B (A = 95:5 H2O:MeOH, 0.05% TFA; B = 5:95
36
H2O:MeOH, 0.05% TFA). Test compounds were found to be >95% in purity from both
RP-HPLC analyses. Mass spectrometry data were collected using either Agilent LC
1200-MS 6130 or Agilent LC 1290-MS 6545 Q-TOF analytical LC-MS instruments at the
IU Chemical Genomics Core Facility (CGCF). 1H-NMR spectra were recorded on a
Bruker 300 MHz spectrometer at the IU CGCF. Chemical shifts are reported in parts per
million and calibrated to the d6-DMSO solvent peaks at 2.50 ppm.
values for the test compounds were obtained by plotting the % resazurin reduction
results in GraphPad Prism and analyzing by non-linear regression using the log(inhibitor)
vs. response (variable slope) equation. Results presented represent the averages of
CC50 values obtained from at least four replicates for each of the FHC and FHs 74 Int
cell lines.
Evaluation of E. coli resistance generation against lead inhibitors
To identify potential resistance toward 17, nifuroxazide, and nitrofurantoin, a
liquid culture, 12-day serial passage assay was employed (each compound was tested
in duplicate). NEB 5-alpha E. coli bacteria were streaked onto an LB agar plate and
grown overnight at 37°C. Two fresh aliquots of LB media (supplemented with 25 mg/L
Ca2+ and 12.5 mg/L Mg2+) were inoculated with separate bacterial colonies and the
cultures were grown overnight at 37°C, with shaking (240 rpm). The overnight cultures
were then sub-cultured (10x dilution) into fresh media solutions and grown at 37°C to
mid-log phase, then diluted into fresh media to achieve two separate cultures with final
OD600 readings of 0.01. Aliquots of the diluted cultures (200 µL) were dispensed into a
clear, 96-well polystyrene plate (one culture was used for replicate 1 for each compound,
and the other culture was used for replicate 2 for each compound), followed by the
addition of 2 µL of nifuroxazide, nitrofurantoin, and compound 17 in DMSO. Test
compounds were evaluated in duplicate with concentration ranges during the resistance
assay from 100 µM to 48.8 nM, 2-fold dilution series. Plates were sealed with "Breathe
63
Easy" oxygen permeable membranes (Diversified Biotech) and left to incubate at 37°C
without shaking (stagnant assay). OD600 readings were taken at the 24 h time point to
monitor for bacterial growth. A second baseline control plate was prepared analogously,
without any bacteria added, to correct for possible compound absorbance and/or
precipitation. For inoculations on subsequent days, bacteria from the wells with the
highest test compound concentration where the OD600 was >0.2, were sub-cultured in 5
mL of fresh media at 37°C until mid-log phase growth was reached. Separate cultures
were maintained from this point forward for each of the compound replicates – i.e. 6
cultures continually propagated. The bacteria were then diluted into fresh media to
OD600 of 0.01 and the bacteria were propagated again as described above. This
procedure was repeated each day, for a total of 12 days, to observe changes in inhibitor
EC50 values over each passage (aliquots of each of these daily cultures were flash
frozen in liquid nitrogen and stored at -80°C for future use). Inhibitor EC50 values were
obtained by plotting the OD600 results from each passage in GraphPad Prism and
analyzing by non-linear regression using the log(inhibitor) vs. response (variable slope)
equation.
Control compounds, calculation of IC50 / EC50 / CC50 values, and statistical
considerations
For all assays, DMSO was used as negative control and a panel of previously
discovered and reported chaperonin inhibitors were used as positive controls: e.g.
compounds 8, 9, and 18 from Johnson et. al 2014 and Abdeen et. al 2016;28,33 suramin
and compound 2h-p from Abdeen et. al 2016;28 compounds 20R, 20L, and 28R from
Abdeen et. al 2018;31 and closantel and rafoxanide from Kunkle et. al 2018.32 Bacterial
proliferation assays also included antibiotic controls such as vancomycin, daptomycin,
and rifampicin. All IC50 / EC50 / CC50 results reported are averages of values determined
64
from individual dose-response curves in assay replicates as follows: 1) individual
I/E/CC50 values from assay replicates were first log-transformed and the average
log(I/E/CC50) values and standard deviations (SD) calculated; 2) replicate log(I/E/CC50)
values were evaluated for outliers using the ROUT method in GraphPad Prism (Q of
10%); and 3) average I/E/CC50 values were then back-calculated from the average
log(I/E/CC50) values. For compounds where log(I/E/CC50) values were greater than the
maximum compound concentrations tested (i.e. >1.75, >1.80, >1.92, >2.00, and >2.40 –
or >56, >63, >83, >100, and >250 µM, respectively), results were represented as 0.1 log
units higher than the maximum concentrations tested (i.e. 1.85, 1.90, 2.02, 2.10, and
2.50 – or 71, 79, 105, 126, and 316 µM, respectively) so as not to overly bias results
because of the unavailability of definitive values for inactive compounds.
65
APPENDIX - SUPPLEMENTAL TABLES
Table 2A - Bacterial proliferation EC50 (µM) Compilation of EC50 results for compounds tested in the various bacterial proliferation assays.
66
67
68
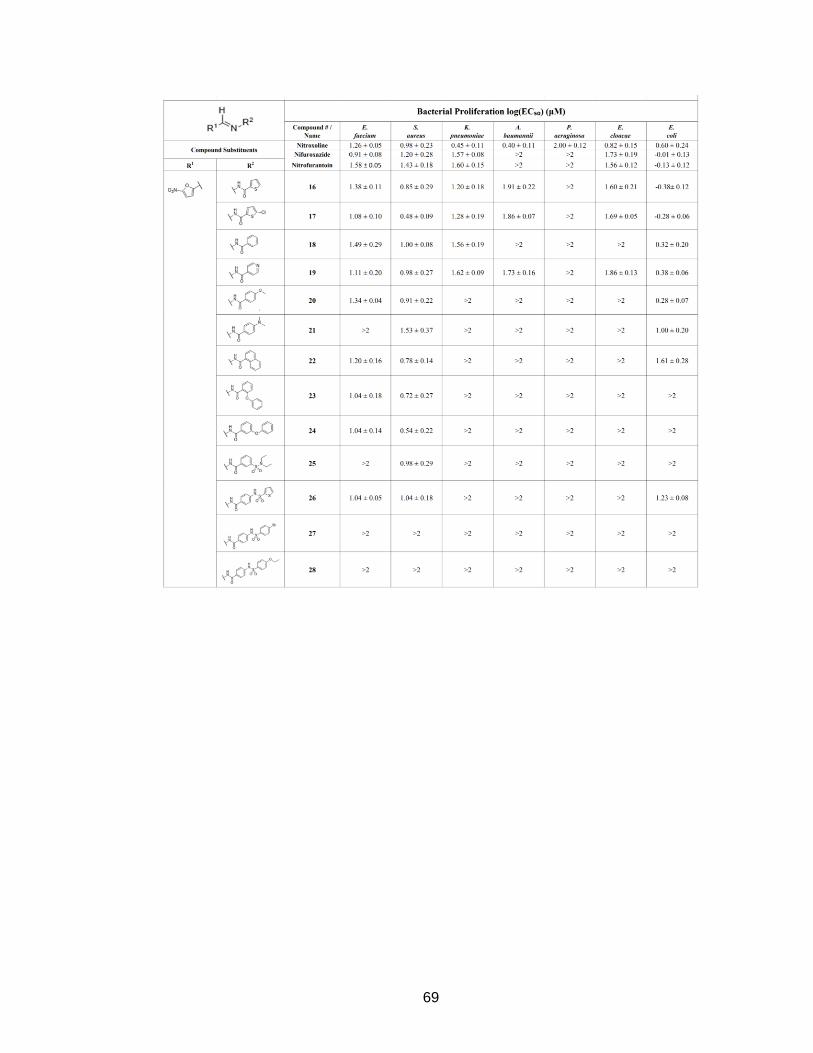
Table 2B - Bacterial proliferation log(EC50) (µM) Compilation of log(EC50) results and standard deviations for compounds tested in the various bacterial proliferation assays.
69
70
71
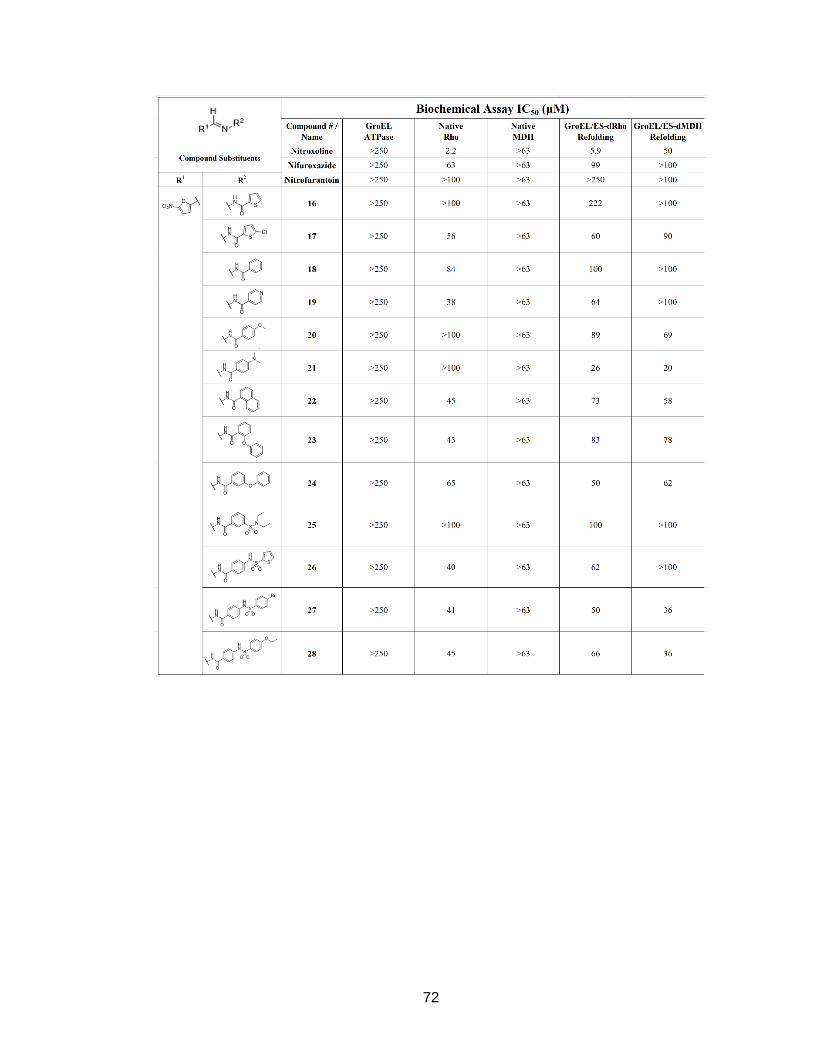
Table 3A - Biochemical assay IC50 (µM) Compilation of IC50 results for compounds tested in the GroEL/ES-mediated dMDH and dRho refolding assays, native MDH and Rho reporter counter-screens, and GroEL-mediated ATPase assay.
72
73
74
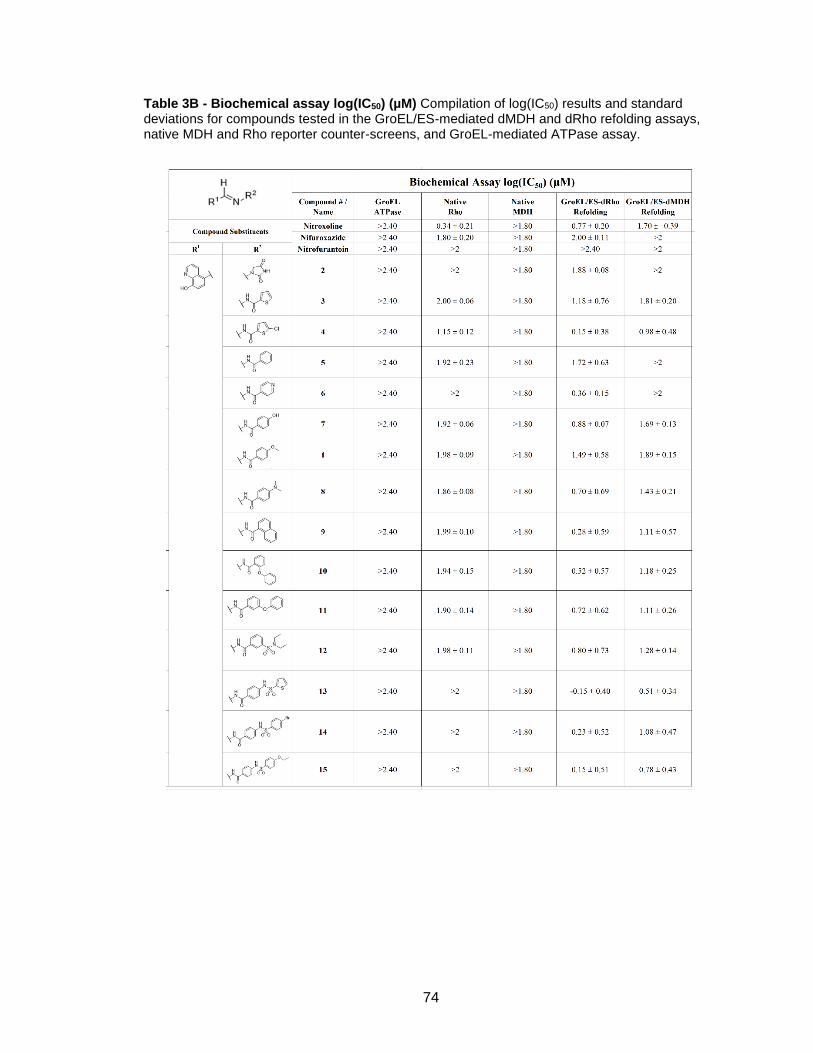
Table 3B - Biochemical assay log(IC50) (µM) Compilation of log(IC50) results and standard deviations for compounds tested in the GroEL/ES-mediated dMDH and dRho refolding assays, native MDH and Rho reporter counter-screens, and GroEL-mediated ATPase assay.
75
76
77
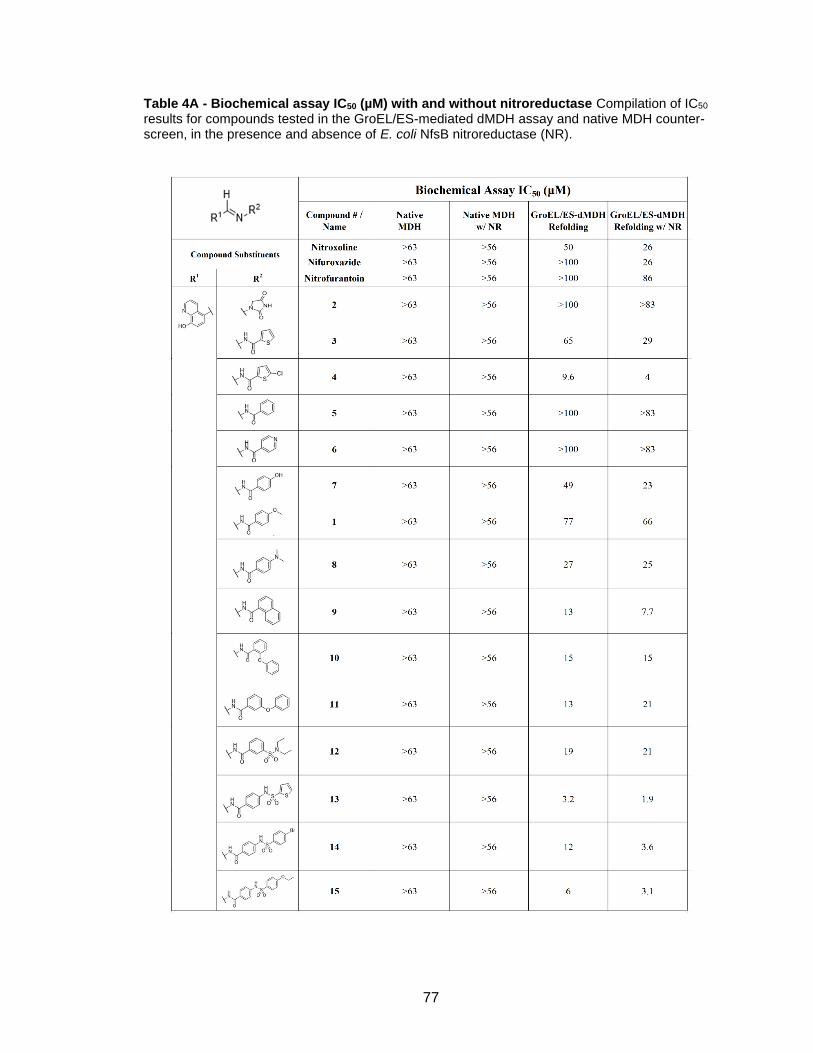
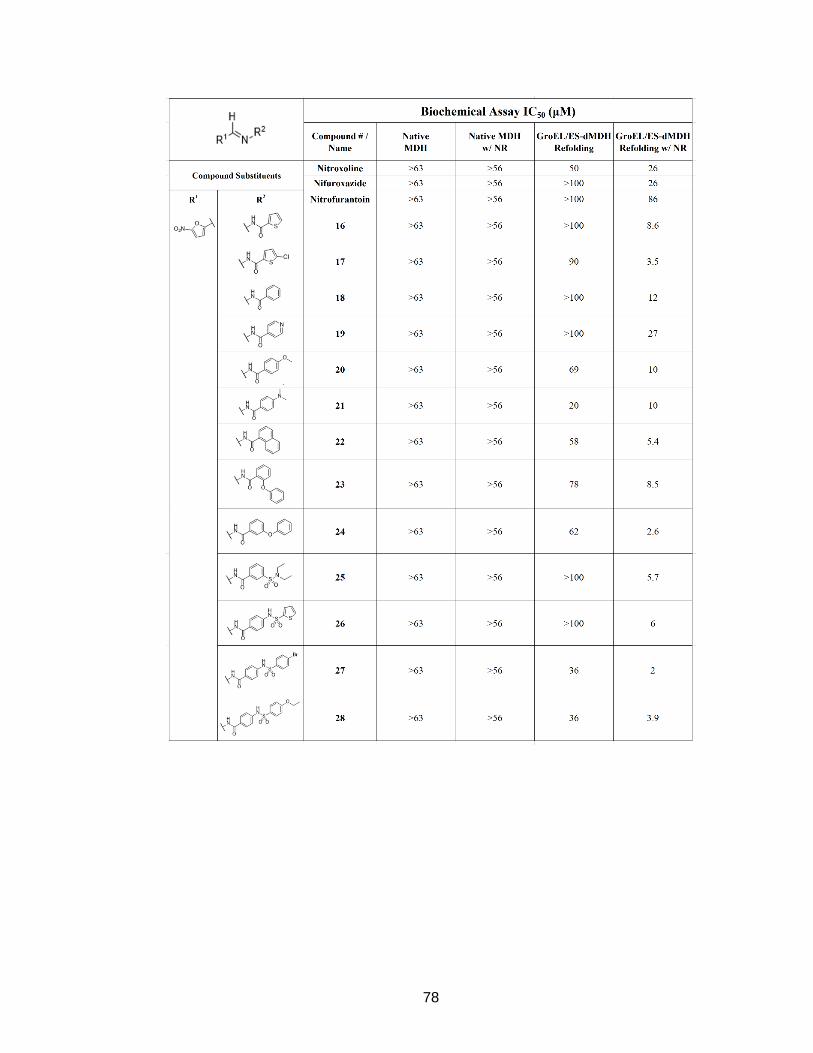
Table 4A - Biochemical assay IC50 (µM) with and without nitroreductase Compilation of IC50 results for compounds tested in the GroEL/ES-mediated dMDH assay and native MDH counter-screen, in the presence and absence of E. coli NfsB nitroreductase (NR).
78
79
80
Table 4B - Biochemical assay log(IC50) (µM) with and without nitroreductase Compilation of log(IC50) results and standard deviations for compounds tested in the GroEL/ES-mediated dMDH assay and native MDH counter-screen, in the presence and absence of E. coli NfsB nitroreductase (NR).
81
82
83
Table 5A - Human cell viability CC50 (µM) Compilation of CC50 results for compounds tested in the human FHC colon and FHs 74 Int intestine cell viability assays.
84
85
86
Table 5B - Human cell viability log(CC50) (µM) Compilation of log(CC50) results and standard deviations for compounds tested in the human FHC colon and FHs 74 Int intestine cell viability assays.
87
88
89
REFERENCES
1. Centers for Disease Control and Prevention. Antibiotic resistance threats in the
United States, 2019. Centers for Disease Control and Prevention: Atlanta, Georgia,
USA, 2019; p. 65-100.
2. Adedeji, W. A., The Treasure Called Antibiotics. Ann Ib Postgrad Med 2016, 14 (2), 56-57.
3. Centers for Disease Control and Prevention. Shiga Toxin-producing Escherichia coli (STEC) 2018 Case Definition. Centers for Disease Control and Prevention: Atlanta, Georgia, USA, 2018.
4. Mead, P.S.; Slutsker, L.; Dietz, V.; McCaig, L.F.; Bresee, J.S.; Shapiro, C.; Griffin, P.M.; Tauxe, R.V., Food-related illness and death in the United States. Emerg Infect Dis 1999, 5 (5), 607-25.
5. National World War II Museum. Fact Sheet: The Challenge of Mass Production Discovery. National World War II Museum: New Orleans, Louisiana, USA, 2017.
6. Davies, J.; Davies, D., Origins and evolution of antibiotic resistance. Microbiol Mol Biol Rev 2010, 74 (3), 417-33.
7. Chopra, I.; Roberts, M., Tetracycline antibiotics: mode of action, applications, molecular biology, and epidemiology of bacterial resistance. Microbiol Mol Biol Rev 2001, 65 (2), 232-60 ; second page, table of contents.
8. Leclercq, R.; Courvalin, P., Resistance to macrolides and related antibiotics in Streptococcus pneumoniae. Antimicrob Agents Chemother 2002, 46 (9), 2727-34.
9. Dalhoff, A., Global fluoroquinolone resistance epidemiology and implications for clinical use. Interdiscip Perspect Infect Dis 2012, 2012, 976273.
10. Doctor Alerts. Tetracyclines (Broad Spectrum Antibiotics): Classification, Uses, and Side Effects. Doctor Alerts: 2017.
11. The Community College of Baltimore County. Blocking Translation During Bacterial Protein Synthesis. The Community College of Baltimore County: Catonsville, Maryland, USA.
12. Verchere, A; Picard, M.; Broutin, I., Functional investigation of the efflux pump MexA-MexB-OprM of Pseudomonas aeruginosa. Biophys J 2013, 104 (2), 286a.
13. Santajit, S.; Indrawattana, N., Mechanisms of Antimicrobial Resistance in ESKAPE Pathogens. Biomed Res Int 2016, 2016, 2475067.
14. Munita, J. M.; Arias, C. A., Mechanisms of Antibiotic Resistance. Microbiol Spectr 2016, 4 (2).
15. Triboulet, S.; Dubee, V.; Lecoq, L.; Bougault, C.; Mainardi, J. L.; Rice, L. B.; Etheve-Quelquejeu, M.; Gutmann, L.; Marie, A.; Dubost, L.; Hugonnet, J. E.; Simorre, J. P.; Arthur, M., Kinetic features of L,D-transpeptidase inactivation critical for beta-lactam antibacterial activity. PLoS One 2013, 8 (7), e67831.
16. Macheboeuf, P.; Contreras-Martel, C.; Job, V.; Dideberg, O.; Dessen, A., Penicillin binding proteins: key players in bacterial cell cycle and drug resistance processes. FEMS Microbiol Rev 2006, 30 (5), 673-91.
17. Lavollay, M.; Arthur, M.; Fourgeaud, M.; Dubost, L.; Marie, A.; Veziris, N.; Blanot, D.; Gutmann, L.; Mainardi, J. L., The peptidoglycan of stationary-phase Mycobacterium tuberculosis predominantly contains cross-links generated by L,D-transpeptidation. J Bacteriol 2008, 190 (12), 4360-6.
18. Brandeis University. Breaking Research: A method by which invading bacteria avoid detection could also be our key to defeating them. Brandeis University: Waltham, Massachusetts, USA, 2014.
19. Salton, M.R.J.; Kim, K.S., Structure. In Medical Microbiology, th; Baron, S., Eds. Galveston (TX), 1996.
90
20. Adams, P. G.; Lamoureux, L.; Swingle, K. L.; Mukundan, H.; Montano, G. A., Lipopolysaccharide-induced dynamic lipid membrane reorganization: tubules, perforations, and stacks. Biophys J 2014, 106 (11), 2395-407.
21. Ventola, C. L., The antibiotic resistance crisis: part 1: causes and threats. P T 2015, 40 (4), 277-83.
22. Horwich, A. L.; Weber-Ban, E. U.; Finley, D., Chaperone rings in protein folding and degradation. Proc Natl Acad Sci U S A 1999, 96 (20), 11033-40.
23. Georgescauld, F.; Popova, K.; Gupta, A. J.; Bracher, A.; Engen, J. R.; Hayer-Hartl, M.; Hartl, F. U., GroEL/ES chaperonin modulates the mechanism and accelerates the rate of TIM-barrel domain folding. Cell 2014, 157 (4), 922-934.
24. Parsons, L. M.; Limberger, R. J.; Shayegani, M., Alterations in levels of DnaK and GroEL result in diminished survival and adherence of stressed Haemophilus ducreyi. Infect Immun 1997, 65 (6), 2413-9.
25. Techtmann, S.M.; Robb, F.T., Archael-like chaperonins in bacteria. Proc Natl Acad Sci U S A 2010, 107 (47), 20269-74.
26. Marchenkov, V.V.; Semisotnov, G.V., GroEL-assisted protein folding: does it occur within the chaperonin inner cavity? Int J Mol Sci 2009, 10 (5), 2066-83.
27. Max Planck Society. Mechanism of the E. coli Chaperonin System, GroEL-GroES. Max Planck Institute of Biochemistry: Martinsried, Germany, USA.
29. Stevens, M.; Abdeen, S.; Salim, N.; Ray, A. M.; Washburn, A.; Chitre, S.; Sivinski, J.; Park, Y.; Hoang, Q. Q.; Chapman, E.; Johnson, S. M., HSP60/10 chaperonin systems are inhibited by a variety of approved drugs, natural products, and known bioactive molecules. Bioorg Med Chem Lett 2019, 29 (9), 1106-1112.
30. Washburn, A.; Abdeen, S.; Ovechkina, Y.; Ray, A.M.; Stevens, M.; Chitre, S.; Sivinski, J.; Park, Y.; Johnson, J.; Hoang, Q.Q.; Chapman, E.; Parish, T.; Johnson, S.M., Dual-targeting GroEL/ES chaperonin and protein tyrosine phosphatase B (PtpB) inhibitors: A polypharmacology strategy for treating Mycobacterium tuberculosis infections. Bioorg Med Chem Lett 2019, 29 (13), 1665-1672.
31. Abdeen, S.; Kunkle, T.; Salim, N.; Ray, A.M.; Mammadova, N.; Summers, C.; Stevens, M.; Ambrose, A.J.; Park, Y.; Schultz, P.G.; Horwich, A.L.; Hoang, Q.Q.; Chapman, E.; Johnson, S.M., Sulfonamido-2-arylbenzoxazole GroEL/ES Inhibitors as Potent Antibacterials against Methicillin-Resistant Staphylococcus aureus (MRSA). J Med Chem 2018, 61 (16), 7345-7357.
32. Kunkle, T.; Abdeen, S.; Salim, N.; Ray, A.M.; Stevens, M.; Ambrose, A.J.; Victorino, J.; Park, Y.; Hoang, Q.Q.; Chapman, E.; Johnson, S.M., Hydroxybiophenylamide GroEL/ES Inhibitors Are Potent Antibacterials against Planktonic and Biofilm Forms of Staphylococcus aureus. J Med Chem 2018, 61 (23), 10651-10664.
33. Johnson, S. M.; Sharif, O.; Mak, P. A.; Wang, H. T.; Engels, I. H.; Brinker, A.; Schultz, P. G.; Horwich, A. L.; Chapman, E., A biochemical screen for GroEL/GroES inhibitors. Bioorg Med Chem Lett 2014, 24 (3), 786-9.
34. Abouelhassan, Y.; Yang, Q.; Yousaf, H.; Nguyen, M. T.; Rolfe, M.; Schultz, G. S.; Huigens, R. W., 3rd, Nitroxoline: a broad-spectrum biofilm-eradicating agent against pathogenic bacteria. Int J Antimicrob Agents 2017, 49 (2), 247-251.
35. Jawetz, E.; Hopper, J., Jr.; Smith, D. R., Nitrofurantoin in chronic urinary tract infection. AMA Arch Intern Med 1957, 100 (4), 549-57.
91
36. Lopes, A.B.; Miguez, E.; Kummerle, A.E.; Rumjanek, V.M.; Fraga, C.A.; Barreiro, E.J., Characterization of amide bond conformers for a novel heterocyclic template of N-acylhydrazone derivatives. Molecules 2013, 18 (10), 11683-704.
37. Miethke, M.; Marahiel, M. A., Siderophore-based iron acquisition and pathogen control. Microbiol Mol Biol Rev 2007, 71 (3), 413-51.
38. Roldan, M. D.; Perez-Reinado, E.; Castillo, F.; Moreno-Vivian, C., Reduction of polynitroaromatic compounds: the bacterial nitroreductases. FEMS Microbiol Rev 2008, 32 (3), 474-500.
39. Hall, B. S.; Wu, X.; Hu, L.; Wilkinson, S. R., Exploiting the drug-activating properties of a novel trypanosomal nitroreductase. Antimicrob Agents Chemother 2010, 54 (3), 1193-9.
40. Spain, J. C., Biodegradation of nitroaromatic compounds. Annu Rev Microbiol 1995, 49, 523-55.
41. Hall, B. S.; Bot, C.; Wilkinson, S. R., Nifurtimox activation by trypanosomal type I nitroreductases generates cytotoxic nitrile metabolites. J Biol Chem 2011, 286 (15), 13088-95.
42. Martin, J., Role of the GroEL chaperonin intermediate domain in coupling ATP hydrolysis to polypeptide release. J Biol Chem 1998, 273 (13), 7351-7.
43. Skipper, P.L.; Kim, M.Y.; Sun, H.L.P.; Wogan, G.N.; Tannenbaum, S.R., Monocyclic aromatic amines as potential human carcinogens: old is new again. Carcinogenesis 2010, 31 (1), 50-8.
44. Streeter, A. J.; Hoener, B. A., Evidence for the involvement of a nitrenium ion in the covalent binding of nitrofurazone to DNA. Pharm Res 1988, 5 (7), 434-6.
45. Patterson, S.; Wyllie, S., Nitro drugs for the treatment of trypanosomatid diseases: past, present, and future prospects. Trends Parasitol 2014, 30 (6), 289-98.
46. Wyllie, S.; Roberts, A. J.; Norval, S.; Patterson, S.; Foth, B. J.; Berriman, M.; Read, K. D.; Fairlamb, A. H., Activation of Bicyclic Nitro-drugs by a Novel Nitroreductase (NTR2) in Leishmania. PLoS Pathog 2016, 12 (11), e1005971.
47. Race, P. R.; Lovering, A. L.; Green, R. M.; Ossor, A.; White, S. A.; Searle, P. F.; Wrighton, C. J.; Hyde, E. I., Structural and mechanistic studies of Escherichia coli nitroreductase with the antibiotic nitrofurazone. Reversed binding orientations in different redox states of the enzyme. J Biol Chem 2005, 280 (14), 13256-64.
48. Abdeen, S.; Salim, N.; Mammadova, N.; Summers, C.M.; Goldsmith-Pestana, K.; McMahon-Pratt, D.; Schultz, P.G.; Horwich, A.L.; Chapman, E.; Johnson, S.M., Targeting the HSP60/10 chaperonin systems of Trypanasoma brucei as a strategy for treating African sleeping sickness. Bioorg Med Chem Lett 2016, 26 (21), 5247-5253.
49. Whiteway, J.; Koziarz, P.; Veall, J.; Sandhu, N.; Kumar, P.; Hoecher, B.; Lambert, I. B., Oxygen-insensitive nitroreductases: analysis of the roles of nfsA and nfsB in development of resistance to 5-nitrofuran derivatives in Escherichia coli. J Bacteriol 1998, 180 (21), 5529-39.
50. Kim, S.; Lieberman, T. D.; Kishony, R., Alternating antibiotic treatments constrain evolutionary paths to multidrug resistance. Proc Natl Acad Sci U S A 2014, 111 (40), 14494-9.
51. Fleeman, R.; LaVoi, T. M.; Santos, R. G.; Morales, A.; Nefzi, A.; Welmaker, G. S.; Medina-Franco, J. L.; Giulianotti, M. A.; Houghten, R. A.; Shaw, L. N., Combinatorial Libraries As a Tool for the Discovery of Novel, Broad-Spectrum Antibacterial Agents Targeting the ESKAPE Pathogens. J Med Chem 2015, 58 (8), 3340-55.
CURRICULUM VITAE
Christopher Ryan Howe
Education:
2018-2020 – Indiana University, Indianapolis, Indiana, USA.
• Completed MS. degree through the Department of Biochemistry and Molecular Biology
• Thesis: Analogues of Nitrofuran Antibiotics are Potent GroEL/ES Pro-Drug Inhibitors with Efficacy Against Enterococcus faecium, Staphylococcus aureus, and Escherichia coli
2014-2018 – Purdue University, West Lafayette, Indiana, USA.
• Completed BS. degree in Chemistry (ACS) with Biochemistry minor, Honors distinction
Positions and Employment:
Indiana University School of Medicine, Department of Biochemistry and Molecular Biology, Indianapolis, Indiana, USA:
2018(October)-2020(February): Graduate Research Student
• Developing potential pharmacological antibiotics against the resistant ESKAPE and E. coli pathogens, with joint activity against the bacterial GroEL/ES chaperone complex
Elanco Animal Health/Lilly, Quality Control and TS-MS, Clinton, Indiana, USA:
2018(May)-2018(August): Chemist Intern
• Method development for extracting lipid components from API-containing bacteria (fermentation samples), purifying the lipids, converting them to forms suitable for GC analysis, and adjusting GC run conditions to maximize peak resolution
• Quantitation of excess lipids fed into fermenters during a given fermentation lifecycle, using this method
Mead Johnson Nutrition, Quality Control, Evansville, Indiana, USA:
2017(May)-2017(August): Quality Control Intern
• Validation and improvement on an ELISA method used to quantitate allergens in infant formula production samples
Purdue University-Low Laboratory, Drug Discovery, West Lafayette, Indiana, USA:
2016(January)-2018(May): Undergraduate Researcher
• Developing peptide-drug conjugates (using both solid- and solution-phase methods) to target the folate receptor in various forms of cancer
• Characterized developed compounds
Honors and Activities:
• Alex and Besie Oblad Academic Scholar, Purdue University
• John Leighty Academic Scholar, Purdue University
• Phi Theta Tau Hammer and Tongs Scholar, Purdue University
• Alpha Lambda Delta/Phi Eta Sigma Honor Society, Purdue Chapter
• Zeta Beta Tau fraternity, Purdue Chapter
• Independent Calculus Tutor
Research Presentations:
• Elanco Animal Health Intern Presentation, Greenfield, Indiana: PowerPoint presentation of method development summer project
• Mead Johnson Nutrition, Evansville, Indiana: PowerPoint presentation of method validation for ELISA method
Technical Skills:
• FPLC with anion exchange, cation exchange, nickel-chelation, and size exclusion columns
• ELISA assays
• Gas chromatography
• High-pressure liquid chromatography
• IR spectroscopy
• Liquid chromatography mass spectrometry
• Protein expression and purification
• SDS-PAGE
• Solid-phase synthesis
• Solution-phase synthesis
• Tissue culture
• Thin-layer chromatography
• Ultra-performance liquid chromatography
Software Knowledge:
• Auto-Dock molecular docking
• BLAST
• ChemDraw
• Discovery Studio Visualizer
• Empower
• GraphPad Prism
• MS Office- Microsoft Word, Excel, PowerPoint, Publisher