2 ( 1 Attributing deuteranopia to a missing photopigment has been much more controversial over the years than the same explanation for protanopia. For excellent modern discussions of the color theory applied to the color defective, see M. J. Alpern, J. Mindel, and S. Torii, "Are there two types of deuteranopes?" J. Physiol. Lond., 199, 443-456 (1968); L. M. Hurvich, "Color vision deficiencies," in Handbook of Sensory Physiology Vol. VII/4 Visual Psychophysics, edited by D. Jameson and L. M. Hurvich (Springer-Verlag, Berlin, 1972), 582-624; and M. Alpern and T. Wake, "Cone pigments in human deutan colouT vision defects," J. Physiol. Lond:, 266, 595-612 (1977). 21 An excellent review of this proposition is available in J. Pokorny and V. C. Smith, "Evaluation of single-pigment shift model of anoma- lous trichromacy," J. Opt. Soc. Am. 67, 1196-1209 (1977); a new theoretical possibility in M. Alpern and E. N. Pugh, Jr., "Variation in the action spectrum of erythrolabe among deuteranopes," J. Physiol. Lond., 266, 613-646, (1977); and M. Alpern and J. Moeller, "The red and green cone visual pigments of deuteranomalous tri- chromacy," J. Physiol. Lond., 266, 647-675 (1977). 22 0ne plausible explanation is that the differences are a factor of retinal subtense, since the screening tests utilize relatively large colored areas while the lights at sea are essentially point sources. Sloan and Habel 12 noted this difference also and suggested that the poorer subjects in their study had a significantly greater impair- ment in the fovea than in the periphery. However, this suggestion was tested in an auxiliary study, to be reported separately, and was not confirmed. 2 "G. Verriest and A. Uvijls, "Central and peripheral increment thresholds for white and spectral lights on a white background in different kinds of congenitally defective colour vision," Atti della Fondazione Giorgio Ronchi XXII (2), 213-254 (1977). 24 G. Verriest, "Les courbes spectrales photopiques d'efficacit6 lu- mineuse relative dans les deficiences conge6nitales de la vision des couleurs," Vision Res. 11, 1407-1434 (1971). 25J A. S. Kinney, "Is photometry still relevant to illuminating engi- neering?", in Compte Rendu 18",London, 1975 (Bureau Central de la CIE, Paris, 1976), 70-76. 26 p. E. King-Smith and D. Carden, "Luminance and opponent-color contributions to visual detection and adaptation and to temporal and spatial integration," J. Opt. Soc. Am. 66, 709-717 (1976). 27 E. Zrenner, "Influence of stimulus duration and area on the spectral luminosity function as determined by sensory and VECP mea- surements," 14th International Society for Clinical Electroreti- nography, Louisville, Kentucky, 1976. Doc. Ophthal. Proc. Series 12, 21-30 (1977). Chromatic border distinctness: Not an index of hue or saturation differences* Brian W. Tansleyt Psychology Department, University of California, San Diego, La Jolla, California 92093 Arne Valberg Institute of Physics, University of Oslo, Oslo, Norway (Received 14 May 1977) Some investigators have suggested that the distinctness of chromatic borders (i.e., borders visible in photic arrays of uniform luminance) can be used as an index of hue and saturation differences between lights. However, recent evidence indicates that only two types of cones in the trichromatic eye contribute to chromatic border perception. A series of experiments are reported that were designed to discriminate between these alternatives, utilizing mainly the short-wavelength visible spectrum. The results support the notion that only R and G cones in the trichromatic eye mediate the perception, of chromatic borders; thus the distinctness of such borders alone cannot be used as an index of either hue or saturation differences, because both of these aspects of color involve contributions from B cones. INTRODUCTION It is possible to equate the luminances of two lights that form a circular bipartite field by (i) carefully aligning the straight edges of each hemifield until they are pre- cisely opposed, and then (ii) changing the radiance of one of the lights so as to minimize the distinctness of the border formed between them. 1 Any border visible after those operations is dependent upon the same kinds of mechanisms that mediate chromatic percepts. The results of previous experiments have led some investigators to suggest that the magnitude of distinct- ness of a chromatic border may be related to the color difference2' 3 or the saturation difference' 5 between the two lights that comprise the photic array in which the border is seen. However, a recent series of experi- ments by Tansley and Boynton 6 ' 7 demonstrated that only the R and G cones of the human retina are used in chro- matic border perception. The B cones, although con- tributing to saturation perception and color perception, do not contribute to the perception of chromatic borders. Tansley and Boynton found that there are sets of lights of differing color that, when paired in the manner de- scribed and adjusted to produce a minimally distinct border (MDB), will form no visible border betweenthem. All the lights in each set share a common property: ir- respective of the differential response of B conestosuch lights, the R-cone response is the same for both hemi- fields, as is the G-cone response. The results of these studies made doubtful the utility of chromatic border distinctness as an index of hue or saturation differences between lights. As a more di- rect means of testing the MDB method in this way, we report several experiments designed to discriminate be- tween the results of Tansley and Boynton and those of the previous studies concerned with the minimally dis- tinct border method. 113 J. Opt. Soc. Am., Vol. 69, No. 1, January 1979 0030-3941/79/010113-06$00.50 (D 1979 Optical So6iety of America 113
Transcript
2( 1Attributing deuteranopia to a missing photopigment has been muchmore controversial over the years than the same explanation forprotanopia. For excellent modern discussions of the color theoryapplied to the color defective, see M. J. Alpern, J. Mindel, and S.Torii, "Are there two types of deuteranopes?" J. Physiol. Lond.,199, 443-456 (1968); L. M. Hurvich, "Color vision deficiencies," inHandbook of Sensory Physiology Vol. VII/4 Visual Psychophysics,edited by D. Jameson and L. M. Hurvich (Springer-Verlag, Berlin,1972), 582-624; and M. Alpern and T. Wake, "Cone pigments inhuman deutan colouT vision defects," J. Physiol. Lond:, 266,595-612 (1977).
21 An excellent review of this proposition is available in J. Pokorny andV. C. Smith, "Evaluation of single-pigment shift model of anoma-lous trichromacy," J. Opt. Soc. Am. 67, 1196-1209 (1977); a newtheoretical possibility in M. Alpern and E. N. Pugh, Jr., "Variationin the action spectrum of erythrolabe among deuteranopes," J.Physiol. Lond., 266, 613-646, (1977); and M. Alpern and J. Moeller,"The red and green cone visual pigments of deuteranomalous tri-chromacy," J. Physiol. Lond., 266, 647-675 (1977).
2 2 0ne plausible explanation is that the differences are a factor ofretinal subtense, since the screening tests utilize relatively largecolored areas while the lights at sea are essentially point sources.Sloan and Habel1 2 noted this difference also and suggested that the
poorer subjects in their study had a significantly greater impair-ment in the fovea than in the periphery. However, this suggestionwas tested in an auxiliary study, to be reported separately, and wasnot confirmed.
2"G. Verriest and A. Uvijls, "Central and peripheral incrementthresholds for white and spectral lights on a white background indifferent kinds of congenitally defective colour vision," Atti dellaFondazione Giorgio Ronchi XXII (2), 213-254 (1977).
2 4G. Verriest, "Les courbes spectrales photopiques d'efficacit6 lu-mineuse relative dans les deficiences conge6nitales de la vision descouleurs," Vision Res. 11, 1407-1434 (1971).
25J A. S. Kinney, "Is photometry still relevant to illuminating engi-neering?", in Compte Rendu 18", London, 1975 (Bureau Centralde la CIE, Paris, 1976), 70-76.
2 6p. E. King-Smith and D. Carden, "Luminance and opponent-colorcontributions to visual detection and adaptation and to temporaland spatial integration," J. Opt. Soc. Am. 66, 709-717 (1976).
27 E. Zrenner, "Influence of stimulus duration and area on the spectralluminosity function as determined by sensory and VECP mea-surements," 14th International Society for Clinical Electroreti-nography, Louisville, Kentucky, 1976. Doc. Ophthal. Proc. Series12, 21-30 (1977).
Chromatic border distinctness: Not an index of hue or saturation differences*
Brian W. TansleytPsychology Department, University of California, San Diego, La Jolla, California 92093
Arne ValbergInstitute of Physics, University of Oslo, Oslo, Norway
(Received 14 May 1977)
Some investigators have suggested that the distinctness of chromatic borders (i.e., borders visible in photicarrays of uniform luminance) can be used as an index of hue and saturation differences between lights.However, recent evidence indicates that only two types of cones in the trichromatic eye contribute tochromatic border perception. A series of experiments are reported that were designed to discriminate betweenthese alternatives, utilizing mainly the short-wavelength visible spectrum. The results support the notion thatonly R and G cones in the trichromatic eye mediate the perception, of chromatic borders; thus thedistinctness of such borders alone cannot be used as an index of either hue or saturation differences, becauseboth of these aspects of color involve contributions from B cones.
INTRODUCTION
It is possible to equate the luminances of two lights thatform a circular bipartite field by (i) carefully aligningthe straight edges of each hemifield until they are pre-cisely opposed, and then (ii) changing the radiance ofone of the lights so as to minimize the distinctness ofthe border formed between them. 1 Any border visibleafter those operations is dependent upon the same kindsof mechanisms that mediate chromatic percepts.
The results of previous experiments have led someinvestigators to suggest that the magnitude of distinct-ness of a chromatic border may be related to the colordifference2'3 or the saturation difference' 5 between thetwo lights that comprise the photic array in which theborder is seen. However, a recent series of experi-ments by Tansley and Boynton6'7 demonstrated that onlythe R and G cones of the human retina are used in chro-matic border perception. The B cones, although con-
tributing to saturation perception and color perception,do not contribute to the perception of chromatic borders.Tansley and Boynton found that there are sets of lightsof differing color that, when paired in the manner de-scribed and adjusted to produce a minimally distinctborder (MDB), will form no visible border betweenthem.All the lights in each set share a common property: ir-respective of the differential response of B conestosuchlights, the R-cone response is the same for both hemi-fields, as is the G-cone response.
The results of these studies made doubtful the utilityof chromatic border distinctness as an index of hue orsaturation differences between lights. As a more di-rect means of testing the MDB method in this way, wereport several experiments designed to discriminate be-tween the results of Tansley and Boynton and those ofthe previous studies concerned with the minimally dis-tinct border method.
113 J. Opt. Soc. Am., Vol. 69, No. 1, January 1979 0030-3941/79/010113-06$00.50 (D 1979 Optical So6iety of America 113
1.0
0.5
0.3
0.1
0.05
0.03
0.011
.00o1
.001
400 450 50 550 600 650 700
WAVELENGTH (NM)
FIG. 1. Upper broken (---) and solid curves are R- and G-cone spectral-sensitivity functions that have shapes derived byWalraven (Ref. 8) but adjusted so that they cross at about 570nm. The heavy solid curve shows the R/G ratio, equivalentto the difference between the upper curves, because they aredisplayed on a logarithmic ordinate. This curve has a mini-mum, related to a maximum separation of the upper curvesat about 460 nm. There are pairs of wavelengths on eitherside of 460 nm that produce equal ratios.
EXPERIMENT 1: CHROMATIC BORDERS AND HUEDIFFERENCES
An important difference between the interpretationsof Kaiser et al., 4 Boynton and Greenspon, 5 Boynton andWagner, 2 Ward and Boynton, 3 and those of Tansley andBoynton6 "' lie in the contribution of B-cone responses tochromatic borders. The results of Tansley and Boyntonstrongly suggest that there is little or no contributionfrom these short-wavelength-sensitive cones. Thereforeit should be possible to predict the distinctness of chro-matic borders by reference to some function of the re-sponses of R and G cones only.
An example of one such function is shown through ref-erence to Fig. 1. Plotted in this figure are the shapesof the fundamental response functions of the R and Gcones as determined by Walraven. 8 We have shiftedthese functions along the ordinate so that they cross at570 un. This crossover point was chosen because (a)the tritanope, a class of dichromat deficient in B cones,sees a neutral point in the spectrum at about 570 nm,(b) the trichromatic saturation function is minimum at570 nm, and (c) for a normal trichromat, light at 570nm, juxtaposed with a white whose color temperature isabout 6500 K, forms an almost invisible border.
114 J. Opt. Soc. Am., Vol. 69, No. 1, January 1979
These points suggest that the R and G cones interactin a system that is nulled at 570 nm. We assume thatthis system could mediate the perception of chromaticborders.
Plotted along with these curves is their ratio, R/G,shown as a dark line with its ordinate plotted on the right.The ratio has a minimum at about 460 nm; there arepairs of spectral lights above and below this wavelengththat have the same ratio of R- to G-cone responses. Anysystem that utilizes responses of only these two typeswould be incapable of discriminating between such pairs,either for hue or because of any spatial characteristics(provided that the retinal images are both sharp). Thussuch pairs should not form visible borders with oneanother. Because the trichromatic color mechanismsreceive input from the B cones, yet the chromatic bor-der mechanism does not, such pairs may have differentcolors, owing to the different responses of B cones tothe two lights. Thus the prediction is that color differ-ences will vary, whereas border distinctness will not,for lights whose B/C cone-response ratios are equiv-alent. In this experiment, two procedures were used tostudy the relation between chromatic border distinct-ness and this response ratio of R and G cones, usingchromatic stimuli of different colors.
In the first procedure, a spectral light whose wave-length was less than 460 nm was sought which producedno visible border in a bipartite field with a spectrallight whose fixed wavelength was more than 460 nri. Inthe second procedure, the observer subjectively ratedthe visual distinctness of borders generated by pairs ofspectral lights that had various R/G ratios.
Method
Apparatus
Figure 2 is a schematic diagram of the Maxwellian-view stimulator used in these experiments. It had twooptical channels, one of which was fed by the output ofa Bausch and Lomb tungsten-filament source, the lightfrom which passed through a Bausch and Lomb gratingmonochromator and blocking filters. The other channelcontained a tungsten ribbon-filament source and as-sociated optics. The light in this channel was madenearly monochromatic (10 nm bandwidth at half-maxi-mum) by interposing one of a selected set of Fabry-~Perot-type interference filters in a collimated portionof the beam and further attenuated by the use of discreteevaporated-metal neutral density filters. Light in thechannel containing the monochromator was attenuatedby use of a circular evaporated-metal neutral densitywedge combined with neutral density filters. The spatialextent of each channel was defined by a semicircularaperture mounted on an X-Y stage. (By manipulation ofthe X-Y stage of one channel the observer could alignthe two hemifields so that their diametrical edges wereprecisely juxtaposed.) The light from the two channelswas combined in a beam-splitter cube and passed throughan achromatizing lens before being brought to a com-pact focus in the plane of the observer's pupil. A dental
D0051
Brian W. Tansley and A-rne Valberg 114
D A3
IRFI L L FhB Shl C L3 AL
SI!MPI1 X h2
Sh2 M MP2
L2 GM
IRF2
FIG. 2. Schematic diagram of the Maxwellian-view stimulatorused in the experiments reported in this paper: A: aperture;AL: achromatizing lens; BC: beam-splitting cube; FH: filter-holder (containing interference filters, blocking filters andneutral density filters, as needed); GM: grating monochroma-tor; IRF: infrared-absorbing filter; M: 1st surface mirror;MP: micropositioner; Ph: pin-hole aperture; SI: tungstenribbon-filament source; S2: Bausch and Lomb tungsten-halogensource; W: circular neutral density wedge.
bite bar was used to hold the observer's head in a fixedposition throughout the experiment. The retinal illumi-nance of the white light in one hemifield was calibratedby use of the method described by Westheimer. 9 Thatlight was used as a standard with which the luminancesof all subsequent standards were equated by the MDBmethod. The retinal illuminance for all studies reportedhere was 30 photopic trolands, with the exception ofspectral lights below 405 nm. These lights could not bemade bright enough to reach this value. (The minimumretinal illuminance for spectral lights below 405 wascalculated to be 9 td. Because with advancing age hu-man lens pigment increasingly attenuates light in thisspectral region, only one of the observers made mea-surements with spectral lights below 405 nm.)
Procedure: Part I
Each of two observers viewed a 1 30' circular bi-partite field. In the right hemifield, one of three spec-tral lights was presented on a given trial (either 500,519, or 541 nm). The observer's task was to vary thewavelength and intensity of the monochromatic light inthe left hemifield to find a light that produced no visibleborder with the right hemifield. For this task, the ob-server was constrained to use wavelengths less than460 nm in the left hemifield.
Procedure: Part 2
In this section of the experiment, the observer waspresented with one of a set of lights (483, 500, 541, 563,574, and 587 nm) in the right hemifield and one of anotherset of lights (390, 395, 400, 405, 410, 415, 420, and
430 nm) in the left hemifield. Each pairwise comparisonof one light from the left hemifield with one from theright was made with the retinal illuminance of the lightfrom the right hemifield held fixed.
For each pair presented, the observer was requiredto adjust the radiance of the left hemifield until a mini-mally distinct border was found between the two hemi-fields. The observer then interrupted the beam comingfrom the apparatus, to keep the border from fading dur-ing the rating procedure. He then rated the distinct-ness of the border for a given pair on an eight-point sub-jective scale where a "0" meant no visible border, anda "7" indicated a very distinct border. Each part of theexperiment was carried out on three separate days andthe average settings (or ratings) were calculated fromthese sessions.
Two observers with normal color vision served assubjects in Part 1, whereas only one served as subjectin Part 2. It was not possible to achieve acceptablelight levels for many of the very short wavelength stim-uli in Part 2, so data presented from this section showonly results of a preliminary investigation of the border-forming perception properties of violet lights. All otherobservations were done at 30 td.
Results and discussion
Figure 3 shows the results of these investigations.The closed symbols represent the mean wavelength (or-dinate) that was chosen in Part 1 to eliminate the per-cept of a border with a given spectral comparison light(abscissa). The numerical values positioned through-out the figure represent the mean distinctness rating atthe MDB point given by one observer for each pairwisecomparison of lights presented in Part 2. Plotted withthese data is the theoretical prediction of Walraven, 8defining lights that will be tritanopic metamers (haveequivalent R- to G-cone response ratios). It appearsfrom these preliminary results that pairs of lights thatproduce no border percept at the MDB point are thosethat fall near this theoretical locus. Also, the distinct-ness ratings increase for pairs of lights that fall fartheraway from this line (lights whose R- to G-cone responseratios are increasingly different).
These two sets of results indicate that there are pairsof lights of differing hue that can yield no visible bor-der; thus, hue differences cannot be ascertained by re-ferring to the chromatic border formed by two lights.
Kaiser et al. 4 suggested that chromtic border distinct-ness could be used as an index of the saturation differ-ence between two lights. They hypothesized that as thedifference between the saturations of two lights in-creases, the chromatic border becomes more visible.However, in their study no data were reported for wave-lengths less than about 460-470 nm. In this region, twovery different predictions can be made regarding therelation between saturation differences or some function
115 J. Opt. Soc. Am., Vol. 69, No. 1, January 1979 Brian W. Tansley and Arne Valberg 115
-- - -WALRAVEN'S THEORETICAL CURVE
* RMB "O" BORDERS* BWT "O" BORDERS
4.0 3.0
3.5 3.0
3.0 2.04.0 2.0
3.0 1.0
2.5 0.5
2.0 0.5 0 ,'* t
0.0 0.0 /a U'".
*2I ,' I I I I I I
(X...0175,y+..006)
NUMBERS-BWT ( C )
I S
0.5 o5 0.5 1.5
0.5 0.5 1.0 2.5
1.0 / 05 2.5 3.00." / 1.5 3.5 3.0
1.0 2.5 4.5
1.0 2.5 3.5 4.0
I 1.0 3.5 a5 5.0
4.0 5.0 6.0 6.0
460 480 500 520 540 560 580 600
WAVELENGTH (nm)
FIG. 3. Results of Expt. 1: The solid squares (observerRMB) and the circles (BWT) represent the mean wavelength(ordinate) chosen when a fixed wavelength (abscissa) waspresented to one hemifield such that no border percept wasvisible at the MDB point. Aside from the three conditionsnoted in the Procedure section of Expt. 1, observer BWTattempted to find a violet light that produced no visible borderwith 574 nm. This was found to be possible for a light of about385 nm. However, the retinal illuminance of this pair wasmuch less than in the rest of the experiment.
The numbers throughout the figure are the average distinct-ness ratings from Expt. 1 (Part 2) for one observer, for pairsof spectral lights, one from the abscissa and one from theordinate, that are adjusted to the minimally distinct borderpoint.
The dotted line is the curve of equivalent RIG ratios [cal-culated from the curves of Fig. 1, from Walraven (Ref. 8)1.The wavelengths of lights, one on the abscissa and one on theordinate, that correspond to a point on the dotted line haveequivalent R/G ratios and therefore should produce no visibleborder at equal luminance.
of R and G cones only and chromatic border distinct-ness.
Figure 4 demonstrates the kind of prediction that wouldfollow from a saturation-difference hypothesis: thereare very few data in the literature on saturation dis-crimination to wavelengths as short as about 400 nm;those of Priest and Brickweddel° are one such set. Theyindicate that saturation increases continually with pro-gressively shorter wavelengths and is minimal at about570 nm. If chromatic border distinctness were relatedto saturation differences, then a pair of lights, for ex-ample, either white or 570 nm (both of minimal satura-tion) and 400 nm, ought to give rise to a very distinctborder-more distinct than 570 and 460 nm because thesaturation difference is greater. By using 570 nm orwhite as one light in all pairs and varying the wavelengthof the other through the visible spectrum, a functionsimilar to that of Fig. 4 should be obtained for chromaticborder distinctness.
700WAVELENGTH (nm)
FIG. 4. Saturation functions obtained by Priest and Brickwedde(Ref. 10). Note increase of saturation for wavelengths lessthan 460 nm.
Tritanopic spectral purity
If, on the other hand, the mechanisms that mediatechromatic border perception utilize the responses fromonly R and G cones, then an experiment that comparesthe border-distinctness ratings of pairs of lights pre-sented in a bipartite field (where one hemifield is alwayskept at this same value of 570 nm or white) should gener-ate a function similar to that of Fig. 5.
This function, called "tritanopic spectral purity" iscalculated by considering a mechanism that signals thedifference between the outputs of only R and G cones andthen contrasts this value with that of other spatial loca-tions. The greater the difference between the tritanopic-spectral-purity values for the pairs of lights in a givenbipartite field, the more distinct the chromatic bordermight be expected to be for that particular pair.
20
1.8
1.E
&1.4
o 1.2
a1O.
400 500 600
wavelength (nm)700
FIG. 5. Prediction as to the outcome of Expt. 2. Tritanopicspectral purity, Pt, is plotted as a function of wavelength.This function is based on the difference between the responsesof R and G cones at each wavelength, normalized to their sum,where the relative heights of the two fundamental responsecurves [taken from Walraven (Ref. 8)] are adjusted to cross atabout 570 nm, as in Fig. 1.
116 J. Opt. Soc. Am., Vol. 69, No. 1, January 1979
380 I-
~iC5
I-(9zW-JW
390 -
400 -
410 F-
4.(
3.5
-< I-J
-J+ 14
0-J
3.01-
2.5-
420 1-
430 F-
440
I I - _[l
O .:...
O <
0 0 00
* O*
Oo o
* 0 0
I .
2.01-
400 500 600
Brian W. Tansley and Arne Valberg 116
-
.-,- l
.
. . .
It
00/e
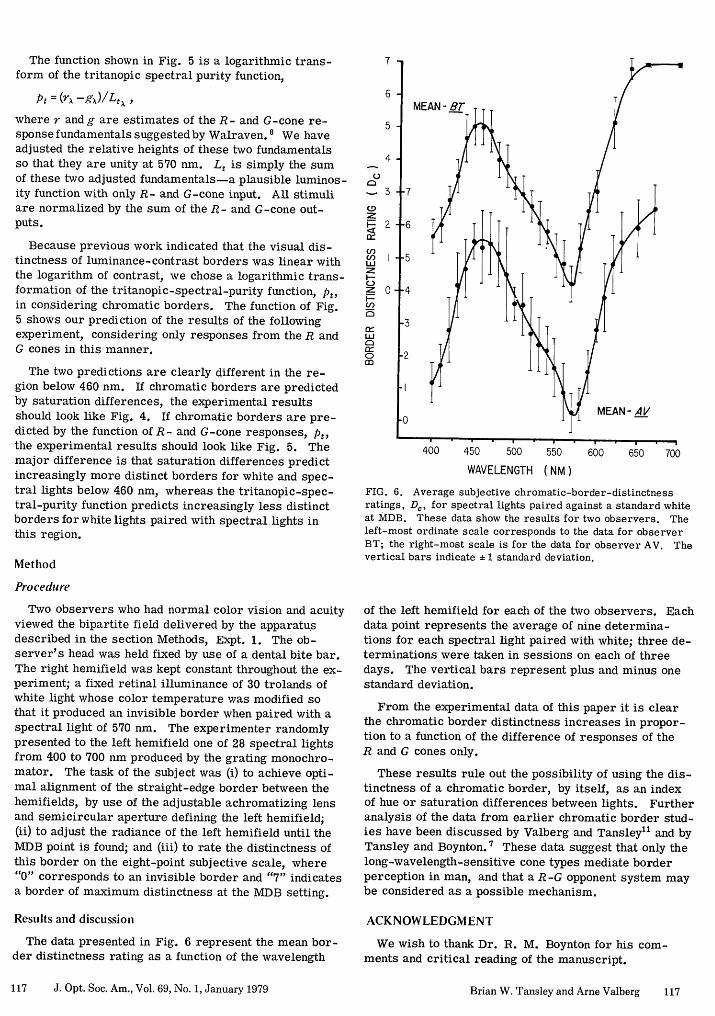
The function shown in Fig. 5 is a logarithmic trans-form of the tritanopic spectral purity function,
Pt = (ro -gx)/Lt. A
where r and g are estimates of the R- and G-cone re-sponse fundamentals suggested by Walraven. 8 We haveadjusted the relative heights of these two fundamentalsso that they are unity at 570 nm. Lt is simply the sumof these two adjusted fundamentals-a plausible luminos-ity function with only R- and G-cone input. All stimuliare normalized by the sum of the R- and G-cone out-puts.
Because previous work indicated that the visual dis-tinctness of luminance-contrast borders was linear withthe logarithm of contrast, we chose a logarithmic trans-formation of the tritanopic-spectral-purity function, Pt,in considering chromatic borders. The function of Fig.5 shows our prediction of the results of the followingexperiment, considering only responses from the R andG cones in this manner.
The two predictions are clearly different in the re-gion below 460 nm. If chromatic borders are predictedby saturation differences, the experimental resultsshould look like Fig. 4. If chromatic borders are pre-dicted by the function of R- and G-cone responses, Pt,the experimental results should look like Fig. 5. Themajor difference is that saturation differences predictincreasingly more distinct borders for white and spec-tral lights below 460 nm, whereas the tritanopic-spec-tral-purity function predicts increasingly less distinctborders for white lights paired with spectral lights inthis region.
Method
Procedure
Two observers who had normal color vision and acuityviewed the bipartite field delivered by the apparatusdescribed in the section Methods, Expt. 1. The ob-server's head was held fixed by use of a dental bite bar.The right hemifield was kept constant throughout the ex-periment; a fixed retinal illuminance of 30 trolands ofwhite light whose color temperature was modified sothat it produced an invisible border when paired with aspectral light of 570 nm. The experimenter randomlypresented to the left hemifield one of 28 spectral lightsfrom 400 to 700 nm produced by the grating monochro-mator. The task of the subject was (i) to achieve opti-mal alignment of the straight-edge border between thehemifields, by use of the adjustable achromatizing lensand semicircular aperture defining the left hemifield;(ii) to adjust the radiance of the left hemifield until theMDB point is found; and (iii) to rate the distinctness ofthis border on the eight-point subjective scale, where"0" corresponds to an invisible border and "7" indicatesa border of maximum distinctness at the MDB setting.
Results and discussion
The data presented in Fig. 6 represent the mean bor-der distinctness rating as a function of the wavelength
7
0M
CDzr
C')Wzz
Lii
00a:
U)
6
5
4
3
2
0
400 450 500 550 600 650 700
WAVELENGTH (NM)
FIG. 6. Average subjective chromatic-border-distinctnessratings, D,, for spectral lights paired against a standard whiteat MDB. These data show the results for two observers. Theleft-most ordinate scale corresponds to the data for observerBT; the right-most scale is for the data for observer AV. Thevertical bars indicate ± 1 standard deviation.
of the left hemifield for each of the two observers. Eachdata point represents the average of nine determina-tions for each spectral light paired with white; three de-terminations were taken in sessions on each of threedays. The vertical bars represent plus and minus onestandard deviation.
From the experimental data of this paper it is clearthe chromatic border distinctness increases in propor-tion to a function of the difference of responses of theR and G cones only.
These results rule out the possibility of using the dis-tinctness of a chromatic border, by itself, as an indexof hue or saturation differences between lights. Furtheranalysis of the data from earlier chromatic border stud-ies have been discussed by Valberg and Tansley11 and byTansley and Boynton. 7 These data suggest that only thelong-wavelength-sensitive cone types mediate borderperception in man, and that a R-G opponent system maybe considered as a possible mechanism.
ACKNOWLEDGMENT
We wish to thank Dr. R. M. Boynton for his com-ments and critical reading of the manuscript.
117 J. Opt. Soc. Am., Vol. 69, No. 1, January 1979 Brian W. Tansley and Arne Valberg 117
*This work was supported in part by NIH Grant No. EY01541
and by a grant from the Norwegian Council for Science andthe Humanities.
t Present address: Psychology Dept., Dalhousie University,Halifax, Nova Scotia, B3H 4J1, Canada.
'R. M. Boynton and P. K. Kaiser "Vision: The additivity law
made to work for heterochromatic photometry with bipartitefields," Science 161, 366-368 (1968).
2 R. M. Boynton and G. Wagner, "Color differences assessed
by the minimally-distinct border method, " in Color Metrics,edited by F. J. Vos, R. C. Friele, and P. L. Walraven(A. I. C. /Holland, Soesterburg, 1972).
3 F. Ward and R. M. Boynton, "Scaling of large chromatic
differences," Vision Res. 14, 943-949 (1974).4 P. K. Kaiser, P. Hertzberg, and R. M. Boynton, "Chromatic
border distinctness and its relation of saturation, " VisionRes. 11, 953-968 (1971).
5 R. M. Boynton and T. S. Greenspon, "The distinctness of
borders formed between equally saturated psychologicallyunique fields, " Vision Res. 12, 495-507 (1972).
ali. W. ransley and It. M. Boynton, "A single line predictsthe distinctness of borders formed by different colors,Science 191, 954-957 (1976).
7B. W. Tansley and R. M. Boynton, "Chromatic border per-
ception: The role of R and G cones, " Vision Res. (to bepublished).
8P. L. Walraven, "A closer look at the tritanopic convergencepoint, " Vision Res. 14, 1339-1343 (1974).
10I. G. Priest and F. G. Brickwedde, "The minimum perceptiblecolorimetric purity as a function of dominant wavelength, " J.Opt. Soc. Am. 28, 133-139 (1938).
"1A. Valberg and B. W. Tansley, "A tritanopic purity differencefunction accounts for border distinctness of the MDB-point,J. Opt. Soc. Am. (to be published).
Oscillator strengths for some D -F transitions in the Mgsequence
Charlotte Froese FischerDepartment of Computer Science, The Pennsylvania State University, University Park, Pennsylvania 16802
(Received 16 March 1978)
Multi-configuration Hartree-Fock wave functions have been obtained for many atoms of the Mgsequence for 3p 2 'D, 3 s 3d ".
3 D, 3p 3d 1'3F, and 3s 4f 1.
3 F states. Theoretical ionization energiesare reported. Oscillator strengths for allowed D -F transitions are presented and compared withexperiment, when available. Agreement is better for the 3s 3d 3D -3p 3d 3 F sequence than for3s 3d 3D -3s 4f 3F. Smoother trends are observed when f values for the ID 1 0~0 5 ,-'F lowest transition,for example, are plotted than for the 3s 3d 'D -3s 4f 'F transition.
1. INTRODUCTION
Oscillator strengths or f values for transitions in elementssuch as Mg I, Si III, Fe XV of the Mg sequence are importantfor abundance analysis of these elements in the solar corona.1In the past, theoretical calculations have been performed forthe more important transitions 2' 3 but these often failed to takeinto account properly the effect of correlation between theouter two electrons. Recently more accurate nonrelativist-ic 4'5' 6 and relativistic 7 f values have been published for manyof these transitions, but the studies were restricted to S - Por P - D transitions. No accurate f values for D - F transi-tions have been reported. In fact, currently it appears8 thatmore beam-foil results are available for the 3s 3d 3D - 3s 4f3F transitions than theoretical results. Since relativistic ef-fects are likely to be less important in these transitions thanin the resonance transition, for example, nonrelativistic cal-
culations for such sequences may be valid for fairly high de-grees of ionization.
For the 3s2 IS - 3s 3p IP resonance transition, there is good
agreement among the various theoretical f values,7 but aconsiderable discrepancy remains between theory and ex-periment, a discrepancy most pronounced at higher degreesof ionization where experimental f values are obtained by the
beam-foil method. Several studies of resonance transitionsfor the Na sequence,9 the Cu sequence and to some extent also
the Zn sequence' have suggested that the "yrast" cascadeeffects may be appreciable and may not have been accountedfor adequately in the analysis of beam-foil data. A similarsituation may be present in the Mg sequence. The yrastcascades arise from transitions between states with n = I + 1,an example being the 3d - 4f transition. A knowledge of thetransition probabilities for the cascade process could providevaluable information for the analysis of the beam-foil decay
curves.
This paper is devoted to a study of the 3d - 4f transitionwhere An = 1 but the f value remains large. Such transitionsare important in the controlled fusion programs and resultsare reported for the ions Kr XXV and Mo XXXI, of particularinterest in fusion research. Nonrelativistic f values for SnXXXIX and W LXIII also have been included since they es-tablish the nonrelativistic trend, but the neglect of relativisticeffects makes these results less meaningful physically.However, additional intermediate coupling calculations in-cluding some relativistic effects indicate that the f value for3s 3d 3D3 - 3s 4f 3F4 may be relatively unaffected even for W
LXIII.
The 3p 2 'D and 3p 3d 1'3F configurations interact with 3s
3d 'D and 3s 4f 1,3F respectively. The energy levels of many
of these 13D and 13F states cross during the first several de-
118 J. Opt. Soc. Am., Vol. 69, No. 1, January 1979 � 1979 Optical Society of America 1180030-3941/79/010118-08$00.50