1 Chromatin accessibility maps of chronic lymphocytic leukemia identify subtype- specific epigenome signatures and associated transcription regulatory networks André F. Rendeiro 1,* , Christian Schmidl 1,* , Jonathan C. Strefford 2,* , Renata Walewska 3 , Zadie Davis 3 , Matthias Farlik 1 , David Oscier 3 , Christoph Bock 1,4,5† 1 CeMM Research Center for Molecular Medicine of the Austrian Academy of Sciences, Vienna, Austria 2 Cancer Sciences, Faculty of Medicine, University of Southampton, Southampton, United Kingdom 3 Department of Molecular Pathology, Royal Bournemouth Hospital, Bournemouth, United Kingdom 4 Department of Laboratory Medicine, Medical University of Vienna, Vienna, Austria 5 Max Planck Institute for Informatics, Saarbrücken, Germany * These authors contributed equally to this work † Correspondence: [email protected]Keywords: Chronic lymphocytic leukemia, chromatin accessibility, epigenome mapping, cancer heterogeneity, hematopoietic malignancies, transcription regulation, gene regulatory networks, machine learning, bioinformatics Abstract Chronic lymphocytic leukemia (CLL) is characterized by substantial clinical heterogeneity, despite relatively few genetic alterations. To provide a basis for studying epigenome deregulation in CLL, we established genome-wide chromatin accessibility maps for 88 CLL samples from 55 patients using the ATAC-seq assay. These data were further complemented by ChIPmentation and RNA-seq profiling in ten samples. Based on this dataset, we de- vised and applied a bioinformatic method that links chromatin profiles to clinical annotations. Our analysis iden- tified sample-specific variation on top of a shared core of CLL regulatory regions. IGHV mutation status – which distinguishes the two major subtypes of CLL – was accurately predicted by the chromatin profiles, and gene reg- ulatory networks inferred for IGHV-mutated vs. IGHV-unmutated samples identified characteristic regulatory differences between these two disease subtypes. In summary, we found widespread heterogeneity in the CLL chromatin landscape, established a community resource for studying epigenome deregulation in leukemia, and demonstrated the feasibility of chromatin accessibility mapping in cancer cohorts and clinical research. Introduction Chronic lymphocytic leukemia (CLL) is the most common type of leukemia in the Western world 1 . It is charac- terized by remarkable clinical heterogeneity, with some patients pursuing an indolent course while others pro- gress rapidly and require early treatment. The diverse clinical course of CLL patients, particularly those that ini- tially present with low disease burden, fuels interest in prognostic biomarkers and personalized therapies 2 . Cur- rent clinical biomarkers for CLL include mutational status of the IGHV genes 3, 4 , IGHV gene family usage 5 , ste- reotyped B cell receptors 6, 7 , serum markers 8, 9 , chromosomal aberrations 10, 11 , and somatic mutations 12, 13, 14 . Most notably, IGHV mutation status distinguishes between a less aggressive form of CLL with mutated IGHV genes (mCLL) and a more aggressive form with unmutated IGHV genes (uCLL). Several surrogate biomarkers of IGHV mutation status have been described. For example, high levels of ZAP70 expression appear to be associat- ed with uCLL 15 . In addition to these focused biomarkers, transcriptome profiling has been used to define broader molecular signatures that may improve disease stratification independent of IGHV mutation status 16 .
Transcript
1
Chromatin accessibility maps of chronic lymphocytic leukemia identify subtype-specific epigenome signatures and associated transcription regulatory networks André F. Rendeiro1,*, Christian Schmidl1,*, Jonathan C. Strefford2,*, Renata Walewska3, Zadie Davis3, Matthias Farlik1, David Oscier3, Christoph Bock1,4,5†
1CeMM Research Center for Molecular Medicine of the Austrian Academy of Sciences, Vienna, Austria
2Cancer Sciences, Faculty of Medicine, University of Southampton, Southampton, United Kingdom
3Department of Molecular Pathology, Royal Bournemouth Hospital, Bournemouth, United Kingdom
4Department of Laboratory Medicine, Medical University of Vienna, Vienna, Austria
5Max Planck Institute for Informatics, Saarbrücken, Germany
Chronic lymphocytic leukemia (CLL) is characterized by substantial clinical heterogeneity, despite relatively few genetic alterations. To provide a basis for studying epigenome deregulation in CLL, we established genome-wide chromatin accessibility maps for 88 CLL samples from 55 patients using the ATAC-seq assay. These data were further complemented by ChIPmentation and RNA-seq profiling in ten samples. Based on this dataset, we de-vised and applied a bioinformatic method that links chromatin profiles to clinical annotations. Our analysis iden-tified sample-specific variation on top of a shared core of CLL regulatory regions. IGHV mutation status – which distinguishes the two major subtypes of CLL – was accurately predicted by the chromatin profiles, and gene reg-ulatory networks inferred for IGHV-mutated vs. IGHV-unmutated samples identified characteristic regulatory differences between these two disease subtypes. In summary, we found widespread heterogeneity in the CLL chromatin landscape, established a community resource for studying epigenome deregulation in leukemia, and demonstrated the feasibility of chromatin accessibility mapping in cancer cohorts and clinical research.
Introduction
Chronic lymphocytic leukemia (CLL) is the most common type of leukemia in the Western world1. It is charac-terized by remarkable clinical heterogeneity, with some patients pursuing an indolent course while others pro-gress rapidly and require early treatment. The diverse clinical course of CLL patients, particularly those that ini-tially present with low disease burden, fuels interest in prognostic biomarkers and personalized therapies2. Cur-rent clinical biomarkers for CLL include mutational status of the IGHV genes3, 4, IGHV gene family usage5, ste-reotyped B cell receptors6, 7, serum markers8, 9, chromosomal aberrations10, 11, and somatic mutations12, 13, 14. Most notably, IGHV mutation status distinguishes between a less aggressive form of CLL with mutated IGHV genes (mCLL) and a more aggressive form with unmutated IGHV genes (uCLL). Several surrogate biomarkers of IGHV mutation status have been described. For example, high levels of ZAP70 expression appear to be associat-ed with uCLL15. In addition to these focused biomarkers, transcriptome profiling has been used to define broader molecular signatures that may improve disease stratification independent of IGHV mutation status16.
2
Recent genome and exome sequencing projects have identified additional genes that are recurrently mutated in CLL17, 18, some of which have prognostic significance. Nevertheless, CLL samples carry relatively few genetic aberrations compared to other adult cancers19, and some patients develop progressive disease despite being clas-sified as “low risk” based on genetic markers, suggesting that non-genetic factors are relevant for CLL etiology and outcome. Several lines of evidence point to a role of epigenome deregulation in CLL pathogenesis: First, somatic mutations have been observed in non-coding regions of the genome, where they appear to induce de-regulation of relevant cancer genes18. Second, chromatin remodeling proteins such as ARID1A and CHD2 are recurrently mutated in CLL17, 18, indicating causal links between chromatin deregulation and CLL. Third, aber-rant DNA methylation was observed in all studied CLL patients20, 21, 22, correlated with IGHV mutation status, and identified a new subtype (iCLL) that appears to be an intermediate between mCLL and uCLL20, 23.
While prior studies of epigenome deregulation in primary cancer samples have focused almost exclusively on DNA methylation24, recent technological advances now make it possible to map chromatin landscapes in large patient cohorts. Most notably, the assay for transposase-accessible chromatin using sequencing (ATAC-seq) fa-cilitates open chromatin mapping in scarce clinical samples25, and ChIPmentation provides a streamlined, low-input workflow for genome-wide mapping of histone marks and transcription factors26. These two assays use a hyperactive variant of the prokaryotic Tn5 transposase, which integrates sequencing adapters preferentially into the DNA of genomic regions with accessible chromatin structure. ATAC-seq gives rise to globally similar results as DNase-seq, sharing its ability to detect footprints of transcription factor binding in the chromatin accessibility landscape27. ChIPmentation closely recapitulates the results obtained by more classical chromatin immunoprecip-itation followed by sequencing (ChIP-seq) protocols26. Both assays work well on scarce patient samples, and they enable fast sample processing on timescales that would be compatible with routine clinical diagnostics.
To establish the feasibility of large-scale chromatin analysis in primary cancer samples, and to provide a basis for dissecting regulatory heterogeneity in CLL, we performed chromatin accessibility mapping using the ATAC-seq assay on a cohort of 88 primary CLL samples derived from 55 patients. Furthermore, for ten of these samples we established histone profiles using ChIPmentation for three histone marks (H3K4me1, H3K27ac, H3K27me3) and transcriptome profiles using RNA-seq. We also developed a bioinformatic method for linking these chromatin profiles to clinical annotations and molecular diagnostics data, and we performed an initial analysis of gene regu-latory networks that underlie the major disease subtypes of CLL. In summary, this study provides a publicly available reference dataset and a rich source of testable hypotheses for dissecting CLL biology and pathogenesis.
Results
Chromatin accessibility maps for 88 CLL samples
To map the chromatin accessibility landscape of CLL (Figure 1a), we performed ATAC-seq on 88 purified lym-phocyte samples obtained from the peripheral blood of 55 CLL patients. These patients were managed at a single medical center, and they collectively represent the spectrum of clinical phenotypes that are commonly observed in CLL (Supplementary Table 1). Their average age at sample collection was 73 years, and 8% of patients were under treatment when the samples were collected. The majority of samples (58%) had been classified as IGHV-mutated as part of routine clinical diagnostics (Supplementary Figure 1 and Supplementary Table 1).
All samples selected for ATAC-seq library preparation contained at least 80% leukemic cells. The libraries were sequenced with an average of 24.7 million fragments, resulting in a dataset comprising a total of 2.2 billion se-quenced fragments (Supplementary Table 2). Data quality was high in all cases, with mitochondrial and duplicate read rates in the expected range (mean: 38.5%; standard deviation: 9.2) and the characteristic patterns of nucleo-some phasing derived from paired-end data (Supplementary Figure 2).
3
The individual samples were sequenced with sufficient depth to obtain the majority of chromatin-accessible re-gions that are detectable in each sample (Supplementary Figure 3). Moreover, by combining data across all 88 samples we approached cohort-level saturation in terms of unique chromatin-accessible regions (Figure 1b), indi-cating that our cohort is sufficiently large to identify most regulatory regions that are common in CLL samples.
As illustrated for the BLK gene locus (Figure 1c), our ATAC-seq dataset can be aggregated into a comprehensive map of chromatin accessibility in CLL. This map comprises 112,298 candidate regulatory regions, of which 11.6% are constitutively open across essentially all CLL samples, whereas 59.1% are open in a sizable propor-tion of samples (5% to 95% of samples), and 29.3% are unique to only one or very few samples (Supplementary Figure 4a). All data are available for interactive browsing and download from the supplementary website (http://cll-chromatin.computational-epigenetics.org/).
Chromatin-accessible regions in CLL are widely distributed throughout the genome, with moderate enrichment at genes and promoters (Figure 1d and Supplementary Figure 4b). We also observed an enrichment for transcription start sites and enhancer elements when we compared the CLL-accessible regions to epigenome segmentations for CD19+ B cells (Figure 1e and Supplementary Figure 4c), a related cell type for which comprehensive reference epigenome data are publicly available28. Nevertheless, we also detected a sizable number of CLL-accessible re-gions that fall into areas of quiescent or repressive chromatin in the epigenome segmentation of the B cells, sug-gesting that many of these regions may constitute CLL-specific regulatory elements.
Heterogeneity in the CLL chromatin accessibility landscape
Although the number of constitutively accessible regions in our cohort was relatively low (11.6%, Supplemen-tary Figure 4a), we still observed high consistency between individual samples, and any two samples in our da-taset shared 70% to 98% of their chromatin-accessible regions (Supplementary Figure 5a). Conversely, we also observed consistent differences in the ATAC-seq signal intensity between samples, many of which appear to re-flect genuine biological differences. To facilitate the gene-by-gene investigation of this heterogeneity, we estab-lished the “chromatin accessibility corridor” as a means of aggregating the cohort-level variation into a single intuitive genome browser track (Figure 2a and Supplementary Website). As illustrated by the PAX5 and BCL6 gene loci, even where the locations of chromatin accessible regions are shared across most samples, substantial differences in the ATAC-seq intensity levels were observed (Figure 2a).
For a more systematic investigation of chromatin heterogeneity in CLL, we calculated the cohort-level variance for each of the 112,298 regions in the CLL consensus map and linked these regions to nearby genes that they may regulate (see Methods for details). Promoters of genes with a known role in B cell biology and CLL patho-genesis showed significantly reduced variability (p < 10-5, Kolmogorov-Smirnov test), suggesting that consistent levels of chromatin accessibility at many of these gene promoters may be important for CLL cells (Supplemen-tary Figure 5b). The observed differences in accessibility were not due to differential representation of CpG is-lands among the promoters of the gene sets (p = 0.49, Fisher’s exact test). Moreover, distal enhancer elements were equally variable for genes with and without a biological link to CLL (p = 0.08, Kolmogorov-Smirnov test).
Beyond these global trends, the variance and distribution of chromatin accessibility across samples was highly gene-specific (Figure 2b and Supplementary Figure 5c), as illustrated by CLL-linked genes including B cell sur-face markers (CD19), B cell receptor signaling components (CD79A/B, LYN, BTK), common oncogenes (MYCN, KRAS, NRAS), and genes that are recurrently mutated in CLL (NOTCH1, SF3BP1, XPO1, CDKN1B)17, 18, 29.
Unsupervised principal component analysis clearly identified IGHV mutation status as the major source of heter-ogeneity in chromatin accessibility among CLL samples (Figure 2c, Supplementary Figure 6). However, the first
4
two principal components explained only 6.7% and 5.2% of the total variance in the chromatin accessibility da-taset, suggesting that many other factors contribute to the observed differences between samples.
The most direct way by which differences in chromatin accessibility may influence disease courses would be through differential regulation of CLL-relevant genes. Therefore, to systematically assess the link between chro-matin accessibility and gene expression in our cohort, we performed RNA-seq on ten of the CLL samples with matched ATAC-seq data. A weak positive correlation was observed between chromatin accessibility and gene expression (Pearson’s r = 0.3; Supplementary Figure 7a), which was highly dependent on the distance of the chromatin-accessible region to the nearest transcription start site (Supplementary Figure 7b).
For chromatin-accessible regions located in the vicinity of genes that were differentially expressed between IGHV-mutated (mCLL) and IGHV-unmutated (uCLL) samples according to the RNA-seq data, we observed sig-nificant differences in chromatin accessibility between the two disease subtypes, which allowed for partial sepa-ration between the two disease subtypes (Supplementary Figure 7c). An even stronger separation was observed when we focused our chromatin accessibility clustering on regions that had been identified as differentially methylated between mCLL and uCLL in a prior study of DNA methylation in CLL20 (Supplementary Figure 7d).
Finally, we assessed whether patterns of differential variability between mCLL and uCLL (i.e., higher levels of heterogeneity in one or the other subtype) may provide insights into the biology of these two disease subtypes. We identified 389 regions that showed a higher degree of variability among mCLL samples, whereas 581 regions were more variable among uCLL samples (Supplementary Figure 8a) – consistent with prior results showing higher gene expression variability among uCLL samples30. These differentially variable regions were distributed across a broad range of ATAC-seq intensity values, and they were not a side effect of differences in average chromatin accessibility (Supplementary Figure 8b). Genomic region enrichment analysis using the LOLA soft-ware31 found mCLL-variable regions enriched for B cell specific transcription factor binding (ATF2, BATF, BCL6, NFKB, RUNX3) and active histone marks (Supplementary Figure 8c). In contrast, uCLL-variable regions were strongly associated with the cohesin complex, including binding sites for CTCF, RAD21, and SMC3.
Disease subtype-specific patterns of chromatin accessibility
To link the CLL chromatin accessibility landscape to clinical annotations and molecular diagnostics data (most notably to the IGHV mutation status), we devised a machine learning based method that derives subtype-specific signatures directly from the data (Figure 3a). Focusing on the distinction between mCLL and uCLL, we trained random forest classifiers to predict whether a particular sample is IGHV-mutated or IGHV-unmutated, using the chromatin accessibility values for all 112,298 regions in the CLL consensus map as input. The performance of the resulting classifier was evaluated by leave-one-out cross-validation, and we observed excellent prediction accuracy with a ROC area under curve of 0.96 (Figure 3b), corresponding to a sensitivity of 95.6% at a specifici-ty of 88.2%. In contrast, when we repeated the same predictions 1,000 times with randomly shuffled class labels to control for potential biases in the machine learning analysis, we observed a much lower ROC area under curve close to the theoretical expectation of 0.5 (Figure 3b), which rules out inflated performance due to overtraining.
We extracted the most predictive regions from the trained classifiers, giving rise to a data-driven chromatin sig-nature of mCLL vs. uCLL. Hierarchical clustering categorized these regions into 719 with increased chromatin accessibility in IGHV-mutated samples (“mCLL regions”, cluster 1 in Figure 3c) and 764 regions with increased chromatin accessibility in IGHV-unmutated samples (“uCLL regions”, cluster 2 in Figure 3c).
To test whether these differences in chromatin accessibility between mCLL and uCLL reflect broader changes in the epigenome landscape, we performed ChIPmentation for three histone marks, which are associated with re-gions of open chromatin such as promoters and enhancers (H3K4me1, H3K27ac) and with regions of repressed
5
chromatin (H3K27me3). These experiments were done for ten patients and with the same samples that were used for ATAC-seq, thus allowing for a matched comparison. In mCLL samples, we detected higher levels of the ac-tive H3K27ac mark compared to repressive H3K27me3 in those regions that were more accessible in mCLL as opposed to uCLL, and vice versa (Figure 3e). This observation is illustrated by the ZNF667 promoter and an en-hancer at the ZBTB20 locus (Figure 3d), two genes that have been identified as predictors of time to treatment and overall survival in CLL32, 33. We also found that the genes in the vicinity of the signature regions were glob-ally more highly expressed in the cell type in which the chromatin accessibility levels were higher (Figure 3f).
We also analyzed the two differential region sets using LOLA31 (Figure 3g) and observed that the mCLL regions were enriched for active promoter and enhancer regions (marked by H3K4me1 and H3K27ac) in lymphocyte-derived cell lines (SU-DHL-5, JVM-2, GM12878, and KARPAS-422) as well as binding sites of relevant tran-scription factors (BATF, BCL6, and BLC3). In contrast, the uCLL regions were enriched for H3K4me1-marked promoter/enhancer regions in CD38-negative naïve B cells, reflecting the postulated naïve B cell origin of these CLL cells34. The uCLL regions were also enriched for transcribed regions (H3K36me3) in naïve B cells and in B cell-derived cell lines such as the BL-2 cell line, which has not undergone class-switch recombination.
Linking chromatin-accessible regions to genes, we investigated the enrichment of cellular signaling pathways and observed striking differences (Figure 3h). The mCLL regions were associated with pathways having an es-tablished role in normal lymphocytes (CTLA4 inhibitory signaling, high-affinity IgE receptor signaling, Fc epsi-lon signaling, and Fc gamma receptor signaling), while the uCLL regions were associated with cancer-associated pathways such as NOTCH signaling and FGF receptor signaling.
Finally, we investigated whether a third CLL subtype comprising of IGHV intermediate samples (iCLL) could be detected in our dataset, as it was recently proposed based on DNA methylation data20, 23. Clustering all samples based on the IGHV mutation signature regions, we indeed observed two intermediate clusters, the larger one comprising 21 samples from 14 patients (Figure 3h, green) and the smaller one comprising 3 samples from 2 pa-tients (Figure 3i, brown). Most but not all of these iCLL samples were classified as IGHV-mutated based on the molecular diagnostics data (Supplementary Figure 9). Principal component analysis provided further evidence that the chromatin accessibility profiles of these intermediate samples indeed fell between the mCLL and uCLL subtypes (Figure 3j). ChIPmentation as well as RNA-seq analysis also supported their intermediate character, as the observed distribution of histone marks and gene expression were consistently ranging between those ob-served for the mCLL and uCLL groups (Supplementary Figure 10).
Gene regulatory networks underlying the mCLL and uCLL disease subtypes
On top of chromatin accessibility mapping, ATAC-seq can also provide high-resolution information on transcrip-tion factor binding based on their DNA binding footprints25, which allowed us to infer chromatin-based gene regulatory networks for CLL and its two major disease subtypes (Figure 4a). To that end, we pooled the ATAC-seq data across all analyzed samples, identified footprints for 366 transcription factors with high-quality motifs in the JASPAR database35, and linked these regulatory elements to their putative target genes (see Methods for de-tails). The quality of the observed footprints was comparable to those in publicly available DNase-seq data for CD19+ B cells (Supplementary Figure 11), although there were some deviations between the two assays that are likely due to the different sequence specificity of the Tn5 enzyme as opposed to the DNase I enzyme.
We first inferred a pan-CLL gene regulatory network using ATAC-seq data from all samples (Supplementary Figure 12). The resulting network was dominated by highly connected transcription factors, including broadly activating factors (SP1/2/3), the insulator protein CTCF, and regulators of biological processes such as cell pro-liferation (EGR), cell cycle (E2F), and B cell maturation (SPI1, PAX5). This pan-CLL network was structurally similar to a network for CD19+ B cells that we inferred from publicly available DNase-seq data using the same
6
bioinformatic method (Supplementary Figure 13), and in the absence of a large chromatin accessibility dataset of B cells from healthy individuals it is not possible to conclusively identify the CLL-specific parts of our network.
Second, in order to investigate the regulatory differences between CLL subtypes, we inferred gene regulatory networks separately for mCLL and uCLL samples (Supplementary Figure 14) and identified the most differen-tially connected genes between the two (Figure 4b). Genes that were more highly connected in the mCLL net-work included the transcription factors ZNF354C and ELF5, the metallopeptidase ADAM29, and the membrane protein CD22. In contrast, the BMP receptor CRIM1, the transcription factors MECOM and PAX9, the FGF sig-naling receptor FGFR1, and the membrane protein CD9 were more highly connected in the uCLL network (Fig-ure 4c). The more highly connected genes in either subtype also showed higher averages of H3K4me1 and H3K27ac in their regulatory elements in samples of the corresponding subtype (Supplementary Figure 15a, 15b).
When we restricted our analysis to genes with a known role in B cell biology and CLL pathogenesis (Figure 4d), we observed a highly specific association of CD22 (an inhibitory receptor for B cell receptor signaling) with mCLL, whereas the CD38 and ZAP70 genes were preferentially associated with uCLL. Focusing on CD22 and PAX9 as two interesting genes emerging from this analysis, we contrasted the sub-networks of their direct neigh-bors in the gene regulatory networks for mCLL and uCLL (Supplementary Figure 15c), illustrating the character-istic regulatory differences between these two disease subtypes. Finally, many of the subtype-specific genes iden-tified by the regulatory network also showed locus-specific differences in their ChIPmentation profiles (Supple-mentary Figure 15d), thus providing further support that the analysis identifies relevant differences and illustrat-ing how our dataset can be used for deriving testable hypotheses on the regulatory basis of CLL.
Discussion
By performing ATAC-seq on a large set of primary CLL samples, we have established a detailed map of the chromatin accessibility landscape in CLL. The ATAC-seq data were complemented and validated with RNA-seq and ChIPmentation for three histone marks, each performed in ten representative samples covering three disease subtypes (mCLL, uCLL, iCLL). To our knowledge, this dataset is currently the largest catalog of chromatin ac-cessibility maps for any cancer type, demonstrating the feasibility of chromatin profiling in large cohorts of pri-mary cancer samples.
The large number of patient samples allowed us to dissect the role of epigenome variability as a potential con-tributor to cancer heterogeneity36. We found that variability between samples was widespread in our dataset, but significantly reduced at the promoters of genes with a known role in B cell biology and CLL pathogenesis. Over-all, our data support the existence of a core regulatory landscape shared by most or all CLL samples, which is complemented by sample-specific subsets of a substantially larger number of CLL-associated regulatory regions.
IGHV mutation status was the single biggest contributor to sample-specific differences in chromatin accessibility, although it explained only 5-10% of the observed variance in our dataset. Based on the chromatin profiles we were able to distinguish with excellent accuracy between IGHV-mutated mCLL and IGHV-unmutated uCLL. Our analysis also suggested the existence of one (or possibly two) intermediate types (iCLL), consistent with a recent report that used DNA methylation analysis of a large CLL cohort to identify novel CLL subtypes20. Chromatin accessibility and DNA methylation both appear to separate better between these disease subtypes than gene ex-pression data, suggesting that the biological differences between the major subtypes of CLL are primarily encod-ed in the epigenome and possibly reflect patterns retained from the subtype’s corresponding cell-of-origin.
Combining data across samples provided sufficient sequencing depth for footprint analysis of transcription factor binding, allowing us to infer gene regulatory networks from the data and to compare them between mCLL and uCLL. Although genomic footprinting has its limitations37, these network models give rise to predictions that can
7
provide a starting point for further experimental dissection of the transcription regulatory landscape of CLL. For example, mCLL-associated regions were enriched for transcription factors that are active in mature B cells and involved in memory B cell differentiation (BATF, BCL6), whereas the uCLL group was enriched for regulatory regions that are active in other hematopoietic cell types, indicative of a less differentiated cell state. Moreover, pathways that may boost proliferation, such as NOTCH signaling38 and interferon signaling39, were specifically observed in the more aggressive subtype (uCLL), whereas enrichment of inhibitory signaling by CTLA4 may contribute to the more indolent character of mCLL40.
From a technological perspective, our study describes broadly applicable methods for dissecting chromatin pro-files in large cohorts of primary patient samples. The differential chromatin analysis outlined in Figure 3 starts from clinical and/or diagnostic data and uses supervised learning techniques to identify and cross-validate dis-criminatory chromatin signatures. We focused specifically on IGHV mutation status, but the method can be ap-plied to any type of patient grouping, for example based on disease progression or therapy response. Moreover, the described method for ATAC-seq based inference of gene regulatory networks (Figure 4) establishes a data-driven approach for dissecting regulatory cell states – including their differences between disease subtypes – that is highly complementary to previous work aimed at inferring regulatory networks from transcriptome data41 , 42, 43. Finally, the “chromatin accessibility corridor” provides an adaptation of a related concept44 and intuitive brows-er-based visualization for chromatin data across large sample cohorts with significant regulatory heterogeneity.
Relevant limitations of our study include: (i) Lack of a clearly defined and experimentally accessible cell-of-origin for uCLL and mCLL, making it difficult to distinguish with certainty between chromatin patterns that are CLL-specific and those that are derived from the cell-of-origin; (ii) clonal heterogeneity of CLL within patients, which would be experimentally addressable only with single-cell sequencing technologies45, 46 that are currently limited in their genome-wide coverage; (iii) lack of scalable methods for distinguishing between regulatory and spurious transcription factor binding; and (iv) ambiguities in the assignment of transcription factor binding sites to the genes that they regulate. In the light of these limitations, the inferred gene regulatory networks constitute an initial model that will require future refinement as additional data and validations become available.
In summary, our study establishes a chromatin accessibility landscape of CLL and it identifies widespread regu-latory heterogeneity. It also provides a resource that can act as a starting point for deeper dissection of chromatin regulation in CLL, identification of therapeutically relevant mechanisms, and eventual translation of relevant dis-coveries into clinical practice. Given that the chromatin profiling assays used here (ATAC-seq and ChIPmenta-tion) are sufficiently fast and straightforward for use in a clinical sequencing laboratory, chromatin deregulation is becoming increasingly tractable as a promising source of biomarkers for stratified cancer therapy.
Methods
Sample acquisition and clinical data
All patients were diagnosed and treated at the Royal Bournemouth Hospital (UK) according to the revised guide-lines of the International Workshop Chronic Lymphocytic Leukemia/National Cancer Institute (IWCLL/NCI). Patients were selected to reflect the clinical and biological heterogeneity of the disease. Sequential samples were included for a total of 24 patients. All samples contained more than 80% leukemic cells. Established chromoso-mal rearrangements were diagnosed by fluorescence in situ hybridization (Abbott Diagnostics; DakoCytomation) or multiple ligation dependent probe amplification using the MLPA P037 CLL-1 probemix (MRC Holland SAL-SA) according to the manufacturers’ instructions. Chromosome analysis was performed and reported according to the International System for Human Cytogenetic Nomenclature. IGHV was sequenced as previously de-
8
scribed4, and a threshold of >98% germline homology was taken to define the unmutated subset4. The study was approved and overseen by the local ethics committee of the contributing institutions.
ATAC-seq
Accessible chromatin mapping was performed using the ATAC-seq method as previously described25, with mi-nor adaptations. In each experiment, 105 cells were washed once in 50 µl PBS, resuspended in 50 µl ATAC-seq lysis buffer (10 mM Tris-HCl, pH 7.4, 10 mM NaCl, 3 mM MgCl2, and 0.1% IGEPAL CA-630) and centrifuged for 10 min at 4°C. Upon centrifugation, the pellet was washed briefly in 50 µl MgCl2 buffer (10 mM Tris, pH 8.0, and 5 mM MgCl2) before incubating in the transposase reaction mix (12.5 µl 2x TD buffer, 2 µl transposase (Illumina) and 10.5 µl nuclease-free water) for 30 min at 37°C. After DNA purification with the MinElute kit, 1 µl of the eluted DNA was used in a qPCR reaction to estimate the optimum number of amplification cycles. Li-brary amplification was followed by SPRI size selection to exclude fragments larger than 1,200 basepairs. DNA concentration was measured with a Qubit fluorometer (Life Technologies). Library amplification was performed using custom Nextera primers25. The libraries were sequenced by the Biomedical Sequencing Facility at CeMM using the Illumina HiSeq3000/4000 platform and the 25 basepair paired-end configuration.
RNA-seq
Total RNA was isolated using the AllPrep DNA/RNA Mini Kit (Qiagen). RNA amount was measured using Qubit 2.0 Fluorometric Quantitation (Life Technologies), and the RNA integrity number (RIN) was determined using Experion Automated Electrophoresis System (Bio-Rad). RNA-seq libraries were prepared using a Sciclone NGS Workstation (PerkinElmer) and a Zepyhr NGS Workstation (PerkinElmer) with the TruSeq Stranded mRNA LT sample preparation kit (Illumina). Library amount and quality were determined using Qubit 2.0 Fluo-rometric Quantitation (Life Technologies) and Experion Automated Electrophoresis System (Bio-Rad). The li-braries were sequenced by the Biomedical Sequencing Facility at CeMM using the Illumina HiSeq 3000/4000 platform and the 50 basepair single-read configuration.
ChIPmentation
ChIPmentation was carried out as previously described26, with minor adaptions. Briefly, cells were washed once with PBS and fixed with 1% paraformaldehyde in up to 1 ml PBS for 10 minutes at room temperature. Glycine was added to stop the reaction. Cells were collected at 500 x g for 10 minutes at 4°C (subsequent work was per-formed on ice and used cool buffers and solutions unless otherwise specified) and washed twice with up to 0.5 ml ice-cold PBS supplemented with 1 μM PMSF. The pellet was lysed in sonication buffer (10 mM Tris-HCl, pH 8.0, 1 mM EDTA, pH 8.0, 0.25% SDS, 1x protease inhibitors (Sigma), 1 µM PMSF) and sonicated with a Co-varis S220 sonicator for 20-30 minutes in a milliTUBE or microTUBE until the size of most fragments was in the range of 200-700 basepairs. Lysates were centrifuged at full speed for 5 minutes at 4°C, and the supernatant containing the sonicated chromatin was transferred to a new tube. The lysate was then brought to RIPA buffer conditions (final concentration: 10 mM Tris-HCl, pH 8.0, 1 mM EDTA, pH 8.0, 140 mM NaCl, 1% Triton x-100, 0.1% SDS, 0.1% DOC, 1x protease inhibitors (Sigma), 1 µM PMSF) in a volume of 200 µl/immunoprecipitation For each immunoprecipitation, 10 μl magnetic Protein A (Life Technologies) were washed twice and resuspended in PBS supplemented with 0.1% BSA. The antibody was added and bound to the beads by rotating 2 hours at 4°C. Used antibodies were H3K4me1 (0.5 μg/immunoprecipitation, Diagenode pAb-194-050), H3K27ac (1 µg/immunoprecipitation, Diagenode pAB-196-050), H3K27me3 (1 µg/immunoprecipitation, Millipore 07-499). For control libraries an IP with 2.5 µg of a nonspecific IgG rabbit
9
antibody was used. Blocked antibody-conjugated beads were then placed on a magnet, supernatant was removed, and the sonicated lysate was added to the beads followed by incubation for 3-4 hours at 4°C on a rotator. Beads were washed subsequently with RIPA (twice), RIPA-500 (10 mM Tris-HCl, pH 8.0, 1 mM EDTA, pH 8.0, 500 mM NaCl, 1% Triton x-100, 0.1% SDS, 0.1% DOC,) (twice), and RIPA-LiCl (10 mM Tris- HCl, pH 8.0, 1 mM EDTA, pH 8.0, 250 mM LiCl, 1% Triton X-100, 0.5% DOC, 0.5% NP40) (twice).
Beads were washed once with cold Tris-Cl pH 8.0 to remove detergent, salts, and EDTA. Beads were washed once more with cold Tris-Cl pH 8.0 but the reaction was not placed on a magnet to discard supernatant immedi-ately. Instead, the whole reaction including beads was transferred to a new tube, and then placed on a magnet to remove supernatant to decrease tagmentation of unspecific chromatin fragments sticking to the tube wall. Beads were then carefully resuspended in 25 μl of the tagmentation reaction mix (10 mM Tris pH 8.0, 5 mM MgCl2, 10% v/v dimethylformamide) containing 1 μl Tagment DNA Enzyme from the Nextera DNA Sample Prep Kit (Illumina) and incubated at 37°C for 1-3 minutes in a thermocycler. The beads were washed with RIPA (twice) and once with cold Tris-Cl pH 8. Beads were washed once more with cold Tris-Cl pH 8.0 but the reaction was not placed on a magnet to discard supernatant immediately. Instead, the whole reaction including beads was again transferred to a new tube, and then placed on a magnet to remove supernatant to remove unspecific tag-mented chromatin fragments. Beads were then incubated with 70 μl elution buffer (0.5% SDS, 300 mM NaCl, 5 mM EDTA, 10 mM Tris-HCl pH 8.0) containing 2 μl of Proteinase K (NEB) for 1 hour at 55°C and 8 hours at 65°C to revert formaldehyde crosslinking, and supernatant was transferred to a new tube. Finally, DNA was puri-fied with SPRI AMPure XP beads (sample-to-beads ratio 1:2) or Qiagen MinElute columns.
1 μl of each library was amplified in a 10-μl qPCR reaction containing 0.15 μM primers, 1× SYBR Green and 5 μl Kapa HiFi HotStart ReadyMix (Kapa Biosystems) to estimate the optimum number of enrichment cycles with the following program: 72°C for 5 min; 98°C for 30 s; 24 cycles of 98°C for 10 s, 63°C for 30 s; and 72°C for 30 s; and a final elongation at 72°C for 1 min. Kapa HiFi HotStart ReadyMix was incubated at 98°C for 45 s before preparation of all PCR reactions (qPCR and final enrichment PCR) to activate the hot-start enzyme for successful nick translation in the first PCR step. Final enrichment of the libraries was performed in a 50 μl reaction using 0.75 μM primers and 25 μl Kapa HiFi HotStart ReadyMix. Libraries were amplified for N+1 cycles, where N is equal to the rounded-up Cq value determined in the qPCR reaction. Enriched libraries were purified with size selection using SPRI AMPure XP beads at a beads-to-sample ratio of 1:1, followed by a size selection using AMPure XP beads to recover libraries with a fragment length of 200-400 basepairs. Library preparation was per-formed using custom Nextera primers as previously described for ATAC-seq25. The libraries were sequenced by the Biomedical Sequencing Facility at CeMM using the Illumina HiSeq3000/4000 platform and the 50 basepair single-read configuration.
Preprocessing of the ATAC-seq data
Reads were trimmed using Skewer47. Trimmed reads were aligned to the GRCh37/hg19 assembly of the human genome using Bowtie248 with the “–very-sensitive” parameter. Duplicate reads were removed using sambamba markdup49, and only properly paired reads with mapping quality >30 and alignment to the nuclear genome were kept. All downstream analyses were performed on the filtered reads. Genome browser tracks were created with the genomeCoverageBed command in BEDTools50 and normalized such that each value represents the read count per basepair per thousand filtered reads. Finally, the UCSC Genome Browser’s bedGraphToBigWig tool was used to produce a bigWig file. Combined tracks with percentile signal across the cohort were created by quanti-fying ATAC-seq read coverage at every reference genome position using BEDTools coverage and normalizing it between samples. Normalization was done by dividing each value by the total number of filtered reads and mul-tiplying it with 10 million, in order to obtain numbers that are comparable and easy to visualize. Next, the mean
10
as well as the 5th, 25th, 75th and 95th percentiles of signal across the whole cohort were calculated with Numpy, converted into bedgraph files, and subsequently to bigwig format using bedGraphToBigWig. Peak calling was performed with MACS251 using the “–nomodel” and “–extsize 147” parameters, and peaks overlapping black-listed features as defined by the ENCODE project52 were discarded.
Preprocessing of the RNA-seq data
Reads were trimmed with Trimmomatic53 and aligned to the GRCh37/hg19 assembly of the human genome using Bowtie154 with the following parameters: -q -p 6 -a -m 100 --minins 0 --maxins 5000 --fr --sam --chunkmbs 200. Duplicate reads were removed with Picard’s MarkDuplicates utility with standard parameters prior to transcript quantification with BitSeq55 using the Markov chain Monte Carlo method and standard parameters. To obtain gene-level quantifications, we assigned the expression values of its highest expressed transcript to each gene. Differential gene-level expression between the three IGHV mutation status groups was performed using DESeq256 from the raw count data with a significance threshold of 0.05.
Preprocessing of the ChIPmentation data
Reads were trimmed using Skewer47. Trimmed reads were aligned to the GRCh37/hg19 assembly of the human genome using Bowtie248 with the “–very-sensitive” parameter. Duplicate reads were removed using sambamba markdup49, and only properly paired reads with mapping quality >30 and alignment to the nuclear genome were kept. All downstream analyses were performed on the filtered reads. Genome browser tracks were created with the genomeCoverageBed command in BEDTools50 and normalized such that each value represents the read count per basepair per thousand filtered reads. Finally, the UCSC Genome Browser’s bedGraphToBigWig tool was used to produce a bigWig file.
Bioinformatic analysis of chromatin accessibility
The CLL consensus map was created by merging the ATAC-seq peaks from all samples using the BEDTools50 merge command. To produce Figure 1b, we counted the number of unique chromatin-accessible regions after merging peaks for each sample in an iterative fashion, randomizing the sample order 1,000 times and computing 95% confidence intervals across all iterations. The chromatin accessibility of each region in each sample was quantified using Pysam, counting the number of reads from the filtered BAM file that overlapped each region. To normalize read counts across samples, we performed quantile normalization using the normalize.quantiles func-tion from the preprocessCore package in R. For each genomic region we calculated the support as the percentage of samples with a called peak in the region, and we calculated four measures of ATAC-seq signal variation across the cohort: mean signal, standard deviation, variance-to-mean ratio, and the squared coefficient of varia-tion (the square of the standard deviation over the mean). Additionally, we used BEDTools intersect to annotate each region with the identity of and distance to the nearest transcription start site and the overlap with Ensembl gene annotations (promoters were defined as the 2,500 basepair region upstream of the transcription start site). Annotation with chromatin states was based on the 15-state genome segmentation for CD19+ B cells from the Roadmap Epigenomics Project57 (identifier: E032). To summarize the chromatin accessibility signals into one value per gene (Figure 2b and Supplementary Figure 5b, 5c) we used the accessibility values of the closest region (but no further than 1,000 basepairs from the transcription start site) to represent the promoter, and the mean val-ues of all distal regions (located more than 2,500 basepairs from the transcription start site) of each gene to repre-sent distal regulatory elements. To test for overrepresentation of CpG islands in the promoters of genes with a known role in B cell biology and/or CLL pathogenesis, we downloaded the position of CpG islands in the
11
GRCh37/hg19 assembly from the UCSC Genome Browser58, counted the number of promoters (as defined above) that overlapped by at least one basepair with CpG islands in the gene set of interest and in all other genes with accessible elements in CLL, and used Fisher’s exact test to assess the significance of the association. Unsu-pervised principal component analysis was performed with the scikit-learn59 library (sklearn.decomposition.PCA) applied to the chromatin accessibility values of all chromatin-accessible regions across the CLL cohort. To inves-tigate variability within the mCLL and uCLL sample groups, we divided the samples in two groups based on their IGHV mutation status (samples below a 98% homology threshold were considered mutated and samples with missing values for the IGHV mutation status were excluded from the analysis), and we used the F test from the var.test function in R on the chromatin accessibility values of all CLL cohort regions. Significantly variable regions were defined as having a Bonferroni-corrected p-value below 0.05 and mean accessibility above 1. Re-gion set enrichment analysis was performed on the significantly variable regions of each group using LOLA31 with its core databases: transcription factor binding sites from ENCODE52, tissue clustered DNase hypersensitive sites60, the CODEX database61, UCSC Genome Browser annotation tracks58, the Cistrome database62, and data from the BLUEPRINT project63.
Machine learning analysis of disease subtypes
Random forest classifiers from the scikit-learn59 Python library (sklearn.ensemble.RandomForestClassifier) were trained with the samples’ IGHV mutation status as class label and the chromatin accessibility values for each sample at each of the 112,298 consensus regions as input features (prediction attributes). All samples with known IGHV mutation status were used for class prediction, the performance was evaluated by leave-one-out cross-validation, and the results were plotted as ROC curves using scikit-learn. Given that several patients contributed more than one sample to the cohort, in each iteration of the cross-validation we removed any samples from the training set that belonged to the same patient as the sample in the test set, in order to eliminate a potential risk of overtraining. Furthermore, we repeated the cross-validation 1,000 times based on randomly shuffled class labels to reconfirm that no overtraining occurred in our analysis. The most predictive regions for IGHV mutation status were selected by averaging the feature importance of the random forest classifiers over all iterations of the cross-validation and selecting those features with Gini importance higher than 10-4. Region set enrichment was per-formed using LOLA31 as described above. Pathway enrichment analysis was performed using seq2pathway64. The sample clustering in Figure 3i was based on the pairwise correlation of ATAC-seq signal in the predictive regions between samples, and the dendrogram was plotted using Scipy’s hierarchical clustering function. With the same values of chromatin accessibility from above, we performed principal component analysis on the CLL samples using R’s implementation in the prcomp function.
Gene regulatory network inference
Transcription factor binding maps as the basis for inferring gene regulatory networks were derived by footprint-ing analysis using the PIQ software65 and a set of 366 human transcription factor motifs from the JASPAR data-base35. As previously described66, we retained only those transcription factors with at least 500 high-purity (>0.7) binding sites overlapping with an ATAC-seq peak. Our scheme for assigning transcription factor binding sites to genes was as follows: Binding sites located in the gene body or in the 2,500 basepair region upstream of its tran-scription start site were assigned to the overlapping gene(s). Intergenic binding sites were assigned to the gene whose transcription start site was closest to the peak. For this association, we used the Ensembl gene annotation version 75, and we treated non-protein-coding genes in the same way as protein-coding genes. To infer gene reg-ulatory networks, an interaction score was calculated in a similar way as previously described66: The interaction
12
score between a transcription factor t and a gene g (St,g) was defined as the sum over all n transcription factor binding sites of t that can be assigned to g:
, = 2 ∗ − 0.5 ∗ 10 ,
In this formula Pi is the PIQ purity score and di,g is the distance of a particular transcription factor binding site i to gene g. This score establishes a unidirectional (transcription factors to genes) and weighted (based on the interac-tion score) relationship, which provide the edges of the gene regulatory network. We inferred gene regulatory networks for all samples combined and also separately for the two disease subtypes (mCLL and uCLL) based on IGHV mutation status. We considered only transcription-factor-to-gene interactions with scores above 1, and in Figure 4b as well as Supplementary Figures 12 and 14 we plotted only nodes with more than 200 connections. For the CD19+ B cell gene regulatory network we used DNase-seq data from the Roadmap Epigenomics Project57 (identifier: E032). Both the processing of the raw data and the network inference were performed in the same manner as ATAC-seq. The comparison of composition and structural characteristics of the gene regulatory networks inferred from ATAC-seq data for the CLL cohort and from DNase-seq data for CD19+ B cells was per-formed using functions from the networkx67 library in Python. The inferred networks were visualized using the Gephi software, applying the Force Atlas 2 graph layout with LinLog and hub dissuasion. In order to compare the inferred mCLL and uCLL networks, we divided the degree of each node by the total number of edges in each network to compensate for differences in the absolute number of detected interactions, and we quantified differ-ences by subtracting and log2-transforming this value between networks for each node.
Data availability
The ATAC-seq intensity data are available for interactive browsing and download from the supplementary web-site (http://cll-chromatin.computational-epigenetics.org/). They are also being submitted to NCBI GEO (acces-sion number pending). The raw sequencing data are being submitted to the EBI EGA for controlled access, in order to protect the privacy of the patients who have donated the samples.
Acknowledgements
We would like to thank all patients who have donated their samples for this study. We also thank Amelie Kuchler and Thomas Penz for expert technical assistance, Johanna Klughammer and Nathan Sheffield for their contribu-tions to the data analysis pipeline, the Biomedical Sequencing Facility at CeMM for assistance with next-generation sequencing, and all members of the Bock lab for their help and advice. Moreover, we would like to thank Ulrich Jäger, Medhat Shehata, Philipp Staber, and Jörg Menche for their comments and for critically read-ing the manuscript. This work was performed in the context of the BLUEPRINT project (European Union’s Sev-enth Framework Programme grant agreement no. 282510) and the ERA-NET projects EpiMark (FWF grant agreement no. I 1575-B19) and CINOCA (FWF grant agreement no. I 1626-B22). C.S. was supported by a Feodor Lynen Fellowship of the Alexander von Humboldt Foundation. J.C.S. was supported by Bloodwise (11052, 12036), the Kay Kendall Leukaemia Fund (873), Cancer Research UK (C34999/A18087, ECMC C24563/A15581), Wessex Medical Research, and the Bournemouth Leukaemia Fund. C.B. was supported by a New Frontiers Group award of the Austrian Academy of Sciences.
13
Author contributions
A.F.R., C.S., J.C.S., D.O., and C.B. planned the study; J.C.S., R.W., Z.D., and D.O. provided samples and clini-cal data; C.S. and M.F. performed the experiments; A.F.R. analyzed the data with contributions from C.S., J.C.S., D.O., and C.B.; C.B. supervised the research; all authors contributed to the writing of the manuscript.
Competing financial interests
The authors declare no competing financial interests.
Figure legends
Figure 1: The chromatin accessibility landscape of chronic lymphocytic leukemia (CLL).
a) ATAC-seq profiling and analysis workflow for establishing patient-specific and cohort-level maps of chroma-tin accessibility in CLL. b) Saturation analysis showing the number of unique chromatin-accessible regions de-tected across 88 samples and with a total sequencing depth of 2.2 billion ATAC-seq fragments. The narrow blue and green corridors indicate 95% confidence intervals for samples added in random order (1,000 iterations). c) Genome browser plot showing ATAC-seq signal intensity for 88 individual CLL samples (top), average signal intensity across the cohort and cohort-level peak calls (center), and reference data from the ENCODE project (bottom). Browsable tracks are available from the supplementary website: http://cll-chromatin.computational-epigenetics.org/. d) Absolute (frequency) and relative (fold-change) co-localization of unique chromatin-accessible regions in CLL with gene annotations (left) and chromatin state segmentations for CD19+ B cells from the Roadmap Epigenomics project (right).
Figure 2: Heterogeneity in the chromatin accessibility landscape of CLL.
a) Genome browser plot showing ATAC-seq signal intensity across the CLL cohort in the vicinity of two genes with a known role in B cell biology (PAX5 and BCL6). This cohort-level track uses color-coded percentiles to visualize the observed heterogeneity between samples. The bottom row zooms in on the chromatin accessibility landscape at three specific regulatory regions. b) Violin plots showing the cohort-wide distribution of chromatin accessibility at promoters (chromatin-accessible regions located with 2,500 basepairs from the transcription start site) and putative enhancers of genes with a known role in B cell biology and/or CLL pathogenesis. c) Unsuper-vised principal component analysis based on the chromatin accessibility for all 88 samples at each of the 112,298 chromatin-accessible regions in the CLL cohort. Samples are color-coded according to their IGHV mutation sta-tus, using <98% germline homology as threshold for classifying samples as mutated.
Figure 3: Disease subtype-specific patterns of chromatin accessibility.
a) Methodology for deriving disease subtype-specific patterns of chromatin accessibility: A machine learning algorithm is trained to distinguish between different sample groups (here: IGHV-mutated vs. IGHV-unmutated), the prediction performance is evaluated by cross-validation, and the most predictive features are obtained by fea-ture extraction from the cross-validated models. b) ROC curve summarizing the test set prediction performance (estimated by leave-one-out cross-validation) of a random forest classifier that uses the ATAC-seq dataset to dis-tinguish between IGHV-mutated and IGHV-unmutated samples. “AUC” refers to the ROC area under curve as a measure of prediction performance, and sensitivity/specificity values are shown for the point on the ROC curve
14
that is closest to the top left corner. The grey lines indicate the performance of 1,000 classifiers trained and eval-uated in the same way but with randomly shuffled class labels. c) Clustered heatmap based on the most predic-tive regions extracted from the cross-validated classifiers. d) Genome browser plots showing ATAC-seq and ChIPmentation profiles for gene loci with a known role in CLL (ZNF667 and ZBTB20). e) Ratio between ChIP-mentation signal for active chromatin (H3K27ac) and repressive chromatin (H3K27me3) at mCLL-linked and uCLL-linked regions. f) Ratio of gene expression levels between genes linked to mCLL-accessible regions and genes linked to uCLL-accessible regions. g) Most highly enriched region sets for mCLL (blue) and uCLL (green) associated regions. h) Most highly enriched pathways among genes linked to mCLL (blue) and uCLL (green) regions. i) Hierarchical clustering of all CLL samples based the classifiers’ most predictive regions. Clusters 1 corresponds to mCLL, cluster 4 to uCLL, and clusters 2 and 3 to iCLL. Samples are colored by IGHV mutation status (top) and cluster assignment (bottom). j) Principal component analysis for the same data as in panel i.
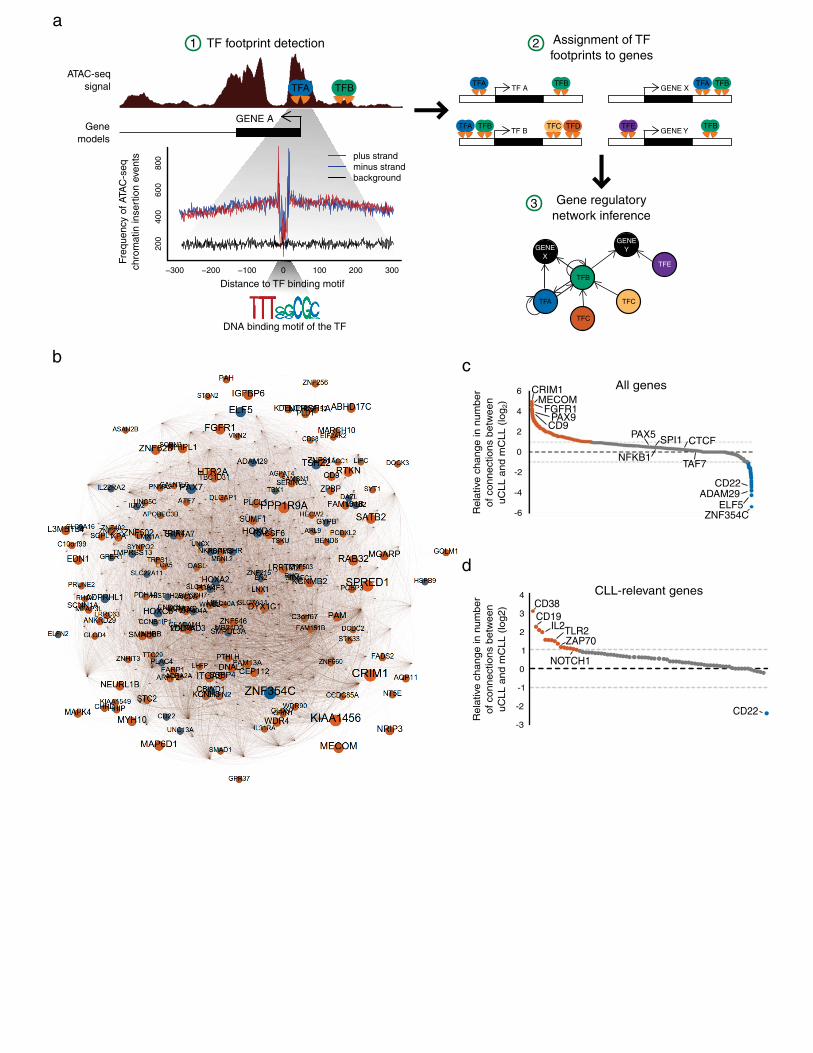
Figure 4: Gene regulatory networks underlying the mCLL and uCLL disease subtypes.
a) Methodology for deriving gene regulatory networks from ATAC-seq data using transcription factor (TF) foot-printing, mapping of transcription factor to genes, and regulatory network inference. b) CLL gene regulatory network derived from the data of all 88 samples, showing the most differentially connected genes between uCLL and mCLL (the full network is shown in Supplementary Figure 12). Node size reflects the nodes’ total number of connections, and colors indicate the network in which the nodes are more highly connected (mCLL: blue; uCLL: orange). c) Relative change in the number of connections between the mCLL and uCLL networks, showing all genes. d) Same as panel c, but focusing on 81 genes with a known role in B cell biology and/or CLL pathogene-sis.
15
Supplementary Information
Supplementary Table 1: Clinical annotations of the CLL patient cohort.
Clinical annotations for the patient samples that were analyzed in this study. All patients were diagnosed and treated at the Royal Bournemouth Hospital (UK).
Supplementary Table 2: Summary statistics of the sequencing experiments.
Sequencing statistics for 88 samples with ATAC-seq, 10 samples with ChIPmentation for three histone marks (H3K4me1, H3K27ac, H3K27me3) and one control (IgG), and 10 samples with RNA-seq.
Supplementary Figure 1: The cohort reflects a range of CLL phenotypes encountered in clinical care.
Visualization of clinical annotations for the patient samples that were analyzed in this study.
Supplementary Figure 2: Observed ATAC-seq fragment length distributions indicate high data quality.
Distribution of ATAC-seq fragment lengths for published GM12878 data12 and for four randomly selected CLL samples from this study. Fragment lengths were inferred based on paired-end sequencing data. The characteristic patterns of nucleosome-associated fragment length are observed in all samples.
Supplementary Figure 3: Sequencing depth yields the majority of ATAC peaks detectable in each sample.
Relationship of the number of sequenced reads (x-axis) and the number of detected chromatin-accessible regions (y-axis), showing the average pattern across all 88 samples (blue line). The corridor indicated in green corre-sponds to a 95% confidence interval for random subsampling across samples.
Supplementary Figure 4: Chromatin-accessible regions in CLL are enriched for promoters and enhancers.
a) Histogram showing the number of samples in which a given chromatin-accessible region from the CLL con-sensus map was detected as a significant ATAC-seq peak. b) Frequency and enrichment of overlap with Ensembl gene annotation for regions in the CLL consensus map, compared to region sets of identical size and lengths that were randomized 1,000 times across the genome. c) Frequency and enrichment of overlap with chromatin state segmentations for CD19+ B cells (data from the Roadmap Epigenomics project), compared to region sets of identical size and lengths that were randomized 1,000 times across the genome.
Supplementary Figure 5: Heterogeneity in chromatin accessibility affects genes related to B cells and CLL.
a) Histogram showing the percentage of chromatin-accessible regions that are shared between any two CLL samples. b) Distribution of variance in chromatin accessibility for promoter regions and putative distal regulatory regions across all genes (grey) and for a set of 81 genes with a known role in B cell biology and/or CLL patho-genesis (blue/green). Chromatin accessibility scores were averaged across all regulatory regions assigned to a
16
given gene. c) Violin plots of normalized chromatin accessibility values for gene promoters (regions located within 2,500 basepairs of the transcription start site) and distal regulatory elements (regions located at least 2,500 basepairs away from the nearest transcription start site) for the same 81 genes as in panel b).
Supplementary Figure 6: Unsupervised analysis identifies IGHV mutation status as a key source of varia-tion.
Principal component analysis based on the chromatin accessibility for all 88 samples at each of the 112,298 chromatin-accessible regions in the CLL cohort. The first five principal components are plotted, and samples are colored according to clinical annotations and molecular diagnostics data (top four rows) as well as the sample processing batch for the ATAC-seq experiments (bottom row).
Supplementary Figure 7: Chromatin accessibility is linked to gene expression and differential methylation.
a) Hexbin scatterplot showing a weak correlation (Pearson’s r = 0.33) between gene expression levels and chro-matin accessibility values at associated regulatory regions, averaging across ten samples with matched ATAC-seq and RNA-seq data. The color gradient is on a logarithmic scale. b) Pearson correlation (top) and significance of the association (bottom) between gene expression levels and chromatin accessibility values at associated regu-latory regions, plotted over the distance of the accessible region to the gene’s transcription start site. c) Mean chromatin accessibility across regulatory regions associated with genes that were upregulated in IGHV-mutated or in IGHV-unmutated CLL. d) Mean chromatin accessibility across regulatory regions overlapping with regions that were hypermethylated in IGHV-mutated or in IGHV-unmutated CLL20.
Supplementary Figure 8: Subtype-specific variable regions show characteristic enrichment patterns.
a) Scatterplot of the change in variance-to-mean ratio in chromatin-accessible regions between the mCLL and uCLL sample groups (x-axis) and the significance of variability of each region within each group (y-axis). Blue and orange dots indicate significantly variable regions each of the two sample group. b) Scatterplots of mean ac-cessibility (left) and variance-to-mean ratio within each sample group (right). The plot on the left illustrates how significantly variable regions are dispersed across the accessibility range and are thus not strongly coupled with differences in mean accessibility between the groups. The color coding is the same as in panel a). c) Most highly enriched region sets that significantly overlap with the differentially variable regions for mCLL (blue) and for uCLL (orange), based on LOLA analysis.
Supplementary Figure 9: Clustering on mCLL/uCLL signature regions reflects IGHV mutation status.
Hierarchical clustering of all CLL samples based on sample-wise correlation of chromatin accessibility for the most discriminatory regions identified between the IGHV-mutated and the IGHV-unmutated disease subtype, complemented by clinical annotations and linking samples from the same patient (curved black lines).
Supplementary Figure 10: mCLL/uCLL signature regions show characteristic histone/expression patterns.
a) Hierarchical clustering and heatmap visualizing the ChIPmentation signal for three histone marks (H3K4me1, H3K27ac, H3K27me3) in ten CLL samples comprising three disease subtypes (mCLL, iCLL, uCLL). Regulatory regions were selected and sorted in the same way as in Figure 3c. b) Violin plots showing the distribution of
17
ChIPmentation levels for each histone mark in the same regulatory regions as in panel a, grouped by disease sub-type. c) Violin plots showing the ratio between the ChIPmentation signal for histone marks associated with active (H3K4me1, H3K27ac) over repressed (H3K27me3) chromatin. d) Mean gene expression values for genes asso-ciated with the regulatory regions from panel a, grouped by disease subtype. e) Boxplot showing the fold change of genes associated with regulatory elements in cluster 1 (mCLL regions) over genes associated with cluster 2 (uCLL regions), again grouped by disease subtypes. In all panels, significance was assessed using the Mann-Whitney U test, and comparisons with p-values above 0.05 were labeled as not significant (n.s.).
Supplementary Figure 11: Transcription factor footprints for ATAC-seq and DNase-seq are similar.
Footprinting diagrams showing the frequency of Tn5 transposase insertion events (for ATAC-seq) and DNase I cutting sites (for DNase-seq, based on data for CD19+ B cells from the Roadmap Epigenomics project) across a 500 basepair window around motifs of transcription factors involved in B cell development.
Gene regulatory network of CLL inferred from footprint predictions of transcription factor binding, based on the ATAC-seq data of all CLL samples. Only nodes with more than 200 connections are displayed.
Supplementary Figure 13: B cell (DNase-seq) and CLL (ATAC-seq) networks share similar properties.
a) Structural characteristics of transcription factor nodes in gene regulatory networks inferred from ATAC-seq data for the CLL cohort and from DNase-seq data for CD19+ B cells. b) Number of connections for all genes in the two gene regulatory networks (transcription factors are shown in red).
Supplementary Figure 14: Gene regulatory networks for mCLL and uCLL samples are globally similar.
Gene regulatory networks inferred based on the IGHV-unmutated samples (uCLL, left) and based on the IGHV-mutated samples (mCLL, right). Only nodes with more than 200 are displayed.
a) Violin plots showing the distribution of ChIPmentation levels for each histone mark in regulatory regions as-sociated with genes that are differentially connected between the subtype-specific networks. b) Violin plots showing the ratio between the ChIPmentation signal for histone marks associated with active (H3K4me1, H3K27ac) over repressed (H3K27me3) chromatin. c) Subnetworks with the neighbors of PAX9 and CD22, shown separately for the mCLL and uCLL networks. Edge widths indicate the strength of the connection as measured by the interaction score. d) ATAC-seq and ChIPmentation signal for three histone marks at representa-tive differentially connected genes between the mCLL and uCLL networks. In panel a and b, significance was assessed using the Mann-Whitney U test, and comparisons with p-values above 0.05 were labeled as not signifi-cant (n.s.).
2. Zenz T, Mertens D, Kuppers R, Dohner H, Stilgenbauer S. From pathogenesis to treatment of chronic
lymphocytic leukaemia. Nat Rev Cancer 10, 37-50 (2010). 3. Damle RN, et al. Ig V gene mutation status and CD38 expression as novel prognostic indicators in chronic
lymphocytic leukemia. Blood 94, 1840-1847 (1999). 4. Hamblin TJ, Davis Z, Gardiner A, Oscier DG, Stevenson FK. Unmutated Ig V(H) genes are associated with
a more aggressive form of chronic lymphocytic leukemia. Blood 94, 1848-1854 (1999). 5. Tobin G, et al. Somatically mutated Ig V(H)3-21 genes characterize a new subset of chronic lymphocytic
leukemia. Blood 99, 2262-2264 (2002). 6. Agathangelidis A, et al. Stereotyped B-cell receptors in one-third of chronic lymphocytic leukemia: a
molecular classification with implications for targeted therapies. Blood 119, 4467-4475 (2012). 7. Rossi D, et al. Stereotyped B-cell receptor is an independent risk factor of chronic lymphocytic leukemia
transformation to Richter syndrome. Clin Cancer Res 15, 4415-4422 (2009). 8. Di Giovanni S, Valentini G, Carducci P, Giallonardo P. Beta-2-microglobulin is a reliable tumor marker in
chronic lymphocytic leukemia. Acta Haematol 81, 181-185 (1989). 9. Hallek M, et al. Elevated serum thymidine kinase levels identify a subgroup at high risk of disease
progression in early, nonsmoldering chronic lymphocytic leukemia. Blood 93, 1732-1737 (1999). 10. Dohner H, et al. Genomic aberrations and survival in chronic lymphocytic leukemia. N Engl J Med 343,
1910-1916 (2000). 11. Rossi D, et al. Integrated mutational and cytogenetic analysis identifies new prognostic subgroups in chronic
336 (2015). 13. Oscier DG, et al. The clinical significance of NOTCH1 and SF3B1 mutations in the UK LRF CLL4 trial.
Blood 121, 468-475 (2013). 14. Stilgenbauer S, et al. Gene mutations and treatment outcome in chronic lymphocytic leukemia: results from
the CLL8 trial. Blood 123, 3247-3254 (2014). 15. Crespo M, et al. ZAP-70 expression as a surrogate for immunoglobulin-variable-region mutations in chronic
lymphocytic leukemia. N Engl J Med 348, 1764-1775 (2003). 16. Ferreira PG, et al. Transcriptome characterization by RNA sequencing identifies a major molecular and
clinical subdivision in chronic lymphocytic leukemia. Genome Res 24, 212-226 (2014). 17. Landau DA, et al. Mutations driving CLL and their evolution in progression and relapse. Nature 526, 525-
530 (2015).
19
18. Puente XS, et al. Non-coding recurrent mutations in chronic lymphocytic leukaemia. Nature 526, 519-524 (2015).
19. Lawrence MS, et al. Mutational heterogeneity in cancer and the search for new cancer-associated genes.
Nature 499, 214-218 (2013). 20. Kulis M, et al. Epigenomic analysis detects widespread gene-body DNA hypomethylation in chronic
lymphocytic leukemia. Nat Genet 44, 1236-1242 (2012). 21. Landau DA, et al. Locally disordered methylation forms the basis of intratumor methylome variation in
chronic lymphocytic leukemia. Cancer Cell 26, 813-825 (2014). 22. Oakes CC, et al. Evolution of DNA methylation is linked to genetic aberrations in chronic lymphocytic
leukemia. Cancer Discov 4, 348-361 (2014). 23. Queiros AC, et al. A B-cell epigenetic signature defines three biologic subgroups of chronic lymphocytic
leukemia with clinical impact. Leukemia 29, 598-605 (2015). 24. Baylin SB, Jones PA. A decade of exploring the cancer epigenome - biological and translational
implications. Nat Rev Cancer 11, 726-734 (2011). 25. Buenrostro JD, Giresi PG, Zaba LC, Chang HY, Greenleaf WJ. Transposition of native chromatin for fast
and sensitive epigenomic profiling of open chromatin, DNA-binding proteins and nucleosome position. Nat Methods 10, 1213-1218 (2013).
26. Schmidl C, Rendeiro AF, Sheffield NC, Bock C. ChIPmentation: fast, robust, low-input ChIP-seq for
histones and transcription factors. Nat Methods 12, 963-965 (2015). 27. Risca VI, Greenleaf WJ. Unraveling the 3D genome: genomics tools for multiscale exploration. Trends
Genet 31, 357-372 (2015). 28. Kundaje A, et al. Integrative analysis of 111 reference human epigenomes. Nature 518, 317-330 (2015). 29. Stevenson FK, Krysov S, Davies AJ, Steele AJ, Packham G. B-cell receptor signaling in chronic
lymphocytic leukemia. Blood 118, 4313-4320 (2011). 30. Ecker S, Pancaldi V, Rico D, Valencia A. Higher gene expression variability in the more aggressive subtype
of chronic lymphocytic leukemia. Genome Med 7, 8 (2015). 31. Sheffield NC, Bock C. LOLA: enrichment analysis for genomic region sets and regulatory elements in R and
Bioconductor. Bioinformatics 32, 587-589 (2016). 32. Morabito F, et al. Surrogate molecular markers for IGHV mutational status in chronic lymphocytic leukemia
for predicting time to first treatment. Leuk Res 39, 840-845 (2015). 33. Nikitin EA, et al. Expression level of lipoprotein lipase and dystrophin genes predict survival in B-cell
chronic lymphocytic leukemia. Leuk Lymphoma 48, 912-922 (2007). 34. Forconi F, et al. The normal IGHV1-69-derived B-cell repertoire contains stereotypic patterns characteristic
of unmutated CLL. Blood 115, 71-77 (2010). 35. Mathelier A, et al. JASPAR 2016: a major expansion and update of the open-access database of transcription
36. Alizadeh AA, et al. Toward understanding and exploiting tumor heterogeneity. Nat Med 21, 846-853 (2015). 37. Sung MH, Baek S, Hager GL. Genome-wide footprinting: ready for prime time? Nat Methods 13, 222-228
(2016). 38. Rosati E, et al. Constitutively activated Notch signaling is involved in survival and apoptosis resistance of B-
CLL cells. Blood 113, 856-865 (2009). 39. Tomic J, Lichty B, Spaner DE. Aberrant interferon-signaling is associated with aggressive chronic
lymphocytic leukemia. Blood 117, 2668-2680 (2011). 40. Mittal AK, et al. Role of CTLA4 in the proliferation and survival of chronic lymphocytic leukemia. PLoS
One 8, e70352 (2013). 41. Basso K, Margolin AA, Stolovitzky G, Klein U, Dalla-Favera R, Califano A. Reverse engineering of
regulatory networks in human B cells. Nat Genet 37, 382-390 (2005). 42. Lefebvre C, et al. A human B-cell interactome identifies MYB and FOXM1 as master regulators of
proliferation in germinal centers. Mol Syst Biol 6, 377 (2010). 43. Yepes S, Torres MM, Lopez-Kleine L. Regulatory network reconstruction reveals genes with prognostic
value for chronic lymphocytic leukemia. BMC Genomics 16, 1002 (2015). 44. Bock C, et al. Reference Maps of human ES and iPS cell variation enable high-throughput characterization
of pluripotent cell lines. Cell 144, 439-452 (2011). 45. Buenrostro JD, et al. Single-cell chromatin accessibility reveals principles of regulatory variation. Nature
523, 486-490 (2015). 46. Jin W, et al. Genome-wide detection of DNase I hypersensitive sites in single cells and FFPE tissue samples.
Nature 528, 142-146 (2015). 47. Jiang H, Lei R, Ding SW, Zhu S. Skewer: a fast and accurate adapter trimmer for next-generation
sequencing paired-end reads. BMC Bioinformatics 15, 182 (2014). 48. Langmead B, Salzberg SL. Fast gapped-read alignment with Bowtie 2. Nat Methods 9, 357-359 (2012). 49. Tarasov A, Vilella AJ, Cuppen E, Nijman IJ, Prins P. Sambamba: fast processing of NGS alignment formats.
Bioinformatics 31, 2032-2034 (2015). 50. Quinlan AR, Hall IM. BEDTools: a flexible suite of utilities for comparing genomic features. Bioinformatics
26, 841-842 (2010). 51. Zhang Y, et al. Model-based analysis of ChIP-Seq (MACS). Genome Biol 9, R137 (2008). 52. Hoffman MM, et al. Integrative annotation of chromatin elements from ENCODE data. Nucleic Acids Res
41, 827-841 (2013). 53. Bolger AM, Lohse M, Usadel B. Trimmomatic: a flexible trimmer for Illumina sequence data.
Bioinformatics 30, 2114-2120 (2014).
21
54. Langmead B, Trapnell C, Pop M, Salzberg SL. Ultrafast and memory-efficient alignment of short DNA sequences to the human genome. Genome Biol 10, R25 (2009).
55. Glaus P, Honkela A, Rattray M. Identifying differentially expressed transcripts from RNA-seq data with
biological variation. Bioinformatics 28, 1721-1728 (2012). 56. Love MI, Huber W, Anders S. Moderated estimation of fold change and dispersion for RNA-seq data with
DESeq2. Genome Biol 15, 550 (2014). 57. Ernst J, Kellis M. Large-scale imputation of epigenomic datasets for systematic annotation of diverse human
tissues. Nat Biotechnol 33, 364-376 (2015). 58. Rosenbloom KR, et al. The UCSC Genome Browser database: 2015 update. Nucleic Acids Res 43, D670-
681 (2015). 59. Pedregosa F, et al. Scikit-learn: Machine learning in Python. The Journal of Machine Learning Research 12,
2825-2830 (2011). 60. Sheffield NC, et al. Patterns of regulatory activity across diverse human cell types predict tissue identity,
transcription factor binding, and long-range interactions. Genome Res 23, 777-788 (2013). 61. Sanchez-Castillo M, et al. CODEX: a next-generation sequencing experiment database for the
haematopoietic and embryonic stem cell communities. Nucleic Acids Res 43, D1117-1123 (2015). 62. Liu T, et al. Cistrome: an integrative platform for transcriptional regulation studies. Genome Biol 12, R83
(2011). 63. Adams D, et al. BLUEPRINT to decode the epigenetic signature written in blood. Nat Biotechnol 30, 224-
226 (2012). 64. Wang B, Cunningham JM, Yang XH. Seq2pathway: an R/Bioconductor package for pathway analysis of
next-generation sequencing data. Bioinformatics 31, 3043-3045 (2015). 65. Sherwood RI, et al. Discovery of directional and nondirectional pioneer transcription factors by modeling
DNase profile magnitude and shape. Nat Biotechnol 32, 171-178 (2014). 66. Qu K, et al. Individuality and variation of personal regulomes in primary human T cells. Cell Syst 1, 51-61
(2015). 67. Hagberg AA, Schult DA, Swart PJ. Exploring network structure, dynamics, and function using NetworkX.
In: Proceedings of the 7th Python in Science Conference. eds Varoquaux G, Vaught T, Millman J (2008).