Chromatographic and Spectroscopic Characterization of Surfactants used for Agrochemical Products Dissertation zur Erlangung des akademischen Grades eines Doktors der Naturwissenschaften – Dr. rer. nat. – vorgelegt von Johannes Klaus Glaubitz geboren in Roth (Bayern) Fakultät für Chemie der Universität Duisburg-Essen 2014
Transcript
Chromatographic and Spectroscopic Characterization of
Surfactants used for Agrochemical Products
Dissertation
zur Erlangung des akademischen Grades eines
Doktors der Naturwissenschaften
– Dr. rer. nat. –
vorgelegt von
Johannes Klaus Glaubitz
geboren in Roth (Bayern)
Fakultät für Chemie
der
Universität Duisburg-Essen
2014
Die vorliegende Arbeit wurde im Zeitraum von November 2010 bis März 2014 im Arbeitskreis von Prof. Dr.
Torsten C. Schmidt in der Fakultät für Chemie der Universität Duisburg-Essen durchgeführt.
Tag der Disputation: 14.07.2014
Gutachter: Prof. Dr. Torsten C. Schmidt
Prof. Dr. Karl Molt
Vorsitzender: Prof. Dr. Jochen S. Gutmann
Für meinen kleinen Sohn
Abstract
IV
Abstract Surfactants are key compounds in agrochemical products that ensure properties such as viscosity, dispersity or
homogeneity and are assisting the homogenous distribution of the active ingredient(s) over the target crop or
promoting its uptake by the plant. There is limited knowledge, however, about the influence of by-products and
impurities in a technical surfactant on the properties of the final product. In this context commercial available
products of sodium bis(2-ethylhexyl) sulfosuccinate (AOT; anionic) and tristyrylphenol ethoxylates with an
average number of 16 ethylene oxide units (TSP-16-ethoxylates; nonionic) - commonly used surfactants in
agrochemical products - were investigated for their content of by-products.
The by-products investigated for AOT were its isomeric surface-active mono-esterified sulfosuccinates. An
analytical method based on liquid chromatography coupled to time of flight mass spectrometry (LC-ToF-MS)
with exact mass measurement was developed to quantify main and by-products in AOT-product. An isomer-
selective synthesis for both monoesters was developed for validation of the developed method. Significant
differences were observed regarding the content of monoesters among four different suppliers and qualities of
AOT-product. A storage stability test performed with a model agrochemical formulation using AOT-product
showed decreasing dispersion stability with raised initial content of monoesters. The differences in monoester
content were then used for product identification. This could be utilized as additional tool in detection of
counterfeit products, as the supplier of the AOT-product in the original agrochemical product is known a priory.
TSP-16-ethoylates were analytically characterized by quantifying all major styrenated ethoxylates against an
internal standard using targeted LC-ToF-MS with exact mass measurement in combination with multivariate
data analysis. Four suppliers and qualities were analyzed and compared with regard to their content of these
styrenated ethoxylates. Significant differences were found between the suppliers based on the content of mono-
and tetrastyrylphenol ethoxylates and mono- and distyrylphenol copolymerized propoxylates-ethoxylates, which
were successfully utilized for supplier identification.
Analytical characterization and control of surfactants may be a useful tool to avoid unwanted property changes
in complex mixtures such as agrochemical products. Moreover, small variations in the composition of
surfactants offer further opportunities for identification of counterfeit products.
Future investigations could address the mode of action leading to raised sedimentation in an agrochemical
product using AOT with raised content of monoesters. Furthermore, it should be investigated if the method
Abstract
V
developed for the characterization of TSP-16-ethoxylatesylates can be adapted to other ethoxylated surfactants
and analytes with a comparably broad composition of main and by-products.
Kurzfassung
VI
Kurzfassung Tenside sind Schlüsselkomponenten für Pestizide, die für Produkteigenschaften wie Viskosität,
Dispersionsstabilität und Homogenität verantwortlich sind und dabei helfen, den Wirkstoff gleichmäßig auf dem
Feld zu verteilen und seine Aufnahme in die Pflanze zu erleichtern. Über den Einfluss von Nebenprodukten und
Verunreinigungen in technischen Tensiden auf die Eigenschaften des finalen Produkts ist bisher wenig bekannt.
In diesem Zusammenhang wurde das Nebenproduktspektrum kommerziell erhältlicher Tenside, Natrium di(2-
ethylhexyl) sulfosuccinate (AOT; anionisch) und Tristyrylphenol mit einem mittleren Ethoxylierungsgrad von
2.4 Results and Discussion ________________________________________________ 29 2.4.1 Determination of AOT and both isomeric Monoesters 2 and 3 __________________________ 29
2.4.2 Determination of AOT and both isomeric Monoesters 2 and 3 __________________________ 32
2.4.3 Comparison of three different Suppliers of AOT Product______________________________ 34
3.3.5 Statistical Data Evaluation _____________________________________________________ 44
3.4 Results and Discussion ________________________________________________ 45 3.4.1 Contents of AOT and Monoesters 2 and 3 in Batches of AOT Product from various Suppliers 45
3.4.2 Statistical Evaluation of the Contents of AOT, Monoester 2, and Monoester 3 with regard to their
use for product identification ___________________________________________________ 52
6.3.8 Reference List ______________________________________________________________ 136
6.4 Analytical Characterization and Comparison of Tristyrylphenol Ethoxylates used in Agrochemical Formulation _________________________________________ 137
6.4.1 Sample for Testing on Mass Calibration of ToF-MS ________________________________ 137
6.4.2 Comparison of the Ionization Performance of APPI and ESI for the Analysis of TSP-40-
TSP-16-ethoxylates Tristyrylphenol ethoxylates with an average degree of ethoxylation of 16 ethylene
oxide units
t-test Statistical hypothesis test based on the Student's t distribution under the null
hypothesis
u Standard uncertainty of the average values
U Expanded measurement uncertainty
UV Ultraviolet
V Volt
v/v Volume to volume ratio
Vx0 Relative standard deviation of the method
w Weight
w/w Weight to weight ratio
List of Figures
XVII
List of Figures Figure 1: General molecular set-up of a surfactant molecule ........................................................................... 1
Figure 2: Schematic display of the different forms of surfactant aggregates depending on the value of the
Nonionic surfactants commonly have a polyethylene oxide chain as hydrophilic group bound via either hydroxyl
or carboxyl groups or primary or secondary amines to various hydrocarbons. For the synthesis of nonionic
surfactants the hydroxyl group is functionalized with ethylene oxide either by base or acid catalysis. In the
following Figure 7 a base catalyzed polymerization is shown.
ROH NaOH
CH2 CH2
O
CH2 CH2
O
+ RO- Na+ + H2O
RO- Na+ + ROCH2CH2O- Na+
ROCH2CH2O- Na+ + ROCH2CH2OCH2CH2O- Na+
Figure 7: Scheme of synthesis of nonionic surfactants [16]
As a result of the polymerization reaction a mixture of homologues with different degrees of ethoxylation is
obtained. In addition to the reaction conditions, the distribution of products depends on the acidity of the
hydroxyl group. For less acidic hydroxyl groups such as of alcohols or sugars unreacted starting material
remains and has to be removed afterwards. Besides, polyethylene glycol is formed in all cases, which may be
necessary or unwanted depending on the application [17].
For phenol derivatives, such as the tristyrylphenol (TSP), the acidity of the hydroxyl group (pKa (TSP) = 11.0) is
higher than the acidity of the hydroxyl group of the already reacted phenol ethoxylates. As a consequence, the
addition of polyethylene oxide to phenol is thermodynamically favored over the addition to already reacted
phenol ethoxylate so that no residual phenol remains after polymerization [17-19]. The starting material,
however, may have different qualities, comprising a variable number of styrenes bound to the phenol group.
Therefore, a complex mixture of different molecules is expected as shown in Figure 8.
OO
Hn
CH3
*
m
m=1-4
n=5-29
Figure 8: Structure of commercially available tristyrylphenol (m=3) with an average number of ethylene
oxide of n = 16.
General Introduction
9
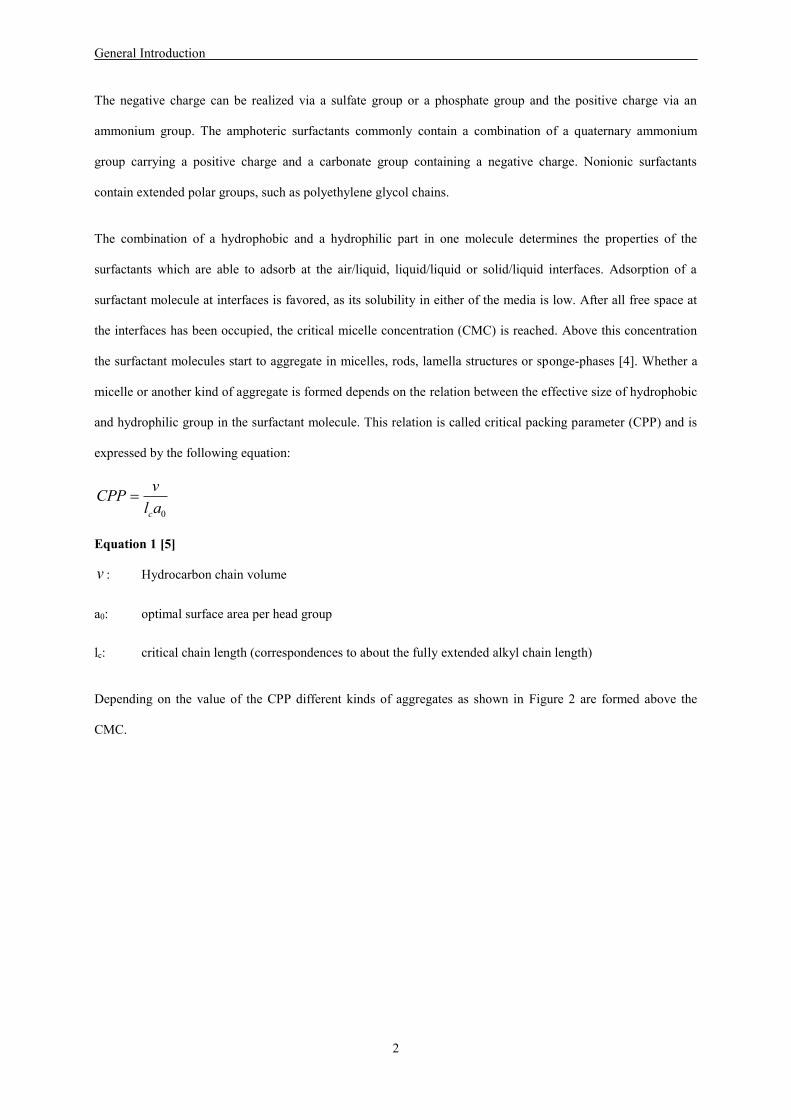
1.3 Agrochemical Formulations
Agrochemical formulations are mixtures of one or more active ingredient(s) (a.i.) and inerts such as surfactants,
solvents, defoamer, stabilizer and partially sticker among others, which are added to provide stable and well
applicable products. Depending on the physico-chemical properties of the a.i. different forms of formulations can
be developed. Typical ones are emulsion concentrates (EC) and suspension concentrates (SC) [20]. EC are
chosen for an a.i. which has a high solubility in organic solvent and a good stability against chemical
transformation (e.g., by hydrolysis, oxidation, etc.). For an a.i. with poor solubility in water and organic solvents
or when stability against chemical transformation is limited, a SC is a better choice. For this purpose the a.i. has
to be milled (micronized) to achieve particle sizes in the micrometer scale in order to ensure uniform distribution
of the a.i. in the final product. As the a.i. is not dissolved, chemical reactivity and chemical transformation is
reduced. Nevertheless the micronized a.i. particles have to be stabilized against agglomeration or sedimentation
in the formulation. Agglomeration can be prevented by using surfactants which adsorb to the interface of particle
and media and thus build up a barrier against agglomeration of the a.i. particles. For this purpose usually large
polymeric surfactants are used, which are also kinetically hindered in their adsorption-desorption processes due
to their structure. This further stabilizes the barrier and moreover hampers crystal growth of the particles [3].
Whereas for larger particles the surfactant is adsorbing at the particle surface smaller particles may be
solubilized within formed micelles, because the hydrophobic hydrocarbon chains act as a liquid in which the a.i.
is solved [4;21]. The viscosity of the formulation can be adjusted against sedimentation via thickeners or gelling
agents, slowing the sedimentation processes to an acceptable degree. In addition to the function to preserve the
a.i. and the agrochemical product against degradation or unwanted changes in its rheological properties
surfactants have the task to enable homogenous distribution of the a.i. in the spraying liquid. For this task
wetting agents are used that spontaneously adsorb to the interface of the a.i. particles during the mixing process
thus making them dispersible in the aqueous continuous phase of the spraying liquid. Moreover, some
surfactants have the ability to facilitate the uptake of the a.i. by the plants. Thereby they are assisted by solvents
tailored to dissolve the a.i. and lead to swelling the waxy layer of the leaf surface thus allowing the migration of
the a.i. from the leaf surface into the cuticle and then into the plant [3].
All in all, the formulation has the task to preserve the a.i. until its use, to ensure maximum homogeneity of a.i. in
the final application and to enhance its performance, e.g., by promoting its uptake by the plant. As described this
is achieved with various surface active agents specialized for their specific task. The selection of a.i.(s) and inerts
has to consider all these requirements, and in addition their potential interaction in the formulation. Some of the
effects such as solubility may be anticipated, others may only be elucidated during storage test, such as chemical
General Introduction
10
stability of the a.i.(s) or long term processes such as sedimentation in a SC or coalescence of emulsion droplets
in EC [22;23]. Nevertheless, “to date, such a choice is made by trial and error procedure ” [24] and setting-up an
agrochemical formulation requires experience paired with theoretical knowledge of colloid chemistry [18].
1.4 Analysis of Surfactants
The various tasks surfactants are prepared for require defined production quality and their control. In order to
control and monitor the composition and content of the actual surfactant, analytical methods are necessary.
For ethoxylated surfactants there is no analytical standard available for each single component. In consequence,
quantitative methods rather focus on determining a sum parameter than the quantitative content of the single
components. One possibility to determine the total content of a nonionic surfactant is using modified
Dragendorff reagent to precipitate the ethoxylated surfactant with electrochemical quantification of the
precipitate. The use of this method has been described for example for the determination of the total amount of
nonionic surfactants in waste water, however not for agrochemical formulations [25-27].
Another approach is the identification and determination of the single ethoxylated entities. For separation of the
single components several techniques are available. One of the earlier ones is thin layer chromatography, which
separates the ethoxylated surfactant either according to the hydrophobic hydrocarbon group using a reversed
phase stationary phase or according to the degree of ethoxylation using a normal phase. For detection staining
derivates with ultraviolet(UV)-active groups have to be used [28;29].
For nonionic surfactants with lower degree of ethoxylation separation via gas chromatography (GC) and
detection either via flame ionization detector (FID) or mass spectrometry (MS) is possible. As the FID is
considered a universal detector because its response depends mainly on the number of carbon atoms in the
analyte the quantitative distribution of the single ethoxylates can be estimated without the use of an analytical
standard [30-32]. The detection via MS provides structural information for the respective component, which
enables structure elucidation. The signal response, however, is very dependent on the components structure [33].
Using liquid chromatography (LC) nonionic surfactants with a higher degree of ethoxylation can be analyzed
which are not accessible to the analysis via GC. Separation according to the degree of ethoxylation can be
achieved via normal phase-liquid chromatography (NP-LC) [34] or via hydrophilic interaction liquid
chromatography (HILIC) [35]. Both have highly polar stationary phases, which interact with the hydrophilic
polyethylene chain. In case of HILIC the mode of separation is partition chromatography between an
immobilized ionic aqueous stationary phase and an organic mobile phase, such as acetonitrile. The aqueous
General Introduction
11
phase is formed by water molecules which adsorb to a hydrophilic stationary phase formed for example by
amphoteric surfactants bound to porous silica. To sustain the aqueous phase the mobile phase consists of a
organic/aqueous mixture with a ratio of at least 9:1 (v/v). Typically, the aqueous phases have a salt concentration
of 5-20 mM, in order to avoid peak tailing [36]. Separation according to the hydrocarbon chain is achieved via
reversed phase liquid chromatography (RP-LC) [37-40]. Another possibility to chromatographically separate
according to the degree of ethoxylation and/or the hydrophobic group is liquid adsorption chromatography
(LAC). The separation here is determined by the number of repeating structural units adsorbing to the stationary
phase. In combination with size exclusion chromatography (SEC) liquid exclusion adsorption chromatography
(LEAC) is possible which allows separation of ethoxylated surfactants under isocratic conditions. Isocratic
elution is mandatory to enable quantitative determination of the different degrees of ethoxylation for a nonionic
surfactant via universal detectors such as refractive index in combination with an evaporation light scattering
detector (ELSD). For such quantification the full chromatographic separation of the single compounds is
necessary, which is possible for binary nonionic surfactant mixtures but has not been demonstrated for complex
mixtures such as agrochemical formulations [41-45]. Qualitative information in complex samples such as
cleaning agents with mixtures of different nonionic surfactants can be provided via 2-dimensional liquid-
chromatography with mass spectrometric detection [46]. Using either MS-MS or Time-of-Flight MS (ToF-MS)
both techniques are more sensitive than for example ELSD or UV-detectors and enable identification via the
(exact) molecular mass and/or specific fragments [31;38;47;48].
For anionic surfactants, such as sodium bis(2-ethylhexyl) sulfosuccinate, there are several methods known using
RP-LC either coupled to UV-VIS-, ELSD, MS or due to the carried charge also electrochemical detectors [49-
52]. Ionic surfactants in principle can also be analyzed using ion chromatography [53] or capillary
electrophorese [54].
In this work RP-LC coupled to ToF-MS with exact mass measurement was used for analysis of both the anionic
and the nonionic surfactants. Some instrument characteristics are described in the following. The coupling of LC
to MS is the most powerful tool for the analysis of surfactants. Using ToF-MS with exact mass measurement
further enables structure elucidation for yet unknown compounds and identification of known ones. For
identification of by-products and characterisation of the surfactant, ToF-MS with exact mass measurement was
the instrument of choice for this work.
Reversed phase liquid chromatography was chosen to ensure separation according to the length of the alkyl
chain and the coupling to the MS was performed via atmospheric pressure chemical ionization (APCI),
General Introduction
12
electrospray ionisation (ESI) and atmospheric pressure photoionization (APPI). The set-up of these three
ionisation devices is shown in Figure 9.
(a) (b)
(c)
Figure 9: Schematic set-up of APCI (a), ESI (b) and APPI (c) [55]
In APCI the LC-eluent is nebulized with nitrogen gas into a heated tube. The eluent is evaporated and the analyte
is carried by the gas flow through the column. There the analyte is ionized by a plasma of solvent molecules
created by the discharge of the corona needle.
In ESI the eluent droplets are charged during the nebulization process at the tip of the nebulizing needle. In the
spray cone, the so called Taylor-cone, the charge is transferred onto the surface of the solvent droplets as they
form. As these are dried on their passage with a hot nitrogen stream, the charge is confined to the shrinking
droplet surface, causing a further atomizing of the droplet. During this process the electric repulsion on the
droplet surface is surpassing the surface tension and cohesion among the solvent molecules in the droplet.
Finally, the charge is transferred to the analyte molecule itself.
General Introduction
13
In APPI the set-up of the nebulization process is the same as for ESI. The ionization however is carried out via a
krypton UV-lamp emitting photons with an energy of about 10 eV. These are able to interact with molecules
having conjugated π-systems such as aromatic rings only. For analytes without such π-systems incorporated
modifiers like toluene have to be used, which then transfer the charge to the analyte [56].
The ionization depends on the chosen device. APCI is leading to more in-source fragmentation and less adducts
for example for nonionic surfactants [57], ESI is producing more adducts and multiple charged entities, which is
especially used for protein and polymer analysis. APPI can be very sensitive for aromatic compounds, however,
it needs modifiers for analytes without conjugated π-systems.
The formed ions are guided into the MS via a series of orifices and electromagnetic lenses. These orifices are
shaped in a way to ensure low pressure inside the MS-instrument, but also to allow entrance of ionized
molecules. The lenses are creating a focused ion beam which is then accelerated into the time of flight tube by
the ion pulser as shown in Figure 10.
Figure 10: Scheme of a ToF mass spectrometer with highlighted ion flight path and length of transients,
respectively [58].
The measurement is realized over the time of flight for different molecules. Every molecule is pushed with the
same impulse and according to Equation 2 with given impulse p, time of travel t and the flight path the actual
m/z-value for the respective ion is determined
General Introduction
14
stpzm /
Equation 2
t: time of flight for the respective ion
m/z: m/z-value
s: flight path
p: pushing impulse
This kind of mass spectrometry depends on the accuracy of time measurement. The better the resolution for time
measurement, the smaller differences between analyte masses can be resolved. Another important part is the
accuracy of mass measurement. This delta is calculated according to Equation 3, and gives the relative difference
between the exact and the actually measured mass [59;60].
610/
//
exact
exactmeasured
zmzmzmppm
Equation 3:
ppm : Relative delta value as parts per million between actual and measured mass
m/zmeasured: measured mass
m/zactual: actual exact mass
To achieve an acceptable accuracy the ToF-MS has to be mass calibrated daily and corrected during
measurements against at least two reference masses, to compensate for differences in the extension of the flight
tube caused by temperature fluctuations during the day. The ToF-MS used for this work is able to perform exact
mass measurement with an accuracy below 1 ppm, which is often sufficient to determine the elemental formula
for an organic molecule detected [59;60].
Besides the mass accuracy the MS has to be able to resolve the given m/z-signal well enough to distinguish it
from other signals. Mass resolution is calculated according to Equation 4 using for m the full width at half
peak maximum (FWHM) also graphically shown in Figure 11 [61;62].
General Introduction
15
mmR
Equation 4:
R: resolution
m: actual m/z-value
m : full width at half peak maximum (FWHM)
Figure 11: Definition of m at full width at half peak maximum (FWHM) [62]
The instrument used in this work achieved a resolution of 10.000 at FWHM for a mass signal at m/z 200, which
was sufficient to perform exact mass measurements for this work.
General Introduction
16
1.5 Quality Control
The control of product quality is important for various areas and applications such as material control in
construction or mechanical engineering, control of food quality, quality control of pharmaceutical and
agrochemical products. These controls are necessary to avoid malfunction of products and in this course hazards
to environment, operators and consumers of the final products.
To conduct these controls instrumental analyses with various scopes have been established. For material analysis
such as for steel for construction there are different non-destructive techniques available, for example
electrochemical testing [63], magnetic resonance [64] or ultra-sonic testing [65]. Food quality can be tested for
example on hazardous or unwanted microorganism, which can be identified via specific DNA-sequences [66] or
their metabolism products via liquid chromatography coupled to fluorescence detection [67]. Also the
toxicologically relevant residues of agrochemical products in crops or pharmaceuticals used in livestock farming
have to be analytically monitored in the raw product and in the processed food [68;69]. For this purpose mainly
analytical methods using LC-MS [70] or LC-MS/MS [71;72] have been established.
Pharmaceutical and agrochemical products are commonly controlled for their content of the active ingredient(s)
in order to avoid over or under dosing on the target. Furthermore, the functionality of the final products over
time has to be controlled via storage tests. After the defined storage time, the content of active ingredient(s) and
parameters such as viscosity, dispersity or homogeneity of the final product are tested [22;23].
1.6 Anti-Counterfeiting
Anti-counterfeiting is concerning the monitoring and the control of the origins of raw materials and products.
This is necessary to avoid inferior quality or malfunction of the final product due to insufficient quality of the
raw product(s). Anti-counterfeited products can cause economic damage for the product manufacturer and pose
potential hazards to environment and consumer due to an altered choice of raw products. These raw products are
often cheaper surrogates which have neither been investigated with regard to their compatibility when used in
the product or on potential hazards nor been registered by the authorities.
There are various ways to identify counterfeited raw materials and products, such as specialized packing
materials [73] or radio frequency identification (RFID) [74]. Furthermore, bulk analysis of products with
spectroscopy techniques like near infrared (NIR) spectroscopy [75;76] or nuclear magnetic resonance (NMR)
General Introduction
17
spectroscopy [77] are used, which detect the spectroscopic fingerprint of a mixture. These fingerprints hold
unique features enabling the distinction between the original and the counterfeited product. As these techniques
are very sensitive to the chemical composition, they are at the same time very sensitive to non-chemical
influences such as grain size, morphology etc. Therefore they require time consuming calibration and constant
monitoring of these non-chemical features. Less sensitive to non-chemical influences are techniques focusing on
the nature and content of the active ingredients using for example LC-MS analysis of the by-product content of
the actual active ingredient in pharmaceutical products [78;79]. Amongst these the analysis of stable isotope
ratios via isotope ratio mass spectroscopy (IRMS) is an important technique. The potential use of this feature for
anti-counterfeiting has been demonstrated for the herbicide glyphosate [80] to distinguish between active
ingredient of the original manufacturer and of different counterfeited sources. The described techniques are also
applied to investigate the origin and nature of food raw products thus trying to identified faked beverages [81;82]
or not labeled additions of synthetic ingredients instead of natural ones, such as caffeine of synthetic or natural
origin [83].
1.7 Scope of the Thesis
In this work two commercially available surfactants commonly used in agrochemical products, sodium bis(2-
ethylhexyl) sulfosuccinate (anionic) and TSP-16-ethoxylates (nonionic), are analytically characterized with
regard to their main and by-products depending on their suppliers. Differences in by-product content between
suppliers, their use for product identification in the final agrochemical formulation and their impact on the
properties of the agrochemical formulation using the respective surfactant were investigated.
In chapter 2 the focus is on the development of an analytical method for the analysis of the anionic surfactant
sodium bis(2-ethylhexyl) sulfosuccinate, trade name Aerosol OT or AOT, and its two isomeric surface active
mono esterified by-products. As both monoesters are used as surfactants in other applications, their contents may
have potential influence on the properties of AOT and the agrochemical formulation using it. Analytical
standards for both by-products were prepared and the method validated according to DIN 32645 for all three
analytes using LC-ToF-MS with exact mass measurement.
In chapter 3 the differences regarding the content of the monoesters as by-products were investigated for four
different suppliers of AOT product with the analytical method developed in the previous chapter. The influence
of these differences in content of monoesters on the properties of a model agrochemical formulation was
General Introduction
18
explored using storage tests. The differences in the by-product content of AOT product of different suppliers
were statistically tested on their use as potential identifiers for anti-counterfeiting purposes in the raw product
and in an agrochemical product.
Chapter 4 focused on the development of an analytical method for the quantitative characterization of the
nonionic surfactant TSP-16-ethoxylates according to the content of its main and by-products. As a novel
approach a combination of instrumental analysis via LC-ToF-MS with exact mass measurement and multivariate
data analysis on the collected data was investigated as it is used in proteomics or metabolomics. Using this
method possible differences in the main and by-product content of TSP-16-ethoxylates of four different suppliers
and qualities were investigated and tested on statistical significance. Additionally, the use of these differences on
supplier identification for anti-counterfeiting in the tristyrylphenol ethoxylates raw product and in the final
agrochemical product using this nonionic surfactant was tested.
In chapter 5 general conclusions on the results and findings in this work are given together with an outlook on
the use of the developed techniques for future investigations.
General Introduction
19
1.8 Reference List
1. Tadros TF (2005) Role of Surfactants in Wetting, Spreading and Adhesion. In: Tadros TF (eds.) Applied Surfactants. Wiley-VCH Verlag GmbH & Co. KGaA, 335-397.
2. Pontzen R and Vermeer AWP (2012) New Formulation Developments. In: Jeschke P, Krämer W, Schrimer U, Witschel M (eds.) Modern Methods in Crop Protection Research. Wiley-VCH Verlag GmbH & Co. KGaA, 217-248.
Co. KGaA, 1-17. 10. Duan L, Tan T, Gao F, Zhou F, Li S, Tian X, Zhang M (2011) Plant growth regulator containing
prohexadione calcium and uniconazole. CN 10227346020110620. 11. Sasagawa M, Ueda N (2011) Granular bioactive compositions having polyurethane coated layers and
protective coated layers, and method for application. JP 201119542820100324. 12. Knieriem T, Ottillinger T (2010) Plant protection formulations comprising dimethomorph and
dithiocarbamate. WO 201006674420091208. 13. Ryu HR, Park HS (2010) Determination of Sodium Bis(2-ethylhexyl)Sulfosuccinate (AOT) Surfactant
with Liquid Chromatography: Comparative Study of Evaporative Light Scattering Detector, Ultraviolet Detector and Conductivity Detector. J Anal Sci & Technol 1:55-60.
14. Porter MR (1991) Anionics. In: Porter MR (eds.) Handbook of Surfactants. Springer US, 161. 15. Porter MR (1991) Anionics. In: Porter MR (eds.) Handbook of Surfactants. Springer US, 99-168. 16. Porter MR (1991) Non-ionics. In: Porter MR (eds.) Handbook of Surfactants. Springer US, 171. 17. Porter MR (1991) Non-ionics. In: Porter MR (eds.) Handbook of Surfactants. Springer US, 169-247. 18. Mollet H and Grubenmann A (2001) Formulationtechnology, Emulsions, Suspensions and Solid Forms.
22. Morrison EB (1970) Accelerated storage test using a programmed temperature rise. Pestic Sci 1:268-269 23. Rogers AR (1970) A Review on accelerated chemical tests. Pestic Sci 1:266-268. 24. Tadros TF (2005) Applications of Surfactants in Agrochemicals. In: Tadros (eds.) Applied Surfactants.
Wiley-VCH Verlag GmbH & Co. KGaA, 503. 25. Szymanski A, Wyrwas B, Szymanowska M, Lukaszewski Z (2001) Determination of short-chained
poly(ethylene glycols) and ethylene glycol in environmental samples Water Res 35:3599-3604. 26. Wyrwas B, Szymanski A, Lukaszewski Z (1998) Tensammetric determination of non-ionic surfactants
combined with the BiAS separation procedure - Part 3. Determination in the presence of hydrocarbons, Talanta 47:325-333.
27. Traczyk L, Szymanski A, Wyrwas B, Jaroszynski T, Lukaszewski Z (2006) Efficiency of non-ionic surfactant removal in biological sewage treatment plants Pol J Environ Stud 15:493-499.
28. Rothbaecher H, Korn A, Mayer G (1993) On the analysis of nonionic surfactants in cleaning agents for automobile production Tenside Surfact Det 30:165-173.
29. Fischesser GJ, Seymour MD (1977) Determination of alkyl ethoxylate mixtures by programmed multiple development thin-layer chromatography J Chromatogr A 135:165-172.
30. Sternberg JC, Gallaway WS, Jones DTL (1962) Mechanism of response of flame ionization detectors Gas Chrom 231-267.
General Introduction
20
31. Wulf V, Wienand N, Wirtz M, Kling HW, Gaeb S, Schmitz OJ (2010) Analysis of special surfactants by comprehensive two-dimensional gas chromatography coupled to time-of-flight mass spectrometry J Chromatogr A 1217:749-754.
32. Asmussen C, Stan HJ (1998) Determination of Non-Ionic Surfactants of the Alcohol Polyethoxylate Type by Means of High Temperature Gas Chromatography and Atomic Emission Detection J High Res Chromatog 21:597-604.
33. Dück R, Wulf V, Geißler M, Baier HU, Wirtz M, Kling HW, Gäb S, Schmitz OJ (2010) Combination of chemical and electron-impact ionisation with GCxGC-qMS for characterization of fatty alcohol alkoxylate polymers in the low-molecular-weight range up to 700 Da Anal Bioanal Chem 396:2273-2283.
34. Miszkiewicz W, Szymanowski J (1996) Analysis of Nonionic Surfactants with Polyoxyethylene Chains by High-Performance Liquid Chromatography, Crit Rev Anal Chem 25:203-246.
35. Abrar S, Trathnigg B (2011) Characterization of polyoxyethylenes according to the number of hydroxy end groups by hydrophilic interaction chromatography at critical conditions for polyethylene glycol, Anal Bioanal Chem 400:2531-2537.
36. Kawachi Y, Ikegami T, Takubo H, Ikegami Y, Miyamoto M, Tanaka N (2011) Chromatographic characterization of hydrophilic interaction liquid chromatography stationary phases: Hydrophilicity, charge effects, structural selectivity, and separation efficiency J Chromatogr A 1218:5903-5919.
37. Rissler K (1999) Improved separation of polyethylene glycols widely differing in molecular weight range by reversed-phase high performance liquid chromatography and evaporative light scattering detection Chromatographia 49:615-620.
38. Ungewiß J, Vietzke JP, Strassner M, Rapp C, Feuerstein B (2003) Quantitative determination of non-ionic surfactants by high-performance liquid-chromatography-ion trap mass-spectrometry Chromatographia 57:73-76.
39. Rissler K (1996) High-performance liquid chromatography and detection of polyethers and their mono(carboxy)alkyl and -arylalkyl substituted derivatives J Chromatogr A 742:1-54.
40. Di Corcia A (1998) Characterization of surfactants and their biointermediates by liquid chromatography mass spectrometry J Chromatogr A 794:165-185.
41. Trathnigg B, Gorbunov A (2001) Liquid exclusion adsorption chromatography: new technique for isocratic separation of nonionic surfactants: I. Retention behaviour of fatty alcohol ethoxylates J Chromatogr A 910:207-216.
42. Trathnigg B (2001) Liquid exclusion adsorption chromatography, a new technique for isocratic separation of nonionic surfactants: II. Quantitation in the analysis of fatty alcohol ethoxylates J Chromatogr A 915:155-166.
43. Trathnigg B, Kollroser M, Rappel C (2001) Liquid exclusion adsorption chromatography, a new technique for isocratic separation of nonionic surfactants: III. Two-dimensional separation of fatty alcohol ethoxylates J Chromatogr A 922:193-205.
44. Trathnigg B, Rappel C (2002) Liquid exclusion adsorption chromatography, a new technique for isocratic separation of nonionic surfactants: IV. Two-dimensional separation of fatty alcohol ethoxylates with focusing of fractions J Chromatogr A 952:149-163.
45. Trathnigg B, Rappel C, Raml R, Gorbunov A (2002) Liquid exclusion adsorption chromatography: a new technique for isocratic separation of non-ionic surfactants: V. Two-dimensional separation of fatty acid polyglycol ethers J Chromatogr A 953:89-99.
46. Elsner V, Laun S, Melchior D, Koehler M, Schmitz OJ (2012) Analysis of fatty alcohol derivatives with comprehensive two-dimensional liquid chromatography coupled with mass spectrometry J Chromatogr A 1268:22-28.
47. Trathnigg B, Ahmed H (2011) Separation of all oligomers in polyethylene glycols and their monomethyl ethers by one-dimensional liquid chromatography Anal Bioanal Chem 399:1523-1534.
48. Socher G, Rissler K, Walter U, Lankmayr (2001) Electrospray Ionization Tandem Quadrupole Mass Sepctrometry for the Characterization and Identification of Ethoxylated Surfactants Tenside Surfact Det 38:80-85.
49. Park HS, Rhee CK (2004) Simultaneous determination of nonionic and anionic industrial surfactants by liquid chromatography combined with evaporative light-scattering detection, J Chromatogr A 1046: 289-291.
50. Chen S, Pietrzyk DJ (1993) Separation of Sulfonate and Sulfate Surfactants by Capillary Electrophoresis: Effect of Buffer Cation. Anal Chem 65:2770-2775.
51. Larson JR, Pfeiffer CD (1983) Determination of organic ionic compounds by liquid chromatography with indirect photometric detection. J Chromatogr A 259: 519-521.
52. Mathew J, Schroeder DL, Zintek LB, Schupp CR, Kosempa MG, Zachary AM, Schupp GC, Wesolowski DJ (2012) Dioctyl sulfosuccinate analysis in near-shore Gulf of Mexico water by direct-injection liquid chromatography-tandem mass spectrometry. J Chromatogr A 1231:46-51.
General Introduction
21
53. Nair LM, Saari-Nordhaus R (1998) Recent developments in surfactant analysis by ion chromatography J Chromatogr A 804:233-239.
54. Vogt C, Heinig K (1998) Surfactant analysis by capillary electrophoresis Tenside Surfact Det 35:470-475. 55. Agilent Technologies. Agilent 6100 Quadrupole LC/MS Systems Concepts Guide.
http://www.chem.agilent.com/Library/usermanuals/Public/G1960-90079_6100_Concepts.pdf Acessed: March 2014.
56. Robb DB, Covey TR, Bruins AP (2000) Atmospheric Pressure Photoionization: An Ionization Method for Liquid Chromatography Mass Spectrometry Anal Chem 72:3653-3659.
57. Desmazieres B, Buchmann W, Terrier P, Tortajada J (2007) APCI Interface for LC- and SEC-MS Analysis of Synthetic Polymers: Advantages and Limits Anal. Chem. 80:783-792.
58. Agilent Technologies. Agilent 6200 Series TOF and 6500 Series Q-TOF LC/MS System Concepts Guide http://www.chem.agilent.com/Library/usermanuals/Public/G3335-90142_TOF_Q-TOF_Concepts.pdf Acessed: March 2014.
59. Brenton AG and Godfrey AR (2010) Accurate Mass Measurement: Terminology and Treatment of Data J Am Soc Mass Spectr 21:1821-1835.
60. The 42nd ASMS Conference on Mass Spectrometry; Hyatt Regency Hotel, Chicago, Illinois (1994) J Am Soc Mass Spectr 5:472-523.
61. Russell DH, Edmondson RD (1997) High-resolution Mass Spectrometry and Accurate Mass Measurements with Emphasis on the Characterization of Peptides and Proteins by Matrix-assisted Laser Desorption/Ionization Time-of-flight Mass Spectrometry J Am Soc Mass Spectr 32:263-276.
62. Muenster H, Taylor L, Thermo Fisher Scientific Mass Resolution and Resolving Power. http://www.thermo.com/eThermo/CMA/PDFs/Various/File_50906.pdf Accessed: March 2014.
63. Hubbard SS, Zhang JY, Monteiro PJM, Peterson JE, Rubin Y (2003) Experimental detection of reinforcing bar corrosion using nondestructive geophysical techniques ACI Mater J 100:501-510.
64. Peeters JM, Faassen EEH, Bakker CJG (2006) Magnetic resonance imaging of microstructure transition in stainless steel Magn Reson Imaging 24:663-672.
66. Silbernagel K, Jechorek R, Barbour WM, Mrozinski P (2004) Evaluation of the BAX(R) system for detection of Listeria monocytogenes in foods: Collaborative study J AOAC Int 872004:395-410.
67. Schindhelm S, Weber A, Andres-Barrao C, Schelling C, Stchigel AM, Cano J, Veuthey JL, Bourgeois J, Barja F (2009) Biochemical and morphological characterization of a new fungal contaminant in balsamic and cider vinegars Food addi contam 2009:1306-1313.
68. The european parliament and the council of the european union (Accessed: December 2013) Regulation (EC) No 1907/2006 of the european parliament and of the council of 18 December 2006 concerning the registration, evaluation, authorisation and restriction of chemicals (REACH) establishing a european agency, amending directive 1999/45/EC and repealing council regulation (EEC) No793/93 and commission regulation (EC) No 1488/94 as well as coucil directive 76/769/EEC and commission directives 91/155/ECC, 93/105/EC and 2000/21/EC. 1907/2006. 10-12-2011. http://www.reach-compliance.eu/english/REACH-ME/engine/sources/regulations/launch-1907-2006-EC.html
Accessed: March 2014. 69. Gunther F (1963) Residue reviews. Residues of pesticides and other foreign chemicals in food and feeds.
Vol. 3. Academic Press, Inc., New York. 70. Gentili A (2007) LC-MS methods for analyzing anti-inflammatory drugs in animal-food products Trac-
Trends Anal Chem 26:595-608. 71. Zywitz D, Anastassiades M, Scherbaum E (2003) Simultaneous determination of neonicotinoid
insecticides in fruits and vegetables by LC-MS and LC-MS-MS - Methodology and residue data Gemeinsame Bestimmung von 5 Neonicotinoid insecticides in fruits and vegetables by LC-MS and LC-MS-MS - Methodology and residue data Deut Lebensm-Rundsch 99:188-196.
72. Schadt HS, Goessl R, Seibel N, Aebischer CP (2012) Quantification of Vitamin D-3 in Feed, Food, and Pharmaceuticals Using High-Performance Liquid Chromatography/Tandem Mass Spectrometry J AOAC Int 95:1487-1494.
73. Zhang J, Ge M (2011) Effect of polymer matrix on the spectral characteristics of spectrum-fingerprint anti-counterfeiting fiber J Tex Inst 103:193-199.
74. Reep P (2007) RFID and DNA taggant authentication systems and methods to prevent coumterfeiting, grey and black market proliferation of pharmaceutical, medical and other products. US 2007-622135.
75. Storme-Paris I, Rebiere H, Matoga M, Civade C, Bonnet PA, Tissier MH, Chaminade P (2010) Challenging Near InfraRed Spectroscopy discriminating ability for counterfeit pharmaceuticals detection Anal Chim Act 658:163-174.
76. Yang Z (2006) IR spectrum-based device for identifying real from fake commercial merchandise and other products CN 2006-10022036.
General Introduction
22
77. Holzgrabe U, Malet-Martino M (2011) Analytical challenges in drug counterfeiting and falsification The NMR approach J Pharm Biomed Anal 55:679-687.
78. Ortiz R, Mariotti, W, Romão W, Eberlin M, Limberger R, Mayorga P (2011) Chemical Fingerprinting of Counterfeits of Viagra and Cialis Tablets and Analogues via Electrospray Ionization Mass Spectrometry. Am J Anal Chem 2:919-928. DOI 10.4236/ajac.2011.28106.
79. Balayiannis G, Anagnostopoulos H, Kellidou I (2009) Facile and Rapid Determination of Contamination in Sulphur Pesticide Formulations by Liquid Chromatography Tandem Mass Spectrometry. Bull Environ Cont Tox 82:133-136.
80. Kujawinski DM, Wolbert JB, Zhang L, Jochmann MA, Widory D, Baran N, Schmidt TC (2013) Carbon isotope ratio measurements of glyphosate and AMPA by liquid chromatography coupled to isotope ratio mass spectrometry Anal Bioanal Chem 405:2869-2878.
81. Moller JKS, Catharino RR, Eberlin MN (2005) Electrospray ionization mass spectrometry fingerprinting of whisky: immediate proof of origin and authenticity. Analyst 130:890-897.
82. Jochmann MA, Steinmann D, Stephan M, Schmidt TC (2009) Flow Injection Analysis Isotope Ratio Mass Spectrometry for Bulk Carbon Stable Isotope Analysis of Alcoholic Beverages J Agr Food Chem 57:10489-10497.
83. Zhang L, Kujawinski DM, Federherr E, Schmidt TC, Jochmann MA (2012) Caffeine in Your Drink - Natural or Synthetic? Anal Chem 84:2805-2811.
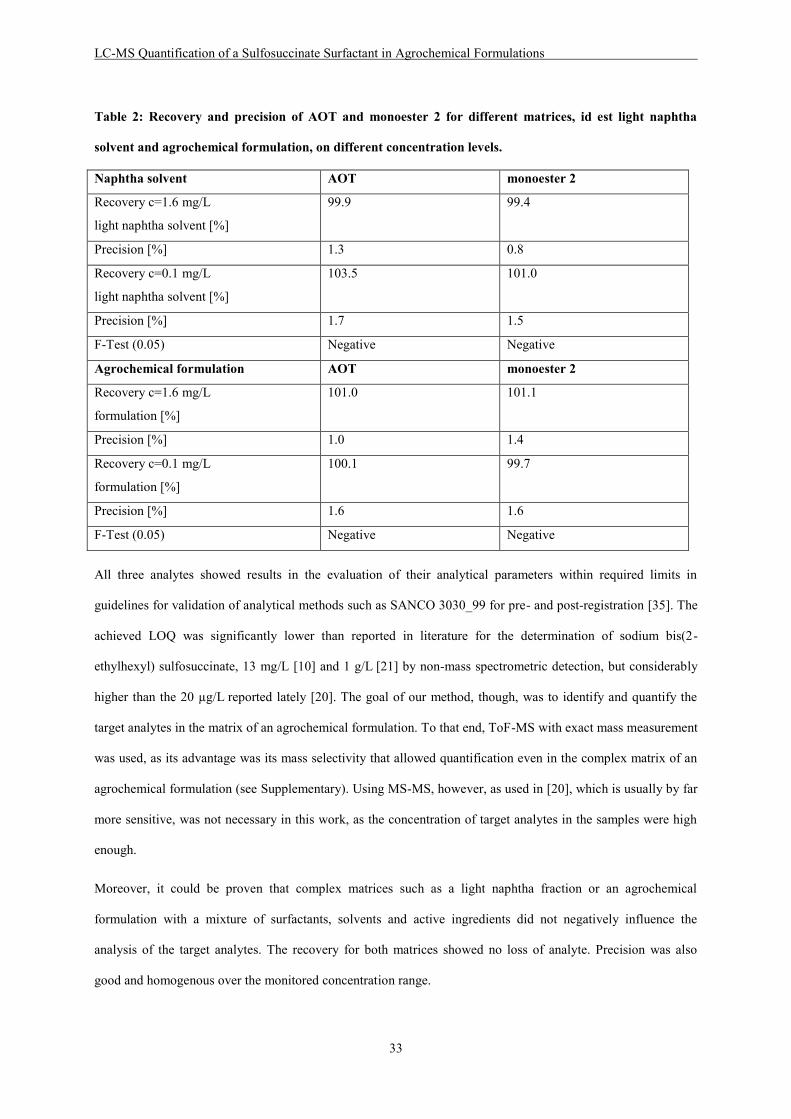
LC-MS Quantification of a Sulfosuccinate Surfactant in Agrochemical Formulations
23
2. LC-MS Quantification of a Sulfosuccinate Surfactant in
Agrochemical Formulations
Redrafted from “Glaubitz J, Schmidt TC (2013) LC-MS Quantification of a Sulfosuccinate Surfactant in
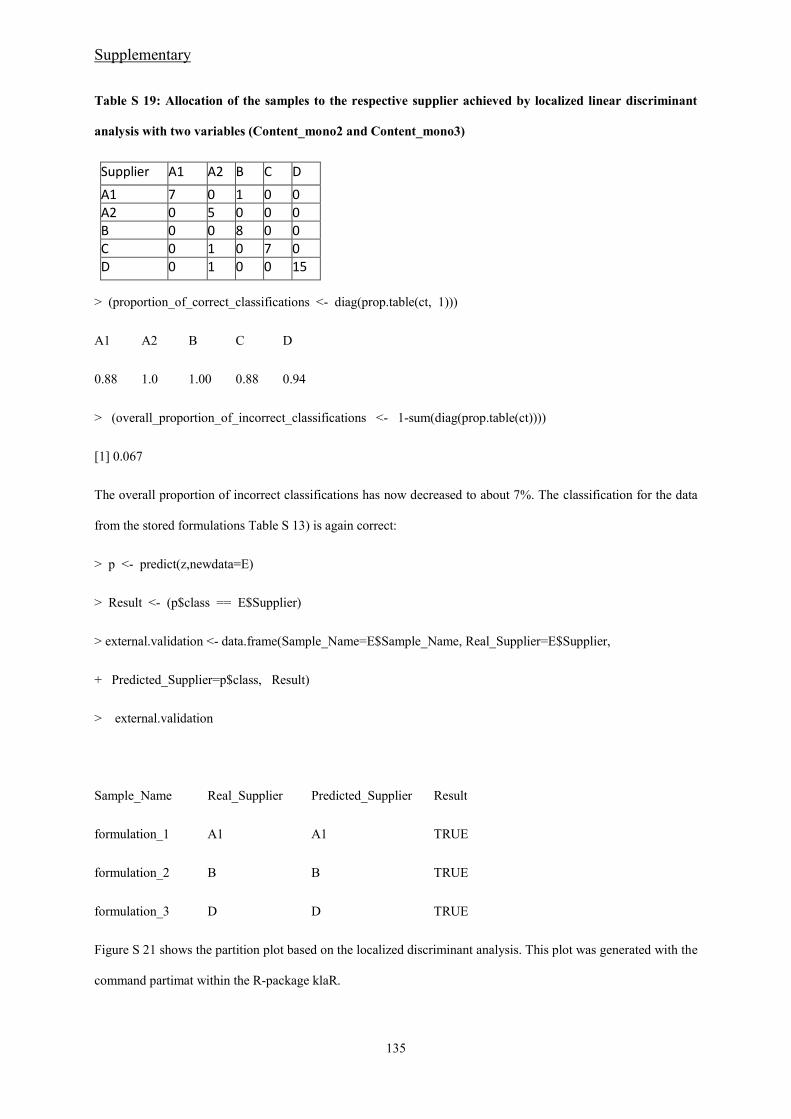
Figure 15: Extracted ion chromatogram (EIC) of the exact molar mass of monoester 2 and 3 including
their A+1 and A+2 isotopic pattern with a range of 20 ppm around each exact mass showing varying
monoesters‘ content for AOT product from three different suppliers. The results for supplier A are shown
in (a), for supplier B in (b) and for supplier C in (c)
Table 3: Content of AOT, monoester 2 and 3 in three different suppliers of AOT product. Analysis of five
independently weight samples each batch number averaged. The expended measurement uncertainty is
calculated according to GUM [26] encompassing 95% of the distribution of values
Supplier A Supplier B Supplier C Specified content (w/w)
w(AOT) [%] 63.0±1.2 65.8±0.7 61.4±1.1 62.5-66.0
w(monoester 2) [%] 1.3±0.02 0.8±0.01 3.2±0.06 not specified
w(monoester 3) [%] 0.7±0.02 0.2±0.004 0.7±0.02 not specified
A one-sided t-test with a level of significance of p = 0.05 was conducted to determine whether the content of
AOT was within the specified concentration range, 62.5-66.0 % (w/w), in the commercial product. The observed
LC-MS Quantification of a Sulfosuccinate Surfactant in Agrochemical Formulations
35
p-values were p = 0.42 (Supplier A), p = 0.52 (Supplier B) and p = 0.05 (Supplier C). As all values were higher
or equal than the level of significance p = 0.05, it was shown, that the content of AOT was within the error
margin of the specified value for all three suppliers.
To analyze, if the content of each target analyte is significantly differing between the measured samples of the
three suppliers paired t-tests were conducted with a level of significance of p = 0.05. The observed p-values of
the paired t-tests are shown in Table 4, the calculation steps are given in Supplementary.
Table 4: Observed p-values of the paired t-test on the content of AOT and monoester 2 and 3 in AOT
product. Paired groups are formed by the three suppliers of AOT product A, B and C, resulting in the test
groups A/B, A/C and B/C with a level of significance of p = 0.05.
Paired groups AOT Monoester 2 Monoester 3
A/B 0.01 1.5E-06 5.6E-07
A/C 0.1 2.8E-07 0.07
B/C 1.0E-03 8.8E-08 4.1E-06
The difference in content of AOT was not significant for the suppliers. The content of the by-products,
monoester 2 and 3, however, was significantly different between suppliers A, B and C with the only exception of
monoester 3 between supplier A and C.
Monoesters 2 and 3 might interfere with the complex mixture of surfactants in an agrochemical product, as they
have surface active properties as well and had been applied as wetting agents in the past [6]. As preliminary
results showed differences in physico-chemical properties of agrochemical formulations containing AOT product
of different suppliers, analytical methods became necessary to determine the content of AOT and monoester 2
and 3 in raw material and formulation samples, respectively.
2.5 Conclusion
A method was developed to chromatographically separate pure AOT (sodium bis(2-ethylhexyl) sulfosuccinate)
and its by-products –monoester 2 and 3 (sodium 1-carboxy-3-[(2-ethylhexyl)oxy]-3-oxopropane-1-sulfonate (2)
and sodium 3-carboxy-1-[(2-ethylhexyl)oxy]-1-oxopropane-2-sulfonate (3))– and to analyze them via a coupled
MS (ToF) with exact mass measurement. Validation was carried out according to DIN 32645 and proved the
method to work not only for analytical standards but also for complex matrices.
LC-MS Quantification of a Sulfosuccinate Surfactant in Agrochemical Formulations
36
As the content of monoester 2 and 3 differed significantly in AOT product of three different suppliers and
preliminary results showed differences in physico-chemical properties of agrochemical formulations containing
AOT product of these suppliers, this offers interesting starting points for future work.
Using these differences in the by-products spectrum of AOT product for identification of counterfeited
agrochemicals, might provide another direction of research. A precise and accurate determination of AOT and
monoesters 2 and 3 in agrochemical products is needed and has not been available so far.
2.6 Acknowledgement
The authors gratefully acknowledge the department of formulation technology at Bayer CropScience for the
financial support and the analytical team for technical and intellectual support. We also acknowledge the support
by the research department of Bayer CropScience on providing time and laboratory equipment for the synthesis
and structure elucidation of monoester 2 and 3.
2.7 Reference List
1. Crop Life International. Technical Monograph n°2, 6th edition http://www.croplife.org/view_document.aspx?docId=1281, Accessed March 2014.
2. Rogers AR (1970) A Review on accelerated chemical tests. Pestic. Sci. 1:266-268 3. Morrison EB (1970) Accelerated storage test using a programmed temperature rise. Pestic Sci 1:268-269. 4. Tadros TF (2008) In: Applied Surfactants, Principles and Applications. Wiley-VCH, Weinheim. 5. Mollet H, Grubenmann A (2000) Formulation Technology: Emulsions, Suspensions, Solid Forms. vol.1,
Wiley-VCH, Weinheim. 6. Porter MR (1994) Handbook of Surfactants. vol. 2 Chapman & Hall, Glasgow. 7. Duan L, Tan T, Gao F, Zhou F, Li S, Tian X, Zhang M (2011) Plant growth regulator containing
prohexadione calcium and uniconazole. CN 10227346020110620. 8. Sasagawa M, Ueda N (2011) Granular bioactive compositions having polyurethane coated layers and
protective coated layers, and method for application. JP 201119542820100324. 9. Knieriem T, Ottillinger T (2010) Plant protection formulations comprising dimethomorph and
dithiocarbamate. WO 201006674420091208. 10. Ryu HR, Park HS (2010) Determination of Sodium Bis(2-ethylhexyl)Sulfosuccinate (AOT) Surfactant
with Liquid Chromatography: Comparative Study of Evaporative Light Scattering Detector, Ultraviolet Detector and Conductivity Detector. J Anal Sci & Technol 1:55-60.
11. Tatterson GB (2003) Scaleup and Design of Industrial Mixing Processes, Lightning Source UK Ltd, United Kingdom.
12. Tatterson GB (2002) Process Scaleup and Desgin, Lightning Source UK, Ltd United Kingdom. 13. The Dow chemical company, Product information TRITON GR-7ME Surfactant
http://msdssearch.dow.com/PublishedLiteratureDOWCOM/dh_0050/0901b803800504f5.pdf?filepath=surfactants/pdfs/noreg/119-02108.pdf&fromPage=GetDoc, Accessed March 2014.
14. Buck RC, Franklin J, Berger U, Conder JM, Cousins IT, de Voogt P, Jensen AA, Kannan K, Mabury SA, van Leeuwen SP (2011) Perfluoroalkyl and polyfluoroalkyl substances in the environment: Terminology, classification, and origins. Integr Environ Assess Manag 7: 513-541.
LC-MS Quantification of a Sulfosuccinate Surfactant in Agrochemical Formulations
37
15. Park SY, Choi J (2009) Genotoxic Effects of Nonylphenol and Bisphenol A Exposure in Aquatic Biomonitoring Species: Freshwater Crustacean, Daphnia magna, and Aquatic Midge, Chironomus riparius. Bull Environ Contam Toxicol 83:463-468.
16. Frassinetti S, Barberio C, Caltavuturo L, Fava F, Di Gioia D (2011) Genotoxicity of 4-nonylphenol and nonylphenol ethoxylate mixtures by the use of Saccharomyces cerevisiae D7 mutation assay and use of this text to evaluate the efficiency of biodegradation treatments. Ecotoxol Environ Saf 74:253-258.
17. Judson RS, Martin MT, Reif DM, Houck KA, Knudsen TB, Rotroff DM, Xia M, Sakamuru S, Huang R, Shinn P, Austin CP, Kavlock RJ, Dix DJ (2010) Analysis of Eight Oil Spill Dispersants Using Rapid, In Vitro Tests for Endocrine and Other Biological Activity. Environ Sci Technol 44:5979-5985.
18. U.S.Environmental Protection AgencyOffice of Research and Development. Comparative Toxicity of Eight Oil Dispersant Products on Two Gulf of Mexico Aquatic Test Species, http://www.epa.gov/bpspill/reports/ComparativeToxTest.Final.6.30.10.pdf, Accessed March 2014.
19. EPA. Summary of EPA, Analytical Methods for Dispersant Analysis in Water Samples, http://www.epa.gov/bpspill/dispersant-methods.html, Accessed March 2014.
20. Mathew J, Schroeder DL, Zintek LB, Schupp CR, Kosempa MG, Zachary AM, Schupp GC, Wesolowski DJ (2012) Dioctyl sulfosuccinate analysis in near-shore Gulf of Mexico water by direct-injection liquid chromatography-tandem mass spectrometry. J Chromatogr A 1231:46-51.
21. Park HS, Rhee CK (2004) Simultaneous determination of nonionic and anionic industrial surfactants by liquid chromatography combined with evaporative light-scattering detection, J Chromatogr A 1046: 289-291.
22. Chen S, Pietrzyk DJ (1993) Separation of Sulfonate and Sulfate Surfactants by Capillary Electrophoresis: Effect of Buffer Cation. Anal Chem 65:2770-2775.
23. Larson JR, Pfeiffer CD (1983) Determination of organic ionic compounds by liquid chromatography with indirect photometric detection. J Chromatogr A 259: 519-521.
24. MacInnis JA, Boucher GD, Palepu R, Marangoni DG (1999) The properties of a family of two-headed surfactant systems: the 4-alkyl-3-sulfosuccinates 2.Surface properties of alkyl sulfosuccinate micelles. Can J Chem 77:340-347.
25. Haun J, Oeste K, Teutenberg T, Schmidt TC (2012) Long-term high-temperature and pH stability assessment of modern commercially available stationary phases by using retention factor analysis. J Chromatogr A 1263:99-107.
26. Joint Committee for Guides in Metrology, JCGM 100:2008 Evaluation of measurement data - Guide to the expression of uncertainty in measurement http://www.bipm.org/utils/common/documents/jcgm/JCGM_100_2008_E.pdf, Accessed March 2014.
27. Itoh H, Kawasaki S, Tadano J (1996) Application of liquid chromatography-atmopheric -pressure chemical-ionization mass spectrometry to pesticide analysis. J Chromatogr A 754:61-76.
28. Kawasaki S, Nagumo F, Ueda H, Tajima Y, Sano M, Tadano J (1993) Simple, rapid and simultaneous measurement of eight different types of carbamate pesticides in serum using liquid chromatography-atmospheric pressure chemical ionization mass spectrometry. J Chromatogr B 620:61-71.
29. Baltussen E, Snijders H, Janssen HG, Sandra P, Cramers CA (1998) Determination of phenylurea herbicides in water samples using on-line sorptive preconcentration and high-preformance liquid chromatography with UV or electrospray mass spectrometric detection. J Chromatogr A 802:285-295.
30. Asperger A, Efer J, Koal T, Engewald W (2001) On the signal response of various pesticides in electrospray and atmospheric pressure chemical ionization depending on the flow-rate of eluent applied in liquid chromatography-tandem mass spectrometry. J Chromatogr A 937:65-72.
31. Garcia-Ac A, Segura PA, Viglino L, Gagnon C, Sauvé S (2011) Comparison of APPI, APCI and ESI for the LC-MS/MS analysis of bezafibrate, cyclophosphamide, enalapril, methotrexate and orlistat in municipal wastewater. J Mass Spectrom. 46:383-390.
32. Baczko K, Chasseray X, Larpent C (2001) Synthesis and surfactant properties of symmetric and unsymmetric sulfosuccinic diesters, Aerosol-OT homologues. J Chem Soc Perkin Trans 2:2179-2188.
33. Gao R, Zhong D, Liu K, Xia Y, Shi R, Li H, Chen X (2012) Simultaneous determination of morinidazole, its N-oxide, sulfate, and diastereoisomeric N+-glucuronides in human plasma by liquid chromatography-tandem mass spectrometry. J Chromatgr B 908:52-58.
34. Yu L, Jin Y, Jianzhou, Ye C, Wang J, Hu G, and Zeng S (2012) Simultaneous determination of diastereoisomeric and enantiomeric impurities in (1R, 3R)-1-(1,3-benzodioxol-5-yl)-2-(chloroacetyl)-2,3,4,9-tetrahydro-1h-pyrido[3,4-b]indole-3-carboxylic acid methyl ester a key intermediate of tadalafil by chiral high-performance liquid chromatography. Chirality 24:303-306.
35. European Commission, Directorate General Health and Consumer Protection (2000) Technical Material and Preparations. Guidance for generating and reporting methods of analysis in support of pre- and post-registration data requirements for Annex II (part A, Section 4) and Annex III (part A, Section 5) of Directive 91/414 SANCO 3030_99 rev. 4 http://www.google.de/url?sa=t&rct=j&q=sanco%203030_99&source=web&cd=1&ved=0CFUQFjAA&ur
LC-MS Quantification of a Sulfosuccinate Surfactant in Agrochemical Formulations
38
l=http%3A%2F%2Fec.europa.eu%2Ffood%2Fplant%2Fprotection%2Fevaluation%2Fguidance%2Fwrkdoc13_en.pdf&ei=bSb8T-zwAanj4QSI3piFBw&usg=AFQjCNFMrx5gEL37VRiLMUq1Vwm7APHRnw, Accessed March 2014.
Composition of commercial AOT surfactant products and ist effects on an agrochemical formulation
39
3. Composition of commercial AOT Surfactant Products
and its Effects on an Agrochemical Formulation
3.1 Abstract
Sodium bis(2-ethylhexyl) sulfosuccinate (Aerosol OT or AOT) is a commercially available surfactant commonly
used in agrochemicals. Besides the principal diester surfactant, commercial AOT product contains two surface-
active isomeric monoester by-products, which may influence the surfactant’s overall properties. This work
investigates whether the purity of the surfactant affects its ability to stabilize an agrochemical formulation. The
concentrations of the diester and two monoester impurities in batches of commercial AOT product from several
suppliers were determined quantitatively by liquid chromatography–mass spectrometry. The tested batches
showed different contents of the monoesters. Samples of a model agrochemical formulation containing AOT
product formed more sediment during storage when the content of monoesters in the surfactant was high. The
supplier of a commercial AOT product could be traced by analysis of the monoester content of either the raw
product or the aged agrochemical formulation.
3.2 Introduction
High levels of surfactants are common in domestic products used for personal care and cleaning, and they are
also common in industry, e.g., in agrochemical products [1; 2]. The active ingredients of agrochemical
formulations are generally mixed with additives, such as surfactants and solvents. Surfactant additives disperse
the active ingredients homogeneously throughout the formulation and stabilize it physically and chemically.
They facilitate the application of the active ingredients by ensuring their even distribution over the area of
application, thus avoiding over- or under dosing; and they also aid in the uptake of the active ingredient by the
target crop or species [3; 4]. These various tasks require different surfactants in different situations. The chosen
surfactant or combination of surfactants must complement the mixture of other components without inducing
unwanted effects during production or storage, such as sedimentation, agglomeration, or crystallization [5].
Once a formulation has been developed, it must be registered and approved before it can be sold commercially.
Registration requires the formulation and its components to be evaluated with regard to their safety and their
adverse effects to human health and the environment [6–8]. A registered formulation has a fixed composition,
which must not be changed, although chemically identical substitutions are permitted, to allow the raw materials
to be obtained from different suppliers. The interchangeability of components from different sources is necessary
Composition of commercial AOT surfactant products and ist effects on an agrochemical formulation
40
not only for legal compliance, but also to ensure the formulation behaves consistently. Changes may affect the
production of the product or the product itself, which may lead to unwanted changes in its properties. Therefore,
quality control of the raw materials is necessary. Furthermore, differences among the products of different
suppliers, where observed, could also assist in the investigation of counterfeiting, by allowing a supplier to be
identified by the by-product spectrum of the product. Such techniques have been used to identify fake perfumes
[9] and whiskey [10], and counterfeit pharmaceutical products have been identified by the nature and content of
their active ingredients [11; 12].
In this study, we investigated the composition of commercial Aerosol OT (AOT) products that are commonly
used as surfactants in agrochemicals, and the influence that variations of the product’s composition have on the
stability of an agrochemical formulation. Commercially available AOT products contain as their major
constituent sodium bis(2-ethylhexyl) sulfosuccinate (i.e., pure AOT) (Figure 5a). The surfactant, together with
surface active isomeric by-products, labeled here “monoester 2” (Figure 5b) and “monoester 3” (Figure 5c), is
solvated in light aromatic naphtha. These other substances in the product may influence the overall properties of
2. Sasagawa M, Ueda N (2011) Granular bioactive compositions having polyurethane coated layers and protective coated layers, and method for application. JP 2011195428.
3. Fleute-Schlachter I, Mainx HG, Heldt S, Busch S (2012) Biocide compositions comprising esters of ethoxylated alcohols adjuvants or additives. WO 2011-EP68529.
4. Pontzen R, Vermeer AWP (2012) New Formulation Developments. In: Jeschke P, Kramer W, Schirmer U, Witschel M. (eds.) Modern Methods in Crop Protection Research. Wiley-VCH Weinheim, 217-248.
5. Tadros TF (2008) Applied Surfactants, Principles and Applications. Wiley-VCH, Weinheim. 6. European Commission, Directorate General Health and Consumer Protection (Accessed: March 2014)
Technical Material and Preparations. Guidance for generating and reporting methods of analysis in support of pre- and post-registration data requirements for Annex II (part A, Section 4) and Annex III (part A, Section 5) of Directive 91/414 SANCO 3030_99 rev. 4 http://ec.europa.eu/food/plant/protection/evaluation/guidance/wrkdoc13_en.pdf.
7. 104th Congress (Accessed: March 2014) Food Quality Protection Act. 104-170 http://www.epa.gov/pesticides/regulating/laws/fqpa/gpogate.pdf.
8. The european parliament and the council of the european union (Accessed: March 2014) Regulation (EC) No 1907/2006 of the european parliament and of the council of 18 December 2006 concerning the registration, evaluation, authorisation and restriction of chemicals (REACH) establishing a european agency, amending directive 1999/45/EC and repealing council regulation (EEC) No793/93 and commission regulation (EC) No 1488/94 as well as coucil directive 76/769/EEC and commission directives 91/155/ECC, 93/105/EC and 2000/21/EC. 1907/2006. 10-12-2011. http://www.reach-compliance.eu/english/REACH-ME/engine/sources/regulations/launch-1907-2006-EC.html.
9. Marques LA, Catharino RR, Bruns RE, Eberlin MN (2006), Electrospray ionization mass spectrometry fingerprinting of perfumes: rapid classification and counterfeit detection. Rapid Commun Mass Spectrom 20:3654-3658. DOI 10.1002/rcm.2779.
10. Moller JKS, Catharino RR, Eberlin MN (2005) Electrospray ionization mass spectrometry fingerprinting of whisky: immediate proof of origin and authenticity. Anal 130:890-897.
11. Ortiz R, Mariotti, W, Romão W, Eberlin M, Limberger R, Mayorga P (2011) Chemical Fingerprinting of Counterfeits of Viagra and Cialis Tablets and Analogues via Electrospray Ionization Mass Spectrometry. Am J Anal Chem 2:919-928. DOI 10.4236/ajac.2011.28106.
12. Balayiannis G, Anagnostopoulos H, Kellidou I (2009) Facile and Rapid Determination of Contamination in Sulphur Pesticide Formulations by Liquid Chromatography Tandem Mass Spectrometry. Bull Environ Cont Tox 82:133-136.
Composition of commercial AOT surfactant products and ist effects on an agrochemical formulation
56
13. Glaubitz J, Schmidt TC (2013) LC-MS Quantification of a Sulfosuccinate Surfactant in Agrochemical Formulations. Chromatographia 76:1729-1737.
14. Haun J, Oeste K, Teutenberg T, Schmidt TC (2012) Long-term high-temperature and pH stability assessment of modern commercially available stationary phases by using retention factor analysis. J Chromatogr A 1263:99-107. DOI 10.1016/j.chroma.2012.09.031.
15. BASF The chemical company (Accessed: March 2014) Product lable and saftey instructions of fungizide Diamant. http://www.agricentre.basf.ie/agroportal/ie/media/product_files_ie/labels_1/Diamant_IE.pdf,
16. Bayer CropScience (Accessed: March 2014) Product lable and saftey instructions of fungizide Folicur. http://www.bayercropscience.co.uk/assets/Uploads/Folicur-label.pdf.
17. CropLife International (Accessed: March 2014) Technical Monograph n°2, 6th edition http://www.croplife.org/view_document.aspx?docId=1281.
18. R Development Core Team (2012) R: A Language and Enviroment for Statistical Computing. R Foundation for Statistical Computing, Vienna, Austria, ISBN 3-900051-07-0.
19. Porter MR(1994) Handbook of Surfactants. vol. 2 Chapman & Hall, Glasgow. 20. Exxon Mobil Chemical (Accessed: March 2014) Material safety data sheat Solvesso 100
21. Shell Chemicals (Accessed: March 2014) Material Safety data sheat ShellSol A100 http://aglayne.com/wp-content/uploads/2010/10/Shellsol-A-100.pdf.
22. European Commission European Chemical Bureau (Accessed: March 2014) IUCLID Dataset Solvesso 100 http://www.petroleumhpv.org/docs/kerosine_jetfuel/2012_may17_IUCLID%20CD%20file%2064742956_2000.pdf.
23. Ryu HR, Park HS (2010) Determination of Sodium Bis(2-ethylhexyl)Sulfosuccinate (AOT) Surfactant with Liquid Chromatography: Comparative Study of Evaporative Light Scattering Detector, Ultraviolet Detector and Conductivity Detector. J Anal Sci & Technol 1:55-60.
24. Mathew J, Schroeder DL, Zintek LB, Schupp CR, Kosempa MG, Zachary AM, Schupp GC, Wesolowski DJ (2012) Dioctyl sulfosuccinate analysis in near-shore Gulf of Mexico water by direct-injection liquid chromatography-tandem mass spectrometry. J Chromatogr A 1231:46-51. DOI 10.1016/j.chroma.2012.01.088.
25. Park HS, Rhee CK (2004) Simultaneous determination of nonionic and anionic industrial surfactants by liquid chromatography combined with evaporative light-scattering detection, J Chromatogr A 1046: 289-291.
26. Maki SA, Wangsa J, Danielson ND (1992) Separation and Detection of Aliphatic Anionic Surfactants Using a Weak Anion Exchange Column with Indirect Photometric and Indirect Conductivity Detection. Anal Chem 64:583-589.
27. Chen S, Pietrzyk DJ (1993) Separation of Sulfonate and Sulfate Surfactants by Capillary Electrophoresis: Effect of Buffer Cation. Anal Chem 65:2770-2775.
28. Longhi G, Ceselli A, Fornili SL, Abbate S, Ceraulo L, Liveri VT (2013) Molecular dynamics of electrosprayed water nanodroplets containing sodium bis(2-ethylhexyl)sulfosuccinate. J Mass Spectrom 48:478-486.
29. Baczko K, Chasseray X, Larpent C (2001) Synthesis and surfactant properties of symmetric and unsymmetric sulfosuccinic diesters, Aerosol-OT homologues. J Chem Soc Perkin Trans 2:2179-2188.
30. MacInnis JA, Boucher GD, Palepu R, Marangoni DG (1999) The properties of a family of two-headed surfactant systems: the 4-alkyl-3-sulfosuccinates 2.Surface properties of alkyl sulfosuccinate micelles. Can J Chem 77:340-347. DOI 10.1139/v99-008.
31. Kawai-Hirai R, Hirai M (2007) Effect of cations on the structure of sodium bis(2-ethylhexyl)sulfosuccinate water-in-oil microemulsion. J Appl Cryst 40:274-278.
32. Jose R, Patel TJ, Cather TA, Grebowicz J, Han H, Bhowmik PK, Agra-Kooijman DM, Kumar S (2013) Room temperature thermotropic liquid crystalline phases of catanionic surfactants derived from quaternary ammonium surfactants and bis(2-ethylhexyl)sulfosuccinate. J Colloid Interface Sci 411:61-68.
33. Calandra P, Marco GD, Ruggirello A, Liveri VT (2009) Physico-chemical investigation of nanostructures in liquid phases: Nickel chloride ionic clusters confined in sodium bis(2-ethylhexyl) sulfosuccinate reverse micelles. J Colloid Interface Sci 336:176-182.
34. Tutz G, Binder H (2005) Localized classification. Stat Comput 15:155-166. 35. Weihs C, Ligges U, Luebke K, Raabe N (2005) Klar analyzing german business cycles. in: Baier D,
Decker R, Schmidt-Thieme L, (eds.), Data Analysis and Decision Support. Springer-Verlag, Berlin, 335-343.
36. Zhang J, Ge M (2011) Effect of polymer matrix on the spectral characteristics of spectrum-fingerprint anti-counterfeiting fiber. J Tex Inst 103:193-199. DOI 10.1080/00405000.2011.562664.
Composition of commercial AOT surfactant products and ist effects on an agrochemical formulation
57
37. Reep P (2007) RFID and DNA taggant authentication systems and methods to prevent coumterfeiting, grey and black market proliferation of pharmaceutical, medical and other products. US 2007-622135.
38. Storme-Paris I, Rebiere H, Matoga M, Civade C, Bonnet PA, Tissier MH, Chaminade P (2010) Challenging Near InfraRed Spectroscopy discriminating ability for counterfeit pharmaceuticals detection Anal Chim Act 658:163-174. DOI 10.1016/j.aca.2009.11.005.
39. Yang Z (2006) IR spectrum-based device for identifying real from fake commercial merchandise and other products CN 2006-10022036.
40. Holzgrabe U, Malet-Martino M (2011) Analytical challenges in drug counterfeiting and falsification The NMR approach J Pharm Biomed Anal 55:679-687. DOI 10.1016/j.jpba.2010.12.017.
Analytical characterization and comparison of Tristyrylphenol ethoxylates used in agrochemical formulation
58
4. Analytical Characterization and Comparison of
Tristyrylphenol Ethoxylates used in Agrochemical
Formulation
4.1 Abstract
The technical nonionic surfactant TSP-16-ethoxylates (Tristyrylphenol ethoxylates), is no single defined
molecule but contains a polymeric distribution with an average of 16 EO units. In order to analyze differences in
the EO number distribution of various suppliers and thus to specify more precisely the required quality for the
use in agrochemical formulations, an analytical method was developed using LC-ToF-MS with exact mass
measurement in combination with multivariate data analysis. This method enables a fast and comprehensive
characterization and comparison of commercially available TSP-16-ethoxylates of different suppliers and
qualities.
Significant differences were found in composition and content of by-products among the suppliers. These were
based on the content of the different styrenated phenol ethoxylates, such as mono-, di-, tri-, and tetrastyrylphenol
ethoxylates and on the content of mono- and distyrylphenol copolymerized propoxylates-ethoxylates. These
differences were utilized to identify the respective supplier in the raw material as well as formulated in a model
agrochemical formulation using a combination of principle component analysis and hierarchical clustering.
4.2 Introduction
As shown in previous work, a small variation in the by-product spectrum of surfactants can have a significant
impact on the physico-chemical properties of agrochemical products [1]. Therefore characterization and control
of the quality of these surfactants is necessary. Whether differences in the composition of a surfactant of
different suppliers have an impact on the properties of an agrochemical product, is usually tested by storage
stability tests. Effects on the physico-chemical properties of the agrochemical product are depending on long-
term processes, manifesting for example in phase separation or viscosity changes. They cannot be accelerated in
the same manner as a chemical process, such as the degradation of an active ingredient, to save time in
development of the formulation [2;3]. A life-time or shelf-life of at least two years is mandatory for an
agrochemical formulation, in order to gain a registration in most countries in the world [4-6]. In consequence,
storage tests have to cover at least two years at ambient conditions. This is time consuming, especially, if one or
more additional suppliers for a specific surfactant have to be registered. In addition, the surfactant has to be
Analytical characterization and comparison of Tristyrylphenol ethoxylates used in agrochemical formulation
59
continuously monitored during the life cycle of an agrochemical product to avoid potential problems in the
physical-chemical stability induced by changes in the quality of the surfactant.
The focus of this work is to develop a fast and reliable method to characterize a nonionic surfactant of different
suppliers and qualities according to its main and by-product spectrum. Investigated were tristyrylphenol (TSP)
ethoxylates with an average degree of polymerization of 16 ethylene oxide units (EO), in the following
abbreviated with TSP-16-ethoxylates. The molecular structure is displayed in Figure 20.
OO
Hn
CH3
*
m
m=1-4
n=5-29
Figure 20: Structure of commercially available tristyrylphenol (m=3) with an average number of ethylene
oxide units of n = 16.
TSP-16-ethoxylates are widely used as emulsifiers in agrochemical products and are purchased without
additional solvent as liquid [7-10]. The distribution of the ethoxylates depends primarily on the reaction
conditions during polymerization and on the acidity of the hydroxyl functionality which undergoes
polymerization. For phenol derivatives, such as the TSP, the acidity of the hydroxyl group (pKa (TSP) = 11.0)
ensures that no residual phenol is left after polymerization as by-product [11-14]. The polymerization on this
kind of educt results in a Poisson-like distribution of ethoxylates, which leads to a complex composition of the
final commercial product [15].
Several methods for the analysis of poly ethylene glycol or alkoxide, fatty acid ethoxylates, respectively, with
liquid chromatography coupled to mass spectrometry have been published. A separation according to the degree
of ethoxylation can be achieved via normal phase-liquid chromatography (NP-LC) [16] or hydrophilic liquid
interaction chromatography (HILIC) [17] whereas the separation according to the hydrophobic group is achieved
via reversed phase liquid chromatography (RP-LC) [18-21] Another possibility for a separation according to
alkyl chain and polyether chain length is liquid exclusion adsorption chromatography (LEAC). Here, separation
of the hydrophobic group is conducted according to liquid adsorption chromatography (LAC) and separation of
the polyether chain according to size exclusion chromatography (SEC) [22-26]. Also the separation of complex
mixtures of different alkoxylates via 2-dimensional liquid-chromatography has been shown [27]. For detection
of the ethoxylated entities universal detectors like the evaporation light scattering detector (ELSD) have been
Analytical characterization and comparison of Tristyrylphenol ethoxylates used in agrochemical formulation
60
succeeded by mass spectrometry (MS) using either MS-MS or Time-of-Flight (ToF), as these are more sensitive
and enable identification via the (exact) molecular mass and/or specific fragments [19;28-30].
Although there has been some research dedicated to characterization of nonionic surfactants in various matrices
including agrochemical formulations [31], there has been no method to the knowledge of the authors for
compound specific characterization and comparison of TSP-16-ethoxylates of different suppliers. Therefore, it
was the aim of this work to develop such a method using reversed-phase liquid-chromatography coupled to a
Time-of-Flight mass spectrometer with exact mass measurement in combination with targeted multivariate data
analysis considering all main components in TSP-16-ethoxylates.
4.3 Experimental
4.3.1 Chemicals and Reagents
High purity water was obtained by a Milli-Q-gradient A10 system (Millipore, Eschborn, Germany). Methanol
and ammonium formiate both of p.a. grade were purchased from Sigma Aldrich. Hexanophenone for internal
standard was supplied by Sigma Aldrich with a purity of 99%. 9 to 10 different production batches each from 3
suppliers and two different product qualities for one of the suppliers of TSP-16-ethoxylates were purchased and
their spectrum of nonionic surface-active compounds was analyzed. For each batch an amount of at least 25 mL
was available. In Table 9, the TSP-16-ethoxylates batches and the respective production sites are listed for each
supplier. The suppliers are indicated with A-C. Supplier B has two different product qualities. The refined
product quality is indicated with “B1” and the single production batches with an upper case “B”. The technical
product quality is indicated with “B2” and the single production batches with a lower case “b”.
Table 9: Investigated suppliers, qualities and production batches of TSP-16-ethoxylates. The refined
quality of supplier B is indicated as “B1” and the technical product with “B2”. The corresponding
production batches are indicated with upper case “B” for the refined quality and with lower case “b” for
the technical product.
Supplier A B1 B2 C
Batch No. A-1 to A-10 B-1 to B-9 b-1 to b-10 C-1 to C-10
Analytical characterization and comparison of Tristyrylphenol ethoxylates used in agrochemical formulation
61
4.3.2 LC-MS Analysis
An Agilent 1200 SL HPLC coupled to an Agilent 6220 Accurate-Mass-TOF mass spectrometer with
interchangeable dual-sprayer electrospray ionization (ESI) and atmospheric pressure chemical ionization (APCI)
sources and an Agilent 1200 SL HPLC coupled to a Thermo Orbitrap Q-exactive equipped with an atmospheric
pressure photo ionization (APPI) source was used for LC-MS measurements. All measurements were done on a
Phenomenex Kinetex (50 x 3.0 mm, 2.6 µm) column, which was chosen due to its good separation capacity,
while allowing higher flow rates due to larger particles, compared to HPLC columns with full porous particle.
Thus, accelerated separation was used, in order to separate the various functionalized and non-functionalized
poly ethylene and copolymerized poly propylene and poly ethylene glycols contained in TSP-16-ethoxylates.
Reversed phase-liquid chromatography (RP-LC) was used to separate the different poly ethylene glycols and
copolymerized poly propylene and ethylene glycols contained in TSP-16-ethoxylates according to their degree of
polymerization. High purity water (Millipore) and methanol were used as LC eluents. Both eluents were
modified with 5 mM of ammonium formate, in order to promote the formation of [M+(NH4)]+ -adducts in the
mass spectrometer, thus facilitating the interpretation of the obtained mass spectra especially for ESI. For the
analysis of the different components in commercially available TSP-16-ethoxylates gradient elution was chosen.
For identification an extended gradient was chosen starting with 20% (v/v) methanol, raised to 97.5% in 12 min,
hold for 3 min at 97.5%, decreased to 20% in 0.5 min and equilibration for 3.5 min at 20%. Total run time was
18 min with a flow of 1.0 mL/min and a column temperature of 50 °C.
For comparison of the different suppliers of TSP-16-ethoxylates a shortened gradient elution was used starting
with 20% (v/v) methanol, raised to 97.5% in 6 min, hold for 3 min at 97.5%, decreased to 20% in 0.5 min and
equilibration for 1.5 min at 20%. Total run time was 11 min with a flow of 1.0 mL/min and a column
temperature of 50 °C.
Flow was directed without split via the APCI and APPI source and with a split of 1:6 (MS:Waste) via the first
sprayer needle of the dual-ESI source into the mass spectrometer. To realize the split a QuickSplit adjustable
flow-splitter (Restek), was used equipped with resistors which enable a constant split ratio independent of
changes in viscosity or pressure. Mass spectra were obtained in positive mode through the whole run.
For the ToF-instrument, the high resolution mode with 4 GHz recording frequency was chosen resulting in an
average resolution of about 10000 full width at half peak maximum (FWHM). Two spectra every second were
obtained with 4959 transients per spectrum and a mass range of 105-3200 m/z. For the APCI source the
parameters were 350 °C for gas temperature, 450 °C for vaporizer temperature, 8 L/min for dry gas, 30 psig
Analytical characterization and comparison of Tristyrylphenol ethoxylates used in agrochemical formulation
62
nebulizer pressure and 4.5 µA corona current. For ESI the parameters were 350 °C for gas temperature, 8 L/min
drying gas flow and 30 psig nebulizer pressure for both ESI sprayer needles of the dual-sprayer ESI source. For
both sources capillary voltage was 3500 V, fragmentor voltage 100 V, skimmer voltage 60 V and octopole 1 RF
Vpp 250 V.
For the Orbitrap instrument a resolution of 30000 FWHM and a collector time of 200 ms were chosen with a
mass range of 200-4000 m/z. The parameters of the APPI source were 150 °C for capillary temperature, 450 °C
for vaporizer temperature, sheath gas flow rate of 50 psig and 10.0 eV photon energy for the krypton lamp.
Mass calibration on the ToF was done for the APCI and ESI source with the corresponding calibration mixtures
supplied by Agilent via the second sprayer of the dual-sprayer ESI source. Mass correction during analysis was
handled on purine (ionization in positive mode forming a proton adduct with m/z = 121.050873 amu) and
hexakis(1H,1H, 3H-fluoropropoxy)phosphazine (abbreviated: HP 921 (ionization in positive mode forming a
formate adduct with m/z = 922.009798 amu)).
For analysis via the APCI source, a solution of both was delivered into the eluent after the LC unit via a tee with
a flow of 0.2 mL/min. To manage the LC pressure at the tee an additional Agilent 1100 isocratic HPLC pumping
unit was used to deliver the recalibration mixture.
For analysis via ESI the solution was delivered with a flow of 0.1 mL/min via the second sprayer needle of the
dual-sprayer ESI source into the mass spectrometer.
Mass calibration on the Orbitrap was done with Pierce PN 88322, the corresponding calibration mixture,
supplied by Thermo Scientific. Mass correction during the measurement was not necessary, according to the
producer, as the mass calibration on this type of instrument is stable enough [32].
4.3.3 Preparations of Standard and Sample Solutions
For the preparation of all standard and stock solutions and dilution steps a mixture of 50/50 (v/v) water and
methanol was used. For determination of the linear range a sample of production batch A-1 of supplier A was
taken.
Linearity Range
For determination of the linearity range a stock solution of tristyrylphenol with 16 EO units was prepared
dissolving an equivalent amount of TSP-16-ethoxylates (Batch A-1) in the mixture of water and methanol,
obtaining a concentration of 0.6 g/L. This stock solution was further diluted 1:9 (v/v) obtaining a concentration
Analytical characterization and comparison of Tristyrylphenol ethoxylates used in agrochemical formulation
63
of 0.06 g/L. For preparation of the standard solution this intermediate stock solution was diluted to fit the
concentration range 30 mg/L to 0.1 mg/L. As no analytical standard for TSP with 16 EO units was available all
given values were calculated based on the weighed amount of TSP-16-ethoxylates.
A stock solution of the internal standard hexanophenone for determination of linearity was prepared dissolving
an equivalent amount of the hexanophenone in the mixture of water and methanol obtaining a concentration of
0.2 g/L. For preparation of the standard solution the stock solution was diluted to fit the concentration range
100 mg/L to 1 mg/L.
Preparation of Sample Solutions
Stock solution of the internal standard hexanophenone for spiking of the samples was prepared dissolving an
equivalent amount of the hexanophenone in the mixture of water and methanol obtaining a concentration of
0.6 g/L. A volume of 0.1 mL of this stock solution was added to every sample after its final dilution step
obtaining a concentration of 60 mg/L of internal standard.
For the analysis of TSP-16-ethoxylates in product batches, 40 mg of the sample was dissolved in 20 mL of the
solvent mixture of water and methanol. The working solution was then diluted 1:100.
For the analysis of TSP-16-ethoxylates in agrochemical formulation samples 30 mg of the sample were diluted
in 20 mL of the solvent mixture. The working solution was then diluted 1:10.
Preparation of Mass Calibration Solution
The mass calibration solution was purchased from Agilent for ESI-source and applied according to the
instructions of the supplier. The solution for mass correction during the analysis was purchased from Agilent for
both APCI- and ESI-source. For mass correction a solution of Purine and HP 921 was prepared containing 1.0
µM Purine and 0.25 µM HP 921 in 95/5 (v/v) methanol/water. For measurements with the ESI source a dilution
of 1:100 was needed to avoid overloading of the detection unit. For testing the mass calibration during analysis,
a test sample containing standards with known exact masses spanning the retention time window was analyzed at
the beginning and the end of a test series. The composition of the test sample is given in the Supplementary.
Analytical characterization and comparison of Tristyrylphenol ethoxylates used in agrochemical formulation
64
4.3.4 Formulation Sample
Samples of four model formulations containing TSP-16-ethoxylates of supplier A, B1, B2 and C were prepared
according to the composition shown in Table 10. These formulation samples were then analyzed according to the
method developed in this work in order to investigate whether the detection and identification of respective
suppliers of TSP-16-ethoxylates was possible in the given matrix of the formulation.
Table 10: Table of composition of the model agrochemical formulation
Data extraction was performed with Agilent Mass Hunter and data analysis with Agilent Mass Profiler
Professional. The acquired scan data were displayed for TSP-16-ethoxylates as EIC with the range of m/z 500 to
921 and the range of m/z 930 to 3200 or, for hexanophenone, as the exact molar mass of the [M+(H)]+ adduct
with an exact mass of m/z 177.1274 and its A+1 and A+2 isotopic masses with a window of 100 ppm around
each mass to account for potential mass divergence during the measurement. The mass range of m/z 921 to 930
was left out intentionally, because in this range the mass signal of HP 921 is detected that was used for mass
calibration.
The acquired scan data of the three replicate measurements of each production batch were at first subjected to a
targeted compound search using the molecular-feature-extraction (MFE) algorithm of the Agilent Mass Hunter
software with a mass tolerance of 10 ppm and a threshold of 2000 counts signal height. For the targeted
Analytical characterization and comparison of Tristyrylphenol ethoxylates used in agrochemical formulation
65
compound search a custom made data base of exact masses was used containing a wide range of different
derivates of styrylphenol ethoxylates and copolymerized propoxylates-ethoxylates. The ammonium adducts
[M+(NH4)]+ of the respective compounds were searched for. The data base is used in the csv-format and the
corresponding data is given in the Supplementary. This first compound extraction was fast screening using a
peak finding algorithm for the respective masses to reduce findings for marginal compounds. For a
comprehensive data extraction a second extraction step was employed next.
The results of the first extraction step were exported to Agilent Mass Profiler Professional software where the
results of all repetition analyses and batches were binned according to the suppliers and qualities to one data file.
The obtained data files for each of the suppliers and qualities contained all compounds found in the first step
with annotation and retention time, except those occurring only once, which were removed in this step to
eliminate marginal compounds.
For the second, exhaustive extraction all samples were reanalyzed with a so called find-by-formula (FBF)
algorithm in the Agilent Mass Hunter software searching for the compounds identified in the first step at their
respective retention times in all samples to minimize false-negative findings. The set deviation from the
calculated exact mass was 20 ppm and ± 0.5 min from the expected retention time. The single charged
[M+(NH4)]+ and the double charged [M+2(NH4)]2+ ammonium adducts of the respective m/z-values of the molar
mass of each compound were searched for. They were then summed up to one peak in an extracted ion
chromatogram (EIC). This peak was integrated and the obtained peak area was used as quantitative information
for the respective compound.
The obtained data set was restricted to the linear range determined consecutive to each sequence of
measurements. All compounds were removed that had insufficient signal-to-noise ratios (SNR<20:1) for
quantification
The data set confined to the linear range was then exported to Agilent Mass Profiler Professional software where
the peak areas of all compounds of each analysis were normalized according to a standard procedure of the
software to the peak area of the internal standard as shown in Equation 5.
Istdxnor AAA 22 loglog
Equation 5
Anor: Area value normalized
Ax: Area value before normalization
AIstd: Area value internal standard
The normalized data set was then subjected to principle component analysis and hierarchical clustering.
Analytical characterization and comparison of Tristyrylphenol ethoxylates used in agrochemical formulation
66
4.3.6 Validation
Linearity was defined by the linearity range of the used mass spectrometric detector and by the LOQ for the
analytes. The linear ranges of 30 mg/L to 0.1 mg/L of TSP with 16 EO units (referring to the weighted amount
of TSP-16-ethoxylates) and 100 mg/L to 1 mg/L of the internal standard hexanophenone were defined
accordingly.
Precision was determined on three repetition analyses at a level of 60 mg/L for the internal standard and 40 mg/L
for TSP (16-EO units). The LOQ was defined as a signal-to-noise ratio of at least 20:1 which was calculated via
the height of the respective analytes.
The specificity of the method was ensured not only by using exact mass measurements for identification and
extraction of each investigated component in TSP-16-ethoxylates, but also by using the retention time windows
in which the different styrenated phenol ethoxylates were eluted under the given chromatographic conditions.
Thereby, false positive hits were as much reduced as possible.
4.4 Results and Discussion
4.4.1 Method Development
For method development a sample of commercially available TSP-16-ethoxylates was used. For analysis
reversed phase liquid chromatography (RP-LC) coupled via atmospheric pressure chemical ionization (APCI) to
a Time-of-Flight mass spectrometry (ToF-MS) with exact mass measurement was used. The latter was necessary
to enable identification of the single ethoxylated entities in the sample. The coupling of APCI was chosen in the
first place as the target analytes are nonionic molecules. Chromatographic separation according to the functional
groups via reversed phase liquid chromatography was achieved as shown in Figure 21 (a) together with the mass
spectra of the identified peaks in Figure 21 (b) for polyethylenglycol (PEG), in Figure 21 (c) for
monostyrylphenol (MSP), in Figure 21 (d) for distyrylphenol (DSP), in Figure 21 (e) for tristyrylphenol (TSP)
and in Figure 21 (f) for tetrastyrylphenol (TeSP) ethoxylates.
Analytical characterization and comparison of Tristyrylphenol ethoxylates used in agrochemical formulation
67
(a)
(b)
(c)
Analytical characterization and comparison of Tristyrylphenol ethoxylates used in agrochemical formulation
68
(d)
(e)
(f)
Figure 21: Chromatographic separation of commercial available TSP-16-ethoxylates with a C18 RP-LC
coupled via APCI in positive mode to a ToF-MS with exact mass measurement. Indicated are PEG, (1)
MSP-, (2) DSP-, (3) TSP- and (4) TeSP ethoxylates in Figure 21 (a). The mass spectra of the identified
Analytical characterization and comparison of Tristyrylphenol ethoxylates used in agrochemical formulation
69
peaks are displayed in Figure 21 (b) for polyethylenglycol (PEG), in Figure 21 (c) for monostyrylphenol
ethoxylates (MSP), in Figure 21 (d) for distyrylphenol (DSP), in Figure 21 (e) for tristyrylphenol (TSP)
and in Figure 21 (f) for tetrastyrylphenol (TeSP).
For identification of the different molecules a coupling to a (ToF-MS) with exact mass measurement was used.
Entities of MSP (1), DSP (2), TSP (3) and TeSP (4) ethoxylates were identified and separated according to the
degree of styrenation. Furthermore, entities of PEG were identified, eluted between tR=1.0 min and tR=7.0 min.
As there are numerous possibilities for the analysis of PEG and as the focus of this work is on the
characterization of the main component, i.e., the actual surfactant, analysis of PEG was not elaborated further.
The identified m/z are [M+(NH4)]+ adducts, due to the composition of the eluent, which has been modified with
5 mM of NH4COOH.
The mass spectra of the different styrylphenol ethoxylates derivates obtained by APCI also show PEG with a
range of 3 (m/z =168.1230 amu; [M+(NH4)]+) to 8 (m/z =388.2545 amu; [M+(NH4)]+) EO units. As PEG
originating from the sample has been chromatographically separated at the beginning of the gradient, the
observed PEG within the peaks of MSP-, DSP-, TSP- and TeSP-ethoxylates, respectively, were caused by in-
source degradation of the polyether chain during ionization, as described in literature [33]. As a consequence of
the distribution each of the styrylphenol ethoxylate derivates is discriminated to shorter chain lengths and the
original distribution cannot be retraced. Reducing vaporization temperature or corona current did not improve
the result, so APCI was considered unsuitable for determining the actual distribution of EO chain length in
nonionic surfactants.
Therefore, the ionization performance of the target analytes was tested on two further ionization devices for the
coupling of liquid chromatography and mass spectrometry, APPI and ESI in positive ionization mode.
Exemplarily, the mass spectrum for the peak of TSP-ethoxylates was used for comparison with the results shown
in Figure 22 (a) for APPI and in Figure 22 (b) for ESI.
Analytical characterization and comparison of Tristyrylphenol ethoxylates used in agrochemical formulation
70
(a)
(b)
Figure 22: Ionization behavior of TSP-ethoxylates ionized by APPI (a) and ESI (b). In each case the of
TSP-ethoxylates is shown. For each experiment the same elution conditions with water and methanol as
mobile phase, plus 5 mM ammonium formiate each eluent were chosen. For ESI (b) an Agilent 6220 ToF-
MS with exact mass measurement and for APPI (c) a Thermo Orbitrab Q-exactive had been used.
As shown there are substantial differences in the ionization behavior of the different TSP-16-ethoxylates
between the investigated types of ionization devices. The spectrum obtained by APPI showed the different TSP
ethoxylates as almost t-distributed, without apparent degradation products except for the signal at 321.24 amu
corresponding to DSP. All entities are detected with their molar masses as the dominant signal being a [M+Na]+
adduct. The mean of the distribution, however, is at TSP ethoxylate with 15 EO units and not at TSP with 16 EO
units as expected for TSP-16-ethoxlyates. Because of its softer mode of ionization APPI leads to less in-source
degradation than observed for APCI, though possibly discriminating entities with higher EO chain length during
ionization [34].
Analytical characterization and comparison of Tristyrylphenol ethoxylates used in agrochemical formulation
71
The spectrum obtained by ESI showed two clusters of signals which corresponded to single- and double-charged
entities of the TSP ethoxylates molar masses. Degradation products, such as PEG for APCI, were not observed.
The double charged state of the TSP-ethoxylates is favored for entities with longer chain length and is ranging
from TSP with 12 EO units (m/z =485.3062 amu; [M+2(NH4)]+2) to TSP with 27 EO units (m/z =815.5037
amu; [M+2(NH4)]+2), whereas the single charged entities are ranging from TSP with 4 EO units
(m/z=600.3961 amu; [M+(NH4)]+) to TSP with 26 EO units (m/z =1568.9413 amu; [M+(NH4)]+). For some
entities both single- and double-charged masses are detected, so that the spectrum has to be deconvoluted in the
end for analysis.
Although APPI and ESI are performing comparably on TSP-16-ethoxylates, TSP with an average chain length of
40 EO units is analyzed next, to determine if both techniques of ionization are applicable for nonionic surfactants
with higher degree of ethoxylation. Again the spectrum is taken for the chromatographic peak of TSP
ethoxylates, with the results shown in Supplementary. For ESI only the molar masses of TSP-ethoxylates are
detected as single- to fourfold-charged entities without apparent in-source degradation of the ions through
ionization. For APPI, however, a complex spectrum with a wide variety of mass signals is received, which can
only partly be assigned to TSP ethoxylates like the highest mass signal to TSP ethoxylate with 33 EO units.
Apparently ionization of TSP ethoxylates is limited with APPI to entities with a shorter EO chain, resulting in
fragmentation of entities with a longer EO chain.
As their actual composition can be determined without discrimination during the ionization process ESI is
chosen as coupling of LC to ToF-MS to characterize TSP-16-ethoxylates of different suppliers according to their
degree of styrenation and ethoxylation.
4.4.2 Method for the Quantitative Determination
Internal Standard for Quantification
As there is no analytical standard available to quantify the different components in commercial TSP-16-
ethoxylates, an internal standard was used to compensate for variations in the performance of the LC-MS
instrument, variation in the sample composition and enabling comparison of TSP-16-ethoxylates between
different suppliers. Hexanophenone was chosen as internal standard because it is easily available, not co-eluting
with the target analytes (see Figure 23) and has a comparable detector response as the target analytes as shown in
the following. For the quantitative comparison of different suppliers of TSP-16-ethoxylates the gradient was
shortened in order to save analysis time in comparison to the gradient used for identification of the single
compounds in TSP-16-ethoxyltes as shown in Figure 21 (a).
Analytical characterization and comparison of Tristyrylphenol ethoxylates used in agrochemical formulation
72
Figure 23: Usage of hexanophenone as internal standard for the quantification of the styrenated phenol
ethoxylates contained in TSP-16-ethoxylates. Hexanophenone, shown in lower the figure, is not co-eluting
with the target analytes, MSP-, DSP-, TSP- and TeSP-ethoxylates, shown in the upper figure. The
shortened gradient is still sufficient to separate the different styrenated phenol ethoxylates.
As shown the different styrenated phenol ethoxylates are still separated well enough and the overlapping of the
peaks of TSP- and TeSP-ethoxylates can be accepted, because identification and extraction of the single
ethoxylate entities is ensured via the detection with ToF-MS and exact mass measurement.
Linear Range
The linear ranges for both internal standard and target analytes were defined based on the linearity range of the
used mass spectrometric detector and by the LOQ for the analytes which had been defined at a signal-to-noise
ratio of at least 20:1 to ensure acceptable quantification. As representative for the target analytes, TSP ethoxylate
with 16 EO units was chosen, as it is the most abundant component in the investigated TSP-16-ethoxylates. The
results for the linear range and the relative standard deviation of the method for both analytes are shown in Table
11 together with the precision of 3 repetition analyses at a level of 60 mg/L for the internal standard and 40 mg/L
for TSP with 16-EO units. The linearity plots and the EICs of both analytes at the corresponding limit of
quantification (LOQ) are given in the Supplementary.
Analytical characterization and comparison of Tristyrylphenol ethoxylates used in agrochemical formulation
73
Table 11: Linear range and the relative standard deviation of the method for the analytes TSP with 16 EO
units and hexanophenone, together with the precision of 3 repetition analyses at a level of 60 mg/L for the
internal standard and 40 mg/L for TSP with 16 EO units and the LOQ.
TSP with 16 EO units Hexanophenone
Linear range [mg/L] 0.3-33.2 1.2-122.0
R 0.9997 0.9993
Relative standard deviation of the
Method Vx0 [%]
3.0 2.6
Precision [%] 2.5 1.9
LOQ [mg/L] 0.3* 6.0
*calculated based on the weighted amount of TSP-16-ethoxylates (Supplier A, batch 1)
Both hexanophenone and TSP with 16 EO units show a comparable linear range and response for the LC-ToF-
MS with ESI. Based on the ionization behavior of TSP with 16 EO units, a linear response for the other TSP
ethoxylates as well as for MSP, DSP and TeSP ethoxylates is assumed. For every measurement the linear range
is defined beforehand and only those compounds within this range are normalized against the content of internal
standard and used for comparison of the different suppliers of TSP-16-ethoxylates.
Nevertheless, determination of the exact distribution of different entities in TSP-16-ethoxylates was not possible,
as the ionization yield of each of the ethoxylates is depending on the EO chain length and its functionalization.
As the aim of this work is the relative comparison of different suppliers of TSP-16-ethoxylates and not an
absolute quantification of the single components this limitation is acceptable.
4.4.3 Comparison of TSP-16-ethoxylates of different Suppliers and Qualities
For comparison of different suppliers of TSP-16-ethoxylates three different suppliers and two different product
qualities for one of the suppliers were compared with respect to their relative content of nonionic surfactants
using the method developed in this work. To this end, data analysis techniques used for example in proteomics
[35-37] or forensics [38-40] have been utilized, where data sets containing multiple components in each sample
are analyzed on significant variations among samples and the compound(s) responsible for it. For this work
Analytical characterization and comparison of Tristyrylphenol ethoxylates used in agrochemical formulation
74
complementary principle component analysis (PCA) and hierarchical clustering (HCA) were used as
recommended by Boyd [41] and Want [42].
Accordingly, from each of the suppliers and qualities at least 9 different production batches were purchased and
analyzed in order to account for variations in the production processes. For each batch three replicate analyses
were performed to account for possible instrument variations. The analytical raw data of all analyses were
subjected to a 2-step targeted data mining approach using the data base composed in this work. The PCA was
conducted then on the complete data set with three repetition analyses of each sample, in order to visualize the
error of the analytical method. The PCA was performed on conditions, i.e. the PCA was performed on the
different samples and not on the compounds identified in the samples [43]. The results of the PCA are displayed
in Figure 24.
Figure 24: PCA of the data sets from supplier A (Cross), B1 (Arrow), B2 (Horizontal Bar) and C (Vertical
bar). The results of 3 repetition analysis each production batch of TSP-16-ethoxylates of the investigated
suppliers were used for this PCA.
The variations in the data set are mainly explained by the first two components, as displayed in Figure 24.
Distinct clusters were formed, which correspond to the respective suppliers A (Cross), B (B1: Arrow; B2:
Horizontal Bar) and C (Vertical Bar). The data points corresponding to the different qualities B1 and B2,
however, are overlapping and form a combined cluster. The variations in the extracted data sets of the suppliers
A, B and C are big enough to result in distinct clusters in PCA. Conversely, the variations between the
production batches of each supplier and between the replicate analyses for each batch are significantly smaller
than between the different suppliers of TSP-16-ethoxylates. As the production batches of each of the suppliers
cover at least four different production campaigns and a time span of three to four years, respectively, the
observed differences can be viewed as systematic and not random. To elucidate on which compounds the
Analytical characterization and comparison of Tristyrylphenol ethoxylates used in agrochemical formulation
75
observed variations in the PCA are based on, their score in direction of the 2 components is plotted as well and
shown in Figure 25.
Figure 25: Loading of each compound of MSP-, DSP-, TSP- TeSP ethoxylates and MSP- and DSP-
copolymerized-propoxylates-ethoxylates for both components obtained by the PCA on conditions as
shown in Figure 24.
The results shown in Figure 25 indicate that the variation in component 1 is mainly explained by the content of
the copolymerized-propoxylated-ethoxylated compounds of MSP (Plus) and DSP (Triangle). The variation in
component 2 is explained by the content of ethoxylated compounds of TeSP (Circle) and MSP (Square). The
content of ethoxylated compounds of TSP and DSP, however explain none of the variations in component 1 or 2
which led to the clustering observed in Figure 24. According to these results supplier A and C are differentiated
according to their content of MSP and TSP-ethoxylates and supplier B separated due to its content of MSP- and
DSP- copolymerized-propoxylates-ethoxylates. The HCA was performed combined on the suppliers, as well as,
on the compounds in each data set in order to analyze which compounds were responsible for the variations
between the suppliers and qualities, respectively. As the results of the PCA had shown little variation originating
from the analytical method, the results of the three repetition analyses of each batch were averaged. The
clustering arrays of the compounds are numbered and marked with brackets within the displayed HCA in Figure
26. These single compounds in these arrays are given in Supplementary.
Analytical characterization and comparison of Tristyrylphenol ethoxylates used in agrochemical formulation
76
Figure 26: Combined hierarchical clustering of the samples (x-axis) and the compounds (y-axis) detected
in the samples of supplier A (grey), B1 (light blue), B2 (violet) and C (dark blue). Each sample is the
average of 3 repetition analyses. The content of a compound in the analyzed sample is coded via a colored
rectangle in the column beneath the respective sample. The color ranges from deep blue, compound not
detected, over yellow, compound as abundant as internal standard, to red, compound with the maximum
Analytical characterization and comparison of Tristyrylphenol ethoxylates used in agrochemical formulation
77
content. Numbered and marked with brackets are those arrays of compounds which are responsible for
the observed clustering of samples according to their suppliers and qualities. The single compounds are
listed in Supplementary
The HCA confirmed the clustering obtained in the PCA. The dendrogram displayed in the top of Figure 26 is
forming three main clusters marked in color in the bottom line starting with cluster 1 containing the samples of
supplier A (grey) than cluster 2 containing those of supplier C (dark blue) and finally cluster 3 for containing
both qualities B1 (light blue) and B2 (violet) of supplier B.
The actual compounds responsible for the observed clustering are given in y-axis and are marked with numbered
arrays. Array 1 lists the compounds that distinguish Supplier B, B1 and B2 from the other suppliers. Samples of
supplier B contain copolymerized propoxylates-ethoxylates of MSP and DSP, which are not detected in the
samples of supplier A and C. These compounds may be explained as contamination originating from the
production of copolymerized propoxylates-ethoxylates of TSP which are also produced by supplier B. Based on
their contents of ethoxylates or copolymerized propoxylates-ethoxylates of MSP, DSP, TSP and TeSP, a
differentiation, however, was not possible between the two qualities of supplier B, B1 and B2. There is at least
no difference in quality between B1 and B2, regarding their content of nonionic-surfactants.
Supplier A and C are mainly differentiated by their content of MSP-ethoxylates (array 3), but also to some
extend by the content of TeSP-ethoxylates (array 4). MSP-ethoxylates are detected in all samples of supplier A,
whereas for supplier C and B (B1 and B2) these compounds are only present in few samples. TeSP-ethoxylates
are present for some samples of supplier C whereas they are absent for all samples of supplier A. The arrays 2
and 5, which contain DSP-, TSP- and TeSP-ethoxylates, show little or no contribution to the observed clustering
of samples. There is hardly any variation in the content of these compounds in the samples of all suppliers. These
findings correlate with those of the PCA, where mainly the content of MSP-ethoxylates and of copolymerized
propoxylates-ethoxylates MSP and DSP and to some extend TeSP-ethoxylates were responsible for the
variations between the different suppliers, resulting in the observed clustering.
The methodology combining instrumental analysis and multivariate data analysis was successfully transferred
for the characterization and differentiation of TSP-16-ethoxylates from different suppliers based on their content
of styrenated phenol ethoxylates. The content of contaminants (supplier B1/B2) and the content of MSP- and
TeSP-ethoxylates (supplier A and C) were differing between the suppliers, whereas the content of main
components, DSP- and TSP-ethoxylates, was comparable. The differences in the content of the surface-active
entities in commercial TSP-16-ethoxylates of the suppliers are significant, however, in the properties of
Analytical characterization and comparison of Tristyrylphenol ethoxylates used in agrochemical formulation
78
agrochemical formulations no differences were observed for different qualities neither during preparation of the
formulation nor during or after storage tests (data not shown).
There are several methods published using LC-MS for the characterization of nonionic surfactants in various
matrices, among others in agrochemical formulations. Characterization of nonionic surfactants according to
hydrophobic chain and degree of ethoxylation using LEAC as proposed by Trathnigg [22-26] was only
demonstrated in absence of matrix compounds and so cannot be applied for complex matrices such as
agrochemical formulations. Another standard approach is using matrix assisted laser desorption ionization
(MALDI) ToF-MS for characterization of nonionic surfactants [44]. The mass spectra obtained by MALDI-ToF-
MS, however, are not easy to interpret, especially the more compounds are detected. In the case of the variations
observed in the analyzed TSP-16-ethoxylates this could result in very complex and hardly interpretable mass
spectra.
Another approach for the determination of nonionic surfactants in complex matrices was shown using GCxGC
or LCxLC coupled to MS [27;29]. These enable identification of the respective surfactants in the samples,
however, lack quantitative information and multivariate data analysis needed for comparison of different
samples. A characterization of nonionic surfactants in an agrochemical formulation, namely octylphenol and
nonylphenol ethoxylates has been shown by Meisen et al. [31] using a combination of different techniques with
the focus on quantification of the total amount of surfactant. For that investigation, however, a combination of
different techniques in different analysis steps was necessary, using at first RPLC for fractionation of the target
analytes, which were then analyzed on their distribution of ethoxylates via NPLC followed by a consecutive
identification of the prior fractionated nonionic surfactant via GC-MS and MALDI-ToF-MS. This is very time
consuming and laborious especially for a large number of samples.
The method developed in this work, using LC-ToF-MS with exact mass measurement in combination with
multivariate data analysis, offers a fast and comprehensive semi-quantitative comparison of a nonionic surfactant
of different suppliers, such as TSP-16-ethoxylates. The characterization obtained by this method can aid the
formulation chemist in comparing different suppliers for one surfactant and thus aiding his choice.
Analytical characterization and comparison of Tristyrylphenol ethoxylates used in agrochemical formulation
79
4.4.4 Statistical Evaluation of the Results on the Content of the Components in TSP-
16-ethoxylates on their Use for Product Identification
There are substantial differences regarding the content of the main components, MSP-, DSP-, TSP- and TeSP-
ethoxylates, and the by-products, copolymerized propoxylates-ethoxylates of MSP and DSP, in commercial
TSP-16-ethoxylates. These differences are specific for the analyzed suppliers A, B and C and could be possibly
further used for product identification. Therefore, model formulation samples were prepared containing TSP-16-
ethoxylates of each supplier and quality (A, B1, B2, C). These samples were then analyzed with the new method
in order to test if they were assigned correctly to their suppliers using both PCA and hierarchical clustering. In
the following, the results of the PCA (Figure 27) and of the hierarchical clustering (HCA) (Figure 28) are shown.
For the HCA only the clustering according to the samples were of interest and so the clustering in y-axis of the
compounds is shown only compressed.
Figure 27: PCA of the data sets from supplier A (Cross), B1 (Arrow), B2 (Horizontal Bar) and C (Vertical
bar) together with the data of the formulation samples containing TSP-16-ethoxylates of supplier A
(Square), B1 (Diamond), B2 (Circle) and C (Triangle). For the PCA the whole data set was taken
including the 3 repetition analysis each production batch and formulation sample.
Analytical characterization and comparison of Tristyrylphenol ethoxylates used in agrochemical formulation
80
Figure 28: Combined hierarchical clustering of the samples (x-axis) and the compounds (y-axis) detected
in the samples of supplier A (grey), B1 (magenta), B2 (turquoise) and C (blue) together with sample of
formulation containing TSP-16-ethoxylates of Supplier A (red), B1 (yellow), B2 (brown) and C (green).
Each sample is the average of 3 repetition analyses. The content of a compound in the analyzed sample is
coded via a colored rectangle in the column beneath the respective sample. The color ranges from deep
blue, compound not detected, over yellow, compound as abundant as internal standard, to red, compound
with the maximum content.
As demonstrated, both data analysis techniques are correctly assigning the TSP-16-ethoxylates in the model
formulation to their corresponding supplier. For the PCA all four formulation samples are identified in their
corresponding supplier cluster. They are all group within the clusters of their suppliers, as shown in the top
dendrogram. The linkage of the formulation samples to a sample of the corresponding supplier cluster in the
hierarchical clustering was formed for all four samples at least two levels lower than the linkage of the respective
supplier cluster. The assignments to the corresponding suppliers displayed in Figure 28 are thus reasonable. The
developed method combining instrumental analysis and multivariate data mining enables the identification of a
supplier of TSP-16-ethoxylates, without apparent matrix interference even though another functionalized PEG,
an ethoxylated alcohol, had been used as well in the chosen model formulation.
This is only possible because the reliable identification and quantification of the single compounds used for
differentiation of the suppliers is ensured by the combination of chromatographic separation and detection via
Analytical characterization and comparison of Tristyrylphenol ethoxylates used in agrochemical formulation
81
exact mass measurement. Albeit this method is highly selective for its target analytes, interferences caused by
the matrix were observed for agrochemical formulations containing terminal sulfated or phosphated TSP-
ethoxylates and/or copolymerized propoxylates-ethoxylates of TSP besides TSP-16-ethoxylates (see
Supplementary). Formulation using a combination of TSP-16-ethoxylates and another TSP-ethoxylates derivate
are not widely spread and so this interference can be accepted. Nevertheless, further investigations should test
the possibility for a correction of the observed interferences.
For agrochemical formulations containing TSP-16-ethoxylates without other nonionic surfactants functionalized
with TSPs, identification of the supplier of TSP-16-ethoxylates for anti-counterfeiting purposes via the method
described in this work would be possible. Analyzing the chemical composition of a subcomponent of an
agrochemical formulation might provide an additional tool to established techniques of anti-counterfeiting, such
as specialized packing material [45], Radio Frequency Identification (RFID) [46], bulk analysis of products via
for example NIR [47;48] or NMR [49]. The chemical composition of the whole product or one of its
subcomponents can hardly be retraced with these techniques. This chemical composition, however, can be highly
significant for identification of counterfeited products. Although the spectroscopic techniques, NIR and NMR,
are also sensitive to the chemical composition, they are at the same time very sensitive to non-chemical
influences such as grain size, morphology etc. Therefore they require time consuming calibration and constant
monitoring of these non-chemical features. In this regard, the developed method is more robust and additionally
allows tracing of the chemical features more easily.
4.5 Conclusion
A fast and comprehensive semi-quantitative method for the characterization of surface active TSP-16-
ethoxylates (tristyrylphenol ethoxylates with an average number of 16 EO units) using LC-ToF-MS with exact
mass measurement combined with multivariate data analysis was developed. The method allows the
determination of the main components which were identified as monostyrylphenol (MSP), distyrylphenol (DSP),
tristyrylphenol (TSP) and tetrastyrylphenol (TeSP) ethoxylates. It was possible to quantify the single ethoxylated
entities in the sample normalized against an internal standard and to subject the result to multivariate data
analysis for analytical characterization and comparison of the different TSP-16-ethoxylates.
From the results of the multivariate data analysis the single ethoxylated entities could be retraced, It was shown
that there are substantial differences in the composition of commercial TSP-16-ethoxylates supplied by four
different producers and available in up to two qualities, with respect to their content of MSP-, DSP-, TSP- and
TeSP ethoxylates, but not with respect to their number and distribution of ethylene oxide units. These differences
Analytical characterization and comparison of Tristyrylphenol ethoxylates used in agrochemical formulation
82
could be successfully used to predict the corresponding supplier of TSP-16-ethoxylates in an agrochemical
model formulation. Therefore, using the by-product spectrum of formulation additives might provide an
interesting alternative for identification of the origin of agrochemical products in anti-counterfeiting.
For future work the usability of the method for product characterization of other ethoxylated surfactants could be
investigated, thus aiding the formulation chemist on the suitable choice for this class of surfactants, reducing the
need for long term storage tests. Finally, the method could be adapted to more sophisticated mass spectrometers
like the Q-Exactive using the Orbitrap-technology to obtain higher mass resolution and so better performance
regarding the identification of the single compounds. For some analytes and matrices the resolution of the ToF-
MS used in this thesis is not sufficient to resolve the analyte m/z-signal from nearly isobaric analyte or matrix
signals. This has been stressed out by Marshall et al [50] for the use of high-resolution MS for petroleum
analysis. In context of this work such a highly complex composition of analytes and matrix, respectively, would
be represented by copolymerized propoxylates-ethoxylates tristyrylphenol, which have variations in regard to the
number of styrenes, the degree of propoxylation and ethoxylation.
4.6 Acknowledgement
The authors gratefully acknowledge the department of formulation technology at Bayer CropScience both the
formulation technology team and the analytical team for the financial, technical and intellectual support. We also
acknowledge the support by the team for structure elucidation in the department of metabolism for providing
time and capacity for measurement on the Q-Exactive Orbitrap mass spectrometer.
4.7 Reference List
1. Glaubitz J, Molt K, Schmidt T (2014) Composition of the surfactant Aerosol OT and its influence on the properties of an agrochemical formulation. J Surf Deterg
2. Morrison EB (1970) Accelerated storage test using a programmed temperature rise. Pestic Sci 1:268-269 3. Rogers AR (1970) A Review on accelerated chemical tests. Pestic. Sci. 1:266-268 4. 104th Congress. Food Quality Protection Act. 104-170
http://www.epa.gov/pesticides/regulating/laws/fqpa/gpogate.pdf. Acessed: March 2014 5. The european parliament and the council of the european union. Regulation (EC) No 1907/2006 of the
european parliament and of the council of 18 December 2006 concerning the registration, evaluation, authorisation and restriction of chemicals (REACH) establishing a european agency, amending directive 1999/45/EC and repealing council regulation (EEC) No793/93 and commission regulation (EC) No 1488/94 as well as coucil directive 76/769/EEC and commission directives 91/155/ECC, 93/105/EC and 2000/21/EC. 1907/2006. 10-12-2011. http://www.reach-compliance.eu/english/REACH-ME/engine/sources/regulations/launch-1907-2006-EC.html. Accessed: March 2014
6. European Parliament. Regulation (EC) No 1107/2009 of the European Parliament and of the Council of 21 October 21 concerning the placing of plant protection products on the market and repealing Council Directives 79/177/EEC and 91/414/EEC. 2009. http://eur-
Analytical characterization and comparison of Tristyrylphenol ethoxylates used in agrochemical formulation
83
lex.europa.eu/LexUriServ/LexUriServ.do?uri=OJ:L:2009:309:0001:0050:EN:PDF. Accessed: March 2014
7. Wacker A, Schaefer C, Woerndle A, Milbradt R (2012) Agrochemical formulations of pesticides in water as suspension concentrates with copolymers. WO 2012-EP1080
8. Clariant, Product range, Crop Protection. http://www.clariant.com/C12575E4001FB2B8/vwLookupDownloads/2008_CropProtection_Newsroom_Brochures_CropProtectionProductRange.pdf/$FILE/2008_CropProtection_Newsroom_Brochures_CropProtectionProductRange.pdf. Accessed: March 2014.
9. Dieleman C, Mayer W, Schmitt M, Jakob J, Strathmann S (2012) Emulsifiable concentrate comprising pesticide, dimethyl sulfoxide, benzyl alcohol, alkyl lactate and diester. WO 2012-EP73226
10. Bristow JT (2011) A new aqueous suspo-emulsion. WO 2011-CN84191 11. Tadros TF (2008) Applied Surfactants, Principles and Applications. Wiley-VCH, Weinheim. 12. Mollet H, Grubenmann A (2000) Formulationtechnology, Emulsions, Suspensions and Solid Forms.
16. Miszkiewicz W, Szymanowski J (1996) Analysis of Nonionic Surfactants with Polyoxyethylene Chains by High-Performance Liquid Chromatography, Crit Rev Anal Chem 25:203-246.
17. Abrar S, Trathnigg B (2011) Characterization of polyoxyethylenes according to the number of hydroxy end groups by hydrophilic interaction chromatography at critical conditions for polyethylene glycol, Anal Bioanal Chem 400:2531-2537.
18. Rissler K (1999) Improved separation of polyethylene glycols widely differing in molecular weight range by reversed-phase high performance liquid chromatography and evaporative light scattering detection Chromatographia 49:615-620.
19. Ungewiß J, Vietzke JP, Strassner M, Rapp C, Feuerstein B (2003) Quantitative determination of non-ionic surfactants by high-performance liquid-chromatography-ion trap mass-spectrometry Chromatographia 57:73-76.
20. Rissler K (1996) High-performance liquid chromatography and detection of polyethers and their mono(carboxy)alkyl and -arylalkyl substituted derivatives J Chromatogr A 742:1-54.
21. Di Corcia A (1998) Characterization of surfactants and their biointermediates by liquid chromatography mass spectrometry J Chromatogr A 794:165-185.
22. Trathnigg B, Gorbunov A (2001) Liquid exclusion adsorption chromatography: new technique for isocratic separation of nonionic surfactants: I. Retention behaviour of fatty alcohol ethoxylates J Chromatogr A 910:207-216.
23. Trathnigg B (2001) Liquid exclusion adsorption chromatography, a new technique for isocratic separation of nonionic surfactants: II. Quantitation in the analysis of fatty alcohol ethoxylates J Chromatogr A 915:155-166.
24. Trathnigg B, Kollroser M, Rappel C (2001) Liquid exclusion adsorption chromatography, a new technique for isocratic separation of nonionic surfactants: III. Two-dimensional separation of fatty alcohol ethoxylates J Chromatogr A 922:193-205.
25. Trathnigg B, Rappel C (2002) Liquid exclusion adsorption chromatography, a new technique for isocratic separation of nonionic surfactants: IV. Two-dimensional separation of fatty alcohol ethoxylates with focusing of fractions J Chromatogr A 952:149-163.
26. Trathnigg B, Rappel C, Raml R, Gorbunov A (2002) Liquid exclusion adsorption chromatography: a new technique for isocratic separation of non-ionic surfactants: V. Two-dimensional separation of fatty acid polyglycol ethers J Chromatogr A 953:89-99.
27. Elsner V, Laun S, Melchior D, Koehler M, Schmitz OJ (2012) Analysis of fatty alcohol derivatives with comprehensive two-dimensional liquid chromatography coupled with mass spectrometry J Chromatogr A 1268:22-28.
28. Trathnigg B, Ahmed H (2011) Separation of all oligomers in polyethylene glycols and their monomethyl ethers by one-dimensional liquid chromatography Anal Bioanal Chem 399:1523-1534.
29. Wulf V, Wienand N, Wirtz M, Kling HW, Gaeb S, Schmitz OJ (2010) Analysis of special surfactants by comprehensive two-dimensional gas chromatography coupled to time-of-flight mass spectrometry J Chromatogr A 1217:749-754.
30. Socher G, Rissler K, Walter U, Lankmayr (2001) Electrospray Ionization Tandem Quadrupole Mass Sepctrometry for the Characterization and Identification of Ethoxylated Surfactants Tenside Surfact Det 38:80-85
31. Meisen S. (2008) Analytik von Alkylphenolethoxylaten in Pflanzenschutzmitteln und anderen Matrices University of Duisburg-Essen.
Analytical characterization and comparison of Tristyrylphenol ethoxylates used in agrochemical formulation
84
32. Thermo Scientific. Maintaining your Orbitrap. http://planetorbitrap.com/data/uploads/509da1e82edf0.pdf Accessed: March 2014.
33. Desmazieres B, Buchmann W, Terrier P, Tortajada J (2007) APCI Interface for LC- and SEC-MS Analysis of Synthetic Polymers: Advantages and Limits Anal. Chem. 80:783-792.
34. Robb DB, Covey TR, Bruins AP (2000) Atmospheric Pressure Photoionization: An Ionization Method for Liquid Chromatography Mass Spectrometry Anal. Chem. 72:3653-3659.
35. Norden B, Broberg P, Lindberg C, Plymoth A (2005) Analysis and Understanding of High-Dimensionality Data by Means of Multivariate Data Analysis. Chem Biodivers 2:1487-1494.
36. Biron DG, Brun C, Lefevre T, Lebarbenchon C, Loxdale HD, Chevenet F, Brizard JP, Thomas F (2006) The pitfalls of proteomics experiments without the correct use of bioinformatics tools. Proteomics 6:5577-5596.
37. Dowsey AW, English JA, Lisacek F, Morris JS, Yang GZ, Dunn MJ (2010) Image analysis tools and emerging algorithms for expression proteomics. Proteomics 10:4226-4257.
38. Choy K, Smith CI, Fuller BT, Richards MP (2010) Investigation of amino acid δ13C signatures in bone collagen to reconstruct human palaeodiets using liquid chromatography-isotope ratio mass spectrometry. Geochim Cosmochim Ac 74:6093-6111.
39. Moller JKS, Catharino RR, Eberlin MN (2005) Electrospray ionization mass spectrometry fingerprinting of whisky: immediate proof of origin and authenticity. Analyst 130:890-897.
40. Weller P, Boner M, Foerstel H, Becker H, Peikert B, Dreher W (2011) Isotopic Fingerprinting for the Authenticity Control of Crop Protection Active Compounds using the Representative Insecticide Fipronil. J Agr Food Chem. 59:4365-4370.
41. Boyd TJ, Osburn CL, Johnson KJ, Birgl KB, Coffin RB (2006) Compound-Specific Isotope Analysis Coupled with Multivariate Statistics to Source-Apportion Hydrocarbon Mixtures Environ Sci Technol 40:1916-1924.
42. Want E (2009) Challenges in applying chemometrics to LC MS-based global metabolite profile data. Bioanalysis 1:805-819.
43. Agilent Technologies Inc., Strand Life Sciences Pvt.Ltd. (2011) Mass Profiler Professional. Version 2.1 44. Ayorinde FO, Eribo BE, Johnson JH, Elhilo E (1999) Molecular distribution of some commercial
nonylphenol ethoxylates using matrix-assisted laser desorption/ionization time-of-flight mass spectrometry Rapid Commun Mass Sp 13:1124-1128.
45. Zhang J, Ge M (2011) Effect of polymer matrix on the spectral characteristics of spectrum-fingerprint anti-counterfeiting fiber J Tex I 103:193-199.
46. Reep P (2007) RFID and DNA taggant authentication systems and methods to prevent coumterfeiting, grey and black market proliferation of pharmaceutical, medical and other products. US 2007-622135
47. Storme-Paris I, Rebiere H, Matoga M, Civade C, Bonnet PA, Tissier MH, Chaminade P (2010) Challenging Near InfraRed Spectroscopy discriminating ability for counterfeit pharmaceuticals detection Anal Chim Acta 658:163-174.
48. Yang Z (2006) IR spectrum-based device for identifying real from fake commercial merchandise and other products CN 2006-10022036
49. Holzgrabe U, Malet-Martino M (2011) Analytical challenges in drug counterfeiting and falsification The NMR approach J Pharmaceut Biomed 55:679-687
50. Marshall AG, Rodgers RP (2004) Petroleomics: The next grand challenge for chemical analysis Acc Chem Res 37:53-59.
General Conclusion and Outlook
85
5. General Conclusion and Outlook Analysis of surfactants and their properties has been widely investigated, mainly in pure form to determine their
physical-chemical properties such as water solubility, cloud point concentration or critical micelle concentration.
Analysis of surfactants is furthermore necessary in environmental samples [1-3], but also for controlling and
monitoring of the composition and content of by-products in the technical product. There are still open questions
regarding the purity of surfactants and its influence on the properties of the surfactant in complex mixtures, like
an agrochemical formulation. Also the usability of differences in the content of by-products for product
identification has potential for research. There are analytical methods known for quantification of the target
analyte sodium bis(2-ethylhexyl) sulfosuccinate (anionic) [4;5], but none for quantifying it together with its
isomeric mono esterified surface active by-products in an agrochemical formulation. For the other target analyte
tristyrylphenol ethoxylates with an average number of 16 ethylene oxide units (TSP-16-ethoxylates; nonionic),
there are analytical methods known to quantify it either as sum parameter [2;6;7] or via the different ethoxylated
entities. These methods have only been demonstrated to be suitable for pure surfactants [8-12]. The
quantification according to degree of ethoxylation in complex matrices such as agrochemical formulations has
only been shown by Meisen et al. [13] with an offline combination of LC for separation according to
hydrophobic group and degree of ethoxylation and identification via GC-MS and MALDI-ToF-MS.
For analytical characterization according to the content of main- and by-products in a single step, analytical
methods have been developed in this thesis using a LC-ToF-MS with exact mass measurement in combination
with multivariate data analysis in case of the TSP-16-ethoxylates.
With these methods significant differences were found between different suppliers of both investigated
surfactants, sodium bis(2-ethylhexyl) sulfosuccinate and TSP-16-ethoxylates with regard to the content of by-
products. For the investigation of differences in the by-product content in TSP-16-ethoxylates, an analytical
method using LC-ToF-MS with exact mass measurement in combination with multivariate data analysis was
developed. With the developed method TSP-16-ethoxylates of three different suppliers and two different
qualities for one supplier were analyzed. For both surfactants the differences in the content of by-products were
significant for the respective suppliers and production qualities. Only the two different qualities of
tristyrylphenol ethoxylates showed no significant differences regarding the content of ethoxylated compounds.
Identification of the surfactants based on the content of their by-products was possible in the raw product and
beyond that also formulated in an aged agrochemical formulation. For the identification of bis(2-ethylhexyl)
sulfosuccinate there were no interferences observed, for the identification of TSP-16-ethoxylates interferences
General Conclusion and Outlook
86
are possible whenever other derivates of tristyrylphenol ethoxylates or copolymerized ethoxylates-propoxylates
were used alongside in the agrochemical formulation. All these derivates partly contained the same styrenated
ethoxylates as by-products which were used for the identification of TSP-16-ethoxylates. Formulation using a
combination of TSP-16-ethoxylates and another TSP-ethoxylates derivate are not widely spread and so this
interference can be accepted. Nevertheless, further investigations should test the possibility for a correction of
the observed interferences.
As demonstrated, identification of the supplier of the surfactant in agrochemical formulations could be utilized
for anti-counterfeiting. In this thesis identification has only been demonstrated for a few artificially prepared
formulation samples but not for real counterfeited ones. Accordingly, further tests should be conducted for
known counterfeited samples using sodium bis(2-ethylhexyl) sulfosuccinate or TSP-16-ethoxylates to confirm
the correct classification. Nevertheless, the chosen approach using the defined by-product content of a sub-
component in an agrochemical product, would offer an additional tool in anti-counterfeiting.
Finally, the found difference in content of by-product had in case of sodium bis(2-ethylhexyl) sulfosuccinate an
impact on the storage behavior of a model agrochemical formulation containing it. A model agrochemical
formulation containing the surfactant with raised content of by-products showed sedimentation after half a year
of storage at 24°C in a climate cabinet, whereas the formulation containing the surfactant with lower content of
by-product stayed dispersed after storage. To rule out the influence of other parameters, exactly the same model
formulation had been chosen for all trials. Moreover, there were no significant differences regarding the content
of inorganic ions or the composition of the organic solvent containing sodium bis(2-ethylhexyl) sulfosuccinate.
Based on the results presented in this thesis an interference of the mono esterified by-products on the sorption-
desorption equilibrium on the dispersed hydrophobically modified particles in the formulation is proposed,
because the monoesters are surface active as well and have been used as wetting agents in the past. This type of
surfactant adsorbs rapidly on new surfaces, thus competing with the surfactant determined to stabilize the
particles in of the dispersion. This hypothesis, however, has not been proven so far. For further clarification it
would be useful to determine an adsorption isotherm for both monoesters on the used dispersed particles, to
characterize the interaction. Furthermore, a storage test with stepwise increasing content of by-product could be
carried out to determine the actual detrimental concentration.
For future research the usability of the developed method for characterization and comparison of TSP-16-
ethoxylates should be tested on other ethoxylated or copolymerized propoxylated-ethoxylated surfactants, thus
aiding the formulation chemist on the suitable choice for this class of surfactants, reducing the need for long term
General Conclusion and Outlook
87
storage tests. Furthermore, the applicability of the presented approach should be proven for the analytical
characterization of surfactants/analytes with a comparable, broad composition of main- and by-products as the
tristyrylphenol ethoxylates, such as condensed naphthalene sulfonate (Trade name: Morwet D425; Akzo Nobel).
Finally, the method could be adapted to more sophisticated mass spectrometers like the Q-Exactive using the
Orbitrap-technology to obtain higher mass resolution and so better performance regarding the identification of
the single compounds. For some analytes and matrices the resolution of the ToF-MS used in this thesis is not
sufficient to resolve the analyte m/z-signal from nearly isobaric analyte or matrix signals. This has been stressed
out by Marshall et al [14] for the use of high-resolution MS for petroleum analysis. In context of this work such
a highly complex composition of analytes and matrix, respectively, would be represented by copolymerized
propoxylates-ethoxylates tristyrylphenol, which have variations in regard to the number of styrenes, the degree
DJ (2012) Dioctyl sulfosuccinate analysis in near-shore Gulf of Mexico water by direct-injection liquid chromatography-tandem mass spectrometry. J Chromatogr A 1231:46-51.
2. Traczyk L, Szymanski A, Wyrwas B, Jaroszynski T, Lukaszewski Z (2006) Efficiency of non-ionic surfactant removal in biological sewage treatment plants Pol J Environ Stud 15:493-499.
3. Buck RC, Franklin J, Berger U, Conder JM, Cousins IT, de Voogt P, Jensen AA, Kannan K, Mabury SA, van Leeuwen SP (2011) Perfluoroalkyl and polyfluoroalkyl substances in the environment: Terminology, classification, and origins. Integr Environ Assess Manag 7: 513-541.
4. Park HS, Rhee CK (2004) Simultaneous determination of nonionic and anionic industrial surfactants by liquid chromatography combined with evaporative light-scattering detection, J Chromatogr A 1046: 289-291.
5. Ryu HR, Park HS (2010) Determination of Sodium Bis(2-ethylhexyl)Sulfosuccinate (AOT) Surfactant with Liquid Chromatography: Comparative Study of Evaporative Light Scattering Detector, Ultraviolet Detector and Conductivity Detector. J Anal Sci & Technol 1:55-60.
6. Szymanski A, Wyrwas B, Szymanowska M, Lukaszewski Z (2001) Determination of short-chained poly(ethylene glycols) and ethylene glycol in environmental samples Water Res 35:3599-3604.
7. Wyrwas B, Szymanski A, Lukaszewski Z (1998) Tensammetric determination of non-ionic surfactants combined with the BiAS separation procedure - Part 3. Determination in the presence of hydrocarbons, TALANTA 47:325-333.
8. Trathnigg B, Gorbunov A (2001) Liquid exclusion adsorption chromatography: new technique for isocratic separation of nonionic surfactants: I. Retention behaviour of fatty alcohol ethoxylates J Chrom A 910:207-216.
9. Trathnigg B (2001) Liquid exclusion adsorption chromatography, a new technique for isocratic separation of nonionic surfactants: II. Quantitation in the analysis of fatty alcohol ethoxylates J Chrom A 915:155-166.
10. Trathnigg B, Kollroser M, Rappel C (2001) Liquid exclusion adsorption chromatography, a new technique for isocratic separation of nonionic surfactants: III. Two-dimensional separation of fatty alcohol ethoxylates J Chrom A 922:193-205.
11. Trathnigg B, Rappel C (2002) Liquid exclusion adsorption chromatography, a new technique for isocratic separation of nonionic surfactants: IV. Two-dimensional separation of fatty alcohol ethoxylates with focusing of fractions J Chrom A 952:149-163.
General Conclusion and Outlook
88
12. Trathnigg B, Rappel C, Raml R, Gorbunov A (2002) Liquid exclusion adsorption chromatography: a new technique for isocratic separation of non-ionic surfactants: V. Two-dimensional separation of fatty acid polyglycol ethers J Chrom A 953:89-99.
13. Meisen S. (2008) Analytik von Alkylphenolethoxylaten in Pflanzenschutzmitteln und anderen Matrices University of Duisburg-Essen.
14. Marshall AG, Rodgers RP (2004) Petroleomics: The next grand challenge for chemical analysis Acc Chem Res 37:53-59.
Supplementary
89
6. Supplementary
6.1 General Introduction
No supplements
6.2 LC-MS Quantification of a Sulfosuccinate Surfactant in Agrochemical
Formulations
Redrafted from “Glaubitz J, Schmidt TC (2013) LC-MS Quantification of a Sulfosuccinate Surfactant in
As shown the main compounds identified are benzyl derivates of benzene, which confirms the characterization
of the light-aromatic naphtha solvent by its supplier [3;4]. 8 different production batches each supplier A1, C and
D were analyzed accordingly, on the composition of their light-aromatic solvent. Exemplary, are given in Figure
S 15 the results for one production batch of AOT product each supplier, as variations between the analyzed
production batches for suppliers were not detected. Shown are separately the range of time
0-10 min in A1-1, C-1 and D-1 and the time range 10-35min in A1-2, C-2 and D-2.
(A1-1)
Supplementary
117
(A1-2)
(C-1)
(C-2)
(D-1)
Supplementary
118
(D-2)
Figure S 15: Comparison of the chromatographic pattern of the light-aromatic naphtha solvent of selected
production batches of AOT product of the suppliers A1, C and D. Shown are separately the retention time
range 0-10 min (A1-1), C-1 and D-1) and 10-35 min (A1-2, C-2 and D-2). The analysis of the solvent was
conducted on GC-MS
The compounds listed in Table S 11 were found for all three suppliers. Observed were, however, differences
between the investigated suppliers of AOT product regarding the abundance of some compounds in the retention
time window 2.0-7.0 min.
6.3.7 Statistical evaluation of the differences in the content of AOT, monoester 2 and 3
for product identification
After having analyzed the content of AOT, monoester 2 and 3 in AOT product samples from production batches
of different suppliers the question arose if in the future such analytical data could be potentially helpful for
identifying the supplier from which an unknown sample originates. The corresponding statistical analysis was
provided by Molt K in personal communication and performed with R, a language and environment for
statistical computing and graphics [5]. The data is prepared as displayed in Table S 12 (Samples from batches of
various suppliers) and in Table S 13 (Trial storage formulation samples). The results of the data analysis in R are
given in the following together with the corresponding code.
Table S 12: Data set samples from batches of various suppliers.
Content_AOT Content_mono2 Content_mono3 Supplier Plot Symbol
Sample Name Identifier
1 62.9 1.3 0.72 A1 a A1 2 58.6 1.5 0.58 A1 a A2 3 60.2 1.7 0.93 A1 a A3 4 61.3 1.2 0.48 A1 a A4 5 62.4 2 0.82 A1 a A5 6 61.2 1.3 0.72 A1 a A6 7 62.6 1.5 0.83 A1 a A7
Supplementary
119
Content_AOT Content_mono2 Content_mono3 Supplier Plot Symbol
Sample Name Identifier
8 62.2 1.3 0.69 A1 a A8 9 64.5 2.8 1.7 A2 A A9 10 57.8 2.3 2.1 A2 A A10 11 58 2.6 2 A2 A A11 12 56.3 2.4 1.9 A2 A A12 13 60.6 2.5 1.8 A2 A A13 14 65.8 0.82 0.15 B B B1 15 65 0.58 0.26 B B B2 16 65.3 0.8 0.15 B B B3 17 73.1 1.2 0.36 B B B4 18 61.3 1.3 0.28 B B B5 19 62.1 1 0.31 B B B6 20 63 0.88 0.21 B B B7 21 71.3 1.2 0.3 B B B8 22 61.4 3.2 0.67 C C C1 23 58.8 2.5 1 C C C2 24 55.7 3.4 1 C C C3 25 62.9 2.5 1.5 C C C4 26 60.1 3.3 0.73 C C C5 27 59 2.3 0.6 C C C6 28 57.1 2.4 0.53 C C C7 29 58.7 2.4 0.54 C C C8 30 63.9 3.8 2.7 D D D1 31 61.6 3.4 2.4 D D D2 32 64.8 4.1 2.7 D D D3 33 65.1 4 2.5 D D D4 34 64.1 3.9 2.3 D D D5 35 61.2 4.1 2.8 D D D6 36 64.6 3.9 2 D D D7 37 64.2 3.8 2.3 D D D8 38 65 4 2 D D D9 39 64.4 3.1 2 D D D10 40 65.3 3.2 2.2 D D D11 41 65.2 3 2.1 D D D12 42 65.2 2.8 1.9 D D D13 43 60.9 2.9 1.8 D D D14 44 63.3 2.9 2 D D D15 45 62.5 3.3 2.2 D D D16
Table S 13: Data set trial storage formulation samples
Content_AOT Content_mono 2 Content_mono3 Supplier Plot Symbol
Sample Name
59.4 1.5 0.46 A1 a formulation_1 63.8 1.3 0.24 B B formulation_2 59.7 3.7 1.9 D D formulation_3
Supplementary
120
Pairwise t-tests
First it is tested if the means of the contents of the individual components (AOT, monoester 2 and 3) in AOT
product differ significantly between the individual suppliers.
> D <- read.table("data_set_1.txt",header=TRUE)
> attach(D)
In the following for each of the variables content of AOT (Content_AOT), monoester 2 (Content_mono2) and
monoester 3 (Content_mono3) the following operations are performed:
Bartlett’s test of the null hypothesis that the variances in each of the groups (suppliers) are the same.
These tests will show that the variances differ significantly between the individual groups.
Paired t-test between the different groups of suppliers. Due to the results of Bartlett’s test the paired t-
tests will be performed with non-pooled variances. The differences between the means are regarded as
significant between those pairs of suppliers where the observed significance level p of the paired t-test is
less than 0.05 and as highly significant for p less than 0.01.
Stripcharts including confidence intervals (95%) for the means are plotted.
AOT
> bartlett.test(Content_di ~ Supplier)
Bartlett test of homogeneity of variances data: Content_AOT by Supplier
Table S 14: Validation of the allocation to the correct supplier cluster of the single supplier samples
achieved by linear discriminant analysis
Sample_Name Real_Supplier Predicted_Supplier Result
1 A1 A1 A1 TRUE 2 A2 A1 A1 TRUE 3 A3 A1 A1 TRUE 4 A4 A1 A1 TRUE 5 A5 A1 A1 TRUE 6 A6 A1 A1 TRUE 7 A7 A1 A1 TRUE 8 A8 A1 A1 TRUE 9 A9 A2 D FALSE 10 A10 A2 A2 TRUE 11 A11 A2 A2 TRUE 12 A12 A2 A2 TRUE 13 A13 A2 A2 TRUE 14 B1 B B TRUE 15 B2 B B TRUE 16 B3 B B TRUE 17 B4 B B TRUE 18 B5 B A1 FALSE 19 B6 B B TRUE 20 B7 B B TRUE 21 B8 B B TRUE 22 C1 C C TRUE 23 C2 C C TRUE 24 C3 C C TRUE 25 C4 C A2 FALSE 26 C5 C C TRUE 27 C6 C C TRUE 28 C7 C C TRUE 29 C8 C C TRUE 30 D1 D D TRUE 31 D2 D D TRUE 32 D3 D D TRUE
Supplementary
127
Sample_Name Real_Supplier Predicted_Supplier Result
33 D4 D D TRUE 34 D5 D D TRUE 35 D6 D D TRUE
36 D7 D D TRUE
37 D8 D D TRUE 38 D9 D D TRUE 39 D10 D D TRUE 40 D11 D D TRUE 41 D12 D D TRUE 42 D13 D D TRUE 43 D14 D A2 FALSE 44 D15 D D TRUE 45 D16 D D TRUE
> ct <- table(Supplier, p$class)
> ct
Table S 15: Allocation of the samples to the respective supplier achieved by linear discriminant analysis
Supplier A1 A2 B C D
A1 8 0 0 0 0 A2 0 4 0 0 1 B 1 0 7 0 0 C 0 1 0 7 0 D 0 1 0 0 15
Table S 16: Validation of the allocation to the correct supplier cluster of the single supplier samples
achieved by linear discriminant analysis with two variables (Content_mono2 and Content_mono3)
Sample_Name Real_Supplier Predicted_Supplier Result
1 A1 A1 A1 TRUE 2 A2 A1 A1 TRUE 3 A3 A1 A1 TRUE 4 A4 A1 B FALSE 5 A5 A1 A1 TRUE 6 A6 A1 A1 TRUE 7 A7 A1 A1 TRUE 8 A8 A1 A1 TRUE 9 A9 A2 A2 TRUE 10 A10 A2 A2 TRUE 11 A11 A2 A2 TRUE 12 A12 A2 A2 TRUE 13 A13 A2 A2 TRUE 14 B1 B B TRUE 15 B2 B B TRUE 16 B3 B B TRUE 17 B4 B B TRUE 18 B5 B B TRUE 19 B6 B B TRUE 20 B7 B B TRUE 21 B8 B B TRUE 22 C1 C C TRUE 23 C2 C C TRUE 24 C3 C C TRUE 25 C4 C A2 FALSE 26 C5 C C TRUE 27 C6 C C TRUE 28 C7 C C TRUE 29 C8 C C TRUE 30 D1 D D TRUE 31 D2 D D TRUE 32 D3 D D TRUE 33 D4 D D TRUE 34 D5 D D TRUE 35 D6 D D TRUE
36 D7 D D TRUE
37 D8 D D TRUE 38 D9 D D TRUE 39 D10 D D TRUE 40 D11 D D TRUE 41 D12 D A2 FALSE 42 D13 D A2 FALSE 43 D14 D A2 FALSE 44 D15 D A2 FALSE 45 D16 D D TRUE
Supplementary
131
> ct <- table(Supplier, p$class)
> ct
Table S 17: Allocation of the samples to the respective supplier achieved by linear discriminant analysis
with two variables (Content_mono2 and Content_mono3)
Supplier A1 A2 B C D
A1 7 0 1 0 0 A2 0 5 0 0 0 B 0 0 8 0 0 C 0 1 0 7 0 D 0 4 0 0 12
Sample_Name Real_Supplier Predicted_Supplier Result
7 A7 A1 A1 TRUE 8 A8 A1 A1 TRUE 9 A9 A2 A2 TRUE
10 A10 A2 A2 TRUE 11 A11 A2 A2 TRUE 12 A12 A2 A2 TRUE 13 A13 A2 A2 TRUE 14 B1 B B TRUE 15 B2 B B TRUE 16 B3 B B TRUE 17 B4 B B TRUE 18 B5 B B TRUE 19 B6 B B TRUE 20 B7 B B TRUE 21 B8 B B TRUE 22 C1 C C TRUE 23 C2 C C TRUE 24 C3 C C TRUE 25 C4 C A2 FALSE 26 C5 C C TRUE 27 C6 C C TRUE
28 C7 C C TRUE
29 C8 C C TRUE 30 D1 D D TRUE 31 D2 D D TRUE 32 D3 D D TRUE 33 D4 D D TRUE 34 D5 D D TRUE 35 D6 D D TRUE 36 D7 D D TRUE 37 D8 D D TRUE 38 D9 D D TRUE 39 D10 D D TRUE 40 D11 D D TRUE 41 D12 D D TRUE 42 D13 D A2 FALSE 43 D14 D D TRUE 44 D15 D D TRUE 45 D16 D D TRUE
> ct <- table(Supplier, p$class)
> ct
Supplementary
135
Table S 19: Allocation of the samples to the respective supplier achieved by localized linear discriminant
analysis with two variables (Content_mono2 and Content_mono3)
Supplier A1 A2 B C D
A1 7 0 1 0 0 A2 0 5 0 0 0 B 0 0 8 0 0 C 0 1 0 7 0 D 0 1 0 0 15
Sample_Name Real_Supplier Predicted_Supplier Result
formulation_1 A1 A1 TRUE
formulation_2 B B TRUE
formulation_3 D D TRUE
Figure S 21 shows the partition plot based on the localized discriminant analysis. This plot was generated with the
command partimat within the R-package klaR.
Supplementary
136
Figure S 21: Partition plot using the variables Content_mono2 and Content_mono3. Supplier “A1” is
designated as “a” and supplier “A2” as “A”. Red character plot symbols show misclassifications within
the data in Table S 12 and blue ones refer to the AOT product in Table S 13.
6.3.8 Reference List
1. Porter MR (1994) Handbook of Surfactants. vol. 2 Chapman & Hall, Glasgow. 2. Tadros TF (2008) In: Applied Surfactants, Principles and Applications. Wiley-VCH, Weinheim. 3. Shell Chemicals (Accessed: March 2014) Material Safety data sheat ShellSol A100
http://aglayne.com/wp-content/uploads/2010/10/Shellsol-A-100.pdf. 4. Exxon Mobil Chemical (Accessed: March 2014) Material safety data sheat Solvesso 100
5. R Development Core Team (2012) R: A Language and Enviroment for Statistical Computing. R Foundation for Statistical Computing, Vienna, Austria, ISBN 3-900051-07-0.
6. Leisch F (2002) Sweave: Dynamic generation of statistical reports using literate data analysis. In: Compstat 2002 - Proceedings in Computational Statistics. Physica Verlag, Heidelberg, ISBN 3-7908-1517-9.
7. Weihs C, Ligges U, Luebke K, Raabe N (2005) Klar analyzing german business cycles. in: Baier D, Decker R, Schmidt-Thieme L, (eds.), Data Analysis and Decision Support. Springer-Verlag, Berlin, 335-343.
8. Venables WN, Ripley BD (2002) Modern Applied Statistics with S. fourth edition, Springer, New York, ISBN 0-387-95457.
9. Maechler M, Rousseeuw P, Struyf A, Hubert M, Hornik K. (2012) Cluster: Cluster Analysis Basics and Extensions. R-Package.