Chromosome painting and arrangement of interphase chromosome territories in Arabidopsis thaliana Dissertation zur Erlangung des akademischen Grades doctor rerum naturalium (Dr.rer.nat.) vorgelegt der Mathematisch-Naturwissenschaftlich-Technischen Fakultät (matematisch-naturwissenschaftlicher Bereich) der Martin-Luther-Universität Halle-Wittenberg von Herrn Ales Pecinka geb. am: 28.01.1978 in: Opava, Tschechische Republik Gutachter: 1. Prof. Reuter 2. Prof. Schubert (Gatersleben) Verteidigung: Halle (Saale), den 30.06.2005 urn:nbn:de:gbv:3-000008813 [http://nbn-resolving.de/urn/resolver.pl?urn=nbn%3Ade%3Agbv%3A3-000008813]
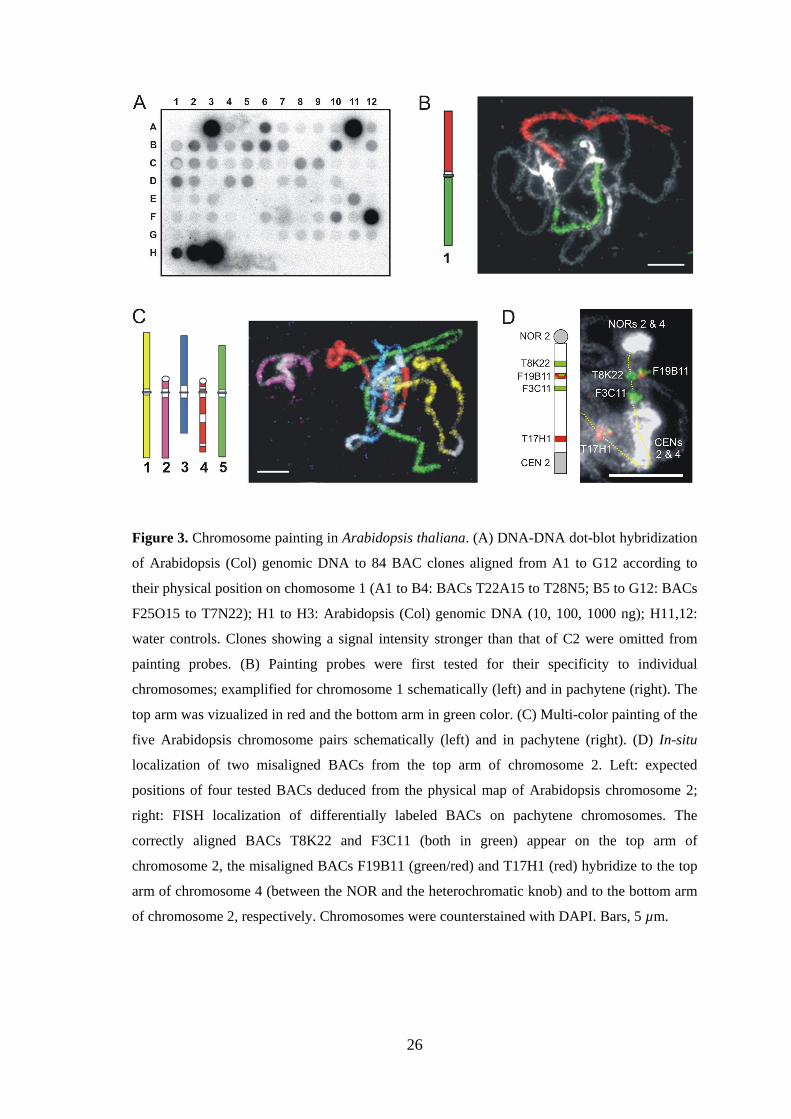
For the experiments with lac operator/lac repressor-NLS tagged lines, the
following DNA clones were used in addition to BACs MGL6 and F18C1 (GenBank
accession Nos. AB022217 and AC011620, respectively): BAC T15P10 containing 45S
rDNA (accession No. AF167571), the plasmid 128x lacO-SK (Kato and Lam 2001), the
plasmid pAL1 containing the 180 bp centromeric tandem repeat of A. thaliana
(Martinez-Zapater et al. 1986) and a BAC contig spanning 4.2 Mb of chromosome 3 top
arm from F2O10 to MSL1 (accession Nos. AC013454 and AB012247, respectively).
2.4. Probe labeling and FISH
BAC DNA was labeled by nick translation, either individually or, for CP, in pools of 4-
5 BACs (19-38 such pools per chromosome). Labeled nucleotides (either biotin-dUTP,
digoxigenin-dUTP, DNP-dUTP, Cy3-dUTP or DEAC-dUTP) were prepared as
described by Henegariu et al. (2000). The quality of each labeled probe was tested
individually on pachytene chromosomes.
Prior to FISH, slides were rinsed in 2×SSC (2 x 5 min), treated with pepsin (100
µg/ml in 0.01 M HCl) for 3-10 min at 38°C, rinsed in 2×SSC (2 x 5 min), post-fixed in
4% formaldehyde/2×SSC (10 min), rinsed in 2×SSC (2 × 5 min), dehydrated in 70, 90,
96% ethanol (2 min each) and air-dried.
20
For CP, the entire labeled probe (~110 ng of DNA of each BAC) was
precipitated and resuspended in 20-40 µl of hybridization mix (50% formamide, 10%
dextran sulphate, 2xSSC, 50 mM sodium phosphate pH 7.0) per slide. After mounting
the probe, the slides were placed on a heat block at 80°C for 2 min and then incubated in
a moist chamber at 37°C for ~12-36 h.
Post hybridization washes and detection steps were as described (Schubert et al.
2001). Biotin-dUTP was detected by avidin conjugated with Texas Red (1:1000; Vector
Laboratories), goat-anti-avidin conjugated with biotin (1:200; Vector Laboratories) and
again with avidin conjugated with Texas Red, digoxigenin-dUTP by mouse-anti-
digoxigenin (1:250; Roche) and goat-anti-mouse conjugated with Alexa-488 (1:200;
Molecular Probes), DNP-dUTP by rabbit-anti-DNP (1:400; Sigma) and goat anti-rabbit
conjugated with Cy5 (1:100; Jackson Laboratories). Cy3-dUTP and DEAC-dUTP were
observed directly. Nuclei and chromosomes were counterstained with 1-2 µg/ml of DAPI
in Vectashield mounting medium (Vector Laboratories).
2.5. Microscopic analyses
Analysis of fluorescence signals was performed with an epifluorescence microscope
(Axioplan 2; Carl Zeiss) using a 100x/1.4 Zeiss plan-apochromat objective and a cooled
CCD camera Spot 2e (Diagnostic Instruments). Images were captured separately for
each fluorochrome using appropriate excitation and emission filters. Single plane
images and stacks of optical sections through nuclei were acquired with MetaVue
software (Universal Imaging). The deconvolution of image stacks was performed with
the ‘point spread function’ algorithm. Monochromatic images were pseudocoloured and
merged using MetaMorph (Universal Imaging) and/or Adobe Photoshop 6.0 (Adobe
Systems) software.
21
2.6. Computer simulations of random chromosome arrangement
2.6.1. Determination of dimensions and volumes of Arabidopsis nuclei
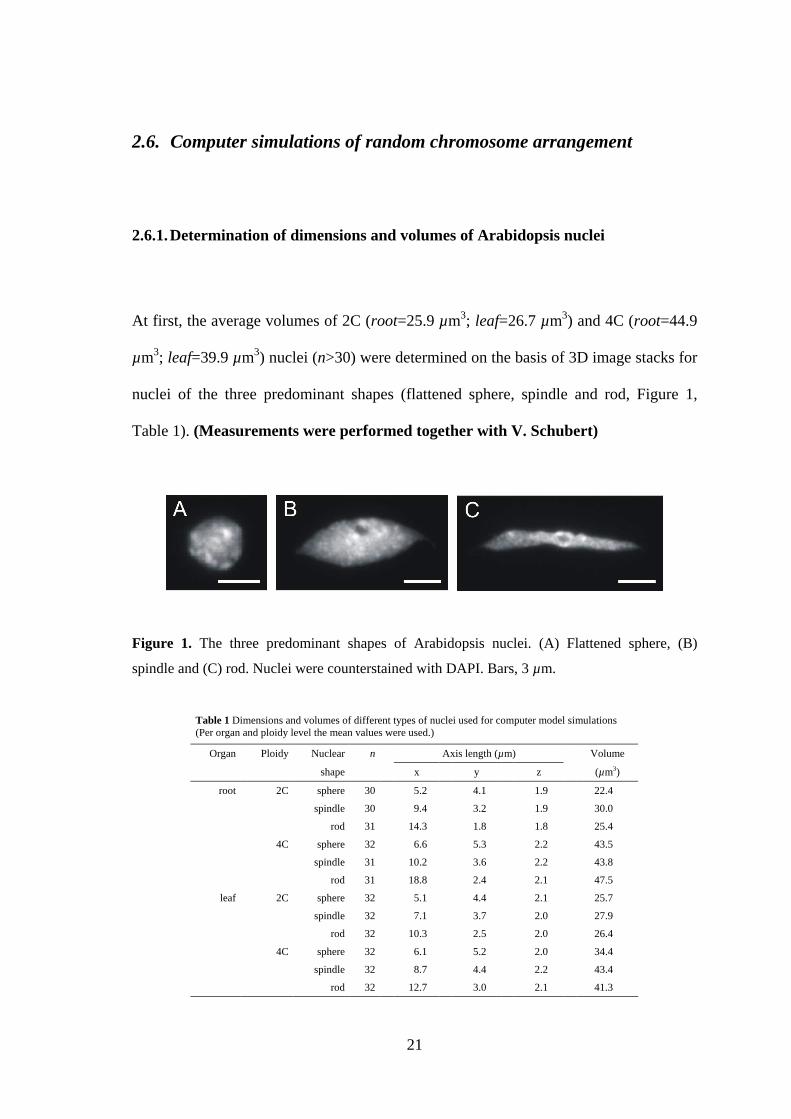
At first, the average volumes of 2C (root=25.9 µm3; leaf=26.7 µm3) and 4C (root=44.9
µm3; leaf=39.9 µm3) nuclei (n>30) were determined on the basis of 3D image stacks for
nuclei of the three predominant shapes (flattened sphere, spindle and rod, Figure 1,
Table 1). (Measurements were performed together with V. Schubert)
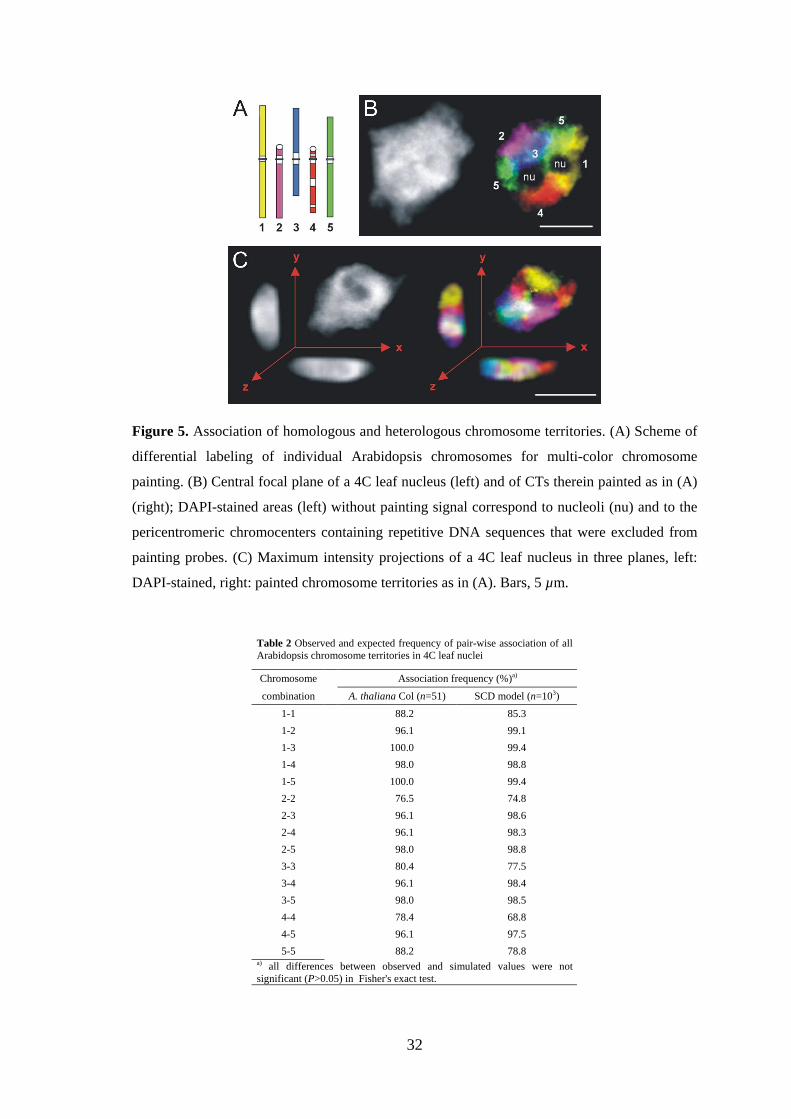
Figure 1. The three predominant shapes of Arabidopsis nuclei. (A) Flattened sphere, (B)
spindle and (C) rod. Nuclei were counterstained with DAPI. Bars, 3 µm.
Table 1 Dimensions and volumes of different types of nuclei used for computer model simulations (Per organ and ploidy level the mean values were used.)
Organ Ploidy Nuclear n Axis length (µm) Volume
shape x y z (µm3)
root 2C sphere 30 5.2 4.1 1.9 22.4
spindle 30 9.4 3.2 1.9 30.0
rod 31 14.3 1.8 1.8 25.4
4C sphere 32 6.6 5.3 2.2 43.5
spindle 31 10.2 3.6 2.2 43.8
rod 31 18.8 2.4 2.1 47.5
leaf 2C sphere 32 5.1 4.4 2.1 25.7
spindle 32 7.1 3.7 2.0 27.9
rod 32 10.3 2.5 2.0 26.4
4C sphere 32 6.1 5.2 2.0 34.4
spindle 32 8.7 4.4 2.2 43.4
rod 32 12.7 3.0 2.1 41.3
22
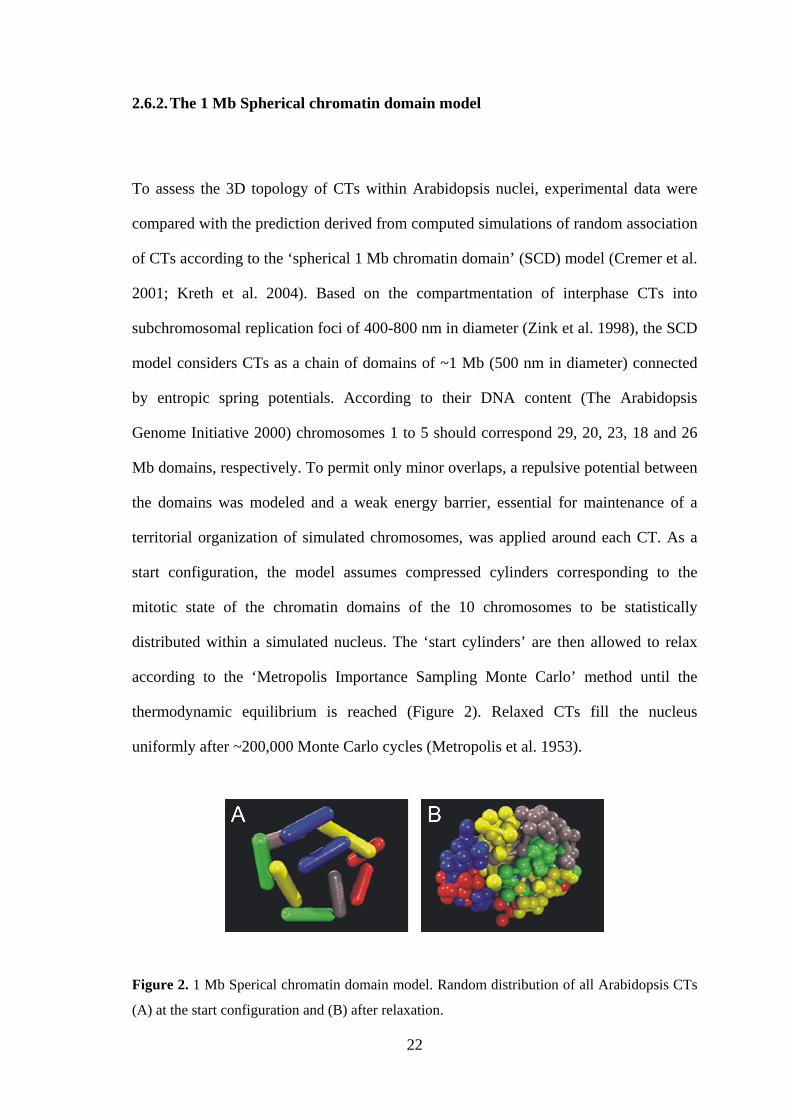
2.6.2. The 1 Mb Spherical chromatin domain model
To assess the 3D topology of CTs within Arabidopsis nuclei, experimental data were
compared with the prediction derived from computed simulations of random association
of CTs according to the ‘spherical 1 Mb chromatin domain’ (SCD) model (Cremer et al.
2001; Kreth et al. 2004). Based on the compartmentation of interphase CTs into
subchromosomal replication foci of 400-800 nm in diameter (Zink et al. 1998), the SCD
model considers CTs as a chain of domains of ~1 Mb (500 nm in diameter) connected
by entropic spring potentials. According to their DNA content (The Arabidopsis
Genome Initiative 2000) chromosomes 1 to 5 should correspond 29, 20, 23, 18 and 26
Mb domains, respectively. To permit only minor overlaps, a repulsive potential between
the domains was modeled and a weak energy barrier, essential for maintenance of a
territorial organization of simulated chromosomes, was applied around each CT. As a
start configuration, the model assumes compressed cylinders corresponding to the
mitotic state of the chromatin domains of the 10 chromosomes to be statistically
distributed within a simulated nucleus. The ‘start cylinders’ are then allowed to relax
according to the ‘Metropolis Importance Sampling Monte Carlo’ method until the
thermodynamic equilibrium is reached (Figure 2). Relaxed CTs fill the nucleus
uniformly after ~200,000 Monte Carlo cycles (Metropolis et al. 1953).
Figure 2. 1 Mb Sperical chromatin domain model. Random distribution of all Arabidopsis CTs
(A) at the start configuration and (B) after relaxation.
23
Subsequently, the minimal distances between domains of interest were
measured. CTs were considered as associated if boundaries were less than 500 nm apart
from each other. At this distance, CTs appear as separated at the microscopic level of
resolution. Assuming a distance of 400 nm decreased the expected association
frequency of heterologous CTs by no more than 1% and did not alter the significance
level for comparison of experimental and simulated data for heterologue association. To
test the influence of nuclear shape (flattened sphere, spindle and rod) on random
arrangement of CTs, 103 nuclei of each shape were modeled. (Done by G. Kreth and
A. Meister)
2.6.3. Random spatial distribution model
Since the ‘SCD’ model does not simulate domains <1 Mb, the geometrical ‘random
spatial distribution’ (RSD) model was established by A. Meister to simulate spheric
chromosome segments of ~100 kb (corresponding to the average BAC insert size)
within 106 spheric, spindle- or rod-shaped nuclei according to the volumes determined
for 2C and 4C nuclei and for the BAC FISH signals (0.15 µm3 and 0.22 µm3,
respectively) therein. The coordinates of segments were calculated from random
numbers. Signals that overlapped or were closer to each other than 100 nm were
considered to indicate homologous pairing. The random occurrence of homologous
pairing was calculated using the VisualBasic 5.0 (Microsoft) software. The differences
between the experimentally obtained values and the simulated ones were compared by
the chi-square or Fisher’s exact test and considered as significant at the P<0.001 level.
24
3. Results and discussion
3.1. Establishing of chromosome painting in Arabidopsis thaliana
3.1.1. Development of painting probes for individual chromosomes
Although the Arabidopsis genome consists of only ~15% repetitive DNA arrays (The
Arabidopsis Genome Initiative 2000), the presence of BACs containing dispersed DNA
repeats has to be avoided carefully when painting probes are arranged since such
sequences impair the painting of individual chromosomes by cross-hybridization to
other than targer chromosomes. In Arabidopsis, repeats are particularly abundant within
the (peri)centromeric heterochromatin and the NORs. Therefore, BACs containing
(peri-)centromeric or 45S rDNA sequences were omitted from painting probes.
Although chromosome arms of most Arabidopsis accessions lack larger blocks of
repetitive DNA, visible microscopically as interstitial heterochromatin, complete and
truncated mobile elements are scattered along chromosome arms. Painting experiments
with chromosome 4 have shown that the use of the complete set of all BACs from the
tiling path results in cross-hybridization signals on other chromosomes in addition to
painting of chromosome 4 (Lysak et al. 2001). Therefore, a search for repetitive DNA
sequences was performed for individual BACs in the TIGR database. BACs containing
>5% mobile elements within annotated sequences were omitted from the painting
probes, even when sequence in question was found to be restricted to the chromosomal
position of the BAC insert. Conversely, some apparently suitable BACs may yield
additional FISH signals at other regions. Thus, annotation analysis does not
25
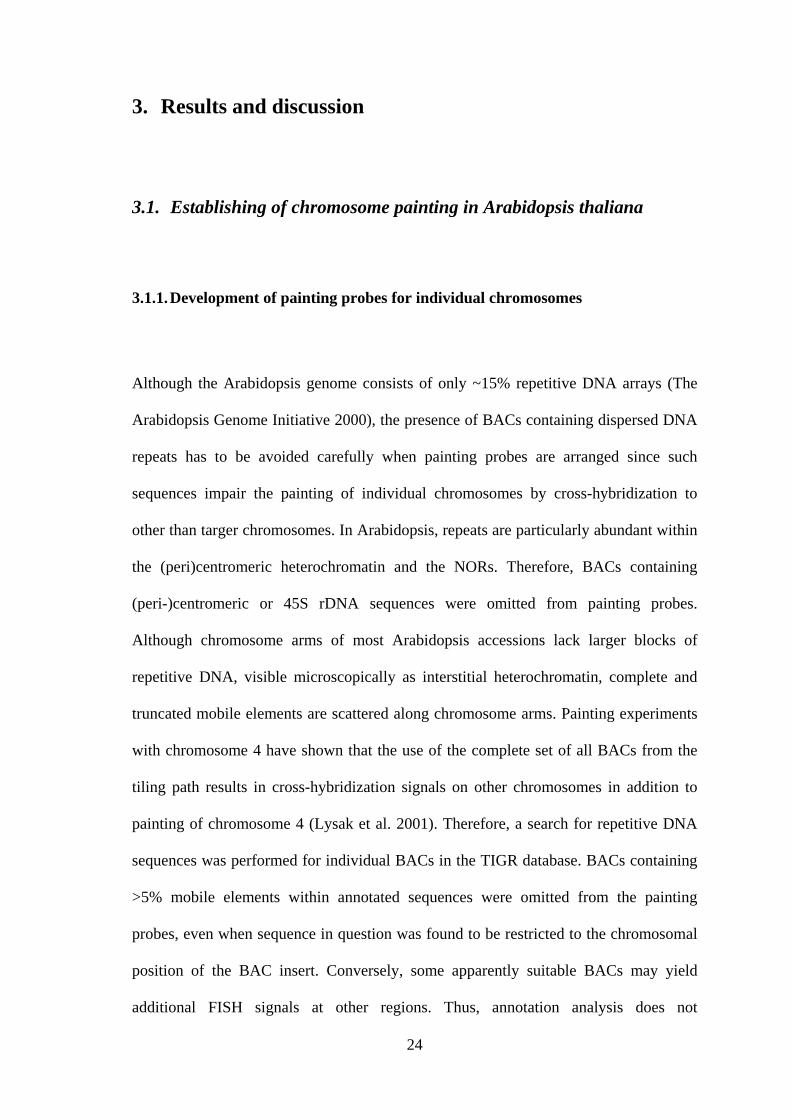
unambiguously indicate the suitability of BACs for CP. Therefore, individual BACs
were additionally spotted on filters and hybridized with radioactively labeled genomic
DNA (Figure 3A). BACs yielding strong hybridization signals (Figure 3A) were
excluded from painting probes. From the total of 1,585 BACs, 1215 clones (77%) were
considered as suitable for CP. Finally the specificity of chromosome specific BAC
pools was tested on pachytene chromosomes. At first by two-color CP for the arms of
individual chromosomes and than by multi-color CP for entire chromosome
complement (Figure 3B,C). For multi-color CP of all five A. thaliana chromosomes, in
total 73 µg of labeled DNA per slide were applied (~110 ng of DNA of each of 669
BACs). [BACs used for painting of chromosomes 1, 2, 3 and 5 were selected by A.
Pecinka; clones used for painting of chromosome 4 were selected previously by
Lysak et al. (2001)]
3.1.2. Identification of misaligned BAC clones by FISH
FISH with BACs mapped to the top arm of chromosome 2 yielded signals at other
positions than expected. On the basis of signals present elsewhere in the complement, it
was found, that at least 14 BACs anchored to the map of the top arm of chromosome 2
were misaligned. For determination of their correct position, individual BACs were
hybridized together with a tested correct BAC from the top arm of chromosome 2 to
pachytene chromosomes. Two major groups of misaligned BACs were identified: (1)
BACs giving a signal on the bottom arm of chromosome 2, and (2) BACs located on
another chromosome (Figure 3D). Thus, FISH provides a tool to confirm chromosomal
location of individual BACs (see also Schubert et al. 2001).
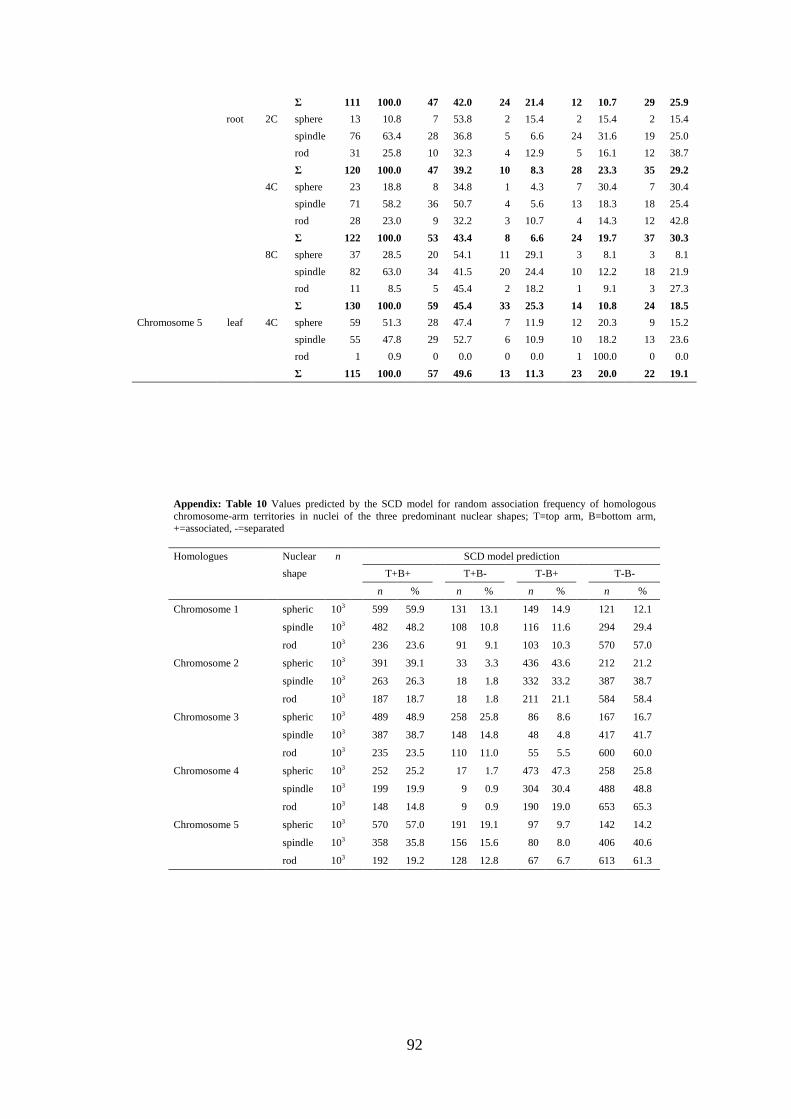
simulations were done (103 nuclei per shape) to test whether an influence of the nuclear
shape on CT arrangement is to be expected. Indeed, the simulations revealed an impact
of nuclear shape on the random association frequency of CTs. For the symmetric
chromosomes 1, 3, and 5 the computer model predicted association of entire
homologues in 48.3-59.9% of spheric nuclei, in contrast to only 20.6-23.6% of rod-
shaped nuclei. For the asymmetric chromosomes 2 and 4 the predicted values were
25.2-31.9% and 14.8-18.7%, respectively. Because of the predicted differences, we
merged the values simulated for different nuclear shapes by calculation of the weighted
average according to the proportion of evaluated spheric, spindle and rod-shaped nuclei
per experimental point [for original values of the observed and the predicted CT
association frequencies (according to the SCD model) for nuclei of different shape see
appendix: Tables 9 and 10]. These values were compared with the sum of values for all
shapes per experimental point (Table 3). The observed association frequency (Figure 6,
Table 3) did not significantly deviate from the SCD model prediction for random
arrangement in the case of chromosome 1. This was valid for the differently shaped
nuclei of 2C, 4C, and 8C DNA content from roots as well as from leaves.
Corresponding data were obtained for chromosomes 3 and 5 as studied in 4C leaf nuclei
(Table 3). Different observations were made for the smaller asymmetric chromosomes 2
and 4 with NORs at their top arm ends. For both these chromosomes the association of
entire homologues occurred significantly more often (P<0.001) and complete separation
less often than expected at random in all tested types of nuclei. This increase of
35
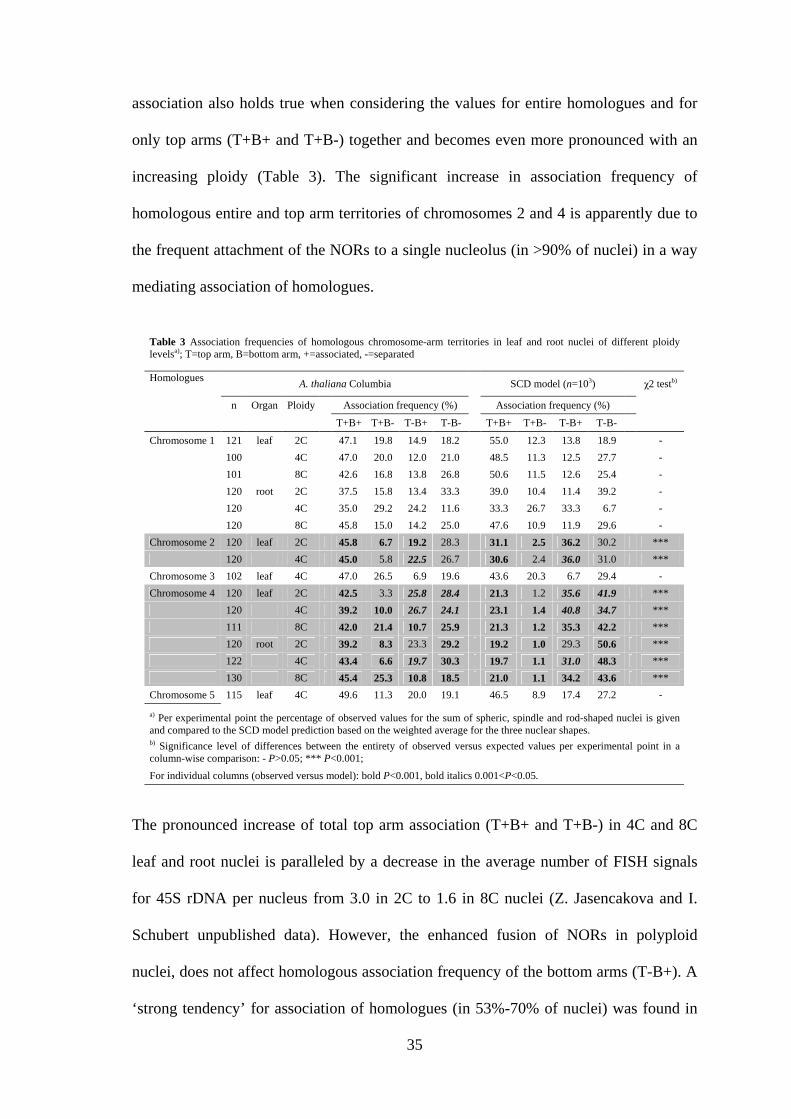
association also holds true when considering the values for entire homologues and for
only top arms (T+B+ and T+B-) together and becomes even more pronounced with an
increasing ploidy (Table 3). The significant increase in association frequency of
homologous entire and top arm territories of chromosomes 2 and 4 is apparently due to
the frequent attachment of the NORs to a single nucleolus (in >90% of nuclei) in a way
mediating association of homologues.
The pronounced increase of total top arm association (T+B+ and T+B-) in 4C and 8C
leaf and root nuclei is paralleled by a decrease in the average number of FISH signals
for 45S rDNA per nucleus from 3.0 in 2C to 1.6 in 8C nuclei (Z. Jasencakova and I.
Schubert unpublished data). However, the enhanced fusion of NORs in polyploid
nuclei, does not affect homologous association frequency of the bottom arms (T-B+). A
‘strong tendency’ for association of homologues (in 53%-70% of nuclei) was found in
Table 3 Association frequencies of homologous chromosome-arm territories in leaf and root nuclei of different ploidy levelsa); T=top arm, B=bottom arm, +=associated, -=separated
Homologues A. thaliana Columbia SCD model (n=103) χ2 testb)
n Organ Ploidy Association frequency (%) Association frequency (%)
a) Per experimental point the percentage of observed values for the sum of spheric, spindle and rod-shaped nuclei is given and compared to the SCD model prediction based on the weighted average for the three nuclear shapes. b) Significance level of differences between the entirety of observed versus expected values per experimental point in a column-wise comparison: - P>0.05; *** P<0.001;
For individual columns (observed versus model): bold P<0.001, bold italics 0.001<P<0.05.
36
human Sertoli cells (Chandley et al. 1996). However, among the tested chromomsomes
only the acrocentric NOR-bearing chromosomes 13 and 21 showed a high frequency of
homologous association (50%) also in dividing lymphocytes, apparently due to
attachment of NORs at one nucleolus (Chandley et al. 1996).
In 8C nuclei, in general no more than two CTs were found per homologue. Also
the number of chromocenters (at maximum 14, i.e. 10 pericentromeres and 4 NORs, but
usually not more than 10, Fransz et al. 2002) did not significantly increase in >4C
nuclei. Both observations suggest that CTs of endoreduplicated chromatids are usually
not separated but remain associated, at least within the pericentromeric regions.
3.2.3. The relative position of a gene (FWA) within its CT does not necessarily
reflect the transcriptional state
After FISH with differently labeled probes for the chromosome 1 top arm territory and
for BAC T2P11 therein (probe contained BACs flanking BAC T2P11 directly from the
both sides) to 4C leaf nuclei (n=359), 12.8% of FISH signals for the BAC were
localized clearly outside the labeled CT. This surprising observation provoked the
question, whether the FISH signal for the corresponding BAC apart from the remaining
CT is due to an outlooping correlated with the transcriptional activity of genes in the
labelled region.
To test whether the transcriptional activity might have an impact on CT
organization, i.e. whether a transcribed gene occupies more often positions outside
compact CT than under silent condition, the flowering gene FWA residing in BAC
M7J2 and mapped to the bottom arm of chromosome 4 was chosen. In wild-type plants
(Ler) this gene is not expressed and strongly methylated, while it is constitutively
expressed and hypomethylated in leaf nuclei of the fwa-1 mutant (Soppe et al. 2000). In
37
2C leaf nuclei (n=337) of fwa-1 only 4.2% of FISH signals for BAC M7J2 were found
distal of the CT periphery (Figure 7A). A similar frequency (3.8%) of signals out-
looped from the CT was observed also for wild-type 2C leaf nuclei (n=368). In 4C
nuclei, out-looping of M7J2 signals occurred in 10.7% of fwa-1 nuclei (n=121) and in
6.5% of 230 wild-type nuclei (n=230). Although there is a tendency of more out-
looping in FWA-expressing 4C nuclei, the difference is not significant.
Thus, the position of a sequence relative to its CT (inside, at the edge or outside)
does not obviously depend on the transcriptional state of that sequence. This agrees with
the observations made on mammalian cells where active genes were found to be located
on the surface as well as in the interior of a CT and were not relocated when switching
the expression status (Mahy et al. 2002a). Therefore, transcriptional activity of a gene is
not necessarily a reasonable explanation for the relatively high frequency (12.8%) at
which the FISH signal for BAC T2P11 was found ‘outside’ the chromosome 1 top arm
territory. However, regions of ‘high gene density and transcription’ may frequently
extend from their territory (Mahy et al. 2002b) as already described for the major
histocompatibility complex region that may locate outside its CT depending on cell type
and gene activity (Volpi et al. 2000). The gene density along Arabidopsis chromosome
arms is rather uniform, but we cannot exclude that most of the 21 presumed genes of
BAC T2P11 are simultaneously expressed in nuclei showing this region apart from its
CT. The results obtained with BACs T2P11 and M7J2 imply that CTs do not always
have a smooth surface, i.e. outlooping of chromatin into interchromosomal space
(mimicking intermingling of CTs) might occur to some extent. (Preparation of
chromosome painting probes and approximately one half of FISH experiments
were done by A. Pecinka; the remaining part and microscopic evaluations were
done by V. Schubert).
38
3.2.4. Somatic pairing of homologous chromosome segments occurs at random
To analyze whether association of homologous CTs reflects strict allelic alignment
along chromosome pairs, the nuclear positions of ~100 kb chromosome segments
(average BAC insert size) were assessed by FISH. Simultaneous detection with
differentially labeled probes of the chromosome 1 top arm territory and of BAC T2P11
therein has shown that of 94 4C leaf nuclei with associated top arm territories only 7
also showed homologous pairing at the position of the T2P11 insert (one FISH signal
for T2P11, Figure 7B1). This indicates that association of homologues is not a
consequence of homologous alignment. (CP probes were prepared by A. Pecinka;
FISH and microscopic evaluation were done by V. Schubert).
Pairing was further analysed for different regions on chromosomes 1, 3 and 4
using either single BACs or two differently labeled adjacent BACs for FISH (Figure
7C). A single compact signal site per nucleus was regarded as single-point pairing in
contrast to clearly separated signals indicating the absence of pairing (Figure 7D1,2). In
addition, in some experiments (Table 4) nuclei that contained dispersed signals of
spheric shape or separated compact signals with a distance less than the signal diameter
(Figure 7D3) were scored. Such nuclei were considered to represent a loose signal
association indicating spatial vicinity but not necessarily allelic alignment of
homologous segments. The RSD model simulations of 106 2C and 4C root and leaf
nuclei, respectively, predicted a random frequency of 5.9-7.8% of nuclei with
homologous pairing (Table 4). In contrast to the situation described for association of
CTs, computer simulations revealed no significant differences as to the random
expectation of single-point pairing for the three predominant nuclear shapes (sphere,
spindle, rod). The reason is presumably that FISH signals for ~100 kb segments occupy
a much smaller proportion of the nuclear volume and therefore cause less spatial
39
constraints than do CTs. The observed frequency of nuclei showing single-point pairing
at the tested positions (0.8-14.0%; on average 4.9%; Table 4) was 7-10 times lower than
that for association of both arms of the corresponding homologous pair (35.0-49.6%;
Table 4).
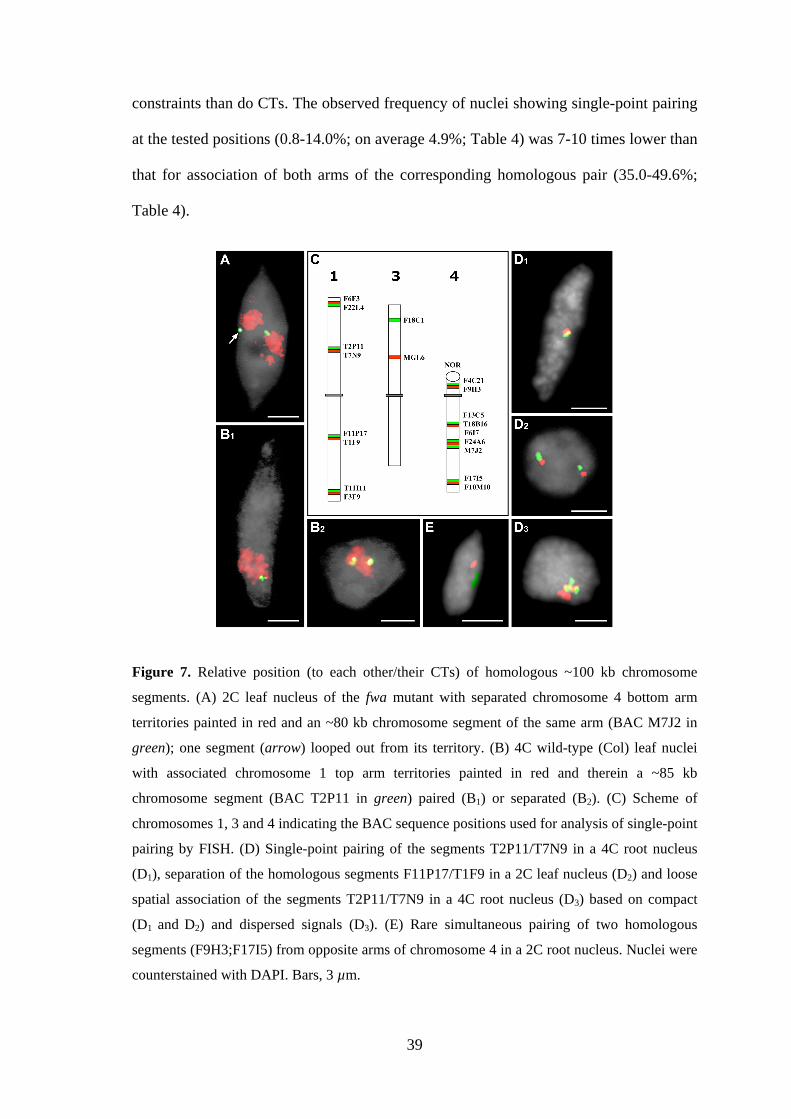
Figure 7. Relative position (to each other/their CTs) of homologous ~100 kb chromosome
segments. (A) 2C leaf nucleus of the fwa mutant with separated chromosome 4 bottom arm
territories painted in red and an ~80 kb chromosome segment of the same arm (BAC M7J2 in
green); one segment (arrow) looped out from its territory. (B) 4C wild-type (Col) leaf nuclei
with associated chromosome 1 top arm territories painted in red and therein a ~85 kb
chromosome segment (BAC T2P11 in green) paired (B1) or separated (B2). (C) Scheme of
chromosomes 1, 3 and 4 indicating the BAC sequence positions used for analysis of single-point
pairing by FISH. (D) Single-point pairing of the segments T2P11/T7N9 in a 4C root nucleus
(D1), separation of the homologous segments F11P17/T1F9 in a 2C leaf nucleus (D2) and loose
spatial association of the segments T2P11/T7N9 in a 4C root nucleus (D3) based on compact
(D1 and D2) and dispersed signals (D3). (E) Rare simultaneous pairing of two homologous
segments (F9H3;F17I5) from opposite arms of chromosome 4 in a 2C root nucleus. Nuclei were
counterstained with DAPI. Bars, 3 µm.
40
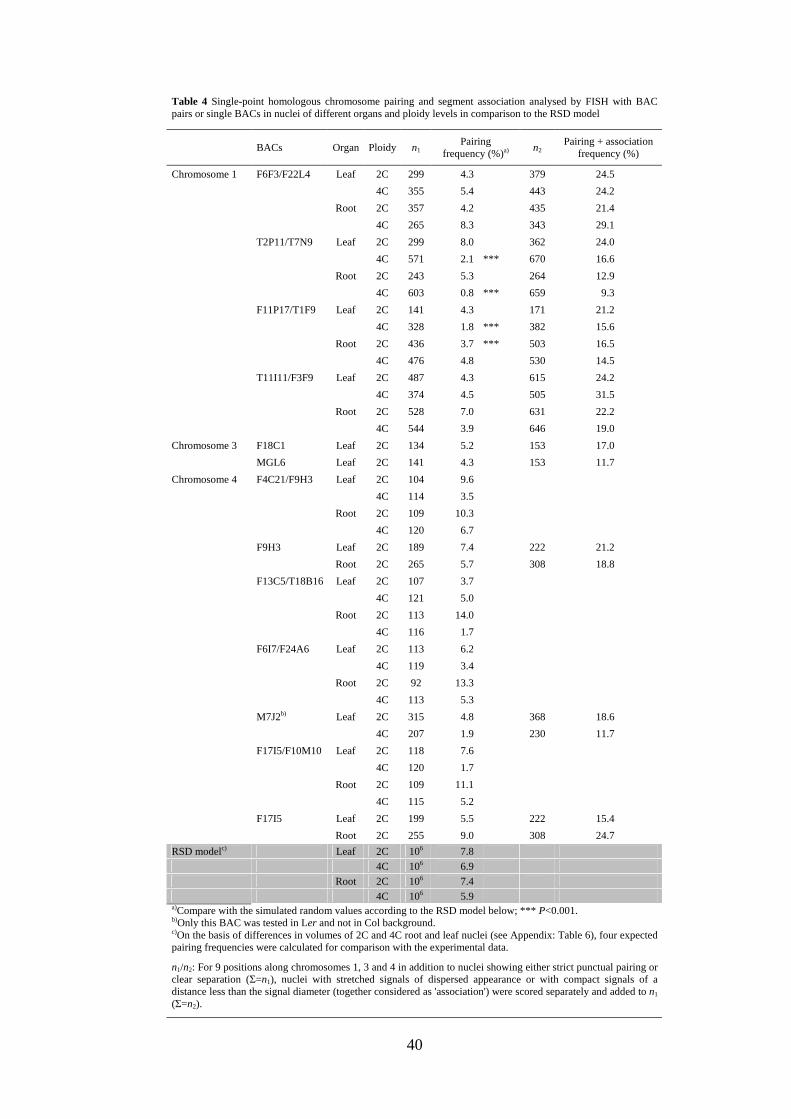
Table 4 Single-point homologous chromosome pairing and segment association analysed by FISH with BAC pairs or single BACs in nuclei of different organs and ploidy levels in comparison to the RSD model
BACs Organ Ploidy n1 Pairing
frequency (%)a) n2
Pairing + association frequency (%)
Chromosome 1 F6F3/F22L4 Leaf 2C 299 4.3 379 24.5
4C 355 5.4 443 24.2
Root 2C 357 4.2 435 21.4
4C 265 8.3 343 29.1
T2P11/T7N9 Leaf 2C 299 8.0 362 24.0
4C 571 2.1 *** 670 16.6
Root 2C 243 5.3 264 12.9
4C 603 0.8 *** 659 9.3
F11P17/T1F9 Leaf 2C 141 4.3 171 21.2
4C 328 1.8 *** 382 15.6
Root 2C 436 3.7 *** 503 16.5
4C 476 4.8 530 14.5
T11I11/F3F9 Leaf 2C 487 4.3 615 24.2
4C 374 4.5 505 31.5
Root 2C 528 7.0 631 22.2
4C 544 3.9 646 19.0
Chromosome 3 F18C1 Leaf 2C 134 5.2 153 17.0
MGL6 Leaf 2C 141 4.3 153 11.7
Chromosome 4 F4C21/F9H3 Leaf 2C 104 9.6
4C 114 3.5
Root 2C 109 10.3
4C 120 6.7
F9H3 Leaf 2C 189 7.4 222 21.2
Root 2C 265 5.7 308 18.8
F13C5/T18B16 Leaf 2C 107 3.7
4C 121 5.0
Root 2C 113 14.0
4C 116 1.7
F6I7/F24A6 Leaf 2C 113 6.2
4C 119 3.4
Root 2C 92 13.3
4C 113 5.3
M7J2b) Leaf 2C 315 4.8 368 18.6
4C 207 1.9 230 11.7
F17I5/F10M10 Leaf 2C 118 7.6
4C 120 1.7
Root 2C 109 11.1
4C 115 5.2
F17I5 Leaf 2C 199 5.5 222 15.4
Root 2C 255 9.0 308 24.7
RSD modelc) Leaf 2C 106 7.8
4C 106 6.9
Root 2C 106 7.4
4C 106 5.9 a)Compare with the simulated random values according to the RSD model below; *** P<0.001. b)Only this BAC was tested in Ler and not in Col background. c)On the basis of differences in volumes of 2C and 4C root and leaf nuclei (see Appendix: Table 6), four expected pairing frequencies were calculated for comparison with the experimental data.
n1/n2: For 9 positions along chromosomes 1, 3 and 4 in addition to nuclei showing either strict punctual pairing or clear separation (Σ=n1), nuclei with stretched signals of dispersed appearance or with compact signals of a distance less than the signal diameter (together considered as 'association') were scored separately and added to n1 (Σ=n2).
41
Compared to pairing, a signal association is up to 10 times more frequent. Adding
the number of nuclei showing single-point pairing to that showing loose association
revealed that, depending on the chromosomal position, within 9.3 to 31.5% of nuclei
allelic sequences occur in a close spatial proximity (Table 4). Regardless of the
chromosomal position, pairing was not observed significantly more often than expected
at random according to the RSD model. No significant differences were found between
leaf and root nuclei irrespective of the ploidy level (tested for chromosomes 1 and 4).
Thus, in A. thaliana nuclei somatic pairing is the exception rather than the rule. The
opposite has been shown for Drosophila melanogaster with homologous pairing in
60%-90% of somatic nuclei from the 13th embryonic cell cycle on (Csink and Henikoff
1998; Fung et al. 1998). The comparison of Arabidopsis and Drosophila shows that
similarity in genome size, sequence organization and chromosome number does not
necessarily cause an identical CT arrangement. of the constraints as to the chromatin
dynamics within interphase nuclei of all tested organisms, a certain flexibility of
chromatin positions has been found (for review see Lam et al. 2004). The average
movement of GFP-tagged chromatin loci is ~0.085µm/min (Kato and Lam 2003).
Therefore, at least in nuclei that show either single-point pairing or close association of
allelic sequences, these allelic sequences might occupy nuclear positions sufficiently
close for homologous recombination (for instance in the course of double strand break
repair), in spite of the lack of a regular and contiguous alignment of homologues.
For chromosome 1 the positional proximity of allelic sequences (single-point
pairing and segment association together) was less pronounced at interstitial loci (15.0%
on top arm; 16.1% on bottom arm) than at distal loci (24.6% on top arm; 23.8% on
bottom arm) when all data from 2C and 4C, leaf and root nuclei were pooled (P<0.001).
This agrees with the clustering of telomeric regions around the nucleolus (Fransz et al.
2002).
42
Simultaneous FISH of two BACs located distantly on a chromosome showed
that homologous pairing has indeed only single point character and does not involve
entire chromosomes (tested for four independent combinations: F6F3 and T11I11;
T7N9 and F11P17; F18C1 and MGL6; F9H3 and F17I5; Figure 7C). Only three (0.2%)
out of 1240 tested nuclei showed simultaneous pairing at two distant loci (Figure 7E).
(Experiments with BACs from chromosome 1 and approximately one-third of
experiment with BACs from chromosome 4 were done by V. Schubert;
experiments assessing pairing of BACs from chromosome 4 were performed by M.
Klatte; experiments with BACs from chromosome 3 were done by A. Pecinka.)
3.2.5. The frequency of somatic homologous pairing is not altered in Arabidopsis
mutants with an increased frequency of somatic homologous recombination
Intermolecular recombination plays an important role in DNA repair of somatic cells
and is essential for the elimination of damaged DNA. To study the frequency of
intermolecular recombination events between homologous chromosomes and sister
chromatids, transgenic Arabidopsis lines carrying a specially designed recombination
trap consisting of disrupted a β-glucuronidase reporter gene in a direct repeat orientation
were generated (Molinier et al. 2004). In case of a recombination event between the
direct repeats of a marker gene, a functional reporter gene is restored. Three mutant
lines B71, W92 and P8I24 displayed a significantly (>40-fold) increased frequency of
somatic homologous recombination in comparison to the control line IC9 (J. Molinier
and B. Hohn, unpublished data). Similar results were obtained for the Atp150caf-1
mutant with a T-DNA insertion in the middle of the AtCAF-1 encoding region. This
mutant showed a >100-fold increased frequency of somatic homologous recombination
43
compared to the control line C24 (Kyryk, Pecinka, Wendeler, Kemper and Reiss,
manuscript in prep.).
These results together led to the question, whether the higher frequency of
somatic homologous recombination found in B71, W92, P8I24 and Atp150caf-1 might
be due to a generally increased pairing frequency between homologues, or rather to an
intensified search for homology to repair induced or spontaneous DNA damage. To
elucidate this issue, the single-point pairing frequency was addressed by FISH in 2C
leaf nuclei of hyperrecombination mutants and their control lines. The attempt to assess
pairing frequency directly at the transgenic locus was not possibel because of: (i) the
relatively small size of T-DNA construct (only 5.6 kb), which did not allow a reliable
microscopic detection of FISH signals and (ii) the unknown position of the transgene in
the genome which excluded the use of a neighboring BAC insert as a probe. Therefore,
the analyses were performed with two BACs, F18C1 and MGL6 (see parts 3.2.4. and
3.3.3.), from the top arm of chromosome 3 (Figure 7C).
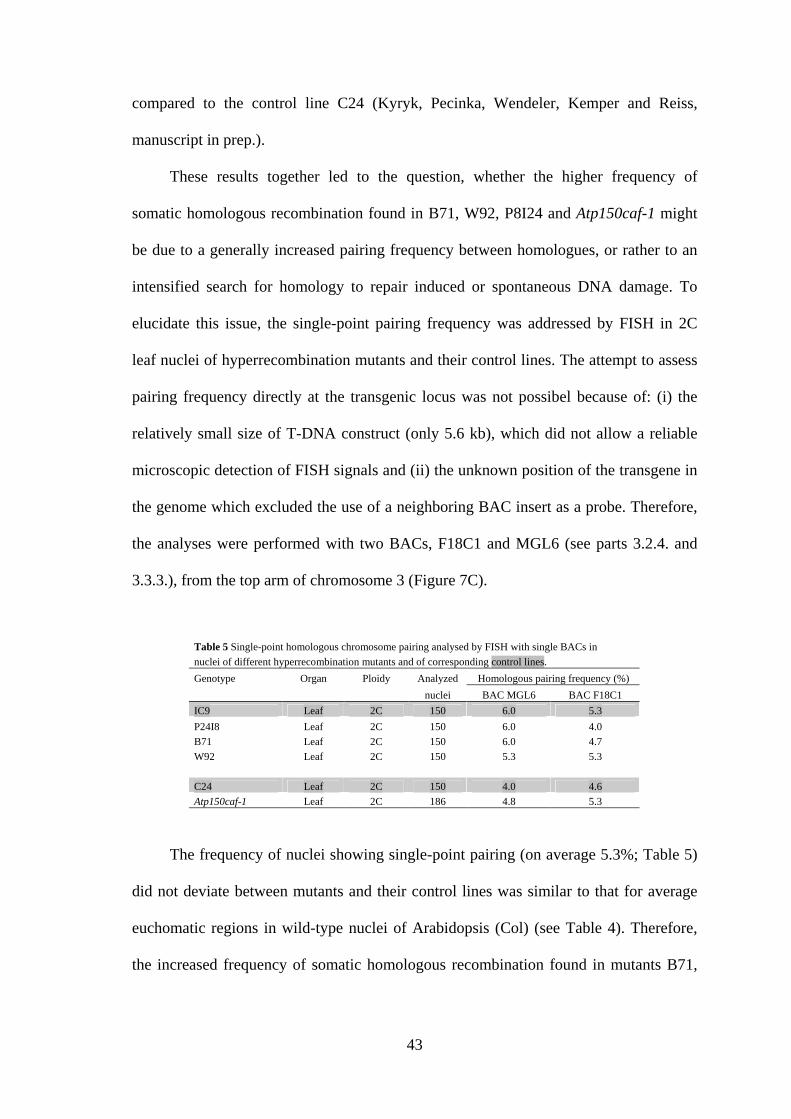
Table 5 Single-point homologous chromosome pairing analysed by FISH with single BACs in nuclei of different hyperrecombination mutants and of corresponding control lines.
Genotype Organ Ploidy Analyzed Homologous pairing frequency (%)
nuclei BAC MGL6 BAC F18C1
IC9 Leaf 2C 150 6.0 5.3
P24I8 Leaf 2C 150 6.0 4.0
B71 Leaf 2C 150 6.0 4.7
W92 Leaf 2C 150 5.3 5.3
C24 Leaf 2C 150 4.0 4.6
Atp150caf-1 Leaf 2C 186 4.8 5.3
The frequency of nuclei showing single-point pairing (on average 5.3%; Table 5)
did not deviate between mutants and their control lines was similar to that for average
euchomatic regions in wild-type nuclei of Arabidopsis (Col) (see Table 4). Therefore,
the increased frequency of somatic homologous recombination found in mutants B71,
44
W92, P8I24 and Atp150caf-1 is not associated with an elevated frequency of somatic
homologous pairing.
The data from b-glucuronidase assay suggest that homologous chromosomes as
well as sister chromatids, can be used as a substrate for somatic homologous
recombination in Arabidopsis nuclei (Molinier et al. 2004). Interestingly, sister
chromatids are used 2-3 times more often for somatic recombinational repair than
homologous chromosomes (Molinier et al. 2004). The frequent use of homologues in
somatic recombination is in contrast to the low frequency of somatic homologous
pairing in Arabidopsis nuclei and suggests a mechanism leading to an intensified search
for homology after induced or spontaneous DNA damage. Such a search could be
catalyzed in Arabidopsis by some protein(s) from the RAD52 epistasis group [i.e.
RAD51, RAD52, RAD54, RAD55, RAD57 and the MRN (MRE11-RAD50-NBS1
complex)] (West et al. 2004).
3.2.6. Conclusions as to the arrangement of interphase CTs and somatic
homologous pairing
Using chromosome specific painting probes, arrangement and dynamics of all
Arabidopsis interphase CTs was studied in 2C, 4C and 8C nuclei isolated from roots
and leaves. Individual CTs were found to be frequently associated with any other CTs.
However, this arrangement corresponds to the computer model prediction for random
CT arrangement and is most likely due to the low number of Arabidopsis chromosomes
(2n=10). The only exceptions are the NOR-bearing top arms of chromosomes 2 and 4,
which associate more frequently than expected at random. This is probably caused by
frequent attachment of NORs to a single nucleolus (in >90% of Arabidopsis nuclei),
which mediates association of homologous NOR-bearing chromosome arms and of
45
entire homologoues. In general, this arrangement was consistent in all investigated types
of nuclei. Furthermore, the relative position of a gene (FWA) within its CT (inside or at
the periphery) does not obviously correlate with its transcriptional state. Somatic
homologous pairing occurred on an average in 4.9% of Arabidopis nuclei. This is in
agreement with the computer model prediction for random positional pairing frequency
(5.9-7.8%). Only in 0.2% of nuclei, simultaneous homologous pairing of two segments
at distant chromosomal positions was found. Thus, homologous pairing has only single-
point character and long range homologous alignment seems to be the exception rather
than the rule in Arabidopsis nuclei. No significant differences as to the frequency of
homologous pairing were found in Arabidopsis mutants with an increased frequency of
somatic homologous recombination. This suggests that the observed increase in
recombination frequency is rather due to more intensified search for homology after
DNA damage than to gross alterations of nuclear organization.
The comparison of Arabidopsis and Drosophila (the latter species is characterized
by frequent somatic homologous pairing) shows that similarity in genome size,
sequence organization and chromosome number does not necessarily cause an identical
arrangement of interphase chromosomes. Therefore, the arrangement of Arabidopsis
CTs seems to be more similar to that found in nuclei of non-cycling mammalian cells
that are characterized by predominantly random relative positioning of CTs (Cornforth
et al. 2002). However, in contrast to nuclei of vertebrates, no pronounced radial
arrangement of CTs could be found in Arabidopsis. This is apparently due to the small
number of Arabidopsis chromosomes and their similar gene density.
46
3.3. Alteration of the local interphase chromosome arrangement by
tandem repetitive trangenes and fluorescent chromatin tags
3.3.1. GFP spot numbers vary in 2C live nuclei of homozygous transgenic plants
(EL702C) harboring two tagged loci on the top arm of chromosome 3
The transgenic Arabidopsis line EL702C carries three lac operator/GFP-lacI-NLS
transgenes (~17 kb each) inserted at two independent loci on the top arm of chromosome
3, ~4.2 Mb apart from each other (Figure 8A). The proximal locus harbors two
transgenes in inverse orientation.
In live 2C guard cell nuclei of homozygous EL702C plants, Kato and Lam (2003)
only rarely observed four GFP spots. For statistical evaluation, they counted GFP spot
numbers in live guard cell nuclei of cotyledons of hemizygous and homozygous EL702C
plants and of homozygous EL700S plants (Figure 8B,C). Since EL700S plants contain
the same construct as EL702C plants except for the lac operator array, homogeneously
distributed GFP signals but no GFP spots were expected in the nucleoplasm. In
hemizygous EL702C plants Kato and Lam (published in Pecinka et al. 2005) found
5% of 92 nuclei without spots, 66% with one spot, 27% with two and 2% with three
spots. In homozygous EL702C plants 12% of 197 nuclei were without spot, 34% showed
one spot, 37% two, 11% three and 6% four spots. In homozygous EL700S plants, 55 out
of 56 nuclei showed no, and one nucleus (<2%) showed one spot. The single spot
observed in an EL700S nucleus and a third spot in two hemizygous EL702C nuclei were
most likely caused by spontaneous aggregation of GFP-lac repressor-NLS molecules. The
absence of GFP spots in some EL702C nuclei might be due to a high level of unbound
GFP-lac repressor-NLS protein yielding a strong overall fluorescence intensity that
47
prevents discrimination of spots at the tagged loci. (this initial experiment was
performed by N. Kato) The less than expected numbers of GFP spots in several nuclei
of homozygous and hemizygous EL702C plants indicated either frequent association
and/or a lack of appearance of GFP spots in these nuclei. To distinguish between these
options, FISH experiments were performed to trace individual lac operator loci with and
without expression of the GFP-lac repressor.
Figure 8: GFP spot numbers in living guard cell nuclei (2C) from cotyledons of
dexamethasone-treated transgenic seedlings. (A) Scheme of chromosome 3 with position
of transgene insertions (indicated in green) in EL702C line. The proximal locus harbors
two transgenes in inverse orientation. (B) Percentage of nuclei with 0, 1, 2, 3, and 4
spots of hemizygous EL702C plants (n=92), of homozygous EL702C plants (n=197) and of
homozygous EL700S plants (n=56). (C) Representative images of nuclei with 0, 1, 2, 3, or 4
spots from each of the lines and schematic view of the lac operator array loci on chromosome 3
in each line.
48
3.3.2. GFP spots always co-localize with FISH signals of lac operator arrays, but
not vice versa
At first, GFP spots and FISH signals of the lac operator repeats were counted in
flow-sorted 2C nuclei of homozygous EL702C plants, in which expression of the GFP-
lac repressor protein was induced with dexamethasone (Dex) (Figure 9). Nuclei
without clear GFP spots were excluded from evaluation. Out of 63 analyzed nuclei, 30%
showed one, 35% two, 25% three and 10% four GFP spots. In contrast, 22% of nuclei
showed four FISH signals, 35% two, 35% three and 8% showed one FISH signal (Figure
9A). All GFP spots coincided with a lac operator FISH signal (Figure 9B), but not vice
versa.
Figure 9. Co-localization of GFP-spots and lac operator-FISH signals in Dex-treated 2C leaf
nuclei of homozygous EL702L plants. (A) Percentage of nuclei with 1 to 4 GFP spots versus
FISH signals. There may occur less GFP spots than FISH signals in one nucleus. (B) Examples of
nuclei with 1, 2, 3 or 4 GFP spots coinciding with lac operator-FISH signals. (C) Example of a
nucleus with missing GFP spot (arrow). Nuclei were counterstained with DAPI. Bars, 3 µm.
49
In total 83% out of 252 FISH signals coincided with a GFP signal. Thus, 17% of the
transgene loci cannot be detected by a GFP spot in Dex-treated homozygous EL702C
nuclei under the applied conditions (Figure 9C). Apparently, some GFP spots could
not be discriminated because of high overall fluorescence intensity and/or rapid
bleaching of signals within a minute of exposure. Less than 4 FISH signals per nucleus
may be most likely due to ectopic or allelic alignment of the lac operator arrays.
3.3.3. Lac operator arrays pair more often than random in nuclei of transgenic
plants and thus enhance pairing frequency of adjacent endogenous regions
To test whether the lower than expected number of signals for lac operator arrays is
indeed due to homologous pairing, FISH experiments with the lac operator array and
BACs flanking the transgenic loci were conducted. The pairing frequency of the lac
operator arrays was assessed by tri-color FISH with BAC MGL6 (79.5 kb, ~54 kb
downstream of the insertion, red) flanking the distal locus, BAC F18C1 (100.8 kb, ~55
kb upstream of the insertion, yellow) flanking the proximal locus and lac operator probe
(green) (Figure10B-D), in 60 hemizygous untreated, 62 homozygous untreated and 59
homozygous Dex-treated EL702C nuclei. The lac operator array alignments were
classified as two different types of homologous pairing. If two signals (MGL6, red and
F18C1, yellow) co-localized with a lac operator signal (green), the alignment was
identified as ectopic pairing. If all signals of either MGL6 or F18C were co-localized with a
lac operator signal, the alignment was identified as allelic pairing. In hemizygous nuclei,
ectopic pairing was detected for 13% of the lac operator loci without Dex-treatment. In
homozygous EL702C nuclei without Dex-treatment, ectopic pairing was observed for
27% of the lac operator array loci and allelic pairing for 34% of the loci. After Dex-
50
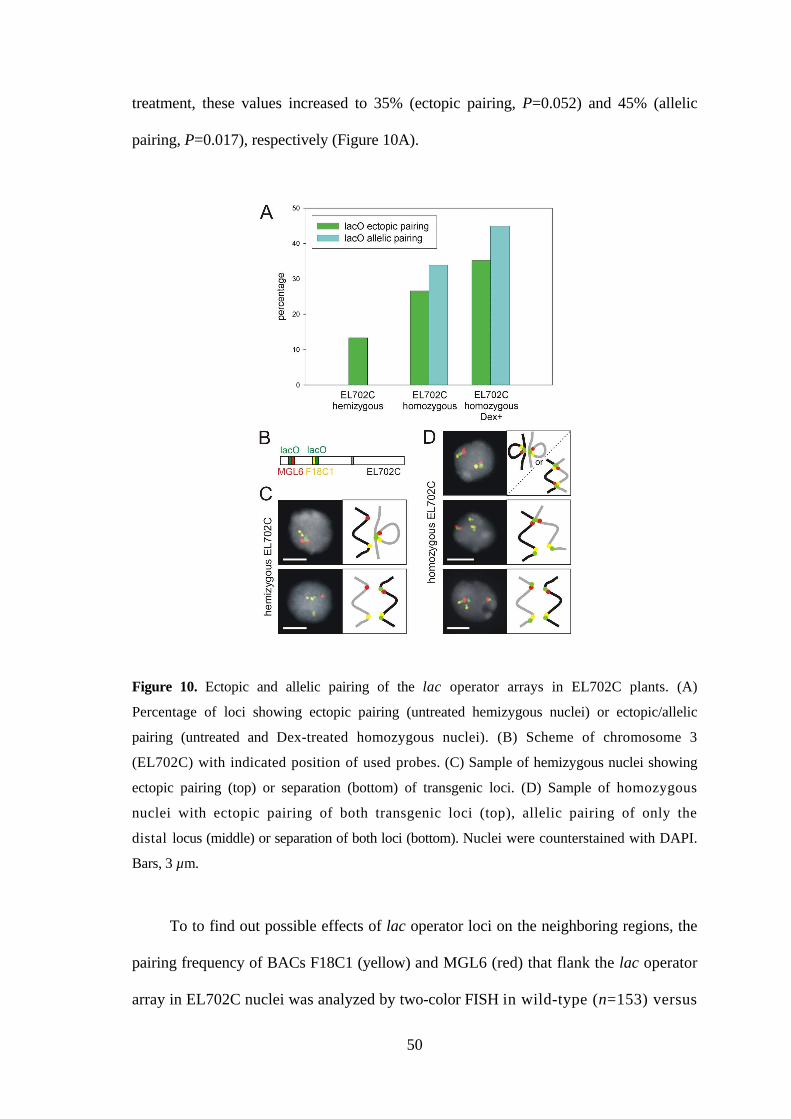
treatment, these values increased to 35% (ectopic pairing, P=0.052) and 45% (allelic
pairing, P=0.017), respectively (Figure 10A).
Figure 10. Ectopic and allelic pairing of the lac operator arrays in EL702C plants. (A)
Percentage of loci showing ectopic pairing (untreated hemizygous nuclei) or ectopic/allelic
pairing (untreated and Dex-treated homozygous nuclei). (B) Scheme of chromosome 3
(EL702C) with indicated position of used probes. (C) Sample of hemizygous nuclei showing
ectopic pairing (top) or separation (bottom) of transgenic loci. (D) Sample of homozygous
nuclei with ectopic pairing of both transgenic loci (top), allelic pairing of only the
distal locus (middle) or separation of both loci (bottom). Nuclei were counterstained with DAPI.
Bars, 3 µm.
To to find out possible effects of lac operator loci on the neighboring regions, the
pairing frequency of BACs F18C1 (yellow) and MGL6 (red) that flank the lac operator
array in EL702C nuclei was analyzed by two-color FISH in wild-type (n=153) versus
51
hemizygous (n=60) and homozygous (n=62) EL702C nuclei without Dex-treatment. In
addition, 61 and 59 nuclei of wild-type and homozygous EL702C after Dex-treatment
were also analyzed (Figure 11).
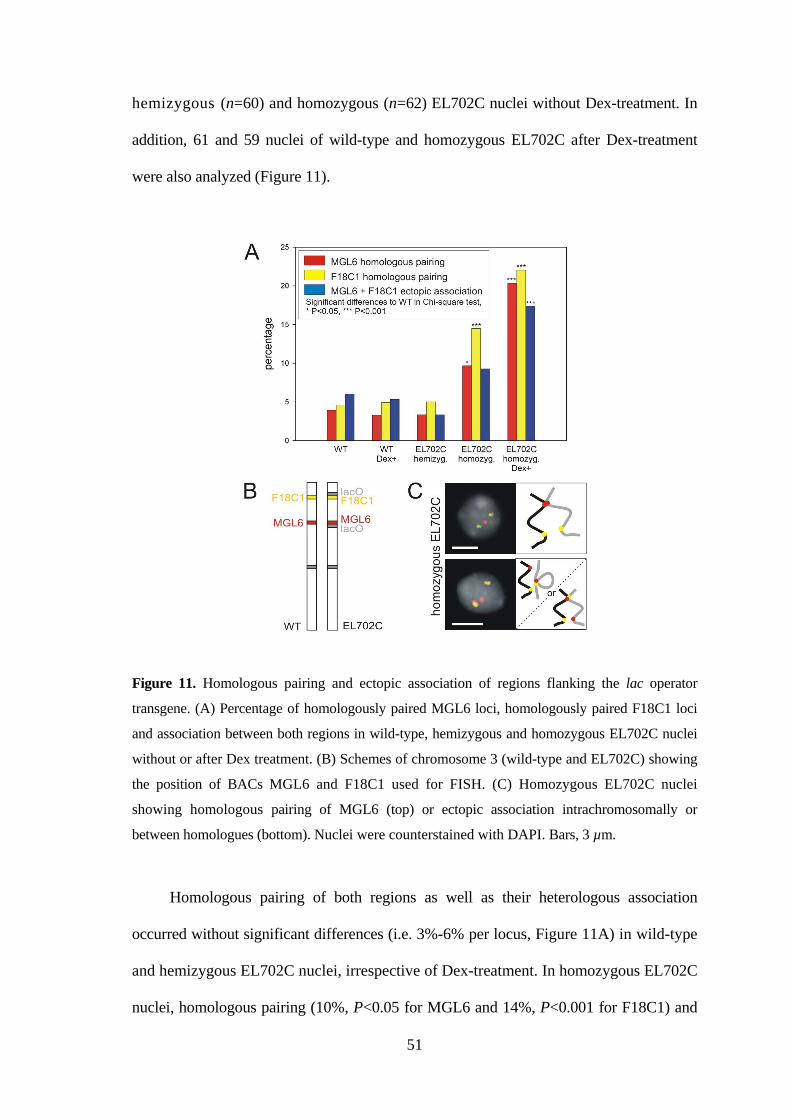
Figure 11. Homologous pairing and ectopic association of regions flanking the lac operator
transgene. (A) Percentage of homologously paired MGL6 loci, homologously paired F18C1 loci
and association between both regions in wild-type, hemizygous and homozygous EL702C nuclei
without or after Dex treatment. (B) Schemes of chromosome 3 (wild-type and EL702C) showing
the position of BACs MGL6 and F18C1 used for FISH. (C) Homozygous EL702C nuclei
showing homologous pairing of MGL6 (top) or ectopic association intrachromosomally or
between homologues (bottom). Nuclei were counterstained with DAPI. Bars, 3 µm.
Homologous pairing of both regions as well as their heterologous association
occurred without significant differences (i.e. 3%-6% per locus, Figure 11A) in wild-type
and hemizygous EL702C nuclei, irrespective of Dex-treatment. In homozygous EL702C
nuclei, homologous pairing (10%, P<0.05 for MGL6 and 14%, P<0.001 for F18C1) and
52
ectopic association (9%, P>0.05) occurred more often than in wild-type. A further
increase of homologous pairing (20%, P=0.032 and 22%, P=0.177, respectively) as well
as of ectopic association (17%, P=0.013; Figure 11A) was found after induction of
GFP-lac repressor protein expression in homozygous EL702C nuclei (all at P<0.001
when compared to wild-type).
Homologous pairing of ~100 kb regions along different chromosomes of A.
thaliana accession Col occurs on an average in about 5% of somatic nuclei (see part
3.2.4.). In wild-type nuclei, allelic pairing and ectopic association of the regions that flank
the lac operator loci in EL702C occur with a similar frequency (3%-6% per locus). These
values are also within the range predicted for random appearance of homologous
pairing according to simulations based on the RSD model (see Materials and
methods). The homozygous presence of the lac operator arrays results in a 4-fold to 10-
fold higher frequency of allelic as well as of ectopic pairing of these loci compared to the
average values observed for endogenous sequences in wild-type nuclei (compare values
for BACs F18C1 and MGL6 in Figure 11A with those for lac operator arrays in Figure
10A). The high allelic pairing frequency of the transgene may exert a “dragging” effect
on the flanking regions (Figure 11A). In hemizygotes, a dragging effect is not obvious
because (i) pairing of the transgene is less frequent than in homozygotes and (ii) in
most cases FISH signals of flanking regions are separated by those of lac operator
loci during ectopic transgene pairing. On the basis of these data it is speculated that
tandem repetitive sequences promote homologous association in Arabidopsis. Such
a tendency for homologous association of tandem repeats could also be the reason for
association of multiple transgene insertion loci in wheat nuclei (Abranches et al. 2000;
Santos et al. 2002).
Expression of the GFP-lac repressor protein in homozygous EL702C nuclei
yielded a further increase of allelic and ectopic pairing of the transgene locus by
53
additional 5 to 10% (Figure 10A), with a dragging effect on the flanking regions
(Figure 11A). Most likely, GFP-lac repressor protein binding to the lac operator
arrays, rather than just expression of the transgene, enforces allelic and ectopic pairing
of the lac operator arrays. Wild-type lac repressor (tetramerizing form) can bind lac
operators on different DNA molecules, tethering together loci on different
chromosomes (Straight et al. 1996; Weiss and Simpson 1997). Because in this study a
dimerizing mutant form of the lac repressor was used (Kato and Lam 2001), which can
bind only one lac operator site (Robinett et al. 1996), the capability of tethering two
chromosomes should be minimized in EL702C. Nevertheless, spontaneous association of
GFP-lac repressor protein molecules bound to different lac operator loci might increase
the pairing frequency. Previously, Kato and Lam (2003) reported that movement
of tagged chromatin in Arabidopsis nuclei, in spite of being spatially constrained,
may span ~0.085µm/min. Because homologous chromosome regions of ~100 kb are
either paired or separated by less than 0.2 µm in ~20 % of Arabidopsis nuclei on
average, it seems reasonable to assume that during the 12 h of Dex-treatment random
associations of lac operator sites may occur and become stabilized due to aggregation of
GFP-lac repressor proteins.
The pairing behavior of lac operator arrays is apparently not sequence specific. A
similar pairing frequency as for the lac operator arrays was found also for the tandem
repetitive transgenic hygromycin phosphotrasnferase (HPT) locus (composed of ~15
rearranged plasmid copies of together ~100 kb) (data of A. Probst in Pecinka et al. J.
Cell Sci, submitted). This locus is silent within the homozygous A. thaliana line A
(Mittelsten Scheid et al. 1991, 1998) and activated in the mom1-1 mutant (Amedeo et al.
2000) without alteration of DNA methylation and histone modifications (Probst et al.
2003). In nuclei of line A, 30% of HPT FISH signals were paired. This value is
significantly higher (P<0.001) than the ~5% of pairing observed for various endogenous
54
euchromatic regions along the Arabidopsis chromosomes (Pecinka et al. 2004). However,
it is not significantly different (P>0.05) from the allelic pairing frequency of transgenic
lac operator arrays (34% of loci) in homozygous EL702C nuclei. In mom1-1 nuclei,
association of HPT FISH signals (21%) was still significantly higher than the
average pairing frequency of Arabidopsis endogenous euchromatic regions (P<0.001).
Sequence-specific but more or less location-independent somatic association of
multiple inserted arrays of tet operator and lac operator has been reported for budding
yeast (Aragon-Alcaide and Strunnikov 2000) although this was not confirmed by
FISH or in the absence of fusion protein. For the same organism, association of tet
operator arrays was shown to depend on the expression of the tet repressor fusion-protein
(Fuchs et al. 2002). In Drosophila, lac O arrays apparently do not necessarily enforce
homologous pairing since it was possible to trace extensive separation of homologues
and even of sister chromatids during premeiotic mid-G2 (Vazquez et al. 2002), although
somatic pairing occurs regularly in many Drosophila tissues.
3.3.4. The transgenic tandem repeats co-localize more often than the flanking
regions with heterochromatic chromocenters
During the FISH analysis described above, a frequent spatial association of lac operator
loci with heterochromatic chromocenters (detected as strongly DAPI-stained regions)
was noticed. Therefore the frequency of positional overlap (co-localization) of FISH
signals of F18C1, MGL6 and lac operator probes with strongly DAPI-stained
chromocenters was quantified in homozygous EL702C nuclei without (n=41) and after
Dex-treatment (n=31). For comparison, the overlap of FISH signals of MGL6 and F18C1
probes with heterochromatin was monitored in 62 wild-type nuclei (Figure 12). In wild-
type nuclei, chromocenters could not be clearly distinguished only on the basis of
55
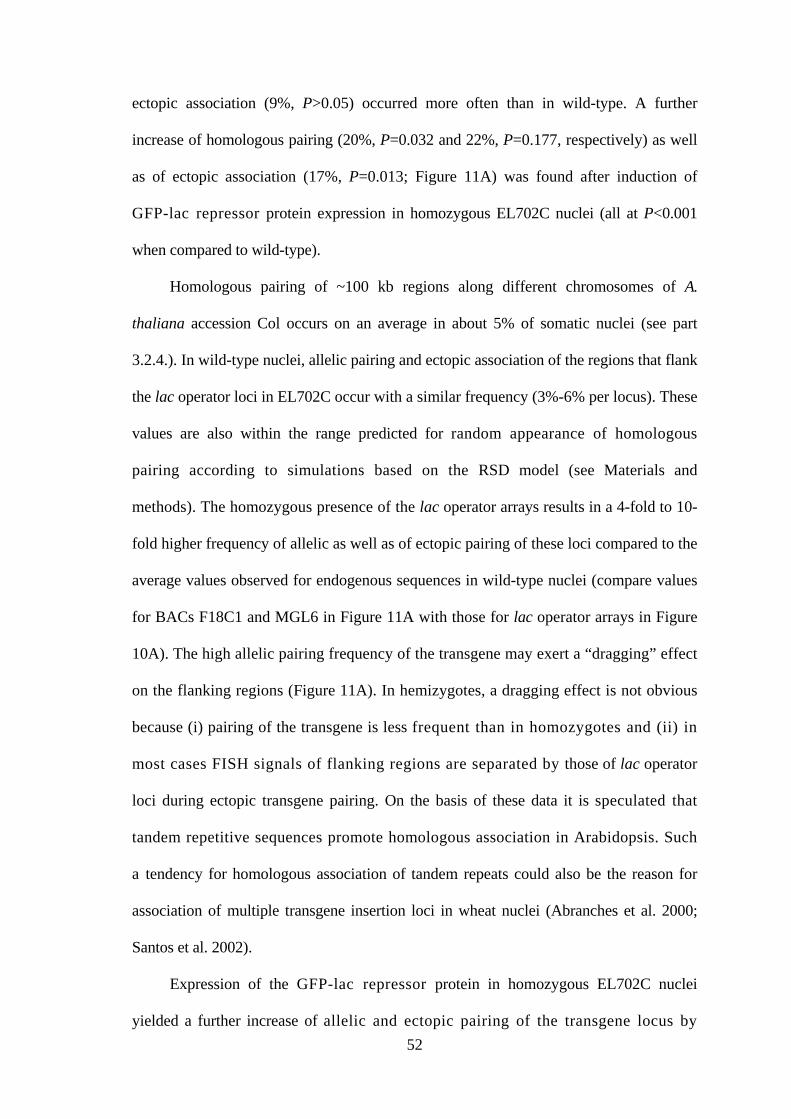
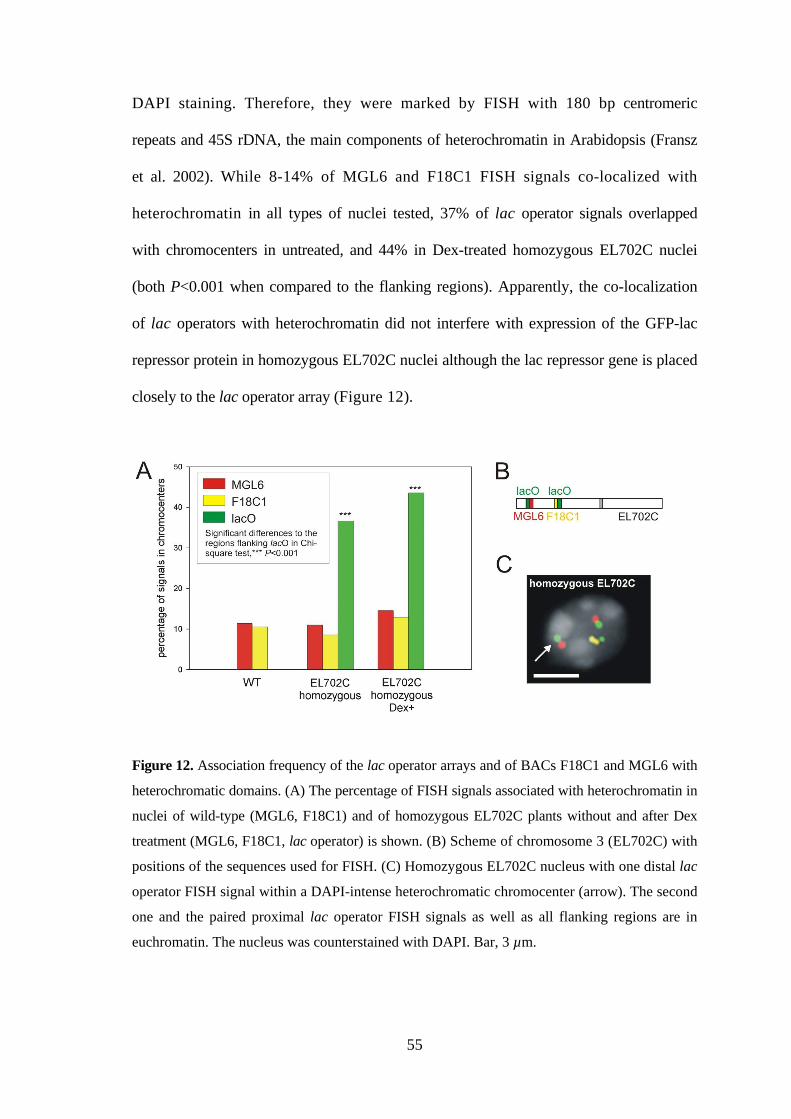
DAPI staining. Therefore, they were marked by FISH with 180 bp centromeric
repeats and 45S rDNA, the main components of heterochromatin in Arabidopsis (Fransz
et al. 2002). While 8-14% of MGL6 and F18C1 FISH signals co-localized with
heterochromatin in all types of nuclei tested, 37% of lac operator signals overlapped
with chromocenters in untreated, and 44% in Dex-treated homozygous EL702C nuclei
(both P<0.001 when compared to the flanking regions). Apparently, the co-localization
of lac operators with heterochromatin did not interfere with expression of the GFP-lac
repressor protein in homozygous EL702C nuclei although the lac repressor gene is placed
closely to the lac operator array (Figure 12).
Figure 12. Association frequency of the lac operator arrays and of BACs F18C1 and MGL6 with
heterochromatic domains. (A) The percentage of FISH signals associated with heterochromatin in
nuclei of wild-type (MGL6, F18C1) and of homozygous EL702C plants without and after Dex
treatment (MGL6, F18C1, lac operator) is shown. (B) Scheme of chromosome 3 (EL702C) with
positions of the sequences used for FISH. (C) Homozygous EL702C nucleus with one distal lac
operator FISH signal within a DAPI-intense heterochromatic chromocenter (arrow). The second
one and the paired proximal lac operator FISH signals as well as all flanking regions are in
euchromatin. The nucleus was counterstained with DAPI. Bar, 3 µm.
56
In order to test whether pairing of lac operator loci precedes association with
heterochromatin, the number of lac operator loci per overlap with a chromocenter was
Appendix: Table 6 Dimensions and volumes of different types of nuclei used for computer model simulations. (Per organ and ploidy level the mean values were used.)
Organ Ploidy Nuclear n Axis length (µm) Volume
shape x y z (µm3)
root 2C sphere 30 5.2 4.1 1.9 22.4
spindle 30 9.4 3.2 1.9 30.0
rod 31 14.3 1.8 1.8 25.4
4C sphere 32 6.6 5.3 2.2 43.5
spindle 31 10.2 3.6 2.2 43.8
rod 31 18.8 2.4 2.1 47.5
leaf 2C sphere 32 5.1 4.4 2.1 25.7
spindle 32 7.1 3.7 2.0 27.9
rod 32 10.3 2.5 2.0 26.4
4C sphere 32 6.1 5.2 2.0 34.4
spindle 32 8.7 4.4 2.2 43.4
rod 32 12.7 3.0 2.1 41.3
Appendix: Table 7 Experimentally observed association of all homologous and heterologous CT combinations in 4C spheric and spindle shaped 4C leaf nuclei
Appendix: Table 8 Values predicted by the SCD model for random association frequency of all homologous and heterologous CT combinations in nuclei of the three predominant nuclear shapes
Appendix: Table 9 Experimentally observed associations of chromosome-arm territories in root and leaf nuclei of different shape and DNA content; T=top arm, B=bottom arm, +=associated, -=separated
Appendix: Table 10 Values predicted by the SCD model for random association frequency of homologous chromosome-arm territories in nuclei of the three predominant nuclear shapes; T=top arm, B=bottom arm, +=associated, -=separated