26
DECEMBER 2010 Chronic Disease Atlas - Coronary Heart Disease - San Diego County
| Date post: | 26-Apr-2018 |
| Category: |
Documents |
| Upload: | nguyenkhanh |
| View: | 214 times |
| Download: | 0 times |

DECEMBER 2010
Chronic Disease Atlas - Coronary Heart Disease -
San Diego County

County of San Diego, Health and Human Services Agency, Public Health Services, Community Health Statistics Unit 1-2011
Coronary Heart Disease (CHD) Medical Encounter* Rates San Diego County by Subregional Area, by Year *CHD deaths refer to underlying (single) cause of death, ICD-10 codes I11, I20-I25. *CHD hospitalizations refer to principal diagnosis, ICD-9 CM codes 402, 410-414, 429.2. *CHD ED discharges refer to principal diagnosis, ICD-9 CM codes 402, 410-414, 429.2 Medical Encounters* Death Data is based on underlying cause of death (not multiple causes) and uses ICD-10 codes. Those included are residents of San Diego County with known zip code of residence. Source: Death Statistical Master Files (CA Department of Public Health), County of San Diego, Health & Human Services Agency, Epidemiology & Immunization Services Branch. Hospital Data is based on principal diagnosis and uses ICD-9 CM codes. Those included are residents of San Diego County with known zip code of residence. Source: Hospital Discharge Data, (CA OSHPD), County of San Diego, Health & Human Services Agency, Epidemiology & Immunization Services Branch. Emergency Department (ED) Data is based on principal diagnosis and uses ICD-9 CM codes. ED discharges are those patients treated and discharged from the ED. Patients admitted to the hospital are not included here, but in the hospitalization data. Those included are residents of San Diego County with known zip code of residence. Source: HASD&IC, County of San Diego, Health & Human Services Agency, Emergency Medical Services, Emergency Department Database. Population Data Source: San Diego Association of Governments (SANDAG), Current Population Estimates, 4/24/2009. Data (rates) prepared by County of San Diego, Health & Human Services Agency, Public Health Services, Community Health Statistics Unit, from Community Profile. Maps prepared by County of San Diego, Health & Human Services Agency, Public Health Services, Emergency Medical Services.
Contact Information: Community Health Statistics Unit
6255 Mission Gorge Road San Diego, CA 92120
(619) 285-6479
[email protected] (Spatial Epidemiologist for EMS)
[email protected] (Biostatistician/Epidemiologist for CHSU)
[email protected] (Senior Epidemiologist for EMS and CHSU)
For more detailed explanation of geography, methods, and sources, see online Community Profile at www.SDHealthStatistics.com

County of San Diego, Health and Human Services Agency, Public Health Services, Community Health Statistics Unit www.sdhealthstatistics.com (619)285-6479
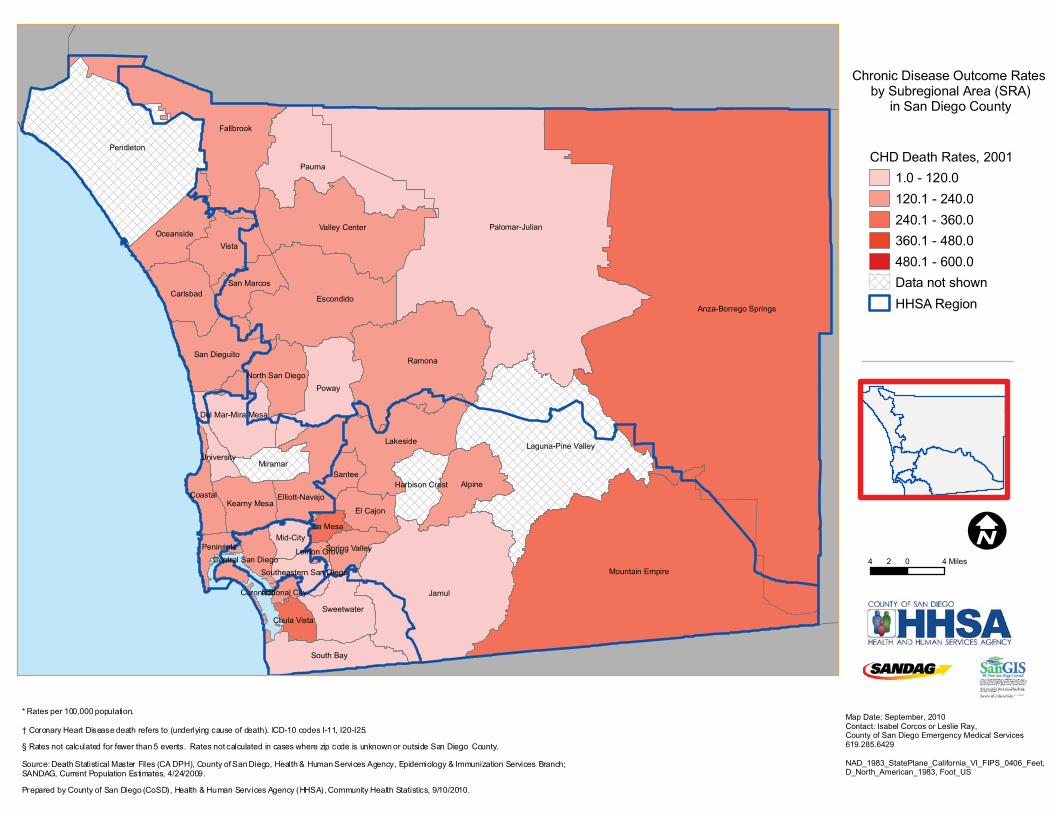
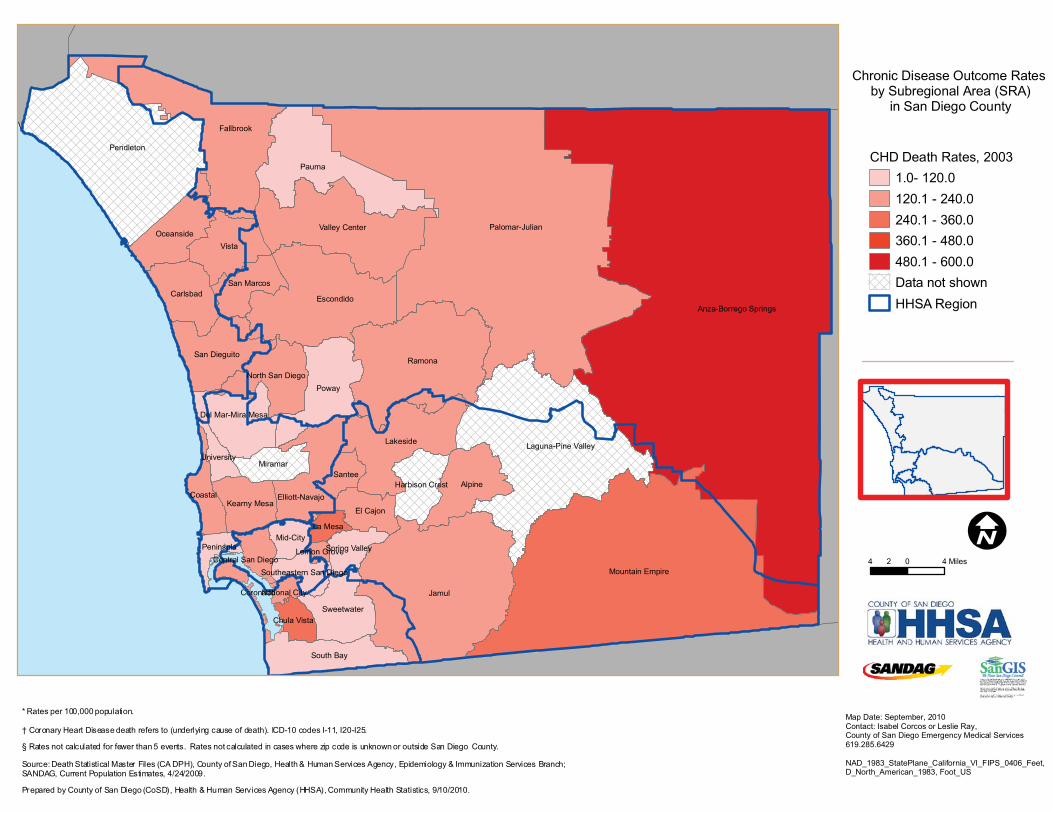
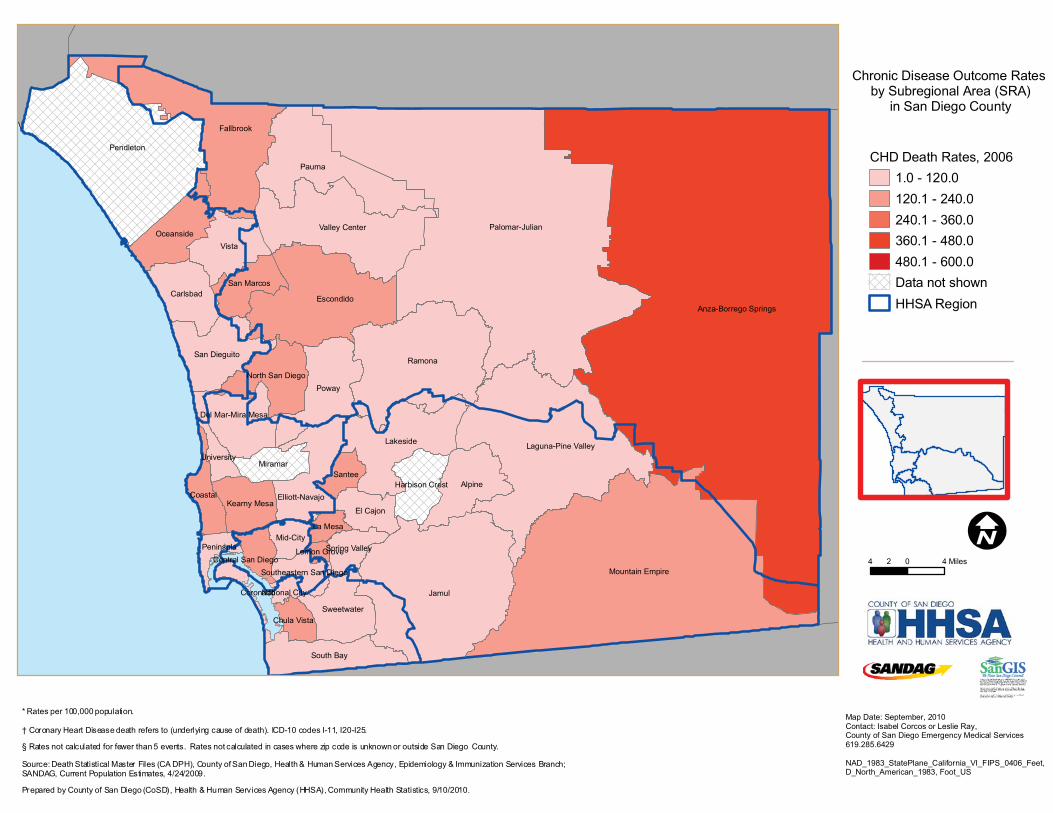
Coronary Heart Disease (CHD) Death Rates Among San Diego County Residents
by Subregional Area
Maps by Year: 2000 2001 2002 2003 2004 2005 2006 2007

Anza-Borrego Springs
Palomar-Julian
Jamul
Mountain Empire
Pendleton
Ramona
Fallbrook
Pauma
Laguna-Pine Valley
Escondido
Valley Center
Lakeside
Poway
Vista
Alpine
South Bay
Carlsbad
Oceanside
San Dieguito
Elliott-Navajo
Sweetwater
El Cajon
Miramar
North San Diego
San Marcos
Del Mar-Mira Mesa
Kearny Mesa
Santee
Mid-CityPeninsula
CoastalHarbison Crest
Spring Valley
Coronado
Chula Vista
Central San Diego
University
La Mesa
Southeastern San Diego
National City
Lemon Grove
Map Date: September, 2010Contact: Isabel Corcos or Leslie Ray,County of San Diego Emergency Medical Services619.285.6429
NAD_1983_StatePlane_California_VI_FIPS_0406_Feet,D_North_American_1983, Foot_US
CHD Death Rates, 20001.0 - 120.0120.1 - 240.0240.1 - 360.0360.1 - 480.0480.1 - 600.0Data not shownHHSA Region
Chronic Disease Outcome Rates by Subregional Area (SRA)
in San Diego County
4 0 42 Miles
* Rates per 100,000 population. † Coronary Heart Disease death refers to (underlying cause of death). ICD-10 codes I-11, I20-I25.
§ Rates not calculated for fewer than 5 events. Rates not calculated in cases where zip code is unknown or outside San Diego County.
Source: Death Statistical Master Files (CA DPH), County of San Diego, Health & Human Services Agency, Epidemiology & Immunization Services Branch; SANDAG, Current Population Estimates, 4/24/2009.
Prepared by County of San Diego (CoSD), Health & Human Services Agency (HHSA), Community Health Statistics, 9/10/2010.
Anza-Borrego Springs
Palomar-Julian
Jamul
Mountain Empire
Pendleton
Ramona
Fallbrook
Pauma
Laguna-Pine Valley
Escondido
Valley Center
Lakeside
Poway
Vista
Alpine
South Bay
Carlsbad
Oceanside
San Dieguito
Elliott-Navajo
Sweetwater
El Cajon
Miramar
North San Diego
San Marcos
Del Mar-Mira Mesa
Kearny Mesa
Santee
Mid-CityPeninsula
CoastalHarbison Crest
Spring Valley
Coronado
Chula Vista
Central San Diego
University
La Mesa
Southeastern San Diego
National City
Lemon Grove
Map Date: September, 2010Contact: Isabel Corcos or Leslie Ray,County of San Diego Emergency Medical Services619.285.6429
NAD_1983_StatePlane_California_VI_FIPS_0406_Feet,D_North_American_1983, Foot_US
CHD Death Rates, 20011.0 - 120.0120.1 - 240.0240.1 - 360.0360.1 - 480.0480.1 - 600.0Data not shownHHSA Region
Chronic Disease Outcome Rates by Subregional Area (SRA)
in San Diego County
4 0 42 Miles
* Rates per 100,000 population. † Coronary Heart Disease death refers to (underlying cause of death). ICD-10 codes I-11, I20-I25.
§ Rates not calculated for fewer than 5 events. Rates not calculated in cases where zip code is unknown or outside San Diego County.
Source: Death Statistical Master Files (CA DPH), County of San Diego, Health & Human Services Agency, Epidemiology & Immunization Services Branch; SANDAG, Current Population Estimates, 4/24/2009.
Prepared by County of San Diego (CoSD), Health & Human Services Agency (HHSA), Community Health Statistics, 9/10/2010.

Anza-Borrego Springs
Palomar-Julian
Jamul
Mountain Empire
Pendleton
Ramona
Fallbrook
Pauma
Laguna-Pine Valley
Escondido
Valley Center
Lakeside
Poway
Vista
Alpine
South Bay
Carlsbad
Oceanside
San Dieguito
Elliott-Navajo
Sweetwater
El Cajon
Miramar
North San Diego
San Marcos
Del Mar-Mira Mesa
Kearny Mesa
Santee
Mid-CityPeninsula
CoastalHarbison Crest
Spring Valley
Coronado
Chula Vista
Central San Diego
University
La Mesa
Southeastern San Diego
National City
Lemon Grove
Map Date: September, 2010Contact: Isabel Corcos or Leslie Ray,County of San Diego Emergency Medical Services619.285.6429
NAD_1983_StatePlane_California_VI_FIPS_0406_Feet,D_North_American_1983, Foot_US
CHD Death Rates, 20021.0 - 120.0120.1 - 240.0240.1 - 360.0360.1 - 480.0480.1 - 600.0Data not shownHHSA Region
Chronic Disease Outcome Rates by Subregional Area (SRA)
in San Diego County
4 0 42 Miles
* Rates per 100,000 population. † Coronary Heart Disease death refers to (underlying cause of death). ICD-10 codes I-11, I20-I25.
§ Rates not calculated for fewer than 5 events. Rates not calculated in cases where zip code is unknown or outside San Diego County.
Source: Death Statistical Master Files (CA DPH), County of San Diego, Health & Human Services Agency, Epidemiology & Immunization Services Branch; SANDAG, Current Population Estimates, 4/24/2009.
Prepared by County of San Diego (CoSD), Health & Human Services Agency (HHSA), Community Health Statistics, 9/10/2010.
Anza-Borrego Springs
Palomar-Julian
Jamul
Mountain Empire
Pendleton
Ramona
Fallbrook
Pauma
Laguna-Pine Valley
Escondido
Valley Center
Lakeside
Poway
Vista
Alpine
South Bay
Carlsbad
Oceanside
San Dieguito
Elliott-Navajo
Sweetwater
El Cajon
Miramar
North San Diego
San Marcos
Del Mar-Mira Mesa
Kearny Mesa
Santee
Mid-CityPeninsula
CoastalHarbison Crest
Spring Valley
Coronado
Chula Vista
Central San Diego
University
La Mesa
Southeastern San Diego
National City
Lemon Grove
Map Date: September, 2010Contact: Isabel Corcos or Leslie Ray,County of San Diego Emergency Medical Services619.285.6429
NAD_1983_StatePlane_California_VI_FIPS_0406_Feet,D_North_American_1983, Foot_US
CHD Death Rates, 20031.0- 120.0120.1 - 240.0240.1 - 360.0360.1 - 480.0480.1 - 600.0Data not shownHHSA Region
Chronic Disease Outcome Rates by Subregional Area (SRA)
in San Diego County
4 0 42 Miles
* Rates per 100,000 population. † Coronary Heart Disease death refers to (underlying cause of death). ICD-10 codes I-11, I20-I25.
§ Rates not calculated for fewer than 5 events. Rates not calculated in cases where zip code is unknown or outside San Diego County.
Source: Death Statistical Master Files (CA DPH), County of San Diego, Health & Human Services Agency, Epidemiology & Immunization Services Branch; SANDAG, Current Population Estimates, 4/24/2009.
Prepared by County of San Diego (CoSD), Health & Human Services Agency (HHSA), Community Health Statistics, 9/10/2010.

Anza-Borrego Springs
Palomar-Julian
Jamul
Mountain Empire
Pendleton
Ramona
Fallbrook
Pauma
Laguna-Pine Valley
Escondido
Valley Center
Lakeside
Poway
Vista
Alpine
South Bay
Carlsbad
Oceanside
San Dieguito
Elliott-Navajo
Sweetwater
El Cajon
Miramar
North San Diego
San Marcos
Del Mar-Mira Mesa
Kearny Mesa
Santee
Mid-CityPeninsula
CoastalHarbison Crest
Spring Valley
Coronado
Chula Vista
Central San Diego
University
La Mesa
Southeastern San Diego
National City
Lemon Grove
Map Date: September, 2010Contact: Isabel Corcos or Leslie Ray,County of San Diego Emergency Medical Services619.285.6429
NAD_1983_StatePlane_California_VI_FIPS_0406_Feet,D_North_American_1983, Foot_US
CHD Death Rates, 20041.0 - 120.0120.1 - 240.0240.1 - 360.0360.1 - 480.0480.1 - 600.0Data not shownHHSA Region
Chronic Disease Outcome Rates by Subregional Area (SRA)
in San Diego County
4 0 42 Miles
* Rates per 100,000 population. † Coronary Heart Disease death refers to (underlying cause of death). ICD-10 codes I-11, I20-I25.
§ Rates not calculated for fewer than 5 events. Rates not calculated in cases where zip code is unknown or outside San Diego County.
Source: Death Statistical Master Files (CA DPH), County of San Diego, Health & Human Services Agency, Epidemiology & Immunization Services Branch; SANDAG, Current Population Estimates, 4/24/2009.
Prepared by County of San Diego (CoSD), Health & Human Services Agency (HHSA), Community Health Statistics, 9/10/2010.

Anza-Borrego Springs
Palomar-Julian
Jamul
Mountain Empire
Pendleton
Ramona
Fallbrook
Pauma
Laguna-Pine Valley
Escondido
Valley Center
Lakeside
Poway
Vista
Alpine
South Bay
Carlsbad
Oceanside
San Dieguito
Elliott-Navajo
Sweetwater
El Cajon
Miramar
North San Diego
San Marcos
Del Mar-Mira Mesa
Kearny Mesa
Santee
Mid-CityPeninsula
CoastalHarbison Crest
Spring Valley
Coronado
Chula Vista
Central San Diego
University
La Mesa
Southeastern San Diego
National City
Lemon Grove
Map Date: September, 2010Contact: Isabel Corcos or Leslie Ray,County of San Diego Emergency Medical Services619.285.6429
NAD_1983_StatePlane_California_VI_FIPS_0406_Feet,D_North_American_1983, Foot_US
CHD Death Rates, 20051.0 - 120.0120.1 - 240.0240.1 - 360.0360.1 - 480.0480.1 - 600.0Data not shownHHSA Region
Chronic Disease Outcome Rates by Subregional Area (SRA)
in San Diego County
4 0 42 Miles
* Rates per 100,000 population. † Coronary Heart Disease death refers to (underlying cause of death). ICD-10 codes I-11, I20-I25.
§ Rates not calculated for fewer than 5 events. Rates not calculated in cases where zip code is unknown or outside San Diego County.
Source: Death Statistical Master Files (CA DPH), County of San Diego, Health & Human Services Agency, Epidemiology & Immunization Services Branch; SANDAG, Current Population Estimates, 4/24/2009.
Prepared by County of San Diego (CoSD), Health & Human Services Agency (HHSA), Community Health Statistics, 9/10/2010.
Anza-Borrego Springs
Palomar-Julian
Jamul
Mountain Empire
Pendleton
Ramona
Fallbrook
Pauma
Laguna-Pine Valley
Escondido
Valley Center
Lakeside
Poway
Vista
Alpine
South Bay
Carlsbad
Oceanside
San Dieguito
Elliott-Navajo
Sweetwater
El Cajon
Miramar
North San Diego
San Marcos
Del Mar-Mira Mesa
Kearny Mesa
Santee
Mid-CityPeninsula
CoastalHarbison Crest
Spring Valley
Coronado
Chula Vista
Central San Diego
University
La Mesa
Southeastern San Diego
National City
Lemon Grove
Map Date: September, 2010Contact: Isabel Corcos or Leslie Ray,County of San Diego Emergency Medical Services619.285.6429
NAD_1983_StatePlane_California_VI_FIPS_0406_Feet,D_North_American_1983, Foot_US
CHD Death Rates, 20061.0 - 120.0120.1 - 240.0240.1 - 360.0360.1 - 480.0480.1 - 600.0Data not shownHHSA Region
Chronic Disease Outcome Rates by Subregional Area (SRA)
in San Diego County
4 0 42 Miles
* Rates per 100,000 population. † Coronary Heart Disease death refers to (underlying cause of death). ICD-10 codes I-11, I20-I25.
§ Rates not calculated for fewer than 5 events. Rates not calculated in cases where zip code is unknown or outside San Diego County.
Source: Death Statistical Master Files (CA DPH), County of San Diego, Health & Human Services Agency, Epidemiology & Immunization Services Branch; SANDAG, Current Population Estimates, 4/24/2009.
Prepared by County of San Diego (CoSD), Health & Human Services Agency (HHSA), Community Health Statistics, 9/10/2010.

Anza-Borrego Springs
Palomar-Julian
Jamul
Mountain Empire
Pendleton
Ramona
Fallbrook
Pauma
Laguna-Pine Valley
Escondido
Valley Center
Lakeside
Poway
Vista
Alpine
South Bay
Carlsbad
Oceanside
San Dieguito
Elliott-Navajo
Sweetwater
El Cajon
Miramar
North San Diego
San Marcos
Del Mar-Mira Mesa
Kearny Mesa
Santee
Mid-CityPeninsula
CoastalHarbison Crest
Spring Valley
Coronado
Chula Vista
Central San Diego
University
La Mesa
Southeastern San Diego
National City
Lemon Grove
Map Date: September, 2010Contact: Isabel Corcos or Leslie Ray,County of San Diego Emergency Medical Services619.285.6429
NAD_1983_StatePlane_California_VI_FIPS_0406_Feet,D_North_American_1983, Foot_US
CHD Death Rates, 20071.0 - 120.0120.1 - 240.0240.1 - 360.0360.1 - 480.0480.1 - 600.0Data not shownHHSA Region
Chronic Disease Outcome Rates by Subregional Area (SRA)
in San Diego County
4 0 42 Miles
* Rates per 100,000 population. † Coronary Heart Disease death refers to (underlying cause of death). ICD-10 codes I-11, I20-I25.
§ Rates not calculated for fewer than 5 events. Rates not calculated in cases where zip code is unknown or outside San Diego County.
Source: Death Statistical Master Files (CA DPH), County of San Diego, Health & Human Services Agency, Epidemiology & Immunization Services Branch; SANDAG, Current Population Estimates, 4/24/2009.
Prepared by County of San Diego (CoSD), Health & Human Services Agency (HHSA), Community Health Statistics, 9/10/2010.

County of San Diego, Health and Human Services Agency, Public Health Services, Community Health Statistics Unit www.sdhealthstatistics.com (619)285-6479
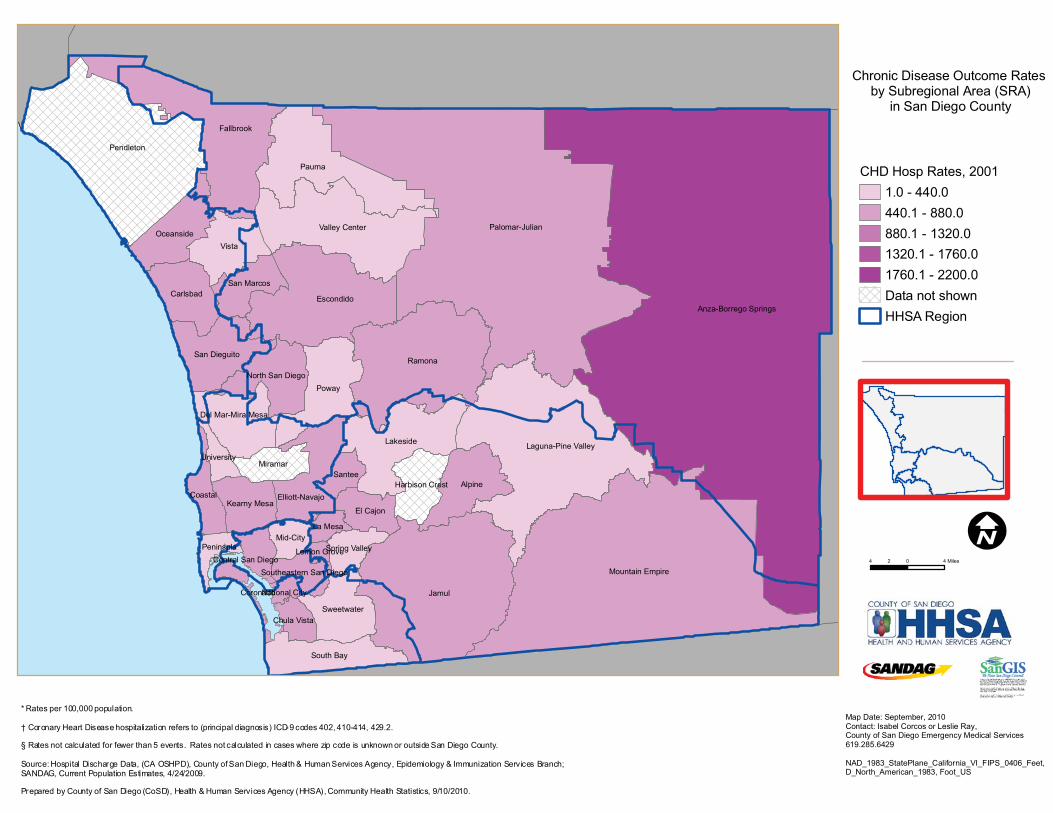
Coronary Heart Disease (CHD) Hospitalization Rates Among San Diego County Residents
by Subregional Area
Maps by Year: 2000 2001 2002 2003 2004 2005 2006 2007 2008

Anza-Borrego Springs
Palomar-Julian
Jamul
Mountain Empire
Pendleton
Ramona
Fallbrook
Pauma
Laguna-Pine Valley
Escondido
Valley Center
Lakeside
Poway
Vista
Alpine
South Bay
Carlsbad
Oceanside
San Dieguito
Elliott-Navajo
Sweetwater
El Cajon
Miramar
North San Diego
San Marcos
Del Mar-Mira Mesa
Kearny Mesa
Santee
Mid-CityPeninsula
CoastalHarbison Crest
Spring Valley
Coronado
Chula Vista
Central San Diego
University
La Mesa
Southeastern San Diego
National City
Lemon Grove
Map Date: September, 2010Contact: Isabel Corcos or Leslie Ray,County of San Diego Emergency Medical Services619.285.6429
NAD_1983_StatePlane_California_VI_FIPS_0406_Feet,D_North_American_1983, Foot_US
CHD Hosp Rates, 20001.0 - 440.0440.1 - 880.0880.1 - 1320.01320.1 - 1760.01760.1 - 2200.0Data not shownHHSA Region
Chronic Disease Outcome Rates by Subregional Area (SRA)
in San Diego County
4 0 42 Miles
* Rates per 100,000 population. † Coronary Heart Disease hospitalization refers to (principal diagnosis) ICD-9 codes 402, 410-414, 429.2. § Rates not calculated for fewer than 5 events. Rates not calculated in cases where zip code is unknown or outside San Diego County. Source: Hospital Discharge Data, (CA OSHPD), County of San Diego, Health & Human Services Agency, Epidemiology & Immunization Services Branch; SANDAG, Current Population Estimates, 4/24/2009. Prepared by County of San Diego (CoSD), Health & Human Services Agency (HHSA), Community Health Statistics, 9/10/2010.
Anza-Borrego Springs
Palomar-Julian
Jamul
Mountain Empire
Pendleton
Ramona
Fallbrook
Pauma
Laguna-Pine Valley
Escondido
Valley Center
Lakeside
Poway
Vista
Alpine
South Bay
Carlsbad
Oceanside
San Dieguito
Elliott-Navajo
Sweetwater
El Cajon
Miramar
North San Diego
San Marcos
Del Mar-Mira Mesa
Kearny Mesa
Santee
Mid-CityPeninsula
CoastalHarbison Crest
Spring Valley
Coronado
Chula Vista
Central San Diego
University
La Mesa
Southeastern San Diego
National City
Lemon Grove
Map Date: September, 2010Contact: Isabel Corcos or Leslie Ray,County of San Diego Emergency Medical Services619.285.6429
NAD_1983_StatePlane_California_VI_FIPS_0406_Feet,D_North_American_1983, Foot_US
CHD Hosp Rates, 20011.0 - 440.0440.1 - 880.0880.1 - 1320.01320.1 - 1760.01760.1 - 2200.0Data not shownHHSA Region
Chronic Disease Outcome Rates by Subregional Area (SRA)
in San Diego County
4 0 42 Miles
* Rates per 100,000 population. † Coronary Heart Disease hospitalization refers to (principal diagnosis) ICD-9 codes 402, 410-414, 429.2. § Rates not calculated for fewer than 5 events. Rates not calculated in cases where zip code is unknown or outside San Diego County. Source: Hospital Discharge Data, (CA OSHPD), County of San Diego, Health & Human Services Agency, Epidemiology & Immunization Services Branch; SANDAG, Current Population Estimates, 4/24/2009. Prepared by County of San Diego (CoSD), Health & Human Services Agency (HHSA), Community Health Statistics, 9/10/2010.

Anza-Borrego Springs
Palomar-Julian
Jamul
Mountain Empire
Pendleton
Ramona
Fallbrook
Pauma
Laguna-Pine Valley
Escondido
Valley Center
Lakeside
Poway
Vista
Alpine
South Bay
Carlsbad
Oceanside
San Dieguito
Elliott-Navajo
Sweetwater
El Cajon
Miramar
North San Diego
San Marcos
Del Mar-Mira Mesa
Kearny Mesa
Santee
Mid-CityPeninsula
CoastalHarbison Crest
Spring Valley
Coronado
Chula Vista
Central San Diego
University
La Mesa
Southeastern San Diego
National City
Lemon Grove
Map Date: September, 2010Contact: Isabel Corcos or Leslie Ray,County of San Diego Emergency Medical Services619.285.6429
NAD_1983_StatePlane_California_VI_FIPS_0406_Feet,D_North_American_1983, Foot_US
CHD Hosp Rates, 20021 - 440.0440.1 - 880.0880.1 - 1320.01320.1 - 1760.01760.1 - 2200.0Data not shownHHSA Region
Chronic Disease Outcome Rates by Subregional Area (SRA)
in San Diego County
4 0 42 Miles
* Rates per 100,000 population. † Coronary Heart Disease hospitalization refers to (principal diagnosis) ICD-9 codes 402, 410-414, 429.2. § Rates not calculated for fewer than 5 events. Rates not calculated in cases where zip code is unknown or outside San Diego County. Source: Hospital Discharge Data, (CA OSHPD), County of San Diego, Health & Human Services Agency, Epidemiology & Immunization Services Branch; SANDAG, Current Population Estimates, 4/24/2009. Prepared by County of San Diego (CoSD), Health & Human Services Agency (HHSA), Community Health Statistics, 9/10/2010.
Anza-Borrego Springs
Palomar-Julian
Jamul
Mountain Empire
Pendleton
Ramona
Fallbrook
Pauma
Laguna-Pine Valley
Escondido
Valley Center
Lakeside
Poway
Vista
Alpine
South Bay
Carlsbad
Oceanside
San Dieguito
Elliott-Navajo
Sweetwater
El Cajon
Miramar
North San Diego
San Marcos
Del Mar-Mira Mesa
Kearny Mesa
Santee
Mid-CityPeninsula
CoastalHarbison Crest
Spring Valley
Coronado
Chula Vista
Central San Diego
University
La Mesa
Southeastern San Diego
National City
Lemon Grove
Map Date: September, 2010Contact: Isabel Corcos or Leslie Ray,County of San Diego Emergency Medical Services619.285.6429
NAD_1983_StatePlane_California_VI_FIPS_0406_Feet,D_North_American_1983, Foot_US
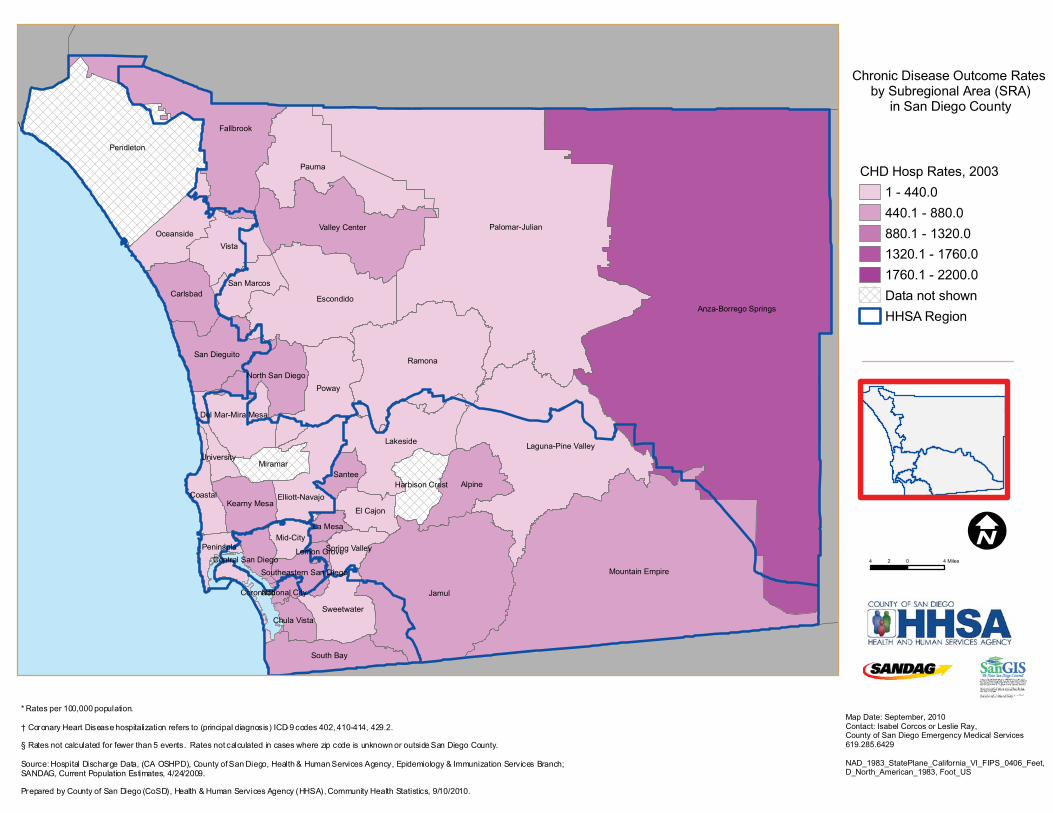
CHD Hosp Rates, 20031 - 440.0440.1 - 880.0880.1 - 1320.01320.1 - 1760.01760.1 - 2200.0Data not shownHHSA Region
Chronic Disease Outcome Rates by Subregional Area (SRA)
in San Diego County
4 0 42 Miles
* Rates per 100,000 population. † Coronary Heart Disease hospitalization refers to (principal diagnosis) ICD-9 codes 402, 410-414, 429.2. § Rates not calculated for fewer than 5 events. Rates not calculated in cases where zip code is unknown or outside San Diego County. Source: Hospital Discharge Data, (CA OSHPD), County of San Diego, Health & Human Services Agency, Epidemiology & Immunization Services Branch; SANDAG, Current Population Estimates, 4/24/2009. Prepared by County of San Diego (CoSD), Health & Human Services Agency (HHSA), Community Health Statistics, 9/10/2010.

Anza-Borrego Springs
Palomar-Julian
Jamul
Mountain Empire
Pendleton
Ramona
Fallbrook
Pauma
Laguna-Pine Valley
Escondido
Valley Center
Lakeside
Poway
Vista
Alpine
South Bay
Carlsbad
Oceanside
San Dieguito
Elliott-Navajo
Sweetwater
El Cajon
Miramar
North San Diego
San Marcos
Del Mar-Mira Mesa
Kearny Mesa
Santee
Mid-CityPeninsula
CoastalHarbison Crest
Spring Valley
Coronado
Chula Vista
Central San Diego
University
La Mesa
Southeastern San Diego
National City
Lemon Grove
Map Date: September, 2010Contact: Isabel Corcos or Leslie Ray,County of San Diego Emergency Medical Services619.285.6429
NAD_1983_StatePlane_California_VI_FIPS_0406_Feet,D_North_American_1983, Foot_US
CHD Hosp Rates, 20041.0 - 440.0440.1 - 880.0880.1 - 1320.01320.1 - 1760.01760.1 - 2200.0Data not shownHHSA Region
Chronic Disease Outcome Rates by Subregional Area (SRA)
in San Diego County
4 0 42 Miles
* Rates per 100,000 population. † Coronary Heart Disease hospitalization refers to (principal diagnosis) ICD-9 codes 402, 410-414, 429.2. § Rates not calculated for fewer than 5 events. Rates not calculated in cases where zip code is unknown or outside San Diego County. Source: Hospital Discharge Data, (CA OSHPD), County of San Diego, Health & Human Services Agency, Epidemiology & Immunization Services Branch; SANDAG, Current Population Estimates, 4/24/2009. Prepared by County of San Diego (CoSD), Health & Human Services Agency (HHSA), Community Health Statistics, 9/10/2010.

Anza-Borrego Springs
Palomar-Julian
Jamul
Mountain Empire
Pendleton
Ramona
Fallbrook
Pauma
Laguna-Pine Valley
Escondido
Valley Center
Lakeside
Poway
Vista
Alpine
South Bay
Carlsbad
Oceanside
San Dieguito
Elliott-Navajo
Sweetwater
El Cajon
Miramar
North San Diego
San Marcos
Del Mar-Mira Mesa
Kearny Mesa
Santee
Mid-CityPeninsula
CoastalHarbison Crest
Spring Valley
Coronado
Chula Vista
Central San Diego
University
La Mesa
Southeastern San Diego
National City
Lemon Grove
Map Date: September, 2010Contact: Isabel Corcos or Leslie Ray,County of San Diego Emergency Medical Services619.285.6429
NAD_1983_StatePlane_California_VI_FIPS_0406_Feet,D_North_American_1983, Foot_US
CHD Hosp Rates, 20051.0 - 440.0440.1 - 880.0880.1 - 1320.01320.1 - 1760.01760.1 - 2200.0Data not shownHHSA Region
Chronic Disease Outcome Rates by Subregional Area (SRA)
in San Diego County
4 0 42 Miles
* Rates per 100,000 population. † Coronary Heart Disease hospitalization refers to (principal diagnosis) ICD-9 codes 402, 410-414, 429.2. § Rates not calculated for fewer than 5 events. Rates not calculated in cases where zip code is unknown or outside San Diego County. Source: Hospital Discharge Data, (CA OSHPD), County of San Diego, Health & Human Services Agency, Epidemiology & Immunization Services Branch; SANDAG, Current Population Estimates, 4/24/2009. Prepared by County of San Diego (CoSD), Health & Human Services Agency (HHSA), Community Health Statistics, 9/10/2010.

Anza-Borrego Springs
Palomar-Julian
Jamul
Mountain Empire
Pendleton
Ramona
Fallbrook
Pauma
Laguna-Pine Valley
Escondido
Valley Center
Lakeside
Poway
Vista
Alpine
South Bay
Carlsbad
Oceanside
San Dieguito
Elliott-Navajo
Sweetwater
El Cajon
Miramar
North San Diego
San Marcos
Del Mar-Mira Mesa
Kearny Mesa
Santee
Mid-CityPeninsula
CoastalHarbison Crest
Spring Valley
Coronado
Chula Vista
Central San Diego
University
La Mesa
Southeastern San Diego
National City
Lemon Grove
Map Date: September, 2010Contact: Isabel Corcos or Leslie Ray,County of San Diego Emergency Medical Services619.285.6429
NAD_1983_StatePlane_California_VI_FIPS_0406_Feet,D_North_American_1983, Foot_US
CHD Hosp Rates, 20061.0 - 440.0440.1 - 880.0880.1 - 1320.01320.1 - 1760.01760.1 - 2200.0Data not shownHHSA Region
Chronic Disease Outcome Rates by Subregional Area (SRA)
in San Diego County
4 0 42 Miles
* Rates per 100,000 population. † Coronary Heart Disease hospitalization refers to (principal diagnosis) ICD-9 codes 402, 410-414, 429.2. § Rates not calculated for fewer than 5 events. Rates not calculated in cases where zip code is unknown or outside San Diego County. Source: Hospital Discharge Data, (CA OSHPD), County of San Diego, Health & Human Services Agency, Epidemiology & Immunization Services Branch; SANDAG, Current Population Estimates, 4/24/2009. Prepared by County of San Diego (CoSD), Health & Human Services Agency (HHSA), Community Health Statistics, 9/10/2010.

Anza-Borrego Springs
Palomar-Julian
Jamul
Mountain Empire
Pendleton
Ramona
Fallbrook
Pauma
Laguna-Pine Valley
Escondido
Valley Center
Lakeside
Poway
Vista
Alpine
South Bay
Carlsbad
Oceanside
San Dieguito
Elliott-Navajo
Sweetwater
El Cajon
Miramar
North San Diego
San Marcos
Del Mar-Mira Mesa
Kearny Mesa
Santee
Mid-CityPeninsula
CoastalHarbison Crest
Spring Valley
Coronado
Chula Vista
Central San Diego
University
La Mesa
Southeastern San Diego
National City
Lemon Grove
Map Date: September, 2010Contact: Isabel Corcos or Leslie Ray,County of San Diego Emergency Medical Services619.285.6429
NAD_1983_StatePlane_California_VI_FIPS_0406_Feet,D_North_American_1983, Foot_US
CHD Hosp Rates, 20071.0 - 440.0440.1 - 880.0880.1 - 1320.01320.1 - 1760.01760.1 - 2200.0Data not shownHHSA Region
Chronic Disease Outcome Rates by Subregional Area (SRA)
in San Diego County
4 0 42 Miles
* Rates per 100,000 population. † Coronary Heart Disease hospitalization refers to (principal diagnosis) ICD-9 codes 402, 410-414, 429.2. § Rates not calculated for fewer than 5 events. Rates not calculated in cases where zip code is unknown or outside San Diego County. Source: Hospital Discharge Data, (CA OSHPD), County of San Diego, Health & Human Services Agency, Epidemiology & Immunization Services Branch; SANDAG, Current Population Estimates, 4/24/2009. Prepared by County of San Diego (CoSD), Health & Human Services Agency (HHSA), Community Health Statistics, 9/10/2010.

Anza-Borrego Springs
Palomar-Julian
Jamul
Mountain Empire
Pendleton
Ramona
Fallbrook
Pauma
Laguna-Pine Valley
Escondido
Valley Center
Lakeside
Poway
Vista
Alpine
South Bay
Carlsbad
Oceanside
San Dieguito
Elliott-Navajo
Sweetwater
El Cajon
Miramar
North San Diego
San Marcos
Del Mar-Mira Mesa
Kearny Mesa
Santee
Mid-CityPeninsula
CoastalHarbison Crest
Spring Valley
Coronado
Chula Vista
Central San Diego
University
La Mesa
Southeastern San Diego
National City
Lemon Grove
Map Date: September, 2010Contact: Isabel Corcos or Leslie Ray,County of San Diego Emergency Medical Services619.285.6429
NAD_1983_StatePlane_California_VI_FIPS_0406_Feet,D_North_American_1983, Foot_US
CHD Hosp Rates, 20081.0 - 440.0440.1 - 880.0880.1 - 1320.01320.1 - 1760.01760.1 - 2200.0Data not shownHHSA Region
Chronic Disease Outcome Rates by Subregional Area (SRA)
in San Diego County
4 0 42 Miles
* Rates per 100,000 population. † Coronary Heart Disease hospitalization refers to (principal diagnosis) ICD-9 codes 402, 410-414, 429.2. § Rates not calculated for fewer than 5 events. Rates not calculated in cases where zip code is unknown or outside San Diego County. Source: Hospital Discharge Data, (CA OSHPD), County of San Diego, Health & Human Services Agency, Epidemiology & Immunization Services Branch; SANDAG, Current Population Estimates, 4/24/2009. Prepared by County of San Diego (CoSD), Health & Human Services Agency (HHSA), Community Health Statistics, 9/10/2010.

County of San Diego, Health and Human Services Agency, Public Health Services, Community Health Statistics Unit www.sdhealthstatistics.com (619)285-6479
Coronary Heart Disease (CHD) Emergency Department Discharge Rates
Among San Diego County Residents by Subregional Area
Maps by Year:
2006 2007 2008
Note: ED Discharge data is a new database. 2006 is first year of available data.

Anza-Borrego Springs
Palomar-Julian
Jamul
Mountain Empire
Pendleton
Ramona
Fallbrook
Pauma
Laguna-Pine Valley
Escondido
Valley Center
Lakeside
Poway
Vista
Alpine
South Bay
Carlsbad
Oceanside
San Dieguito
Elliott-Navajo
Sweetwater
El Cajon
Miramar
North San Diego
San Marcos
Del Mar-Mira Mesa
Kearny Mesa
Santee
Mid-CityPeninsula
CoastalHarbison Crest
Spring Valley
Coronado
Chula Vista
Central San Diego
University
La Mesa
Southeastern San Diego
National City
Lemon Grove
Map Date: September, 2010Contact: Isabel Corcos or Leslie Ray,County of San Diego Emergency Medical Services619.285.6429
NAD_1983_StatePlane_California_VI_FIPS_0406_Feet,D_North_American_1983, Foot_US
CHD ED Rates, 20061.0 - 20.020.1 - 40.040.1 - 60.060.1 - 80.080.1 - 100.0Data not shownHHSA Region
Chronic Disease Outcome Rates by Subregional Area (SRA)
in San Diego County
4 0 42 Miles
* Rates per 100,000 population. † Coronary Heart Disease emergency department discharge refers to (principal diagnosis) ICD-9 codes 402, 410-414, 429.2. § Rates not calculated for fewer than 5 events. Rates not calculated in cases where zip code is unknown or outside San Diego County. Source: HASD&IC, CHIP, County of San Diego, Health & Human Services Agency, Emergency Medical Services, Emergency Department Database; SANDAG, Current Population Estimates, 4/24/2009. Prepared by County of San Diego (CoSD), Health & Human Services Agency (HHSA), Community Health Statistics, 9/10/2010.

Anza-Borrego Springs
Palomar-Julian
Jamul
Mountain Empire
Pendleton
Ramona
Fallbrook
Pauma
Laguna-Pine Valley
Escondido
Valley Center
Lakeside
Poway
Vista
Alpine
South Bay
Carlsbad
Oceanside
San Dieguito
Elliott-Navajo
Sweetwater
El Cajon
Miramar
North San Diego
San Marcos
Del Mar-Mira Mesa
Kearny Mesa
Santee
Mid-CityPeninsula
CoastalHarbison Crest
Spring Valley
Coronado
Chula Vista
Central San Diego
University
La Mesa
Southeastern San Diego
National City
Lemon Grove
Map Date: September, 2010Contact: Isabel Corcos or Leslie Ray,County of San Diego Emergency Medical Services619.285.6429
NAD_1983_StatePlane_California_VI_FIPS_0406_Feet,D_North_American_1983, Foot_US
CHD ED Rates, 20071.0 - 20.020.1 - 40.040.1 - 60.060.1 - 80.080.1 - 100.0Data not shownHHSA Region
Chronic Disease Outcome Rates by Subregional Area (SRA)
in San Diego County
4 0 42 Miles
* Rates per 100,000 population. † Coronary Heart Disease emergency department discharge refers to (principal diagnosis) ICD-9 codes 402, 410-414, 429.2. § Rates not calculated for fewer than 5 events. Rates not calculated in cases where zip code is unknown or outside San Diego County. Source: HASD&IC, CHIP, County of San Diego, Health & Human Services Agency, Emergency Medical Services, Emergency Department Database; SANDAG, Current Population Estimates, 4/24/2009. Prepared by County of San Diego (CoSD), Health & Human Services Agency (HHSA), Community Health Statistics, 9/10/2010.

Anza-Borrego Springs
Palomar-Julian
Jamul
Mountain Empire
Pendleton
Ramona
Fallbrook
Pauma
Laguna-Pine Valley
Escondido
Valley Center
Lakeside
Poway
Vista
Alpine
South Bay
Carlsbad
Oceanside
San Dieguito
Elliott-Navajo
Sweetwater
El Cajon
Miramar
North San Diego
San Marcos
Del Mar-Mira Mesa
Kearny Mesa
Santee
Mid-CityPeninsula
CoastalHarbison Crest
Spring Valley
Coronado
Chula Vista
Central San Diego
University
La Mesa
Southeastern San Diego
National City
Lemon Grove
Map Date: September, 2010Contact: Isabel Corcos or Leslie Ray,County of San Diego Emergency Medical Services619.285.6429
NAD_1983_StatePlane_California_VI_FIPS_0406_Feet,D_North_American_1983, Foot_US
CHD ED Rates, 20081.0 - 20.020.1 - 40.040.1 - 60.060.1 - 80.080.1 - 100.0Data not shownHHSA Region
Chronic Disease Outcome Rates by Subregional Area (SRA)
in San Diego County
4 0 42 Miles
* Rates per 100,000 population. † Coronary Heart Disease emergency department discharge refers to (principal diagnosis) ICD-9 codes 402, 410-414, 429.2. § Rates not calculated for fewer than 5 events. Rates not calculated in cases where zip code is unknown or outside San Diego County. Source: HASD&IC, CHIP, County of San Diego, Health & Human Services Agency, Emergency Medical Services, Emergency Department Database; SANDAG, Current Population Estimates, 4/24/2009. Prepared by County of San Diego (CoSD), Health & Human Services Agency (HHSA), Community Health Statistics, 9/10/2010.

County of San Diego Health and Human Services Agency
Public Health Services Community Health Statistics Unit
www.SDHealthStatistics.com


