Chronic Disease Management in Underserved Populations- Mission Impossible? Jim Schultz, MD, MBA, FAAFP, DiMM Chief Medical Officer Neighborhood Healthcare Escondido, California LA University of Best Practices August 2015
Transcript
Chronic Disease Management in Underserved Populations- Mission
ImpossibleJim Schultz MD MBA FAAFP DiMM
Chief Medical OfficerNeighborhood Healthcare
Escondido California
LA University of Best PracticesAugust 2015
lowast Chose Onelowast A- UCLAlowast B-USClowast C- Other
Audience Response
Evidence-based response
lowast Goalslowast To describe Community Health Centers in San Diego County
lowast To outline challenges to population health improvement and chronic disease management in CHCs
lowast To describe progress in CDM and PopHealth in SD County
lowast To outline the tools used by one CHC to improve CDM and PopHealth
Chronic Disease Management in Underserved
lowast Which EMR do you use for outpatient carelowast 1 EPIClowast 2 CernerClaritylowast 3 NextGenlowast 4 Allscriptslowast 5 Vista or Vista open source variationlowast 6 eClinicalWorkslowast 7 Other
Audience Response
lowast Does your EMR have a usable registry function built inlowast 1 Yeslowast 2 Nolowast 3 Unsure
Audience Response
lowast Do you provide real time population or panel clinical quality data to your medical stafflowast 1 Yes multiple measureslowast 2 Yes one or two measureslowast 3 Nolowast 4 What are you smoking
Audience Response
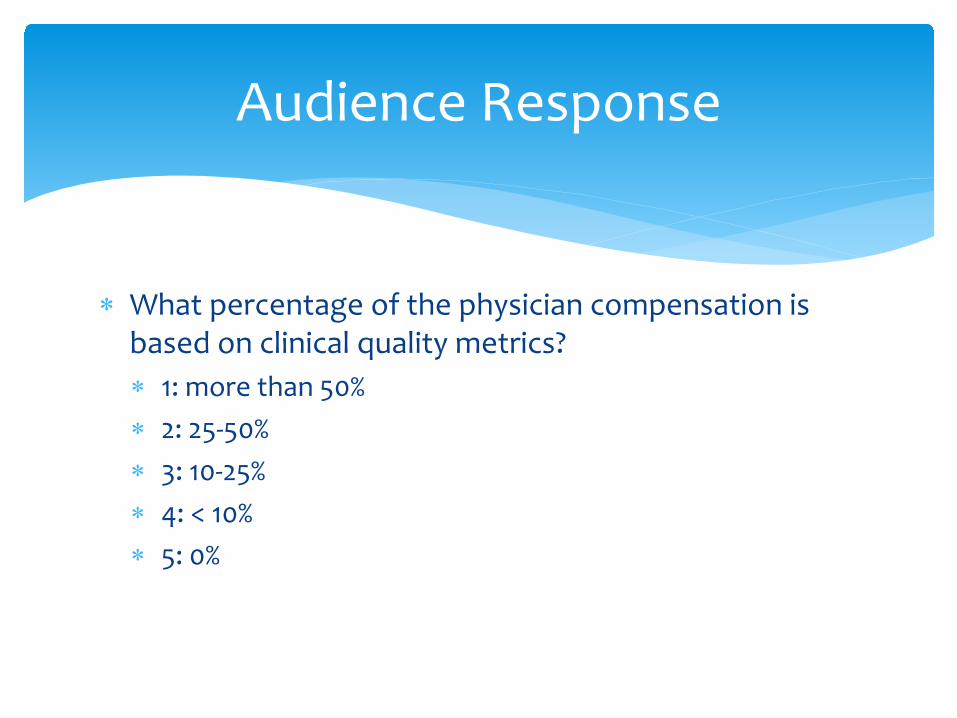
lowast What percentage of the physician compensation is based on clinical quality metricslowast 1 more than 50lowast 2 25-50lowast 3 10-25lowast 4 lt 10lowast 5 0
Audience Response
lowast Is providing real time actionable clinical data to your medical staff at the point of care a priority in your organizationlowast 1 Yes and it is happeninglowast 2 Yes but unable to do it yetlowast 3 Yes but searching for fundingROIlowast 4 Nolowast 5 What is that
Audience Response
lowast 17 not-for-profit private 501c3 organizations plus IHS lowast gt120 siteslowast gt900000 patients served annually lowast gt2000000 encounters annuallylowast gt650 Medical Stafflowast No county hospital in SDlowast No county (primary or specialty) clinics in SDlowast Geographic managed care for MediCaid (68 Plans)lowast Border county 180000 undocumented immigrants with
no health insurance possibilities
Community Health Centers inSan Diego County- the lsquoSafety Netrsquo
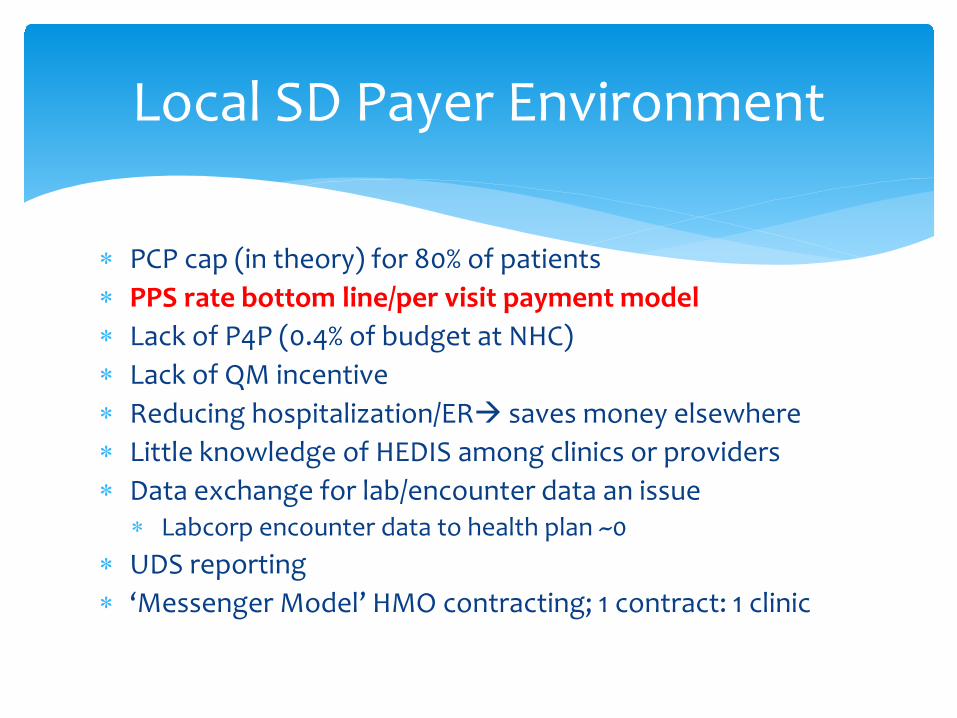
lowast PCP cap (in theory) for 80 of patientslowast PPS rate bottom lineper visit payment modellowast Lack of P4P (04 of budget at NHC)lowast Lack of QM incentivelowast Reducing hospitalizationER saves money elsewherelowast Little knowledge of HEDIS among clinics or providerslowast Data exchange for labencounter data an issue
lowast Labcorp encounter data to health plan ~0lowast UDS reportinglowast lsquoMessenger Modelrsquo HMO contracting 1 contract 1 clinic
Local SD Payer Environment
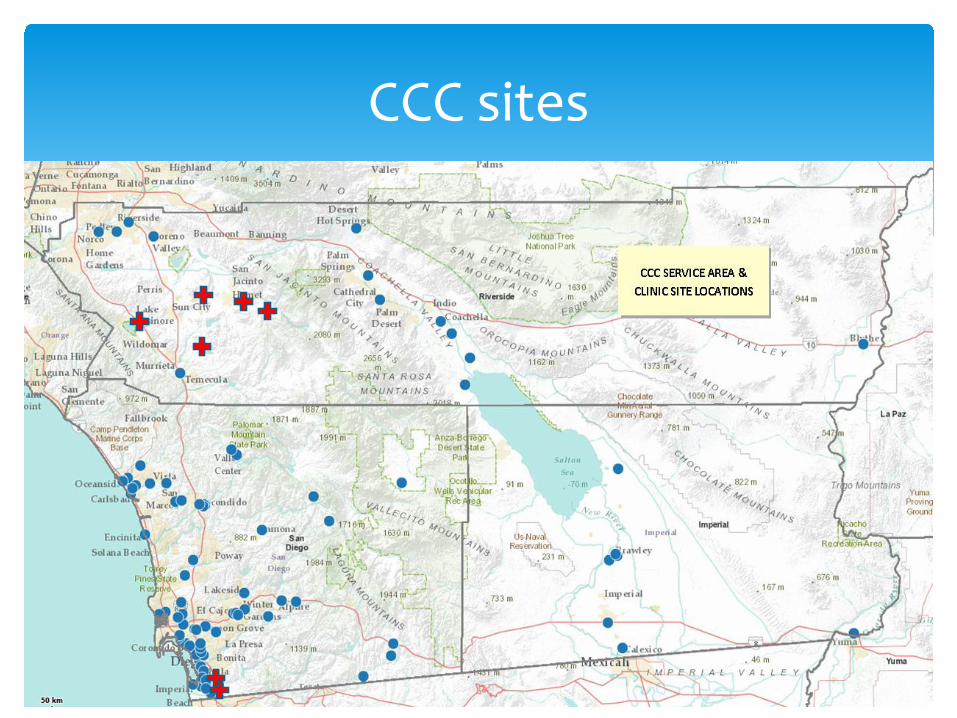
CCC sites
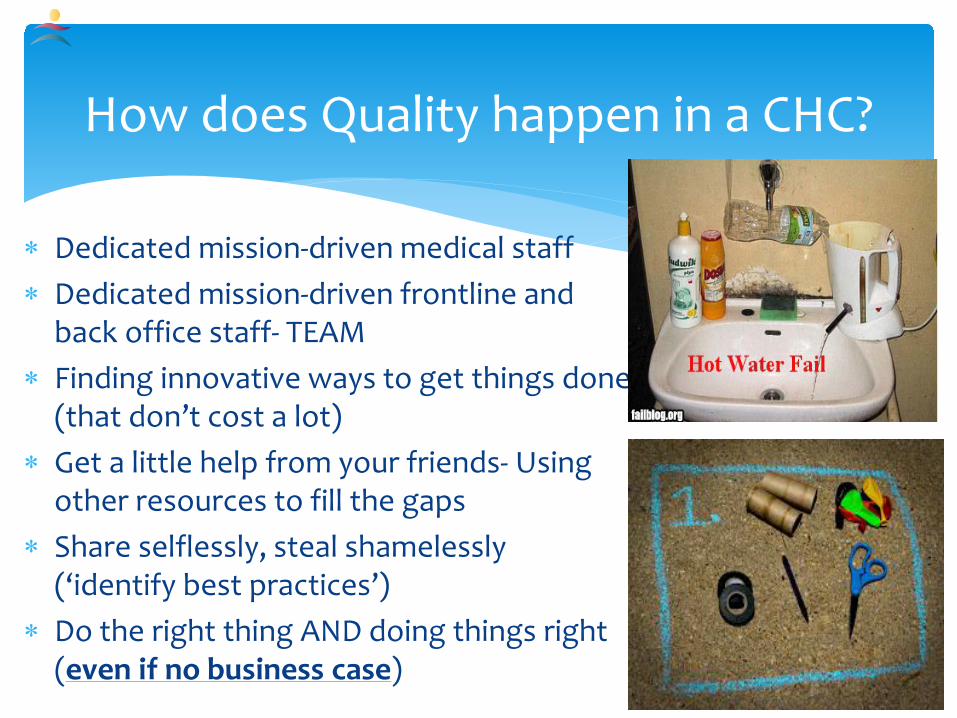
Quality Work in CHCs
lowast Dedicated mission-driven medical stafflowast Dedicated mission-driven frontline and
back office staff- TEAMlowast Finding innovative ways to get things done
(that donrsquot cost a lot)lowast Get a little help from your friends- Using
other resources to fill the gapslowast Share selflessly steal shamelessly
(lsquoidentify best practicesrsquo)lowast Do the right thing AND doing things right
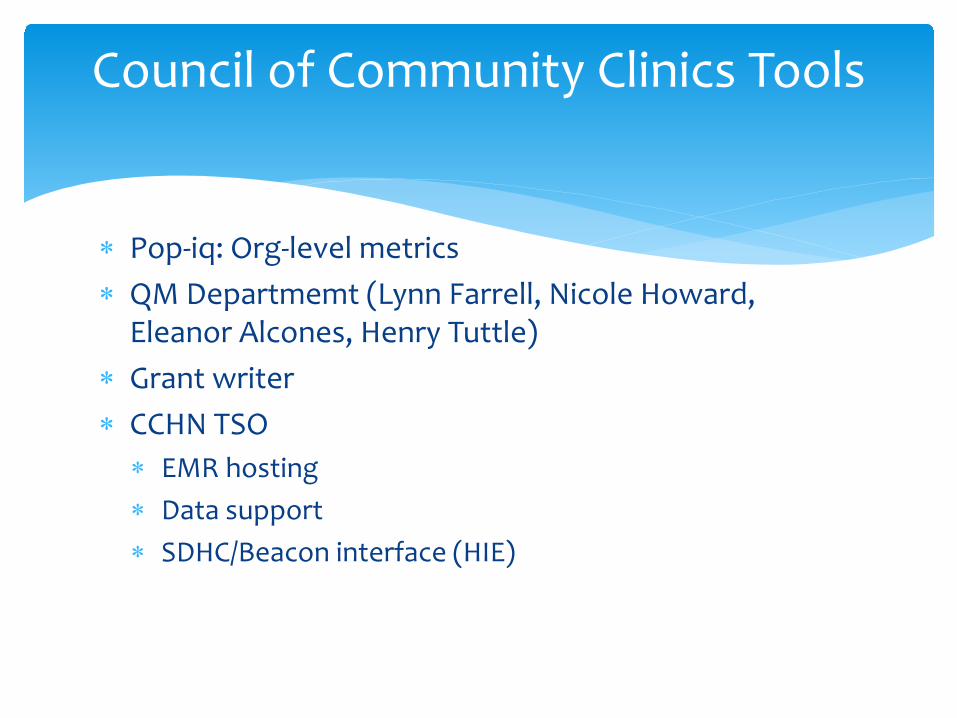
lowast Pop-iq Org-level metricslowast QM Departmemt (Lynn Farrell Nicole Howard
Eleanor Alcones Henry Tuttle)lowast Grant writerlowast CCHN TSOlowast EMR hostinglowast Data supportlowast SDHCBeacon interface (HIE)
Council of Community Clinics Tools
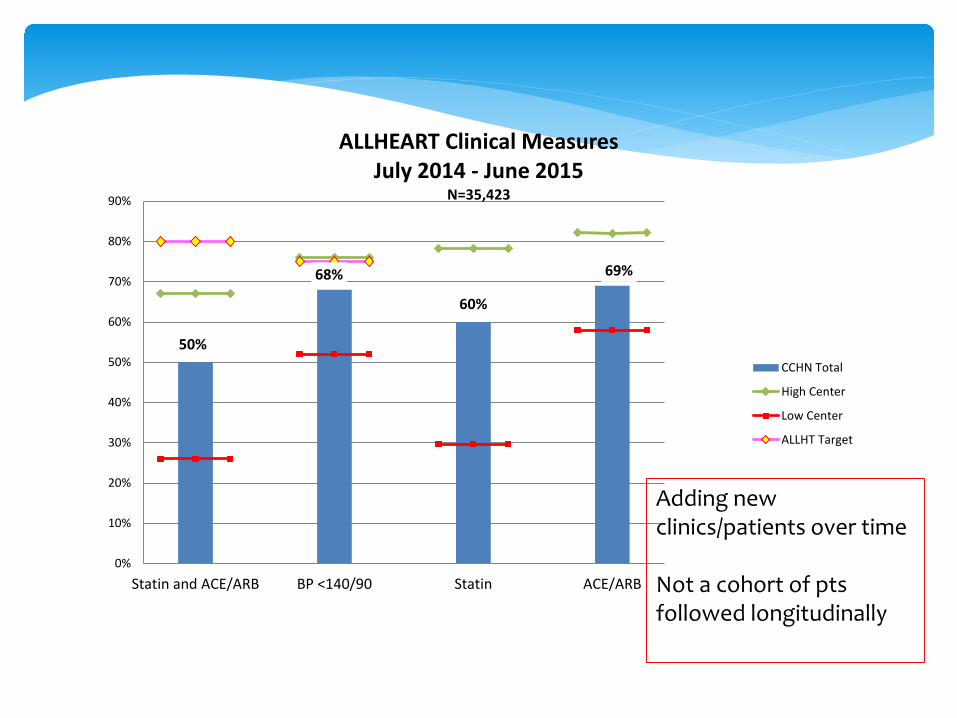
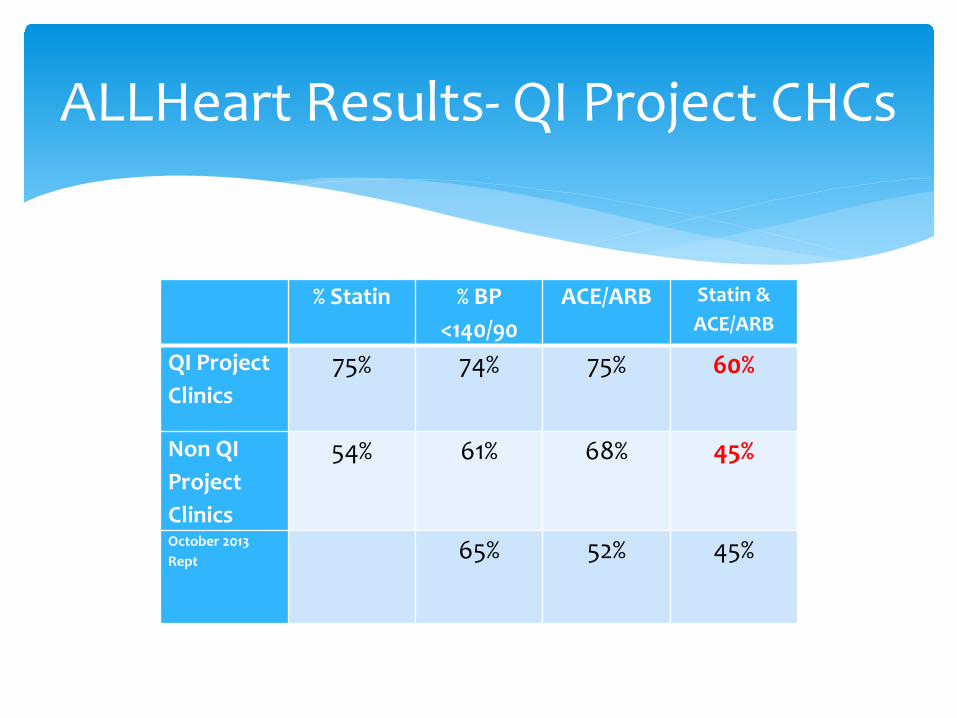
Council of Community Clinicslowast ALLHeart as an example of consortium-level Quality
Improvement effortlowast DM age 50+lowast Tracking
lowast ALL use (med bundle) lowast Rx not dispensing data
lowast Clinical measureslowast BP A1C test and results Tobacco usecounselling Self
Management LDL test and results etclowast No CV event data
lowast Provider and staff educationlowast Targeted interventions in select clinics of their own designlowast Kaiser Community Benefit fundedlowast Followed ALL effort
ALL HEART Clinics by CountyImperial County
Clinicas de Salud del Pueblo
Los Angeles County
Northeast Valley Health Corporation
Eisner Pediatric amp Family Medical Center
Central City Community Health Center (Sites also in Orange County amp Riverside)
Group AverageQ1Q2Q3Q4070399999999999996071299999999999997073075MedicaidQ1Q2Q3Q406062064065CommercialQ1Q2Q3Q4070399999999999996071299999999999997073075MedicareQ1Q2Q3Q406806850000000000000507071MedicaidQ1Q2Q3Q4060403379999999971743894300000000630674973000000027CommercialQ1Q2Q3Q40100672299999999952906490500000001251124955000000045MedicareQ1Q2Q3Q4040268919999999981162596200000000620449982000000018
Estimated 2014 Blood Pressure Control Rates by Quarter amp Insurance
Type
38
Slide courtesy Allen Fremont MD Rand Corp
Estimated 2014 Patients with Newly Controlled Blood Pressure by
Group AverageQ1Q2Q3Q4070399999999999996071299999999999997073075MedicaidQ1Q2Q3Q406062064065CommercialQ1Q2Q3Q4070399999999999996071299999999999997073075MedicareQ1Q2Q3Q406806850000000000000507071MedicaidQ1Q2Q3Q4060403379999999971743894300000000630674973000000027CommercialQ1Q2Q3Q40100672299999999952906490500000001251124955000000045MedicareQ1Q2Q3Q4040268919999999981162596200000000620449982000000018
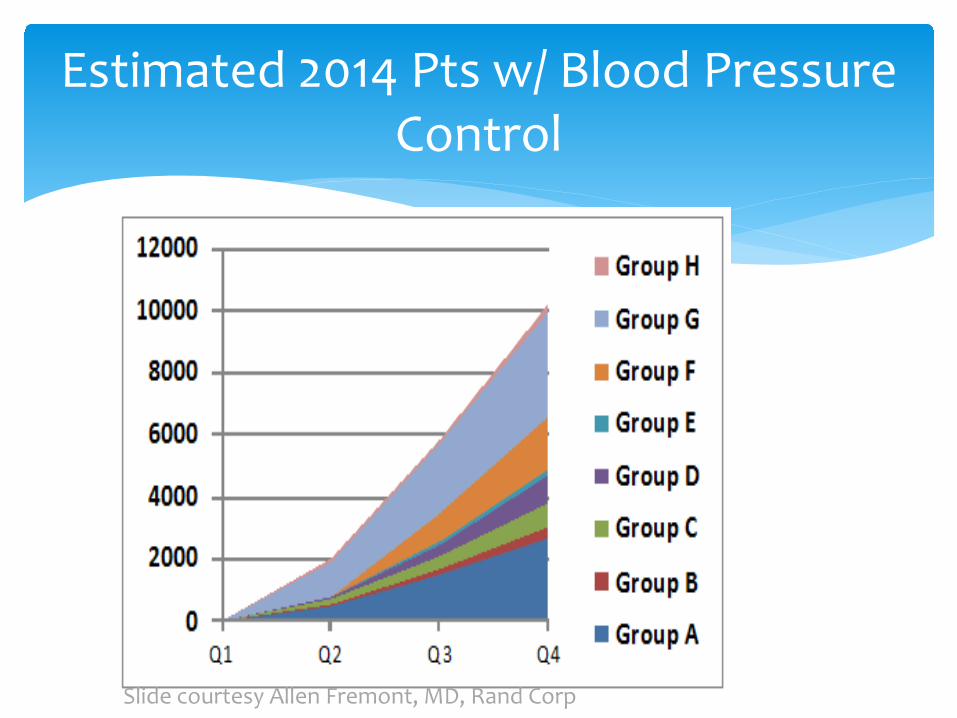
Estimated 2014 Pts w Blood Pressure Control
40
Slide courtesy Allen Fremont MD Rand Corp
41Slide courtesy Allen Fremont MD Rand Corp
Neighborhood Healthcare2014 stats12 sites2 counties65000 patients245000 visits18000 BH only visits
gt40 medical providers
9 primary care sites all PCMH-accredited except new Menifee(5 with embedded BH 1 rural with outside agency)
lowast Private non-profit corporation licensed by CA DHSlowast Federally Qualified Health Center (lsquoFQHCrsquo lsquo330rsquo clinic)lowast Volunteer Board of Directors consumer representation lowast Discounted sliding fee scale for cash patients ($35)lowast Evening and Saturday hourslowast Employed MDs NPs and PAs dentists psychiatrists
psychologists psych NPs midwives 1 Chiropractorlowast Staff cultural competence reflects patient demographicslowast NCQA PCMH level 23lowast Limited specialty care no inpatient or SNF care
wwwnhcareorg
Neighborhood Healthcare
44
NHC- Providing Quality Health Care Since 1969
lowast Medical dental and behavioral health services to 65000 people annually in 245000 visits
lowast 450+ employees Annual Budget $48 million lowast 100 full and part time clinical staff licensedboard-
certified in family medicine internal medicine pediatrics geriatrics sports medicine psychology psychiatry geropsych general dentistry pediatric dentistry chiropractic and others
wwwnhcareorg
Neighborhood HealthcareFY 2016 Budget -- Revenue by Category
TOTAL REVENUE = $49676159(excludes revenue from capital)
Sliding Scale Patient Payments
15
Donations 07
Medi-Cal651
Medicare66
Private Insurance04
County State and Federal
Grants amp Contracts
163
Contract Rx Program
65
Other Income
24
Medi-Cal = 178Mgd Care Medi-Cal = 473
Medicare = 28Mgd Care Medicare = 38
Private Insurance 02Mgd Care Commercial 01
Mgd Care Covered CA $ 01
Neighborhood HealthcareFY 2016 ndash Patient Care Revenue
Medi-Cal 60377 = 217Mgd Care Medi-Cal 160205 = 576
Public Insurance 12435 = 45Grants amp Contracts 583 = 02
Neighborhood HealthcareExpenses ndash
Patient Care vs Administrative Support
Administrative Costs159
Fundraising 07
Direct Services834
34
58
67
79
69
75
98
53
61
0
20
40
60
80
100
1201 9 17 25 33 41 49 57 65 73 81 89 97 105
113
121
129
137
145
153
161
169
177
185
193
201
209
217
225
233
241
249
257
265
273
281
289
297
305
313
321
329
337
345
353
361
369
377
dm a1c gt9 DM LDL cont cvd ldl cont DM BP cont BP control
smokcess asthma on cont CRC screened mammo pap
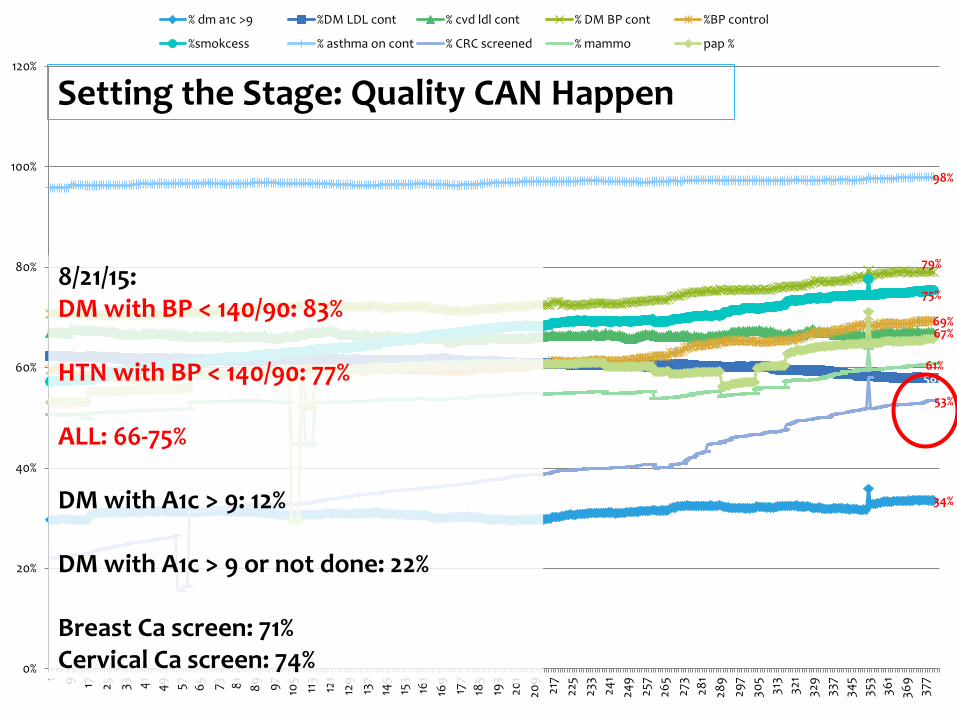
Setting the Stage Quality CAN Happen
82115DM with BP lt 14090 83
HTN with BP lt 14090 77
ALL 66-75
DM with A1c gt 9 12
DM with A1c gt 9 or not done 22
Breast Ca screen 71Cervical Ca screen 74
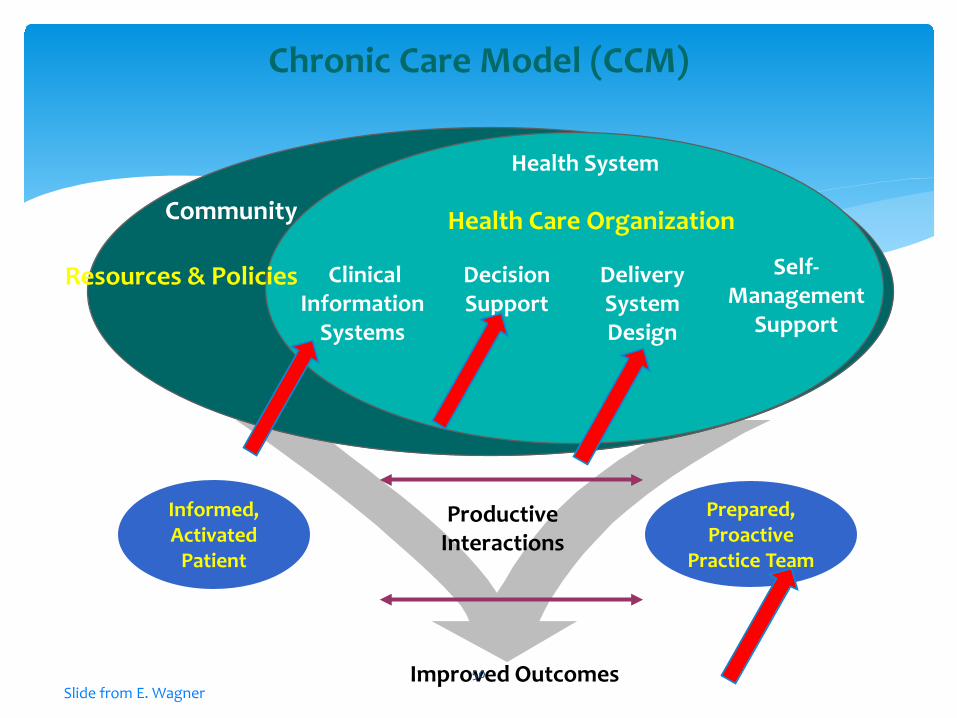
Resources amp Policies
Community
DeliverySystemDesign
DecisionSupport
ClinicalInformation
Systems
Self-Management
Support
Health System
Health Care Organization
InformedActivated
Patient
PreparedProactive
Practice Team
ProductiveInteractions
Improved Outcomes
Chronic Care Model (CCM)
Slide from E Wagner 50
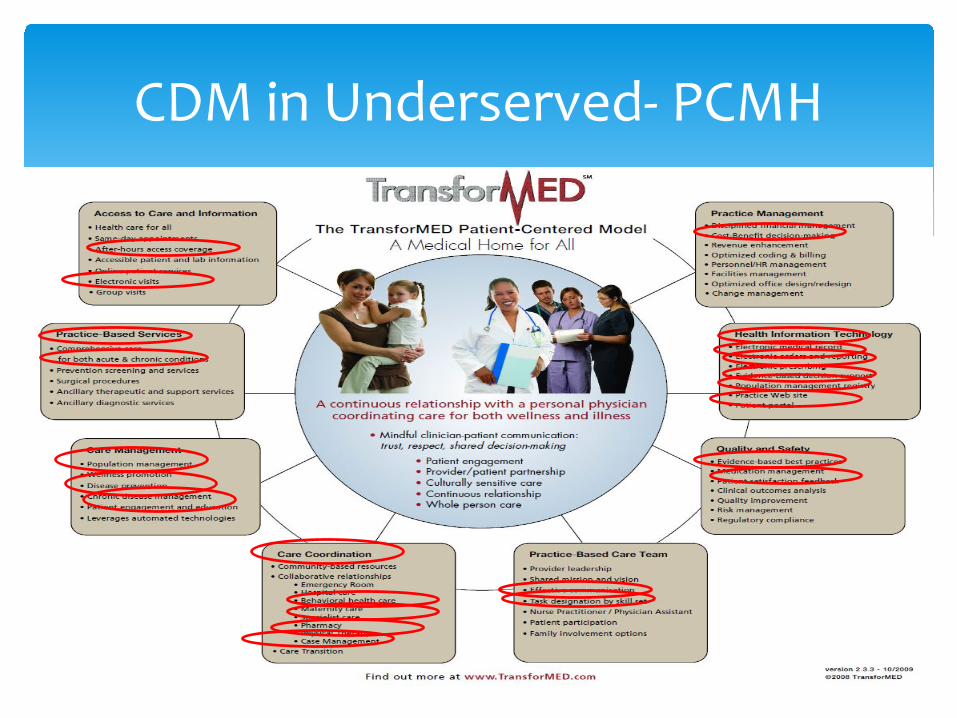
CDM in Underserved- PCMH
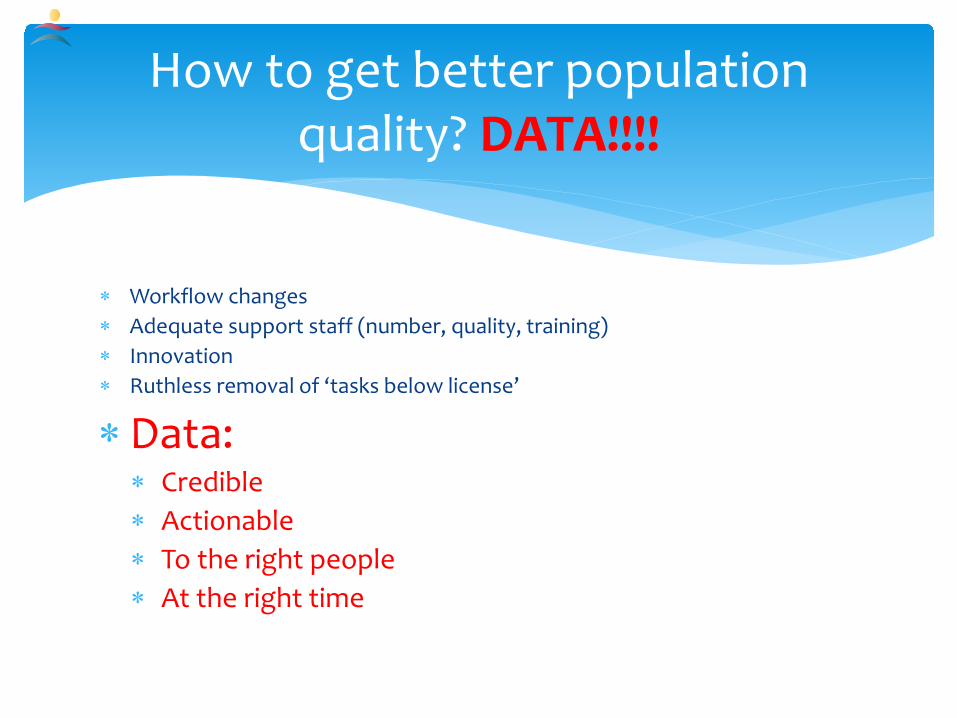
lowast Workflow changeslowast Adequate support staff (number quality training)lowast Innovation (NHC=lsquoMikeyrsquo)lowast Ruthless removal of lsquotasks below licensersquolowast Datalowast Crediblelowast Actionablelowast To the right peoplelowast At the right time
management program inception 2000lowast Dulce group medical apptslowast pain mgmt groups asthma groups
lowast Disparities collaborative (depression screen and rx)lowast BH integrationlowast EHR 2010lowast PCMH MUlowast AllHeart ALL (Kaiser grant through CCC)
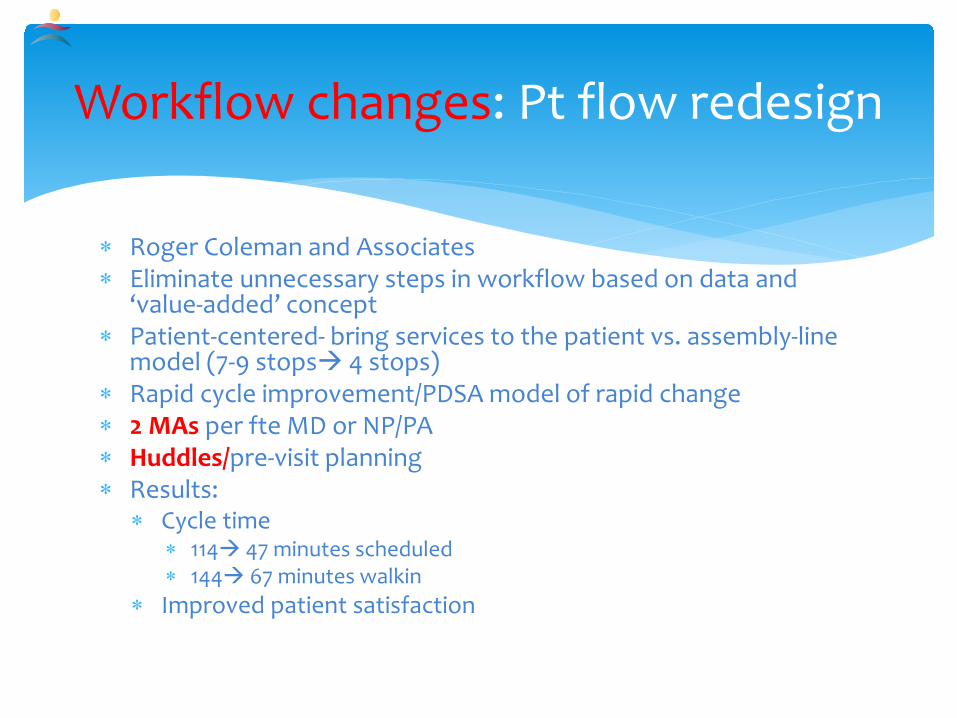
lowast Roger Coleman and Associateslowast Eliminate unnecessary steps in workflow based on data and
lsquovalue-addedrsquo conceptlowast Patient-centered- bring services to the patient vs assembly-line
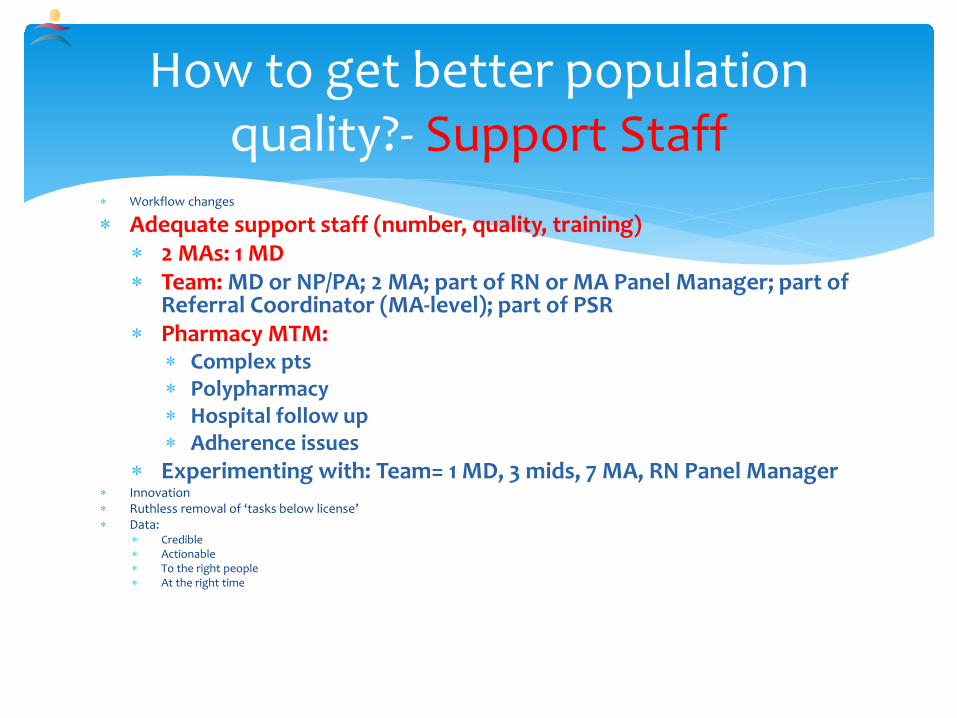
model (7-9 stops 4 stops)lowast Rapid cycle improvementPDSA model of rapid changelowast 2 MAs per fte MD or NPPAlowast Huddlespre-visit planninglowast Results
lowast Experimenting with Team= 1 MD 3 mids 7 MA RN Panel Managerlowast Innovationlowast Ruthless removal of lsquotasks below licensersquolowast Data
lowast Crediblelowast Actionablelowast To the right peoplelowast At the right time
How to get better population quality- Support Staff
lowast Workflow changeslowast Adequate support staff (number quality training)
lowast Innovationlowast And leveraging othersrsquo innovations
lowast Ruthless removal of lsquotasks below licensersquolowast Data
lowast Crediblelowast Actionablelowast To the right peoplelowast At the right time
How to get better population quality- Innovation
lowast RN CDE-led chronic disease management programlowast Key features
lowast Stared ~1999 with Dr NickECClowast RN-ledlowast BH availablelowast MDNPPA involvement on med changeslab interpretationexamlowast Self management skillslowast Patient education and activationlowast Care coordination (scheduling labs referrals PCP consultation
foot exams)lowast Proactive office encounter (huddles pre0visit planning)lowast Single stable point of contact (health coach) for the patient
Innovation Project Dulce
Project Dulce Cost-Effectiveness
Cost savings estimates for Dulce Model (~$QALY 2006 $)
Uninsured $10000
County Medical Services $25000
Medicaid $45000
Commercial $70000Health Services Research Health Research and Educational TrustDOI 101111j1475-6773200700701x
Analysis of the impact of group medical visits on clinical outcomes of Project Dulce patients with Diabetes HbA1c Results of August 2006 Enrollees with a group medical visit between 72000 to 62006
00
10
20
30
40
50
60
70
80
90
HbA1c Prior toDulce 11(n=78)
HbA1c Prior to GMV(n=78 plt0001)
HbA1c after 6months
(n=55 plt005)
HbA1c after 12months
(n=55 plt005)
HbA1c after 18months
(n=24 plt005)
HbA1c after 24months
(n=22 plt005)
87
7872 70 70 72
(n=24) (n=22)(n=55)(n=55)(n=78)(n=78)
Project Dulce Group Medical Visits Analysis of change in HbA1c over time
Pre-EMR
Innovation
Primary Care retinal photography
George Hayes CRR - Scripps Whittier Institute
lowast Workflow changeslowast Adequate support staff (number quality training)lowast Innovationlowast Ruthless removal of lsquotasks below licensersquo
lowastDatalowast Crediblelowast Actionablelowast To the right peoplelowast At the right time
How to get better population quality DATA
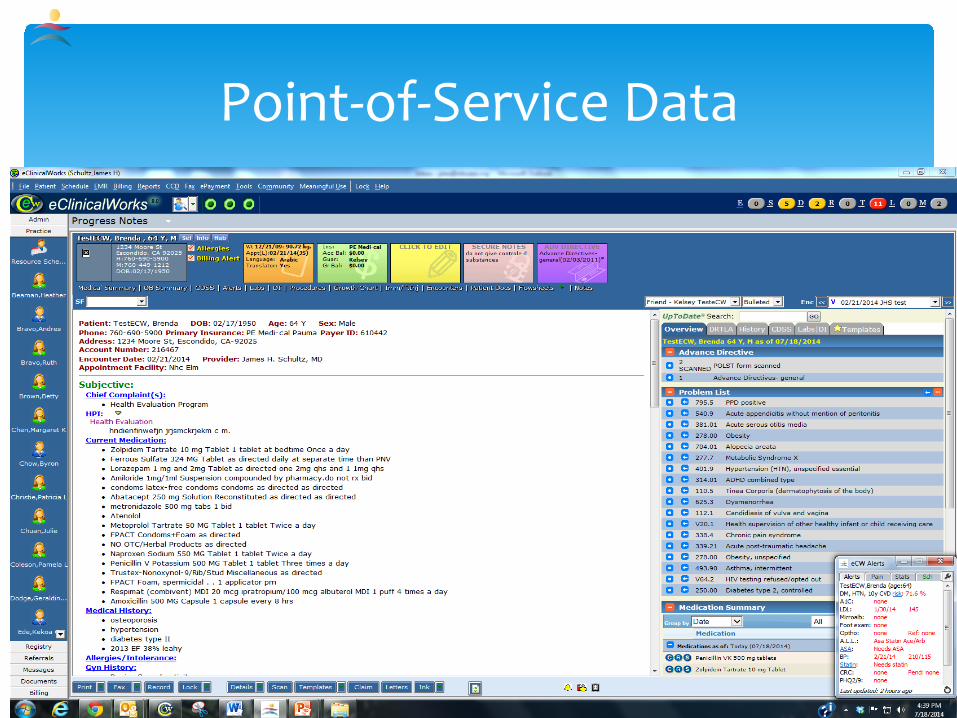
lowast 2010 implementation of eClinicalWorks (eCW)
lowast Data lag 1 year +lowast Validation period 1 year +lowast Registry functionlowast BridgeITlowast Home-grown registrylowast eCW alerts point-of-service data with low annoyance
quotientlowast i2i
NHC Data Journey EMR
lowast 5 stages of grief (Kubler-Ross)lowast Denial- lsquothe data are wrongrsquo lsquoitrsquos not my patientsrsquo
lowast Remedy only show good easily-verifiable datalowast Anger-rsquo damn you they arenrsquot my ptsrsquo lsquoI donrsquot practice cookbook
medicinersquo lowast Remedy only show good easily-verifiable data
lowast Bargaining- lsquo if I had some help on thisrsquo lsquomy pts are the sickest so of course my numbers are badrsquo lsquoI get all the new out-of-control ptsrsquolowast Remedy good data with good benchmarks- local and regionalnational
similar practices eg CHC vs CHClowast Depression-rsquo boy I really suckrsquo lsquomy system is set up to sabatoge mersquo lsquomy
MAs are no buenorsquolowast Remedy give tools and workflow changes that make doing the right thing
easy get help at appropriate license level donrsquot penalize right away for poor performance
lowast Acceptance-rsquo ok how do we make it betterrsquo lsquoMAs letrsquos be the top by the end of the monthrsquolowast Remedy- more of the above continued emphasis emphasize saving lives
and preventing morbidity (and cost in some systems)
Data
lowast Data overload-lowast providers burn out trying to be 1 in everything drive their
team crazy start focusing on the numbers over actual clinical quality start pt dumpingcherry picking
lowast Remedy only emphasize a few things at a time reward for one or two priority areas reward whole team
lowast Apathylowast too much data people revert back to concentrating on
individual pt carelowast Feel futility at times- moving the result takes effort and timelowast Remedy give the populationprevention tasks to others (RNs
+ data analysts midlevels dedicated to specific roles advanced MAs in conjunction with their team under protocols health coaches etc)
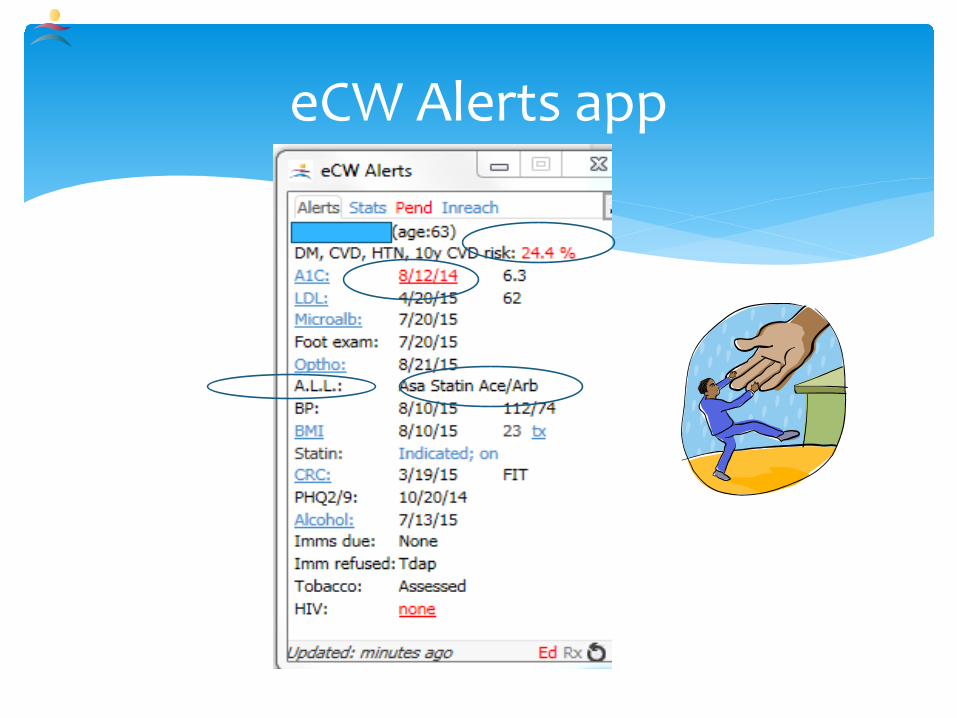
A1cLDLMAbcreatFoot examRetina screenALL medsASABP controlStatinCRC screenBreast Ca screenCervical Ca screenDepression screenAlcohol screenImmunizations due todaydeclinedTobacco usecounselling dueHIV done everVisit summary printed (MU)eRx sent (MU measure)
eCW Alerts app
lowast Donrsquot wait for the patient to show up- identify the needs and go get them
lowast New skillslowast Datadata analysislowast Prioritization of a lot of needlowast Proactive pt activationeducation for preventive care
lowast How financedlowast LIHP funding for population management and PCMHlowast Health Plan very little fundinglowast CHC payment model a handicap
lowast Best example CRC screenlowast Key finding team responsibility for screening and
monitoring (not JUST the MD)
Population Management
Organization Wide Trend
0
10
20
30
40
50
60
70
1 12 23 34 45 56 67 78 89 100 111
122
133
144
155
166
177
188
199
210
221
232
243
254
265
276
287
298
309
320
331
342
353
364
375
CRC screened
CRC screened
56 82015
lowast Partners KP C4 PASD LabCorp lowast Minimum funding from C4lowast LabCorp donated FIT tests
lowast Pt identified needing CRC screen lowast during visit via eCW alerts applowast proactively using registry
lowast FIT test givenlowast Tests tracked by Panel Managers
lowast Pt contacted if kit not returned in 2 wkslowast Results tracked monthly
lowast Reported to sites med staff QM BOD periodicallylowast Positive tests free colonoscopy by Kaiser via Project Access San Diegolowast Positive Biopsies
lowast Kaiser-donated surgery imaging specialty consultRx planlowast PASD arranges for donated oncology eval XRT if needed ChemoRx if
needed
Colorectal Cancer Screening Project
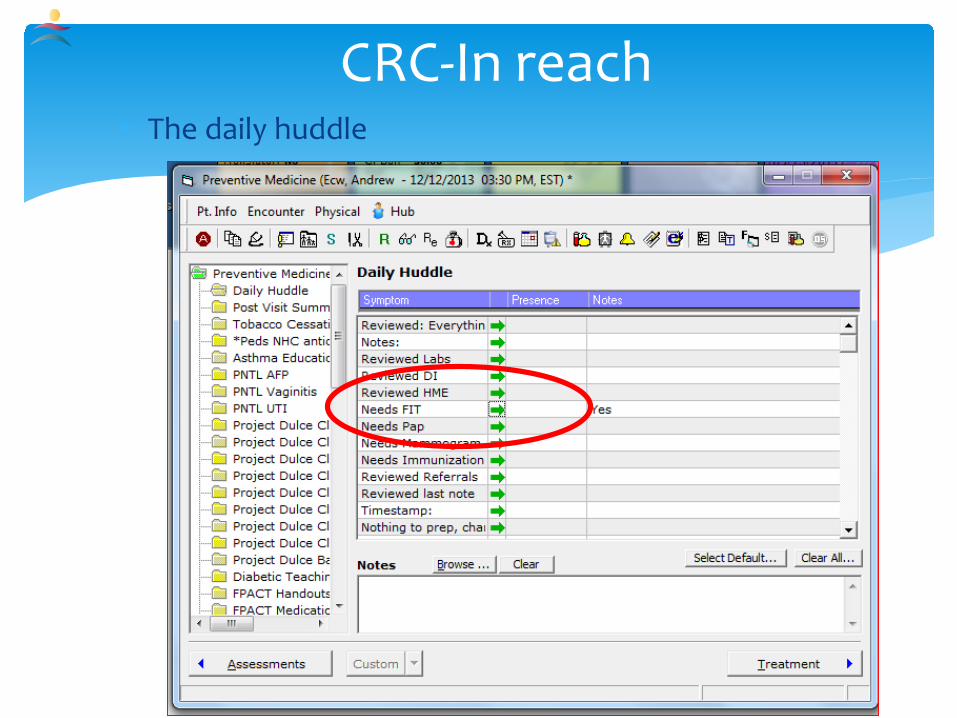
CRC-In reachlowast The daily huddle
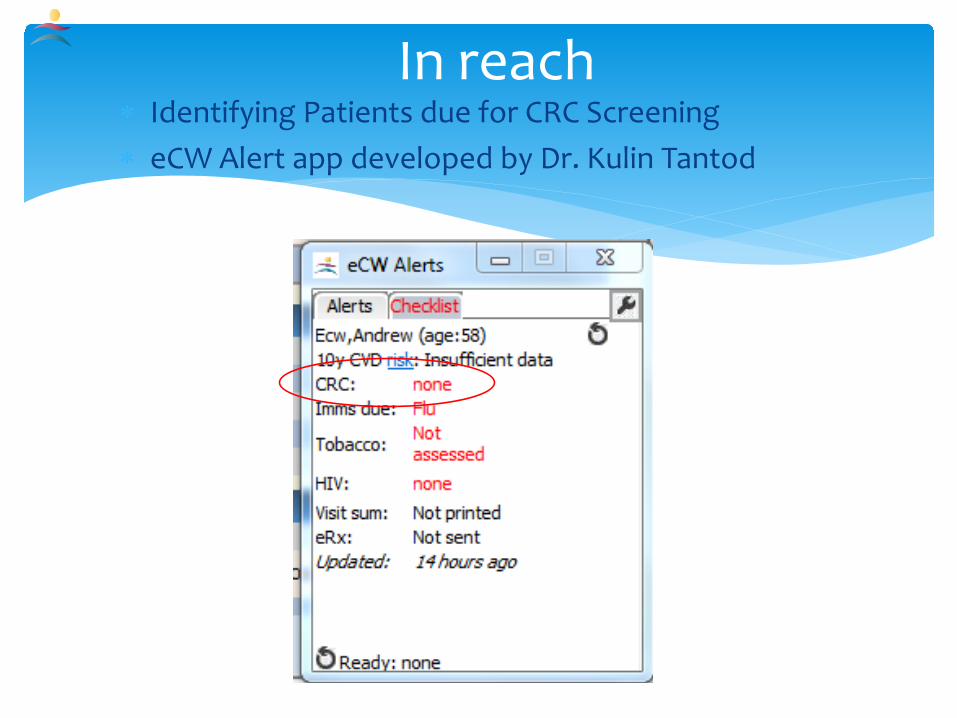
In reachlowast Identifying Patients due for CRC Screening lowast eCW Alert app developed by Dr Kulin Tantod
Outreachlowast Identifying Patients due for CRC Screening lowast Data registry developed by Dr Kulin Tantod
Hypertension and Diabetes efforts at NHC
Neighborhood Healthcare ALLHeart Project
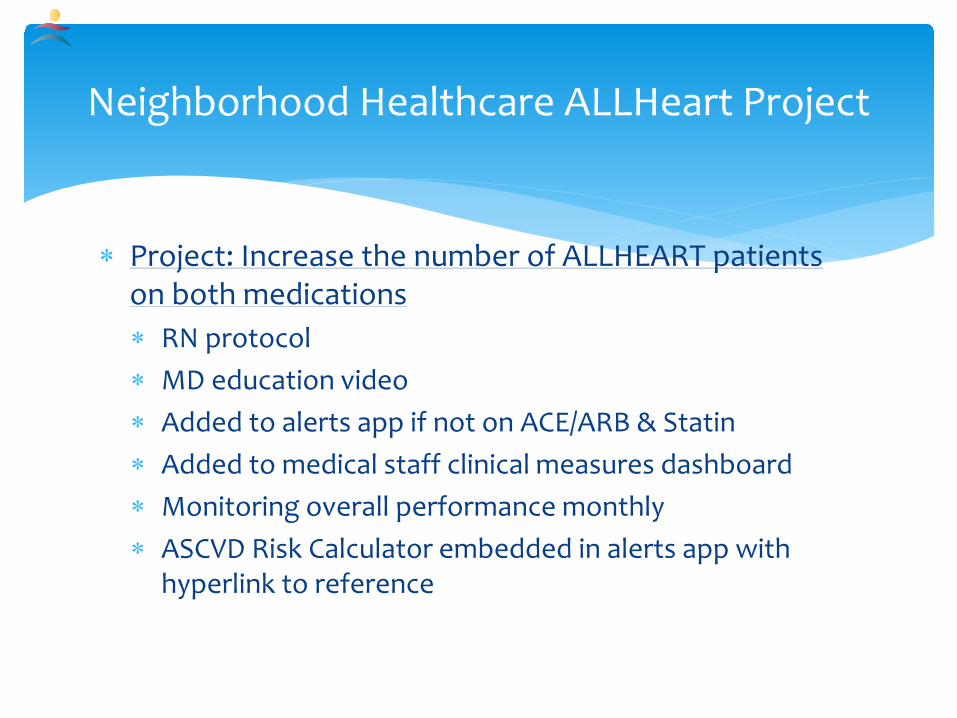
lowast Project Increase the number of ALLHEART patients on both medications lowast RN protocollowast MD education videolowast Added to alerts app if not on ACEARB amp Statinlowast Added to medical staff clinical measures dashboardlowast Monitoring overall performance monthlylowast ASCVD Risk Calculator embedded in alerts app with
hyperlink to reference
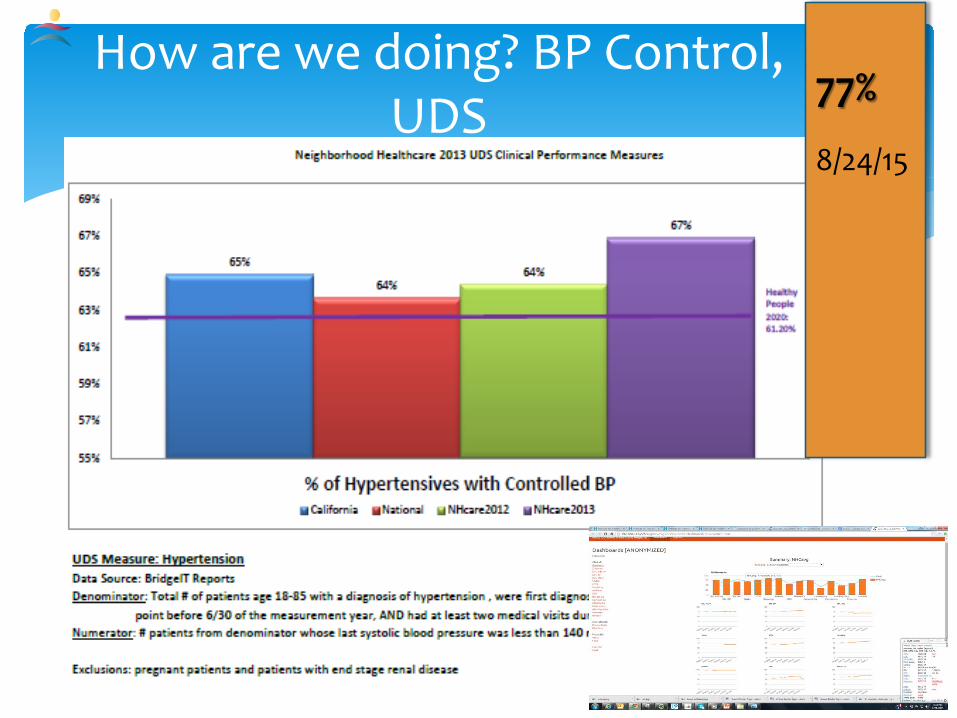
How are we doing BP Control UDS 77
82415
NHCCCC HTN Protocol
October 2013
How are we doing BP ControlDMALL
DM lt14090 83 (33293999)
HTN 77 (66938713)65 on 31614
DM gt50 on ACEARB + Statin75 on 10914 (24583269)70 on 31614
How are we doing BP ControlAs of 31014
How are we doing BP ControlAs of 2515
How are we doing DM BP control
lowast MDs are competitivelowast Data + supportmoving the curve
Getting Quality Data to the Medical Staff
NHC Physician- level Interactive Real Time Quality Detail- panel level detail
Individual real timeDetailed
Trending
Peer-normative
Actionable
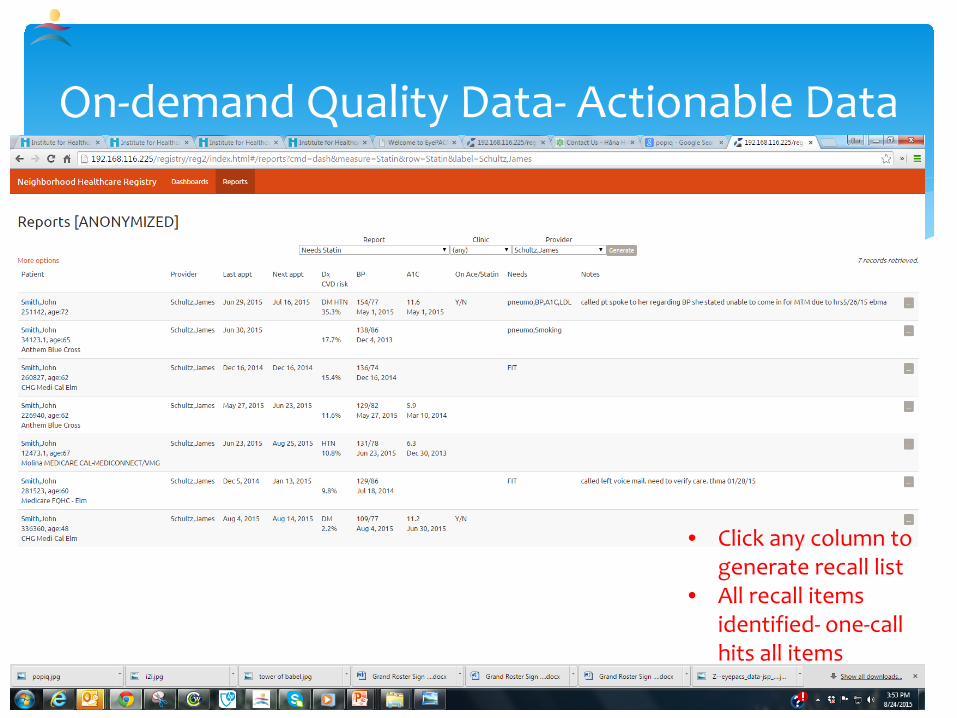
On-demand Quality Data- Actionable Data
bull Click any column to generate recall list
bull All recall items identified- one-call hits all items
Outreachlowast Identifying Patients due for CRC Screening lowast Data registry developed by Dr Kulin Tantod
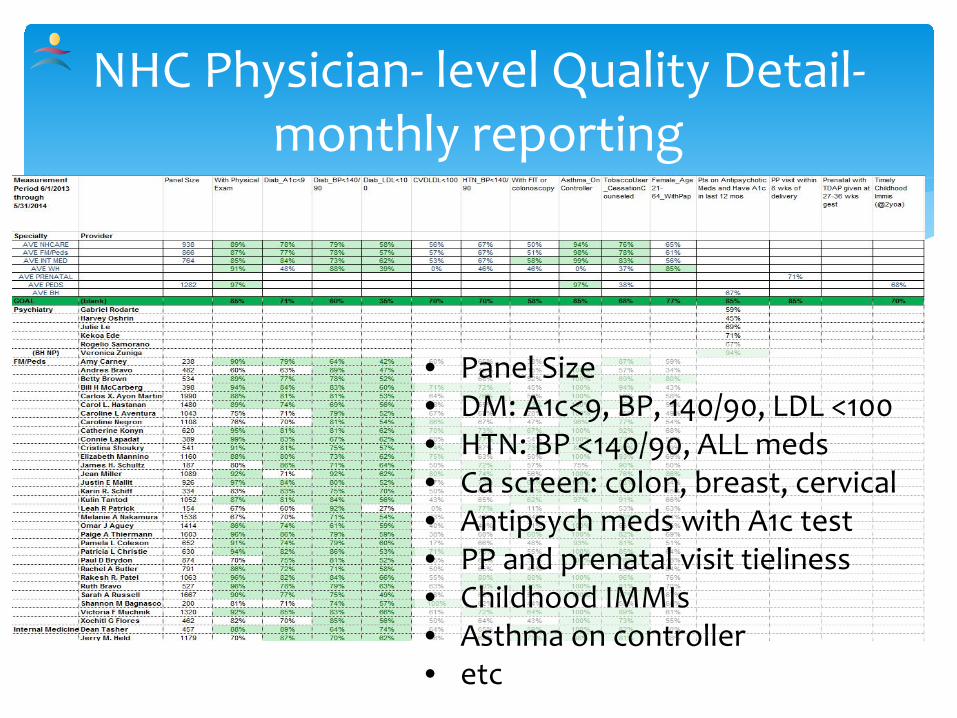
bull Panel Sizebull DM A1clt9 BP 14090 LDL lt100 bull HTN BP lt14090 ALL medsbull Ca screen colon breast cervicalbull Antipsych meds with A1c testbull PP and prenatal visit tielinessbull Childhood IMMIsbull Asthma on controllerbull etc
lowast Chronic disease management can be done in an underserved population requirementslowast Committed leadershiplowast Dedicated staff with a unifying purposelowast Validated and trusted data delivered when it is neededlowast Data analytics capabilitylowast Prioritization processlowast Leveraging community resourceslowast Engaged patientslowast Payment model to support activities outside typical
face-to-face visit
Summary
Key Concept- Data
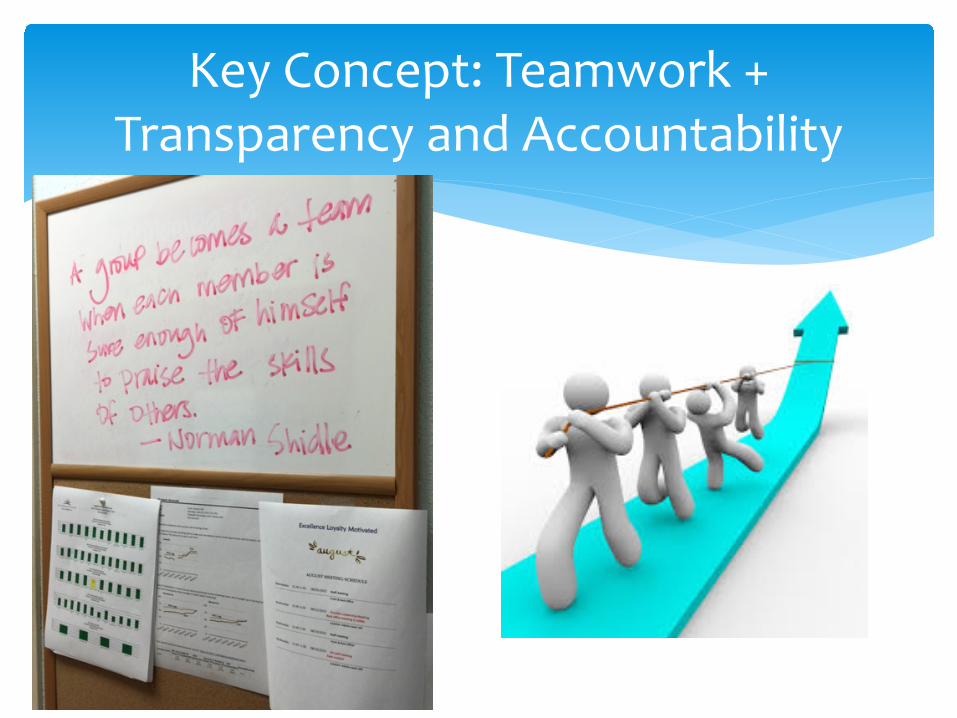
Key Concept Teamwork + Transparency and Accountability
Key Concept- Innovation
Primary Care retinal photography
George Hayes CRR - Scripps Whittier Institute
Key Concept- Boldness
Key Concept- Team
Erika Bazan MA- Care Coordinator
Maria Acosta MA
Erica Cruz MA
Key Concept- Happy People
Chronic Disease Management in Underserved Populations- Mission Impossible
Audience Response
Evidence-based response
Slide Number 4
Chronic Disease Management in Underserved
Audience Response
Audience Response
Audience Response
Audience Response
Audience Response
Community Health Centers in San Diego County- the lsquoSafety Netrsquo
Local SD Payer Environment
Slide Number 13
CCC sites
Quality Work in CHCs
How does Quality happen in a CHC
Recent Council of Community Clinics Advances
Council of Community Clinics Tools
Council of Community Clinics
Slide Number 20
ALL HEART Clinics by County
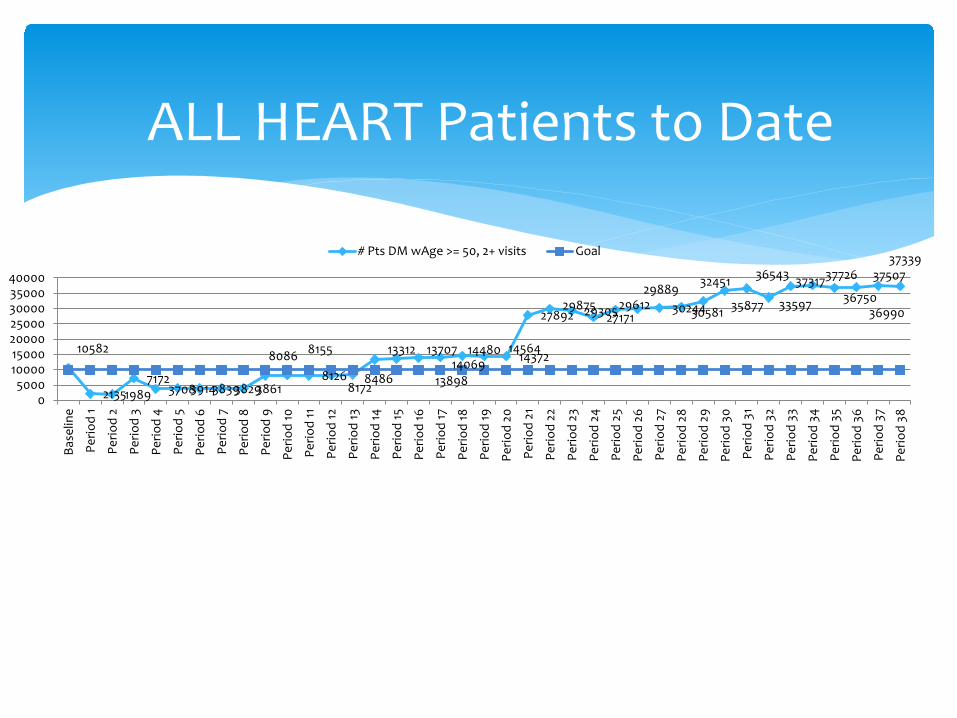
ALL HEART Patients to Date
Slide Number 23
ALLHeart Results- QI Project CHCs
Slide Number 25
Slide Number 26
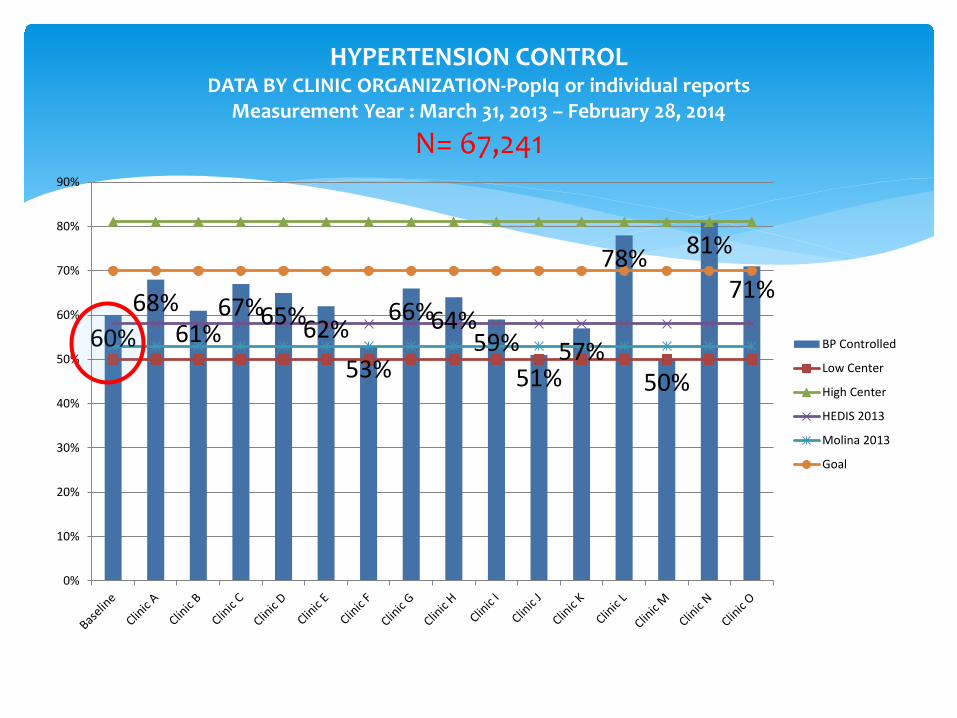
HYPERTENSION CONTROL DATA BY CLINIC ORGANIZATION-PopIq or individual reportsMeasurement Year March 31 2013 ndash February 28 2014N= 67241
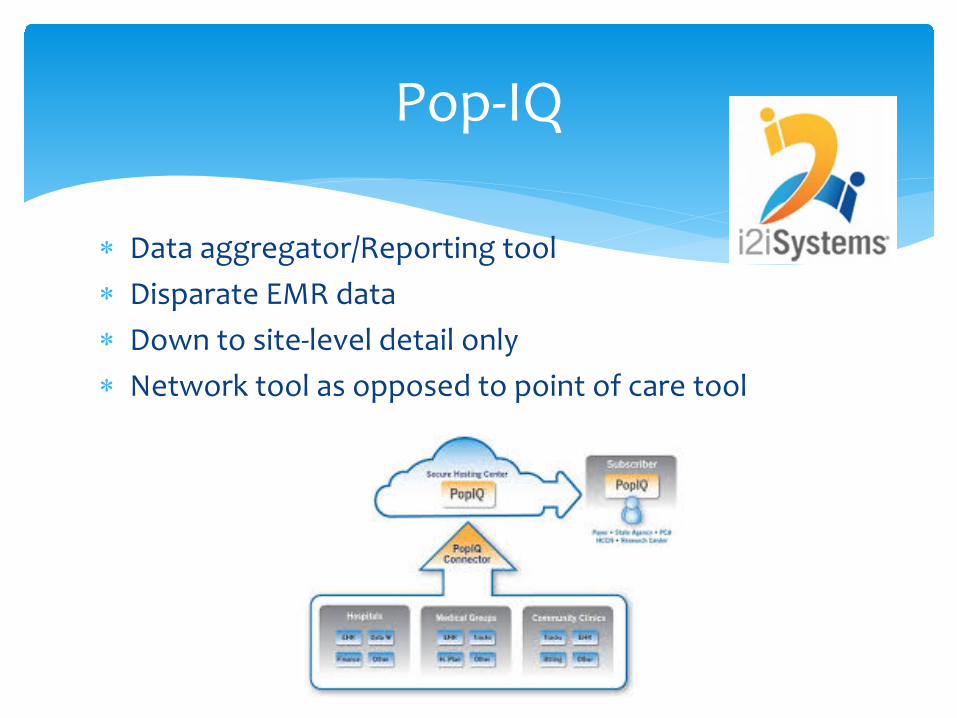
Pop-IQ
PopIQ Data Analytics amp Data Aggregation
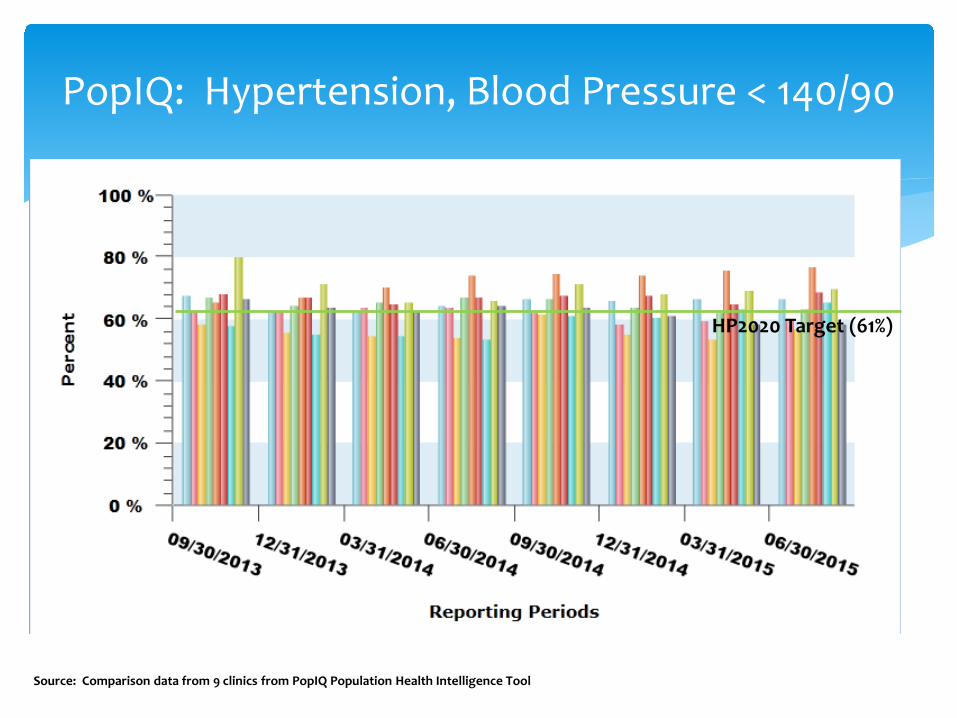
PopIQ Hypertension Blood Pressure lt 14090
PopIQ Blood Pressure lt 14090Diabetes
PopIQ DM Blood Pressure lt 14090
PopIQ Diabetics with HbA1c TestingHbA1c lt 7
Slide Number 34
What measures will be collecting for 2015-2016
Some measures will be stratified by age gender zip code in 2015-2016
Estimated 2014 Blood Pressure Control Rates by Quarter amp Group
Estimated 2014 Blood Pressure Control Rates by Quarter amp Insurance Type
Estimated 2014 Patients with Newly Controlled Blood Pressure by Quarter amp Insurance
Estimated 2014 Pts w Blood Pressure Control
Slide Number 41
Neighborhood Healthcare
Slide Number 43
NHC- Providing Quality Health Care Since 1969
Slide Number 45
Slide Number 46
Slide Number 47
Slide Number 48
Slide Number 49
Slide Number 50
CDM in Underserved- PCMH
How to get better population quality
How to get better population quality
NHC QM Efforts- Workflow changes
Workflow changes Pt flow redesign
Workflow changes Individual Reports- Huddles
How to get better population quality- Support Staff
How to get better population quality- Innovation
Innovation Project Dulce
Project Dulce Cost-Effectiveness
Slide Number 61
Innovation
How to get better population quality DATA
NHC Data Journey EMR
Data
Data- Grief Stages 6 and 7
Point-of-Service Data
Point-of-Service DataPre-visit PlanningProactive
eCW Alerts app
Population Management
Organization Wide Trend
Colorectal Cancer Screening Project
CRC-In reach
In reach
Outreach
Hypertension and Diabetes efforts at NHC
Neighborhood Healthcare ALLHeart Project
How are we doing BP Control UDS
NHCCCC HTN ProtocolOctober 2013
How are we doing BP ControlDMALL
How are we doing BP Control
How are we doing BP Control
How are we doing DM BP control
Getting Quality Data to the Medical Staff
NHC Physician- level Interactive Real Time Quality Detail- panel level detail
Key Concept Teamwork + Transparency and Accountability
Key Concept- Innovation
Key Concept- Boldness
Key Concept- Team
Key Concept- Happy People
Slide Number 97
Group
Name
HTN Control Q1 14
HTN Control Q2 14
HTN Control Q3 14
HTN Control Q4 14
Percent Change
Additional HTN Controlled
HTN 2013 Denominator
Group A
Arch
500
520
560
610
110
2640
24000
Group B
Sharp- RS
758
760
770
780
22
374
17063
Group C
Scripps Coastal
602
620
640
670
68
836
12291
Group D
Scripps Clinic
668
670
690
720
52
869
16704
Group E
UCSD
630
640
660
670
40
160
4000
Group F
Kaiser
841
841
850
860
19
1758
92525
Group G
Community Clinics
600
620
640
660
60
3349
55814
Group H
Multicultural
490
520
540
570
80
240
3000
Name
HTN Control Q1 14
HTN Control Q2 14
HTN Control Q3 14
HTN Control Q4 14
Added HTN Contr 2
Added HTN Contr 5
Additional HTN Controlled
HTN 2013 Denominator
Arch
12000
12480
13440
14640
480
1200
2640
24000
Sharp- RS
12935
12968
13139
13309
341
853
374
17063
Scripps Coastal
7399
7620
7866
8235
246
615
836
12291
Scripps Clinic
11158
11192
11526
12027
334
835
869
16704
UCSD
2520
2560
2640
2680
80
200
160
4000
Kaiser
77814
77814
78646
79572
1851
4626
1758
92525
Group Average across all Hypertensive Patients
Group Average across all Hypertensive Patients by Insurance Type
Community Clinics
33488
34605
35721
36837
1116
2791
3349
55814
Multicultural
1470
1560
1620
1710
60
150
240
3000
Total Numerators
158785
160798
164598
169010
225397
Avg Control Rate
704
713
730
750
HTN Control
Group Average
Medicaid
Commercial
Medicare
Q1
704
Q1
600
704
680
Q2
713
Q2
620
713
685
Q3
730
Q3
640
730
700
Q4
750
Q4
650
750
710
HTN Control
Group A
Group B
Group C
Group D
Group E
Group F
Group G
Group H
Q1
500
758
602
668
630
841
600
490
Q2
520
760
620
670
640
841
620
520
Q3
560
770
640
690
660
850
640
540
Q4
610
780
670
720
670
860
660
570
Q1
Q2
Q3
Q4
Q1
Q2
Q3
Q4
Q1
Q2
Q3
Q4
Q1
Q2
Q3
Q4
Group A
500
520
560
610
Group A
12000
12480
13440
14640
Group A
0
480
1440
2640
Medicaid
0
604
1744
3067
Group B
758
760
770
780
Group B
12935
12968
13139
13309
Group B
0
33
203
374
Commercial
0
1007
2906
5112
Group C
602
620
640
670
Group C
7399
7620
7866
8235
Group C
0
221
467
836
Medicare
0
403
1163
2045
Group D
668
670
690
720
Group D
11158
11192
11526
12027
Group D
0
33
367
869
0
2013
5813
10225
Group E
630
640
660
670
Group E
2520
2560
2640
2680
Group E
0
40
120
160
Group F
841
841
850
860
Group F
77814
77814
78646
79572
Group F
0
0
833
1758
Group G
600
620
640
660
Group G
33488
34605
35721
36837
Group G
0
1116
2233
3349
Group H
490
520
540
570
Group H
1470
1560
1620
1710
Group H
0
90
150
240
0
2013
5813
10225
Data for April 7 2014 Meeting
HTN Control
Group
Name
HTN Control 2013
HTN Compliant 2013
HTN Non-Compliant 2013
HTN 2013 Denominator
Group A
Arch
540
12960
11040
24000
Overall
Group A
Group B
Group C
Group D
Group E
Group F
Group G
Group H
Group B
Sharp- RS
758
12935
4128
17063
MC only
Controlled
155517
12960
12935
7399
11158
77814
33251
Group C
Scripps Coastal
602
7399
4892
12291
Uncontrolled
62880
11040
4128
4892
5546
14711
22563
Group D
Scripps Clinic
668
11158
5546
16704
Group E
UCSD
Group F
Kaiser
841
77814
14711
92525
Group G
Community Clinics
600
33251
22563
55814
Group H
Multicultural
712
155517
62880
218397
DM lt120-90
Group
Name
HTN Control 2013
HTN Compliant 2013
HTN Non-Compliant 2013
HTN 2013 Denominator
comment
Group A
Arch
650
1412
766
2178
Overall
Group A
Group B
Group C
Group D
Group E
Group F
Group G
Group H
Group B
Sharp- RS
8135
5806
1331
7137
MY2012
Controlled
49461
1412
5806
3707
4974
310856
33251
Group C
Scripps Coastal
724
3707
1413
5120
Uncontrolled
27794
766
1331
1413
1605
116
22563
Group D
Scripps Clinic
756
4974
1605
6579
Group E
UCSD
728
311
116
427
commercial HMO only
Group F
Kaiser
Group G
Community Clinics
600
33251
22563
55814
Group H
Multicultural
640
49461
27794
77255
HTN
sharp RS Mediccer FFS
720
2925
1138
4063
2013MY
all MC
MC Advantage
770
10010
2990
13000
2012MY
all MC
Medcare overall
758
12935
4128
17063
DM BP 140-90
MC FFS
770
684
204
888
888
Commer
822
3369
729
4098
40
Group
Name
HTN Control Q1 14
HTN Control Q2 14
HTN Control Q3 14
HTN Control Q4 14
Percent Change
Additional HTN Controlled
HTN 2013 Denominator
Group A
Arch
500
520
560
610
110
2640
24000
Group B
Sharp- RS
758
760
770
780
22
374
17063
Group C
Scripps Coastal
602
620
640
670
68
836
12291
Group D
Scripps Clinic
668
670
690
720
52
869
16704
Group E
UCSD
630
640
660
670
40
160
4000
Group F
Kaiser
841
841
850
860
19
1758
92525
Group G
Community Clinics
600
620
640
660
60
3349
55814
Group H
Multicultural
490
520
540
570
80
240
3000
Name
HTN Control Q1 14
HTN Control Q2 14
HTN Control Q3 14
HTN Control Q4 14
Added HTN Contr 2
Added HTN Contr 5
Additional HTN Controlled
HTN 2013 Denominator
Arch
12000
12480
13440
14640
480
1200
2640
24000
Sharp- RS
12935
12968
13139
13309
341
853
374
17063
Scripps Coastal
7399
7620
7866
8235
246
615
836
12291
Scripps Clinic
11158
11192
11526
12027
334
835
869
16704
UCSD
2520
2560
2640
2680
80
200
160
4000
Kaiser
77814
77814
78646
79572
1851
4626
1758
92525
Group Average across all Hypertensive Patients
Group Average across all Hypertensive Patients by Insurance Type
Community Clinics
33488
34605
35721
36837
1116
2791
3349
55814
Multicultural
1470
1560
1620
1710
60
150
240
3000
Total Numerators
158785
160798
164598
169010
225397
Avg Control Rate
704
713
730
750
HTN Control
Group Average
Medicaid
Commercial
Medicare
Q1
704
Q1
600
704
680
Q2
713
Q2
620
713
685
Q3
730
Q3
640
730
700
Q4
750
Q4
650
750
710
HTN Control
Group A
Group B
Group C
Group D
Group E
Group F
Group G
Group H
Q1
500
758
602
668
630
841
600
490
Q2
520
760
620
670
640
841
620
520
Q3
560
770
640
690
660
850
640
540
Q4
610
780
670
720
670
860
660
570
Q1
Q2
Q3
Q4
Q1
Q2
Q3
Q4
Q1
Q2
Q3
Q4
Q1
Q2
Q3
Q4
Group A
500
520
560
610
Group A
12000
12480
13440
14640
Group A
0
480
1440
2640
Medicaid
0
604
1744
3067
Group B
758
760
770
780
Group B
12935
12968
13139
13309
Group B
0
33
203
374
Commercial
0
1007
2906
5112
Group C
602
620
640
670
Group C
7399
7620
7866
8235
Group C
0
221
467
836
Medicare
0
403
1163
2045
Group D
668
670
690
720
Group D
11158
11192
11526
12027
Group D
0
33
367
869
0
2013
5813
10225
Group E
630
640
660
670
Group E
2520
2560
2640
2680
Group E
0
40
120
160
Group F
841
841
850
860
Group F
77814
77814
78646
79572
Group F
0
0
833
1758
Group G
600
620
640
660
Group G
33488
34605
35721
36837
Group G
0
1116
2233
3349
Group H
490
520
540
570
Group H
1470
1560
1620
1710
Group H
0
90
150
240
0
2013
5813
10225
Data for April 7 2014 Meeting
HTN Control
Group
Name
HTN Control 2013
HTN Compliant 2013
HTN Non-Compliant 2013
HTN 2013 Denominator
Group A
Arch
540
12960
11040
24000
Overall
Group A
Group B
Group C
Group D
Group E
Group F
Group G
Group H
Group B
Sharp- RS
758
12935
4128
17063
MC only
Controlled
155517
12960
12935
7399
11158
77814
33251
Group C
Scripps Coastal
602
7399
4892
12291
Uncontrolled
62880
11040
4128
4892
5546
14711
22563
Group D
Scripps Clinic
668
11158
5546
16704
Group E
UCSD
Group F
Kaiser
841
77814
14711
92525
Group G
Community Clinics
600
33251
22563
55814
Group H
Multicultural
712
155517
62880
218397
DM lt120-90
Group
Name
HTN Control 2013
HTN Compliant 2013
HTN Non-Compliant 2013
HTN 2013 Denominator
comment
Group A
Arch
650
1412
766
2178
Overall
Group A
Group B
Group C
Group D
Group E
Group F
Group G
Group H
Group B
Sharp- RS
8135
5806
1331
7137
MY2012
Controlled
49461
1412
5806
3707
4974
310856
33251
Group C
Scripps Coastal
724
3707
1413
5120
Uncontrolled
27794
766
1331
1413
1605
116
22563
Group D
Scripps Clinic
756
4974
1605
6579
Group E
UCSD
728
311
116
427
commercial HMO only
Group F
Kaiser
Group G
Community Clinics
600
33251
22563
55814
Group H
Multicultural
640
49461
27794
77255
HTN
sharp RS Mediccer FFS
720
2925
1138
4063
2013MY
all MC
MC Advantage
770
10010
2990
13000
2012MY
all MC
Medcare overall
758
12935
4128
17063
DM BP 140-90
MC FFS
770
684
204
888
888
Commer
822
3369
729
4098
40
lowast Chose Onelowast A- UCLAlowast B-USClowast C- Other
Audience Response
Evidence-based response
lowast Goalslowast To describe Community Health Centers in San Diego County
lowast To outline challenges to population health improvement and chronic disease management in CHCs
lowast To describe progress in CDM and PopHealth in SD County
lowast To outline the tools used by one CHC to improve CDM and PopHealth
Chronic Disease Management in Underserved
lowast Which EMR do you use for outpatient carelowast 1 EPIClowast 2 CernerClaritylowast 3 NextGenlowast 4 Allscriptslowast 5 Vista or Vista open source variationlowast 6 eClinicalWorkslowast 7 Other
Audience Response
lowast Does your EMR have a usable registry function built inlowast 1 Yeslowast 2 Nolowast 3 Unsure
Audience Response
lowast Do you provide real time population or panel clinical quality data to your medical stafflowast 1 Yes multiple measureslowast 2 Yes one or two measureslowast 3 Nolowast 4 What are you smoking
Audience Response
lowast What percentage of the physician compensation is based on clinical quality metricslowast 1 more than 50lowast 2 25-50lowast 3 10-25lowast 4 lt 10lowast 5 0
Audience Response
lowast Is providing real time actionable clinical data to your medical staff at the point of care a priority in your organizationlowast 1 Yes and it is happeninglowast 2 Yes but unable to do it yetlowast 3 Yes but searching for fundingROIlowast 4 Nolowast 5 What is that
Audience Response
lowast 17 not-for-profit private 501c3 organizations plus IHS lowast gt120 siteslowast gt900000 patients served annually lowast gt2000000 encounters annuallylowast gt650 Medical Stafflowast No county hospital in SDlowast No county (primary or specialty) clinics in SDlowast Geographic managed care for MediCaid (68 Plans)lowast Border county 180000 undocumented immigrants with
no health insurance possibilities
Community Health Centers inSan Diego County- the lsquoSafety Netrsquo
lowast PCP cap (in theory) for 80 of patientslowast PPS rate bottom lineper visit payment modellowast Lack of P4P (04 of budget at NHC)lowast Lack of QM incentivelowast Reducing hospitalizationER saves money elsewherelowast Little knowledge of HEDIS among clinics or providerslowast Data exchange for labencounter data an issue
lowast Labcorp encounter data to health plan ~0lowast UDS reportinglowast lsquoMessenger Modelrsquo HMO contracting 1 contract 1 clinic
Local SD Payer Environment
CCC sites
Quality Work in CHCs
lowast Dedicated mission-driven medical stafflowast Dedicated mission-driven frontline and
back office staff- TEAMlowast Finding innovative ways to get things done
(that donrsquot cost a lot)lowast Get a little help from your friends- Using
other resources to fill the gapslowast Share selflessly steal shamelessly
(lsquoidentify best practicesrsquo)lowast Do the right thing AND doing things right
lowast Pop-iq Org-level metricslowast QM Departmemt (Lynn Farrell Nicole Howard
Eleanor Alcones Henry Tuttle)lowast Grant writerlowast CCHN TSOlowast EMR hostinglowast Data supportlowast SDHCBeacon interface (HIE)
Council of Community Clinics Tools
Council of Community Clinicslowast ALLHeart as an example of consortium-level Quality
Improvement effortlowast DM age 50+lowast Tracking
lowast ALL use (med bundle) lowast Rx not dispensing data
lowast Clinical measureslowast BP A1C test and results Tobacco usecounselling Self
Management LDL test and results etclowast No CV event data
lowast Provider and staff educationlowast Targeted interventions in select clinics of their own designlowast Kaiser Community Benefit fundedlowast Followed ALL effort
ALL HEART Clinics by CountyImperial County
Clinicas de Salud del Pueblo
Los Angeles County
Northeast Valley Health Corporation
Eisner Pediatric amp Family Medical Center
Central City Community Health Center (Sites also in Orange County amp Riverside)
Group AverageQ1Q2Q3Q4070399999999999996071299999999999997073075MedicaidQ1Q2Q3Q406062064065CommercialQ1Q2Q3Q4070399999999999996071299999999999997073075MedicareQ1Q2Q3Q406806850000000000000507071MedicaidQ1Q2Q3Q4060403379999999971743894300000000630674973000000027CommercialQ1Q2Q3Q40100672299999999952906490500000001251124955000000045MedicareQ1Q2Q3Q4040268919999999981162596200000000620449982000000018
Estimated 2014 Blood Pressure Control Rates by Quarter amp Insurance
Type
38
Slide courtesy Allen Fremont MD Rand Corp
Estimated 2014 Patients with Newly Controlled Blood Pressure by
Group AverageQ1Q2Q3Q4070399999999999996071299999999999997073075MedicaidQ1Q2Q3Q406062064065CommercialQ1Q2Q3Q4070399999999999996071299999999999997073075MedicareQ1Q2Q3Q406806850000000000000507071MedicaidQ1Q2Q3Q4060403379999999971743894300000000630674973000000027CommercialQ1Q2Q3Q40100672299999999952906490500000001251124955000000045MedicareQ1Q2Q3Q4040268919999999981162596200000000620449982000000018
Estimated 2014 Pts w Blood Pressure Control
40
Slide courtesy Allen Fremont MD Rand Corp
41Slide courtesy Allen Fremont MD Rand Corp
Neighborhood Healthcare2014 stats12 sites2 counties65000 patients245000 visits18000 BH only visits
gt40 medical providers
9 primary care sites all PCMH-accredited except new Menifee(5 with embedded BH 1 rural with outside agency)
lowast Private non-profit corporation licensed by CA DHSlowast Federally Qualified Health Center (lsquoFQHCrsquo lsquo330rsquo clinic)lowast Volunteer Board of Directors consumer representation lowast Discounted sliding fee scale for cash patients ($35)lowast Evening and Saturday hourslowast Employed MDs NPs and PAs dentists psychiatrists
psychologists psych NPs midwives 1 Chiropractorlowast Staff cultural competence reflects patient demographicslowast NCQA PCMH level 23lowast Limited specialty care no inpatient or SNF care
wwwnhcareorg
Neighborhood Healthcare
44
NHC- Providing Quality Health Care Since 1969
lowast Medical dental and behavioral health services to 65000 people annually in 245000 visits
lowast 450+ employees Annual Budget $48 million lowast 100 full and part time clinical staff licensedboard-
certified in family medicine internal medicine pediatrics geriatrics sports medicine psychology psychiatry geropsych general dentistry pediatric dentistry chiropractic and others
wwwnhcareorg
Neighborhood HealthcareFY 2016 Budget -- Revenue by Category
TOTAL REVENUE = $49676159(excludes revenue from capital)
Sliding Scale Patient Payments
15
Donations 07
Medi-Cal651
Medicare66
Private Insurance04
County State and Federal
Grants amp Contracts
163
Contract Rx Program
65
Other Income
24
Medi-Cal = 178Mgd Care Medi-Cal = 473
Medicare = 28Mgd Care Medicare = 38
Private Insurance 02Mgd Care Commercial 01
Mgd Care Covered CA $ 01
Neighborhood HealthcareFY 2016 ndash Patient Care Revenue
Medi-Cal 60377 = 217Mgd Care Medi-Cal 160205 = 576
Public Insurance 12435 = 45Grants amp Contracts 583 = 02
Neighborhood HealthcareExpenses ndash
Patient Care vs Administrative Support
Administrative Costs159
Fundraising 07
Direct Services834
34
58
67
79
69
75
98
53
61
0
20
40
60
80
100
1201 9 17 25 33 41 49 57 65 73 81 89 97 105
113
121
129
137
145
153
161
169
177
185
193
201
209
217
225
233
241
249
257
265
273
281
289
297
305
313
321
329
337
345
353
361
369
377
dm a1c gt9 DM LDL cont cvd ldl cont DM BP cont BP control
smokcess asthma on cont CRC screened mammo pap
Setting the Stage Quality CAN Happen
82115DM with BP lt 14090 83
HTN with BP lt 14090 77
ALL 66-75
DM with A1c gt 9 12
DM with A1c gt 9 or not done 22
Breast Ca screen 71Cervical Ca screen 74
Resources amp Policies
Community
DeliverySystemDesign
DecisionSupport
ClinicalInformation
Systems
Self-Management
Support
Health System
Health Care Organization
InformedActivated
Patient
PreparedProactive
Practice Team
ProductiveInteractions
Improved Outcomes
Chronic Care Model (CCM)
Slide from E Wagner 50
CDM in Underserved- PCMH
lowast Workflow changeslowast Adequate support staff (number quality training)lowast Innovation (NHC=lsquoMikeyrsquo)lowast Ruthless removal of lsquotasks below licensersquolowast Datalowast Crediblelowast Actionablelowast To the right peoplelowast At the right time
management program inception 2000lowast Dulce group medical apptslowast pain mgmt groups asthma groups
lowast Disparities collaborative (depression screen and rx)lowast BH integrationlowast EHR 2010lowast PCMH MUlowast AllHeart ALL (Kaiser grant through CCC)
lowast Roger Coleman and Associateslowast Eliminate unnecessary steps in workflow based on data and
lsquovalue-addedrsquo conceptlowast Patient-centered- bring services to the patient vs assembly-line
model (7-9 stops 4 stops)lowast Rapid cycle improvementPDSA model of rapid changelowast 2 MAs per fte MD or NPPAlowast Huddlespre-visit planninglowast Results
lowast Experimenting with Team= 1 MD 3 mids 7 MA RN Panel Managerlowast Innovationlowast Ruthless removal of lsquotasks below licensersquolowast Data
lowast Crediblelowast Actionablelowast To the right peoplelowast At the right time
How to get better population quality- Support Staff
lowast Workflow changeslowast Adequate support staff (number quality training)
lowast Innovationlowast And leveraging othersrsquo innovations
lowast Ruthless removal of lsquotasks below licensersquolowast Data
lowast Crediblelowast Actionablelowast To the right peoplelowast At the right time
How to get better population quality- Innovation
lowast RN CDE-led chronic disease management programlowast Key features
lowast Stared ~1999 with Dr NickECClowast RN-ledlowast BH availablelowast MDNPPA involvement on med changeslab interpretationexamlowast Self management skillslowast Patient education and activationlowast Care coordination (scheduling labs referrals PCP consultation
foot exams)lowast Proactive office encounter (huddles pre0visit planning)lowast Single stable point of contact (health coach) for the patient
Innovation Project Dulce
Project Dulce Cost-Effectiveness
Cost savings estimates for Dulce Model (~$QALY 2006 $)
Uninsured $10000
County Medical Services $25000
Medicaid $45000
Commercial $70000Health Services Research Health Research and Educational TrustDOI 101111j1475-6773200700701x
Analysis of the impact of group medical visits on clinical outcomes of Project Dulce patients with Diabetes HbA1c Results of August 2006 Enrollees with a group medical visit between 72000 to 62006
00
10
20
30
40
50
60
70
80
90
HbA1c Prior toDulce 11(n=78)
HbA1c Prior to GMV(n=78 plt0001)
HbA1c after 6months
(n=55 plt005)
HbA1c after 12months
(n=55 plt005)
HbA1c after 18months
(n=24 plt005)
HbA1c after 24months
(n=22 plt005)
87
7872 70 70 72
(n=24) (n=22)(n=55)(n=55)(n=78)(n=78)
Project Dulce Group Medical Visits Analysis of change in HbA1c over time
Pre-EMR
Innovation
Primary Care retinal photography
George Hayes CRR - Scripps Whittier Institute
lowast Workflow changeslowast Adequate support staff (number quality training)lowast Innovationlowast Ruthless removal of lsquotasks below licensersquo
lowastDatalowast Crediblelowast Actionablelowast To the right peoplelowast At the right time
How to get better population quality DATA
lowast 2010 implementation of eClinicalWorks (eCW)
lowast Data lag 1 year +lowast Validation period 1 year +lowast Registry functionlowast BridgeITlowast Home-grown registrylowast eCW alerts point-of-service data with low annoyance
quotientlowast i2i
NHC Data Journey EMR
lowast 5 stages of grief (Kubler-Ross)lowast Denial- lsquothe data are wrongrsquo lsquoitrsquos not my patientsrsquo
lowast Remedy only show good easily-verifiable datalowast Anger-rsquo damn you they arenrsquot my ptsrsquo lsquoI donrsquot practice cookbook
medicinersquo lowast Remedy only show good easily-verifiable data
lowast Bargaining- lsquo if I had some help on thisrsquo lsquomy pts are the sickest so of course my numbers are badrsquo lsquoI get all the new out-of-control ptsrsquolowast Remedy good data with good benchmarks- local and regionalnational
similar practices eg CHC vs CHClowast Depression-rsquo boy I really suckrsquo lsquomy system is set up to sabatoge mersquo lsquomy
MAs are no buenorsquolowast Remedy give tools and workflow changes that make doing the right thing
easy get help at appropriate license level donrsquot penalize right away for poor performance
lowast Acceptance-rsquo ok how do we make it betterrsquo lsquoMAs letrsquos be the top by the end of the monthrsquolowast Remedy- more of the above continued emphasis emphasize saving lives
and preventing morbidity (and cost in some systems)
Data
lowast Data overload-lowast providers burn out trying to be 1 in everything drive their
team crazy start focusing on the numbers over actual clinical quality start pt dumpingcherry picking
lowast Remedy only emphasize a few things at a time reward for one or two priority areas reward whole team
lowast Apathylowast too much data people revert back to concentrating on
individual pt carelowast Feel futility at times- moving the result takes effort and timelowast Remedy give the populationprevention tasks to others (RNs
+ data analysts midlevels dedicated to specific roles advanced MAs in conjunction with their team under protocols health coaches etc)
A1cLDLMAbcreatFoot examRetina screenALL medsASABP controlStatinCRC screenBreast Ca screenCervical Ca screenDepression screenAlcohol screenImmunizations due todaydeclinedTobacco usecounselling dueHIV done everVisit summary printed (MU)eRx sent (MU measure)
eCW Alerts app
lowast Donrsquot wait for the patient to show up- identify the needs and go get them
lowast New skillslowast Datadata analysislowast Prioritization of a lot of needlowast Proactive pt activationeducation for preventive care
lowast How financedlowast LIHP funding for population management and PCMHlowast Health Plan very little fundinglowast CHC payment model a handicap
lowast Best example CRC screenlowast Key finding team responsibility for screening and
monitoring (not JUST the MD)
Population Management
Organization Wide Trend
0
10
20
30
40
50
60
70
1 12 23 34 45 56 67 78 89 100 111
122
133
144
155
166
177
188
199
210
221
232
243
254
265
276
287
298
309
320
331
342
353
364
375
CRC screened
CRC screened
56 82015
lowast Partners KP C4 PASD LabCorp lowast Minimum funding from C4lowast LabCorp donated FIT tests
lowast Pt identified needing CRC screen lowast during visit via eCW alerts applowast proactively using registry
lowast FIT test givenlowast Tests tracked by Panel Managers
lowast Pt contacted if kit not returned in 2 wkslowast Results tracked monthly
lowast Reported to sites med staff QM BOD periodicallylowast Positive tests free colonoscopy by Kaiser via Project Access San Diegolowast Positive Biopsies
lowast Kaiser-donated surgery imaging specialty consultRx planlowast PASD arranges for donated oncology eval XRT if needed ChemoRx if
needed
Colorectal Cancer Screening Project
CRC-In reachlowast The daily huddle
In reachlowast Identifying Patients due for CRC Screening lowast eCW Alert app developed by Dr Kulin Tantod
Outreachlowast Identifying Patients due for CRC Screening lowast Data registry developed by Dr Kulin Tantod
Hypertension and Diabetes efforts at NHC
Neighborhood Healthcare ALLHeart Project
lowast Project Increase the number of ALLHEART patients on both medications lowast RN protocollowast MD education videolowast Added to alerts app if not on ACEARB amp Statinlowast Added to medical staff clinical measures dashboardlowast Monitoring overall performance monthlylowast ASCVD Risk Calculator embedded in alerts app with
hyperlink to reference
How are we doing BP Control UDS 77
82415
NHCCCC HTN Protocol
October 2013
How are we doing BP ControlDMALL
DM lt14090 83 (33293999)
HTN 77 (66938713)65 on 31614
DM gt50 on ACEARB + Statin75 on 10914 (24583269)70 on 31614
How are we doing BP ControlAs of 31014
How are we doing BP ControlAs of 2515
How are we doing DM BP control
lowast MDs are competitivelowast Data + supportmoving the curve
Getting Quality Data to the Medical Staff
NHC Physician- level Interactive Real Time Quality Detail- panel level detail
Individual real timeDetailed
Trending
Peer-normative
Actionable
On-demand Quality Data- Actionable Data
bull Click any column to generate recall list
bull All recall items identified- one-call hits all items
Outreachlowast Identifying Patients due for CRC Screening lowast Data registry developed by Dr Kulin Tantod
bull Panel Sizebull DM A1clt9 BP 14090 LDL lt100 bull HTN BP lt14090 ALL medsbull Ca screen colon breast cervicalbull Antipsych meds with A1c testbull PP and prenatal visit tielinessbull Childhood IMMIsbull Asthma on controllerbull etc
lowast Chronic disease management can be done in an underserved population requirementslowast Committed leadershiplowast Dedicated staff with a unifying purposelowast Validated and trusted data delivered when it is neededlowast Data analytics capabilitylowast Prioritization processlowast Leveraging community resourceslowast Engaged patientslowast Payment model to support activities outside typical
face-to-face visit
Summary
Key Concept- Data
Key Concept Teamwork + Transparency and Accountability
Key Concept- Innovation
Primary Care retinal photography
George Hayes CRR - Scripps Whittier Institute
Key Concept- Boldness
Key Concept- Team
Erika Bazan MA- Care Coordinator
Maria Acosta MA
Erica Cruz MA
Key Concept- Happy People
Chronic Disease Management in Underserved Populations- Mission Impossible
Audience Response
Evidence-based response
Slide Number 4
Chronic Disease Management in Underserved
Audience Response
Audience Response
Audience Response
Audience Response
Audience Response
Community Health Centers in San Diego County- the lsquoSafety Netrsquo
Local SD Payer Environment
Slide Number 13
CCC sites
Quality Work in CHCs
How does Quality happen in a CHC
Recent Council of Community Clinics Advances
Council of Community Clinics Tools
Council of Community Clinics
Slide Number 20
ALL HEART Clinics by County
ALL HEART Patients to Date
Slide Number 23
ALLHeart Results- QI Project CHCs
Slide Number 25
Slide Number 26
HYPERTENSION CONTROL DATA BY CLINIC ORGANIZATION-PopIq or individual reportsMeasurement Year March 31 2013 ndash February 28 2014N= 67241
Pop-IQ
PopIQ Data Analytics amp Data Aggregation
PopIQ Hypertension Blood Pressure lt 14090
PopIQ Blood Pressure lt 14090Diabetes
PopIQ DM Blood Pressure lt 14090
PopIQ Diabetics with HbA1c TestingHbA1c lt 7
Slide Number 34
What measures will be collecting for 2015-2016
Some measures will be stratified by age gender zip code in 2015-2016
Estimated 2014 Blood Pressure Control Rates by Quarter amp Group
Estimated 2014 Blood Pressure Control Rates by Quarter amp Insurance Type
Estimated 2014 Patients with Newly Controlled Blood Pressure by Quarter amp Insurance
Estimated 2014 Pts w Blood Pressure Control
Slide Number 41
Neighborhood Healthcare
Slide Number 43
NHC- Providing Quality Health Care Since 1969
Slide Number 45
Slide Number 46
Slide Number 47
Slide Number 48
Slide Number 49
Slide Number 50
CDM in Underserved- PCMH
How to get better population quality
How to get better population quality
NHC QM Efforts- Workflow changes
Workflow changes Pt flow redesign
Workflow changes Individual Reports- Huddles
How to get better population quality- Support Staff
How to get better population quality- Innovation
Innovation Project Dulce
Project Dulce Cost-Effectiveness
Slide Number 61
Innovation
How to get better population quality DATA
NHC Data Journey EMR
Data
Data- Grief Stages 6 and 7
Point-of-Service Data
Point-of-Service DataPre-visit PlanningProactive
eCW Alerts app
Population Management
Organization Wide Trend
Colorectal Cancer Screening Project
CRC-In reach
In reach
Outreach
Hypertension and Diabetes efforts at NHC
Neighborhood Healthcare ALLHeart Project
How are we doing BP Control UDS
NHCCCC HTN ProtocolOctober 2013
How are we doing BP ControlDMALL
How are we doing BP Control
How are we doing BP Control
How are we doing DM BP control
Getting Quality Data to the Medical Staff
NHC Physician- level Interactive Real Time Quality Detail- panel level detail
Key Concept Teamwork + Transparency and Accountability
Key Concept- Innovation
Key Concept- Boldness
Key Concept- Team
Key Concept- Happy People
Slide Number 97
Group
Name
HTN Control Q1 14
HTN Control Q2 14
HTN Control Q3 14
HTN Control Q4 14
Percent Change
Additional HTN Controlled
HTN 2013 Denominator
Group A
Arch
500
520
560
610
110
2640
24000
Group B
Sharp- RS
758
760
770
780
22
374
17063
Group C
Scripps Coastal
602
620
640
670
68
836
12291
Group D
Scripps Clinic
668
670
690
720
52
869
16704
Group E
UCSD
630
640
660
670
40
160
4000
Group F
Kaiser
841
841
850
860
19
1758
92525
Group G
Community Clinics
600
620
640
660
60
3349
55814
Group H
Multicultural
490
520
540
570
80
240
3000
Name
HTN Control Q1 14
HTN Control Q2 14
HTN Control Q3 14
HTN Control Q4 14
Added HTN Contr 2
Added HTN Contr 5
Additional HTN Controlled
HTN 2013 Denominator
Arch
12000
12480
13440
14640
480
1200
2640
24000
Sharp- RS
12935
12968
13139
13309
341
853
374
17063
Scripps Coastal
7399
7620
7866
8235
246
615
836
12291
Scripps Clinic
11158
11192
11526
12027
334
835
869
16704
UCSD
2520
2560
2640
2680
80
200
160
4000
Kaiser
77814
77814
78646
79572
1851
4626
1758
92525
Group Average across all Hypertensive Patients
Group Average across all Hypertensive Patients by Insurance Type
Community Clinics
33488
34605
35721
36837
1116
2791
3349
55814
Multicultural
1470
1560
1620
1710
60
150
240
3000
Total Numerators
158785
160798
164598
169010
225397
Avg Control Rate
704
713
730
750
HTN Control
Group Average
Medicaid
Commercial
Medicare
Q1
704
Q1
600
704
680
Q2
713
Q2
620
713
685
Q3
730
Q3
640
730
700
Q4
750
Q4
650
750
710
HTN Control
Group A
Group B
Group C
Group D
Group E
Group F
Group G
Group H
Q1
500
758
602
668
630
841
600
490
Q2
520
760
620
670
640
841
620
520
Q3
560
770
640
690
660
850
640
540
Q4
610
780
670
720
670
860
660
570
Q1
Q2
Q3
Q4
Q1
Q2
Q3
Q4
Q1
Q2
Q3
Q4
Q1
Q2
Q3
Q4
Group A
500
520
560
610
Group A
12000
12480
13440
14640
Group A
0
480
1440
2640
Medicaid
0
604
1744
3067
Group B
758
760
770
780
Group B
12935
12968
13139
13309
Group B
0
33
203
374
Commercial
0
1007
2906
5112
Group C
602
620
640
670
Group C
7399
7620
7866
8235
Group C
0
221
467
836
Medicare
0
403
1163
2045
Group D
668
670
690
720
Group D
11158
11192
11526
12027
Group D
0
33
367
869
0
2013
5813
10225
Group E
630
640
660
670
Group E
2520
2560
2640
2680
Group E
0
40
120
160
Group F
841
841
850
860
Group F
77814
77814
78646
79572
Group F
0
0
833
1758
Group G
600
620
640
660
Group G
33488
34605
35721
36837
Group G
0
1116
2233
3349
Group H
490
520
540
570
Group H
1470
1560
1620
1710
Group H
0
90
150
240
0
2013
5813
10225
Data for April 7 2014 Meeting
HTN Control
Group
Name
HTN Control 2013
HTN Compliant 2013
HTN Non-Compliant 2013
HTN 2013 Denominator
Group A
Arch
540
12960
11040
24000
Overall
Group A
Group B
Group C
Group D
Group E
Group F
Group G
Group H
Group B
Sharp- RS
758
12935
4128
17063
MC only
Controlled
155517
12960
12935
7399
11158
77814
33251
Group C
Scripps Coastal
602
7399
4892
12291
Uncontrolled
62880
11040
4128
4892
5546
14711
22563
Group D
Scripps Clinic
668
11158
5546
16704
Group E
UCSD
Group F
Kaiser
841
77814
14711
92525
Group G
Community Clinics
600
33251
22563
55814
Group H
Multicultural
712
155517
62880
218397
DM lt120-90
Group
Name
HTN Control 2013
HTN Compliant 2013
HTN Non-Compliant 2013
HTN 2013 Denominator
comment
Group A
Arch
650
1412
766
2178
Overall
Group A
Group B
Group C
Group D
Group E
Group F
Group G
Group H
Group B
Sharp- RS
8135
5806
1331
7137
MY2012
Controlled
49461
1412
5806
3707
4974
310856
33251
Group C
Scripps Coastal
724
3707
1413
5120
Uncontrolled
27794
766
1331
1413
1605
116
22563
Group D
Scripps Clinic
756
4974
1605
6579
Group E
UCSD
728
311
116
427
commercial HMO only
Group F
Kaiser
Group G
Community Clinics
600
33251
22563
55814
Group H
Multicultural
640
49461
27794
77255
HTN
sharp RS Mediccer FFS
720
2925
1138
4063
2013MY
all MC
MC Advantage
770
10010
2990
13000
2012MY
all MC
Medcare overall
758
12935
4128
17063
DM BP 140-90
MC FFS
770
684
204
888
888
Commer
822
3369
729
4098
40
Group
Name
HTN Control Q1 14
HTN Control Q2 14
HTN Control Q3 14
HTN Control Q4 14
Percent Change
Additional HTN Controlled
HTN 2013 Denominator
Group A
Arch
500
520
560
610
110
2640
24000
Group B
Sharp- RS
758
760
770
780
22
374
17063
Group C
Scripps Coastal
602
620
640
670
68
836
12291
Group D
Scripps Clinic
668
670
690
720
52
869
16704
Group E
UCSD
630
640
660
670
40
160
4000
Group F
Kaiser
841
841
850
860
19
1758
92525
Group G
Community Clinics
600
620
640
660
60
3349
55814
Group H
Multicultural
490
520
540
570
80
240
3000
Name
HTN Control Q1 14
HTN Control Q2 14
HTN Control Q3 14
HTN Control Q4 14
Added HTN Contr 2
Added HTN Contr 5
Additional HTN Controlled
HTN 2013 Denominator
Arch
12000
12480
13440
14640
480
1200
2640
24000
Sharp- RS
12935
12968
13139
13309
341
853
374
17063
Scripps Coastal
7399
7620
7866
8235
246
615
836
12291
Scripps Clinic
11158
11192
11526
12027
334
835
869
16704
UCSD
2520
2560
2640
2680
80
200
160
4000
Kaiser
77814
77814
78646
79572
1851
4626
1758
92525
Group Average across all Hypertensive Patients
Group Average across all Hypertensive Patients by Insurance Type
Community Clinics
33488
34605
35721
36837
1116
2791
3349
55814
Multicultural
1470
1560
1620
1710
60
150
240
3000
Total Numerators
158785
160798
164598
169010
225397
Avg Control Rate
704
713
730
750
HTN Control
Group Average
Medicaid
Commercial
Medicare
Q1
704
Q1
600
704
680
Q2
713
Q2
620
713
685
Q3
730
Q3
640
730
700
Q4
750
Q4
650
750
710
HTN Control
Group A
Group B
Group C
Group D
Group E
Group F
Group G
Group H
Q1
500
758
602
668
630
841
600
490
Q2
520
760
620
670
640
841
620
520
Q3
560
770
640
690
660
850
640
540
Q4
610
780
670
720
670
860
660
570
Q1
Q2
Q3
Q4
Q1
Q2
Q3
Q4
Q1
Q2
Q3
Q4
Q1
Q2
Q3
Q4
Group A
500
520
560
610
Group A
12000
12480
13440
14640
Group A
0
480
1440
2640
Medicaid
0
604
1744
3067
Group B
758
760
770
780
Group B
12935
12968
13139
13309
Group B
0
33
203
374
Commercial
0
1007
2906
5112
Group C
602
620
640
670
Group C
7399
7620
7866
8235
Group C
0
221
467
836
Medicare
0
403
1163
2045
Group D
668
670
690
720
Group D
11158
11192
11526
12027
Group D
0
33
367
869
0
2013
5813
10225
Group E
630
640
660
670
Group E
2520
2560
2640
2680
Group E
0
40
120
160
Group F
841
841
850
860
Group F
77814
77814
78646
79572
Group F
0
0
833
1758
Group G
600
620
640
660
Group G
33488
34605
35721
36837
Group G
0
1116
2233
3349
Group H
490
520
540
570
Group H
1470
1560
1620
1710
Group H
0
90
150
240
0
2013
5813
10225
Data for April 7 2014 Meeting
HTN Control
Group
Name
HTN Control 2013
HTN Compliant 2013
HTN Non-Compliant 2013
HTN 2013 Denominator
Group A
Arch
540
12960
11040
24000
Overall
Group A
Group B
Group C
Group D
Group E
Group F
Group G
Group H
Group B
Sharp- RS
758
12935
4128
17063
MC only
Controlled
155517
12960
12935
7399
11158
77814
33251
Group C
Scripps Coastal
602
7399
4892
12291
Uncontrolled
62880
11040
4128
4892
5546
14711
22563
Group D
Scripps Clinic
668
11158
5546
16704
Group E
UCSD
Group F
Kaiser
841
77814
14711
92525
Group G
Community Clinics
600
33251
22563
55814
Group H
Multicultural
712
155517
62880
218397
DM lt120-90
Group
Name
HTN Control 2013
HTN Compliant 2013
HTN Non-Compliant 2013
HTN 2013 Denominator
comment
Group A
Arch
650
1412
766
2178
Overall
Group A
Group B
Group C
Group D
Group E
Group F
Group G
Group H
Group B
Sharp- RS
8135
5806
1331
7137
MY2012
Controlled
49461
1412
5806
3707
4974
310856
33251
Group C
Scripps Coastal
724
3707
1413
5120
Uncontrolled
27794
766
1331
1413
1605
116
22563
Group D
Scripps Clinic
756
4974
1605
6579
Group E
UCSD
728
311
116
427
commercial HMO only
Group F
Kaiser
Group G
Community Clinics
600
33251
22563
55814
Group H
Multicultural
640
49461
27794
77255
HTN
sharp RS Mediccer FFS
720
2925
1138
4063
2013MY
all MC
MC Advantage
770
10010
2990
13000
2012MY
all MC
Medcare overall
758
12935
4128
17063
DM BP 140-90
MC FFS
770
684
204
888
888
Commer
822
3369
729
4098
40
Evidence-based response
lowast Goalslowast To describe Community Health Centers in San Diego County
lowast To outline challenges to population health improvement and chronic disease management in CHCs
lowast To describe progress in CDM and PopHealth in SD County
lowast To outline the tools used by one CHC to improve CDM and PopHealth
Chronic Disease Management in Underserved
lowast Which EMR do you use for outpatient carelowast 1 EPIClowast 2 CernerClaritylowast 3 NextGenlowast 4 Allscriptslowast 5 Vista or Vista open source variationlowast 6 eClinicalWorkslowast 7 Other
Audience Response
lowast Does your EMR have a usable registry function built inlowast 1 Yeslowast 2 Nolowast 3 Unsure
Audience Response
lowast Do you provide real time population or panel clinical quality data to your medical stafflowast 1 Yes multiple measureslowast 2 Yes one or two measureslowast 3 Nolowast 4 What are you smoking
Audience Response
lowast What percentage of the physician compensation is based on clinical quality metricslowast 1 more than 50lowast 2 25-50lowast 3 10-25lowast 4 lt 10lowast 5 0
Audience Response
lowast Is providing real time actionable clinical data to your medical staff at the point of care a priority in your organizationlowast 1 Yes and it is happeninglowast 2 Yes but unable to do it yetlowast 3 Yes but searching for fundingROIlowast 4 Nolowast 5 What is that
Audience Response
lowast 17 not-for-profit private 501c3 organizations plus IHS lowast gt120 siteslowast gt900000 patients served annually lowast gt2000000 encounters annuallylowast gt650 Medical Stafflowast No county hospital in SDlowast No county (primary or specialty) clinics in SDlowast Geographic managed care for MediCaid (68 Plans)lowast Border county 180000 undocumented immigrants with
no health insurance possibilities
Community Health Centers inSan Diego County- the lsquoSafety Netrsquo
lowast PCP cap (in theory) for 80 of patientslowast PPS rate bottom lineper visit payment modellowast Lack of P4P (04 of budget at NHC)lowast Lack of QM incentivelowast Reducing hospitalizationER saves money elsewherelowast Little knowledge of HEDIS among clinics or providerslowast Data exchange for labencounter data an issue
lowast Labcorp encounter data to health plan ~0lowast UDS reportinglowast lsquoMessenger Modelrsquo HMO contracting 1 contract 1 clinic
Local SD Payer Environment
CCC sites
Quality Work in CHCs
lowast Dedicated mission-driven medical stafflowast Dedicated mission-driven frontline and
back office staff- TEAMlowast Finding innovative ways to get things done
(that donrsquot cost a lot)lowast Get a little help from your friends- Using
other resources to fill the gapslowast Share selflessly steal shamelessly
(lsquoidentify best practicesrsquo)lowast Do the right thing AND doing things right
lowast Pop-iq Org-level metricslowast QM Departmemt (Lynn Farrell Nicole Howard
Eleanor Alcones Henry Tuttle)lowast Grant writerlowast CCHN TSOlowast EMR hostinglowast Data supportlowast SDHCBeacon interface (HIE)
Council of Community Clinics Tools
Council of Community Clinicslowast ALLHeart as an example of consortium-level Quality
Improvement effortlowast DM age 50+lowast Tracking
lowast ALL use (med bundle) lowast Rx not dispensing data
lowast Clinical measureslowast BP A1C test and results Tobacco usecounselling Self
Management LDL test and results etclowast No CV event data
lowast Provider and staff educationlowast Targeted interventions in select clinics of their own designlowast Kaiser Community Benefit fundedlowast Followed ALL effort
ALL HEART Clinics by CountyImperial County
Clinicas de Salud del Pueblo
Los Angeles County
Northeast Valley Health Corporation
Eisner Pediatric amp Family Medical Center
Central City Community Health Center (Sites also in Orange County amp Riverside)
Group AverageQ1Q2Q3Q4070399999999999996071299999999999997073075MedicaidQ1Q2Q3Q406062064065CommercialQ1Q2Q3Q4070399999999999996071299999999999997073075MedicareQ1Q2Q3Q406806850000000000000507071MedicaidQ1Q2Q3Q4060403379999999971743894300000000630674973000000027CommercialQ1Q2Q3Q40100672299999999952906490500000001251124955000000045MedicareQ1Q2Q3Q4040268919999999981162596200000000620449982000000018
Estimated 2014 Blood Pressure Control Rates by Quarter amp Insurance
Type
38
Slide courtesy Allen Fremont MD Rand Corp
Estimated 2014 Patients with Newly Controlled Blood Pressure by
Group AverageQ1Q2Q3Q4070399999999999996071299999999999997073075MedicaidQ1Q2Q3Q406062064065CommercialQ1Q2Q3Q4070399999999999996071299999999999997073075MedicareQ1Q2Q3Q406806850000000000000507071MedicaidQ1Q2Q3Q4060403379999999971743894300000000630674973000000027CommercialQ1Q2Q3Q40100672299999999952906490500000001251124955000000045MedicareQ1Q2Q3Q4040268919999999981162596200000000620449982000000018
Estimated 2014 Pts w Blood Pressure Control
40
Slide courtesy Allen Fremont MD Rand Corp
41Slide courtesy Allen Fremont MD Rand Corp
Neighborhood Healthcare2014 stats12 sites2 counties65000 patients245000 visits18000 BH only visits
gt40 medical providers
9 primary care sites all PCMH-accredited except new Menifee(5 with embedded BH 1 rural with outside agency)
lowast Private non-profit corporation licensed by CA DHSlowast Federally Qualified Health Center (lsquoFQHCrsquo lsquo330rsquo clinic)lowast Volunteer Board of Directors consumer representation lowast Discounted sliding fee scale for cash patients ($35)lowast Evening and Saturday hourslowast Employed MDs NPs and PAs dentists psychiatrists
psychologists psych NPs midwives 1 Chiropractorlowast Staff cultural competence reflects patient demographicslowast NCQA PCMH level 23lowast Limited specialty care no inpatient or SNF care
wwwnhcareorg
Neighborhood Healthcare
44
NHC- Providing Quality Health Care Since 1969
lowast Medical dental and behavioral health services to 65000 people annually in 245000 visits
lowast 450+ employees Annual Budget $48 million lowast 100 full and part time clinical staff licensedboard-
certified in family medicine internal medicine pediatrics geriatrics sports medicine psychology psychiatry geropsych general dentistry pediatric dentistry chiropractic and others
wwwnhcareorg
Neighborhood HealthcareFY 2016 Budget -- Revenue by Category
TOTAL REVENUE = $49676159(excludes revenue from capital)
Sliding Scale Patient Payments
15
Donations 07
Medi-Cal651
Medicare66
Private Insurance04
County State and Federal
Grants amp Contracts
163
Contract Rx Program
65
Other Income
24
Medi-Cal = 178Mgd Care Medi-Cal = 473
Medicare = 28Mgd Care Medicare = 38
Private Insurance 02Mgd Care Commercial 01
Mgd Care Covered CA $ 01
Neighborhood HealthcareFY 2016 ndash Patient Care Revenue
Medi-Cal 60377 = 217Mgd Care Medi-Cal 160205 = 576
Public Insurance 12435 = 45Grants amp Contracts 583 = 02
Neighborhood HealthcareExpenses ndash
Patient Care vs Administrative Support
Administrative Costs159
Fundraising 07
Direct Services834
34
58
67
79
69
75
98
53
61
0
20
40
60
80
100
1201 9 17 25 33 41 49 57 65 73 81 89 97 105
113
121
129
137
145
153
161
169
177
185
193
201
209
217
225
233
241
249
257
265
273
281
289
297
305
313
321
329
337
345
353
361
369
377
dm a1c gt9 DM LDL cont cvd ldl cont DM BP cont BP control
smokcess asthma on cont CRC screened mammo pap
Setting the Stage Quality CAN Happen
82115DM with BP lt 14090 83
HTN with BP lt 14090 77
ALL 66-75
DM with A1c gt 9 12
DM with A1c gt 9 or not done 22
Breast Ca screen 71Cervical Ca screen 74
Resources amp Policies
Community
DeliverySystemDesign
DecisionSupport
ClinicalInformation
Systems
Self-Management
Support
Health System
Health Care Organization
InformedActivated
Patient
PreparedProactive
Practice Team
ProductiveInteractions
Improved Outcomes
Chronic Care Model (CCM)
Slide from E Wagner 50
CDM in Underserved- PCMH
lowast Workflow changeslowast Adequate support staff (number quality training)lowast Innovation (NHC=lsquoMikeyrsquo)lowast Ruthless removal of lsquotasks below licensersquolowast Datalowast Crediblelowast Actionablelowast To the right peoplelowast At the right time
management program inception 2000lowast Dulce group medical apptslowast pain mgmt groups asthma groups
lowast Disparities collaborative (depression screen and rx)lowast BH integrationlowast EHR 2010lowast PCMH MUlowast AllHeart ALL (Kaiser grant through CCC)
lowast Roger Coleman and Associateslowast Eliminate unnecessary steps in workflow based on data and
lsquovalue-addedrsquo conceptlowast Patient-centered- bring services to the patient vs assembly-line
model (7-9 stops 4 stops)lowast Rapid cycle improvementPDSA model of rapid changelowast 2 MAs per fte MD or NPPAlowast Huddlespre-visit planninglowast Results
lowast Experimenting with Team= 1 MD 3 mids 7 MA RN Panel Managerlowast Innovationlowast Ruthless removal of lsquotasks below licensersquolowast Data
lowast Crediblelowast Actionablelowast To the right peoplelowast At the right time
How to get better population quality- Support Staff
lowast Workflow changeslowast Adequate support staff (number quality training)
lowast Innovationlowast And leveraging othersrsquo innovations
lowast Ruthless removal of lsquotasks below licensersquolowast Data
lowast Crediblelowast Actionablelowast To the right peoplelowast At the right time
How to get better population quality- Innovation
lowast RN CDE-led chronic disease management programlowast Key features
lowast Stared ~1999 with Dr NickECClowast RN-ledlowast BH availablelowast MDNPPA involvement on med changeslab interpretationexamlowast Self management skillslowast Patient education and activationlowast Care coordination (scheduling labs referrals PCP consultation
foot exams)lowast Proactive office encounter (huddles pre0visit planning)lowast Single stable point of contact (health coach) for the patient
Innovation Project Dulce
Project Dulce Cost-Effectiveness
Cost savings estimates for Dulce Model (~$QALY 2006 $)
Uninsured $10000
County Medical Services $25000
Medicaid $45000
Commercial $70000Health Services Research Health Research and Educational TrustDOI 101111j1475-6773200700701x
Analysis of the impact of group medical visits on clinical outcomes of Project Dulce patients with Diabetes HbA1c Results of August 2006 Enrollees with a group medical visit between 72000 to 62006
00
10
20
30
40
50
60
70
80
90
HbA1c Prior toDulce 11(n=78)
HbA1c Prior to GMV(n=78 plt0001)
HbA1c after 6months
(n=55 plt005)
HbA1c after 12months
(n=55 plt005)
HbA1c after 18months
(n=24 plt005)
HbA1c after 24months
(n=22 plt005)
87
7872 70 70 72
(n=24) (n=22)(n=55)(n=55)(n=78)(n=78)
Project Dulce Group Medical Visits Analysis of change in HbA1c over time
Pre-EMR
Innovation
Primary Care retinal photography
George Hayes CRR - Scripps Whittier Institute
lowast Workflow changeslowast Adequate support staff (number quality training)lowast Innovationlowast Ruthless removal of lsquotasks below licensersquo
lowastDatalowast Crediblelowast Actionablelowast To the right peoplelowast At the right time
How to get better population quality DATA
lowast 2010 implementation of eClinicalWorks (eCW)
lowast Data lag 1 year +lowast Validation period 1 year +lowast Registry functionlowast BridgeITlowast Home-grown registrylowast eCW alerts point-of-service data with low annoyance
quotientlowast i2i
NHC Data Journey EMR
lowast 5 stages of grief (Kubler-Ross)lowast Denial- lsquothe data are wrongrsquo lsquoitrsquos not my patientsrsquo
lowast Remedy only show good easily-verifiable datalowast Anger-rsquo damn you they arenrsquot my ptsrsquo lsquoI donrsquot practice cookbook
medicinersquo lowast Remedy only show good easily-verifiable data
lowast Bargaining- lsquo if I had some help on thisrsquo lsquomy pts are the sickest so of course my numbers are badrsquo lsquoI get all the new out-of-control ptsrsquolowast Remedy good data with good benchmarks- local and regionalnational
similar practices eg CHC vs CHClowast Depression-rsquo boy I really suckrsquo lsquomy system is set up to sabatoge mersquo lsquomy
MAs are no buenorsquolowast Remedy give tools and workflow changes that make doing the right thing
easy get help at appropriate license level donrsquot penalize right away for poor performance
lowast Acceptance-rsquo ok how do we make it betterrsquo lsquoMAs letrsquos be the top by the end of the monthrsquolowast Remedy- more of the above continued emphasis emphasize saving lives
and preventing morbidity (and cost in some systems)
Data
lowast Data overload-lowast providers burn out trying to be 1 in everything drive their
team crazy start focusing on the numbers over actual clinical quality start pt dumpingcherry picking
lowast Remedy only emphasize a few things at a time reward for one or two priority areas reward whole team
lowast Apathylowast too much data people revert back to concentrating on
individual pt carelowast Feel futility at times- moving the result takes effort and timelowast Remedy give the populationprevention tasks to others (RNs
+ data analysts midlevels dedicated to specific roles advanced MAs in conjunction with their team under protocols health coaches etc)
A1cLDLMAbcreatFoot examRetina screenALL medsASABP controlStatinCRC screenBreast Ca screenCervical Ca screenDepression screenAlcohol screenImmunizations due todaydeclinedTobacco usecounselling dueHIV done everVisit summary printed (MU)eRx sent (MU measure)
eCW Alerts app
lowast Donrsquot wait for the patient to show up- identify the needs and go get them
lowast New skillslowast Datadata analysislowast Prioritization of a lot of needlowast Proactive pt activationeducation for preventive care
lowast How financedlowast LIHP funding for population management and PCMHlowast Health Plan very little fundinglowast CHC payment model a handicap
lowast Best example CRC screenlowast Key finding team responsibility for screening and
monitoring (not JUST the MD)
Population Management
Organization Wide Trend
0
10
20
30
40
50
60
70
1 12 23 34 45 56 67 78 89 100 111
122
133
144
155
166
177
188
199
210
221
232
243
254
265
276
287
298
309
320
331
342
353
364
375
CRC screened
CRC screened
56 82015
lowast Partners KP C4 PASD LabCorp lowast Minimum funding from C4lowast LabCorp donated FIT tests
lowast Pt identified needing CRC screen lowast during visit via eCW alerts applowast proactively using registry
lowast FIT test givenlowast Tests tracked by Panel Managers
lowast Pt contacted if kit not returned in 2 wkslowast Results tracked monthly
lowast Reported to sites med staff QM BOD periodicallylowast Positive tests free colonoscopy by Kaiser via Project Access San Diegolowast Positive Biopsies
lowast Kaiser-donated surgery imaging specialty consultRx planlowast PASD arranges for donated oncology eval XRT if needed ChemoRx if
needed
Colorectal Cancer Screening Project
CRC-In reachlowast The daily huddle
In reachlowast Identifying Patients due for CRC Screening lowast eCW Alert app developed by Dr Kulin Tantod
Outreachlowast Identifying Patients due for CRC Screening lowast Data registry developed by Dr Kulin Tantod
Hypertension and Diabetes efforts at NHC
Neighborhood Healthcare ALLHeart Project
lowast Project Increase the number of ALLHEART patients on both medications lowast RN protocollowast MD education videolowast Added to alerts app if not on ACEARB amp Statinlowast Added to medical staff clinical measures dashboardlowast Monitoring overall performance monthlylowast ASCVD Risk Calculator embedded in alerts app with
hyperlink to reference
How are we doing BP Control UDS 77
82415
NHCCCC HTN Protocol
October 2013
How are we doing BP ControlDMALL
DM lt14090 83 (33293999)
HTN 77 (66938713)65 on 31614
DM gt50 on ACEARB + Statin75 on 10914 (24583269)70 on 31614
How are we doing BP ControlAs of 31014
How are we doing BP ControlAs of 2515
How are we doing DM BP control
lowast MDs are competitivelowast Data + supportmoving the curve
Getting Quality Data to the Medical Staff
NHC Physician- level Interactive Real Time Quality Detail- panel level detail
Individual real timeDetailed
Trending
Peer-normative
Actionable
On-demand Quality Data- Actionable Data
bull Click any column to generate recall list
bull All recall items identified- one-call hits all items
Outreachlowast Identifying Patients due for CRC Screening lowast Data registry developed by Dr Kulin Tantod
bull Panel Sizebull DM A1clt9 BP 14090 LDL lt100 bull HTN BP lt14090 ALL medsbull Ca screen colon breast cervicalbull Antipsych meds with A1c testbull PP and prenatal visit tielinessbull Childhood IMMIsbull Asthma on controllerbull etc
lowast Chronic disease management can be done in an underserved population requirementslowast Committed leadershiplowast Dedicated staff with a unifying purposelowast Validated and trusted data delivered when it is neededlowast Data analytics capabilitylowast Prioritization processlowast Leveraging community resourceslowast Engaged patientslowast Payment model to support activities outside typical
face-to-face visit
Summary
Key Concept- Data
Key Concept Teamwork + Transparency and Accountability
Key Concept- Innovation
Primary Care retinal photography
George Hayes CRR - Scripps Whittier Institute
Key Concept- Boldness
Key Concept- Team
Erika Bazan MA- Care Coordinator
Maria Acosta MA
Erica Cruz MA
Key Concept- Happy People
Chronic Disease Management in Underserved Populations- Mission Impossible
Audience Response
Evidence-based response
Slide Number 4
Chronic Disease Management in Underserved
Audience Response
Audience Response
Audience Response
Audience Response
Audience Response
Community Health Centers in San Diego County- the lsquoSafety Netrsquo
Local SD Payer Environment
Slide Number 13
CCC sites
Quality Work in CHCs
How does Quality happen in a CHC
Recent Council of Community Clinics Advances
Council of Community Clinics Tools
Council of Community Clinics
Slide Number 20
ALL HEART Clinics by County
ALL HEART Patients to Date
Slide Number 23
ALLHeart Results- QI Project CHCs
Slide Number 25
Slide Number 26
HYPERTENSION CONTROL DATA BY CLINIC ORGANIZATION-PopIq or individual reportsMeasurement Year March 31 2013 ndash February 28 2014N= 67241
Pop-IQ
PopIQ Data Analytics amp Data Aggregation
PopIQ Hypertension Blood Pressure lt 14090
PopIQ Blood Pressure lt 14090Diabetes
PopIQ DM Blood Pressure lt 14090
PopIQ Diabetics with HbA1c TestingHbA1c lt 7
Slide Number 34
What measures will be collecting for 2015-2016
Some measures will be stratified by age gender zip code in 2015-2016
Estimated 2014 Blood Pressure Control Rates by Quarter amp Group
Estimated 2014 Blood Pressure Control Rates by Quarter amp Insurance Type
Estimated 2014 Patients with Newly Controlled Blood Pressure by Quarter amp Insurance
Estimated 2014 Pts w Blood Pressure Control
Slide Number 41
Neighborhood Healthcare
Slide Number 43
NHC- Providing Quality Health Care Since 1969
Slide Number 45
Slide Number 46
Slide Number 47
Slide Number 48
Slide Number 49
Slide Number 50
CDM in Underserved- PCMH
How to get better population quality
How to get better population quality
NHC QM Efforts- Workflow changes
Workflow changes Pt flow redesign
Workflow changes Individual Reports- Huddles
How to get better population quality- Support Staff
How to get better population quality- Innovation
Innovation Project Dulce
Project Dulce Cost-Effectiveness
Slide Number 61
Innovation
How to get better population quality DATA
NHC Data Journey EMR
Data
Data- Grief Stages 6 and 7
Point-of-Service Data
Point-of-Service DataPre-visit PlanningProactive
eCW Alerts app
Population Management
Organization Wide Trend
Colorectal Cancer Screening Project
CRC-In reach
In reach
Outreach
Hypertension and Diabetes efforts at NHC
Neighborhood Healthcare ALLHeart Project
How are we doing BP Control UDS
NHCCCC HTN ProtocolOctober 2013
How are we doing BP ControlDMALL
How are we doing BP Control
How are we doing BP Control
How are we doing DM BP control
Getting Quality Data to the Medical Staff
NHC Physician- level Interactive Real Time Quality Detail- panel level detail
Key Concept Teamwork + Transparency and Accountability
Key Concept- Innovation
Key Concept- Boldness
Key Concept- Team
Key Concept- Happy People
Slide Number 97
Group
Name
HTN Control Q1 14
HTN Control Q2 14
HTN Control Q3 14
HTN Control Q4 14
Percent Change
Additional HTN Controlled
HTN 2013 Denominator
Group A
Arch
500
520
560
610
110
2640
24000
Group B
Sharp- RS
758
760
770
780
22
374
17063
Group C
Scripps Coastal
602
620
640
670
68
836
12291
Group D
Scripps Clinic
668
670
690
720
52
869
16704
Group E
UCSD
630
640
660
670
40
160
4000
Group F
Kaiser
841
841
850
860
19
1758
92525
Group G
Community Clinics
600
620
640
660
60
3349
55814
Group H
Multicultural
490
520
540
570
80
240
3000
Name
HTN Control Q1 14
HTN Control Q2 14
HTN Control Q3 14
HTN Control Q4 14
Added HTN Contr 2
Added HTN Contr 5
Additional HTN Controlled
HTN 2013 Denominator
Arch
12000
12480
13440
14640
480
1200
2640
24000
Sharp- RS
12935
12968
13139
13309
341
853
374
17063
Scripps Coastal
7399
7620
7866
8235
246
615
836
12291
Scripps Clinic
11158
11192
11526
12027
334
835
869
16704
UCSD
2520
2560
2640
2680
80
200
160
4000
Kaiser
77814
77814
78646
79572
1851
4626
1758
92525
Group Average across all Hypertensive Patients
Group Average across all Hypertensive Patients by Insurance Type
Community Clinics
33488
34605
35721
36837
1116
2791
3349
55814
Multicultural
1470
1560
1620
1710
60
150
240
3000
Total Numerators
158785
160798
164598
169010
225397
Avg Control Rate
704
713
730
750
HTN Control
Group Average
Medicaid
Commercial
Medicare
Q1
704
Q1
600
704
680
Q2
713
Q2
620
713
685
Q3
730
Q3
640
730
700
Q4
750
Q4
650
750
710
HTN Control
Group A
Group B
Group C
Group D
Group E
Group F
Group G
Group H
Q1
500
758
602
668
630
841
600
490
Q2
520
760
620
670
640
841
620
520
Q3
560
770
640
690
660
850
640
540
Q4
610
780
670
720
670
860
660
570
Q1
Q2
Q3
Q4
Q1
Q2
Q3
Q4
Q1
Q2
Q3
Q4
Q1
Q2
Q3
Q4
Group A
500
520
560
610
Group A
12000
12480
13440
14640
Group A
0
480
1440
2640
Medicaid
0
604
1744
3067
Group B
758
760
770
780
Group B
12935
12968
13139
13309
Group B
0
33
203
374
Commercial
0
1007
2906
5112
Group C
602
620
640
670
Group C
7399
7620
7866
8235
Group C
0
221
467
836
Medicare
0
403
1163
2045
Group D
668
670
690
720
Group D
11158
11192
11526
12027
Group D
0
33
367
869
0
2013
5813
10225
Group E
630
640
660
670
Group E
2520
2560
2640
2680
Group E
0
40
120
160
Group F
841
841
850
860
Group F
77814
77814
78646
79572
Group F
0
0
833
1758
Group G
600
620
640
660
Group G
33488
34605
35721
36837
Group G
0
1116
2233
3349
Group H
490
520
540
570
Group H
1470
1560
1620
1710
Group H
0
90
150
240
0
2013
5813
10225
Data for April 7 2014 Meeting
HTN Control
Group
Name
HTN Control 2013
HTN Compliant 2013
HTN Non-Compliant 2013
HTN 2013 Denominator
Group A
Arch
540
12960
11040
24000
Overall
Group A
Group B
Group C
Group D
Group E
Group F
Group G
Group H
Group B
Sharp- RS
758
12935
4128
17063
MC only
Controlled
155517
12960
12935
7399
11158
77814
33251
Group C
Scripps Coastal
602
7399
4892
12291
Uncontrolled
62880
11040
4128
4892
5546
14711
22563
Group D
Scripps Clinic
668
11158
5546
16704
Group E
UCSD
Group F
Kaiser
841
77814
14711
92525
Group G
Community Clinics
600
33251
22563
55814
Group H
Multicultural
712
155517
62880
218397
DM lt120-90
Group
Name
HTN Control 2013
HTN Compliant 2013
HTN Non-Compliant 2013
HTN 2013 Denominator
comment
Group A
Arch
650
1412
766
2178
Overall
Group A
Group B
Group C
Group D
Group E
Group F
Group G
Group H
Group B
Sharp- RS
8135
5806
1331
7137
MY2012
Controlled
49461
1412
5806
3707
4974
310856
33251
Group C
Scripps Coastal
724
3707
1413
5120
Uncontrolled
27794
766
1331
1413
1605
116
22563
Group D
Scripps Clinic
756
4974
1605
6579
Group E
UCSD
728
311
116
427
commercial HMO only
Group F
Kaiser
Group G
Community Clinics
600
33251
22563
55814
Group H
Multicultural
640
49461
27794
77255
HTN
sharp RS Mediccer FFS
720
2925
1138
4063
2013MY
all MC
MC Advantage
770
10010
2990
13000
2012MY
all MC
Medcare overall
758
12935
4128
17063
DM BP 140-90
MC FFS
770
684
204
888
888
Commer
822
3369
729
4098
40
Group
Name
HTN Control Q1 14
HTN Control Q2 14
HTN Control Q3 14
HTN Control Q4 14
Percent Change
Additional HTN Controlled
HTN 2013 Denominator
Group A
Arch
500
520
560
610
110
2640
24000
Group B
Sharp- RS
758
760
770
780
22
374
17063
Group C
Scripps Coastal
602
620
640
670
68
836
12291
Group D
Scripps Clinic
668
670
690
720
52
869
16704
Group E
UCSD
630
640
660
670
40
160
4000
Group F
Kaiser
841
841
850
860
19
1758
92525
Group G
Community Clinics
600
620
640
660
60
3349
55814
Group H
Multicultural
490
520
540
570
80
240
3000
Name
HTN Control Q1 14
HTN Control Q2 14
HTN Control Q3 14
HTN Control Q4 14
Added HTN Contr 2
Added HTN Contr 5
Additional HTN Controlled
HTN 2013 Denominator
Arch
12000
12480
13440
14640
480
1200
2640
24000
Sharp- RS
12935
12968
13139
13309
341
853
374
17063
Scripps Coastal
7399
7620
7866
8235
246
615
836
12291
Scripps Clinic
11158
11192
11526
12027
334
835
869
16704
UCSD
2520
2560
2640
2680
80
200
160
4000
Kaiser
77814
77814
78646
79572
1851
4626
1758
92525
Group Average across all Hypertensive Patients
Group Average across all Hypertensive Patients by Insurance Type
Community Clinics
33488
34605
35721
36837
1116
2791
3349
55814
Multicultural
1470
1560
1620
1710
60
150
240
3000
Total Numerators
158785
160798
164598
169010
225397
Avg Control Rate
704
713
730
750
HTN Control
Group Average
Medicaid
Commercial
Medicare
Q1
704
Q1
600
704
680
Q2
713
Q2
620
713
685
Q3
730
Q3
640
730
700
Q4
750
Q4
650
750
710
HTN Control
Group A
Group B
Group C
Group D
Group E
Group F
Group G
Group H
Q1
500
758
602
668
630
841
600
490
Q2
520
760
620
670
640
841
620
520
Q3
560
770
640
690
660
850
640
540
Q4
610
780
670
720
670
860
660
570
Q1
Q2
Q3
Q4
Q1
Q2
Q3
Q4
Q1
Q2
Q3
Q4
Q1
Q2
Q3
Q4
Group A
500
520
560
610
Group A
12000
12480
13440
14640
Group A
0
480
1440
2640
Medicaid
0
604
1744
3067
Group B
758
760
770
780
Group B
12935
12968
13139
13309
Group B
0
33
203
374
Commercial
0
1007
2906
5112
Group C
602
620
640
670
Group C
7399
7620
7866
8235
Group C
0
221
467
836
Medicare
0
403
1163
2045
Group D
668
670
690
720
Group D
11158
11192
11526
12027
Group D
0
33
367
869
0
2013
5813
10225
Group E
630
640
660
670
Group E
2520
2560
2640
2680
Group E
0
40
120
160
Group F
841
841
850
860
Group F
77814
77814
78646
79572
Group F
0
0
833
1758
Group G
600
620
640
660
Group G
33488
34605
35721
36837
Group G
0
1116
2233
3349
Group H
490
520
540
570
Group H
1470
1560
1620
1710
Group H
0
90
150
240
0
2013
5813
10225
Data for April 7 2014 Meeting
HTN Control
Group
Name
HTN Control 2013
HTN Compliant 2013
HTN Non-Compliant 2013
HTN 2013 Denominator
Group A
Arch
540
12960
11040
24000
Overall
Group A
Group B
Group C
Group D
Group E
Group F
Group G
Group H
Group B
Sharp- RS
758
12935
4128
17063
MC only
Controlled
155517
12960
12935
7399
11158
77814
33251
Group C
Scripps Coastal
602
7399
4892
12291
Uncontrolled
62880
11040
4128
4892
5546
14711
22563
Group D
Scripps Clinic
668
11158
5546
16704
Group E
UCSD
Group F
Kaiser
841
77814
14711
92525
Group G
Community Clinics
600
33251
22563
55814
Group H
Multicultural
712
155517
62880
218397
DM lt120-90
Group
Name
HTN Control 2013
HTN Compliant 2013
HTN Non-Compliant 2013
HTN 2013 Denominator
comment
Group A
Arch
650
1412
766
2178
Overall
Group A
Group B
Group C
Group D
Group E
Group F
Group G
Group H
Group B
Sharp- RS
8135
5806
1331
7137
MY2012
Controlled
49461
1412
5806
3707
4974
310856
33251
Group C
Scripps Coastal
724
3707
1413
5120
Uncontrolled
27794
766
1331
1413
1605
116
22563
Group D
Scripps Clinic
756
4974
1605
6579
Group E
UCSD
728
311
116
427
commercial HMO only
Group F
Kaiser
Group G
Community Clinics
600
33251
22563
55814
Group H
Multicultural
640
49461
27794
77255
HTN
sharp RS Mediccer FFS
720
2925
1138
4063
2013MY
all MC
MC Advantage
770
10010
2990
13000
2012MY
all MC
Medcare overall
758
12935
4128
17063
DM BP 140-90
MC FFS
770
684
204
888
888
Commer
822
3369
729
4098
40
lowast PCP cap (in theory) for 80 of patientslowast PPS rate bottom lineper visit payment modellowast Lack of P4P (04 of budget at NHC)lowast Lack of QM incentivelowast Reducing hospitalizationER saves money elsewherelowast Little knowledge of HEDIS among clinics or providerslowast Data exchange for labencounter data an issue
lowast Labcorp encounter data to health plan ~0lowast UDS reportinglowast lsquoMessenger Modelrsquo HMO contracting 1 contract 1 clinic
Local SD Payer Environment
CCC sites
Quality Work in CHCs
lowast Dedicated mission-driven medical stafflowast Dedicated mission-driven frontline and
back office staff- TEAMlowast Finding innovative ways to get things done
(that donrsquot cost a lot)lowast Get a little help from your friends- Using
other resources to fill the gapslowast Share selflessly steal shamelessly
(lsquoidentify best practicesrsquo)lowast Do the right thing AND doing things right
lowast Pop-iq Org-level metricslowast QM Departmemt (Lynn Farrell Nicole Howard
Eleanor Alcones Henry Tuttle)lowast Grant writerlowast CCHN TSOlowast EMR hostinglowast Data supportlowast SDHCBeacon interface (HIE)
Council of Community Clinics Tools
Council of Community Clinicslowast ALLHeart as an example of consortium-level Quality
Improvement effortlowast DM age 50+lowast Tracking
lowast ALL use (med bundle) lowast Rx not dispensing data
lowast Clinical measureslowast BP A1C test and results Tobacco usecounselling Self
Management LDL test and results etclowast No CV event data
lowast Provider and staff educationlowast Targeted interventions in select clinics of their own designlowast Kaiser Community Benefit fundedlowast Followed ALL effort
ALL HEART Clinics by CountyImperial County
Clinicas de Salud del Pueblo
Los Angeles County
Northeast Valley Health Corporation
Eisner Pediatric amp Family Medical Center
Central City Community Health Center (Sites also in Orange County amp Riverside)
Group AverageQ1Q2Q3Q4070399999999999996071299999999999997073075MedicaidQ1Q2Q3Q406062064065CommercialQ1Q2Q3Q4070399999999999996071299999999999997073075MedicareQ1Q2Q3Q406806850000000000000507071MedicaidQ1Q2Q3Q4060403379999999971743894300000000630674973000000027CommercialQ1Q2Q3Q40100672299999999952906490500000001251124955000000045MedicareQ1Q2Q3Q4040268919999999981162596200000000620449982000000018
Estimated 2014 Blood Pressure Control Rates by Quarter amp Insurance
Type
38
Slide courtesy Allen Fremont MD Rand Corp
Estimated 2014 Patients with Newly Controlled Blood Pressure by
Group AverageQ1Q2Q3Q4070399999999999996071299999999999997073075MedicaidQ1Q2Q3Q406062064065CommercialQ1Q2Q3Q4070399999999999996071299999999999997073075MedicareQ1Q2Q3Q406806850000000000000507071MedicaidQ1Q2Q3Q4060403379999999971743894300000000630674973000000027CommercialQ1Q2Q3Q40100672299999999952906490500000001251124955000000045MedicareQ1Q2Q3Q4040268919999999981162596200000000620449982000000018
Estimated 2014 Pts w Blood Pressure Control
40
Slide courtesy Allen Fremont MD Rand Corp
41Slide courtesy Allen Fremont MD Rand Corp
Neighborhood Healthcare2014 stats12 sites2 counties65000 patients245000 visits18000 BH only visits
gt40 medical providers
9 primary care sites all PCMH-accredited except new Menifee(5 with embedded BH 1 rural with outside agency)
lowast Private non-profit corporation licensed by CA DHSlowast Federally Qualified Health Center (lsquoFQHCrsquo lsquo330rsquo clinic)lowast Volunteer Board of Directors consumer representation lowast Discounted sliding fee scale for cash patients ($35)lowast Evening and Saturday hourslowast Employed MDs NPs and PAs dentists psychiatrists
psychologists psych NPs midwives 1 Chiropractorlowast Staff cultural competence reflects patient demographicslowast NCQA PCMH level 23lowast Limited specialty care no inpatient or SNF care
wwwnhcareorg
Neighborhood Healthcare
44
NHC- Providing Quality Health Care Since 1969
lowast Medical dental and behavioral health services to 65000 people annually in 245000 visits
lowast 450+ employees Annual Budget $48 million lowast 100 full and part time clinical staff licensedboard-
certified in family medicine internal medicine pediatrics geriatrics sports medicine psychology psychiatry geropsych general dentistry pediatric dentistry chiropractic and others
wwwnhcareorg
Neighborhood HealthcareFY 2016 Budget -- Revenue by Category
TOTAL REVENUE = $49676159(excludes revenue from capital)
Sliding Scale Patient Payments
15
Donations 07
Medi-Cal651
Medicare66
Private Insurance04
County State and Federal
Grants amp Contracts
163
Contract Rx Program
65
Other Income
24
Medi-Cal = 178Mgd Care Medi-Cal = 473
Medicare = 28Mgd Care Medicare = 38
Private Insurance 02Mgd Care Commercial 01
Mgd Care Covered CA $ 01
Neighborhood HealthcareFY 2016 ndash Patient Care Revenue
Medi-Cal 60377 = 217Mgd Care Medi-Cal 160205 = 576
Public Insurance 12435 = 45Grants amp Contracts 583 = 02
Neighborhood HealthcareExpenses ndash
Patient Care vs Administrative Support
Administrative Costs159
Fundraising 07
Direct Services834
34
58
67
79
69
75
98
53
61
0
20
40
60
80
100
1201 9 17 25 33 41 49 57 65 73 81 89 97 105
113
121
129
137
145
153
161
169
177
185
193
201
209
217
225
233
241
249
257
265
273
281
289
297
305
313
321
329
337
345
353
361
369
377
dm a1c gt9 DM LDL cont cvd ldl cont DM BP cont BP control
smokcess asthma on cont CRC screened mammo pap
Setting the Stage Quality CAN Happen
82115DM with BP lt 14090 83
HTN with BP lt 14090 77
ALL 66-75
DM with A1c gt 9 12
DM with A1c gt 9 or not done 22
Breast Ca screen 71Cervical Ca screen 74
Resources amp Policies
Community
DeliverySystemDesign
DecisionSupport
ClinicalInformation
Systems
Self-Management
Support
Health System
Health Care Organization
InformedActivated
Patient
PreparedProactive
Practice Team
ProductiveInteractions
Improved Outcomes
Chronic Care Model (CCM)
Slide from E Wagner 50
CDM in Underserved- PCMH
lowast Workflow changeslowast Adequate support staff (number quality training)lowast Innovation (NHC=lsquoMikeyrsquo)lowast Ruthless removal of lsquotasks below licensersquolowast Datalowast Crediblelowast Actionablelowast To the right peoplelowast At the right time
management program inception 2000lowast Dulce group medical apptslowast pain mgmt groups asthma groups
lowast Disparities collaborative (depression screen and rx)lowast BH integrationlowast EHR 2010lowast PCMH MUlowast AllHeart ALL (Kaiser grant through CCC)
lowast Roger Coleman and Associateslowast Eliminate unnecessary steps in workflow based on data and
lsquovalue-addedrsquo conceptlowast Patient-centered- bring services to the patient vs assembly-line
model (7-9 stops 4 stops)lowast Rapid cycle improvementPDSA model of rapid changelowast 2 MAs per fte MD or NPPAlowast Huddlespre-visit planninglowast Results
lowast Experimenting with Team= 1 MD 3 mids 7 MA RN Panel Managerlowast Innovationlowast Ruthless removal of lsquotasks below licensersquolowast Data
lowast Crediblelowast Actionablelowast To the right peoplelowast At the right time
How to get better population quality- Support Staff
lowast Workflow changeslowast Adequate support staff (number quality training)
lowast Innovationlowast And leveraging othersrsquo innovations
lowast Ruthless removal of lsquotasks below licensersquolowast Data
lowast Crediblelowast Actionablelowast To the right peoplelowast At the right time
How to get better population quality- Innovation
lowast RN CDE-led chronic disease management programlowast Key features
lowast Stared ~1999 with Dr NickECClowast RN-ledlowast BH availablelowast MDNPPA involvement on med changeslab interpretationexamlowast Self management skillslowast Patient education and activationlowast Care coordination (scheduling labs referrals PCP consultation
foot exams)lowast Proactive office encounter (huddles pre0visit planning)lowast Single stable point of contact (health coach) for the patient
Innovation Project Dulce
Project Dulce Cost-Effectiveness
Cost savings estimates for Dulce Model (~$QALY 2006 $)
Uninsured $10000
County Medical Services $25000
Medicaid $45000
Commercial $70000Health Services Research Health Research and Educational TrustDOI 101111j1475-6773200700701x
Analysis of the impact of group medical visits on clinical outcomes of Project Dulce patients with Diabetes HbA1c Results of August 2006 Enrollees with a group medical visit between 72000 to 62006
00
10
20
30
40
50
60
70
80
90
HbA1c Prior toDulce 11(n=78)
HbA1c Prior to GMV(n=78 plt0001)
HbA1c after 6months
(n=55 plt005)
HbA1c after 12months
(n=55 plt005)
HbA1c after 18months
(n=24 plt005)
HbA1c after 24months
(n=22 plt005)
87
7872 70 70 72
(n=24) (n=22)(n=55)(n=55)(n=78)(n=78)
Project Dulce Group Medical Visits Analysis of change in HbA1c over time
Pre-EMR
Innovation
Primary Care retinal photography
George Hayes CRR - Scripps Whittier Institute
lowast Workflow changeslowast Adequate support staff (number quality training)lowast Innovationlowast Ruthless removal of lsquotasks below licensersquo
lowastDatalowast Crediblelowast Actionablelowast To the right peoplelowast At the right time
How to get better population quality DATA
lowast 2010 implementation of eClinicalWorks (eCW)
lowast Data lag 1 year +lowast Validation period 1 year +lowast Registry functionlowast BridgeITlowast Home-grown registrylowast eCW alerts point-of-service data with low annoyance
quotientlowast i2i
NHC Data Journey EMR
lowast 5 stages of grief (Kubler-Ross)lowast Denial- lsquothe data are wrongrsquo lsquoitrsquos not my patientsrsquo
lowast Remedy only show good easily-verifiable datalowast Anger-rsquo damn you they arenrsquot my ptsrsquo lsquoI donrsquot practice cookbook
medicinersquo lowast Remedy only show good easily-verifiable data
lowast Bargaining- lsquo if I had some help on thisrsquo lsquomy pts are the sickest so of course my numbers are badrsquo lsquoI get all the new out-of-control ptsrsquolowast Remedy good data with good benchmarks- local and regionalnational
similar practices eg CHC vs CHClowast Depression-rsquo boy I really suckrsquo lsquomy system is set up to sabatoge mersquo lsquomy
MAs are no buenorsquolowast Remedy give tools and workflow changes that make doing the right thing
easy get help at appropriate license level donrsquot penalize right away for poor performance
lowast Acceptance-rsquo ok how do we make it betterrsquo lsquoMAs letrsquos be the top by the end of the monthrsquolowast Remedy- more of the above continued emphasis emphasize saving lives
and preventing morbidity (and cost in some systems)
Data
lowast Data overload-lowast providers burn out trying to be 1 in everything drive their
team crazy start focusing on the numbers over actual clinical quality start pt dumpingcherry picking
lowast Remedy only emphasize a few things at a time reward for one or two priority areas reward whole team
lowast Apathylowast too much data people revert back to concentrating on
individual pt carelowast Feel futility at times- moving the result takes effort and timelowast Remedy give the populationprevention tasks to others (RNs
+ data analysts midlevels dedicated to specific roles advanced MAs in conjunction with their team under protocols health coaches etc)
A1cLDLMAbcreatFoot examRetina screenALL medsASABP controlStatinCRC screenBreast Ca screenCervical Ca screenDepression screenAlcohol screenImmunizations due todaydeclinedTobacco usecounselling dueHIV done everVisit summary printed (MU)eRx sent (MU measure)
eCW Alerts app
lowast Donrsquot wait for the patient to show up- identify the needs and go get them
lowast New skillslowast Datadata analysislowast Prioritization of a lot of needlowast Proactive pt activationeducation for preventive care
lowast How financedlowast LIHP funding for population management and PCMHlowast Health Plan very little fundinglowast CHC payment model a handicap
lowast Best example CRC screenlowast Key finding team responsibility for screening and
monitoring (not JUST the MD)
Population Management
Organization Wide Trend
0
10
20
30
40
50
60
70
1 12 23 34 45 56 67 78 89 100 111
122
133
144
155
166
177
188
199
210
221
232
243
254
265
276
287
298
309
320
331
342
353
364
375
CRC screened
CRC screened
56 82015
lowast Partners KP C4 PASD LabCorp lowast Minimum funding from C4lowast LabCorp donated FIT tests
lowast Pt identified needing CRC screen lowast during visit via eCW alerts applowast proactively using registry
lowast FIT test givenlowast Tests tracked by Panel Managers
lowast Pt contacted if kit not returned in 2 wkslowast Results tracked monthly
lowast Reported to sites med staff QM BOD periodicallylowast Positive tests free colonoscopy by Kaiser via Project Access San Diegolowast Positive Biopsies
lowast Kaiser-donated surgery imaging specialty consultRx planlowast PASD arranges for donated oncology eval XRT if needed ChemoRx if
needed
Colorectal Cancer Screening Project
CRC-In reachlowast The daily huddle
In reachlowast Identifying Patients due for CRC Screening lowast eCW Alert app developed by Dr Kulin Tantod
Outreachlowast Identifying Patients due for CRC Screening lowast Data registry developed by Dr Kulin Tantod
Hypertension and Diabetes efforts at NHC
Neighborhood Healthcare ALLHeart Project
lowast Project Increase the number of ALLHEART patients on both medications lowast RN protocollowast MD education videolowast Added to alerts app if not on ACEARB amp Statinlowast Added to medical staff clinical measures dashboardlowast Monitoring overall performance monthlylowast ASCVD Risk Calculator embedded in alerts app with
hyperlink to reference
How are we doing BP Control UDS 77
82415
NHCCCC HTN Protocol
October 2013
How are we doing BP ControlDMALL
DM lt14090 83 (33293999)
HTN 77 (66938713)65 on 31614
DM gt50 on ACEARB + Statin75 on 10914 (24583269)70 on 31614
How are we doing BP ControlAs of 31014
How are we doing BP ControlAs of 2515
How are we doing DM BP control
lowast MDs are competitivelowast Data + supportmoving the curve
Getting Quality Data to the Medical Staff
NHC Physician- level Interactive Real Time Quality Detail- panel level detail
Individual real timeDetailed
Trending
Peer-normative
Actionable
On-demand Quality Data- Actionable Data
bull Click any column to generate recall list
bull All recall items identified- one-call hits all items
Outreachlowast Identifying Patients due for CRC Screening lowast Data registry developed by Dr Kulin Tantod
bull Panel Sizebull DM A1clt9 BP 14090 LDL lt100 bull HTN BP lt14090 ALL medsbull Ca screen colon breast cervicalbull Antipsych meds with A1c testbull PP and prenatal visit tielinessbull Childhood IMMIsbull Asthma on controllerbull etc
lowast Chronic disease management can be done in an underserved population requirementslowast Committed leadershiplowast Dedicated staff with a unifying purposelowast Validated and trusted data delivered when it is neededlowast Data analytics capabilitylowast Prioritization processlowast Leveraging community resourceslowast Engaged patientslowast Payment model to support activities outside typical
face-to-face visit
Summary
Key Concept- Data
Key Concept Teamwork + Transparency and Accountability
Key Concept- Innovation
Primary Care retinal photography
George Hayes CRR - Scripps Whittier Institute
Key Concept- Boldness
Key Concept- Team
Erika Bazan MA- Care Coordinator
Maria Acosta MA
Erica Cruz MA
Key Concept- Happy People
Chronic Disease Management in Underserved Populations- Mission Impossible
Audience Response
Evidence-based response
Slide Number 4
Chronic Disease Management in Underserved
Audience Response
Audience Response
Audience Response
Audience Response
Audience Response
Community Health Centers in San Diego County- the lsquoSafety Netrsquo
Local SD Payer Environment
Slide Number 13
CCC sites
Quality Work in CHCs
How does Quality happen in a CHC
Recent Council of Community Clinics Advances
Council of Community Clinics Tools
Council of Community Clinics
Slide Number 20
ALL HEART Clinics by County
ALL HEART Patients to Date
Slide Number 23
ALLHeart Results- QI Project CHCs
Slide Number 25
Slide Number 26
HYPERTENSION CONTROL DATA BY CLINIC ORGANIZATION-PopIq or individual reportsMeasurement Year March 31 2013 ndash February 28 2014N= 67241
Pop-IQ
PopIQ Data Analytics amp Data Aggregation
PopIQ Hypertension Blood Pressure lt 14090
PopIQ Blood Pressure lt 14090Diabetes
PopIQ DM Blood Pressure lt 14090
PopIQ Diabetics with HbA1c TestingHbA1c lt 7
Slide Number 34
What measures will be collecting for 2015-2016
Some measures will be stratified by age gender zip code in 2015-2016
Estimated 2014 Blood Pressure Control Rates by Quarter amp Group
Estimated 2014 Blood Pressure Control Rates by Quarter amp Insurance Type
Estimated 2014 Patients with Newly Controlled Blood Pressure by Quarter amp Insurance
Estimated 2014 Pts w Blood Pressure Control
Slide Number 41
Neighborhood Healthcare
Slide Number 43
NHC- Providing Quality Health Care Since 1969
Slide Number 45
Slide Number 46
Slide Number 47
Slide Number 48
Slide Number 49
Slide Number 50
CDM in Underserved- PCMH
How to get better population quality
How to get better population quality
NHC QM Efforts- Workflow changes
Workflow changes Pt flow redesign
Workflow changes Individual Reports- Huddles
How to get better population quality- Support Staff
How to get better population quality- Innovation
Innovation Project Dulce
Project Dulce Cost-Effectiveness
Slide Number 61
Innovation
How to get better population quality DATA
NHC Data Journey EMR
Data
Data- Grief Stages 6 and 7
Point-of-Service Data
Point-of-Service DataPre-visit PlanningProactive
eCW Alerts app
Population Management
Organization Wide Trend
Colorectal Cancer Screening Project
CRC-In reach
In reach
Outreach
Hypertension and Diabetes efforts at NHC
Neighborhood Healthcare ALLHeart Project
How are we doing BP Control UDS
NHCCCC HTN ProtocolOctober 2013
How are we doing BP ControlDMALL
How are we doing BP Control
How are we doing BP Control
How are we doing DM BP control
Getting Quality Data to the Medical Staff
NHC Physician- level Interactive Real Time Quality Detail- panel level detail
Key Concept Teamwork + Transparency and Accountability
Key Concept- Innovation
Key Concept- Boldness
Key Concept- Team
Key Concept- Happy People
Slide Number 97
Group
Name
HTN Control Q1 14
HTN Control Q2 14
HTN Control Q3 14
HTN Control Q4 14
Percent Change
Additional HTN Controlled
HTN 2013 Denominator
Group A
Arch
500
520
560
610
110
2640
24000
Group B
Sharp- RS
758
760
770
780
22
374
17063
Group C
Scripps Coastal
602
620
640
670
68
836
12291
Group D
Scripps Clinic
668
670
690
720
52
869
16704
Group E
UCSD
630
640
660
670
40
160
4000
Group F
Kaiser
841
841
850
860
19
1758
92525
Group G
Community Clinics
600
620
640
660
60
3349
55814
Group H
Multicultural
490
520
540
570
80
240
3000
Name
HTN Control Q1 14
HTN Control Q2 14
HTN Control Q3 14
HTN Control Q4 14
Added HTN Contr 2
Added HTN Contr 5
Additional HTN Controlled
HTN 2013 Denominator
Arch
12000
12480
13440
14640
480
1200
2640
24000
Sharp- RS
12935
12968
13139
13309
341
853
374
17063
Scripps Coastal
7399
7620
7866
8235
246
615
836
12291
Scripps Clinic
11158
11192
11526
12027
334
835
869
16704
UCSD
2520
2560
2640
2680
80
200
160
4000
Kaiser
77814
77814
78646
79572
1851
4626
1758
92525
Group Average across all Hypertensive Patients
Group Average across all Hypertensive Patients by Insurance Type
Community Clinics
33488
34605
35721
36837
1116
2791
3349
55814
Multicultural
1470
1560
1620
1710
60
150
240
3000
Total Numerators
158785
160798
164598
169010
225397
Avg Control Rate
704
713
730
750
HTN Control
Group Average
Medicaid
Commercial
Medicare
Q1
704
Q1
600
704
680
Q2
713
Q2
620
713
685
Q3
730
Q3
640
730
700
Q4
750
Q4
650
750
710
HTN Control
Group A
Group B
Group C
Group D
Group E
Group F
Group G
Group H
Q1
500
758
602
668
630
841
600
490
Q2
520
760
620
670
640
841
620
520
Q3
560
770
640
690
660
850
640
540
Q4
610
780
670
720
670
860
660
570
Q1
Q2
Q3
Q4
Q1
Q2
Q3
Q4
Q1
Q2
Q3
Q4
Q1
Q2
Q3
Q4
Group A
500
520
560
610
Group A
12000
12480
13440
14640
Group A
0
480
1440
2640
Medicaid
0
604
1744
3067
Group B
758
760
770
780
Group B
12935
12968
13139
13309
Group B
0
33
203
374
Commercial
0
1007
2906
5112
Group C
602
620
640
670
Group C
7399
7620
7866
8235
Group C
0
221
467
836
Medicare
0
403
1163
2045
Group D
668
670
690
720
Group D
11158
11192
11526
12027
Group D
0
33
367
869
0
2013
5813
10225
Group E
630
640
660
670
Group E
2520
2560
2640
2680
Group E
0
40
120
160
Group F
841
841
850
860
Group F
77814
77814
78646
79572
Group F
0
0
833
1758
Group G
600
620
640
660
Group G
33488
34605
35721
36837
Group G
0
1116
2233
3349
Group H
490
520
540
570
Group H
1470
1560
1620
1710
Group H
0
90
150
240
0
2013
5813
10225
Data for April 7 2014 Meeting
HTN Control
Group
Name
HTN Control 2013
HTN Compliant 2013
HTN Non-Compliant 2013
HTN 2013 Denominator
Group A
Arch
540
12960
11040
24000
Overall
Group A
Group B
Group C
Group D
Group E
Group F
Group G
Group H
Group B
Sharp- RS
758
12935
4128
17063
MC only
Controlled
155517
12960
12935
7399
11158
77814
33251
Group C
Scripps Coastal
602
7399
4892
12291
Uncontrolled
62880
11040
4128
4892
5546
14711
22563
Group D
Scripps Clinic
668
11158
5546
16704
Group E
UCSD
Group F
Kaiser
841
77814
14711
92525
Group G
Community Clinics
600
33251
22563
55814
Group H
Multicultural
712
155517
62880
218397
DM lt120-90
Group
Name
HTN Control 2013
HTN Compliant 2013
HTN Non-Compliant 2013
HTN 2013 Denominator
comment
Group A
Arch
650
1412
766
2178
Overall
Group A
Group B
Group C
Group D
Group E
Group F
Group G
Group H
Group B
Sharp- RS
8135
5806
1331
7137
MY2012
Controlled
49461
1412
5806
3707
4974
310856
33251
Group C
Scripps Coastal
724
3707
1413
5120
Uncontrolled
27794
766
1331
1413
1605
116
22563
Group D
Scripps Clinic
756
4974
1605
6579
Group E
UCSD
728
311
116
427
commercial HMO only
Group F
Kaiser
Group G
Community Clinics
600
33251
22563
55814
Group H
Multicultural
640
49461
27794
77255
HTN
sharp RS Mediccer FFS
720
2925
1138
4063
2013MY
all MC
MC Advantage
770
10010
2990
13000
2012MY
all MC
Medcare overall
758
12935
4128
17063
DM BP 140-90
MC FFS
770
684
204
888
888
Commer
822
3369
729
4098
40
Group
Name
HTN Control Q1 14
HTN Control Q2 14
HTN Control Q3 14
HTN Control Q4 14
Percent Change
Additional HTN Controlled
HTN 2013 Denominator
Group A
Arch
500
520
560
610
110
2640
24000
Group B
Sharp- RS
758
760
770
780
22
374
17063
Group C
Scripps Coastal
602
620
640
670
68
836
12291
Group D
Scripps Clinic
668
670
690
720
52
869
16704
Group E
UCSD
630
640
660
670
40
160
4000
Group F
Kaiser
841
841
850
860
19
1758
92525
Group G
Community Clinics
600
620
640
660
60
3349
55814
Group H
Multicultural
490
520
540
570
80
240
3000
Name
HTN Control Q1 14
HTN Control Q2 14
HTN Control Q3 14
HTN Control Q4 14
Added HTN Contr 2
Added HTN Contr 5
Additional HTN Controlled
HTN 2013 Denominator
Arch
12000
12480
13440
14640
480
1200
2640
24000
Sharp- RS
12935
12968
13139
13309
341
853
374
17063
Scripps Coastal
7399
7620
7866
8235
246
615
836
12291
Scripps Clinic
11158
11192
11526
12027
334
835
869
16704
UCSD
2520
2560
2640
2680
80
200
160
4000
Kaiser
77814
77814
78646
79572
1851
4626
1758
92525
Group Average across all Hypertensive Patients
Group Average across all Hypertensive Patients by Insurance Type
Community Clinics
33488
34605
35721
36837
1116
2791
3349
55814
Multicultural
1470
1560
1620
1710
60
150
240
3000
Total Numerators
158785
160798
164598
169010
225397
Avg Control Rate
704
713
730
750
HTN Control
Group Average
Medicaid
Commercial
Medicare
Q1
704
Q1
600
704
680
Q2
713
Q2
620
713
685
Q3
730
Q3
640
730
700
Q4
750
Q4
650
750
710
HTN Control
Group A
Group B
Group C
Group D
Group E
Group F
Group G
Group H
Q1
500
758
602
668
630
841
600
490
Q2
520
760
620
670
640
841
620
520
Q3
560
770
640
690
660
850
640
540
Q4
610
780
670
720
670
860
660
570
Q1
Q2
Q3
Q4
Q1
Q2
Q3
Q4
Q1
Q2
Q3
Q4
Q1
Q2
Q3
Q4
Group A
500
520
560
610
Group A
12000
12480
13440
14640
Group A
0
480
1440
2640
Medicaid
0
604
1744
3067
Group B
758
760
770
780
Group B
12935
12968
13139
13309
Group B
0
33
203
374
Commercial
0
1007
2906
5112
Group C
602
620
640
670
Group C
7399
7620
7866
8235
Group C
0
221
467
836
Medicare
0
403
1163
2045
Group D
668
670
690
720
Group D
11158
11192
11526
12027
Group D
0
33
367
869
0
2013
5813
10225
Group E
630
640
660
670
Group E
2520
2560
2640
2680
Group E
0
40
120
160
Group F
841
841
850
860
Group F
77814
77814
78646
79572
Group F
0
0
833
1758
Group G
600
620
640
660
Group G
33488
34605
35721
36837
Group G
0
1116
2233
3349
Group H
490
520
540
570
Group H
1470
1560
1620
1710
Group H
0
90
150
240
0
2013
5813
10225
Data for April 7 2014 Meeting
HTN Control
Group
Name
HTN Control 2013
HTN Compliant 2013
HTN Non-Compliant 2013
HTN 2013 Denominator
Group A
Arch
540
12960
11040
24000
Overall
Group A
Group B
Group C
Group D
Group E
Group F
Group G
Group H
Group B
Sharp- RS
758
12935
4128
17063
MC only
Controlled
155517
12960
12935
7399
11158
77814
33251
Group C
Scripps Coastal
602
7399
4892
12291
Uncontrolled
62880
11040
4128
4892
5546
14711
22563
Group D
Scripps Clinic
668
11158
5546
16704
Group E
UCSD
Group F
Kaiser
841
77814
14711
92525
Group G
Community Clinics
600
33251
22563
55814
Group H
Multicultural
712
155517
62880
218397
DM lt120-90
Group
Name
HTN Control 2013
HTN Compliant 2013
HTN Non-Compliant 2013
HTN 2013 Denominator
comment
Group A
Arch
650
1412
766
2178
Overall
Group A
Group B
Group C
Group D
Group E
Group F
Group G
Group H
Group B
Sharp- RS
8135
5806
1331
7137
MY2012
Controlled
49461
1412
5806
3707
4974
310856
33251
Group C
Scripps Coastal
724
3707
1413
5120
Uncontrolled
27794
766
1331
1413
1605
116
22563
Group D
Scripps Clinic
756
4974
1605
6579
Group E
UCSD
728
311
116
427
commercial HMO only
Group F
Kaiser
Group G
Community Clinics
600
33251
22563
55814
Group H
Multicultural
640
49461
27794
77255
HTN
sharp RS Mediccer FFS
720
2925
1138
4063
2013MY
all MC
MC Advantage
770
10010
2990
13000
2012MY
all MC
Medcare overall
758
12935
4128
17063
DM BP 140-90
MC FFS
770
684
204
888
888
Commer
822
3369
729
4098
40
Council of Community Clinicslowast ALLHeart as an example of consortium-level Quality
Improvement effortlowast DM age 50+lowast Tracking
lowast ALL use (med bundle) lowast Rx not dispensing data
lowast Clinical measureslowast BP A1C test and results Tobacco usecounselling Self
Management LDL test and results etclowast No CV event data
lowast Provider and staff educationlowast Targeted interventions in select clinics of their own designlowast Kaiser Community Benefit fundedlowast Followed ALL effort
ALL HEART Clinics by CountyImperial County
Clinicas de Salud del Pueblo
Los Angeles County
Northeast Valley Health Corporation
Eisner Pediatric amp Family Medical Center
Central City Community Health Center (Sites also in Orange County amp Riverside)
Group AverageQ1Q2Q3Q4070399999999999996071299999999999997073075MedicaidQ1Q2Q3Q406062064065CommercialQ1Q2Q3Q4070399999999999996071299999999999997073075MedicareQ1Q2Q3Q406806850000000000000507071MedicaidQ1Q2Q3Q4060403379999999971743894300000000630674973000000027CommercialQ1Q2Q3Q40100672299999999952906490500000001251124955000000045MedicareQ1Q2Q3Q4040268919999999981162596200000000620449982000000018
Estimated 2014 Blood Pressure Control Rates by Quarter amp Insurance
Type
38
Slide courtesy Allen Fremont MD Rand Corp
Estimated 2014 Patients with Newly Controlled Blood Pressure by
Group AverageQ1Q2Q3Q4070399999999999996071299999999999997073075MedicaidQ1Q2Q3Q406062064065CommercialQ1Q2Q3Q4070399999999999996071299999999999997073075MedicareQ1Q2Q3Q406806850000000000000507071MedicaidQ1Q2Q3Q4060403379999999971743894300000000630674973000000027CommercialQ1Q2Q3Q40100672299999999952906490500000001251124955000000045MedicareQ1Q2Q3Q4040268919999999981162596200000000620449982000000018
Estimated 2014 Pts w Blood Pressure Control
40
Slide courtesy Allen Fremont MD Rand Corp
41Slide courtesy Allen Fremont MD Rand Corp
Neighborhood Healthcare2014 stats12 sites2 counties65000 patients245000 visits18000 BH only visits
gt40 medical providers
9 primary care sites all PCMH-accredited except new Menifee(5 with embedded BH 1 rural with outside agency)
lowast Private non-profit corporation licensed by CA DHSlowast Federally Qualified Health Center (lsquoFQHCrsquo lsquo330rsquo clinic)lowast Volunteer Board of Directors consumer representation lowast Discounted sliding fee scale for cash patients ($35)lowast Evening and Saturday hourslowast Employed MDs NPs and PAs dentists psychiatrists
psychologists psych NPs midwives 1 Chiropractorlowast Staff cultural competence reflects patient demographicslowast NCQA PCMH level 23lowast Limited specialty care no inpatient or SNF care
wwwnhcareorg
Neighborhood Healthcare
44
NHC- Providing Quality Health Care Since 1969
lowast Medical dental and behavioral health services to 65000 people annually in 245000 visits
lowast 450+ employees Annual Budget $48 million lowast 100 full and part time clinical staff licensedboard-
certified in family medicine internal medicine pediatrics geriatrics sports medicine psychology psychiatry geropsych general dentistry pediatric dentistry chiropractic and others
wwwnhcareorg
Neighborhood HealthcareFY 2016 Budget -- Revenue by Category
TOTAL REVENUE = $49676159(excludes revenue from capital)
Sliding Scale Patient Payments
15
Donations 07
Medi-Cal651
Medicare66
Private Insurance04
County State and Federal
Grants amp Contracts
163
Contract Rx Program
65
Other Income
24
Medi-Cal = 178Mgd Care Medi-Cal = 473
Medicare = 28Mgd Care Medicare = 38
Private Insurance 02Mgd Care Commercial 01
Mgd Care Covered CA $ 01
Neighborhood HealthcareFY 2016 ndash Patient Care Revenue
Medi-Cal 60377 = 217Mgd Care Medi-Cal 160205 = 576
Public Insurance 12435 = 45Grants amp Contracts 583 = 02
Neighborhood HealthcareExpenses ndash
Patient Care vs Administrative Support
Administrative Costs159
Fundraising 07
Direct Services834
34
58
67
79
69
75
98
53
61
0
20
40
60
80
100
1201 9 17 25 33 41 49 57 65 73 81 89 97 105
113
121
129
137
145
153
161
169
177
185
193
201
209
217
225
233
241
249
257
265
273
281
289
297
305
313
321
329
337
345
353
361
369
377
dm a1c gt9 DM LDL cont cvd ldl cont DM BP cont BP control
smokcess asthma on cont CRC screened mammo pap
Setting the Stage Quality CAN Happen
82115DM with BP lt 14090 83
HTN with BP lt 14090 77
ALL 66-75
DM with A1c gt 9 12
DM with A1c gt 9 or not done 22
Breast Ca screen 71Cervical Ca screen 74
Resources amp Policies
Community
DeliverySystemDesign
DecisionSupport
ClinicalInformation
Systems
Self-Management
Support
Health System
Health Care Organization
InformedActivated
Patient
PreparedProactive
Practice Team
ProductiveInteractions
Improved Outcomes
Chronic Care Model (CCM)
Slide from E Wagner 50
CDM in Underserved- PCMH
lowast Workflow changeslowast Adequate support staff (number quality training)lowast Innovation (NHC=lsquoMikeyrsquo)lowast Ruthless removal of lsquotasks below licensersquolowast Datalowast Crediblelowast Actionablelowast To the right peoplelowast At the right time
management program inception 2000lowast Dulce group medical apptslowast pain mgmt groups asthma groups
lowast Disparities collaborative (depression screen and rx)lowast BH integrationlowast EHR 2010lowast PCMH MUlowast AllHeart ALL (Kaiser grant through CCC)
lowast Roger Coleman and Associateslowast Eliminate unnecessary steps in workflow based on data and
lsquovalue-addedrsquo conceptlowast Patient-centered- bring services to the patient vs assembly-line
model (7-9 stops 4 stops)lowast Rapid cycle improvementPDSA model of rapid changelowast 2 MAs per fte MD or NPPAlowast Huddlespre-visit planninglowast Results
lowast Experimenting with Team= 1 MD 3 mids 7 MA RN Panel Managerlowast Innovationlowast Ruthless removal of lsquotasks below licensersquolowast Data
lowast Crediblelowast Actionablelowast To the right peoplelowast At the right time
How to get better population quality- Support Staff
lowast Workflow changeslowast Adequate support staff (number quality training)
lowast Innovationlowast And leveraging othersrsquo innovations
lowast Ruthless removal of lsquotasks below licensersquolowast Data
lowast Crediblelowast Actionablelowast To the right peoplelowast At the right time
How to get better population quality- Innovation
lowast RN CDE-led chronic disease management programlowast Key features
lowast Stared ~1999 with Dr NickECClowast RN-ledlowast BH availablelowast MDNPPA involvement on med changeslab interpretationexamlowast Self management skillslowast Patient education and activationlowast Care coordination (scheduling labs referrals PCP consultation
foot exams)lowast Proactive office encounter (huddles pre0visit planning)lowast Single stable point of contact (health coach) for the patient
Innovation Project Dulce
Project Dulce Cost-Effectiveness
Cost savings estimates for Dulce Model (~$QALY 2006 $)
Uninsured $10000
County Medical Services $25000
Medicaid $45000
Commercial $70000Health Services Research Health Research and Educational TrustDOI 101111j1475-6773200700701x
Analysis of the impact of group medical visits on clinical outcomes of Project Dulce patients with Diabetes HbA1c Results of August 2006 Enrollees with a group medical visit between 72000 to 62006
00
10
20
30
40
50
60
70
80
90
HbA1c Prior toDulce 11(n=78)
HbA1c Prior to GMV(n=78 plt0001)
HbA1c after 6months
(n=55 plt005)
HbA1c after 12months
(n=55 plt005)
HbA1c after 18months
(n=24 plt005)
HbA1c after 24months
(n=22 plt005)
87
7872 70 70 72
(n=24) (n=22)(n=55)(n=55)(n=78)(n=78)
Project Dulce Group Medical Visits Analysis of change in HbA1c over time
Pre-EMR
Innovation
Primary Care retinal photography
George Hayes CRR - Scripps Whittier Institute
lowast Workflow changeslowast Adequate support staff (number quality training)lowast Innovationlowast Ruthless removal of lsquotasks below licensersquo
lowastDatalowast Crediblelowast Actionablelowast To the right peoplelowast At the right time
How to get better population quality DATA
lowast 2010 implementation of eClinicalWorks (eCW)
lowast Data lag 1 year +lowast Validation period 1 year +lowast Registry functionlowast BridgeITlowast Home-grown registrylowast eCW alerts point-of-service data with low annoyance
quotientlowast i2i
NHC Data Journey EMR
lowast 5 stages of grief (Kubler-Ross)lowast Denial- lsquothe data are wrongrsquo lsquoitrsquos not my patientsrsquo
lowast Remedy only show good easily-verifiable datalowast Anger-rsquo damn you they arenrsquot my ptsrsquo lsquoI donrsquot practice cookbook
medicinersquo lowast Remedy only show good easily-verifiable data
lowast Bargaining- lsquo if I had some help on thisrsquo lsquomy pts are the sickest so of course my numbers are badrsquo lsquoI get all the new out-of-control ptsrsquolowast Remedy good data with good benchmarks- local and regionalnational
similar practices eg CHC vs CHClowast Depression-rsquo boy I really suckrsquo lsquomy system is set up to sabatoge mersquo lsquomy
MAs are no buenorsquolowast Remedy give tools and workflow changes that make doing the right thing
easy get help at appropriate license level donrsquot penalize right away for poor performance
lowast Acceptance-rsquo ok how do we make it betterrsquo lsquoMAs letrsquos be the top by the end of the monthrsquolowast Remedy- more of the above continued emphasis emphasize saving lives
and preventing morbidity (and cost in some systems)
Data
lowast Data overload-lowast providers burn out trying to be 1 in everything drive their
team crazy start focusing on the numbers over actual clinical quality start pt dumpingcherry picking
lowast Remedy only emphasize a few things at a time reward for one or two priority areas reward whole team
lowast Apathylowast too much data people revert back to concentrating on
individual pt carelowast Feel futility at times- moving the result takes effort and timelowast Remedy give the populationprevention tasks to others (RNs
+ data analysts midlevels dedicated to specific roles advanced MAs in conjunction with their team under protocols health coaches etc)
A1cLDLMAbcreatFoot examRetina screenALL medsASABP controlStatinCRC screenBreast Ca screenCervical Ca screenDepression screenAlcohol screenImmunizations due todaydeclinedTobacco usecounselling dueHIV done everVisit summary printed (MU)eRx sent (MU measure)
eCW Alerts app
lowast Donrsquot wait for the patient to show up- identify the needs and go get them
lowast New skillslowast Datadata analysislowast Prioritization of a lot of needlowast Proactive pt activationeducation for preventive care
lowast How financedlowast LIHP funding for population management and PCMHlowast Health Plan very little fundinglowast CHC payment model a handicap
lowast Best example CRC screenlowast Key finding team responsibility for screening and
monitoring (not JUST the MD)
Population Management
Organization Wide Trend
0
10
20
30
40
50
60
70
1 12 23 34 45 56 67 78 89 100 111
122
133
144
155
166
177
188
199
210
221
232
243
254
265
276
287
298
309
320
331
342
353
364
375
CRC screened
CRC screened
56 82015
lowast Partners KP C4 PASD LabCorp lowast Minimum funding from C4lowast LabCorp donated FIT tests
lowast Pt identified needing CRC screen lowast during visit via eCW alerts applowast proactively using registry
lowast FIT test givenlowast Tests tracked by Panel Managers
lowast Pt contacted if kit not returned in 2 wkslowast Results tracked monthly
lowast Reported to sites med staff QM BOD periodicallylowast Positive tests free colonoscopy by Kaiser via Project Access San Diegolowast Positive Biopsies
lowast Kaiser-donated surgery imaging specialty consultRx planlowast PASD arranges for donated oncology eval XRT if needed ChemoRx if
needed
Colorectal Cancer Screening Project
CRC-In reachlowast The daily huddle
In reachlowast Identifying Patients due for CRC Screening lowast eCW Alert app developed by Dr Kulin Tantod
Outreachlowast Identifying Patients due for CRC Screening lowast Data registry developed by Dr Kulin Tantod
Hypertension and Diabetes efforts at NHC
Neighborhood Healthcare ALLHeart Project
lowast Project Increase the number of ALLHEART patients on both medications lowast RN protocollowast MD education videolowast Added to alerts app if not on ACEARB amp Statinlowast Added to medical staff clinical measures dashboardlowast Monitoring overall performance monthlylowast ASCVD Risk Calculator embedded in alerts app with
hyperlink to reference
How are we doing BP Control UDS 77
82415
NHCCCC HTN Protocol
October 2013
How are we doing BP ControlDMALL
DM lt14090 83 (33293999)
HTN 77 (66938713)65 on 31614
DM gt50 on ACEARB + Statin75 on 10914 (24583269)70 on 31614
How are we doing BP ControlAs of 31014
How are we doing BP ControlAs of 2515
How are we doing DM BP control
lowast MDs are competitivelowast Data + supportmoving the curve
Getting Quality Data to the Medical Staff
NHC Physician- level Interactive Real Time Quality Detail- panel level detail
Individual real timeDetailed
Trending
Peer-normative
Actionable
On-demand Quality Data- Actionable Data
bull Click any column to generate recall list
bull All recall items identified- one-call hits all items
Outreachlowast Identifying Patients due for CRC Screening lowast Data registry developed by Dr Kulin Tantod
bull Panel Sizebull DM A1clt9 BP 14090 LDL lt100 bull HTN BP lt14090 ALL medsbull Ca screen colon breast cervicalbull Antipsych meds with A1c testbull PP and prenatal visit tielinessbull Childhood IMMIsbull Asthma on controllerbull etc
lowast Chronic disease management can be done in an underserved population requirementslowast Committed leadershiplowast Dedicated staff with a unifying purposelowast Validated and trusted data delivered when it is neededlowast Data analytics capabilitylowast Prioritization processlowast Leveraging community resourceslowast Engaged patientslowast Payment model to support activities outside typical
face-to-face visit
Summary
Key Concept- Data
Key Concept Teamwork + Transparency and Accountability
Key Concept- Innovation
Primary Care retinal photography
George Hayes CRR - Scripps Whittier Institute
Key Concept- Boldness
Key Concept- Team
Erika Bazan MA- Care Coordinator
Maria Acosta MA
Erica Cruz MA
Key Concept- Happy People
Chronic Disease Management in Underserved Populations- Mission Impossible
Audience Response
Evidence-based response
Slide Number 4
Chronic Disease Management in Underserved
Audience Response
Audience Response
Audience Response
Audience Response
Audience Response
Community Health Centers in San Diego County- the lsquoSafety Netrsquo
Local SD Payer Environment
Slide Number 13
CCC sites
Quality Work in CHCs
How does Quality happen in a CHC
Recent Council of Community Clinics Advances
Council of Community Clinics Tools
Council of Community Clinics
Slide Number 20
ALL HEART Clinics by County
ALL HEART Patients to Date
Slide Number 23
ALLHeart Results- QI Project CHCs
Slide Number 25
Slide Number 26
HYPERTENSION CONTROL DATA BY CLINIC ORGANIZATION-PopIq or individual reportsMeasurement Year March 31 2013 ndash February 28 2014N= 67241
Pop-IQ
PopIQ Data Analytics amp Data Aggregation
PopIQ Hypertension Blood Pressure lt 14090
PopIQ Blood Pressure lt 14090Diabetes
PopIQ DM Blood Pressure lt 14090
PopIQ Diabetics with HbA1c TestingHbA1c lt 7
Slide Number 34
What measures will be collecting for 2015-2016
Some measures will be stratified by age gender zip code in 2015-2016
Estimated 2014 Blood Pressure Control Rates by Quarter amp Group
Estimated 2014 Blood Pressure Control Rates by Quarter amp Insurance Type
Estimated 2014 Patients with Newly Controlled Blood Pressure by Quarter amp Insurance
Estimated 2014 Pts w Blood Pressure Control
Slide Number 41
Neighborhood Healthcare
Slide Number 43
NHC- Providing Quality Health Care Since 1969
Slide Number 45
Slide Number 46
Slide Number 47
Slide Number 48
Slide Number 49
Slide Number 50
CDM in Underserved- PCMH
How to get better population quality
How to get better population quality
NHC QM Efforts- Workflow changes
Workflow changes Pt flow redesign
Workflow changes Individual Reports- Huddles
How to get better population quality- Support Staff
How to get better population quality- Innovation
Innovation Project Dulce
Project Dulce Cost-Effectiveness
Slide Number 61
Innovation
How to get better population quality DATA
NHC Data Journey EMR
Data
Data- Grief Stages 6 and 7
Point-of-Service Data
Point-of-Service DataPre-visit PlanningProactive
eCW Alerts app
Population Management
Organization Wide Trend
Colorectal Cancer Screening Project
CRC-In reach
In reach
Outreach
Hypertension and Diabetes efforts at NHC
Neighborhood Healthcare ALLHeart Project
How are we doing BP Control UDS
NHCCCC HTN ProtocolOctober 2013
How are we doing BP ControlDMALL
How are we doing BP Control
How are we doing BP Control
How are we doing DM BP control
Getting Quality Data to the Medical Staff
NHC Physician- level Interactive Real Time Quality Detail- panel level detail
Group AverageQ1Q2Q3Q4070399999999999996071299999999999997073075MedicaidQ1Q2Q3Q406062064065CommercialQ1Q2Q3Q4070399999999999996071299999999999997073075MedicareQ1Q2Q3Q406806850000000000000507071MedicaidQ1Q2Q3Q4060403379999999971743894300000000630674973000000027CommercialQ1Q2Q3Q40100672299999999952906490500000001251124955000000045MedicareQ1Q2Q3Q4040268919999999981162596200000000620449982000000018
Estimated 2014 Pts w Blood Pressure Control
40
Slide courtesy Allen Fremont MD Rand Corp
41Slide courtesy Allen Fremont MD Rand Corp
Neighborhood Healthcare2014 stats12 sites2 counties65000 patients245000 visits18000 BH only visits
gt40 medical providers
9 primary care sites all PCMH-accredited except new Menifee(5 with embedded BH 1 rural with outside agency)
lowast Private non-profit corporation licensed by CA DHSlowast Federally Qualified Health Center (lsquoFQHCrsquo lsquo330rsquo clinic)lowast Volunteer Board of Directors consumer representation lowast Discounted sliding fee scale for cash patients ($35)lowast Evening and Saturday hourslowast Employed MDs NPs and PAs dentists psychiatrists
psychologists psych NPs midwives 1 Chiropractorlowast Staff cultural competence reflects patient demographicslowast NCQA PCMH level 23lowast Limited specialty care no inpatient or SNF care
wwwnhcareorg
Neighborhood Healthcare
44
NHC- Providing Quality Health Care Since 1969
lowast Medical dental and behavioral health services to 65000 people annually in 245000 visits
lowast 450+ employees Annual Budget $48 million lowast 100 full and part time clinical staff licensedboard-
certified in family medicine internal medicine pediatrics geriatrics sports medicine psychology psychiatry geropsych general dentistry pediatric dentistry chiropractic and others
wwwnhcareorg
Neighborhood HealthcareFY 2016 Budget -- Revenue by Category
TOTAL REVENUE = $49676159(excludes revenue from capital)
Sliding Scale Patient Payments
15
Donations 07
Medi-Cal651
Medicare66
Private Insurance04
County State and Federal
Grants amp Contracts
163
Contract Rx Program
65
Other Income
24
Medi-Cal = 178Mgd Care Medi-Cal = 473
Medicare = 28Mgd Care Medicare = 38
Private Insurance 02Mgd Care Commercial 01
Mgd Care Covered CA $ 01
Neighborhood HealthcareFY 2016 ndash Patient Care Revenue
Medi-Cal 60377 = 217Mgd Care Medi-Cal 160205 = 576
Public Insurance 12435 = 45Grants amp Contracts 583 = 02
Neighborhood HealthcareExpenses ndash
Patient Care vs Administrative Support
Administrative Costs159
Fundraising 07
Direct Services834
34
58
67
79
69
75
98
53
61
0
20
40
60
80
100
1201 9 17 25 33 41 49 57 65 73 81 89 97 105
113
121
129
137
145
153
161
169
177
185
193
201
209
217
225
233
241
249
257
265
273
281
289
297
305
313
321
329
337
345
353
361
369
377
dm a1c gt9 DM LDL cont cvd ldl cont DM BP cont BP control
smokcess asthma on cont CRC screened mammo pap
Setting the Stage Quality CAN Happen
82115DM with BP lt 14090 83
HTN with BP lt 14090 77
ALL 66-75
DM with A1c gt 9 12
DM with A1c gt 9 or not done 22
Breast Ca screen 71Cervical Ca screen 74
Resources amp Policies
Community
DeliverySystemDesign
DecisionSupport
ClinicalInformation
Systems
Self-Management
Support
Health System
Health Care Organization
InformedActivated
Patient
PreparedProactive
Practice Team
ProductiveInteractions
Improved Outcomes
Chronic Care Model (CCM)
Slide from E Wagner 50
CDM in Underserved- PCMH
lowast Workflow changeslowast Adequate support staff (number quality training)lowast Innovation (NHC=lsquoMikeyrsquo)lowast Ruthless removal of lsquotasks below licensersquolowast Datalowast Crediblelowast Actionablelowast To the right peoplelowast At the right time
management program inception 2000lowast Dulce group medical apptslowast pain mgmt groups asthma groups
lowast Disparities collaborative (depression screen and rx)lowast BH integrationlowast EHR 2010lowast PCMH MUlowast AllHeart ALL (Kaiser grant through CCC)
lowast Roger Coleman and Associateslowast Eliminate unnecessary steps in workflow based on data and
lsquovalue-addedrsquo conceptlowast Patient-centered- bring services to the patient vs assembly-line
model (7-9 stops 4 stops)lowast Rapid cycle improvementPDSA model of rapid changelowast 2 MAs per fte MD or NPPAlowast Huddlespre-visit planninglowast Results
lowast Experimenting with Team= 1 MD 3 mids 7 MA RN Panel Managerlowast Innovationlowast Ruthless removal of lsquotasks below licensersquolowast Data
lowast Crediblelowast Actionablelowast To the right peoplelowast At the right time
How to get better population quality- Support Staff
lowast Workflow changeslowast Adequate support staff (number quality training)
lowast Innovationlowast And leveraging othersrsquo innovations
lowast Ruthless removal of lsquotasks below licensersquolowast Data
lowast Crediblelowast Actionablelowast To the right peoplelowast At the right time
How to get better population quality- Innovation
lowast RN CDE-led chronic disease management programlowast Key features
lowast Stared ~1999 with Dr NickECClowast RN-ledlowast BH availablelowast MDNPPA involvement on med changeslab interpretationexamlowast Self management skillslowast Patient education and activationlowast Care coordination (scheduling labs referrals PCP consultation
foot exams)lowast Proactive office encounter (huddles pre0visit planning)lowast Single stable point of contact (health coach) for the patient
Innovation Project Dulce
Project Dulce Cost-Effectiveness
Cost savings estimates for Dulce Model (~$QALY 2006 $)
Uninsured $10000
County Medical Services $25000
Medicaid $45000
Commercial $70000Health Services Research Health Research and Educational TrustDOI 101111j1475-6773200700701x
Analysis of the impact of group medical visits on clinical outcomes of Project Dulce patients with Diabetes HbA1c Results of August 2006 Enrollees with a group medical visit between 72000 to 62006
00
10
20
30
40
50
60
70
80
90
HbA1c Prior toDulce 11(n=78)
HbA1c Prior to GMV(n=78 plt0001)
HbA1c after 6months
(n=55 plt005)
HbA1c after 12months
(n=55 plt005)
HbA1c after 18months
(n=24 plt005)
HbA1c after 24months
(n=22 plt005)
87
7872 70 70 72
(n=24) (n=22)(n=55)(n=55)(n=78)(n=78)
Project Dulce Group Medical Visits Analysis of change in HbA1c over time
Pre-EMR
Innovation
Primary Care retinal photography
George Hayes CRR - Scripps Whittier Institute
lowast Workflow changeslowast Adequate support staff (number quality training)lowast Innovationlowast Ruthless removal of lsquotasks below licensersquo
lowastDatalowast Crediblelowast Actionablelowast To the right peoplelowast At the right time
How to get better population quality DATA
lowast 2010 implementation of eClinicalWorks (eCW)
lowast Data lag 1 year +lowast Validation period 1 year +lowast Registry functionlowast BridgeITlowast Home-grown registrylowast eCW alerts point-of-service data with low annoyance
quotientlowast i2i
NHC Data Journey EMR
lowast 5 stages of grief (Kubler-Ross)lowast Denial- lsquothe data are wrongrsquo lsquoitrsquos not my patientsrsquo
lowast Remedy only show good easily-verifiable datalowast Anger-rsquo damn you they arenrsquot my ptsrsquo lsquoI donrsquot practice cookbook
medicinersquo lowast Remedy only show good easily-verifiable data
lowast Bargaining- lsquo if I had some help on thisrsquo lsquomy pts are the sickest so of course my numbers are badrsquo lsquoI get all the new out-of-control ptsrsquolowast Remedy good data with good benchmarks- local and regionalnational
similar practices eg CHC vs CHClowast Depression-rsquo boy I really suckrsquo lsquomy system is set up to sabatoge mersquo lsquomy
MAs are no buenorsquolowast Remedy give tools and workflow changes that make doing the right thing
easy get help at appropriate license level donrsquot penalize right away for poor performance
lowast Acceptance-rsquo ok how do we make it betterrsquo lsquoMAs letrsquos be the top by the end of the monthrsquolowast Remedy- more of the above continued emphasis emphasize saving lives
and preventing morbidity (and cost in some systems)
Data
lowast Data overload-lowast providers burn out trying to be 1 in everything drive their
team crazy start focusing on the numbers over actual clinical quality start pt dumpingcherry picking
lowast Remedy only emphasize a few things at a time reward for one or two priority areas reward whole team
lowast Apathylowast too much data people revert back to concentrating on
individual pt carelowast Feel futility at times- moving the result takes effort and timelowast Remedy give the populationprevention tasks to others (RNs
+ data analysts midlevels dedicated to specific roles advanced MAs in conjunction with their team under protocols health coaches etc)
A1cLDLMAbcreatFoot examRetina screenALL medsASABP controlStatinCRC screenBreast Ca screenCervical Ca screenDepression screenAlcohol screenImmunizations due todaydeclinedTobacco usecounselling dueHIV done everVisit summary printed (MU)eRx sent (MU measure)
eCW Alerts app
lowast Donrsquot wait for the patient to show up- identify the needs and go get them
lowast New skillslowast Datadata analysislowast Prioritization of a lot of needlowast Proactive pt activationeducation for preventive care
lowast How financedlowast LIHP funding for population management and PCMHlowast Health Plan very little fundinglowast CHC payment model a handicap
lowast Best example CRC screenlowast Key finding team responsibility for screening and
monitoring (not JUST the MD)
Population Management
Organization Wide Trend
0
10
20
30
40
50
60
70
1 12 23 34 45 56 67 78 89 100 111
122
133
144
155
166
177
188
199
210
221
232
243
254
265
276
287
298
309
320
331
342
353
364
375
CRC screened
CRC screened
56 82015
lowast Partners KP C4 PASD LabCorp lowast Minimum funding from C4lowast LabCorp donated FIT tests
lowast Pt identified needing CRC screen lowast during visit via eCW alerts applowast proactively using registry
lowast FIT test givenlowast Tests tracked by Panel Managers
lowast Pt contacted if kit not returned in 2 wkslowast Results tracked monthly
lowast Reported to sites med staff QM BOD periodicallylowast Positive tests free colonoscopy by Kaiser via Project Access San Diegolowast Positive Biopsies
lowast Kaiser-donated surgery imaging specialty consultRx planlowast PASD arranges for donated oncology eval XRT if needed ChemoRx if
needed
Colorectal Cancer Screening Project
CRC-In reachlowast The daily huddle
In reachlowast Identifying Patients due for CRC Screening lowast eCW Alert app developed by Dr Kulin Tantod
Outreachlowast Identifying Patients due for CRC Screening lowast Data registry developed by Dr Kulin Tantod
Hypertension and Diabetes efforts at NHC
Neighborhood Healthcare ALLHeart Project
lowast Project Increase the number of ALLHEART patients on both medications lowast RN protocollowast MD education videolowast Added to alerts app if not on ACEARB amp Statinlowast Added to medical staff clinical measures dashboardlowast Monitoring overall performance monthlylowast ASCVD Risk Calculator embedded in alerts app with
hyperlink to reference
How are we doing BP Control UDS 77
82415
NHCCCC HTN Protocol
October 2013
How are we doing BP ControlDMALL
DM lt14090 83 (33293999)
HTN 77 (66938713)65 on 31614
DM gt50 on ACEARB + Statin75 on 10914 (24583269)70 on 31614
How are we doing BP ControlAs of 31014
How are we doing BP ControlAs of 2515
How are we doing DM BP control
lowast MDs are competitivelowast Data + supportmoving the curve
Getting Quality Data to the Medical Staff
NHC Physician- level Interactive Real Time Quality Detail- panel level detail
Individual real timeDetailed
Trending
Peer-normative
Actionable
On-demand Quality Data- Actionable Data
bull Click any column to generate recall list
bull All recall items identified- one-call hits all items
Outreachlowast Identifying Patients due for CRC Screening lowast Data registry developed by Dr Kulin Tantod
bull Panel Sizebull DM A1clt9 BP 14090 LDL lt100 bull HTN BP lt14090 ALL medsbull Ca screen colon breast cervicalbull Antipsych meds with A1c testbull PP and prenatal visit tielinessbull Childhood IMMIsbull Asthma on controllerbull etc
lowast Chronic disease management can be done in an underserved population requirementslowast Committed leadershiplowast Dedicated staff with a unifying purposelowast Validated and trusted data delivered when it is neededlowast Data analytics capabilitylowast Prioritization processlowast Leveraging community resourceslowast Engaged patientslowast Payment model to support activities outside typical
face-to-face visit
Summary
Key Concept- Data
Key Concept Teamwork + Transparency and Accountability
Key Concept- Innovation
Primary Care retinal photography
George Hayes CRR - Scripps Whittier Institute
Key Concept- Boldness
Key Concept- Team
Erika Bazan MA- Care Coordinator
Maria Acosta MA
Erica Cruz MA
Key Concept- Happy People
Chronic Disease Management in Underserved Populations- Mission Impossible
Audience Response
Evidence-based response
Slide Number 4
Chronic Disease Management in Underserved
Audience Response
Audience Response
Audience Response
Audience Response
Audience Response
Community Health Centers in San Diego County- the lsquoSafety Netrsquo
Local SD Payer Environment
Slide Number 13
CCC sites
Quality Work in CHCs
How does Quality happen in a CHC
Recent Council of Community Clinics Advances
Council of Community Clinics Tools
Council of Community Clinics
Slide Number 20
ALL HEART Clinics by County
ALL HEART Patients to Date
Slide Number 23
ALLHeart Results- QI Project CHCs
Slide Number 25
Slide Number 26
HYPERTENSION CONTROL DATA BY CLINIC ORGANIZATION-PopIq or individual reportsMeasurement Year March 31 2013 ndash February 28 2014N= 67241
Pop-IQ
PopIQ Data Analytics amp Data Aggregation
PopIQ Hypertension Blood Pressure lt 14090
PopIQ Blood Pressure lt 14090Diabetes
PopIQ DM Blood Pressure lt 14090
PopIQ Diabetics with HbA1c TestingHbA1c lt 7
Slide Number 34
What measures will be collecting for 2015-2016
Some measures will be stratified by age gender zip code in 2015-2016
Estimated 2014 Blood Pressure Control Rates by Quarter amp Group
Estimated 2014 Blood Pressure Control Rates by Quarter amp Insurance Type
Estimated 2014 Patients with Newly Controlled Blood Pressure by Quarter amp Insurance
Estimated 2014 Pts w Blood Pressure Control
Slide Number 41
Neighborhood Healthcare
Slide Number 43
NHC- Providing Quality Health Care Since 1969
Slide Number 45
Slide Number 46
Slide Number 47
Slide Number 48
Slide Number 49
Slide Number 50
CDM in Underserved- PCMH
How to get better population quality
How to get better population quality
NHC QM Efforts- Workflow changes
Workflow changes Pt flow redesign
Workflow changes Individual Reports- Huddles
How to get better population quality- Support Staff
How to get better population quality- Innovation
Innovation Project Dulce
Project Dulce Cost-Effectiveness
Slide Number 61
Innovation
How to get better population quality DATA
NHC Data Journey EMR
Data
Data- Grief Stages 6 and 7
Point-of-Service Data
Point-of-Service DataPre-visit PlanningProactive
eCW Alerts app
Population Management
Organization Wide Trend
Colorectal Cancer Screening Project
CRC-In reach
In reach
Outreach
Hypertension and Diabetes efforts at NHC
Neighborhood Healthcare ALLHeart Project
How are we doing BP Control UDS
NHCCCC HTN ProtocolOctober 2013
How are we doing BP ControlDMALL
How are we doing BP Control
How are we doing BP Control
How are we doing DM BP control
Getting Quality Data to the Medical Staff
NHC Physician- level Interactive Real Time Quality Detail- panel level detail
Key Concept Teamwork + Transparency and Accountability
Key Concept- Innovation
Key Concept- Boldness
Key Concept- Team
Key Concept- Happy People
Slide Number 97
43
lowast Private non-profit corporation licensed by CA DHSlowast Federally Qualified Health Center (lsquoFQHCrsquo lsquo330rsquo clinic)lowast Volunteer Board of Directors consumer representation lowast Discounted sliding fee scale for cash patients ($35)lowast Evening and Saturday hourslowast Employed MDs NPs and PAs dentists psychiatrists
psychologists psych NPs midwives 1 Chiropractorlowast Staff cultural competence reflects patient demographicslowast NCQA PCMH level 23lowast Limited specialty care no inpatient or SNF care
wwwnhcareorg
Neighborhood Healthcare
44
NHC- Providing Quality Health Care Since 1969
lowast Medical dental and behavioral health services to 65000 people annually in 245000 visits
lowast 450+ employees Annual Budget $48 million lowast 100 full and part time clinical staff licensedboard-
certified in family medicine internal medicine pediatrics geriatrics sports medicine psychology psychiatry geropsych general dentistry pediatric dentistry chiropractic and others
wwwnhcareorg
Neighborhood HealthcareFY 2016 Budget -- Revenue by Category
TOTAL REVENUE = $49676159(excludes revenue from capital)
Sliding Scale Patient Payments
15
Donations 07
Medi-Cal651
Medicare66
Private Insurance04
County State and Federal
Grants amp Contracts
163
Contract Rx Program
65
Other Income
24
Medi-Cal = 178Mgd Care Medi-Cal = 473
Medicare = 28Mgd Care Medicare = 38
Private Insurance 02Mgd Care Commercial 01
Mgd Care Covered CA $ 01
Neighborhood HealthcareFY 2016 ndash Patient Care Revenue
Medi-Cal 60377 = 217Mgd Care Medi-Cal 160205 = 576
Public Insurance 12435 = 45Grants amp Contracts 583 = 02
Neighborhood HealthcareExpenses ndash
Patient Care vs Administrative Support
Administrative Costs159
Fundraising 07
Direct Services834
34
58
67
79
69
75
98
53
61
0
20
40
60
80
100
1201 9 17 25 33 41 49 57 65 73 81 89 97 105
113
121
129
137
145
153
161
169
177
185
193
201
209
217
225
233
241
249
257
265
273
281
289
297
305
313
321
329
337
345
353
361
369
377
dm a1c gt9 DM LDL cont cvd ldl cont DM BP cont BP control
smokcess asthma on cont CRC screened mammo pap
Setting the Stage Quality CAN Happen
82115DM with BP lt 14090 83
HTN with BP lt 14090 77
ALL 66-75
DM with A1c gt 9 12
DM with A1c gt 9 or not done 22
Breast Ca screen 71Cervical Ca screen 74
Resources amp Policies
Community
DeliverySystemDesign
DecisionSupport
ClinicalInformation
Systems
Self-Management
Support
Health System
Health Care Organization
InformedActivated
Patient
PreparedProactive
Practice Team
ProductiveInteractions
Improved Outcomes
Chronic Care Model (CCM)
Slide from E Wagner 50
CDM in Underserved- PCMH
lowast Workflow changeslowast Adequate support staff (number quality training)lowast Innovation (NHC=lsquoMikeyrsquo)lowast Ruthless removal of lsquotasks below licensersquolowast Datalowast Crediblelowast Actionablelowast To the right peoplelowast At the right time
management program inception 2000lowast Dulce group medical apptslowast pain mgmt groups asthma groups
lowast Disparities collaborative (depression screen and rx)lowast BH integrationlowast EHR 2010lowast PCMH MUlowast AllHeart ALL (Kaiser grant through CCC)
lowast Roger Coleman and Associateslowast Eliminate unnecessary steps in workflow based on data and
lsquovalue-addedrsquo conceptlowast Patient-centered- bring services to the patient vs assembly-line
model (7-9 stops 4 stops)lowast Rapid cycle improvementPDSA model of rapid changelowast 2 MAs per fte MD or NPPAlowast Huddlespre-visit planninglowast Results
lowast Experimenting with Team= 1 MD 3 mids 7 MA RN Panel Managerlowast Innovationlowast Ruthless removal of lsquotasks below licensersquolowast Data
lowast Crediblelowast Actionablelowast To the right peoplelowast At the right time
How to get better population quality- Support Staff
lowast Workflow changeslowast Adequate support staff (number quality training)
lowast Innovationlowast And leveraging othersrsquo innovations
lowast Ruthless removal of lsquotasks below licensersquolowast Data
lowast Crediblelowast Actionablelowast To the right peoplelowast At the right time
How to get better population quality- Innovation
lowast RN CDE-led chronic disease management programlowast Key features
lowast Stared ~1999 with Dr NickECClowast RN-ledlowast BH availablelowast MDNPPA involvement on med changeslab interpretationexamlowast Self management skillslowast Patient education and activationlowast Care coordination (scheduling labs referrals PCP consultation
foot exams)lowast Proactive office encounter (huddles pre0visit planning)lowast Single stable point of contact (health coach) for the patient
Innovation Project Dulce
Project Dulce Cost-Effectiveness
Cost savings estimates for Dulce Model (~$QALY 2006 $)
Uninsured $10000
County Medical Services $25000
Medicaid $45000
Commercial $70000Health Services Research Health Research and Educational TrustDOI 101111j1475-6773200700701x
Analysis of the impact of group medical visits on clinical outcomes of Project Dulce patients with Diabetes HbA1c Results of August 2006 Enrollees with a group medical visit between 72000 to 62006
00
10
20
30
40
50
60
70
80
90
HbA1c Prior toDulce 11(n=78)
HbA1c Prior to GMV(n=78 plt0001)
HbA1c after 6months
(n=55 plt005)
HbA1c after 12months
(n=55 plt005)
HbA1c after 18months
(n=24 plt005)
HbA1c after 24months
(n=22 plt005)
87
7872 70 70 72
(n=24) (n=22)(n=55)(n=55)(n=78)(n=78)
Project Dulce Group Medical Visits Analysis of change in HbA1c over time
Pre-EMR
Innovation
Primary Care retinal photography
George Hayes CRR - Scripps Whittier Institute
lowast Workflow changeslowast Adequate support staff (number quality training)lowast Innovationlowast Ruthless removal of lsquotasks below licensersquo
lowastDatalowast Crediblelowast Actionablelowast To the right peoplelowast At the right time
How to get better population quality DATA
lowast 2010 implementation of eClinicalWorks (eCW)
lowast Data lag 1 year +lowast Validation period 1 year +lowast Registry functionlowast BridgeITlowast Home-grown registrylowast eCW alerts point-of-service data with low annoyance
quotientlowast i2i
NHC Data Journey EMR
lowast 5 stages of grief (Kubler-Ross)lowast Denial- lsquothe data are wrongrsquo lsquoitrsquos not my patientsrsquo
lowast Remedy only show good easily-verifiable datalowast Anger-rsquo damn you they arenrsquot my ptsrsquo lsquoI donrsquot practice cookbook
medicinersquo lowast Remedy only show good easily-verifiable data
lowast Bargaining- lsquo if I had some help on thisrsquo lsquomy pts are the sickest so of course my numbers are badrsquo lsquoI get all the new out-of-control ptsrsquolowast Remedy good data with good benchmarks- local and regionalnational
similar practices eg CHC vs CHClowast Depression-rsquo boy I really suckrsquo lsquomy system is set up to sabatoge mersquo lsquomy
MAs are no buenorsquolowast Remedy give tools and workflow changes that make doing the right thing
easy get help at appropriate license level donrsquot penalize right away for poor performance
lowast Acceptance-rsquo ok how do we make it betterrsquo lsquoMAs letrsquos be the top by the end of the monthrsquolowast Remedy- more of the above continued emphasis emphasize saving lives
and preventing morbidity (and cost in some systems)
Data
lowast Data overload-lowast providers burn out trying to be 1 in everything drive their
team crazy start focusing on the numbers over actual clinical quality start pt dumpingcherry picking
lowast Remedy only emphasize a few things at a time reward for one or two priority areas reward whole team
lowast Apathylowast too much data people revert back to concentrating on
individual pt carelowast Feel futility at times- moving the result takes effort and timelowast Remedy give the populationprevention tasks to others (RNs
+ data analysts midlevels dedicated to specific roles advanced MAs in conjunction with their team under protocols health coaches etc)
A1cLDLMAbcreatFoot examRetina screenALL medsASABP controlStatinCRC screenBreast Ca screenCervical Ca screenDepression screenAlcohol screenImmunizations due todaydeclinedTobacco usecounselling dueHIV done everVisit summary printed (MU)eRx sent (MU measure)
eCW Alerts app
lowast Donrsquot wait for the patient to show up- identify the needs and go get them
lowast New skillslowast Datadata analysislowast Prioritization of a lot of needlowast Proactive pt activationeducation for preventive care
lowast How financedlowast LIHP funding for population management and PCMHlowast Health Plan very little fundinglowast CHC payment model a handicap
lowast Best example CRC screenlowast Key finding team responsibility for screening and
monitoring (not JUST the MD)
Population Management
Organization Wide Trend
0
10
20
30
40
50
60
70
1 12 23 34 45 56 67 78 89 100 111
122
133
144
155
166
177
188
199
210
221
232
243
254
265
276
287
298
309
320
331
342
353
364
375
CRC screened
CRC screened
56 82015
lowast Partners KP C4 PASD LabCorp lowast Minimum funding from C4lowast LabCorp donated FIT tests
lowast Pt identified needing CRC screen lowast during visit via eCW alerts applowast proactively using registry
lowast FIT test givenlowast Tests tracked by Panel Managers
lowast Pt contacted if kit not returned in 2 wkslowast Results tracked monthly
lowast Reported to sites med staff QM BOD periodicallylowast Positive tests free colonoscopy by Kaiser via Project Access San Diegolowast Positive Biopsies
lowast Kaiser-donated surgery imaging specialty consultRx planlowast PASD arranges for donated oncology eval XRT if needed ChemoRx if
needed
Colorectal Cancer Screening Project
CRC-In reachlowast The daily huddle
In reachlowast Identifying Patients due for CRC Screening lowast eCW Alert app developed by Dr Kulin Tantod
Outreachlowast Identifying Patients due for CRC Screening lowast Data registry developed by Dr Kulin Tantod
Hypertension and Diabetes efforts at NHC
Neighborhood Healthcare ALLHeart Project
lowast Project Increase the number of ALLHEART patients on both medications lowast RN protocollowast MD education videolowast Added to alerts app if not on ACEARB amp Statinlowast Added to medical staff clinical measures dashboardlowast Monitoring overall performance monthlylowast ASCVD Risk Calculator embedded in alerts app with
hyperlink to reference
How are we doing BP Control UDS 77
82415
NHCCCC HTN Protocol
October 2013
How are we doing BP ControlDMALL
DM lt14090 83 (33293999)
HTN 77 (66938713)65 on 31614
DM gt50 on ACEARB + Statin75 on 10914 (24583269)70 on 31614
How are we doing BP ControlAs of 31014
How are we doing BP ControlAs of 2515
How are we doing DM BP control
lowast MDs are competitivelowast Data + supportmoving the curve
Getting Quality Data to the Medical Staff
NHC Physician- level Interactive Real Time Quality Detail- panel level detail
Individual real timeDetailed
Trending
Peer-normative
Actionable
On-demand Quality Data- Actionable Data
bull Click any column to generate recall list
bull All recall items identified- one-call hits all items
Outreachlowast Identifying Patients due for CRC Screening lowast Data registry developed by Dr Kulin Tantod
bull Panel Sizebull DM A1clt9 BP 14090 LDL lt100 bull HTN BP lt14090 ALL medsbull Ca screen colon breast cervicalbull Antipsych meds with A1c testbull PP and prenatal visit tielinessbull Childhood IMMIsbull Asthma on controllerbull etc
lowast Chronic disease management can be done in an underserved population requirementslowast Committed leadershiplowast Dedicated staff with a unifying purposelowast Validated and trusted data delivered when it is neededlowast Data analytics capabilitylowast Prioritization processlowast Leveraging community resourceslowast Engaged patientslowast Payment model to support activities outside typical
face-to-face visit
Summary
Key Concept- Data
Key Concept Teamwork + Transparency and Accountability
Key Concept- Innovation
Primary Care retinal photography
George Hayes CRR - Scripps Whittier Institute
Key Concept- Boldness
Key Concept- Team
Erika Bazan MA- Care Coordinator
Maria Acosta MA
Erica Cruz MA
Key Concept- Happy People
Chronic Disease Management in Underserved Populations- Mission Impossible
Audience Response
Evidence-based response
Slide Number 4
Chronic Disease Management in Underserved
Audience Response
Audience Response
Audience Response
Audience Response
Audience Response
Community Health Centers in San Diego County- the lsquoSafety Netrsquo
Local SD Payer Environment
Slide Number 13
CCC sites
Quality Work in CHCs
How does Quality happen in a CHC
Recent Council of Community Clinics Advances
Council of Community Clinics Tools
Council of Community Clinics
Slide Number 20
ALL HEART Clinics by County
ALL HEART Patients to Date
Slide Number 23
ALLHeart Results- QI Project CHCs
Slide Number 25
Slide Number 26
HYPERTENSION CONTROL DATA BY CLINIC ORGANIZATION-PopIq or individual reportsMeasurement Year March 31 2013 ndash February 28 2014N= 67241
Pop-IQ
PopIQ Data Analytics amp Data Aggregation
PopIQ Hypertension Blood Pressure lt 14090
PopIQ Blood Pressure lt 14090Diabetes
PopIQ DM Blood Pressure lt 14090
PopIQ Diabetics with HbA1c TestingHbA1c lt 7
Slide Number 34
What measures will be collecting for 2015-2016
Some measures will be stratified by age gender zip code in 2015-2016
Estimated 2014 Blood Pressure Control Rates by Quarter amp Group
Estimated 2014 Blood Pressure Control Rates by Quarter amp Insurance Type
Estimated 2014 Patients with Newly Controlled Blood Pressure by Quarter amp Insurance
Estimated 2014 Pts w Blood Pressure Control
Slide Number 41
Neighborhood Healthcare
Slide Number 43
NHC- Providing Quality Health Care Since 1969
Slide Number 45
Slide Number 46
Slide Number 47
Slide Number 48
Slide Number 49
Slide Number 50
CDM in Underserved- PCMH
How to get better population quality
How to get better population quality
NHC QM Efforts- Workflow changes
Workflow changes Pt flow redesign
Workflow changes Individual Reports- Huddles
How to get better population quality- Support Staff
How to get better population quality- Innovation
Innovation Project Dulce
Project Dulce Cost-Effectiveness
Slide Number 61
Innovation
How to get better population quality DATA
NHC Data Journey EMR
Data
Data- Grief Stages 6 and 7
Point-of-Service Data
Point-of-Service DataPre-visit PlanningProactive
eCW Alerts app
Population Management
Organization Wide Trend
Colorectal Cancer Screening Project
CRC-In reach
In reach
Outreach
Hypertension and Diabetes efforts at NHC
Neighborhood Healthcare ALLHeart Project
How are we doing BP Control UDS
NHCCCC HTN ProtocolOctober 2013
How are we doing BP ControlDMALL
How are we doing BP Control
How are we doing BP Control
How are we doing DM BP control
Getting Quality Data to the Medical Staff
NHC Physician- level Interactive Real Time Quality Detail- panel level detail
Key Concept Teamwork + Transparency and Accountability
Key Concept- Innovation
Key Concept- Boldness
Key Concept- Team
Key Concept- Happy People
Slide Number 97
44
NHC- Providing Quality Health Care Since 1969
lowast Medical dental and behavioral health services to 65000 people annually in 245000 visits
lowast 450+ employees Annual Budget $48 million lowast 100 full and part time clinical staff licensedboard-
certified in family medicine internal medicine pediatrics geriatrics sports medicine psychology psychiatry geropsych general dentistry pediatric dentistry chiropractic and others
wwwnhcareorg
Neighborhood HealthcareFY 2016 Budget -- Revenue by Category
TOTAL REVENUE = $49676159(excludes revenue from capital)
Sliding Scale Patient Payments
15
Donations 07
Medi-Cal651
Medicare66
Private Insurance04
County State and Federal
Grants amp Contracts
163
Contract Rx Program
65
Other Income
24
Medi-Cal = 178Mgd Care Medi-Cal = 473
Medicare = 28Mgd Care Medicare = 38
Private Insurance 02Mgd Care Commercial 01
Mgd Care Covered CA $ 01
Neighborhood HealthcareFY 2016 ndash Patient Care Revenue
Medi-Cal 60377 = 217Mgd Care Medi-Cal 160205 = 576
Public Insurance 12435 = 45Grants amp Contracts 583 = 02
Neighborhood HealthcareExpenses ndash
Patient Care vs Administrative Support
Administrative Costs159
Fundraising 07
Direct Services834
34
58
67
79
69
75
98
53
61
0
20
40
60
80
100
1201 9 17 25 33 41 49 57 65 73 81 89 97 105
113
121
129
137
145
153
161
169
177
185
193
201
209
217
225
233
241
249
257
265
273
281
289
297
305
313
321
329
337
345
353
361
369
377
dm a1c gt9 DM LDL cont cvd ldl cont DM BP cont BP control
smokcess asthma on cont CRC screened mammo pap
Setting the Stage Quality CAN Happen
82115DM with BP lt 14090 83
HTN with BP lt 14090 77
ALL 66-75
DM with A1c gt 9 12
DM with A1c gt 9 or not done 22
Breast Ca screen 71Cervical Ca screen 74
Resources amp Policies
Community
DeliverySystemDesign
DecisionSupport
ClinicalInformation
Systems
Self-Management
Support
Health System
Health Care Organization
InformedActivated
Patient
PreparedProactive
Practice Team
ProductiveInteractions
Improved Outcomes
Chronic Care Model (CCM)
Slide from E Wagner 50
CDM in Underserved- PCMH
lowast Workflow changeslowast Adequate support staff (number quality training)lowast Innovation (NHC=lsquoMikeyrsquo)lowast Ruthless removal of lsquotasks below licensersquolowast Datalowast Crediblelowast Actionablelowast To the right peoplelowast At the right time
management program inception 2000lowast Dulce group medical apptslowast pain mgmt groups asthma groups
lowast Disparities collaborative (depression screen and rx)lowast BH integrationlowast EHR 2010lowast PCMH MUlowast AllHeart ALL (Kaiser grant through CCC)
lowast Roger Coleman and Associateslowast Eliminate unnecessary steps in workflow based on data and
lsquovalue-addedrsquo conceptlowast Patient-centered- bring services to the patient vs assembly-line
model (7-9 stops 4 stops)lowast Rapid cycle improvementPDSA model of rapid changelowast 2 MAs per fte MD or NPPAlowast Huddlespre-visit planninglowast Results
lowast Experimenting with Team= 1 MD 3 mids 7 MA RN Panel Managerlowast Innovationlowast Ruthless removal of lsquotasks below licensersquolowast Data
lowast Crediblelowast Actionablelowast To the right peoplelowast At the right time
How to get better population quality- Support Staff
lowast Workflow changeslowast Adequate support staff (number quality training)
lowast Innovationlowast And leveraging othersrsquo innovations
lowast Ruthless removal of lsquotasks below licensersquolowast Data
lowast Crediblelowast Actionablelowast To the right peoplelowast At the right time
How to get better population quality- Innovation
lowast RN CDE-led chronic disease management programlowast Key features
lowast Stared ~1999 with Dr NickECClowast RN-ledlowast BH availablelowast MDNPPA involvement on med changeslab interpretationexamlowast Self management skillslowast Patient education and activationlowast Care coordination (scheduling labs referrals PCP consultation
foot exams)lowast Proactive office encounter (huddles pre0visit planning)lowast Single stable point of contact (health coach) for the patient
Innovation Project Dulce
Project Dulce Cost-Effectiveness
Cost savings estimates for Dulce Model (~$QALY 2006 $)
Uninsured $10000
County Medical Services $25000
Medicaid $45000
Commercial $70000Health Services Research Health Research and Educational TrustDOI 101111j1475-6773200700701x
Analysis of the impact of group medical visits on clinical outcomes of Project Dulce patients with Diabetes HbA1c Results of August 2006 Enrollees with a group medical visit between 72000 to 62006
00
10
20
30
40
50
60
70
80
90
HbA1c Prior toDulce 11(n=78)
HbA1c Prior to GMV(n=78 plt0001)
HbA1c after 6months
(n=55 plt005)
HbA1c after 12months
(n=55 plt005)
HbA1c after 18months
(n=24 plt005)
HbA1c after 24months
(n=22 plt005)
87
7872 70 70 72
(n=24) (n=22)(n=55)(n=55)(n=78)(n=78)
Project Dulce Group Medical Visits Analysis of change in HbA1c over time
Pre-EMR
Innovation
Primary Care retinal photography
George Hayes CRR - Scripps Whittier Institute
lowast Workflow changeslowast Adequate support staff (number quality training)lowast Innovationlowast Ruthless removal of lsquotasks below licensersquo
lowastDatalowast Crediblelowast Actionablelowast To the right peoplelowast At the right time
How to get better population quality DATA
lowast 2010 implementation of eClinicalWorks (eCW)
lowast Data lag 1 year +lowast Validation period 1 year +lowast Registry functionlowast BridgeITlowast Home-grown registrylowast eCW alerts point-of-service data with low annoyance
quotientlowast i2i
NHC Data Journey EMR
lowast 5 stages of grief (Kubler-Ross)lowast Denial- lsquothe data are wrongrsquo lsquoitrsquos not my patientsrsquo
lowast Remedy only show good easily-verifiable datalowast Anger-rsquo damn you they arenrsquot my ptsrsquo lsquoI donrsquot practice cookbook
medicinersquo lowast Remedy only show good easily-verifiable data
lowast Bargaining- lsquo if I had some help on thisrsquo lsquomy pts are the sickest so of course my numbers are badrsquo lsquoI get all the new out-of-control ptsrsquolowast Remedy good data with good benchmarks- local and regionalnational
similar practices eg CHC vs CHClowast Depression-rsquo boy I really suckrsquo lsquomy system is set up to sabatoge mersquo lsquomy
MAs are no buenorsquolowast Remedy give tools and workflow changes that make doing the right thing
easy get help at appropriate license level donrsquot penalize right away for poor performance
lowast Acceptance-rsquo ok how do we make it betterrsquo lsquoMAs letrsquos be the top by the end of the monthrsquolowast Remedy- more of the above continued emphasis emphasize saving lives
and preventing morbidity (and cost in some systems)
Data
lowast Data overload-lowast providers burn out trying to be 1 in everything drive their
team crazy start focusing on the numbers over actual clinical quality start pt dumpingcherry picking
lowast Remedy only emphasize a few things at a time reward for one or two priority areas reward whole team
lowast Apathylowast too much data people revert back to concentrating on
individual pt carelowast Feel futility at times- moving the result takes effort and timelowast Remedy give the populationprevention tasks to others (RNs
+ data analysts midlevels dedicated to specific roles advanced MAs in conjunction with their team under protocols health coaches etc)
A1cLDLMAbcreatFoot examRetina screenALL medsASABP controlStatinCRC screenBreast Ca screenCervical Ca screenDepression screenAlcohol screenImmunizations due todaydeclinedTobacco usecounselling dueHIV done everVisit summary printed (MU)eRx sent (MU measure)
eCW Alerts app
lowast Donrsquot wait for the patient to show up- identify the needs and go get them
lowast New skillslowast Datadata analysislowast Prioritization of a lot of needlowast Proactive pt activationeducation for preventive care
lowast How financedlowast LIHP funding for population management and PCMHlowast Health Plan very little fundinglowast CHC payment model a handicap
lowast Best example CRC screenlowast Key finding team responsibility for screening and
monitoring (not JUST the MD)
Population Management
Organization Wide Trend
0
10
20
30
40
50
60
70
1 12 23 34 45 56 67 78 89 100 111
122
133
144
155
166
177
188
199
210
221
232
243
254
265
276
287
298
309
320
331
342
353
364
375
CRC screened
CRC screened
56 82015
lowast Partners KP C4 PASD LabCorp lowast Minimum funding from C4lowast LabCorp donated FIT tests
lowast Pt identified needing CRC screen lowast during visit via eCW alerts applowast proactively using registry
lowast FIT test givenlowast Tests tracked by Panel Managers
lowast Pt contacted if kit not returned in 2 wkslowast Results tracked monthly
lowast Reported to sites med staff QM BOD periodicallylowast Positive tests free colonoscopy by Kaiser via Project Access San Diegolowast Positive Biopsies
lowast Kaiser-donated surgery imaging specialty consultRx planlowast PASD arranges for donated oncology eval XRT if needed ChemoRx if
needed
Colorectal Cancer Screening Project
CRC-In reachlowast The daily huddle
In reachlowast Identifying Patients due for CRC Screening lowast eCW Alert app developed by Dr Kulin Tantod
Outreachlowast Identifying Patients due for CRC Screening lowast Data registry developed by Dr Kulin Tantod
Hypertension and Diabetes efforts at NHC
Neighborhood Healthcare ALLHeart Project
lowast Project Increase the number of ALLHEART patients on both medications lowast RN protocollowast MD education videolowast Added to alerts app if not on ACEARB amp Statinlowast Added to medical staff clinical measures dashboardlowast Monitoring overall performance monthlylowast ASCVD Risk Calculator embedded in alerts app with
hyperlink to reference
How are we doing BP Control UDS 77
82415
NHCCCC HTN Protocol
October 2013
How are we doing BP ControlDMALL
DM lt14090 83 (33293999)
HTN 77 (66938713)65 on 31614
DM gt50 on ACEARB + Statin75 on 10914 (24583269)70 on 31614
How are we doing BP ControlAs of 31014
How are we doing BP ControlAs of 2515
How are we doing DM BP control
lowast MDs are competitivelowast Data + supportmoving the curve
Getting Quality Data to the Medical Staff
NHC Physician- level Interactive Real Time Quality Detail- panel level detail
Individual real timeDetailed
Trending
Peer-normative
Actionable
On-demand Quality Data- Actionable Data
bull Click any column to generate recall list
bull All recall items identified- one-call hits all items
Outreachlowast Identifying Patients due for CRC Screening lowast Data registry developed by Dr Kulin Tantod
bull Panel Sizebull DM A1clt9 BP 14090 LDL lt100 bull HTN BP lt14090 ALL medsbull Ca screen colon breast cervicalbull Antipsych meds with A1c testbull PP and prenatal visit tielinessbull Childhood IMMIsbull Asthma on controllerbull etc
lowast Chronic disease management can be done in an underserved population requirementslowast Committed leadershiplowast Dedicated staff with a unifying purposelowast Validated and trusted data delivered when it is neededlowast Data analytics capabilitylowast Prioritization processlowast Leveraging community resourceslowast Engaged patientslowast Payment model to support activities outside typical
face-to-face visit
Summary
Key Concept- Data
Key Concept Teamwork + Transparency and Accountability
Key Concept- Innovation
Primary Care retinal photography
George Hayes CRR - Scripps Whittier Institute
Key Concept- Boldness
Key Concept- Team
Erika Bazan MA- Care Coordinator
Maria Acosta MA
Erica Cruz MA
Key Concept- Happy People
Chronic Disease Management in Underserved Populations- Mission Impossible
Audience Response
Evidence-based response
Slide Number 4
Chronic Disease Management in Underserved
Audience Response
Audience Response
Audience Response
Audience Response
Audience Response
Community Health Centers in San Diego County- the lsquoSafety Netrsquo
Local SD Payer Environment
Slide Number 13
CCC sites
Quality Work in CHCs
How does Quality happen in a CHC
Recent Council of Community Clinics Advances
Council of Community Clinics Tools
Council of Community Clinics
Slide Number 20
ALL HEART Clinics by County
ALL HEART Patients to Date
Slide Number 23
ALLHeart Results- QI Project CHCs
Slide Number 25
Slide Number 26
HYPERTENSION CONTROL DATA BY CLINIC ORGANIZATION-PopIq or individual reportsMeasurement Year March 31 2013 ndash February 28 2014N= 67241
Pop-IQ
PopIQ Data Analytics amp Data Aggregation
PopIQ Hypertension Blood Pressure lt 14090
PopIQ Blood Pressure lt 14090Diabetes
PopIQ DM Blood Pressure lt 14090
PopIQ Diabetics with HbA1c TestingHbA1c lt 7
Slide Number 34
What measures will be collecting for 2015-2016
Some measures will be stratified by age gender zip code in 2015-2016
Estimated 2014 Blood Pressure Control Rates by Quarter amp Group
Estimated 2014 Blood Pressure Control Rates by Quarter amp Insurance Type
Estimated 2014 Patients with Newly Controlled Blood Pressure by Quarter amp Insurance
Estimated 2014 Pts w Blood Pressure Control
Slide Number 41
Neighborhood Healthcare
Slide Number 43
NHC- Providing Quality Health Care Since 1969
Slide Number 45
Slide Number 46
Slide Number 47
Slide Number 48
Slide Number 49
Slide Number 50
CDM in Underserved- PCMH
How to get better population quality
How to get better population quality
NHC QM Efforts- Workflow changes
Workflow changes Pt flow redesign
Workflow changes Individual Reports- Huddles
How to get better population quality- Support Staff
How to get better population quality- Innovation
Innovation Project Dulce
Project Dulce Cost-Effectiveness
Slide Number 61
Innovation
How to get better population quality DATA
NHC Data Journey EMR
Data
Data- Grief Stages 6 and 7
Point-of-Service Data
Point-of-Service DataPre-visit PlanningProactive
eCW Alerts app
Population Management
Organization Wide Trend
Colorectal Cancer Screening Project
CRC-In reach
In reach
Outreach
Hypertension and Diabetes efforts at NHC
Neighborhood Healthcare ALLHeart Project
How are we doing BP Control UDS
NHCCCC HTN ProtocolOctober 2013
How are we doing BP ControlDMALL
How are we doing BP Control
How are we doing BP Control
How are we doing DM BP control
Getting Quality Data to the Medical Staff
NHC Physician- level Interactive Real Time Quality Detail- panel level detail
Key Concept Teamwork + Transparency and Accountability
Key Concept- Innovation
Key Concept- Boldness
Key Concept- Team
Key Concept- Happy People
Slide Number 97
CDM in Underserved- PCMH
lowast Workflow changeslowast Adequate support staff (number quality training)lowast Innovation (NHC=lsquoMikeyrsquo)lowast Ruthless removal of lsquotasks below licensersquolowast Datalowast Crediblelowast Actionablelowast To the right peoplelowast At the right time
management program inception 2000lowast Dulce group medical apptslowast pain mgmt groups asthma groups
lowast Disparities collaborative (depression screen and rx)lowast BH integrationlowast EHR 2010lowast PCMH MUlowast AllHeart ALL (Kaiser grant through CCC)
lowast Roger Coleman and Associateslowast Eliminate unnecessary steps in workflow based on data and
lsquovalue-addedrsquo conceptlowast Patient-centered- bring services to the patient vs assembly-line
model (7-9 stops 4 stops)lowast Rapid cycle improvementPDSA model of rapid changelowast 2 MAs per fte MD or NPPAlowast Huddlespre-visit planninglowast Results
lowast Experimenting with Team= 1 MD 3 mids 7 MA RN Panel Managerlowast Innovationlowast Ruthless removal of lsquotasks below licensersquolowast Data
lowast Crediblelowast Actionablelowast To the right peoplelowast At the right time
How to get better population quality- Support Staff
lowast Workflow changeslowast Adequate support staff (number quality training)
lowast Innovationlowast And leveraging othersrsquo innovations
lowast Ruthless removal of lsquotasks below licensersquolowast Data
lowast Crediblelowast Actionablelowast To the right peoplelowast At the right time
How to get better population quality- Innovation
lowast RN CDE-led chronic disease management programlowast Key features
lowast Stared ~1999 with Dr NickECClowast RN-ledlowast BH availablelowast MDNPPA involvement on med changeslab interpretationexamlowast Self management skillslowast Patient education and activationlowast Care coordination (scheduling labs referrals PCP consultation
foot exams)lowast Proactive office encounter (huddles pre0visit planning)lowast Single stable point of contact (health coach) for the patient
Innovation Project Dulce
Project Dulce Cost-Effectiveness
Cost savings estimates for Dulce Model (~$QALY 2006 $)
Uninsured $10000
County Medical Services $25000
Medicaid $45000
Commercial $70000Health Services Research Health Research and Educational TrustDOI 101111j1475-6773200700701x
Analysis of the impact of group medical visits on clinical outcomes of Project Dulce patients with Diabetes HbA1c Results of August 2006 Enrollees with a group medical visit between 72000 to 62006
00
10
20
30
40
50
60
70
80
90
HbA1c Prior toDulce 11(n=78)
HbA1c Prior to GMV(n=78 plt0001)
HbA1c after 6months
(n=55 plt005)
HbA1c after 12months
(n=55 plt005)
HbA1c after 18months
(n=24 plt005)
HbA1c after 24months
(n=22 plt005)
87
7872 70 70 72
(n=24) (n=22)(n=55)(n=55)(n=78)(n=78)
Project Dulce Group Medical Visits Analysis of change in HbA1c over time
Pre-EMR
Innovation
Primary Care retinal photography
George Hayes CRR - Scripps Whittier Institute
lowast Workflow changeslowast Adequate support staff (number quality training)lowast Innovationlowast Ruthless removal of lsquotasks below licensersquo
lowastDatalowast Crediblelowast Actionablelowast To the right peoplelowast At the right time
How to get better population quality DATA
lowast 2010 implementation of eClinicalWorks (eCW)
lowast Data lag 1 year +lowast Validation period 1 year +lowast Registry functionlowast BridgeITlowast Home-grown registrylowast eCW alerts point-of-service data with low annoyance
quotientlowast i2i
NHC Data Journey EMR
lowast 5 stages of grief (Kubler-Ross)lowast Denial- lsquothe data are wrongrsquo lsquoitrsquos not my patientsrsquo
lowast Remedy only show good easily-verifiable datalowast Anger-rsquo damn you they arenrsquot my ptsrsquo lsquoI donrsquot practice cookbook
medicinersquo lowast Remedy only show good easily-verifiable data
lowast Bargaining- lsquo if I had some help on thisrsquo lsquomy pts are the sickest so of course my numbers are badrsquo lsquoI get all the new out-of-control ptsrsquolowast Remedy good data with good benchmarks- local and regionalnational
similar practices eg CHC vs CHClowast Depression-rsquo boy I really suckrsquo lsquomy system is set up to sabatoge mersquo lsquomy
MAs are no buenorsquolowast Remedy give tools and workflow changes that make doing the right thing
easy get help at appropriate license level donrsquot penalize right away for poor performance
lowast Acceptance-rsquo ok how do we make it betterrsquo lsquoMAs letrsquos be the top by the end of the monthrsquolowast Remedy- more of the above continued emphasis emphasize saving lives
and preventing morbidity (and cost in some systems)
Data
lowast Data overload-lowast providers burn out trying to be 1 in everything drive their
team crazy start focusing on the numbers over actual clinical quality start pt dumpingcherry picking
lowast Remedy only emphasize a few things at a time reward for one or two priority areas reward whole team
lowast Apathylowast too much data people revert back to concentrating on
individual pt carelowast Feel futility at times- moving the result takes effort and timelowast Remedy give the populationprevention tasks to others (RNs
+ data analysts midlevels dedicated to specific roles advanced MAs in conjunction with their team under protocols health coaches etc)
A1cLDLMAbcreatFoot examRetina screenALL medsASABP controlStatinCRC screenBreast Ca screenCervical Ca screenDepression screenAlcohol screenImmunizations due todaydeclinedTobacco usecounselling dueHIV done everVisit summary printed (MU)eRx sent (MU measure)
eCW Alerts app
lowast Donrsquot wait for the patient to show up- identify the needs and go get them
lowast New skillslowast Datadata analysislowast Prioritization of a lot of needlowast Proactive pt activationeducation for preventive care
lowast How financedlowast LIHP funding for population management and PCMHlowast Health Plan very little fundinglowast CHC payment model a handicap
lowast Best example CRC screenlowast Key finding team responsibility for screening and
monitoring (not JUST the MD)
Population Management
Organization Wide Trend
0
10
20
30
40
50
60
70
1 12 23 34 45 56 67 78 89 100 111
122
133
144
155
166
177
188
199
210
221
232
243
254
265
276
287
298
309
320
331
342
353
364
375
CRC screened
CRC screened
56 82015
lowast Partners KP C4 PASD LabCorp lowast Minimum funding from C4lowast LabCorp donated FIT tests
lowast Pt identified needing CRC screen lowast during visit via eCW alerts applowast proactively using registry
lowast FIT test givenlowast Tests tracked by Panel Managers
lowast Pt contacted if kit not returned in 2 wkslowast Results tracked monthly
lowast Reported to sites med staff QM BOD periodicallylowast Positive tests free colonoscopy by Kaiser via Project Access San Diegolowast Positive Biopsies
lowast Kaiser-donated surgery imaging specialty consultRx planlowast PASD arranges for donated oncology eval XRT if needed ChemoRx if
needed
Colorectal Cancer Screening Project
CRC-In reachlowast The daily huddle
In reachlowast Identifying Patients due for CRC Screening lowast eCW Alert app developed by Dr Kulin Tantod
Outreachlowast Identifying Patients due for CRC Screening lowast Data registry developed by Dr Kulin Tantod
Hypertension and Diabetes efforts at NHC
Neighborhood Healthcare ALLHeart Project
lowast Project Increase the number of ALLHEART patients on both medications lowast RN protocollowast MD education videolowast Added to alerts app if not on ACEARB amp Statinlowast Added to medical staff clinical measures dashboardlowast Monitoring overall performance monthlylowast ASCVD Risk Calculator embedded in alerts app with
hyperlink to reference
How are we doing BP Control UDS 77
82415
NHCCCC HTN Protocol
October 2013
How are we doing BP ControlDMALL
DM lt14090 83 (33293999)
HTN 77 (66938713)65 on 31614
DM gt50 on ACEARB + Statin75 on 10914 (24583269)70 on 31614
How are we doing BP ControlAs of 31014
How are we doing BP ControlAs of 2515
How are we doing DM BP control
lowast MDs are competitivelowast Data + supportmoving the curve
Getting Quality Data to the Medical Staff
NHC Physician- level Interactive Real Time Quality Detail- panel level detail
Individual real timeDetailed
Trending
Peer-normative
Actionable
On-demand Quality Data- Actionable Data
bull Click any column to generate recall list
bull All recall items identified- one-call hits all items
Outreachlowast Identifying Patients due for CRC Screening lowast Data registry developed by Dr Kulin Tantod
bull Panel Sizebull DM A1clt9 BP 14090 LDL lt100 bull HTN BP lt14090 ALL medsbull Ca screen colon breast cervicalbull Antipsych meds with A1c testbull PP and prenatal visit tielinessbull Childhood IMMIsbull Asthma on controllerbull etc
lowast Chronic disease management can be done in an underserved population requirementslowast Committed leadershiplowast Dedicated staff with a unifying purposelowast Validated and trusted data delivered when it is neededlowast Data analytics capabilitylowast Prioritization processlowast Leveraging community resourceslowast Engaged patientslowast Payment model to support activities outside typical
face-to-face visit
Summary
Key Concept- Data
Key Concept Teamwork + Transparency and Accountability
Key Concept- Innovation
Primary Care retinal photography
George Hayes CRR - Scripps Whittier Institute
Key Concept- Boldness
Key Concept- Team
Erika Bazan MA- Care Coordinator
Maria Acosta MA
Erica Cruz MA
Key Concept- Happy People
Chronic Disease Management in Underserved Populations- Mission Impossible
Audience Response
Evidence-based response
Slide Number 4
Chronic Disease Management in Underserved
Audience Response
Audience Response
Audience Response
Audience Response
Audience Response
Community Health Centers in San Diego County- the lsquoSafety Netrsquo
Local SD Payer Environment
Slide Number 13
CCC sites
Quality Work in CHCs
How does Quality happen in a CHC
Recent Council of Community Clinics Advances
Council of Community Clinics Tools
Council of Community Clinics
Slide Number 20
ALL HEART Clinics by County
ALL HEART Patients to Date
Slide Number 23
ALLHeart Results- QI Project CHCs
Slide Number 25
Slide Number 26
HYPERTENSION CONTROL DATA BY CLINIC ORGANIZATION-PopIq or individual reportsMeasurement Year March 31 2013 ndash February 28 2014N= 67241
Pop-IQ
PopIQ Data Analytics amp Data Aggregation
PopIQ Hypertension Blood Pressure lt 14090
PopIQ Blood Pressure lt 14090Diabetes
PopIQ DM Blood Pressure lt 14090
PopIQ Diabetics with HbA1c TestingHbA1c lt 7
Slide Number 34
What measures will be collecting for 2015-2016
Some measures will be stratified by age gender zip code in 2015-2016
Estimated 2014 Blood Pressure Control Rates by Quarter amp Group
Estimated 2014 Blood Pressure Control Rates by Quarter amp Insurance Type
Estimated 2014 Patients with Newly Controlled Blood Pressure by Quarter amp Insurance
Estimated 2014 Pts w Blood Pressure Control
Slide Number 41
Neighborhood Healthcare
Slide Number 43
NHC- Providing Quality Health Care Since 1969
Slide Number 45
Slide Number 46
Slide Number 47
Slide Number 48
Slide Number 49
Slide Number 50
CDM in Underserved- PCMH
How to get better population quality
How to get better population quality
NHC QM Efforts- Workflow changes
Workflow changes Pt flow redesign
Workflow changes Individual Reports- Huddles
How to get better population quality- Support Staff
How to get better population quality- Innovation
Innovation Project Dulce
Project Dulce Cost-Effectiveness
Slide Number 61
Innovation
How to get better population quality DATA
NHC Data Journey EMR
Data
Data- Grief Stages 6 and 7
Point-of-Service Data
Point-of-Service DataPre-visit PlanningProactive
eCW Alerts app
Population Management
Organization Wide Trend
Colorectal Cancer Screening Project
CRC-In reach
In reach
Outreach
Hypertension and Diabetes efforts at NHC
Neighborhood Healthcare ALLHeart Project
How are we doing BP Control UDS
NHCCCC HTN ProtocolOctober 2013
How are we doing BP ControlDMALL
How are we doing BP Control
How are we doing BP Control
How are we doing DM BP control
Getting Quality Data to the Medical Staff
NHC Physician- level Interactive Real Time Quality Detail- panel level detail
Key Concept Teamwork + Transparency and Accountability
Key Concept- Innovation
Key Concept- Boldness
Key Concept- Team
Key Concept- Happy People
Slide Number 97
lowast Workflow changeslowast Adequate support staff (number quality training)lowast Innovation (NHC=lsquoMikeyrsquo)lowast Ruthless removal of lsquotasks below licensersquolowast Datalowast Crediblelowast Actionablelowast To the right peoplelowast At the right time
management program inception 2000lowast Dulce group medical apptslowast pain mgmt groups asthma groups
lowast Disparities collaborative (depression screen and rx)lowast BH integrationlowast EHR 2010lowast PCMH MUlowast AllHeart ALL (Kaiser grant through CCC)
lowast Roger Coleman and Associateslowast Eliminate unnecessary steps in workflow based on data and
lsquovalue-addedrsquo conceptlowast Patient-centered- bring services to the patient vs assembly-line
model (7-9 stops 4 stops)lowast Rapid cycle improvementPDSA model of rapid changelowast 2 MAs per fte MD or NPPAlowast Huddlespre-visit planninglowast Results
lowast Experimenting with Team= 1 MD 3 mids 7 MA RN Panel Managerlowast Innovationlowast Ruthless removal of lsquotasks below licensersquolowast Data
lowast Crediblelowast Actionablelowast To the right peoplelowast At the right time
How to get better population quality- Support Staff
lowast Workflow changeslowast Adequate support staff (number quality training)
lowast Innovationlowast And leveraging othersrsquo innovations
lowast Ruthless removal of lsquotasks below licensersquolowast Data
lowast Crediblelowast Actionablelowast To the right peoplelowast At the right time
How to get better population quality- Innovation
lowast RN CDE-led chronic disease management programlowast Key features
lowast Stared ~1999 with Dr NickECClowast RN-ledlowast BH availablelowast MDNPPA involvement on med changeslab interpretationexamlowast Self management skillslowast Patient education and activationlowast Care coordination (scheduling labs referrals PCP consultation
foot exams)lowast Proactive office encounter (huddles pre0visit planning)lowast Single stable point of contact (health coach) for the patient
Innovation Project Dulce
Project Dulce Cost-Effectiveness
Cost savings estimates for Dulce Model (~$QALY 2006 $)
Uninsured $10000
County Medical Services $25000
Medicaid $45000
Commercial $70000Health Services Research Health Research and Educational TrustDOI 101111j1475-6773200700701x
Analysis of the impact of group medical visits on clinical outcomes of Project Dulce patients with Diabetes HbA1c Results of August 2006 Enrollees with a group medical visit between 72000 to 62006
00
10
20
30
40
50
60
70
80
90
HbA1c Prior toDulce 11(n=78)
HbA1c Prior to GMV(n=78 plt0001)
HbA1c after 6months
(n=55 plt005)
HbA1c after 12months
(n=55 plt005)
HbA1c after 18months
(n=24 plt005)
HbA1c after 24months
(n=22 plt005)
87
7872 70 70 72
(n=24) (n=22)(n=55)(n=55)(n=78)(n=78)
Project Dulce Group Medical Visits Analysis of change in HbA1c over time
Pre-EMR
Innovation
Primary Care retinal photography
George Hayes CRR - Scripps Whittier Institute
lowast Workflow changeslowast Adequate support staff (number quality training)lowast Innovationlowast Ruthless removal of lsquotasks below licensersquo
lowastDatalowast Crediblelowast Actionablelowast To the right peoplelowast At the right time
How to get better population quality DATA
lowast 2010 implementation of eClinicalWorks (eCW)
lowast Data lag 1 year +lowast Validation period 1 year +lowast Registry functionlowast BridgeITlowast Home-grown registrylowast eCW alerts point-of-service data with low annoyance
quotientlowast i2i
NHC Data Journey EMR
lowast 5 stages of grief (Kubler-Ross)lowast Denial- lsquothe data are wrongrsquo lsquoitrsquos not my patientsrsquo
lowast Remedy only show good easily-verifiable datalowast Anger-rsquo damn you they arenrsquot my ptsrsquo lsquoI donrsquot practice cookbook
medicinersquo lowast Remedy only show good easily-verifiable data
lowast Bargaining- lsquo if I had some help on thisrsquo lsquomy pts are the sickest so of course my numbers are badrsquo lsquoI get all the new out-of-control ptsrsquolowast Remedy good data with good benchmarks- local and regionalnational
similar practices eg CHC vs CHClowast Depression-rsquo boy I really suckrsquo lsquomy system is set up to sabatoge mersquo lsquomy
MAs are no buenorsquolowast Remedy give tools and workflow changes that make doing the right thing
easy get help at appropriate license level donrsquot penalize right away for poor performance
lowast Acceptance-rsquo ok how do we make it betterrsquo lsquoMAs letrsquos be the top by the end of the monthrsquolowast Remedy- more of the above continued emphasis emphasize saving lives
and preventing morbidity (and cost in some systems)
Data
lowast Data overload-lowast providers burn out trying to be 1 in everything drive their
team crazy start focusing on the numbers over actual clinical quality start pt dumpingcherry picking
lowast Remedy only emphasize a few things at a time reward for one or two priority areas reward whole team
lowast Apathylowast too much data people revert back to concentrating on
individual pt carelowast Feel futility at times- moving the result takes effort and timelowast Remedy give the populationprevention tasks to others (RNs
+ data analysts midlevels dedicated to specific roles advanced MAs in conjunction with their team under protocols health coaches etc)
A1cLDLMAbcreatFoot examRetina screenALL medsASABP controlStatinCRC screenBreast Ca screenCervical Ca screenDepression screenAlcohol screenImmunizations due todaydeclinedTobacco usecounselling dueHIV done everVisit summary printed (MU)eRx sent (MU measure)
eCW Alerts app
lowast Donrsquot wait for the patient to show up- identify the needs and go get them
lowast New skillslowast Datadata analysislowast Prioritization of a lot of needlowast Proactive pt activationeducation for preventive care
lowast How financedlowast LIHP funding for population management and PCMHlowast Health Plan very little fundinglowast CHC payment model a handicap
lowast Best example CRC screenlowast Key finding team responsibility for screening and
monitoring (not JUST the MD)
Population Management
Organization Wide Trend
0
10
20
30
40
50
60
70
1 12 23 34 45 56 67 78 89 100 111
122
133
144
155
166
177
188
199
210
221
232
243
254
265
276
287
298
309
320
331
342
353
364
375
CRC screened
CRC screened
56 82015
lowast Partners KP C4 PASD LabCorp lowast Minimum funding from C4lowast LabCorp donated FIT tests
lowast Pt identified needing CRC screen lowast during visit via eCW alerts applowast proactively using registry
lowast FIT test givenlowast Tests tracked by Panel Managers
lowast Pt contacted if kit not returned in 2 wkslowast Results tracked monthly
lowast Reported to sites med staff QM BOD periodicallylowast Positive tests free colonoscopy by Kaiser via Project Access San Diegolowast Positive Biopsies
lowast Kaiser-donated surgery imaging specialty consultRx planlowast PASD arranges for donated oncology eval XRT if needed ChemoRx if
needed
Colorectal Cancer Screening Project
CRC-In reachlowast The daily huddle
In reachlowast Identifying Patients due for CRC Screening lowast eCW Alert app developed by Dr Kulin Tantod
Outreachlowast Identifying Patients due for CRC Screening lowast Data registry developed by Dr Kulin Tantod
Hypertension and Diabetes efforts at NHC
Neighborhood Healthcare ALLHeart Project
lowast Project Increase the number of ALLHEART patients on both medications lowast RN protocollowast MD education videolowast Added to alerts app if not on ACEARB amp Statinlowast Added to medical staff clinical measures dashboardlowast Monitoring overall performance monthlylowast ASCVD Risk Calculator embedded in alerts app with
hyperlink to reference
How are we doing BP Control UDS 77
82415
NHCCCC HTN Protocol
October 2013
How are we doing BP ControlDMALL
DM lt14090 83 (33293999)
HTN 77 (66938713)65 on 31614
DM gt50 on ACEARB + Statin75 on 10914 (24583269)70 on 31614
How are we doing BP ControlAs of 31014
How are we doing BP ControlAs of 2515
How are we doing DM BP control
lowast MDs are competitivelowast Data + supportmoving the curve
Getting Quality Data to the Medical Staff
NHC Physician- level Interactive Real Time Quality Detail- panel level detail
Individual real timeDetailed
Trending
Peer-normative
Actionable
On-demand Quality Data- Actionable Data
bull Click any column to generate recall list
bull All recall items identified- one-call hits all items
Outreachlowast Identifying Patients due for CRC Screening lowast Data registry developed by Dr Kulin Tantod
bull Panel Sizebull DM A1clt9 BP 14090 LDL lt100 bull HTN BP lt14090 ALL medsbull Ca screen colon breast cervicalbull Antipsych meds with A1c testbull PP and prenatal visit tielinessbull Childhood IMMIsbull Asthma on controllerbull etc
lowast Chronic disease management can be done in an underserved population requirementslowast Committed leadershiplowast Dedicated staff with a unifying purposelowast Validated and trusted data delivered when it is neededlowast Data analytics capabilitylowast Prioritization processlowast Leveraging community resourceslowast Engaged patientslowast Payment model to support activities outside typical
face-to-face visit
Summary
Key Concept- Data
Key Concept Teamwork + Transparency and Accountability
Key Concept- Innovation
Primary Care retinal photography
George Hayes CRR - Scripps Whittier Institute
Key Concept- Boldness
Key Concept- Team
Erika Bazan MA- Care Coordinator
Maria Acosta MA
Erica Cruz MA
Key Concept- Happy People
Chronic Disease Management in Underserved Populations- Mission Impossible
Audience Response
Evidence-based response
Slide Number 4
Chronic Disease Management in Underserved
Audience Response
Audience Response
Audience Response
Audience Response
Audience Response
Community Health Centers in San Diego County- the lsquoSafety Netrsquo
Local SD Payer Environment
Slide Number 13
CCC sites
Quality Work in CHCs
How does Quality happen in a CHC
Recent Council of Community Clinics Advances
Council of Community Clinics Tools
Council of Community Clinics
Slide Number 20
ALL HEART Clinics by County
ALL HEART Patients to Date
Slide Number 23
ALLHeart Results- QI Project CHCs
Slide Number 25
Slide Number 26
HYPERTENSION CONTROL DATA BY CLINIC ORGANIZATION-PopIq or individual reportsMeasurement Year March 31 2013 ndash February 28 2014N= 67241
Pop-IQ
PopIQ Data Analytics amp Data Aggregation
PopIQ Hypertension Blood Pressure lt 14090
PopIQ Blood Pressure lt 14090Diabetes
PopIQ DM Blood Pressure lt 14090
PopIQ Diabetics with HbA1c TestingHbA1c lt 7
Slide Number 34
What measures will be collecting for 2015-2016
Some measures will be stratified by age gender zip code in 2015-2016
Estimated 2014 Blood Pressure Control Rates by Quarter amp Group
Estimated 2014 Blood Pressure Control Rates by Quarter amp Insurance Type
Estimated 2014 Patients with Newly Controlled Blood Pressure by Quarter amp Insurance
Estimated 2014 Pts w Blood Pressure Control
Slide Number 41
Neighborhood Healthcare
Slide Number 43
NHC- Providing Quality Health Care Since 1969
Slide Number 45
Slide Number 46
Slide Number 47
Slide Number 48
Slide Number 49
Slide Number 50
CDM in Underserved- PCMH
How to get better population quality
How to get better population quality
NHC QM Efforts- Workflow changes
Workflow changes Pt flow redesign
Workflow changes Individual Reports- Huddles
How to get better population quality- Support Staff
How to get better population quality- Innovation
Innovation Project Dulce
Project Dulce Cost-Effectiveness
Slide Number 61
Innovation
How to get better population quality DATA
NHC Data Journey EMR
Data
Data- Grief Stages 6 and 7
Point-of-Service Data
Point-of-Service DataPre-visit PlanningProactive
eCW Alerts app
Population Management
Organization Wide Trend
Colorectal Cancer Screening Project
CRC-In reach
In reach
Outreach
Hypertension and Diabetes efforts at NHC
Neighborhood Healthcare ALLHeart Project
How are we doing BP Control UDS
NHCCCC HTN ProtocolOctober 2013
How are we doing BP ControlDMALL
How are we doing BP Control
How are we doing BP Control
How are we doing DM BP control
Getting Quality Data to the Medical Staff
NHC Physician- level Interactive Real Time Quality Detail- panel level detail
Key Concept Teamwork + Transparency and Accountability
Key Concept- Innovation
Key Concept- Boldness
Key Concept- Team
Key Concept- Happy People
Slide Number 97
lowast Roger Coleman and Associateslowast Eliminate unnecessary steps in workflow based on data and
lsquovalue-addedrsquo conceptlowast Patient-centered- bring services to the patient vs assembly-line
model (7-9 stops 4 stops)lowast Rapid cycle improvementPDSA model of rapid changelowast 2 MAs per fte MD or NPPAlowast Huddlespre-visit planninglowast Results
lowast Experimenting with Team= 1 MD 3 mids 7 MA RN Panel Managerlowast Innovationlowast Ruthless removal of lsquotasks below licensersquolowast Data
lowast Crediblelowast Actionablelowast To the right peoplelowast At the right time
How to get better population quality- Support Staff
lowast Workflow changeslowast Adequate support staff (number quality training)
lowast Innovationlowast And leveraging othersrsquo innovations
lowast Ruthless removal of lsquotasks below licensersquolowast Data
lowast Crediblelowast Actionablelowast To the right peoplelowast At the right time
How to get better population quality- Innovation
lowast RN CDE-led chronic disease management programlowast Key features
lowast Stared ~1999 with Dr NickECClowast RN-ledlowast BH availablelowast MDNPPA involvement on med changeslab interpretationexamlowast Self management skillslowast Patient education and activationlowast Care coordination (scheduling labs referrals PCP consultation
foot exams)lowast Proactive office encounter (huddles pre0visit planning)lowast Single stable point of contact (health coach) for the patient
Innovation Project Dulce
Project Dulce Cost-Effectiveness
Cost savings estimates for Dulce Model (~$QALY 2006 $)
Uninsured $10000
County Medical Services $25000
Medicaid $45000
Commercial $70000Health Services Research Health Research and Educational TrustDOI 101111j1475-6773200700701x
Analysis of the impact of group medical visits on clinical outcomes of Project Dulce patients with Diabetes HbA1c Results of August 2006 Enrollees with a group medical visit between 72000 to 62006
00
10
20
30
40
50
60
70
80
90
HbA1c Prior toDulce 11(n=78)
HbA1c Prior to GMV(n=78 plt0001)
HbA1c after 6months
(n=55 plt005)
HbA1c after 12months
(n=55 plt005)
HbA1c after 18months
(n=24 plt005)
HbA1c after 24months
(n=22 plt005)
87
7872 70 70 72
(n=24) (n=22)(n=55)(n=55)(n=78)(n=78)
Project Dulce Group Medical Visits Analysis of change in HbA1c over time
Pre-EMR
Innovation
Primary Care retinal photography
George Hayes CRR - Scripps Whittier Institute
lowast Workflow changeslowast Adequate support staff (number quality training)lowast Innovationlowast Ruthless removal of lsquotasks below licensersquo
lowastDatalowast Crediblelowast Actionablelowast To the right peoplelowast At the right time
How to get better population quality DATA
lowast 2010 implementation of eClinicalWorks (eCW)
lowast Data lag 1 year +lowast Validation period 1 year +lowast Registry functionlowast BridgeITlowast Home-grown registrylowast eCW alerts point-of-service data with low annoyance
quotientlowast i2i
NHC Data Journey EMR
lowast 5 stages of grief (Kubler-Ross)lowast Denial- lsquothe data are wrongrsquo lsquoitrsquos not my patientsrsquo
lowast Remedy only show good easily-verifiable datalowast Anger-rsquo damn you they arenrsquot my ptsrsquo lsquoI donrsquot practice cookbook
medicinersquo lowast Remedy only show good easily-verifiable data
lowast Bargaining- lsquo if I had some help on thisrsquo lsquomy pts are the sickest so of course my numbers are badrsquo lsquoI get all the new out-of-control ptsrsquolowast Remedy good data with good benchmarks- local and regionalnational
similar practices eg CHC vs CHClowast Depression-rsquo boy I really suckrsquo lsquomy system is set up to sabatoge mersquo lsquomy
MAs are no buenorsquolowast Remedy give tools and workflow changes that make doing the right thing
easy get help at appropriate license level donrsquot penalize right away for poor performance
lowast Acceptance-rsquo ok how do we make it betterrsquo lsquoMAs letrsquos be the top by the end of the monthrsquolowast Remedy- more of the above continued emphasis emphasize saving lives
and preventing morbidity (and cost in some systems)
Data
lowast Data overload-lowast providers burn out trying to be 1 in everything drive their
team crazy start focusing on the numbers over actual clinical quality start pt dumpingcherry picking
lowast Remedy only emphasize a few things at a time reward for one or two priority areas reward whole team
lowast Apathylowast too much data people revert back to concentrating on
individual pt carelowast Feel futility at times- moving the result takes effort and timelowast Remedy give the populationprevention tasks to others (RNs
+ data analysts midlevels dedicated to specific roles advanced MAs in conjunction with their team under protocols health coaches etc)
A1cLDLMAbcreatFoot examRetina screenALL medsASABP controlStatinCRC screenBreast Ca screenCervical Ca screenDepression screenAlcohol screenImmunizations due todaydeclinedTobacco usecounselling dueHIV done everVisit summary printed (MU)eRx sent (MU measure)
eCW Alerts app
lowast Donrsquot wait for the patient to show up- identify the needs and go get them
lowast New skillslowast Datadata analysislowast Prioritization of a lot of needlowast Proactive pt activationeducation for preventive care
lowast How financedlowast LIHP funding for population management and PCMHlowast Health Plan very little fundinglowast CHC payment model a handicap
lowast Best example CRC screenlowast Key finding team responsibility for screening and
monitoring (not JUST the MD)
Population Management
Organization Wide Trend
0
10
20
30
40
50
60
70
1 12 23 34 45 56 67 78 89 100 111
122
133
144
155
166
177
188
199
210
221
232
243
254
265
276
287
298
309
320
331
342
353
364
375
CRC screened
CRC screened
56 82015
lowast Partners KP C4 PASD LabCorp lowast Minimum funding from C4lowast LabCorp donated FIT tests
lowast Pt identified needing CRC screen lowast during visit via eCW alerts applowast proactively using registry
lowast FIT test givenlowast Tests tracked by Panel Managers
lowast Pt contacted if kit not returned in 2 wkslowast Results tracked monthly
lowast Reported to sites med staff QM BOD periodicallylowast Positive tests free colonoscopy by Kaiser via Project Access San Diegolowast Positive Biopsies
lowast Kaiser-donated surgery imaging specialty consultRx planlowast PASD arranges for donated oncology eval XRT if needed ChemoRx if
needed
Colorectal Cancer Screening Project
CRC-In reachlowast The daily huddle
In reachlowast Identifying Patients due for CRC Screening lowast eCW Alert app developed by Dr Kulin Tantod
Outreachlowast Identifying Patients due for CRC Screening lowast Data registry developed by Dr Kulin Tantod
Hypertension and Diabetes efforts at NHC
Neighborhood Healthcare ALLHeart Project
lowast Project Increase the number of ALLHEART patients on both medications lowast RN protocollowast MD education videolowast Added to alerts app if not on ACEARB amp Statinlowast Added to medical staff clinical measures dashboardlowast Monitoring overall performance monthlylowast ASCVD Risk Calculator embedded in alerts app with
hyperlink to reference
How are we doing BP Control UDS 77
82415
NHCCCC HTN Protocol
October 2013
How are we doing BP ControlDMALL
DM lt14090 83 (33293999)
HTN 77 (66938713)65 on 31614
DM gt50 on ACEARB + Statin75 on 10914 (24583269)70 on 31614
How are we doing BP ControlAs of 31014
How are we doing BP ControlAs of 2515
How are we doing DM BP control
lowast MDs are competitivelowast Data + supportmoving the curve
Getting Quality Data to the Medical Staff
NHC Physician- level Interactive Real Time Quality Detail- panel level detail
Individual real timeDetailed
Trending
Peer-normative
Actionable
On-demand Quality Data- Actionable Data
bull Click any column to generate recall list
bull All recall items identified- one-call hits all items
Outreachlowast Identifying Patients due for CRC Screening lowast Data registry developed by Dr Kulin Tantod
bull Panel Sizebull DM A1clt9 BP 14090 LDL lt100 bull HTN BP lt14090 ALL medsbull Ca screen colon breast cervicalbull Antipsych meds with A1c testbull PP and prenatal visit tielinessbull Childhood IMMIsbull Asthma on controllerbull etc
lowast Chronic disease management can be done in an underserved population requirementslowast Committed leadershiplowast Dedicated staff with a unifying purposelowast Validated and trusted data delivered when it is neededlowast Data analytics capabilitylowast Prioritization processlowast Leveraging community resourceslowast Engaged patientslowast Payment model to support activities outside typical
face-to-face visit
Summary
Key Concept- Data
Key Concept Teamwork + Transparency and Accountability
Key Concept- Innovation
Primary Care retinal photography
George Hayes CRR - Scripps Whittier Institute
Key Concept- Boldness
Key Concept- Team
Erika Bazan MA- Care Coordinator
Maria Acosta MA
Erica Cruz MA
Key Concept- Happy People
Chronic Disease Management in Underserved Populations- Mission Impossible
Audience Response
Evidence-based response
Slide Number 4
Chronic Disease Management in Underserved
Audience Response
Audience Response
Audience Response
Audience Response
Audience Response
Community Health Centers in San Diego County- the lsquoSafety Netrsquo
Local SD Payer Environment
Slide Number 13
CCC sites
Quality Work in CHCs
How does Quality happen in a CHC
Recent Council of Community Clinics Advances
Council of Community Clinics Tools
Council of Community Clinics
Slide Number 20
ALL HEART Clinics by County
ALL HEART Patients to Date
Slide Number 23
ALLHeart Results- QI Project CHCs
Slide Number 25
Slide Number 26
HYPERTENSION CONTROL DATA BY CLINIC ORGANIZATION-PopIq or individual reportsMeasurement Year March 31 2013 ndash February 28 2014N= 67241
Pop-IQ
PopIQ Data Analytics amp Data Aggregation
PopIQ Hypertension Blood Pressure lt 14090
PopIQ Blood Pressure lt 14090Diabetes
PopIQ DM Blood Pressure lt 14090
PopIQ Diabetics with HbA1c TestingHbA1c lt 7
Slide Number 34
What measures will be collecting for 2015-2016
Some measures will be stratified by age gender zip code in 2015-2016
Estimated 2014 Blood Pressure Control Rates by Quarter amp Group
Estimated 2014 Blood Pressure Control Rates by Quarter amp Insurance Type
Estimated 2014 Patients with Newly Controlled Blood Pressure by Quarter amp Insurance
Estimated 2014 Pts w Blood Pressure Control
Slide Number 41
Neighborhood Healthcare
Slide Number 43
NHC- Providing Quality Health Care Since 1969
Slide Number 45
Slide Number 46
Slide Number 47
Slide Number 48
Slide Number 49
Slide Number 50
CDM in Underserved- PCMH
How to get better population quality
How to get better population quality
NHC QM Efforts- Workflow changes
Workflow changes Pt flow redesign
Workflow changes Individual Reports- Huddles
How to get better population quality- Support Staff
How to get better population quality- Innovation
Innovation Project Dulce
Project Dulce Cost-Effectiveness
Slide Number 61
Innovation
How to get better population quality DATA
NHC Data Journey EMR
Data
Data- Grief Stages 6 and 7
Point-of-Service Data
Point-of-Service DataPre-visit PlanningProactive
eCW Alerts app
Population Management
Organization Wide Trend
Colorectal Cancer Screening Project
CRC-In reach
In reach
Outreach
Hypertension and Diabetes efforts at NHC
Neighborhood Healthcare ALLHeart Project
How are we doing BP Control UDS
NHCCCC HTN ProtocolOctober 2013
How are we doing BP ControlDMALL
How are we doing BP Control
How are we doing BP Control
How are we doing DM BP control
Getting Quality Data to the Medical Staff
NHC Physician- level Interactive Real Time Quality Detail- panel level detail
Key Concept Teamwork + Transparency and Accountability
Key Concept- Innovation
Key Concept- Boldness
Key Concept- Team
Key Concept- Happy People
Slide Number 97
Project Dulce Cost-Effectiveness
Cost savings estimates for Dulce Model (~$QALY 2006 $)
Uninsured $10000
County Medical Services $25000
Medicaid $45000
Commercial $70000Health Services Research Health Research and Educational TrustDOI 101111j1475-6773200700701x
Analysis of the impact of group medical visits on clinical outcomes of Project Dulce patients with Diabetes HbA1c Results of August 2006 Enrollees with a group medical visit between 72000 to 62006
00
10
20
30
40
50
60
70
80
90
HbA1c Prior toDulce 11(n=78)
HbA1c Prior to GMV(n=78 plt0001)
HbA1c after 6months
(n=55 plt005)
HbA1c after 12months
(n=55 plt005)
HbA1c after 18months
(n=24 plt005)
HbA1c after 24months
(n=22 plt005)
87
7872 70 70 72
(n=24) (n=22)(n=55)(n=55)(n=78)(n=78)
Project Dulce Group Medical Visits Analysis of change in HbA1c over time
Pre-EMR
Innovation
Primary Care retinal photography
George Hayes CRR - Scripps Whittier Institute
lowast Workflow changeslowast Adequate support staff (number quality training)lowast Innovationlowast Ruthless removal of lsquotasks below licensersquo
lowastDatalowast Crediblelowast Actionablelowast To the right peoplelowast At the right time
How to get better population quality DATA
lowast 2010 implementation of eClinicalWorks (eCW)
lowast Data lag 1 year +lowast Validation period 1 year +lowast Registry functionlowast BridgeITlowast Home-grown registrylowast eCW alerts point-of-service data with low annoyance
quotientlowast i2i
NHC Data Journey EMR
lowast 5 stages of grief (Kubler-Ross)lowast Denial- lsquothe data are wrongrsquo lsquoitrsquos not my patientsrsquo
lowast Remedy only show good easily-verifiable datalowast Anger-rsquo damn you they arenrsquot my ptsrsquo lsquoI donrsquot practice cookbook
medicinersquo lowast Remedy only show good easily-verifiable data
lowast Bargaining- lsquo if I had some help on thisrsquo lsquomy pts are the sickest so of course my numbers are badrsquo lsquoI get all the new out-of-control ptsrsquolowast Remedy good data with good benchmarks- local and regionalnational
similar practices eg CHC vs CHClowast Depression-rsquo boy I really suckrsquo lsquomy system is set up to sabatoge mersquo lsquomy
MAs are no buenorsquolowast Remedy give tools and workflow changes that make doing the right thing
easy get help at appropriate license level donrsquot penalize right away for poor performance
lowast Acceptance-rsquo ok how do we make it betterrsquo lsquoMAs letrsquos be the top by the end of the monthrsquolowast Remedy- more of the above continued emphasis emphasize saving lives
and preventing morbidity (and cost in some systems)
Data
lowast Data overload-lowast providers burn out trying to be 1 in everything drive their
team crazy start focusing on the numbers over actual clinical quality start pt dumpingcherry picking
lowast Remedy only emphasize a few things at a time reward for one or two priority areas reward whole team
lowast Apathylowast too much data people revert back to concentrating on
individual pt carelowast Feel futility at times- moving the result takes effort and timelowast Remedy give the populationprevention tasks to others (RNs
+ data analysts midlevels dedicated to specific roles advanced MAs in conjunction with their team under protocols health coaches etc)
A1cLDLMAbcreatFoot examRetina screenALL medsASABP controlStatinCRC screenBreast Ca screenCervical Ca screenDepression screenAlcohol screenImmunizations due todaydeclinedTobacco usecounselling dueHIV done everVisit summary printed (MU)eRx sent (MU measure)
eCW Alerts app
lowast Donrsquot wait for the patient to show up- identify the needs and go get them
lowast New skillslowast Datadata analysislowast Prioritization of a lot of needlowast Proactive pt activationeducation for preventive care
lowast How financedlowast LIHP funding for population management and PCMHlowast Health Plan very little fundinglowast CHC payment model a handicap
lowast Best example CRC screenlowast Key finding team responsibility for screening and
monitoring (not JUST the MD)
Population Management
Organization Wide Trend
0
10
20
30
40
50
60
70
1 12 23 34 45 56 67 78 89 100 111
122
133
144
155
166
177
188
199
210
221
232
243
254
265
276
287
298
309
320
331
342
353
364
375
CRC screened
CRC screened
56 82015
lowast Partners KP C4 PASD LabCorp lowast Minimum funding from C4lowast LabCorp donated FIT tests
lowast Pt identified needing CRC screen lowast during visit via eCW alerts applowast proactively using registry
lowast FIT test givenlowast Tests tracked by Panel Managers
lowast Pt contacted if kit not returned in 2 wkslowast Results tracked monthly
lowast Reported to sites med staff QM BOD periodicallylowast Positive tests free colonoscopy by Kaiser via Project Access San Diegolowast Positive Biopsies
lowast Kaiser-donated surgery imaging specialty consultRx planlowast PASD arranges for donated oncology eval XRT if needed ChemoRx if
needed
Colorectal Cancer Screening Project
CRC-In reachlowast The daily huddle
In reachlowast Identifying Patients due for CRC Screening lowast eCW Alert app developed by Dr Kulin Tantod
Outreachlowast Identifying Patients due for CRC Screening lowast Data registry developed by Dr Kulin Tantod
Hypertension and Diabetes efforts at NHC
Neighborhood Healthcare ALLHeart Project
lowast Project Increase the number of ALLHEART patients on both medications lowast RN protocollowast MD education videolowast Added to alerts app if not on ACEARB amp Statinlowast Added to medical staff clinical measures dashboardlowast Monitoring overall performance monthlylowast ASCVD Risk Calculator embedded in alerts app with
hyperlink to reference
How are we doing BP Control UDS 77
82415
NHCCCC HTN Protocol
October 2013
How are we doing BP ControlDMALL
DM lt14090 83 (33293999)
HTN 77 (66938713)65 on 31614
DM gt50 on ACEARB + Statin75 on 10914 (24583269)70 on 31614
How are we doing BP ControlAs of 31014
How are we doing BP ControlAs of 2515
How are we doing DM BP control
lowast MDs are competitivelowast Data + supportmoving the curve
Getting Quality Data to the Medical Staff
NHC Physician- level Interactive Real Time Quality Detail- panel level detail
Individual real timeDetailed
Trending
Peer-normative
Actionable
On-demand Quality Data- Actionable Data
bull Click any column to generate recall list
bull All recall items identified- one-call hits all items
Outreachlowast Identifying Patients due for CRC Screening lowast Data registry developed by Dr Kulin Tantod
bull Panel Sizebull DM A1clt9 BP 14090 LDL lt100 bull HTN BP lt14090 ALL medsbull Ca screen colon breast cervicalbull Antipsych meds with A1c testbull PP and prenatal visit tielinessbull Childhood IMMIsbull Asthma on controllerbull etc
lowast Chronic disease management can be done in an underserved population requirementslowast Committed leadershiplowast Dedicated staff with a unifying purposelowast Validated and trusted data delivered when it is neededlowast Data analytics capabilitylowast Prioritization processlowast Leveraging community resourceslowast Engaged patientslowast Payment model to support activities outside typical
face-to-face visit
Summary
Key Concept- Data
Key Concept Teamwork + Transparency and Accountability
Key Concept- Innovation
Primary Care retinal photography
George Hayes CRR - Scripps Whittier Institute
Key Concept- Boldness
Key Concept- Team
Erika Bazan MA- Care Coordinator
Maria Acosta MA
Erica Cruz MA
Key Concept- Happy People
Chronic Disease Management in Underserved Populations- Mission Impossible
Audience Response
Evidence-based response
Slide Number 4
Chronic Disease Management in Underserved
Audience Response
Audience Response
Audience Response
Audience Response
Audience Response
Community Health Centers in San Diego County- the lsquoSafety Netrsquo
Local SD Payer Environment
Slide Number 13
CCC sites
Quality Work in CHCs
How does Quality happen in a CHC
Recent Council of Community Clinics Advances
Council of Community Clinics Tools
Council of Community Clinics
Slide Number 20
ALL HEART Clinics by County
ALL HEART Patients to Date
Slide Number 23
ALLHeart Results- QI Project CHCs
Slide Number 25
Slide Number 26
HYPERTENSION CONTROL DATA BY CLINIC ORGANIZATION-PopIq or individual reportsMeasurement Year March 31 2013 ndash February 28 2014N= 67241
Pop-IQ
PopIQ Data Analytics amp Data Aggregation
PopIQ Hypertension Blood Pressure lt 14090
PopIQ Blood Pressure lt 14090Diabetes
PopIQ DM Blood Pressure lt 14090
PopIQ Diabetics with HbA1c TestingHbA1c lt 7
Slide Number 34
What measures will be collecting for 2015-2016
Some measures will be stratified by age gender zip code in 2015-2016
Estimated 2014 Blood Pressure Control Rates by Quarter amp Group
Estimated 2014 Blood Pressure Control Rates by Quarter amp Insurance Type
Estimated 2014 Patients with Newly Controlled Blood Pressure by Quarter amp Insurance
Estimated 2014 Pts w Blood Pressure Control
Slide Number 41
Neighborhood Healthcare
Slide Number 43
NHC- Providing Quality Health Care Since 1969
Slide Number 45
Slide Number 46
Slide Number 47
Slide Number 48
Slide Number 49
Slide Number 50
CDM in Underserved- PCMH
How to get better population quality
How to get better population quality
NHC QM Efforts- Workflow changes
Workflow changes Pt flow redesign
Workflow changes Individual Reports- Huddles
How to get better population quality- Support Staff
How to get better population quality- Innovation
Innovation Project Dulce
Project Dulce Cost-Effectiveness
Slide Number 61
Innovation
How to get better population quality DATA
NHC Data Journey EMR
Data
Data- Grief Stages 6 and 7
Point-of-Service Data
Point-of-Service DataPre-visit PlanningProactive
eCW Alerts app
Population Management
Organization Wide Trend
Colorectal Cancer Screening Project
CRC-In reach
In reach
Outreach
Hypertension and Diabetes efforts at NHC
Neighborhood Healthcare ALLHeart Project
How are we doing BP Control UDS
NHCCCC HTN ProtocolOctober 2013
How are we doing BP ControlDMALL
How are we doing BP Control
How are we doing BP Control
How are we doing DM BP control
Getting Quality Data to the Medical Staff
NHC Physician- level Interactive Real Time Quality Detail- panel level detail
Key Concept Teamwork + Transparency and Accountability
Key Concept- Innovation
Key Concept- Boldness
Key Concept- Team
Key Concept- Happy People
Slide Number 97
Innovation
Primary Care retinal photography
George Hayes CRR - Scripps Whittier Institute
lowast Workflow changeslowast Adequate support staff (number quality training)lowast Innovationlowast Ruthless removal of lsquotasks below licensersquo
lowastDatalowast Crediblelowast Actionablelowast To the right peoplelowast At the right time
How to get better population quality DATA
lowast 2010 implementation of eClinicalWorks (eCW)
lowast Data lag 1 year +lowast Validation period 1 year +lowast Registry functionlowast BridgeITlowast Home-grown registrylowast eCW alerts point-of-service data with low annoyance
quotientlowast i2i
NHC Data Journey EMR
lowast 5 stages of grief (Kubler-Ross)lowast Denial- lsquothe data are wrongrsquo lsquoitrsquos not my patientsrsquo
lowast Remedy only show good easily-verifiable datalowast Anger-rsquo damn you they arenrsquot my ptsrsquo lsquoI donrsquot practice cookbook
medicinersquo lowast Remedy only show good easily-verifiable data
lowast Bargaining- lsquo if I had some help on thisrsquo lsquomy pts are the sickest so of course my numbers are badrsquo lsquoI get all the new out-of-control ptsrsquolowast Remedy good data with good benchmarks- local and regionalnational
similar practices eg CHC vs CHClowast Depression-rsquo boy I really suckrsquo lsquomy system is set up to sabatoge mersquo lsquomy
MAs are no buenorsquolowast Remedy give tools and workflow changes that make doing the right thing
easy get help at appropriate license level donrsquot penalize right away for poor performance
lowast Acceptance-rsquo ok how do we make it betterrsquo lsquoMAs letrsquos be the top by the end of the monthrsquolowast Remedy- more of the above continued emphasis emphasize saving lives
and preventing morbidity (and cost in some systems)
Data
lowast Data overload-lowast providers burn out trying to be 1 in everything drive their
team crazy start focusing on the numbers over actual clinical quality start pt dumpingcherry picking
lowast Remedy only emphasize a few things at a time reward for one or two priority areas reward whole team
lowast Apathylowast too much data people revert back to concentrating on
individual pt carelowast Feel futility at times- moving the result takes effort and timelowast Remedy give the populationprevention tasks to others (RNs
+ data analysts midlevels dedicated to specific roles advanced MAs in conjunction with their team under protocols health coaches etc)
A1cLDLMAbcreatFoot examRetina screenALL medsASABP controlStatinCRC screenBreast Ca screenCervical Ca screenDepression screenAlcohol screenImmunizations due todaydeclinedTobacco usecounselling dueHIV done everVisit summary printed (MU)eRx sent (MU measure)
eCW Alerts app
lowast Donrsquot wait for the patient to show up- identify the needs and go get them
lowast New skillslowast Datadata analysislowast Prioritization of a lot of needlowast Proactive pt activationeducation for preventive care
lowast How financedlowast LIHP funding for population management and PCMHlowast Health Plan very little fundinglowast CHC payment model a handicap
lowast Best example CRC screenlowast Key finding team responsibility for screening and
monitoring (not JUST the MD)
Population Management
Organization Wide Trend
0
10
20
30
40
50
60
70
1 12 23 34 45 56 67 78 89 100 111
122
133
144
155
166
177
188
199
210
221
232
243
254
265
276
287
298
309
320
331
342
353
364
375
CRC screened
CRC screened
56 82015
lowast Partners KP C4 PASD LabCorp lowast Minimum funding from C4lowast LabCorp donated FIT tests
lowast Pt identified needing CRC screen lowast during visit via eCW alerts applowast proactively using registry
lowast FIT test givenlowast Tests tracked by Panel Managers
lowast Pt contacted if kit not returned in 2 wkslowast Results tracked monthly
lowast Reported to sites med staff QM BOD periodicallylowast Positive tests free colonoscopy by Kaiser via Project Access San Diegolowast Positive Biopsies
lowast Kaiser-donated surgery imaging specialty consultRx planlowast PASD arranges for donated oncology eval XRT if needed ChemoRx if
needed
Colorectal Cancer Screening Project
CRC-In reachlowast The daily huddle
In reachlowast Identifying Patients due for CRC Screening lowast eCW Alert app developed by Dr Kulin Tantod
Outreachlowast Identifying Patients due for CRC Screening lowast Data registry developed by Dr Kulin Tantod
Hypertension and Diabetes efforts at NHC
Neighborhood Healthcare ALLHeart Project
lowast Project Increase the number of ALLHEART patients on both medications lowast RN protocollowast MD education videolowast Added to alerts app if not on ACEARB amp Statinlowast Added to medical staff clinical measures dashboardlowast Monitoring overall performance monthlylowast ASCVD Risk Calculator embedded in alerts app with
hyperlink to reference
How are we doing BP Control UDS 77
82415
NHCCCC HTN Protocol
October 2013
How are we doing BP ControlDMALL
DM lt14090 83 (33293999)
HTN 77 (66938713)65 on 31614
DM gt50 on ACEARB + Statin75 on 10914 (24583269)70 on 31614
How are we doing BP ControlAs of 31014
How are we doing BP ControlAs of 2515
How are we doing DM BP control
lowast MDs are competitivelowast Data + supportmoving the curve
Getting Quality Data to the Medical Staff
NHC Physician- level Interactive Real Time Quality Detail- panel level detail
Individual real timeDetailed
Trending
Peer-normative
Actionable
On-demand Quality Data- Actionable Data
bull Click any column to generate recall list
bull All recall items identified- one-call hits all items
Outreachlowast Identifying Patients due for CRC Screening lowast Data registry developed by Dr Kulin Tantod
bull Panel Sizebull DM A1clt9 BP 14090 LDL lt100 bull HTN BP lt14090 ALL medsbull Ca screen colon breast cervicalbull Antipsych meds with A1c testbull PP and prenatal visit tielinessbull Childhood IMMIsbull Asthma on controllerbull etc
lowast Chronic disease management can be done in an underserved population requirementslowast Committed leadershiplowast Dedicated staff with a unifying purposelowast Validated and trusted data delivered when it is neededlowast Data analytics capabilitylowast Prioritization processlowast Leveraging community resourceslowast Engaged patientslowast Payment model to support activities outside typical
face-to-face visit
Summary
Key Concept- Data
Key Concept Teamwork + Transparency and Accountability
Key Concept- Innovation
Primary Care retinal photography
George Hayes CRR - Scripps Whittier Institute
Key Concept- Boldness
Key Concept- Team
Erika Bazan MA- Care Coordinator
Maria Acosta MA
Erica Cruz MA
Key Concept- Happy People
Chronic Disease Management in Underserved Populations- Mission Impossible
Audience Response
Evidence-based response
Slide Number 4
Chronic Disease Management in Underserved
Audience Response
Audience Response
Audience Response
Audience Response
Audience Response
Community Health Centers in San Diego County- the lsquoSafety Netrsquo
Local SD Payer Environment
Slide Number 13
CCC sites
Quality Work in CHCs
How does Quality happen in a CHC
Recent Council of Community Clinics Advances
Council of Community Clinics Tools
Council of Community Clinics
Slide Number 20
ALL HEART Clinics by County
ALL HEART Patients to Date
Slide Number 23
ALLHeart Results- QI Project CHCs
Slide Number 25
Slide Number 26
HYPERTENSION CONTROL DATA BY CLINIC ORGANIZATION-PopIq or individual reportsMeasurement Year March 31 2013 ndash February 28 2014N= 67241
Pop-IQ
PopIQ Data Analytics amp Data Aggregation
PopIQ Hypertension Blood Pressure lt 14090
PopIQ Blood Pressure lt 14090Diabetes
PopIQ DM Blood Pressure lt 14090
PopIQ Diabetics with HbA1c TestingHbA1c lt 7
Slide Number 34
What measures will be collecting for 2015-2016
Some measures will be stratified by age gender zip code in 2015-2016
Estimated 2014 Blood Pressure Control Rates by Quarter amp Group
Estimated 2014 Blood Pressure Control Rates by Quarter amp Insurance Type
Estimated 2014 Patients with Newly Controlled Blood Pressure by Quarter amp Insurance
Estimated 2014 Pts w Blood Pressure Control
Slide Number 41
Neighborhood Healthcare
Slide Number 43
NHC- Providing Quality Health Care Since 1969
Slide Number 45
Slide Number 46
Slide Number 47
Slide Number 48
Slide Number 49
Slide Number 50
CDM in Underserved- PCMH
How to get better population quality
How to get better population quality
NHC QM Efforts- Workflow changes
Workflow changes Pt flow redesign
Workflow changes Individual Reports- Huddles
How to get better population quality- Support Staff
How to get better population quality- Innovation
Innovation Project Dulce
Project Dulce Cost-Effectiveness
Slide Number 61
Innovation
How to get better population quality DATA
NHC Data Journey EMR
Data
Data- Grief Stages 6 and 7
Point-of-Service Data
Point-of-Service DataPre-visit PlanningProactive
eCW Alerts app
Population Management
Organization Wide Trend
Colorectal Cancer Screening Project
CRC-In reach
In reach
Outreach
Hypertension and Diabetes efforts at NHC
Neighborhood Healthcare ALLHeart Project
How are we doing BP Control UDS
NHCCCC HTN ProtocolOctober 2013
How are we doing BP ControlDMALL
How are we doing BP Control
How are we doing BP Control
How are we doing DM BP control
Getting Quality Data to the Medical Staff
NHC Physician- level Interactive Real Time Quality Detail- panel level detail
Key Concept Teamwork + Transparency and Accountability
Key Concept- Innovation
Key Concept- Boldness
Key Concept- Team
Key Concept- Happy People
Slide Number 97
lowast Data overload-lowast providers burn out trying to be 1 in everything drive their
team crazy start focusing on the numbers over actual clinical quality start pt dumpingcherry picking
lowast Remedy only emphasize a few things at a time reward for one or two priority areas reward whole team
lowast Apathylowast too much data people revert back to concentrating on
individual pt carelowast Feel futility at times- moving the result takes effort and timelowast Remedy give the populationprevention tasks to others (RNs
+ data analysts midlevels dedicated to specific roles advanced MAs in conjunction with their team under protocols health coaches etc)
A1cLDLMAbcreatFoot examRetina screenALL medsASABP controlStatinCRC screenBreast Ca screenCervical Ca screenDepression screenAlcohol screenImmunizations due todaydeclinedTobacco usecounselling dueHIV done everVisit summary printed (MU)eRx sent (MU measure)
eCW Alerts app
lowast Donrsquot wait for the patient to show up- identify the needs and go get them
lowast New skillslowast Datadata analysislowast Prioritization of a lot of needlowast Proactive pt activationeducation for preventive care
lowast How financedlowast LIHP funding for population management and PCMHlowast Health Plan very little fundinglowast CHC payment model a handicap
lowast Best example CRC screenlowast Key finding team responsibility for screening and
monitoring (not JUST the MD)
Population Management
Organization Wide Trend
0
10
20
30
40
50
60
70
1 12 23 34 45 56 67 78 89 100 111
122
133
144
155
166
177
188
199
210
221
232
243
254
265
276
287
298
309
320
331
342
353
364
375
CRC screened
CRC screened
56 82015
lowast Partners KP C4 PASD LabCorp lowast Minimum funding from C4lowast LabCorp donated FIT tests
lowast Pt identified needing CRC screen lowast during visit via eCW alerts applowast proactively using registry
lowast FIT test givenlowast Tests tracked by Panel Managers
lowast Pt contacted if kit not returned in 2 wkslowast Results tracked monthly
lowast Reported to sites med staff QM BOD periodicallylowast Positive tests free colonoscopy by Kaiser via Project Access San Diegolowast Positive Biopsies
lowast Kaiser-donated surgery imaging specialty consultRx planlowast PASD arranges for donated oncology eval XRT if needed ChemoRx if
needed
Colorectal Cancer Screening Project
CRC-In reachlowast The daily huddle
In reachlowast Identifying Patients due for CRC Screening lowast eCW Alert app developed by Dr Kulin Tantod
Outreachlowast Identifying Patients due for CRC Screening lowast Data registry developed by Dr Kulin Tantod
Hypertension and Diabetes efforts at NHC
Neighborhood Healthcare ALLHeart Project
lowast Project Increase the number of ALLHEART patients on both medications lowast RN protocollowast MD education videolowast Added to alerts app if not on ACEARB amp Statinlowast Added to medical staff clinical measures dashboardlowast Monitoring overall performance monthlylowast ASCVD Risk Calculator embedded in alerts app with
hyperlink to reference
How are we doing BP Control UDS 77
82415
NHCCCC HTN Protocol
October 2013
How are we doing BP ControlDMALL
DM lt14090 83 (33293999)
HTN 77 (66938713)65 on 31614
DM gt50 on ACEARB + Statin75 on 10914 (24583269)70 on 31614
How are we doing BP ControlAs of 31014
How are we doing BP ControlAs of 2515
How are we doing DM BP control
lowast MDs are competitivelowast Data + supportmoving the curve
Getting Quality Data to the Medical Staff
NHC Physician- level Interactive Real Time Quality Detail- panel level detail
Individual real timeDetailed
Trending
Peer-normative
Actionable
On-demand Quality Data- Actionable Data
bull Click any column to generate recall list
bull All recall items identified- one-call hits all items
Outreachlowast Identifying Patients due for CRC Screening lowast Data registry developed by Dr Kulin Tantod
bull Panel Sizebull DM A1clt9 BP 14090 LDL lt100 bull HTN BP lt14090 ALL medsbull Ca screen colon breast cervicalbull Antipsych meds with A1c testbull PP and prenatal visit tielinessbull Childhood IMMIsbull Asthma on controllerbull etc
lowast Chronic disease management can be done in an underserved population requirementslowast Committed leadershiplowast Dedicated staff with a unifying purposelowast Validated and trusted data delivered when it is neededlowast Data analytics capabilitylowast Prioritization processlowast Leveraging community resourceslowast Engaged patientslowast Payment model to support activities outside typical
face-to-face visit
Summary
Key Concept- Data
Key Concept Teamwork + Transparency and Accountability
Key Concept- Innovation
Primary Care retinal photography
George Hayes CRR - Scripps Whittier Institute
Key Concept- Boldness
Key Concept- Team
Erika Bazan MA- Care Coordinator
Maria Acosta MA
Erica Cruz MA
Key Concept- Happy People
Chronic Disease Management in Underserved Populations- Mission Impossible
Audience Response
Evidence-based response
Slide Number 4
Chronic Disease Management in Underserved
Audience Response
Audience Response
Audience Response
Audience Response
Audience Response
Community Health Centers in San Diego County- the lsquoSafety Netrsquo
Local SD Payer Environment
Slide Number 13
CCC sites
Quality Work in CHCs
How does Quality happen in a CHC
Recent Council of Community Clinics Advances
Council of Community Clinics Tools
Council of Community Clinics
Slide Number 20
ALL HEART Clinics by County
ALL HEART Patients to Date
Slide Number 23
ALLHeart Results- QI Project CHCs
Slide Number 25
Slide Number 26
HYPERTENSION CONTROL DATA BY CLINIC ORGANIZATION-PopIq or individual reportsMeasurement Year March 31 2013 ndash February 28 2014N= 67241
Pop-IQ
PopIQ Data Analytics amp Data Aggregation
PopIQ Hypertension Blood Pressure lt 14090
PopIQ Blood Pressure lt 14090Diabetes
PopIQ DM Blood Pressure lt 14090
PopIQ Diabetics with HbA1c TestingHbA1c lt 7
Slide Number 34
What measures will be collecting for 2015-2016
Some measures will be stratified by age gender zip code in 2015-2016
Estimated 2014 Blood Pressure Control Rates by Quarter amp Group
Estimated 2014 Blood Pressure Control Rates by Quarter amp Insurance Type
Estimated 2014 Patients with Newly Controlled Blood Pressure by Quarter amp Insurance
Estimated 2014 Pts w Blood Pressure Control
Slide Number 41
Neighborhood Healthcare
Slide Number 43
NHC- Providing Quality Health Care Since 1969
Slide Number 45
Slide Number 46
Slide Number 47
Slide Number 48
Slide Number 49
Slide Number 50
CDM in Underserved- PCMH
How to get better population quality
How to get better population quality
NHC QM Efforts- Workflow changes
Workflow changes Pt flow redesign
Workflow changes Individual Reports- Huddles
How to get better population quality- Support Staff
How to get better population quality- Innovation
Innovation Project Dulce
Project Dulce Cost-Effectiveness
Slide Number 61
Innovation
How to get better population quality DATA
NHC Data Journey EMR
Data
Data- Grief Stages 6 and 7
Point-of-Service Data
Point-of-Service DataPre-visit PlanningProactive
eCW Alerts app
Population Management
Organization Wide Trend
Colorectal Cancer Screening Project
CRC-In reach
In reach
Outreach
Hypertension and Diabetes efforts at NHC
Neighborhood Healthcare ALLHeart Project
How are we doing BP Control UDS
NHCCCC HTN ProtocolOctober 2013
How are we doing BP ControlDMALL
How are we doing BP Control
How are we doing BP Control
How are we doing DM BP control
Getting Quality Data to the Medical Staff
NHC Physician- level Interactive Real Time Quality Detail- panel level detail
Key Concept Teamwork + Transparency and Accountability
Key Concept- Innovation
Key Concept- Boldness
Key Concept- Team
Key Concept- Happy People
Slide Number 97
eCW Alerts app
lowast Donrsquot wait for the patient to show up- identify the needs and go get them
lowast New skillslowast Datadata analysislowast Prioritization of a lot of needlowast Proactive pt activationeducation for preventive care
lowast How financedlowast LIHP funding for population management and PCMHlowast Health Plan very little fundinglowast CHC payment model a handicap
lowast Best example CRC screenlowast Key finding team responsibility for screening and
monitoring (not JUST the MD)
Population Management
Organization Wide Trend
0
10
20
30
40
50
60
70
1 12 23 34 45 56 67 78 89 100 111
122
133
144
155
166
177
188
199
210
221
232
243
254
265
276
287
298
309
320
331
342
353
364
375
CRC screened
CRC screened
56 82015
lowast Partners KP C4 PASD LabCorp lowast Minimum funding from C4lowast LabCorp donated FIT tests
lowast Pt identified needing CRC screen lowast during visit via eCW alerts applowast proactively using registry
lowast FIT test givenlowast Tests tracked by Panel Managers
lowast Pt contacted if kit not returned in 2 wkslowast Results tracked monthly
lowast Reported to sites med staff QM BOD periodicallylowast Positive tests free colonoscopy by Kaiser via Project Access San Diegolowast Positive Biopsies
lowast Kaiser-donated surgery imaging specialty consultRx planlowast PASD arranges for donated oncology eval XRT if needed ChemoRx if
needed
Colorectal Cancer Screening Project
CRC-In reachlowast The daily huddle
In reachlowast Identifying Patients due for CRC Screening lowast eCW Alert app developed by Dr Kulin Tantod
Outreachlowast Identifying Patients due for CRC Screening lowast Data registry developed by Dr Kulin Tantod
Hypertension and Diabetes efforts at NHC
Neighborhood Healthcare ALLHeart Project
lowast Project Increase the number of ALLHEART patients on both medications lowast RN protocollowast MD education videolowast Added to alerts app if not on ACEARB amp Statinlowast Added to medical staff clinical measures dashboardlowast Monitoring overall performance monthlylowast ASCVD Risk Calculator embedded in alerts app with
hyperlink to reference
How are we doing BP Control UDS 77
82415
NHCCCC HTN Protocol
October 2013
How are we doing BP ControlDMALL
DM lt14090 83 (33293999)
HTN 77 (66938713)65 on 31614
DM gt50 on ACEARB + Statin75 on 10914 (24583269)70 on 31614
How are we doing BP ControlAs of 31014
How are we doing BP ControlAs of 2515
How are we doing DM BP control
lowast MDs are competitivelowast Data + supportmoving the curve
Getting Quality Data to the Medical Staff
NHC Physician- level Interactive Real Time Quality Detail- panel level detail
Individual real timeDetailed
Trending
Peer-normative
Actionable
On-demand Quality Data- Actionable Data
bull Click any column to generate recall list
bull All recall items identified- one-call hits all items
Outreachlowast Identifying Patients due for CRC Screening lowast Data registry developed by Dr Kulin Tantod
bull Panel Sizebull DM A1clt9 BP 14090 LDL lt100 bull HTN BP lt14090 ALL medsbull Ca screen colon breast cervicalbull Antipsych meds with A1c testbull PP and prenatal visit tielinessbull Childhood IMMIsbull Asthma on controllerbull etc
lowast Chronic disease management can be done in an underserved population requirementslowast Committed leadershiplowast Dedicated staff with a unifying purposelowast Validated and trusted data delivered when it is neededlowast Data analytics capabilitylowast Prioritization processlowast Leveraging community resourceslowast Engaged patientslowast Payment model to support activities outside typical
face-to-face visit
Summary
Key Concept- Data
Key Concept Teamwork + Transparency and Accountability
Key Concept- Innovation
Primary Care retinal photography
George Hayes CRR - Scripps Whittier Institute
Key Concept- Boldness
Key Concept- Team
Erika Bazan MA- Care Coordinator
Maria Acosta MA
Erica Cruz MA
Key Concept- Happy People
Chronic Disease Management in Underserved Populations- Mission Impossible
Audience Response
Evidence-based response
Slide Number 4
Chronic Disease Management in Underserved
Audience Response
Audience Response
Audience Response
Audience Response
Audience Response
Community Health Centers in San Diego County- the lsquoSafety Netrsquo
Local SD Payer Environment
Slide Number 13
CCC sites
Quality Work in CHCs
How does Quality happen in a CHC
Recent Council of Community Clinics Advances
Council of Community Clinics Tools
Council of Community Clinics
Slide Number 20
ALL HEART Clinics by County
ALL HEART Patients to Date
Slide Number 23
ALLHeart Results- QI Project CHCs
Slide Number 25
Slide Number 26
HYPERTENSION CONTROL DATA BY CLINIC ORGANIZATION-PopIq or individual reportsMeasurement Year March 31 2013 ndash February 28 2014N= 67241
Pop-IQ
PopIQ Data Analytics amp Data Aggregation
PopIQ Hypertension Blood Pressure lt 14090
PopIQ Blood Pressure lt 14090Diabetes
PopIQ DM Blood Pressure lt 14090
PopIQ Diabetics with HbA1c TestingHbA1c lt 7
Slide Number 34
What measures will be collecting for 2015-2016
Some measures will be stratified by age gender zip code in 2015-2016
Estimated 2014 Blood Pressure Control Rates by Quarter amp Group
Estimated 2014 Blood Pressure Control Rates by Quarter amp Insurance Type
Estimated 2014 Patients with Newly Controlled Blood Pressure by Quarter amp Insurance
Estimated 2014 Pts w Blood Pressure Control
Slide Number 41
Neighborhood Healthcare
Slide Number 43
NHC- Providing Quality Health Care Since 1969
Slide Number 45
Slide Number 46
Slide Number 47
Slide Number 48
Slide Number 49
Slide Number 50
CDM in Underserved- PCMH
How to get better population quality
How to get better population quality
NHC QM Efforts- Workflow changes
Workflow changes Pt flow redesign
Workflow changes Individual Reports- Huddles
How to get better population quality- Support Staff
How to get better population quality- Innovation
Innovation Project Dulce
Project Dulce Cost-Effectiveness
Slide Number 61
Innovation
How to get better population quality DATA
NHC Data Journey EMR
Data
Data- Grief Stages 6 and 7
Point-of-Service Data
Point-of-Service DataPre-visit PlanningProactive
eCW Alerts app
Population Management
Organization Wide Trend
Colorectal Cancer Screening Project
CRC-In reach
In reach
Outreach
Hypertension and Diabetes efforts at NHC
Neighborhood Healthcare ALLHeart Project
How are we doing BP Control UDS
NHCCCC HTN ProtocolOctober 2013
How are we doing BP ControlDMALL
How are we doing BP Control
How are we doing BP Control
How are we doing DM BP control
Getting Quality Data to the Medical Staff
NHC Physician- level Interactive Real Time Quality Detail- panel level detail
Key Concept Teamwork + Transparency and Accountability
Key Concept- Innovation
Key Concept- Boldness
Key Concept- Team
Key Concept- Happy People
Slide Number 97
Organization Wide Trend
0
10
20
30
40
50
60
70
1 12 23 34 45 56 67 78 89 100 111
122
133
144
155
166
177
188
199
210
221
232
243
254
265
276
287
298
309
320
331
342
353
364
375
CRC screened
CRC screened
56 82015
lowast Partners KP C4 PASD LabCorp lowast Minimum funding from C4lowast LabCorp donated FIT tests
lowast Pt identified needing CRC screen lowast during visit via eCW alerts applowast proactively using registry
lowast FIT test givenlowast Tests tracked by Panel Managers
lowast Pt contacted if kit not returned in 2 wkslowast Results tracked monthly
lowast Reported to sites med staff QM BOD periodicallylowast Positive tests free colonoscopy by Kaiser via Project Access San Diegolowast Positive Biopsies
lowast Kaiser-donated surgery imaging specialty consultRx planlowast PASD arranges for donated oncology eval XRT if needed ChemoRx if
needed
Colorectal Cancer Screening Project
CRC-In reachlowast The daily huddle
In reachlowast Identifying Patients due for CRC Screening lowast eCW Alert app developed by Dr Kulin Tantod
Outreachlowast Identifying Patients due for CRC Screening lowast Data registry developed by Dr Kulin Tantod
Hypertension and Diabetes efforts at NHC
Neighborhood Healthcare ALLHeart Project
lowast Project Increase the number of ALLHEART patients on both medications lowast RN protocollowast MD education videolowast Added to alerts app if not on ACEARB amp Statinlowast Added to medical staff clinical measures dashboardlowast Monitoring overall performance monthlylowast ASCVD Risk Calculator embedded in alerts app with
hyperlink to reference
How are we doing BP Control UDS 77
82415
NHCCCC HTN Protocol
October 2013
How are we doing BP ControlDMALL
DM lt14090 83 (33293999)
HTN 77 (66938713)65 on 31614
DM gt50 on ACEARB + Statin75 on 10914 (24583269)70 on 31614
How are we doing BP ControlAs of 31014
How are we doing BP ControlAs of 2515
How are we doing DM BP control
lowast MDs are competitivelowast Data + supportmoving the curve
Getting Quality Data to the Medical Staff
NHC Physician- level Interactive Real Time Quality Detail- panel level detail
Individual real timeDetailed
Trending
Peer-normative
Actionable
On-demand Quality Data- Actionable Data
bull Click any column to generate recall list
bull All recall items identified- one-call hits all items
Outreachlowast Identifying Patients due for CRC Screening lowast Data registry developed by Dr Kulin Tantod
bull Panel Sizebull DM A1clt9 BP 14090 LDL lt100 bull HTN BP lt14090 ALL medsbull Ca screen colon breast cervicalbull Antipsych meds with A1c testbull PP and prenatal visit tielinessbull Childhood IMMIsbull Asthma on controllerbull etc
lowast Chronic disease management can be done in an underserved population requirementslowast Committed leadershiplowast Dedicated staff with a unifying purposelowast Validated and trusted data delivered when it is neededlowast Data analytics capabilitylowast Prioritization processlowast Leveraging community resourceslowast Engaged patientslowast Payment model to support activities outside typical
face-to-face visit
Summary
Key Concept- Data
Key Concept Teamwork + Transparency and Accountability
Key Concept- Innovation
Primary Care retinal photography
George Hayes CRR - Scripps Whittier Institute
Key Concept- Boldness
Key Concept- Team
Erika Bazan MA- Care Coordinator
Maria Acosta MA
Erica Cruz MA
Key Concept- Happy People
Chronic Disease Management in Underserved Populations- Mission Impossible
Audience Response
Evidence-based response
Slide Number 4
Chronic Disease Management in Underserved
Audience Response
Audience Response
Audience Response
Audience Response
Audience Response
Community Health Centers in San Diego County- the lsquoSafety Netrsquo
Local SD Payer Environment
Slide Number 13
CCC sites
Quality Work in CHCs
How does Quality happen in a CHC
Recent Council of Community Clinics Advances
Council of Community Clinics Tools
Council of Community Clinics
Slide Number 20
ALL HEART Clinics by County
ALL HEART Patients to Date
Slide Number 23
ALLHeart Results- QI Project CHCs
Slide Number 25
Slide Number 26
HYPERTENSION CONTROL DATA BY CLINIC ORGANIZATION-PopIq or individual reportsMeasurement Year March 31 2013 ndash February 28 2014N= 67241
Pop-IQ
PopIQ Data Analytics amp Data Aggregation
PopIQ Hypertension Blood Pressure lt 14090
PopIQ Blood Pressure lt 14090Diabetes
PopIQ DM Blood Pressure lt 14090
PopIQ Diabetics with HbA1c TestingHbA1c lt 7
Slide Number 34
What measures will be collecting for 2015-2016
Some measures will be stratified by age gender zip code in 2015-2016
Estimated 2014 Blood Pressure Control Rates by Quarter amp Group
Estimated 2014 Blood Pressure Control Rates by Quarter amp Insurance Type
Estimated 2014 Patients with Newly Controlled Blood Pressure by Quarter amp Insurance
Estimated 2014 Pts w Blood Pressure Control
Slide Number 41
Neighborhood Healthcare
Slide Number 43
NHC- Providing Quality Health Care Since 1969
Slide Number 45
Slide Number 46
Slide Number 47
Slide Number 48
Slide Number 49
Slide Number 50
CDM in Underserved- PCMH
How to get better population quality
How to get better population quality
NHC QM Efforts- Workflow changes
Workflow changes Pt flow redesign
Workflow changes Individual Reports- Huddles
How to get better population quality- Support Staff
How to get better population quality- Innovation
Innovation Project Dulce
Project Dulce Cost-Effectiveness
Slide Number 61
Innovation
How to get better population quality DATA
NHC Data Journey EMR
Data
Data- Grief Stages 6 and 7
Point-of-Service Data
Point-of-Service DataPre-visit PlanningProactive
eCW Alerts app
Population Management
Organization Wide Trend
Colorectal Cancer Screening Project
CRC-In reach
In reach
Outreach
Hypertension and Diabetes efforts at NHC
Neighborhood Healthcare ALLHeart Project
How are we doing BP Control UDS
NHCCCC HTN ProtocolOctober 2013
How are we doing BP ControlDMALL
How are we doing BP Control
How are we doing BP Control
How are we doing DM BP control
Getting Quality Data to the Medical Staff
NHC Physician- level Interactive Real Time Quality Detail- panel level detail
Key Concept Teamwork + Transparency and Accountability
Key Concept- Innovation
Key Concept- Boldness
Key Concept- Team
Key Concept- Happy People
Slide Number 97
Outreachlowast Identifying Patients due for CRC Screening lowast Data registry developed by Dr Kulin Tantod
Hypertension and Diabetes efforts at NHC
Neighborhood Healthcare ALLHeart Project
lowast Project Increase the number of ALLHEART patients on both medications lowast RN protocollowast MD education videolowast Added to alerts app if not on ACEARB amp Statinlowast Added to medical staff clinical measures dashboardlowast Monitoring overall performance monthlylowast ASCVD Risk Calculator embedded in alerts app with
hyperlink to reference
How are we doing BP Control UDS 77
82415
NHCCCC HTN Protocol
October 2013
How are we doing BP ControlDMALL
DM lt14090 83 (33293999)
HTN 77 (66938713)65 on 31614
DM gt50 on ACEARB + Statin75 on 10914 (24583269)70 on 31614
How are we doing BP ControlAs of 31014
How are we doing BP ControlAs of 2515
How are we doing DM BP control
lowast MDs are competitivelowast Data + supportmoving the curve
Getting Quality Data to the Medical Staff
NHC Physician- level Interactive Real Time Quality Detail- panel level detail
Individual real timeDetailed
Trending
Peer-normative
Actionable
On-demand Quality Data- Actionable Data
bull Click any column to generate recall list
bull All recall items identified- one-call hits all items
Outreachlowast Identifying Patients due for CRC Screening lowast Data registry developed by Dr Kulin Tantod
bull Panel Sizebull DM A1clt9 BP 14090 LDL lt100 bull HTN BP lt14090 ALL medsbull Ca screen colon breast cervicalbull Antipsych meds with A1c testbull PP and prenatal visit tielinessbull Childhood IMMIsbull Asthma on controllerbull etc
lowast Chronic disease management can be done in an underserved population requirementslowast Committed leadershiplowast Dedicated staff with a unifying purposelowast Validated and trusted data delivered when it is neededlowast Data analytics capabilitylowast Prioritization processlowast Leveraging community resourceslowast Engaged patientslowast Payment model to support activities outside typical
face-to-face visit
Summary
Key Concept- Data
Key Concept Teamwork + Transparency and Accountability
Key Concept- Innovation
Primary Care retinal photography
George Hayes CRR - Scripps Whittier Institute
Key Concept- Boldness
Key Concept- Team
Erika Bazan MA- Care Coordinator
Maria Acosta MA
Erica Cruz MA
Key Concept- Happy People
Chronic Disease Management in Underserved Populations- Mission Impossible
Audience Response
Evidence-based response
Slide Number 4
Chronic Disease Management in Underserved
Audience Response
Audience Response
Audience Response
Audience Response
Audience Response
Community Health Centers in San Diego County- the lsquoSafety Netrsquo
Local SD Payer Environment
Slide Number 13
CCC sites
Quality Work in CHCs
How does Quality happen in a CHC
Recent Council of Community Clinics Advances
Council of Community Clinics Tools
Council of Community Clinics
Slide Number 20
ALL HEART Clinics by County
ALL HEART Patients to Date
Slide Number 23
ALLHeart Results- QI Project CHCs
Slide Number 25
Slide Number 26
HYPERTENSION CONTROL DATA BY CLINIC ORGANIZATION-PopIq or individual reportsMeasurement Year March 31 2013 ndash February 28 2014N= 67241
Pop-IQ
PopIQ Data Analytics amp Data Aggregation
PopIQ Hypertension Blood Pressure lt 14090
PopIQ Blood Pressure lt 14090Diabetes
PopIQ DM Blood Pressure lt 14090
PopIQ Diabetics with HbA1c TestingHbA1c lt 7
Slide Number 34
What measures will be collecting for 2015-2016
Some measures will be stratified by age gender zip code in 2015-2016
Estimated 2014 Blood Pressure Control Rates by Quarter amp Group
Estimated 2014 Blood Pressure Control Rates by Quarter amp Insurance Type
Estimated 2014 Patients with Newly Controlled Blood Pressure by Quarter amp Insurance
Estimated 2014 Pts w Blood Pressure Control
Slide Number 41
Neighborhood Healthcare
Slide Number 43
NHC- Providing Quality Health Care Since 1969
Slide Number 45
Slide Number 46
Slide Number 47
Slide Number 48
Slide Number 49
Slide Number 50
CDM in Underserved- PCMH
How to get better population quality
How to get better population quality
NHC QM Efforts- Workflow changes
Workflow changes Pt flow redesign
Workflow changes Individual Reports- Huddles
How to get better population quality- Support Staff
How to get better population quality- Innovation
Innovation Project Dulce
Project Dulce Cost-Effectiveness
Slide Number 61
Innovation
How to get better population quality DATA
NHC Data Journey EMR
Data
Data- Grief Stages 6 and 7
Point-of-Service Data
Point-of-Service DataPre-visit PlanningProactive
eCW Alerts app
Population Management
Organization Wide Trend
Colorectal Cancer Screening Project
CRC-In reach
In reach
Outreach
Hypertension and Diabetes efforts at NHC
Neighborhood Healthcare ALLHeart Project
How are we doing BP Control UDS
NHCCCC HTN ProtocolOctober 2013
How are we doing BP ControlDMALL
How are we doing BP Control
How are we doing BP Control
How are we doing DM BP control
Getting Quality Data to the Medical Staff
NHC Physician- level Interactive Real Time Quality Detail- panel level detail
Key Concept Teamwork + Transparency and Accountability
Key Concept- Innovation
Key Concept- Boldness
Key Concept- Team
Key Concept- Happy People
Slide Number 97
Hypertension and Diabetes efforts at NHC
Neighborhood Healthcare ALLHeart Project
lowast Project Increase the number of ALLHEART patients on both medications lowast RN protocollowast MD education videolowast Added to alerts app if not on ACEARB amp Statinlowast Added to medical staff clinical measures dashboardlowast Monitoring overall performance monthlylowast ASCVD Risk Calculator embedded in alerts app with
hyperlink to reference
How are we doing BP Control UDS 77
82415
NHCCCC HTN Protocol
October 2013
How are we doing BP ControlDMALL
DM lt14090 83 (33293999)
HTN 77 (66938713)65 on 31614
DM gt50 on ACEARB + Statin75 on 10914 (24583269)70 on 31614
How are we doing BP ControlAs of 31014
How are we doing BP ControlAs of 2515
How are we doing DM BP control
lowast MDs are competitivelowast Data + supportmoving the curve
Getting Quality Data to the Medical Staff
NHC Physician- level Interactive Real Time Quality Detail- panel level detail
Individual real timeDetailed
Trending
Peer-normative
Actionable
On-demand Quality Data- Actionable Data
bull Click any column to generate recall list
bull All recall items identified- one-call hits all items
Outreachlowast Identifying Patients due for CRC Screening lowast Data registry developed by Dr Kulin Tantod
bull Panel Sizebull DM A1clt9 BP 14090 LDL lt100 bull HTN BP lt14090 ALL medsbull Ca screen colon breast cervicalbull Antipsych meds with A1c testbull PP and prenatal visit tielinessbull Childhood IMMIsbull Asthma on controllerbull etc
lowast Chronic disease management can be done in an underserved population requirementslowast Committed leadershiplowast Dedicated staff with a unifying purposelowast Validated and trusted data delivered when it is neededlowast Data analytics capabilitylowast Prioritization processlowast Leveraging community resourceslowast Engaged patientslowast Payment model to support activities outside typical
face-to-face visit
Summary
Key Concept- Data
Key Concept Teamwork + Transparency and Accountability
Key Concept- Innovation
Primary Care retinal photography
George Hayes CRR - Scripps Whittier Institute
Key Concept- Boldness
Key Concept- Team
Erika Bazan MA- Care Coordinator
Maria Acosta MA
Erica Cruz MA
Key Concept- Happy People
Chronic Disease Management in Underserved Populations- Mission Impossible
Audience Response
Evidence-based response
Slide Number 4
Chronic Disease Management in Underserved
Audience Response
Audience Response
Audience Response
Audience Response
Audience Response
Community Health Centers in San Diego County- the lsquoSafety Netrsquo
Local SD Payer Environment
Slide Number 13
CCC sites
Quality Work in CHCs
How does Quality happen in a CHC
Recent Council of Community Clinics Advances
Council of Community Clinics Tools
Council of Community Clinics
Slide Number 20
ALL HEART Clinics by County
ALL HEART Patients to Date
Slide Number 23
ALLHeart Results- QI Project CHCs
Slide Number 25
Slide Number 26
HYPERTENSION CONTROL DATA BY CLINIC ORGANIZATION-PopIq or individual reportsMeasurement Year March 31 2013 ndash February 28 2014N= 67241
Pop-IQ
PopIQ Data Analytics amp Data Aggregation
PopIQ Hypertension Blood Pressure lt 14090
PopIQ Blood Pressure lt 14090Diabetes
PopIQ DM Blood Pressure lt 14090
PopIQ Diabetics with HbA1c TestingHbA1c lt 7
Slide Number 34
What measures will be collecting for 2015-2016
Some measures will be stratified by age gender zip code in 2015-2016
Estimated 2014 Blood Pressure Control Rates by Quarter amp Group
Estimated 2014 Blood Pressure Control Rates by Quarter amp Insurance Type
Estimated 2014 Patients with Newly Controlled Blood Pressure by Quarter amp Insurance
Estimated 2014 Pts w Blood Pressure Control
Slide Number 41
Neighborhood Healthcare
Slide Number 43
NHC- Providing Quality Health Care Since 1969
Slide Number 45
Slide Number 46
Slide Number 47
Slide Number 48
Slide Number 49
Slide Number 50
CDM in Underserved- PCMH
How to get better population quality
How to get better population quality
NHC QM Efforts- Workflow changes
Workflow changes Pt flow redesign
Workflow changes Individual Reports- Huddles
How to get better population quality- Support Staff
How to get better population quality- Innovation
Innovation Project Dulce
Project Dulce Cost-Effectiveness
Slide Number 61
Innovation
How to get better population quality DATA
NHC Data Journey EMR
Data
Data- Grief Stages 6 and 7
Point-of-Service Data
Point-of-Service DataPre-visit PlanningProactive
eCW Alerts app
Population Management
Organization Wide Trend
Colorectal Cancer Screening Project
CRC-In reach
In reach
Outreach
Hypertension and Diabetes efforts at NHC
Neighborhood Healthcare ALLHeart Project
How are we doing BP Control UDS
NHCCCC HTN ProtocolOctober 2013
How are we doing BP ControlDMALL
How are we doing BP Control
How are we doing BP Control
How are we doing DM BP control
Getting Quality Data to the Medical Staff
NHC Physician- level Interactive Real Time Quality Detail- panel level detail
Key Concept Teamwork + Transparency and Accountability
Key Concept- Innovation
Key Concept- Boldness
Key Concept- Team
Key Concept- Happy People
Slide Number 97
Neighborhood Healthcare ALLHeart Project
lowast Project Increase the number of ALLHEART patients on both medications lowast RN protocollowast MD education videolowast Added to alerts app if not on ACEARB amp Statinlowast Added to medical staff clinical measures dashboardlowast Monitoring overall performance monthlylowast ASCVD Risk Calculator embedded in alerts app with
hyperlink to reference
How are we doing BP Control UDS 77
82415
NHCCCC HTN Protocol
October 2013
How are we doing BP ControlDMALL
DM lt14090 83 (33293999)
HTN 77 (66938713)65 on 31614
DM gt50 on ACEARB + Statin75 on 10914 (24583269)70 on 31614
How are we doing BP ControlAs of 31014
How are we doing BP ControlAs of 2515
How are we doing DM BP control
lowast MDs are competitivelowast Data + supportmoving the curve
Getting Quality Data to the Medical Staff
NHC Physician- level Interactive Real Time Quality Detail- panel level detail
Individual real timeDetailed
Trending
Peer-normative
Actionable
On-demand Quality Data- Actionable Data
bull Click any column to generate recall list
bull All recall items identified- one-call hits all items
Outreachlowast Identifying Patients due for CRC Screening lowast Data registry developed by Dr Kulin Tantod
bull Panel Sizebull DM A1clt9 BP 14090 LDL lt100 bull HTN BP lt14090 ALL medsbull Ca screen colon breast cervicalbull Antipsych meds with A1c testbull PP and prenatal visit tielinessbull Childhood IMMIsbull Asthma on controllerbull etc
lowast Chronic disease management can be done in an underserved population requirementslowast Committed leadershiplowast Dedicated staff with a unifying purposelowast Validated and trusted data delivered when it is neededlowast Data analytics capabilitylowast Prioritization processlowast Leveraging community resourceslowast Engaged patientslowast Payment model to support activities outside typical
face-to-face visit
Summary
Key Concept- Data
Key Concept Teamwork + Transparency and Accountability
Key Concept- Innovation
Primary Care retinal photography
George Hayes CRR - Scripps Whittier Institute
Key Concept- Boldness
Key Concept- Team
Erika Bazan MA- Care Coordinator
Maria Acosta MA
Erica Cruz MA
Key Concept- Happy People
Chronic Disease Management in Underserved Populations- Mission Impossible
Audience Response
Evidence-based response
Slide Number 4
Chronic Disease Management in Underserved
Audience Response
Audience Response
Audience Response
Audience Response
Audience Response
Community Health Centers in San Diego County- the lsquoSafety Netrsquo
Local SD Payer Environment
Slide Number 13
CCC sites
Quality Work in CHCs
How does Quality happen in a CHC
Recent Council of Community Clinics Advances
Council of Community Clinics Tools
Council of Community Clinics
Slide Number 20
ALL HEART Clinics by County
ALL HEART Patients to Date
Slide Number 23
ALLHeart Results- QI Project CHCs
Slide Number 25
Slide Number 26
HYPERTENSION CONTROL DATA BY CLINIC ORGANIZATION-PopIq or individual reportsMeasurement Year March 31 2013 ndash February 28 2014N= 67241
Pop-IQ
PopIQ Data Analytics amp Data Aggregation
PopIQ Hypertension Blood Pressure lt 14090
PopIQ Blood Pressure lt 14090Diabetes
PopIQ DM Blood Pressure lt 14090
PopIQ Diabetics with HbA1c TestingHbA1c lt 7
Slide Number 34
What measures will be collecting for 2015-2016
Some measures will be stratified by age gender zip code in 2015-2016
Estimated 2014 Blood Pressure Control Rates by Quarter amp Group
Estimated 2014 Blood Pressure Control Rates by Quarter amp Insurance Type
Estimated 2014 Patients with Newly Controlled Blood Pressure by Quarter amp Insurance
Estimated 2014 Pts w Blood Pressure Control
Slide Number 41
Neighborhood Healthcare
Slide Number 43
NHC- Providing Quality Health Care Since 1969
Slide Number 45
Slide Number 46
Slide Number 47
Slide Number 48
Slide Number 49
Slide Number 50
CDM in Underserved- PCMH
How to get better population quality
How to get better population quality
NHC QM Efforts- Workflow changes
Workflow changes Pt flow redesign
Workflow changes Individual Reports- Huddles
How to get better population quality- Support Staff
How to get better population quality- Innovation
Innovation Project Dulce
Project Dulce Cost-Effectiveness
Slide Number 61
Innovation
How to get better population quality DATA
NHC Data Journey EMR
Data
Data- Grief Stages 6 and 7
Point-of-Service Data
Point-of-Service DataPre-visit PlanningProactive
eCW Alerts app
Population Management
Organization Wide Trend
Colorectal Cancer Screening Project
CRC-In reach
In reach
Outreach
Hypertension and Diabetes efforts at NHC
Neighborhood Healthcare ALLHeart Project
How are we doing BP Control UDS
NHCCCC HTN ProtocolOctober 2013
How are we doing BP ControlDMALL
How are we doing BP Control
How are we doing BP Control
How are we doing DM BP control
Getting Quality Data to the Medical Staff
NHC Physician- level Interactive Real Time Quality Detail- panel level detail
Key Concept Teamwork + Transparency and Accountability
Key Concept- Innovation
Key Concept- Boldness
Key Concept- Team
Key Concept- Happy People
Slide Number 97
lowast Chronic disease management can be done in an underserved population requirementslowast Committed leadershiplowast Dedicated staff with a unifying purposelowast Validated and trusted data delivered when it is neededlowast Data analytics capabilitylowast Prioritization processlowast Leveraging community resourceslowast Engaged patientslowast Payment model to support activities outside typical
face-to-face visit
Summary
Key Concept- Data
Key Concept Teamwork + Transparency and Accountability
Key Concept- Innovation
Primary Care retinal photography
George Hayes CRR - Scripps Whittier Institute
Key Concept- Boldness
Key Concept- Team
Erika Bazan MA- Care Coordinator
Maria Acosta MA
Erica Cruz MA
Key Concept- Happy People
Chronic Disease Management in Underserved Populations- Mission Impossible
Audience Response
Evidence-based response
Slide Number 4
Chronic Disease Management in Underserved
Audience Response
Audience Response
Audience Response
Audience Response
Audience Response
Community Health Centers in San Diego County- the lsquoSafety Netrsquo
Local SD Payer Environment
Slide Number 13
CCC sites
Quality Work in CHCs
How does Quality happen in a CHC
Recent Council of Community Clinics Advances
Council of Community Clinics Tools
Council of Community Clinics
Slide Number 20
ALL HEART Clinics by County
ALL HEART Patients to Date
Slide Number 23
ALLHeart Results- QI Project CHCs
Slide Number 25
Slide Number 26
HYPERTENSION CONTROL DATA BY CLINIC ORGANIZATION-PopIq or individual reportsMeasurement Year March 31 2013 ndash February 28 2014N= 67241
Pop-IQ
PopIQ Data Analytics amp Data Aggregation
PopIQ Hypertension Blood Pressure lt 14090
PopIQ Blood Pressure lt 14090Diabetes
PopIQ DM Blood Pressure lt 14090
PopIQ Diabetics with HbA1c TestingHbA1c lt 7
Slide Number 34
What measures will be collecting for 2015-2016
Some measures will be stratified by age gender zip code in 2015-2016
Estimated 2014 Blood Pressure Control Rates by Quarter amp Group
Estimated 2014 Blood Pressure Control Rates by Quarter amp Insurance Type
Estimated 2014 Patients with Newly Controlled Blood Pressure by Quarter amp Insurance
Estimated 2014 Pts w Blood Pressure Control
Slide Number 41
Neighborhood Healthcare
Slide Number 43
NHC- Providing Quality Health Care Since 1969
Slide Number 45
Slide Number 46
Slide Number 47
Slide Number 48
Slide Number 49
Slide Number 50
CDM in Underserved- PCMH
How to get better population quality
How to get better population quality
NHC QM Efforts- Workflow changes
Workflow changes Pt flow redesign
Workflow changes Individual Reports- Huddles
How to get better population quality- Support Staff
How to get better population quality- Innovation
Innovation Project Dulce
Project Dulce Cost-Effectiveness
Slide Number 61
Innovation
How to get better population quality DATA
NHC Data Journey EMR
Data
Data- Grief Stages 6 and 7
Point-of-Service Data
Point-of-Service DataPre-visit PlanningProactive
eCW Alerts app
Population Management
Organization Wide Trend
Colorectal Cancer Screening Project
CRC-In reach
In reach
Outreach
Hypertension and Diabetes efforts at NHC
Neighborhood Healthcare ALLHeart Project
How are we doing BP Control UDS
NHCCCC HTN ProtocolOctober 2013
How are we doing BP ControlDMALL
How are we doing BP Control
How are we doing BP Control
How are we doing DM BP control
Getting Quality Data to the Medical Staff
NHC Physician- level Interactive Real Time Quality Detail- panel level detail