Chuck West CASNR Water Center Plant & Soil Science Department Texas Tech University Role of Forage Crops and Grazing in the Water-Limited Texas High Plains Leu Distinguished Lecture, November 12, 2018
Transcript
Chuck WestCASNR Water CenterPlant & Soil Science DepartmentTexas Tech University
Role of Forage Crops and Grazing in the Water-Limited Texas High Plains
Leu Distinguished Lecture, November 12, 2018
2
Main Topics
The water situation Forage options Water footprint Graduate student research The future
• Ogallala Aquifer supports ~30% of U.S. crop and livestock production
• Increases U.S. agricultural production by more than $12 billion annually
Great Plains agriculture
USDA-NASS, 2016
Ogallala Aquifer
4
Hotspots of groundwater depletion
McGuire, 2014Haacker et al., 2015
Map of all cattle and calves. 1 Dot = 10,000 head (USDA-NASS, 2012)
6
Change in all cattle and calves, 2007-2012
South Plains
Panhandle
8
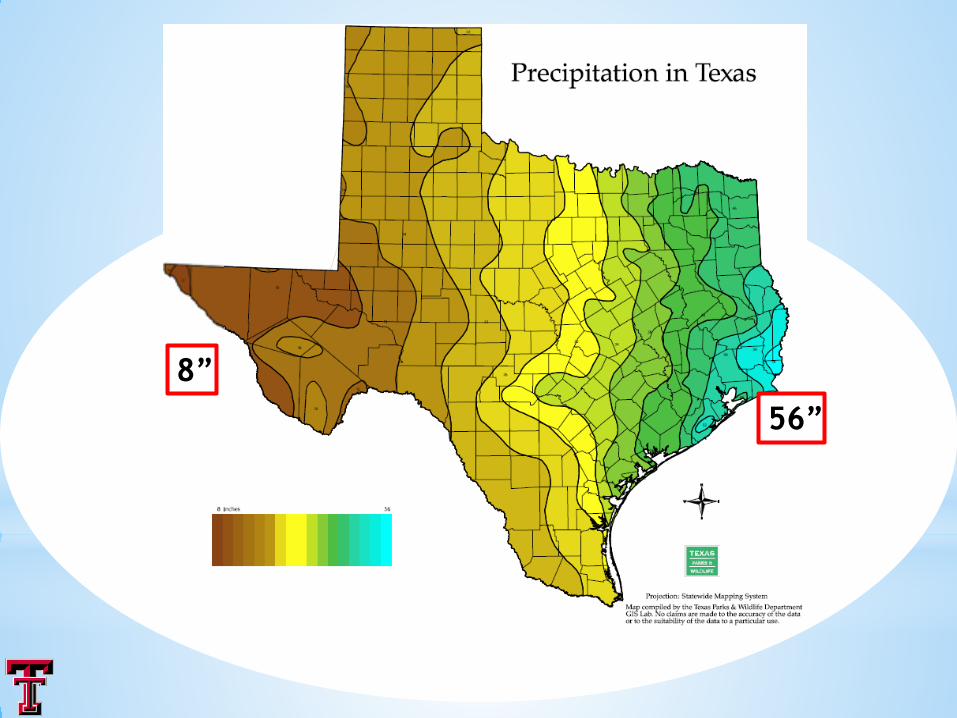
Southern Great Plains has chronic water deficit:
Low precipitation
High evaporative demand
0
2
4
6
8
10
12
RainfallPotential ET
Inches of water
Lubbock: Rain and PET by month
In Lubbock, PET exceeds rainfall in every month.
56”8”
Why forages and cattle?• Native ecosystem is grassland.
Hypothesis: Forages/livestock production provides profitable means of transitioning to low water-input and dryland agriculture in the Texas High Plains.
Capitalize on using high-quality forages with low resource inputs.
13
Forage Options – Largely warm-season grassesCool-season grasses limited by dry winters, hot summers
Rangeland – native species, short grasses, mesquite‘Improved’ grasses: old world bluestems, lovegrass, kleingrass
Dryland cropping area – Old world bluestems, wheat graze-out,sorghum, millets
Irrigated area – Silage crops, wheat, triticale, crop residue, teff,old world bluestem in transition to dryland, alfalfa
Alfalfa – declined area, in pockets, very profitable if enough water.Used for dairy calves and heifers, receiving feeder cattle,Largely replaced by co-products in diets.
I am emphasizing alfalfa for grazing.
14
cv WW-B.DahlBothriochloa bladii
Crop Monocultures Integrated Systems
Complementarity
Diversification
Allen et al. 2012. Agron. J. 104:162515
MonocultureCotton
Integrating livestock in Texas High PlainsIntegrated
Crop-Livestock
Rye
Cotton
Wheat
Wheat
Fallow
Rye
Old world bluestem
25% less irrigation40% less nitrogen
16
TAMU-TWRI, 2012
Crop breeding for water use efficiency
17
Very little effort in WUE of forages!
Silage cropSilage yield
Irrigation applied
Water footprint
tons/acre in./yr ac-in/ton
Sorghum 22.4 14.9 0.67Corn 22.5 22.9 1.00
Irrigation water use by sorghum and corn silages 4-yr avg.Bean and McCullem Texas A&M AgriLife-Amarillo
Result: forage sorghum can produce as much silage as corn at 2/3 the amount of irrigation.
The rub: forage sorghum produces less milk than corn silage. BMR trait can partially negate that deficit.
Comments about Water Use Efficiency vs. Water Footprint
WUE = is yield/water input [or /water used]ROI or ‘Bang for the Buck’
WF = is 1/WUE water use/yieldImpact of using a nonrenewable resource for
producing a low-value product because the economy depends on stretching the water supply.
Point: WUE of rain < that from irrigation.
19
Virtual Water in Agricultural ProductionVirtual water is that used in production and
processing of a commodity. Part of life cycle analyses.Refers to amount “transferred” among regions in
food/feed to water deficit areas.Ag production responsible for 90% of global demand
for freshwater, mainly for irrigation.Increasing competitive demands for water.
Beef production is criticized for high resource input and negative environmental impact per unit of output.Q: How much water is used in beef production?Q: How can we reduce water footprint in beef?
20
Partitioning of Virtual Water in Life Cycle Analyses
Green water: precipitation and stored in soil
Blue water: developed, stored, transportede.g. diverted surface or groundwater for
irrigation, drinking, cleaning
Gray water: amount needed to dilute polluted water to allowable levels.
21
Virtual Water in Ag Products Workshop. 2016.UNL Center for Water Resources – Dr. C. RayUNL Water for Food Institute – Dr. M. Mekonnen
Beckett & Oltjen. 1993. Estimation of the water require-ment for beef production in the U.S. JAS 71:818-826.
Boneless meat. Blue water only.
3.7 m3 / kg of boneless meat. (440 gal / lb)
Recommendation:
Improving efficiency in irrigation use on stocker pasturewould reduce overall water requirement.
Based irrigation requirement on California practices.We are interested in stocker at low irrigation.
22
Literature values of WF for beef (m3/kg)1. Boneless meat (U.S.): 3.7
Beckett & Oltjen. 1993. JAS
2. Global average of liveweight: 15.4MeKonnen & Hoekstra. 2012. Ecosystems
3. Pasture-fed beef (U.S.) liveweight: 19.6Ibid.
4. Western feedlot (U.S.) liveweight: 3.9Ibid.
5. Southern Plains carcass weight: 2.5 Rotz et al. 2015. JAS
Results vary with animal mass unit, type of water, and estimates of irrigation.
23
graze extensive grassland,
crop residue
graze improved forages
high-grain feedlot diets
Cow-calf Stocker Fattening
Is it possible to strategically integrate high-quality legumes without increasing the water footprint?
Beef Production Chain
24
SoilForage
Animal
Environment
Water
Grazing System
[Lisa Baxter]
25
Integrating ecology
Species comparison for water footprintm3 transpired / kg biomass yield
Forage species Water footprintm3 transpired/kg biomass
Bermudagrass .265Corn .370Wheat .500Alfalfa .770
26
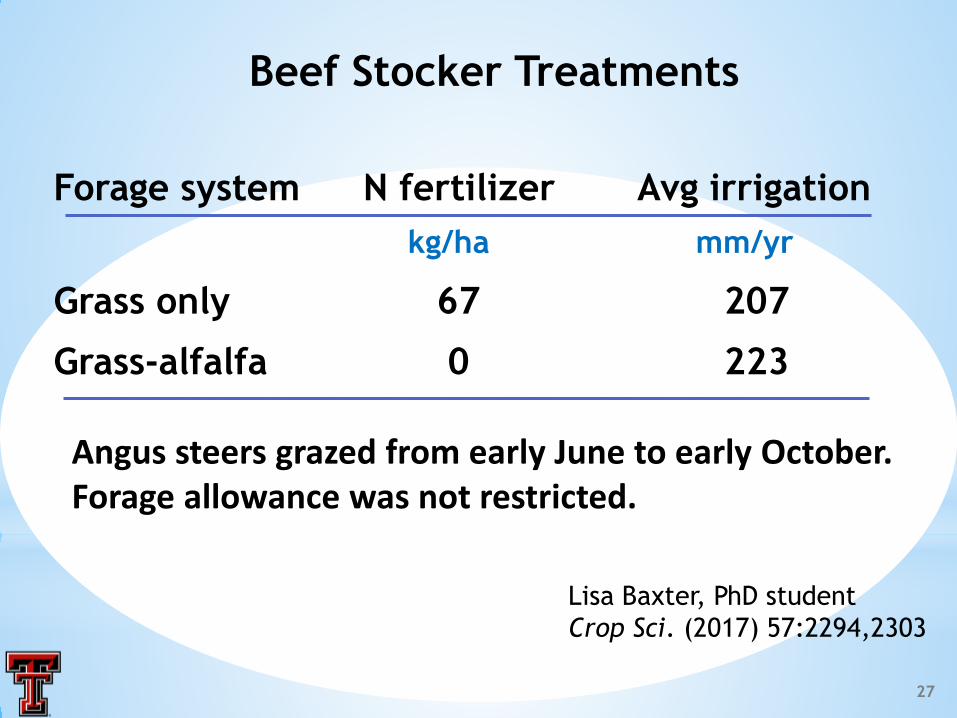
Beef Stocker Treatments
Forage system N fertilizer Avg irrigationkg/ha mm/yr
Grass only 67 207
Grass-alfalfa 0 223
Lisa Baxter, PhD studentCrop Sci. (2017) 57:2294,2303
Angus steers grazed from early June to early October.Forage allowance was not restricted.
27
Dryland Native – 4.5 ha
Dryland Teff – 1.7 ha OWB – 2.1 ha
Grass-only grazing rotation (12 head on 8.3 ha)
28
Native – 0.9 ha Teff – 0.2 ha
Alfalfa-tall wheatgrass – 0.9 ha
OWB-Legume – 2.1 ha
GL grazing rotation (8 head on 4.1 ha)
29
[Lisa Baxter]
30
Water Footprint Calculations
• Water footprint = m3 water delivery / kg LWG (Effective rainfall + corrected irrigation) / observed LWG
Why? Legume presence required slightly more irrigation, but it increased animal gain 60% over grass alone.Twice the protein content, more digestible energy.
Observed
Total: with hay
37
Alfalfa uses more water per kg of forage, but leverages two major attributes:
1. Greater nutritive value in grass-legume
2. Fixes N via symbiosis, so C and GHG footprints are also lower.
Forage system CP IVTOMD ADG% % kg
Grass only 7.0 55 0.79Grass-alfalfa 14.4 64 0.94
38
Efficiency of resource use: Law of the MinimumDeficit of most limiting factor restricts yield.Limiting resource renders inefficient all other inputs.Upon relief, the next most-limiting factor restricts yield until genetic potential is reached.
• Inclusion of legumes increased beef stocker gain per animal-day and per ha
• Grass-Legume system received slightly more water
[Lisa Baxter]40
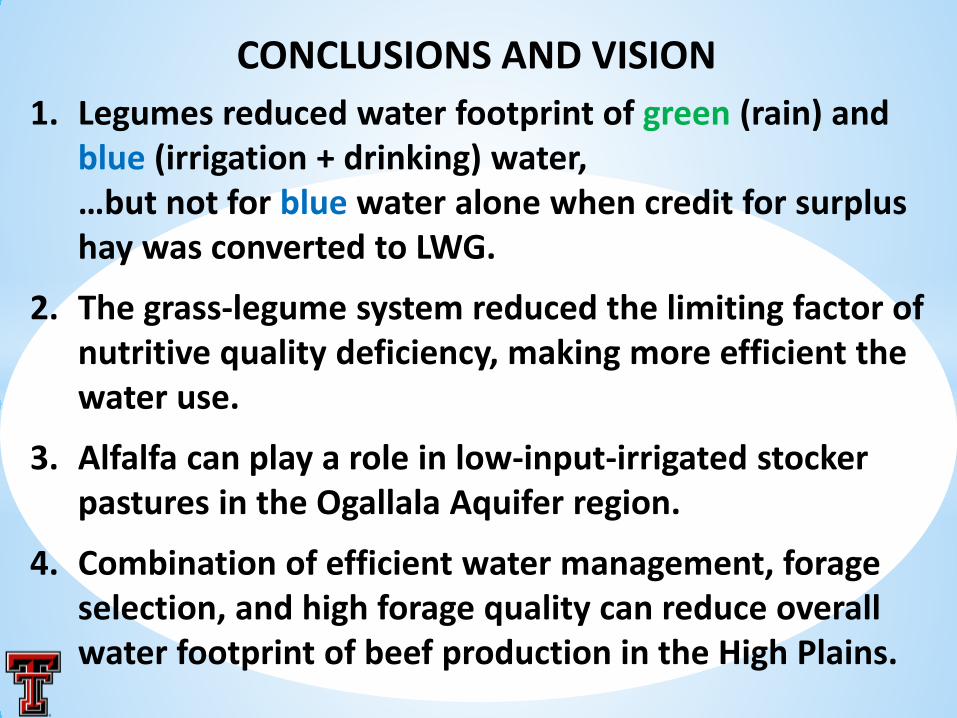
CONCLUSIONS AND VISION1. Legumes reduced water footprint of green (rain) and
blue (irrigation + drinking) water, …but not for blue water alone when credit for surplus hay was converted to LWG.
2. The grass-legume system reduced the limiting factor of nutritive quality deficiency, making more efficient the water use.
3. Alfalfa can play a role in low-input-irrigated stocker pastures in the Ogallala Aquifer region.
4. Combination of efficient water management, forage selection, and high forage quality can reduce overall water footprint of beef production in the High Plains.
42
Graduate Student Research
Digital image analysis of OWB canopy
Simulating OWB growth with ALMANAC model
Pollinator communities and soil ecology in OWB
Alfalfa effect on enteric methane emissions
Alfalfa effect on native grass water relations
USDASouthern SARE LS14-261NIFA 2016-68007-25066Texas Water Development Board
Texas Tech University Thornton Endowment
ContributorsLisa Baxter Madhav DhakalVivien Allen Rick KellisonPhil Brown Paul GreenKrishna Bhandari Victoria Xiong