41
Ciba Specialty Chemicals Further strengthens its position „Managing for Growth“ February 2003

Ciba Specialty Chemicals
Further strengthens its position„Managing for Growth“
February 2003
Contents
Key achievements 2002
Results and Developments 2002
Strategy
Sustainability and Corporate Governance
Outlook and conclusions
Key achievements 2002

Results 2002MCHF FY 2002 (%Sales) Change
CHF loc. curr.Sales 7 085 - 4% + 3%EBIT 788 (11.1%) + 4% + 25%EBITDA 1 173 (16.6%) - 5% + 10% Net income 406 (5.7%) + 6%EPS* (CHF) 5.92 +3%Free cash flow 683 - 12% Net debt 1 463 - 38%
Reliable performance in difficult market environment
* Basic and diluted

Key achievements 2002• Strengthened market position
– Sales in local currency up 3%– Geographical expansion with Asian sales up 5%
• Reliable results– EBITDA maintained at 16.6% of sales – Net income up 6% in CHF
• Strong cash management– Strong free cash flow generation of 683 MCHF– Net debt reduced by 888 MCHF to below 1.5 BCHF
• Shareholder focus– Payout 3 CHF remaining on increased level
• Good preparation for the future– Innovation: R&D expenses up 7% to 4.2% of sales– Organic growth initiatives launched– Efficiency: Headcount reduction 1300 / 7% in 2001/2002– Efficiency: Production cost improvements– External growth: very strong balance sheet
Ready to go

Results fourth quarter 2002MCHF Q4 2002 % of sales Change
CHF loc. curr.
Sales 1 675 - 2% + 6%EBIT 161 9.6% + 3% + 29%EBITDA 257 15.3% - 6% + 11% Net income 94 + 18%EPS* (CHF) 1.35 + 14%
Negative currency effects overshadows positive trend
* Basic and diluted

Contents
Key achievements 2002
Results and Developments 2002
Strategy
Sustainability and Corporate Governance
Outlook and conclusions
Results and Developments 2002

Challenging business environment
1.35
1.40
1.45
1.50
1.55
1.60
1.65
1.70
1.75
1.80
Jan 01
FebM
ar
AprM
ai
Jun
JulAug
SepO
ct
Nov
Dec 01
Jan 02Feb
Mar
Apr
Mai
Jun
Jul
AugSep
Oct
Nov
Dec 02
70
75
80
85
90
95
100
105
110
Dollar Euro 3 per. Mov. Avg. (Sales)
Volatile markets withstrong monthly shifts
Asian economies better than those ofother parts of the world
Strong changes incurrencies
Individual quarters are no good indicator

Group sales 2002
FY‘02*Volume-Mix + 5% Price - 3% M&A + 1%Loc. currency + 3%Currency - 7%TOTAL in CHF - 4%
- Europe 38% -1%/2%- Americas 35% -7%/2%- Asia 27% -3%/5%
- Volumes up, especially Q2- Prices stabilizing in Q4, some
price increases
0
800
1600
Q1 Q2 Q3 Q4 Q1 Q2 Q3 Q42001 2002
MCHF
Strong growth in Asia, especially China & India
* compared to previous year
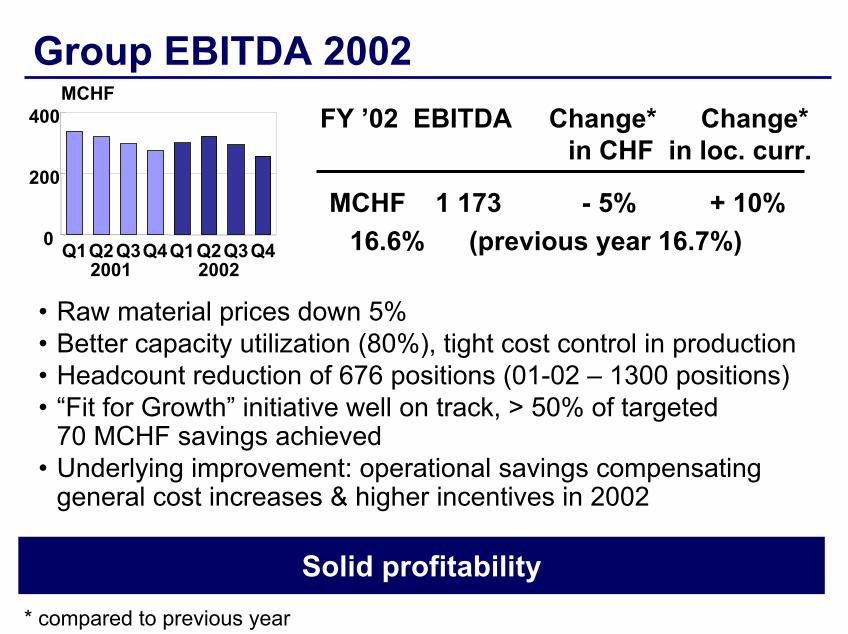
Group EBITDA 2002
0
200
400
Q1Q2Q3Q4Q1Q2Q3Q42001 2002
MCHFFY ’02 EBITDA Change* Change*
in CHF in loc. curr.
MCHF 1 173 - 5% + 10%16.6% (previous year 16.7%)
• Raw material prices down 5%• Better capacity utilization (80%), tight cost control in production • Headcount reduction of 676 positions (01-02 – 1300 positions)• “Fit for Growth” initiative well on track, > 50% of targeted
70 MCHF savings achieved• Underlying improvement: operational savings compensating
general cost increases & higher incentives in 2002
Solid profitability* compared to previous year

PA: Innovation driven strong growth
• R&D: 4.5% of sales• FDA clearance for SHELFPLUS™ (UV
filter) + IRGAGUARD™ (antimicrobial)• 10 new products introduced in 2002:- IRGALUBE™ product line broadened for
industrial lubricant applications- IRGASURF™ HL 560 hydrophilic
additive for fibers and non wovens- SMARTLIGHT™ RL 1000 additive to
improve greenhouse productivity- IRGASTAB™ STYL and IRGASTAB™
PUR, application specific solutions
• Plant closure in Spain/Canada with costs in 2002 and full benefit in 2003
• Cap.Ex.: 4.8% of sales for capacity expansion/ process improvements:
- Automated packaging in Kaisten: cost savings CHF 5m/a
- Tinuvin™ 770 production in Lampert-heim: costs 30% lower
- Light stabilizer production in Puebla(Mex) for 47 MCHF in 2003
Stable high profitability by productivity improvement
EBIT 245 MCHF 13.5% - 11/+4%EBITDA 346 MCHF 19.1% - 11/+1%Cap.Ex. 86 MCHF 4.8% + 8/+17%Net op. Assets 1236 MCHF -12%
EBIT 245 MCHF 13.5% - 11/+4%EBITDA 346 MCHF 19.1% - 11/+1%Cap.Ex. 86 MCHF 4.8% + 8/+17%Net op. Assets 1236 MCHF -12%
Sales 1813 MCHF - 1%/6%Currency - 7%Acquisitions 0%Volume + 10%Price - 4%
Sales 1813 MCHF - 1%/6%Currency - 7%Acquisitions 0%Volume + 10%Price - 4%

CE: Profit record with innovation power
• R&D: 5.2% of sales• >20 new products introduced in 2002:- CROMOPHTAL® Red 2028, new DPP
pigment (for non-warping plastics)- Lignostab™ 1198 wood photo-
stabilization additive launched- Series of new BAPO photoinitiators: one
stop shop for radiation curing industry (pigments, photoinitiators, optical brighteners, light stabilizers) for UV-cured coatings, inks, adhesives
- Strong new platform for coatings services (EFKA)
• Cap.Ex.: 3.9% of sales for low cost expansion/ process improvement:
- 2 step cost effective capacity expansion in DPP red – Step 1 approved (CHF 17m)
• Balanced portfolio as major profit driver (span of different chemistries):
High level, balanced product portfolio with >3000 products
Sales 1920 MCHF -1%/5%Currency - 6%Acquisitions + 2%Volume + 6%Price - 3%
Sales 1920 MCHF -1%/5%Currency - 6%Acquisitions + 2%Volume + 6%Price - 3%
EBIT 341 MCHF 17.7% +9/+29%EBITDA 440 MCHF 22.9% +7/+23%Cap.Ex. 74 MCHF 3.9% +13/+17%Net op. Assets 1834 MCHF -8%
EBIT 341 MCHF 17.7% +9/+29%EBITDA 440 MCHF 22.9% +7/+23%Cap.Ex. 74 MCHF 3.9% +13/+17%Net op. Assets 1834 MCHF -8%

WPT: New flocculants/geographical expansion
Turnaround with lower cost base
• Profitability boost by lower average raw material prices (2002 vs 2001).
• Cap.Ex.: 2.5% of sales for low cost expansion/ process improvement:
- Plant closures: Old Bridge- Plant upgrades in Bradford, West
Memphis, Suffolk (WT) and Ankleshwar(Paper)
• R&D: 2.1% of sales• 43 new products introduced in 2002:- HYDROCOL® system of choice for
high speed paper production- Magnafloc® high performance
flocculants for mineral processing- Ciba® Zetac® 8000 series inverse
emulsion flocculants for 20% efficiency improvement
- Ciba® LODYNE® grease repellant for use in food packaging, cleared by FDA
Sales 1409 MCHF -5%/1%Currency -6%Acquisitions 0%Volume +4%Price -3%
Sales 1409 MCHF -5%/1%Currency -6%Acquisitions 0%Volume +4%Price -3%
EBIT 98 MCHF 7.0% +51/+69%EBITDA 186 MCHF 13.2% +18/+28%Cap.Ex. 35 MCHF 2.5% -34/-30%Net op. Assets 2429 MCHF -6%
EBIT 98 MCHF 7.0% +51/+69%EBITDA 186 MCHF 13.2% +18/+28%Cap.Ex. 35 MCHF 2.5% -34/-30%Net op. Assets 2429 MCHF -6%

TE: Strong sales growth in Chemicals
Above average free cash flow generation
• R&D: 2.4% of sales• 53 new products introduced in 2002:- Ciba® OLEOPHOBOL® 7749: The new
technology for highly effective water, grease and oil repellants
- Launch of Ciba® Textile Services for the entire textile value chain
- Expansion of global cooperation with DuPont Textiles and Interiors (DTI) to meet strong demand for improved comfort, function and easy care
- 32 new dyes, esp. Eriofast reactive dyes range for Polyamide (brilliant and intensive shades)
• Cap.Ex.: 2.2% of sales for low cost expansion/ process improvement:
- Further low cost process improvement in K-90 in Basle (dyes)
- Rightsizing Clayton provisioned for- Merger Albemarle/Charlotte plants- Successful textile chemicals production
in Panyu (CHF 15m)- Shift of Textile Chemicals production
unit from Bradford to Langweid• Below average profitability potential,
but strong free cash flow generation (>25% of total)
Sales 1544 MCHF -8%/-2%Currency -6%Acquisitions 0%Volume +2%Price -4%
Sales 1544 MCHF -8%/-2%Currency -6%Acquisitions 0%Volume +2%Price -4%
EBIT 142 MCHF 9.2% -21/-1%EBITDA 208 MCHF 13.5% -16/0%Cap.Ex. 34 MCHF 2.2% +8/+13%Net op. Assets 1291 MCHF -13%
EBIT 142 MCHF 9.2% -21/-1%EBITDA 208 MCHF 13.5% -16/0%Cap.Ex. 34 MCHF 2.2% +8/+13%Net op. Assets 1291 MCHF -13%

HPC: High growth in Personal Care
High Profitability driven by new product lines
• R&D: 7.6% of sales• 8 new products introduced in 2002:- Ciba® TINOSORB® S, new efficient,
photostable broad-spectrum UV filter (used in Nivea® Sun range)
- Commercial break through of Ciba®
TINOSORB FD® and Ciba® TINOSORB®
FR, the special UV absorbers for detergents and rinse conditioners
- Vibracolor™ Hair Colors for brilliant shades, stability, wash fastness
- Ciba® TINOLUX® laundry additive using sun to bleach stains
• Cap.Ex.: 4.4% of sales for low cost expansion/ process improvement:
- New cGMP formulation unit for UV-absorber in Grenzach (CHF 4 m) - at >90% capacity utilization in year 1
Sales 399 MCHF -7%/1%Currency - 8%Acquisitions 0%Volume +2%Price - 1%
Sales 399 MCHF -7%/1%Currency - 8%Acquisitions 0%Volume +2%Price - 1%
EBIT 56 MCHF 14.0% -17/+7%EBITDA 82 MCHF 20.6% -14/+4%Cap.Ex. 18 MCHF 4.4% -28/-24%Net op. Assets 294 MCHF -14%
EBIT 56 MCHF 14.0% -17/+7%EBITDA 82 MCHF 20.6% -14/+4%Cap.Ex. 18 MCHF 4.4% -28/-24%Net op. Assets 294 MCHF -14%

Currency effects: TranslationGlobal sales distribution
38%
27%35%
Sales: -7%/2% -1%/2% -3%/5%
Sales - 4%/+3%
EBIT +4%/+25%
EBITDA - 5%/+10%

Currency translation impactTo “add” local sales, they are translated into one common currency
2001 Actual in CHF
2002 at x-rates of 2001 (in CHF)
Change "in local curren-cies"
2002 in CHF at actual x-rates 2002
Change in CHF
Sales 7367 7562 2.7% 7085 -3.8%Cost Goods Sold 4988 4963 -0.5% 4729 -5.2%Gross Profit 2379 2599 9.2% 2356 -1.0%SG&A costs (& other) 1618 1644 1.6% 1568 -3.1%EBIT 761 955 25.5% 788 3.6%
EBITDA 1230 1359 10.5% 1173 -4.6%
Higher sales „in local currencies“Higher EBITDA „in local currencies“
Lower sales in CHFLower EBITDA in CHF
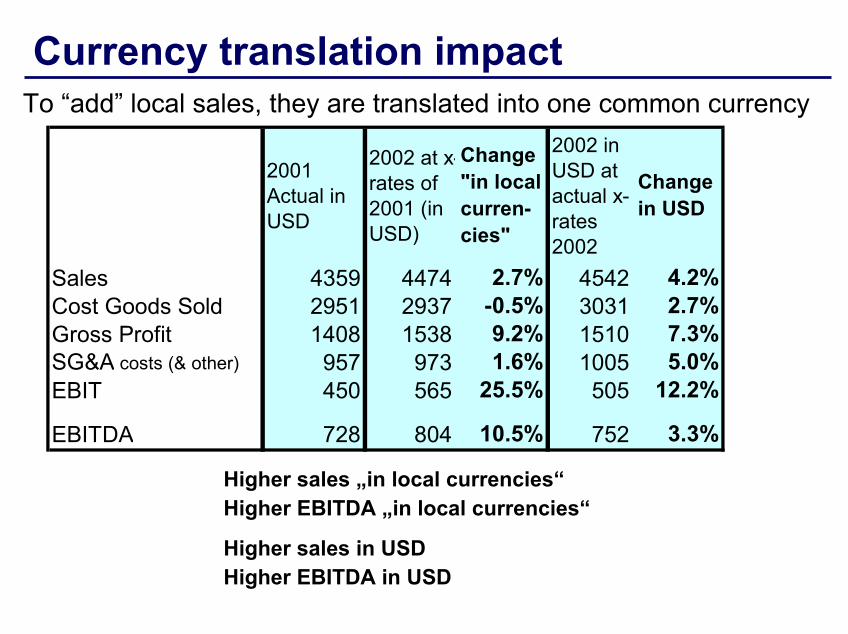
Currency translation impactTo “add” local sales, they are translated into one common currency
2001 Actual in USD
2002 at x-rates of 2001 (in USD)
Change "in local curren-cies"
2002 in USD at actual x-rates 2002
Change in USD
Sales 4359 4474 2.7% 4542 4.2%Cost Goods Sold 2951 2937 -0.5% 3031 2.7%Gross Profit 1408 1538 9.2% 1510 7.3%SG&A costs (& other) 957 973 1.6% 1005 5.0%EBIT 450 565 25.5% 505 12.2%
EBITDA 728 804 10.5% 752 3.3%
Higher sales „in local currencies“Higher EBITDA „in local currencies“
Higher sales in USDHigher EBITDA in USD
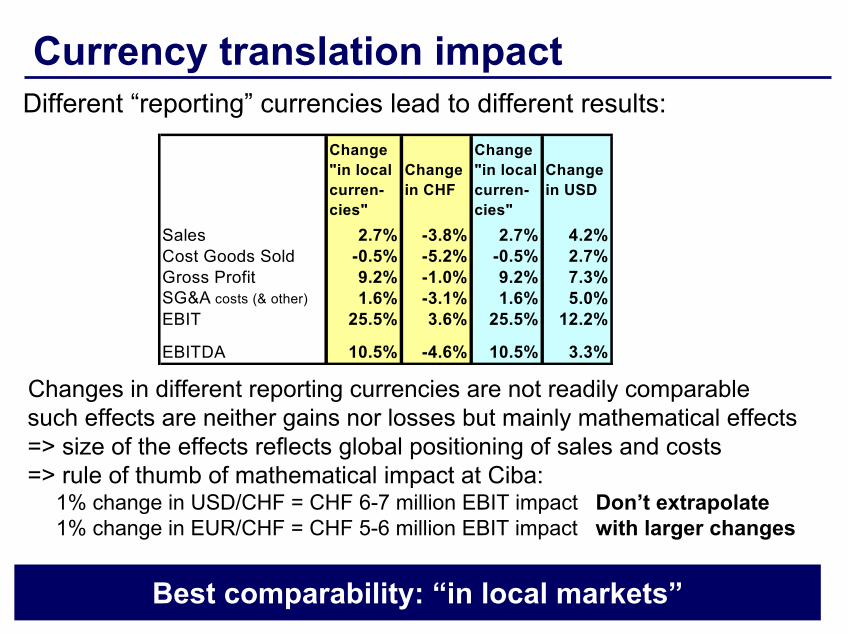
Currency translation impactDifferent “reporting” currencies lead to different results:
Changes in different reporting currencies are not readily comparablesuch effects are neither gains nor losses but mainly mathematical effects=> size of the effects reflects global positioning of sales and costs=> rule of thumb of mathematical impact at Ciba:
1% change in USD/CHF = CHF 6-7 million EBIT impact Don’t extrapolate1% change in EUR/CHF = CHF 5-6 million EBIT impact with larger changes
Change "in local curren-cies"
Change in CHF
Change "in local curren-cies"
Change in USD
Sales 2.7% -3.8% 2.7% 4.2%Cost Goods Sold -0.5% -5.2% -0.5% 2.7%Gross Profit 9.2% -1.0% 9.2% 7.3%SG&A costs (& other) 1.6% -3.1% 1.6% 5.0%EBIT 25.5% 3.6% 25.5% 12.2%
EBITDA 10.5% -4.6% 10.5% 3.3%
Best comparability: “in local markets”
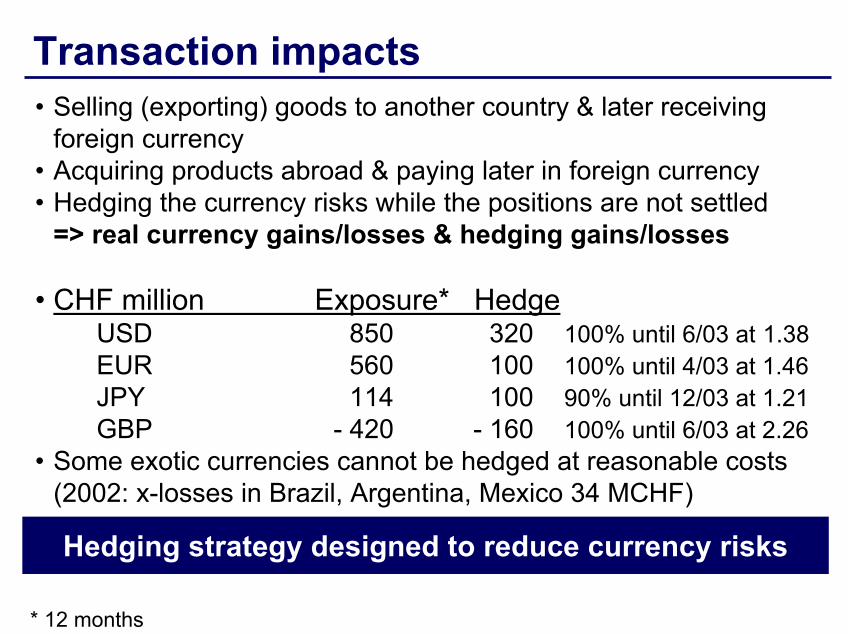
Transaction impacts• Selling (exporting) goods to another country & later receiving
foreign currency• Acquiring products abroad & paying later in foreign currency• Hedging the currency risks while the positions are not settled
=> real currency gains/losses & hedging gains/losses
• CHF million Exposure* HedgeUSD 850 320 100% until 6/03 at 1.38EUR 560 100 100% until 4/03 at 1.46JPY 114 100 90% until 12/03 at 1.21 GBP - 420 - 160 100% until 6/03 at 2.26
• Some exotic currencies cannot be hedged at reasonable costs(2002: x-losses in Brazil, Argentina, Mexico 34 MCHF)
Hedging strategy designed to reduce currency risks
* 12 months

Net income 2002
MCHF 2002 (%Sales) Change
Net income 406 (5.7%) + 6%EPS (CHF) 5.92 + 3%
EBIT 788 (11.1%) + 4%Net financial exp. 215 (3.0%) + 11%Taxes 154 (27.0%)* - 13%
Further underlying improvement
* % of income before taxes

Asset management
CAPEX 250 259as % of sales 3.5% 3.5% as % of depreciation 71.1% 68.9%
MCHF 2002 2001
Dec. 31 2002 2001Net current op. assets 1 911 2 102
as % of sales 27% 28.5%Net debt 1 463 2 351Net debt/equity 33.6% 60.1%
Strong balance sheet

Asset management
1996 - 2002
• Receivables - 22%• Inventories - 27%
• Net current op. assets down from 47% to 27% of sales
• Fixed assets down from 63.7% to 45.1% of sales
Fixed Assets
40%
50%
60%
1996 1997 1998 1999 2000 2001 2002
Tight control of assets and working capital
Net current op. assets
20%
30%
40%
1996 1997 1998 1999 2000 2001 2002
%Sales

Cash flow
Cash flows from/(for)…… Operations (excl. restructuring) 1 050 1 100… Investing (excl. M&A) - 233 - 189… Dividends - 134 - 132Free cash flow (before restruct.) 683 779
MCHF 2002 2001
Free cash flow (before restruct.) 683 779Spent for …… Restructuring - 12 - 46… Acquisitions (net of divestments) - 116 - 144… Additional payout to shareholders - 69 0… Equity movements + 344 + 9
Resulting reduction in net debt 888 632Currency effect + 58 + 34
Sustainable high free cash flow generation

Debt trends
• Strong cash generationin second half
31.12.2002:Net debt / market cap 21%Net debt / equity 33.6%EBIT interest cover: 7.1
11792361
cash net debt
2983 1463
4230 3840
MCHF
1602
2351
3994
2000
0
-2000
-4000
31.12.2000 31.12.2001 31.12.2002 gross debt
Increased financial flexibility

Contents
Key achievements 2002
Results and Developments 2002
Global program „Managing for Growth“
Sustainability and Corporate Governance
Outlook and conclusions
Strategy

Our strategic direction remains• Target: Leading specialty chemicals company• Balanced global presence• Focused portfolio with 5 strong segments• Leading positions in its selected markets• Program „Managing for Growth“• Focus on cash flow• Acquisitions only with clear return targets
„Managing for growth“ will accelerate implementation

External growth: M&A• Business fit:
– Synergetic additions – no diversification– Innovation-driven– Broadening platform and market presence
• Size:– In total available cash at least 1 BCHF– If more: additional use of equity possible
• Return: Double-digit return rate• Integration feasible with present managerial resources
Clear return targets

External growth: M&A
Plastic StabilizersLube Oil Additives
Antioxidants
Thermoset PowderCoatings Materials
Corrosion InhibitorsElectronic ChemicalsRadiation Curing AgentsMasterbatchPigments (non-Inks)
Light StabilizersBiocides
Flame Retardants
Paper ChemicalsWater ManagementOil Field ChemicalsMining ChemicalsWater Soluble Polym.
Textile Chemicals
Printing Inks
Cosmetic Chemicals
Biocides Dyestuffs
Plastic AdditivesCoating Effects
Water & Paper Treatment
Textile Effects
Home & Personal Care
Full use of technology synergies
Focused portfolio with 5 strong segments Cross fertilization of know-how
Illustrates homogeneity of our portfolio
Paper Colors
Technologicalbase:
Pigments
PlasticAdditives
CoatingEffects
Water & PaperTreatment Textile Effects Home &
Personal Care
Paper DyesTechnological
base:Textile Dyes
Hair DyesTransparent dyes for engineering plastics
Lubricant dyesDyes for agricultural films
Pigments for synthetic fibersCosmetic ColorsPlastic Colors
UV stabilizersUV protection clothesUV absorbers for detergents and rinse conditionersSun screens
Technologicalbase:
UV technology
Technologicalbase:
Encapsulation OutlastCosmetics encapsulationPerfume encapsulation

Our 4 Initiatives – AchievementsProfitable growth• Focus on the market
Innovation• New solutions, new markets
People• Clear vision, lean structure
Cash Flow• Key for growth
Substantial achievements of “Fit for Growth”

Our 4 Initiatives – New emphasis
„Managing for Growth“
Profitable growth
Innovation
People
Cash
• Main focus:• Push profitable growth• Implementation• Innovation
Next program „Managing for Growth“
Key growth areas• Cross-Segment Selling
– Exploit cross-segment synergies– Push implementation of new business
opportunities• Geography
– Further push growth in key countries in Central Europe and Asia
• Service – Solutions– Redefine product value-added to provide
value-added service to customers– Push one-company approach to offer
high quality solutions• Innovation
– Focus on key projects with high business potential

Contents
Key achievements 2002
Results and Developments 2002
Strategy
Sustainability and Corporate Governance
Outlook and conclusions
Sustainability and Corporate Governance

Social responsibility• 2000: Pro-active preparation and implementation of
„Code of Conduct“ • 2001: EHS Report fully integrated in Annual Report• 2002: New „Social Policy Statement“ covering
– employment conditions – non-discrimination– child labor– environment– community relation
Ciba follows international best practice in all communities in which it operates

Corporate Governance Ciba SC• 6 out of 7 members of the Board are non-executive and
independent of Ciba• No cross board memberships• Strong Vice Chairman as Lead Director• Sub-committees for Audit, Finance, HR, Remuneration and
Nominations• Audit and remuneration committees: All board members
are non-executive, including committee chairman• Strong empowerment of Internal Auditing• Executive Committee: Shares instead of options
Structure ensures “Checks and Balances”

Disclosure• Reporting about Corporate Governance since Annual report
1997• 2002: Implementation of „Swiss Code of Best Practice“• Introduction SWX Corporate Governance guidelines for
Annual report 2002; were already earlier mainly compliant due to listing on NYSE (CSB) and 20-F registration statement
• 2002: Implementation of U.S. Sarbanes-Oxley Act principles
Transparency creates predictability and therefore trust

Contents
Key achievements 2002
Results and Developments 2002
Strategy
Sustainability and Corporate Governance
Outlook and conclusionsOutlook and conclusions

Outlook 2003• Economic conditions challenging in first semester,
recovery in second semester expected • Solid base, ready for upturn• Profitable growth due to focus on innovation and
implementation
Assumptions• No significant worsening of the geopolitical climate• Reasonably stable currency rates• Continuous recovery of the world-wide markets
Outlook 2003 under these conditions• Sales in local currency
EBITDA margin in %Net Income in CHF
• Free cash flow above 600 MCHF
Expected:Above last year’s level

Conclusions• Sales increase in local currency: + 3%• Stable EBITDA margin 2002: 16.6%• Net income up: + 6%• Very strong cash flow, further strengthened balance sheet• “Fit for Growth” successful, measures implemented• Next step “Managing for Growth”• Outlook 2003: Local sales, EBITDA margin and
Net Income in CHF above last year’s level• Mid-term company targets 2005 confirmed
Ciba well positioned for further growth!

Ciba Specialty Chemicals
Plastic Additives CoatingEffects
Water & PaperTreatment
Textile Effects
Home &Personal Care
Ciba well positioned for further growth!

DisclaimerForward-looking statements and information contained in the Annual Report, in the Management’s Discussion and Analysis of Financial Condition and Results of Operations and in other distributed materials are qualified in their entirety as there are certain important factors that could cause results to differ materially from those anticipated. Such statements reflect the current views of the Company with respect to market conditions and future events and are subject to certain risks, uncertainties and assumptions. Investors are cautioned that all forward-looking statements involve risks and uncertainty. In addition to the factors discussed above, among the factors that could cause actual results to differ materially are the following: the timing and strength of new product offerings, pricing strategies of competitors, introduction of competing products by other companies, lack of acceptance of new products and services by the Company’s targeted customers, changes in the Company’s business strategy, the Company’s ability to continue to receive adequate raw materials from its suppliers on acceptable terms, or at all, and to continue to obtain sufficient financing to meet its liquidity needs, and changes in the political, social and regulatory framework in which the Company operates or in economic or technological trends or conditions, including currency fluctuations, inflation and consumer confidence, on a global, regional or national basis and various other factors. Furthermore, the Company does not assume any obligation to update these forward-looking statements.

Additional segment dataSales%Change FY 2002 Total Vol./ Quarterly Sales
in CHF Curr. Mix Price M&A Q1 ‘02 Q2 ‘02 Q3 ‘02 Q4 ‘02Plastic Additives -1% -7% +10% -4% 0% 460 479 447 427Coating Effects -1% -6% +6% -3% +2% 482 520 471 447Water & Paper Treatment-5% -6% +4% -3% 0% 371 353 344 341Textile Effects -8% -6% +2% -4% 0% 393 423 367 361Home & Personal Care -7% -8% +2% -1% 0% 100 101 99 99Group -4% -7% +5% -3% +1% 1806 1876 1728 1675
EBIT EBIT FY ‘02 EBIT FY ‘011 EBIT Margin EBIT MarginMCHF MCHF FY 2002 FY 20011
Plastic Additives 245 275 13.5% 15.0%Coating Effects 341 312 17.7% 16.1%Water & Paper Treatment 98 65 7.0% 4.4%Textile Effects 142 181 9.2% 10.8%Home & Personal Care 56 67 14.0% 15.7%Corporate -94 -139Group 788 761 11.1% 10.3%
1 Pro forma after effects of SFAS 142


