30
November 30, 2017 CIBC Investor Presentation Q4 F17

November 30, 2017
CIBC Investor Presentation
Q4 F17

Forward-Looking Statements 1
A NOTE ABOUT FORWARD-LOOKING STATEMENTS: From time to time, we make written or oral forward-looking statements within the meaning of certain securities laws, including in this
Annual Report, in other filings with Canadian securities regulators or the SEC and in other communications. All such statements are made pursuant to the “safe harbour” provisions of,
and are intended to be forward-looking statements under applicable Canadian and U.S. securities legislation, including the U.S. Private Securities Litigation Reform Act of 1995. These
statements include, but are not limited to, statements made in the “Message from the President and Chief Executive Officer”, “Overview – Performance against objectives”, “Financial
performance overview – Taxes”, “Financial performance overview – Significant events”, “Financial performance overview – Outlook for calendar year 2018”, “Strategic business units
overview – Canadian Personal and Small Business Banking”, “Strategic business units overview – Canadian Commercial Banking and Wealth Management”, “Strategic business units
overview – U.S. Commercial Banking and Wealth Management”, “Strategic business units overview – Capital Markets”, “Financial condition – Capital resources”, “Financial condition –
Off-balance sheet arrangements”, “Management of risk – Risk overview”, “Management of risk – Top and emerging risks”, “Management of risk – Credit risk”, “Management of risk –
Market risk”, “Management of risk – Liquidity risk”, “Accounting and control matters – Critical accounting policies and estimates”, “Accounting and control matters – Financial
instruments”, “Accounting and control matters – Accounting developments”, “Accounting and control matters – Regulatory developments” and “Accounting and control matters –
Controls and procedures” sections of this report and other statements about our operations, business lines, financial condition, risk management, priorities, targets, ongoing objectives,
strategies, the regulatory environment in which we operate and outlook for calendar year 2018 and subsequent periods. Forward-looking statements are typically identified by the words
“believe”, “expect”, “anticipate”, “intend”, “estimate”, “forecast”, “target”, “objective” and other similar expressions or future or conditional verbs such as “will”, “should”,
“would” and “could”. By their nature, these statements require us to make assumptions, including the economic assumptions set out in the “Financial performance overview – Outlook
for calendar year 2018” section of this report, and are subject to inherent risks and uncertainties that may be general or specific. A variety of factors, many of which are beyond our
control, affect our operations, performance and results, and could cause actual results to differ materially from the expectations expressed in any of our forward-looking statements.
These factors include: credit, market, liquidity, strategic, insurance, operational, reputation and legal, regulatory and environmental risk; the effectiveness and adequacy of our risk
management and valuation models and processes; legislative or regulatory developments in the jurisdictions where we operate, including the Dodd-Frank Wall Street Reform and
Consumer Protection Act and the regulations issued and to be issued thereunder, the Organisation for Economic Co-operation and Development Common Reporting Standard, and
regulatory reforms in the United Kingdom and Europe, the Basel Committee on Banking Supervision’s global standards for capital and liquidity reform, and those relating to bank
recapitalization legislation and the payments system in Canada; amendments to, and interpretations of, risk-based capital guidelines and reporting instructions, and interest rate and
liquidity regulatory guidance; the resolution of legal and regulatory proceedings and related matters; the effect of changes to accounting standards, rules and interpretations; changes
in our estimates of reserves and allowances; changes in tax laws; changes to our credit ratings; political conditions and developments, including changes relating to economic or trade
matters; the possible effect on our business of international conflicts and the war on terror; natural disasters, public health emergencies, disruptions to public infrastructure and other
catastrophic events; reliance on third parties to provide components of our business infrastructure; potential disruptions to our information technology systems and services; increasing
cyber security risks which may include theft of assets, unauthorized access to sensitive information, or operational disruption; social media risk; losses incurred as a result of internal or
external fraud; anti-money laundering; the accuracy and completeness of information provided to us concerning clients and counterparties; the failure of third parties to comply with
their obligations to us and our affiliates or associates; intensifying competition from established competitors and new entrants in the financial services industry including through
internet and mobile banking; technological change; global capital market activity; changes in monetary and economic policy; currency value and interest rate fluctuations, including as
a result of market and oil price volatility; general business and economic conditions worldwide, as well as in Canada, the U.S. and other countries where we have operations, including
increasing Canadian household debt levels and global credit risks; our success in developing and introducing new products and services, expanding existing distribution channels,
developing new distribution channels and realizing increased revenue from these channels; changes in client spending and saving habits; our ability to attract and retain key employees
and executives; our ability to successfully execute our strategies and complete and integrate acquisitions and joint ventures; the risk that expected synergies and benefits of the
acquisition of PrivateBancorp, Inc. will not be realized within the expected time frame or at all; and our ability to anticipate and manage the risks associated with these factors. This
list is not exhaustive of the factors that may affect any of our forward-looking statements. These and other factors should be considered carefully and readers should not place undue
reliance on our forward-looking statements. Any forward-looking statements contained in this report represent the views of management only as of the date hereof and are presented
for the purpose of assisting our shareholders and financial analysts in understanding our financial position, objectives and priorities and anticipated financial performance as at and for
the periods ended on the dates presented, and may not be appropriate for other purposes. We do not undertake to update any forward-looking statement that is contained in this report
or in other communications except as required by law.
Investor Relations contacts:
Amy South, Senior Vice-President 416 594-7386
Investor Relations Fax Number 416 980-5028
Visit the Investor Relations section at www.cibc.com

Victor Dodig President and Chief Executive Officer
CIBC Overview

Kevin Glass Senior Executive Vice-President and Chief Financial Officer
Financial Review

Adjusted1 Q4/16 Q3/17 Q4/17
($MM, except for EPS, Efficiency Ratio, ROE, and CET1 Ratio)
Revenue 3,684 4,113 4,247
Non-Interest Expenses 2,200 2,368 2,420
Pre-Provision Earnings 1,484 1,745 1,827
Provision for Credit Losses 222 209 212
Net Income — Reported2 931 1,097 1,164
Net Income — Adjusted1 1,041 1,166 1,263
Diluted EPS — Reported $2.32 $2.60 $2.59
Diluted EPS — Adjusted1 $2.60 $2.77 $2.81
Efficiency Ratio — Adjusted TEB1 58.2% 57.3% 56.5%
ROE — Adjusted1 18.8% 17.3% 17.2%
CET1 Ratio 11.3% 10.4% 10.6%
Fourth Quarter, 2017 Highlights 4
1 Adjusted results are Non-GAAP financial measures. See slide 29 for further details. 2 Reported results are on slide 22.
Earnings • Adjusted1 EPS growth of 8% YoY
• Operating Leverage of 3.4%
• ROE of 17.2%
Revenue • Diversified volume growth in Canadian
Personal and Small Business Banking
• Strong asset growth in Wealth
Management
• Good loan and deposit growth in
Commercial Banking
• Strong full quarter of CIBC Bank USA
results
Expenses • Efficiency ratio of 56.5%, an
improvement of 170 bps YoY
Provision for Credit Losses • Strong credit performance across SBUs
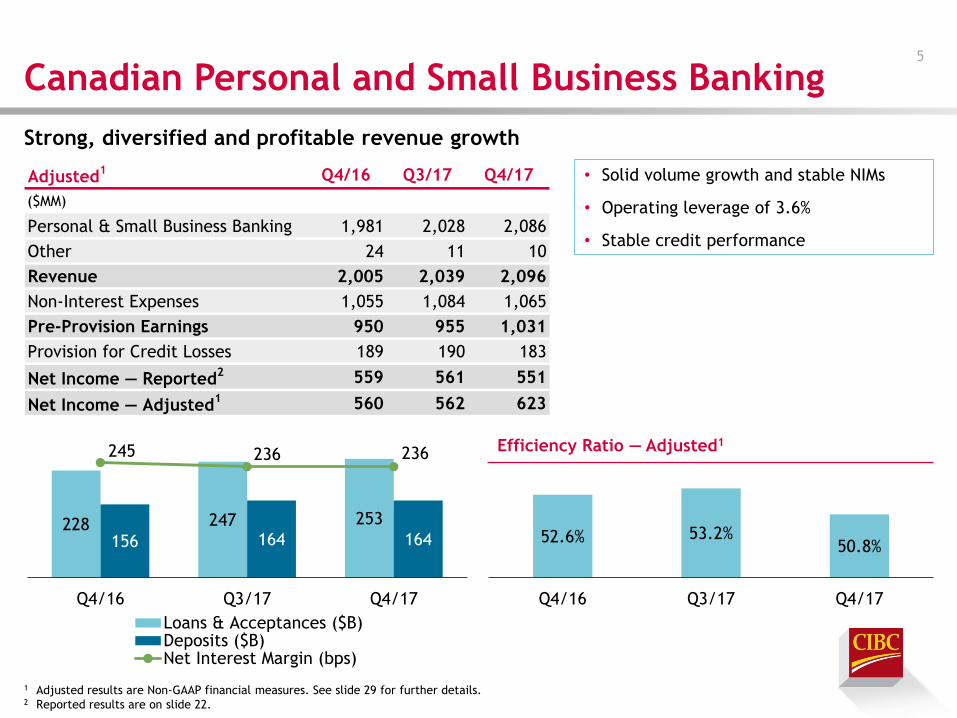
Adjusted1 Q4/16 Q3/17 Q4/17
($MM)
Personal & Small Business Banking 1,981 2,028 2,086
Other 24 11 10
Revenue 2,005 2,039 2,096
Non-Interest Expenses 1,055 1,084 1,065
Pre-Provision Earnings 950 955 1,031
Provision for Credit Losses 189 190 183
Net Income — Reported2 559 561 551
Net Income — Adjusted1 560 562 623
228 247 253
156 164 164
245 236 236
Q4/16 Q3/17 Q4/17
Loans & Acceptances ($B)Deposits ($B)Net Interest Margin (bps)
52.6% 53.2%50.8%
Q4/16 Q3/17 Q4/17
Canadian Personal and Small Business Banking 5
1 Adjusted results are Non-GAAP financial measures. See slide 29 for further details. 2 Reported results are on slide 22.
• Solid volume growth and stable NIMs
• Operating leverage of 3.6%
• Stable credit performance
Strong, diversified and profitable revenue growth
Efficiency Ratio — Adjusted1

Q4/17
Balances
($B)
YoY
Growth
Most Current
Market Share1
Absolute
Rank
YoY Growth
Rank
Money-In
Personal Deposits & GICs 143 5.3% 16.7% 4 3
Canadian Retail Mutual Fund AUM 101 11.6% 15.4% 3 2
Small Business Deposits & GICs 22 3.8% 13.6% 4 6
Money-Out
Real Estate Secured Personal Lending 222 11.7% 18.6% 3 1
Unsecured Personal Lending incl. Cards 28 4.1% 12.0% 4 2
Small Business Lending 3 11.3% 10.5% 5 2
Strong and Balanced Market Share Growth 6
1 Market share is calculated using most current data available from OSFI, Canadian Bankers Association and
Investment Funds Institute of Canada, and is based on 6 banks (CIBC, BMO, BNS, NA, RBC and TD).
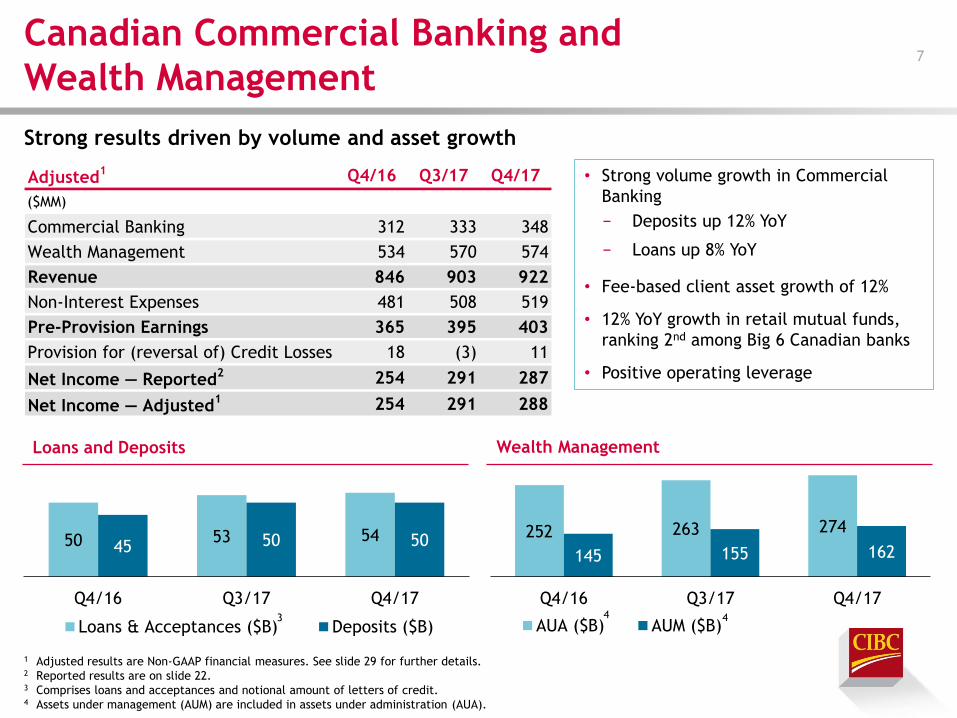
Adjusted1 Q4/16 Q3/17 Q4/17
($MM)
Commercial Banking 312 333 348
Wealth Management 534 570 574
Revenue 846 903 922
Non-Interest Expenses 481 508 519
Pre-Provision Earnings 365 395 403
Provision for (reversal of) Credit Losses 18 (3) 11
Net Income — Reported2 254 291 287
Net Income — Adjusted1 254 291 288
50 53 5445 50 50
Q4/16 Q3/17 Q4/17
Loans & Acceptances ($B) Deposits ($B)
252 263 274
145 155 162
Q4/16 Q3/17 Q4/17
AUA ($B) AUM ($B)
Canadian Commercial Banking and
Wealth Management 7
1 Adjusted results are Non-GAAP financial measures. See slide 29 for further details. 2 Reported results are on slide 22. 3 Comprises loans and acceptances and notional amount of letters of credit. 4 Assets under management (AUM) are included in assets under administration (AUA).
• Strong volume growth in Commercial
Banking
− Deposits up 12% YoY
− Loans up 8% YoY
• Fee-based client asset growth of 12%
• 12% YoY growth in retail mutual funds,
ranking 2nd among Big 6 Canadian banks
• Positive operating leverage
4 4 3
Strong results driven by volume and asset growth
Loans and Deposits Wealth Management

24 19 3726
82
Q4/16 Q3/17 Q4/17
Former PrivateBankAtlantic Trust, Real Estate Finance & Other
Adjusted1 Q4/16 Q3/17 Q4/17
($MM)
Commercial Banking 49 150 257
Wealth Management 57 80 110
Other - 9 24
Revenue2 106 239 391
Non-Interest Expenses 74 147 219
Pre-Provision Earnings 32 92 172
Provision for Credit Losses - 34 13
Net Income — Reported3 23 41 107
Net Income — Adjusted1 24 45 119
44 58 62
12
38 45 49
10
Q4/16 Q3/17 Q4/17
AUA ($B) AUM ($B) Geneva ($B)
59 74
U.S. Commercial Banking and
Wealth Management 8
1 Adjusted results are Non-GAAP financial measures. See slide 29 for further details. 2 Revenue is reported on a taxable equivalent basis (TEB). 3 Reported results are on slide 22. 4 Assets under management (AUM) are included in assets under administration (AUA).
• Revenue growth reflects the high-quality
U.S. banking and private wealth
capabilities added during the year
• Acquisition of Geneva Advisors
contributed over $10B in assets under
management
• Credit quality remains strong
• Leveraging combined capabilities for an
expanded client offering
4 4
Continued profitable client growth
Net Income — Adjusted ($MM)1 Wealth Management

Adjusted1 (US$MM),
for the three months ended
2016
Sep. 302
2017
Oct. 313
Revenue 184 226
Non-Interest Expenses 92 119
Pre-Provision Earnings 92 107
Provision for Credit Losses 16 10
Net Income — Reported 49 57
Net Income — Adjusted1 49 65
(US$B)
Average Loans4 14.4 16.4
Average Deposits4 15.2 16.2
3.18%3.40%
Q3/16 Q4/17
49 65
Q3/16 Q4/17
Former PrivateBank (US$) 9
1 Adjusted results are Non-GAAP financial measures. See slide 29 for further details. 2 Results are for the calendar quarters as previously disclosed by PrivateBancorp, Inc.’s public filings. 3 Loan accretion in revenue and PCL build-up were treated as an item of note. Equivalent items for Q3/17 were
included in adjusted results. 4 Loan balances exclude loans held for sale. Loan and deposit balances exclude the impact of purchase accounting.
Pre-Acquisition2 Post-Acquisition Pre-Acquisition2 Post-Acquisition
• Growth in average loans4 of US$2B, or 14%,
and average deposits4 of US$1B, or 7%
• Solid momentum in new client
development, with approximately
US$623MM in loans to new clients during
Q4/17
• Overall credit quality continues to be
strong
(Three months ended
September 30/16)
(Three months ended
October 31/17)
(Three months ended
September 30/16)
(Three months ended
October 31/17)
Net Income — Adjusted (US$MM)1 Net Interest Margin — Adjusted1

Adjusted1 Q4/16 Q3/17 Q4/17
($MM)
Global Markets 366 362 299
Corporate & Investment Banking 265 318 326
Other (2) (1) (3)
Revenue2 629 679 622
Non-Interest Expenses 302 340 320
Pre-Provision Earnings 327 339 302
Provision for Credit Losses - 1 -
Net Income — Reported3 255 252 222
Net Income — Adjusted1 262 252 222
325 397 375
304282 247
Q4/16 Q3/17 Q4/17
Non-Trading Trading
Revenue ($MM)1,2
Capital Markets 10
1 Adjusted results are Non-GAAP financial measures. See slide 29 for further details. 2 Revenue is reported on a taxable equivalent basis (TEB). 3 Reported results are on slide 22.
• Growing and diversifying our business by
geography, industry and products:
− Delivering capital markets products
and services to our Canadian and
U.S. Commercial and Wealth clients
− Adding innovative and stable
revenue streams through Capital
Markets cycle
• Building our U.S. platform, leveraging
our expertise and investment in
technology
• Maintaining strict discipline around
resources ensuring strong ROE and NIX
ratios
Delivering consistent and stable earnings

Adjusted1 Q4/16 Q3/17 Q4/17
($MM)
International Banking 176 183 183
Other (78) 70 33
Revenue2 98 253 216
Non-Interest Expenses 288 289 297
Pre-Provision Earnings (190) (36) (81)
Provision for (reversal of) Credit Losses 15 (13) 5
Net Income (Loss) — Reported3 (160) (48) (3)
Net Income (Loss) — Adjusted1 (59) 16 11
Corporate and Other 11
1 Adjusted results are Non-GAAP financial measures. See slide 29 for further details. 2 Revenue is reported on a taxable equivalent basis (TEB). 3 Reported results are on slide 22.
• Consistent performance in International
Banking
• Higher Treasury revenue
• Lower TEB offset YoY
• Strong credit performance
98253 216
288 289 297
Q4/16 Q3/17 Q4/17
Revenue Expense

CET1 Ratio (all-in basis)
Capital 12
• Strong internal capital generation
• Share issuance driven by DRIP
Partially offset by:
• Impact of Geneva Advisors acquisition and Basel I Floor adjustment
10.4%
(10)bps 10.6%
29bps12bps
(3)bps(6)bps
Q3/17 Internal CapitalGeneration
Common SharesIssued (excl.
Geneva related)
RWAs (excl. FX) Geneva Basel I Floor& Other
Q4/17

Adjusted1 FY16 FY17
Revenue 14,530 15,975
Non-Interest Expenses 8,709 9,312
Pre-Provision Earnings 5,821 6,663
Provision for Credit Losses 902 812
Net Income — Reported 4,295 4,718
Net Income — Adjusted1 4,104 4,665
Diluted EPS — Reported $10.70 $11.24
Diluted EPS — Adjusted1 $10.22 $11.11
Efficiency Ratio — Adjusted TEB1 58.0% 57.2%
ROE — Adjusted1 19.0% 18.1%
CET1 Ratio 11.3% 10.6%
($MM, except for EPS, Efficiency Ratio, ROE, and CET1 Ratio)
2017 Highlights 13
1 Adjusted results are Non-GAAP financial measures. See slide 29 for further details.
Earnings • Adjusted1 EPS up 9% YoY
• Operating Leverage of 1.6%
• ROE of 18.1%
Revenue • Diversified revenue growth in our
Canadian Personal, Commercial and
Wealth businesses
• CIBC Bank USA contributed over
$400MM of revenue
• Solid performance in core Capital
Markets businesses
Expenses • Efficiency ratio of 57.2%, an
improvement of 80 bps YoY
• Focused investments to support
business growth
Provision for Credit Losses • Down YoY reflecting lower provisions in
Capital Markets

Laura Dottori-Attanasio Senior Executive Vice-President and Chief Risk Officer
Fourth Quarter, 2017
Risk Review

222 212 179 209 212
0.27% 0.26% 0.25% 0.24% 0.23%
Q4/16 Q1/17 Q2/17 Q3/17 Q4/17
Adjusted PCL Rate (Impaired Loans)
Adjusted1 Q4/16 Q3/17 Q4/17
($MM)
Canadian Personal and Small Business
Banking189 190 183
Canadian Commercial Banking and
Wealth Management18 (3) 11
U.S. Commercial Banking and
Wealth Management– 34 13
Capital Markets – 1 –
Corporate and Other 15 (13) 5
Total Provision for Credit Losses 222 209 212
Total Provision for Credit Losses — Reported 222 209 229
Provision for Credit Losses 15
1 Adjusted results are Non-GAAP financial measures. See slide 29 for further details.
vs. Q3/17:
• Lower losses in U.S. real estate finance
and Canadian retail portfolios
• Higher losses in Canadian
Commercial Banking

Reported Q4/16 Q3/17 Q4/17
Canadian Residential Mortgages 0.14% 0.14% 0.14%
Canadian Personal Lending 0.33% 0.30% 0.29%
CIBC Business & Government Loans1 0.93% 0.43% 0.40%
CIBC Bank USA n/a 0.68% 0.67%
CIBC FirstCaribbean 7.02% 6.24% 5.49%
Total Gross Impaired Loans 0.52% 0.37% 0.36%
0.00%
0.40%
0.80%
1.20%
Q4/16 Q1/17 Q2/17 Q3/17 Q4/17
Consumer Business & Government CIBC Total
Credit Quality — Gross Impaired Loans 16
1 Excludes CIBC Bank USA and CIBC FCIB business & government loans.
vs. Q3/17:
• Overall gross impaired ratio continues to
remain low and stable
Gross Impaired Loan Ratio

0.00%
0.20%
0.40%
0.60%
0.80%
Q4/16 Q1/17 Q2/17 Q3/17 Q4/17
Consumer Business & Government CIBC Total
Reported Q4/16 Q3/17 Q4/17
Canadian Residential Mortgages 0.01% 0.02% 0.01%
Canadian Credit Cards 3.31% 3.33% 3.06%
Canadian Personal Lending 0.77% 0.78% 0.72%
CIBC Business & Government Loans1 0.61% 0.02% 0.08%
CIBC Bank USA n/a 0.00% 0.02%
CIBC FirstCaribbean 1.03% 0.67% 1.77%
Total Net Write-off Ratio 0.39% 0.24% 0.24%
Credit Quality — Net Write-offs 17
1 Excludes CIBC Bank USA and CIBC FCIB business & government loans.
• Overall net write-off ratio remain stable
QoQ
• Lower ratio in Business & Government
portfolio YoY
• Higher ratio in CIBC FirstCaribbean QoQ
and YoY
Net Write-off Ratio

12.0 12.0 12.2 12.4 12.4
2.5 2.5 2.6 2.7 2.75.8 5.9 6.2 6.5 6.6
20.3 20.4 21.0 21.6 21.7
Q4/16 Q1/17 Q2/17 Q3/17 Q4/17
Other Region GVA GTA
105 106 108 110 114
25 26 26 27 27 51 54 56 60 60
181 186 190 197 201
Q4/16 Q1/17 Q2/17 Q3/17 Q4/17
Other Region GVA GTA
Canadian Real Estate Secured Personal Lending 18
1 GVA and GTA definitions based on regional mappings from Teranet.
• Uninsured mortgages in the Greater
Vancouver Area1 (GVA) and Greater
Toronto Area1 (GTA) have lower 90+ days
delinquency rates than the
Canadian average
Mortgage Balances ($B; spot) HELOC Balances ($B; spot)
Q4/16 Q3/17 Q4/17
Total Mortgages 0.25% 0.23% 0.23%
Uninsured Mortgages 0.19% 0.17% 0.17%
Uninsured Mortgages in GVA1 0.06% 0.07% 0.05%
Uninsured Mortgages in GTA1 0.07% 0.06% 0.08%
90+ Days Delinquency Rates
1 1 1 1

12.2 12.0 12.1 12.3 12.2
13.7 13.7 14.0 14.4 14.6
Q4/16 Q1/17 Q2/17 Q3/17 Q4/17
Credit Cards Unsecured Personal Lending
25.9 26.826.726.125.7
Canadian Credit Cards and Unsecured
Personal Lending 19
1 Includes unsecured personal lines of credit, loans and overdraft.
• 90+ days delinquency rates of both
credit cards and unsecured personal
lending were down YoY
Balances ($B; spot)
Q4/16 Q3/17 Q4/17
Canadian Credit Cards 0.82% 0.75% 0.78%
Canadian Unsecured Personal Lending1 0.50% 0.47% 0.48%
90+ Days Delinquency Rates

Appendix

532
1,183 1,083
37
60 59
F12 F16 F17CIBC MA Headcount (end of period spot)
Avg Unit Sales per CIBC MA
67% 67%
8%
32%24%
1%
Q4/12 Q4/17
Real Estate Secured Lending Average Balances by Channel
Building Deeper Relationships With Our
Mortgage Clients 21
Over 75% were
single-product
clients
CIBC Banking Centres
CIBC Mortgage Advisors
FirstLine Mortgages
• Less than 15% are
single-product relationships
• Over 55% of clients have
deposits and / or
investments with CIBC
CIBC Mortgage Advisor Productivity
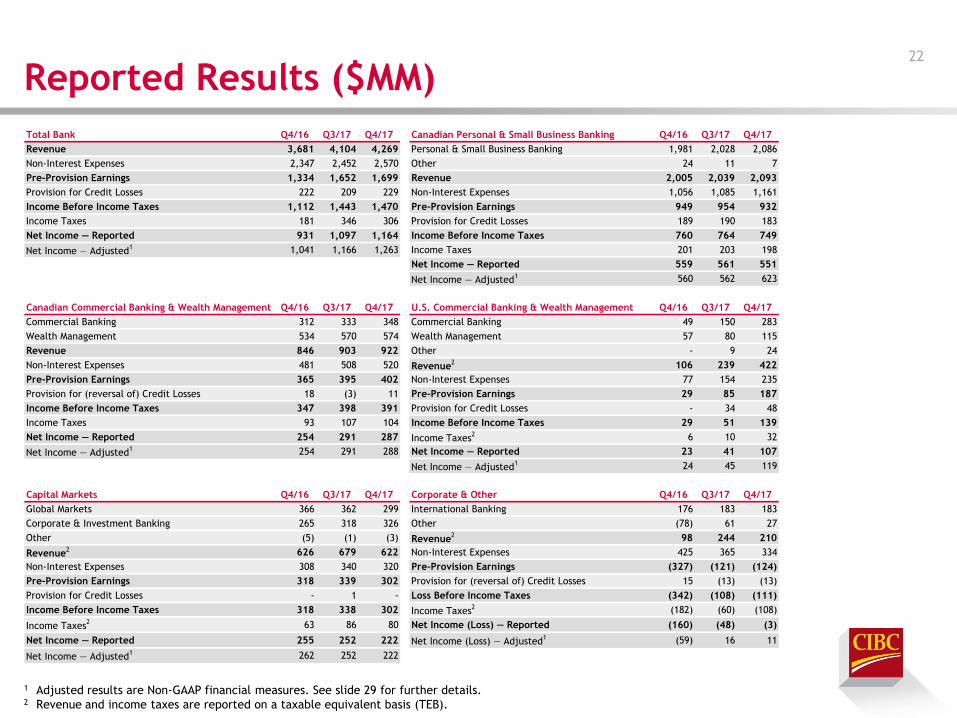
Total Bank Q4/16 Q3/17 Q4/17 Canadian Personal & Small Business Banking Q4/16 Q3/17 Q4/17
Revenue 3,681 4,104 4,269 Personal & Small Business Banking 1,981 2,028 2,086
Non-Interest Expenses 2,347 2,452 2,570 Other 24 11 7
Pre-Provision Earnings 1,334 1,652 1,699 Revenue 2,005 2,039 2,093
Provision for Credit Losses 222 209 229 Non-Interest Expenses 1,056 1,085 1,161
Income Before Income Taxes 1,112 1,443 1,470 Pre-Provision Earnings 949 954 932
Income Taxes 181 346 306 Provision for Credit Losses 189 190 183
Net Income — Reported 931 1,097 1,164 Income Before Income Taxes 760 764 749
Net Income — Adjusted1 1,041 1,166 1,263 Income Taxes 201 203 198
Net Income — Reported 559 561 551
Net Income — Adjusted1 560 562 623
Canadian Commercial Banking & Wealth Management Q4/16 Q3/17 Q4/17 U.S. Commercial Banking & Wealth Management Q4/16 Q3/17 Q4/17
Commercial Banking 312 333 348 Commercial Banking 49 150 283
Wealth Management 534 570 574 Wealth Management 57 80 115
Revenue 846 903 922 Other - 9 24
Non-Interest Expenses 481 508 520 Revenue2 106 239 422
Pre-Provision Earnings 365 395 402 Non-Interest Expenses 77 154 235
Provision for (reversal of) Credit Losses 18 (3) 11 Pre-Provision Earnings 29 85 187
Income Before Income Taxes 347 398 391 Provision for Credit Losses - 34 48
Income Taxes 93 107 104 Income Before Income Taxes 29 51 139
Net Income — Reported 254 291 287 Income Taxes2 6 10 32
Net Income — Adjusted1 254 291 288 Net Income — Reported 23 41 107
Net Income — Adjusted1 24 45 119
Capital Markets Q4/16 Q3/17 Q4/17 Corporate & Other Q4/16 Q3/17 Q4/17
Global Markets 366 362 299 International Banking 176 183 183
Corporate & Investment Banking 265 318 326 Other (78) 61 27
Other (5) (1) (3) Revenue2 98 244 210
Revenue2 626 679 622 Non-Interest Expenses 425 365 334
Non-Interest Expenses 308 340 320 Pre-Provision Earnings (327) (121) (124)
Pre-Provision Earnings 318 339 302 Provision for (reversal of) Credit Losses 15 (13) (13)
Provision for Credit Losses - 1 - Loss Before Income Taxes (342) (108) (111)
Income Before Income Taxes 318 338 302 Income Taxes2 (182) (60) (108)
Income Taxes2 63 86 80 Net Income (Loss) — Reported (160) (48) (3)
Net Income — Reported 255 252 222 Net Income (Loss) — Adjusted1 (59) 16 11
Net Income — Adjusted1 262 252 222
Reported Results ($MM) 22
1 Adjusted results are Non-GAAP financial measures. See slide 29 for further details. 2 Revenue and income taxes are reported on a taxable equivalent basis (TEB).

3% 7%17%
35% 38%
5%11%
25%
41%
18%
4% 8%
20%
38%30%
<30% 30 to <45% 45 to <60% 60 to ≤75% >75%
Canada GVA GTA
6%17%
31%36%
10%4%
14%
30%40%
12%6%
17%
31%36%
10%
≤650 651-700 701-750 751-800 >800
Canada GVA GTA
Canadian Uninsured Residential Mortgages —
Q4/17 Originations 23
1 LTV ratios for residential mortgages are calculated based on weighted average. See page 57 of 2017 Annual Report
for further details. 2 GVA and GTA definitions based on regional mappings from Teranet.
• $12B of originations in Q4/17
• Average LTV1 in Canada: 64%
− GVA2: 58%
− GTA2: 62%
Beacon Distribution
Loan-to-Value (LTV)1 Distribution
2 2
2 2
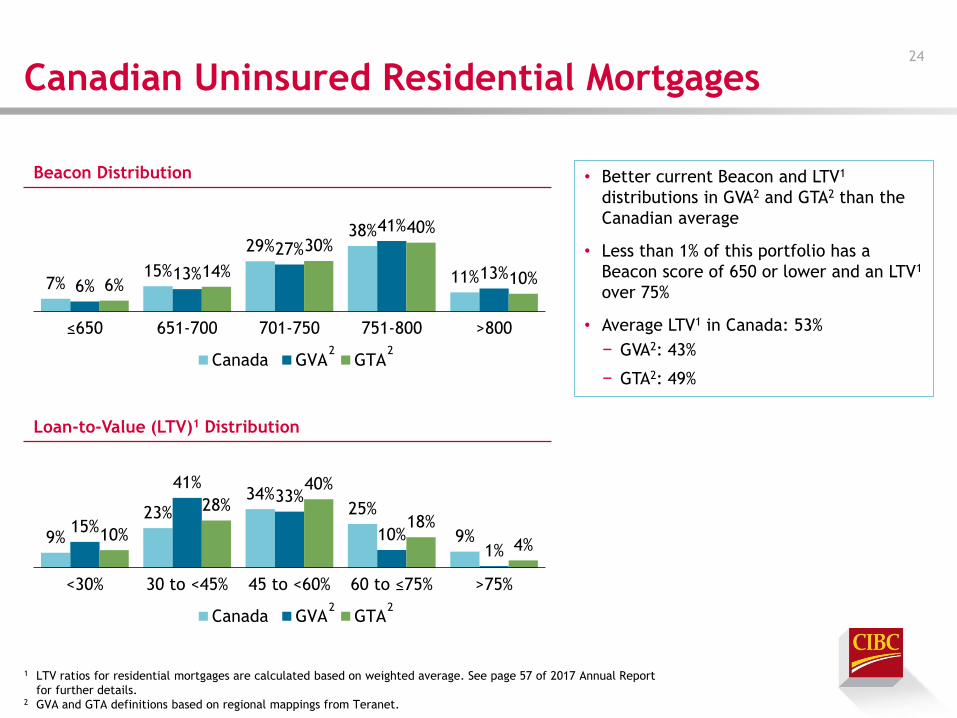
9%
23%34%
25%
9%15%
41%33%
10%1%
10%
28%
40%
18%
4%
<30% 30 to <45% 45 to <60% 60 to ≤75% >75%
Canada GVA GTA
7%15%
29%38%
11%6%
13%
27%
41%
13%6%
14%
30%40%
10%
≤650 651-700 701-750 751-800 >800
Canada GVA GTA
Canadian Uninsured Residential Mortgages 24
1 LTV ratios for residential mortgages are calculated based on weighted average. See page 57 of 2017 Annual Report
for further details. 2 GVA and GTA definitions based on regional mappings from Teranet.
• Better current Beacon and LTV1
distributions in GVA2 and GTA2 than the
Canadian average
• Less than 1% of this portfolio has a
Beacon score of 650 or lower and an LTV1
over 75%
• Average LTV1 in Canada: 53%
− GVA2: 43%
− GTA2: 49%
Beacon Distribution
Loan-to-Value (LTV)1 Distribution
2 2
2 2

17.7 16.8 17.4 17.3 18.1
Q4/16 Q1/17 Q2/17 Q3/17 Q4/17
Oil & Gas Business & Government Exposure 25
1 Based on business and government Advanced Internal Rating-Based (AIRB) estimates of exposure at default.
See page 23 of the Supplementary Regulatory Capital Disclosure for further details.
• $18.1B of direct exposure1, up from
$17.3B last quarter
− 75% of this is investment grade
• $7.5B drawn exposure1, up from $7.2B
last quarter
− 63% of this is investment grade
• 84% of undrawn exposure1 is investment
grade
Downstream 3%
Integrated 13%
Midstream 17%
O&G Services 3%
Petroleum Distribution
16%
Exploration & Production
48%
Direct Exposure1

40.2 40.5 40.8 41.3 41.4
Q4/16 Q1/17 Q2/17 Q3/17 Q4/17
Q4/16 Q1/17 Q2/17 Q3/17 Q4/17
Insured Mortgages 68% 69% 69% 69% 69%
Uninsured Mortgages 65% 66% 66% 65% 65%
HELOC 62% 62% 63% 62% 62%
Loan-to-Value (LTV)3
Oil & Gas Retail Exposure 26
1 Comprises mortgages, HELOC, unsecured personal lines and loans, credit cards and small business. 2 Alberta, Saskatchewan and Newfoundland and Labrador. 3 LTV ratios for residential mortgages are calculated based on weighted average. See page 57 of 2017 Annual Report
for further details.
• $41.4B of retail exposure1 to oil
provinces2 (or $21.8B excluding insured
mortgages)
− Alberta accounts for $32.7B or 79% of
the retail exposure1
− Average LTV3 of 65% in the uninsured
mortgage portfolio
Insured Mortgages
47%
Uninsured Mortgages
31%
HELOC9%
Other13%
Retail Exposure1 in Oil Provinces ($B)

(15)
(10)
(5)
0
5
10
15
20
(15)
(10)
(5)
0
5
10
15
20
Trading Revenue (TEB) VaR
($MM)
Aug-17 Sep-17 Oct-17
($MM)
Trading Revenue (TEB)1 Distribution2 27
1 Non-GAAP financial measure. See slide 29 for further details. 2 Trading revenue distribution on which VaR is calculated is not on a TEB basis. Trading revenue (TEB) comprises both
trading net interest income and non-interest income and excludes underwriting fees and commissions. Trading
revenue (TEB) excludes certain exited portfolios.

Pre-Tax
Effect
($MM)
After-Tax
& NCI
Effect
($MM)
EPS
Effect
($/Share)
Pre-Tax
Effect
($MM)
After-Tax
& NCI
Effect
($MM)
EPS
Effect
($/Share)
Fees and charges related to the launch of
Simplii Financial and the related wind-down of
President’s Choice Financial
98 71 0.15 98 71 0.16
Transaction and integration-related costs as
well as purchase accounting adjustments
associated with the acquisition of The
PrivateBank and Geneva Advisors
46 29 0.07 104 73 0.18
Increase (decrease) in collective allowance in
Corporate & Other(18) (13) (0.03) (18) (13) (0.03)
Amortization of intangible assets 19 12 0.03 41 28 0.07
Gain on sale and lease back of certain retail
properties(299) (245) (0.59)
Increase in legal provisions 45 33 0.08
Adjustment to Net Income attributable to
common shareholders and EPS145 99 0.22 (29) (53) (0.13)
Q4 2017 FY 2017
Items of Note 28

Non-GAAP Financial Measures 29
• Adjusted results are Non-GAAP financial measures that do not have any standardized
meaning prescribed by GAAP and are therefore unlikely to be comparable to similar
measures presented by other issuers.
• For further details on items of note see slide 28 of this presentation; for Non-GAAP
measures and reconciliation of Non-GAAP to GAAP measures see pages 1 and 2 of the
Q4/17 Supplementary Financial Information and pages 14 and 15 of the 2017 Annual
Report available on www.cibc.com.


