28
Dino Explorer 2014 CICS Explorer overview

Dino Explorer 2014
CICS Explorer overview
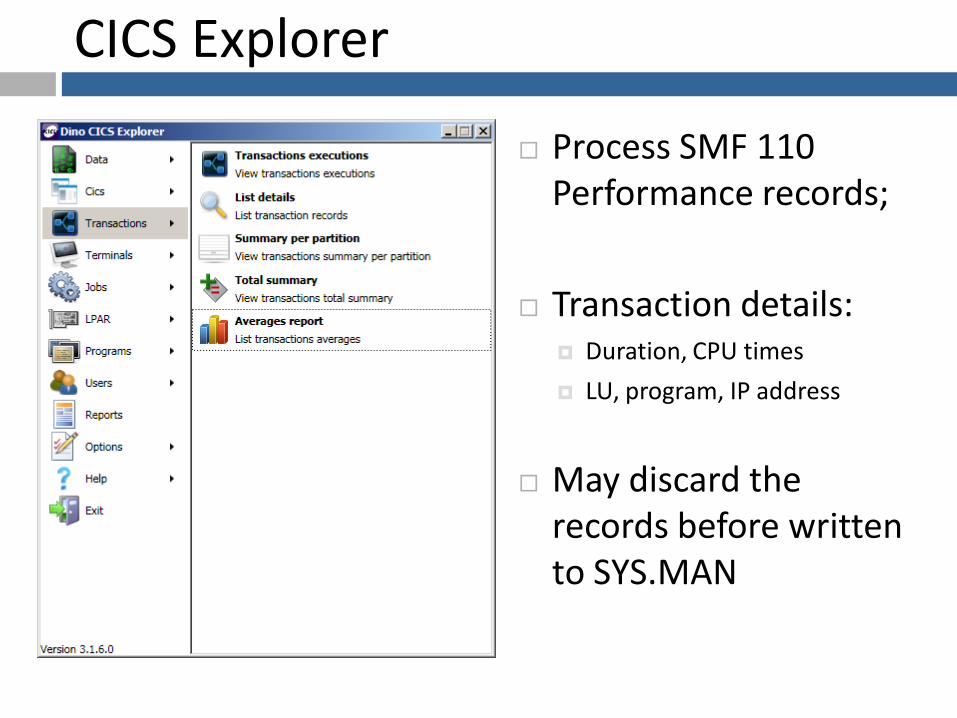
CICS Explorer
Process SMF 110 Performance records;
Transaction details: Duration, CPU times
LU, program, IP address
May discard the records before written to SYS.MAN

Dino Architecture
The transaction details are downloaded assynchronously in a continuosly process;
There is an independent messaging process for each z/OS image;
Dino DB
eventseventsevents
queries
qu
erie
s queries

Dino Messaging
Timestamp and
save the eventsSMF
Copy SMF record
to SMF datasets
SMF Dump
IFASMFDP
SMF
dataset
SYS.MAN1 SYS.MAN2 SYS.MANn
Events
JE
S2
RA
CF
CIC
S
DB
2
oth
ers
Extract CPU
Explorer info and
Save in CSV file
SMF Extractor
DXPLSMFExport
data
CSV file
...
Transfer the
File
FTP
CSV file
In
ASCII
Transfer the
FileFTP
Get the records
and
Insert on DB
Data Loader
Dino DB
Save the records
On memory
DxQueue
DxSMF
Get the records
exit
I/O
I/O
I/O I/O I/O
I/O
I/OI/O
Open platform
Dino Messaging – Real Time
Batch Collector – File Transfer Note: SMF Discard option embedded

Data flow
The records are processed asynchronously on the DXSMF address space and saved on the DXQUEUE for delivery;
If we stop polling records, they are automatically paged-out;
Once restored, they are paged-in.

Throughput controls
You can control:
Number of parallel sessions
How many records per bulk insert
TCP/IP message size
Resting time when the messaging is faster
Maximum time the events are kept in memory

One record per transaction
You can see all the transactions on a single view independently where it was executed;
Start time SID CICS name TRX Type RACF username Program name LUNAME Terminal Unit-of-Work ID Orign IP Duration time CPU time
07/05/2013 17:49:24 BE12 CICSTS41 CQRY S CICSUSER DFHQRY SC0TCP06 CP06 CB534B8D918A4003 10.1.1.10 0:00:00,106 0:00:00,013
07/05/2013 17:49:24 BE12 CICSTS41 CSGM S CICSUSER DFHGMM SC0TCP06 CP06 CB534B8DAC744002 10.1.1.10 0:00:00,074 0:00:00,010
07/05/2013 17:49:25 BE12 CICSTS41 CSAC TO CICSUSER DFHACP SC0TCP06 CP06 CB534B8E71D0F000 10.1.1.10 0:00:00,008 0:00:00,005
07/05/2013 17:49:28 BE12 CICSTS41 BEAR TO CICSUSER CICSTEST SC0TCP06 CP06 CB534B90C76D0000 10.1.1.10 0:00:02,958 0:00:00,027
07/05/2013 17:49:31 BE12 CICSTS41 CSAC TO CICSUSER DFHACP SC0TCP06 CP06 CB534B9465BE6000 10.1.1.10 0:00:00,007 0:00:00,004
07/05/2013 17:49:46 BE12 CICSTS41 BEAR TO CICSUSER CICSTEST SC0TCP06 CP06 CB534BA24C4AA000 10.1.1.10 0:00:01,129 0:00:00,011
07/05/2013 17:49:48 BE12 CICSTS41 CSAC TO CICSUSER DFHACP SC0TCP06 CP06 CB534BA4B572E000 10.1.1.10 0:00:00,006 0:00:00,003
07/05/2013 17:49:51 BE12 CICSTS41 BEAR TO CICSUSER CICSTEST SC0TCP06 CP06 CB534BA759DC7000 10.1.1.10 0:00:00,634 0:00:00,013
07/05/2013 17:49:55 BE12 CICSTS41 BEAR TO CICSUSER CICSTEST SC0TCP06 CP06 CB534BAAF31C5000 10.1.1.10 0:00:00,649 0:00:00,012
07/05/2013 17:49:57 BE12 CICSTS41 BEAR TO CICSUSER CICSTEST SC0TCP06 CP06 CB534BAD21A55000 10.1.1.10 0:00:00,665 0:00:00,010

You can see the transactions a few seconds after their execution
Two phase
Import Load views

Transaction History
The transactions are summarized on intervals and grouped by key fields:
Transaction code
CICS name
SID
LUNAME
Username
Program name
Abend code
IP address
Terminal
WLM class
Trx class
Trx type

History counters
We save:
totals;
Interval (start and end times);
and the quantity of transactions
So,
average = total/qty
in any interval
Number of transactions
Duration time
CPU time
Chars sent/received
OO calls
CPU mode times (K8, X9...)
∑

Total and Averages
The averages are nice to see changes in behaviour (application)
The totals are good for charge-backing

Customized dashboards
Any report can became a real-time report on a web portal

CICS Activity (TPS)
Average and peak transaction activity per hour of day and average response time (ms).

Double axis charts
Select the fields to chart

Waiting times
Drill-down functionality to show why the response time is high.

Transaction behavior
Comparing the top transaction with the latest months

Correlating transactions
You can use any combination of these fields on filters to find the related transactions
Currently supported fields:
Start time LUNAME Ori Ip address Pre Netid
End time Terminal Ori Port Ori Correlat
SID Transaction class Ori Facility Ori Time
CICS name WLM Class Ori Trx Pre Time
Job name WLM Report Pre Trx trxNum
Transaction code Unit-of-Work ID Ori Applid Ori Number
Type User Data 1 Pre Applid Pre Number
RACF username User Data 2 Ori Netid Hop count
Program name User Data 3
Ip address User Data 3

User Data
You can add your own application fields:
EXEC CICS MONITOR command
Supports up to 4 fields
See CMG 2013 paper: “Empowering CICS Logs”
Start time SID CICS name Jobname Trx code Type Pgm name Unit-of-Work ID Application Status BIN Duration time CPU time
07/05/2013 12:00:40 LPR1 CICSTS41 CICSA RE01 U RETIRA01 CB5340AEE0DE3002 WITHDRAW APPROVED 420061 0:00:00,084 0:00:00,016
07/05/2013 13:03:16 LPR1 CICSTS41 CICSA EX01 U EXTRAT01 CB5340AF071A8001 STATEMENT REJECTED 376520 0:00:00,046 0:00:00,001
07/05/2013 11:10:02 LPR1 CICSTS41 CICSA EM01 U EMPRES01 CB5340AF07A7A001 LOAN TIMED OUT 515590 0:00:00,045 0:00:00,003
07/05/2013 16:30:55 LPR1 CICSTS41 CICSA IB01 U INTBAN01 CB5340AF01E5C000 INT.BANKING RISK 422091 0:00:00,478 0:00:00,014
07/05/2013 17:00:46 LPR1 CICSTS41 CICSA BR01 U AGENCI01 CB5340AF048CD001 BRANCH ERROR 476608 0:00:00,603 0:00:00,026

BACKUP SLIDES
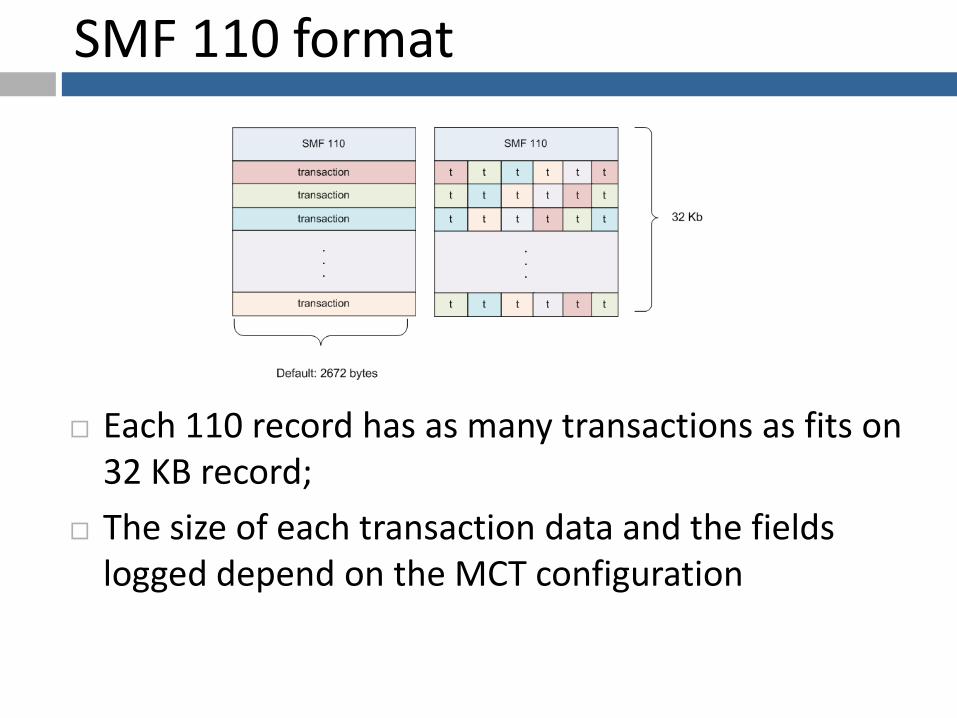
SMF 110 format
Each 110 record has as many transactions as fits on 32 KB record;
The size of each transaction data and the fields logged depend on the MCT configuration

Compressing history
Re-group your history with fewer fields
Re-group in a larger interval: daily, weekly or montly
You can get impressive results (97% reduction) just taking a few fields out, such as IP address, LUNAME and Terminal

Monitors uses XMNOUT exit
The real-time monitors use this facility to get transaction execution details;
Is invoked before a performance class monitoring record is written to the performance record buffer;
You can use this exit to examine the record, to suppress its output to SMF, or to change the data it contains;
Examples: CA-Sysview, OMEGAMON for CICS, BMC MainView and IBM CICS Performance Monitor.

Dino x Monitors (XMNOUT)
XMNOUT is invoked at least once per transaction execution;
CICS customization is required to activate the XMNOUT exits;
CMF fulfills an 32 Kb record with information from many transactions and calls the SMF exit;
The SMF activity is highly reduced compared to XMNOUT activity (roughly 20 times).

CICS TS 4.2 New Fields
New fields to tracking the transaction:
Transaction group ID (TRNGRPID);
Origin Transaction identification;
Previous hop: chain of transactions;
User correlation data (XAPADMGR exit);
Note: Not valid for SNA interconnection

User Correlation
1. You can create your own transaction ID up to 64 bytes;
2. Inform it on the first transaction executed (point of origin) through the XAPADMGR global exit;
3. All the other transactions in the chain will kept the same ID.

Transaction Execution
One record for each transaction
You can apply filters to the loading process
Start time Tcp service Link count Ori Trx MS CPU time Suspend time
End time Chars rec. XCTL count Pre Trx L8 CPU time 1st Disp time
SID Chars sent Load count Ori Applid J8 CPU time Disp wait
CICS name OO calls Socket count Pre Applid S8 CPU time DB2 thread wait
Job name Unit-of-Work ID IC count Ori Netid Key 8 CPU time DB2 conn wait
Transaction code Trx. Flags TS count Pre Netid Key 9 CPU time Ch.mode wait
Type User Data 1 Web send count Ori Correlat L9 CPU time QR mode wait
RACF username User Data 2 Web count Ori Time J9 CPU time RMI time
Program name User Data 3 Web bytes Pre Time RO CPU time RMI suspend
LUNAME User Data 3 Max User Below trxNum X8 CPU time RLS wait
Terminal Ori Ip address Max CICS Below Ori Number X9 CPU time LU6.2 wait
Transaction class Ori Port Max CICS Above Pre Number Transient time MQ wait
WLM Class Ori Facility Max Pgm Storage Hop count Non-RLS time Term time
WLM Report Transient count Max Pgm Below Duration time RMI total Tcls delay
Abend Browse count DB2 count Dispatch time Lock time
Cur abend FC count IMS count CPU time ENQ time
Ip address BMS count MQ count QR CPU time IC time

CICS History - Fields
New: 1 minute interval
Start time Cur abend Load count Dispatch time Non-RLS time LU6.2 wait
End time Ip address Socket count CPU time RMI total MQ wait
SID Tcp service IC count QR CPU time Lock time Term time
CICS name Trx. Flags TS count MS CPU time ENQ time Tcls delay
Job name Ori Facility Web send count L8 CPU time IC time MXT delay
Transaction code Ori Ip address Web count J8 CPU time Suspend time
Type Ori Port Max User Below S8 CPU time 1st Disp time
RACF username Transactions Max CICS Below Key 8 CPU time Disp wait
Program name OO calls Max CICS Above Key 9 CPU time DB2 thread wait
LUNAME Transient count Max Pgm Storage L9 CPU time DB2 conn wait
Terminal Browse count Max Pgm Below J9 CPU time Ch.mode wait
Transaction class FC count DB2 count RO CPU time QR mode wait
WLM Class BMS count IMS count X8 CPU time RMI time
WLM Report Link count MQ count X9 CPU time RMI suspend
Abend XCTL count Duration time Transient time RLS wait


![COURSE2016 Aktuelles rund um zVSE - Lattwein · PDF fileAktuelles rund um z/VSE ... CICS Web Support (CWS), [ Business Transaction Services (BTS) ] 15 Preview: May ... – CICS Explorer](https://static.documents.pub/doc/80x56/5a9d9dc27f8b9abd0a8b479a/course2016-aktuelles-rund-um-zvse-lattwein-rund-um-zvse-cics-web-support.jpg)


