1
CIF Sector Update Report (Spring 2014) Sector: Industrials Analyst: Michael Sanders
Presentation Date: April 7, 2014
Review Period: Start Date: March 20, 2014 End Date: April 1, 2014
Section (A) Sector Performance Review (A-1) Sector Performance Relative to SP500
Sector Performance Review:
One Month Price Chart:
2
The Industrial sector slightly outperformed the S&P 500, (by 0.56%) during the review period
between March 20, 2014 and April 1, 2014. The price for XLI starting on March 20, 2014 was
$51.71, and ending on April 1, 2014 the ETF price for industrials was $52.70 indicating a $0.99
increase. The total capital gain for the XLI ETF during the review period was 1.89%. The S&P 500
had prices that started the review period at $1860.77, and ended the review period at
$1885.52. The total capital gain for the S&P 500 was 1.33%.
The broad over view of the market has a few indicators that could possibly explain the weak
performance from both the S&P 500 and the XLI. The recent conflict in Ukraine has strained on
the U.S markets, specifically because president Obama has issued trade sanctions against
Russia. On March 26, 2014 president Obama made a statement that the U.S will continue to
Ukraine through any peaceful measure. This has created bearish sentiment amongst investors,
and the S&P 500 and XLI ETF dropped in price after the announcement. Another issue that the
U.S markets have had to deal with during the review period is the adverse weather conditions
across the country (ISM). This has slowed down deliveries, and increased total expenses for
some firms. Both of these events have affected the market as a whole and are a part of the
bigger picture which influenced the slight outperformance.
The Industrial sector as a whole is extremely cyclical, and with the macro issues mentioned
above it is logical that the sector would perform as it did. Regarding the cyclical nature of the
industrial sector, most every macro indicators are useful. The unemployment rate for the U.S as
a whole was release at 6.7% which was the same rate as February. In addition, the PMI was at
53.7% for March which is 0.5% up from February. Important notes for the PMI were: new
orders, employment, production, and inventors are growing, and supplier deliveries are
slowing. The PMI and unemployment are both strong indicators for the overall health and
direction that the industrial sector will take. In this case the PMI has increased and indicates the
sector has potential growth in the short term, which could be a possibly indicate causality for
the slightly positive return that the sector ETF had. The treasury yield curve rate averaged
3.59% during the review period. This is lower than the start of the year, but has been about the
average since mid January 2014. This does create some bullish sentiment amongst investors
and could be a reason that the ETF return was slightly positive.
3
(A-2) Big Sector Movers
Top Gainers One-Month:
Fastenal Company (FAST) (+8.86%):
Joy Global INC (JOY) (+8.03%):
4
FAST and JOY both had extremely strong one-month price charts with gains above 8% for both
companies. FAST missed earnings estimates in January after releasing their annual report; this
caused the stock price to plummet. It is possible that after the initial shock of the report the
stock returned to its actual price. Joy Global had two announcements that most likely
contributed to the sudden increase in the stock price. First, the demand for mining equipment
returned after a previously slow year. Second, JOY announced a revision to their profit forecast
in 2014 raising the low expectation significantly.
Top Gainers Three-Month:
Southwest Airlines Co (LUV) (+22.61%):
Allegion plc Ordinary Shares (ALLE) (+22.22%):
5
Both Southwest and ALLE had extremely positive 3 month price charts, with gains above 22%.
Southwest has been presented bullishly from analysts with 7 positive revisions in the last 4
weeks. Another possible contribution to the major gain for Southwest is one of the few
profitable airlines, and since weather has been a major inhibitor to the industry it is possible
that they are a better buy than its competitors. However, there were no specific indicators for
the large gains. ALLE beat analyst expectations on February 21, 2014 which was the day they
saw the most positive gains. Most likely the market reaction to report release is what gave ALLE
such a huge boost in price.
Top Losers One-Month:
Ingersoll-Rand plc (IR) (-7.74%):
Nielsen Holdings NV (NLSN) (-5.26%):
6
The top losers for the one month price chart were Ingersoll-Rand (IR) an indoor climate control
firm, and Nielsen Holdings NV (NLSN) is an information and measurement services company. IR
had lower than expected profits in the last month which most likely contributed to its lagging
stock price. Also, the senior vice president sold 14 thousand shares on March 3, 2014. This isn’t
an extremely strong indicator for falling stock prices, but could be one contributing factor.
Looking at the institutional holdings for NLSN there are seven firms that own more than 4%. On
March 10, 2014 all seven of the major holders sold 6 million or more shares in the company. If
you look at the one or two year charts you will find that NLSN has had major gains in the last
two years. Most likely the investment firms sold their positions because they hit their target
price, thus pushing the price down.
Top Losers Three-Month:
The ADT Corp. (ADT) (-18.53%):
7
Dun & Brandstreet Corp (DNB) (-16.96%):
ADT was the industrial sectors top loser, losing over 18% of its total value. On January 31, 2014
an investigation began that accoused ADT for possible violations of Federal Securities Laws. This
was most definitely the cause of the major loss ADT had in the past three months. It is an
ongoing investigation and therefore the stock price hasn’t increased much since the
investigation began. DNB has also had a terrible three months, with losses nearing 17%. In the
last four months there have been 0 upgrades and 1 down grade from Reuters. DNB announced
on February 3, 2014 that they were undergoing leadership changes, by changing 4 major
positions: COO, Chief Sales Officer, Chief Marketing Officer, and Chief People Officer. On
February 3, 2014 DNB’s stock price dropped dramatically.
(A-3) Two Largest Stocks in the Sector
The two largest stocks for the industrial sector are General Electric Corp, and Boeing Corp.
General Electric has a current volume of approximately 33 million. Boeing has a current
approximate volume of 4 million shares.
GE One-Month:
8
Boeing One-Month:
GE outperformed the sector ETF and the S&P slightly by at the end of the one month chart.
Over the course of one month the S&P performed better on average than GE and the sector
9
ETF, but did not finish as strong as GE towards the end of the one month period. Boeing
underperformed when compared to both the S&P and the sector ETF.
General Electric News:
April 1, 2014 GE announced a recall of over 200 incubator-like warmers used in China to
regulate body temperature, regulate airflow and monitor vital signs in undersized infants. The
recall was due to the warmers restricting airflow to the infant. The recall could cost GE millions.
However, GE’s stock price did not seem to be affected by this news.
Boeing News:
April 1, 2014 Air Canada finalized an order for 61 Boeing 737 Max single-aisle jets. The
total value of the order is at $6.5 billion, originally announced in December of 2013. In addition,
to the 67 jets the agreement has additional options and rights for another purchase of 48
planes. The stock price seemed to rally because of this news.
(A-4) Short-term (up to Three Months) Outlook of the Sector
What is your short-term (up to three months) outlook of the sector? Provide arguments in
support of your view.
The industrial sector as mention previously is sensitive to the business cycle, world wide
events, and domestic events. The PMI is a very strong macro number we can use to evaluate
the short term health of the industrial sector. Currently the PMI is 53.7% which is a bullish
indicator, and since this is an improvement from February it is even more bullish. The treasury
yield is approximately 3.60%, which is also a bullish indicator. However, Janet Yellen has
mentioned that in the near future there will be tapering off of quantitative easing. This will give
a rise to interest rates, which while considered a bearish indicator has bullish potential. If the
interest rates rise and the forward rate remains higher than the market could have bullish
sentiment. However, in the case that the interest rate becomes higher than the forward rate,
the market will see bearish indications and negative returns. For the industrial sector especially
this is dangerous, because it is so cyclical. The current situation in Ukraine is a world event that
is unstable, and could be a potential threat to the industrial sector. Many international firms
will be hurt depending how long the economic sanctions against Russia continue. The situation
seems to be complicated and only growing in complexity, especially since the US has promised
to help bail out Ukraine. Overall, I would say the next few months will be fairly bullish where we
see some growth in the sector. Long term however it would be wise to re-evaluate the Ukraine
situation and the treasury rate after two to three months.
10
Section (B) Sector Holding Updates
Stock #1: FedEx Corporation (FDX)
Date Recommended: 02/24/2014
Date Re-evaluated: 04/07/2014
(B-1) Company Updates and Stock Performance
Company Update
FedEx filled their 10-Q report on March 20, 2014, missing earnings and revenue estimates. FDX
says that the weather is the main reason for missing both revenue and earnings. Analysts have
had several upgrades and downgrades on both earnings and revenue in the last four weeks, but
only one upgrade revision in the last week. On March 30, 2014 New York City and the state of
New York are suing FDX for allegedly violating state and federal laws by illegally delivering
contraband cigarettes to peoples homes. FDX is claimed to have knowingly shipped over
400,000 cartons of unstamped cigarettes depriving New York of tax revenue. FDX announced
two weeks ago that they will be opening a freight station in Chicago to expand its network and
to meet the current demand level.
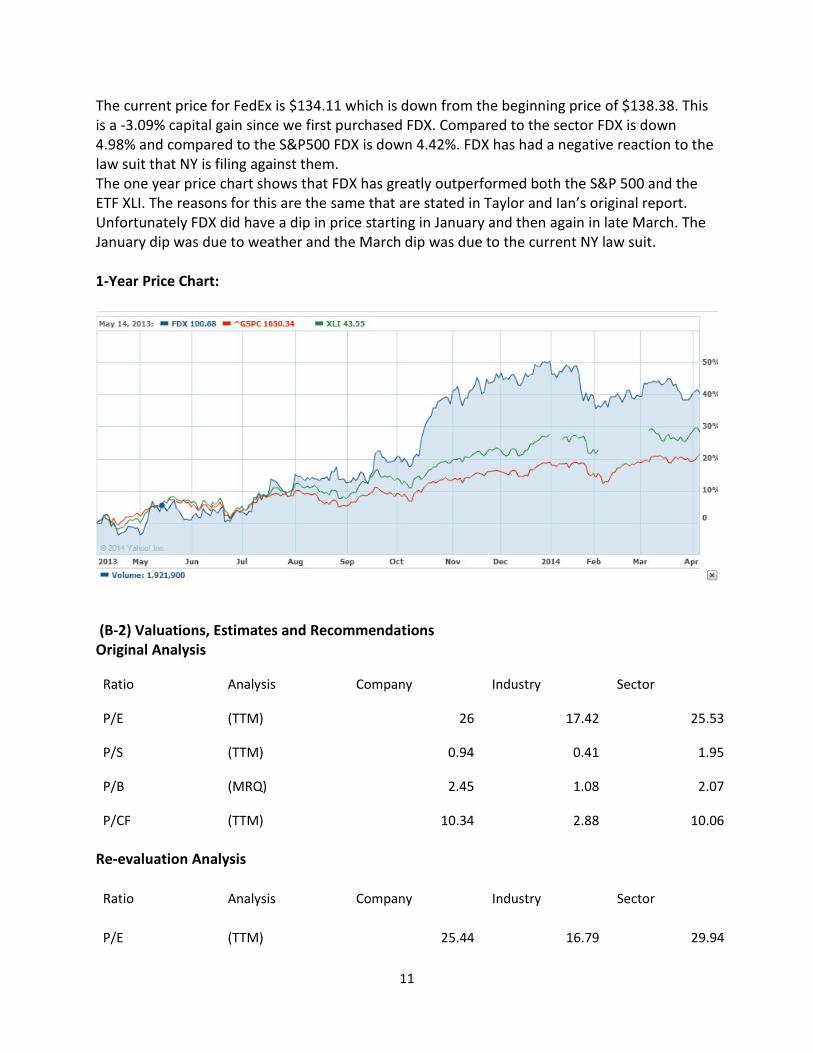
11
The current price for FedEx is $134.11 which is down from the beginning price of $138.38. This
is a -3.09% capital gain since we first purchased FDX. Compared to the sector FDX is down
4.98% and compared to the S&P500 FDX is down 4.42%. FDX has had a negative reaction to the
law suit that NY is filing against them.
The one year price chart shows that FDX has greatly outperformed both the S&P 500 and the
ETF XLI. The reasons for this are the same that are stated in Taylor and Ian’s original report.
Unfortunately FDX did have a dip in price starting in January and then again in late March. The
January dip was due to weather and the March dip was due to the current NY law suit.
1-Year Price Chart:
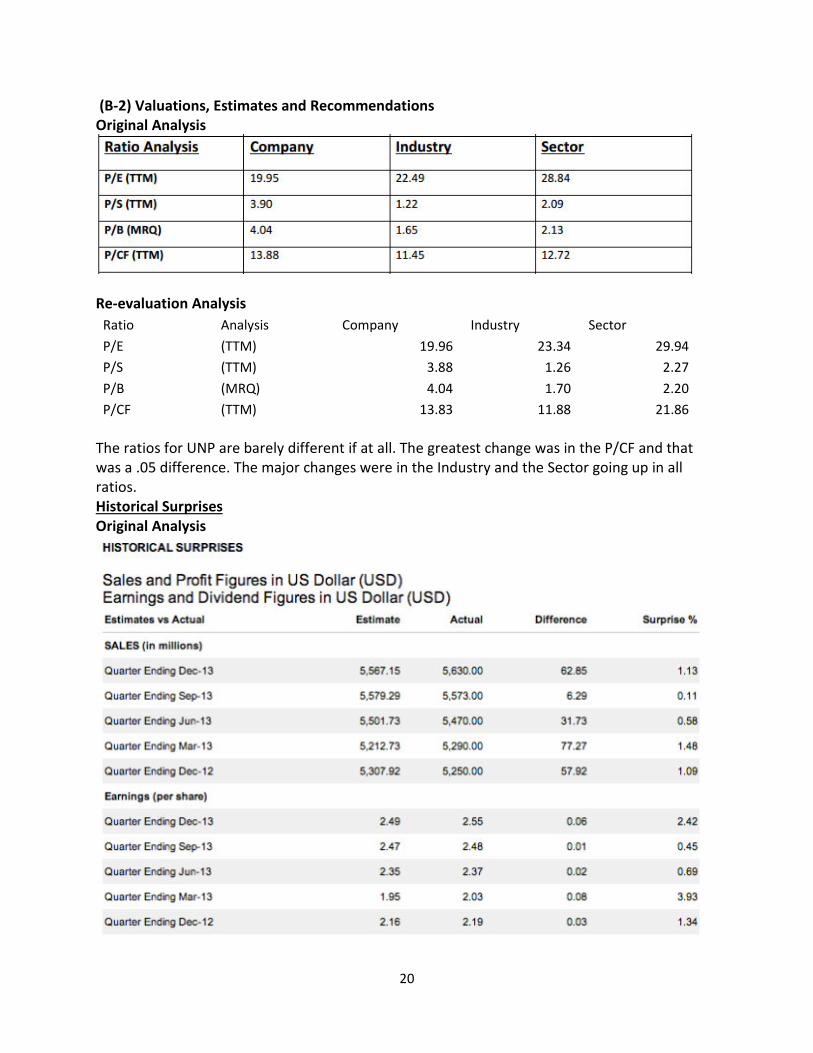
(B-2) Valuations, Estimates and Recommendations
Original Analysis
Ratio Analysis Company Industry Sector
P/E (TTM) 26 17.42 25.53
P/S (TTM) 0.94 0.41 1.95
P/B (MRQ) 2.45 1.08 2.07
P/CF (TTM) 10.34 2.88 10.06
Re-evaluation Analysis
Ratio Analysis Company Industry Sector
P/E (TTM) 25.44 16.79 29.94
12
P/S (TTM) 0.88 0.41 2.27
P/B (MRQ) 2.81 1.56 2.20
P/CF (TTM) 9.58 7.61 13.76
Nearly all of the ratios went down for FDX from the previous report done by Taylor and Ian. The
P/E ratio is down 0.56, P/S is down 0.06, P/B is the only ratio up by 0.36, and P/CF is down by
0.76. The industry has seen an increase in the P/E ratio and P/B, but a huge increase in P/CF.
The sector has increased in P/CF, P/B, and P/S, however the sector has decreased in P/E.
Historical Surprises
13
Original Analysis
Re-evaluation Analysis
As mentioned earlier FDX did not meet the analyst estimates for earnings or revenues. The
largest historical surprise was in the earnings last quarter which was missed by 15.47%.
14
Revenues missed by 1.17% which was the highest revenue miss that FDX has historically had
(looking at 2013-2014). Again this was due to the harsh weather conditions that the entire
country has faced.
Consensus Estimates
Original Analysis:
15
Re-Evaluation Analysis:
The estimates for revenues ending May-14 are all up from the previous review period. The year
ending estimates however have been downgraded both for 2014 and 2015 for revenues. The
earnings estimates have been upgraded for the coming quarter May-14, but also have been
down graded for years ending. The LTG has been downgraded as well.
16
Estimate Revision Analysis
Original Analysis (02/24/2014)
Re-Evaluation Analysis
17
There have been more downgrades for FDX than upgrades since the original report. The last
four weeks in the original report had more downgrades than upgrades, but not nearly as many
as there are currently. The reason for the number of analyst revisions is simply because the
earnings report was release about four weeks ago.
Analysts’ Recommendations
Original Analysis
Re-Evaluation Analysis
18
The current analyst rating is the same rating that was given when Taylor and Ian submitted
their report: 2.10. The only change is there is one additional analyst reporting and he/she has
given FDX a recommended outperform. The consensus from analysts is buy or hold.
(B-3) Technical Indicators
19
We can see that there are two death crosses 10-50 day SMA one in January where analysts had
suspicions from missing revenues and earnings on the February report, and also in the
beginning of April. The 50 to 200 day moving average, we see a death cross in September and a
gold cross in December 2012. The death cross that is on my 10 to 50 day MA has a much
narrower gap than the original report. The 50 to 200 day MA seems to be almost identical.
Stock #2: Union Pacific Corp (UNP)
Date Recommended: 03/28/2014
Date Re-evaluated: 04/07/2014
(B-1) Company Updates and Stock Performance
Company Update
Since the purchase of Union Pacific (UNP) on March 28, there haven’t been any news articles
that have drastically affected the stock price or previous analysis. There hasn’t been an SEC
filing since the original recommendation.
Relative Performance
Since the recent purchase of UNP we have seen a capital gain of 0.85%. Compared to the sector
we recognize a 1.04% difference in gain. Compared to the S&P 500 we recognize a 0.48%
difference in gain. In such a short time period there have been reasonable gains. When looking
at the one year chart we can see that UNP has this year out performed the sector and the S&P
500 over the course of 2014. From October to January 2014 UNP underperformed the sector
and outperformed the S&P.
1-Year Price Chart
20
(B-2) Valuations, Estimates and Recommendations
Original Analysis
Re-evaluation Analysis
Ratio Analysis Company Industry Sector
P/E (TTM) 19.96 23.34 29.94
P/S (TTM) 3.88 1.26 2.27
P/B (MRQ) 4.04 1.70 2.20
P/CF (TTM) 13.83 11.88 21.86
The ratios for UNP are barely different if at all. The greatest change was in the P/CF and that
was a .05 difference. The major changes were in the Industry and the Sector going up in all
ratios.
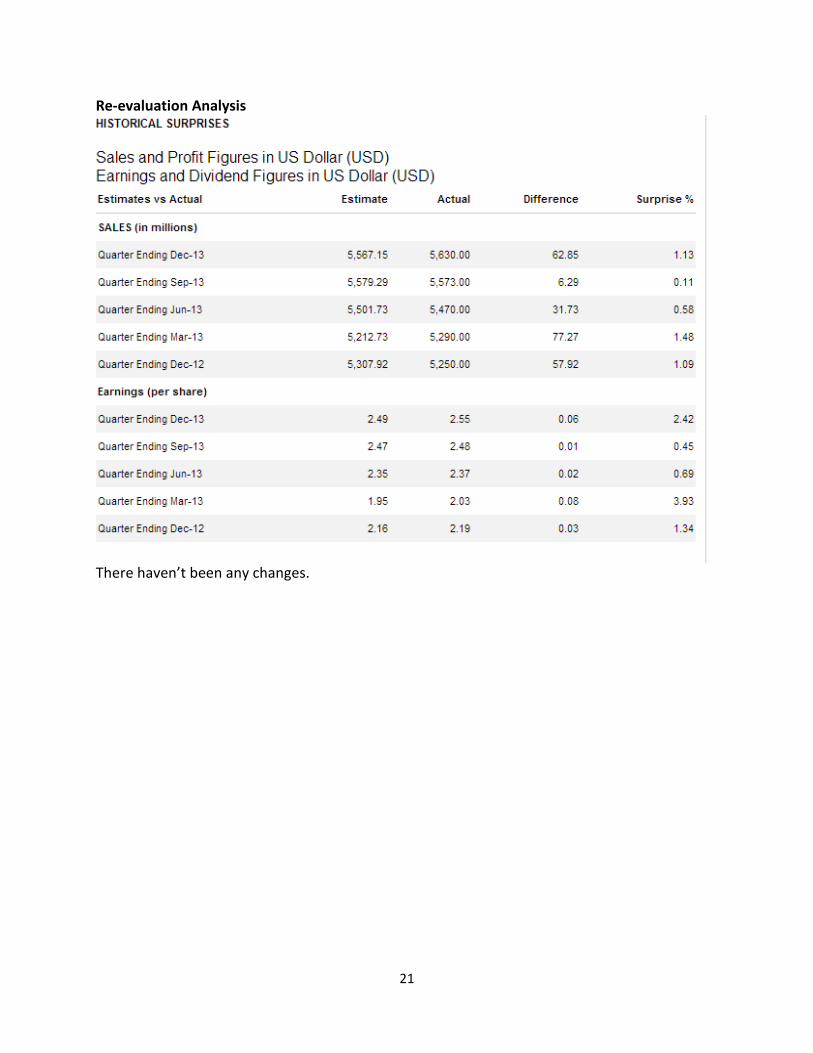
Historical Surprises
Original Analysis
21
Re-evaluation Analysis
There haven’t been any changes.
22
Consensus Estimates
Original Analysis
Re-Evaluation Analysis
The number of estimates has decreased by as many as three analysts. The revenue estimates
have increased during the review period. Earnings have also increased during the review
period, but not as significantly as the revenue estimates.
23
Estimate Revision Analysis
Original Analysis (03/28/2014)
Re-Evaluation Analysis
There have been seven revisions since last week on revenue 5/7 upgraded UNP and 2/7
downgraded revenues. There were 16 revisions this last week 14/16 we upgrades where as
2/16 were down grades. Most of the upgrades were for the year ending estimates. All
downgrades were for the Quarters ending in Jun and September this year.
24
Analysts’ Recommendations
Original Analysis
Re-Evaluation Analysis
There is one significant change since the purchase of UNP: one analyst who recommended a
buy no longer is recommending anything and one analyst who recommended an outperform is
no longer recommending. This raises the mean rating by 0.03, shouldn’t have any affect on the
current price.
25
(B-3) Technical Indicators
10 to 50 Day SMA:
50 to 200 Day SMA:
The 6 month chart seems to have changed slightly. The end of the 10 day line is leveling off
rather than sloping down. There are no new death crosses or golden crosses for the 10 to 50
day SMA. The 50 to 200 day moving average looks almost identical to the original chart. The
26
only difference is that the gap between the 50 day and the 200 day SMA is much wider than
before.
Section (C) Sector Holding Recommendations Based on your sector update research, recommend and provide justifications what CIF should
do for each individual stock it holds in the sector:
I am recommending that we hold our current target prices and stop-loss prices for both FDX
and UNP. UNP has had enough time to have any significant changes since we purchased the
stock on March 28th. FDX has had negative returns since our purchase, but I believe that there is
still time for FDX to turn around. The stock price hasn’t come close to the stop-loss price set by
previous analysts, and they only recently released their first quarter report. The issues that FDX
has faced in this first quarter will not be as severe most importantly the weather. The NY law
suit has only just started and FDX will most likely drag it out as long as possible. Analysts are
very bullish about the second quarter for FDX, and I believe that we should re-evaluate our
position at that time.
Company Name
Ticker
Symbol
Date
Recommended
Date Re-
evaluated
Recommendation
Sell
Adjust
“Target
Price”
Adjust
“Stop-
loss
Price”
FedEx Corporation FDX 02/24/2014 4/7/2014 NO NO NO
Union Pacific Rail UNP 03/28/2014 4/7/2014 NO NO NO
27
Works Cited:
http://finance.yahoo.com/
www.reuters.com
www.sectorspdr.com/sectorspdr
http://www.capitalspectator.com/us-economic-profile-3-19-14/
http://data.bls.gov/timeseries/LNS14000000 (Unemployment Data)
http://www.ism.ws/ismreport/mfgrob.cfm (PMI Data)
http://www.treasury.gov/resource-center/data-chart-center/interest-
rates/Pages/TextView.aspx?data=yield
http://files.shareholder.com/downloads/DNB/3071101328x0x722886/b39c1aa8-5773-4bd8-
bb18-1df3ba241dfd/DNB_News_2014_2_3_General.pdf