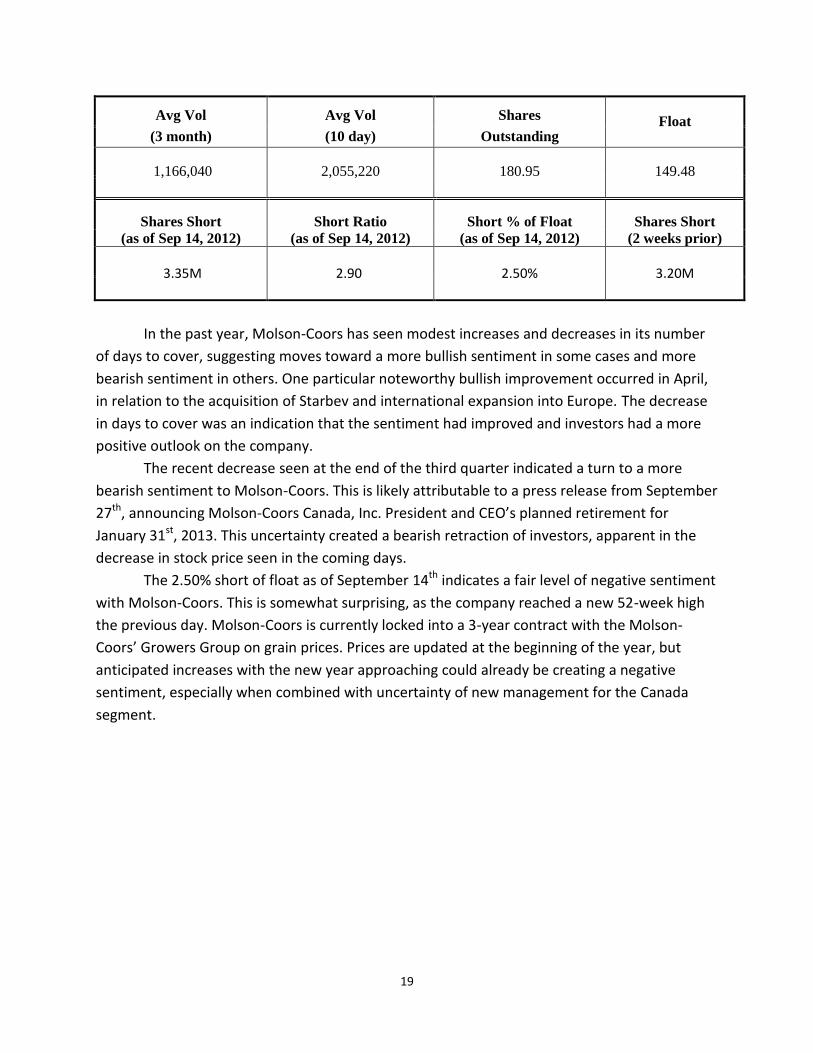
Short Interest Ratio: 2.90 Short as % of Float: 2.50%
Ratio Analysis Company Industry Sector
P/E (TTM) 14.91 174.37 40.59
P/S (TTM) 2.26 12.03 3.63
P/B (MRQ) 1.04 1.62 2.07
P/CF (TTM) 10.57 6.17 22.97
Dividend Yield 2.86 1.47 1.71
Total Debt/Equity (MRQ) 62.74 59.03 23.68
Net Profit Margin (TTM) 15.19 5.00 7.30
ROA (TTM) 3.71 3.42 4.09
ROE (TTM) 6.90 6.94 12.46
2
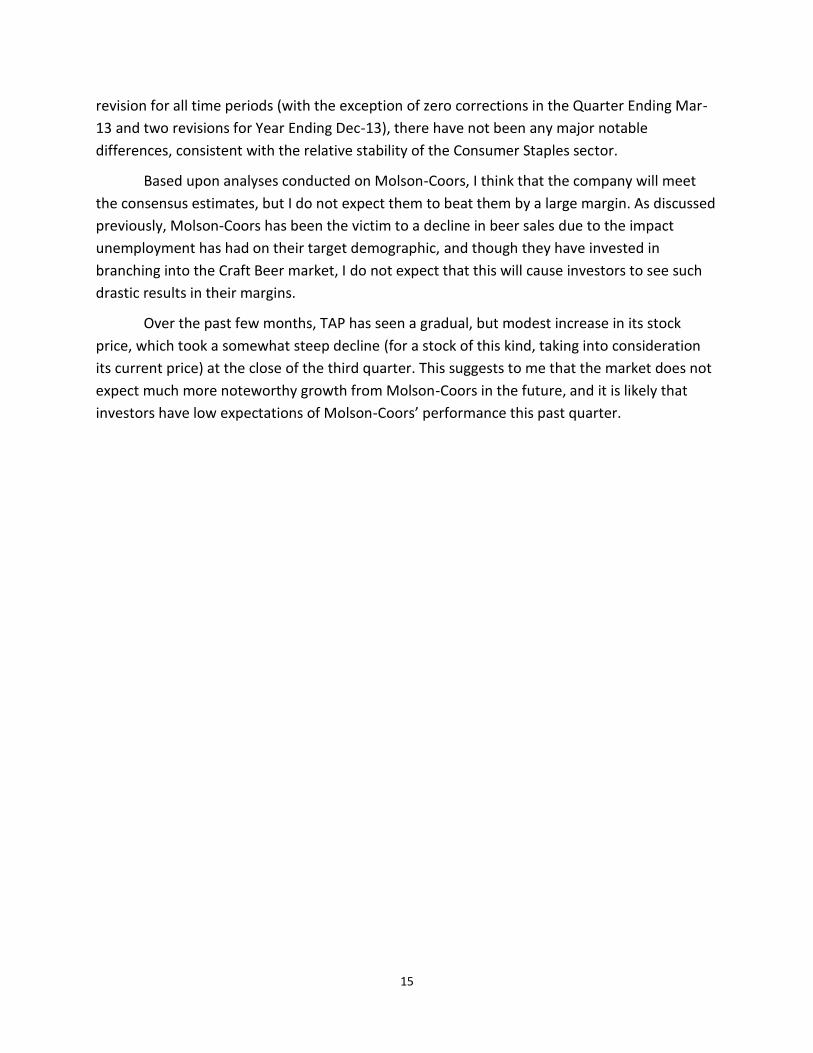
Investment Thesis I propose to hold on buying Molson-Coors stock until earnings statements for the third quarter are released and a new plan for management of the Canada sector is put into place, or if the company announces another international expansion.
Summary Molson-Coors is a brewing company that formed after the acquisition of Molson and Coors in 2005.
Company Profile: Molson-Coors main strategy has involved mergers and acquisitions to obtain economies of scale in a competitive industry that is difficult to enter (at the scale of Molson-Coors and its competitors).
Fundamental Valuation: As Molson-Coors has seen little growth over the last five years, it is assumed that the abnormal growth rate would last 2 years, yielding an implied price of $53.32.
Relative Valuation: The most useful ratios to consider for the XLP are P/E and Dividend Payout. P/E is significantly lower than competitors at 10.88, but Dividend Payout is comparable to competitors at 36.23%.
Revenue and Earnings Estimates: Revenue is estimated to exceed recent years both annually and in the coming quarters. Earnings are estimated to increase overall annually, but decrease quarterly in comparison to same quarter, previous years.
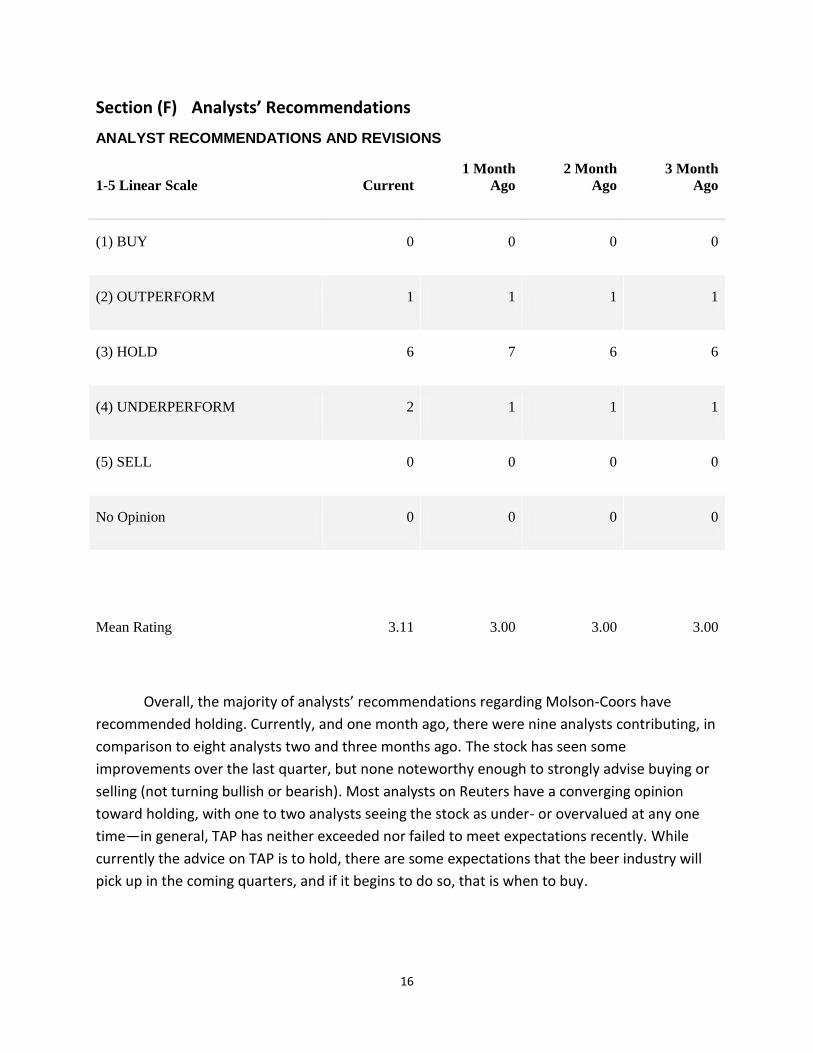
Analyst Recommendations: The majority of analysts recommend a hold on Molson-Coors’ stock at this time.
Institutional Ownership: The company’s institutional owners of >5% make up 18.7% stake in the company.
Short Interest: Short interest relates to events involving the company, with market sentiment becoming more bullish with the expansion into Europe in April 2012, and becoming more bearish with the announcement of the retirement of the President and CEO of the Canada segment within the last two weeks.
Stock Price Chart: Stock price for Molson-Coors has stayed relatively stable over the past five years, characteristic of stocks in the XLP. Overall, it has generally underperformed in comparison to competitors during this time, with a brief exception during the financial crisis.
3
Section (B) Company Profile
Company Summary
Molson-Coors Brewing Company is a brewer made up of the 2005 merger between
Molson, founded in 1786, and Coors, founded in 1873. Some of the brands they employ include
Coors and Coors Light, Molson Canadian, Miller and Miller Light, Keystone, and Blue Moon.
Molson-Coors operates in four segments: the Canada segment (making up approximately 40%
share of the beer market in Canada), the United States segment (making up approximately 29%
of the beer market in the United States), the United Kingdom segment (making up
approximately 19% of the beer market in the United Kingdom), and the Molson-Coors
International (MCI) segment.
A large part of the expansion and growth that has taken place within Molson-Coors
since the 2005 merger has involved similar merger and acquisition type activities. In 2007,
Molson-Coors and SABMiller announced a joint venture that would be known as MillerCoors in
its United States operations. This joint venture allowed Molson-Coors to take advantage of
economies of scale, as they were able to combine assets and therefore take part in more
investment opportunities, as well as a larger portfolio of brands. The larger portfolio provides a
simplified system for distributors to offer to retailers. Other activities of this nature include the
purchase of Sharp’s Brewery in the United Kingdom in 2011 and the acquisition of Starbev in
2012.
Business Model, Competition, Environment and Strategy
As listed on the Molson-Coors website, the company models the business around “a
love of beer, a passion for building extraordinary brands, a dedication to innovation, [and] a
business built on responsible practices.” These four fundamentals outline what is important to
the company, and their culture about how they do business.
The major competition Molson-Coors faces in their direct industry is Anheuser-Busch
Companies, Inc. But outside of the beer industry, there are direct threats from substitute
products from wine manufacturers, distilleries, and general beverage companies like Coca Cola.
The target consumer to the beer industry is young adult men, and with the current
unemployment rate within this demographic remaining high, there has been a decrease in the
demand of beer recently; this has been coupled with an increased demand in substitute
products like hard alcohol and wine from other consumers.
Concerning the environment of Molson-Coors, the competitive rivalry within the
industry is high, and Anheuser-Busch has held approximately 48% of market share in recent
years. The threat of substitute products is high, and consumers have been showing increasing
4
demand for substitutes like wine and hard alcohol. The threat of new entrants is low to
moderate, as it is not entirely difficult for small scale entrepreneurs to enter the beer industry.
But the threat of new entrants at the same scale as Molson-Coors is very low, as these startup
breweries would take many years to establish their brand and gain exposure. The bargaining
power of customers is relatively low; this could be disputed when taking large distributors into
consideration (but their bargaining power would still remain fairly low). The bargaining power
of suppliers is high. Molson-Coors, and companies with similar products, rely on products like
wheat, barley, hops, and aluminum; all of which have had increasing prices in recent years.
Agricultural products like wheat are expected to further increase in the near future due to the
current drought.
As previously discussed, a major strategy employed by Molson-Coors since their merger
in 2005 has been taking advantage of economies of scale through acquisitions, purchases, and
joint ventures. Concerning their “dedication to innovation,” Molson-Coors has demonstrated
their initiative to incorporating innovative changes in their packaging to enhance the
customers’ experience—including their being the first to use a recyclable can and the more
recent cold-activated bottles and cans used for Coors Light products.
Revenue and Earnings History
REVENUE
Periods 2010 2011 2012
March 661.0 690.4 691.4
June 883.3 933.6 999.4
September 875.0 954.4
December 835.1 937.3
Note: Units in Millions of U.S. Dollars
5
EARNINGS PER SHARE
Periods 2010 2011 2012
March 0.3312 0.43773 0.43698
June 1.26894 1.18803 0.57434
September 1.3714 1.04565
December 0.59171 0.94777
Note: Units in U.S. Dollars
Annual revenue for 2010 was $3254.4 (million), and $3515.7 (million) for 2011. For the
first half of 2012, revenue was at $1690.8 (million); $66.8 million ahead of where revenues
stood after the second quarter for 2011. In general, revenues appear to be increasing gradually
each year, with the last three quarters significantly higher than first quarter reports. The second
and third quarters include summer months and the type of weather that directly impacts beer
sales, and the fourth quarter includes the holiday season’s increased demand.
Annual Earnings were $3.56325 for 2010, and $3.61918 in 2011. Though there was an
increase in earnings in 2011, it was quite small. As of right now, earnings for 2012 are at
$1.01132, down by $0.61444 in comparison to this time last year. Similarly to revenues, the last
three quarters (and in particular the second and third quarter) tend to have higher earnings
than the first quarter, but this does not seem to be the case in 2012. As discussed before,
summer months and good weather have an impact on beer sales. Poor weather/shifts in
weather patterns, combined with drought conditions that cause an increase in the price of
wheat this year have appeared to slow down earnings in 2012.