1 Date:03.20.2013 Analyst Name: Justin L. Jaena CIF Stock Recommendation Report (Spring 2013) Company Name and Ticker: Cameron International Corp (CAM) Section (A) Summary Recommendation Buy: Yes No Target Price: Stop-Loss Price: Sector: XLE (Energy) Industry: Oil and Gas Equipment and Services Market Cap (in Billions): 15.738 Billion # of Shrs. O/S (in Millions): 247.85 Million Current Price: 63.96 52 WK Hi: 67.42 52 WK Low: 38.38 EBO Valuation: 39.84 Morningstar (MS) Fair Value Est.: 55 MS FV Uncertainty: Average MS Consider Buying: 38.58 MS Consider Selling: 74.25 EPS (TTM): 44.29 EPS (FY1): 3.88 EPS (FY2): 5.03 MS Star Rating: 2 Stars Next Fiscal Yr. End ”Year”: 2013 “Month”: December Last Fiscal Qtr. End: Less Than 8 WK: Y N If Less Than 8 WK, next Earnings Ann. Date: 04.25.2013 Analyst Consensus Recommendation: 1.74 Forward P/E: 12.72 Mean LT Growth: 20.59% PEG: 0.62 Beta: 1.55 % Inst. Ownership: 97.12% Inst. Ownership- Net Buy: Y N Short Interest Ratio: 1.4 Short as % of Float: 1.6% Ratio Analysis Company Industry Sector P/E (TTM) 21 19.43 12.44 P/S (TTM) 1.85 1.72 2.92 P/B (MRQ) 2.81 2.49 10.71 P/CF (TTM) 15.66 8.26 8.50 Dividend Yield 0 2.02 2.52 Total Debt/Equity (MRQ) 37.30 45.32 13.95 Net Profit Margin (TTM) 8.83 9.26 10.34 ROA (TTM) 7.31 6.05 3.53 ROE (TTM) 14.61 12.56 5.56
Transcript
1
Date:03.20.2013
Analyst Name: Justin L. Jaena
CIF Stock Recommendation Report (Spring 2013)
Company Name and Ticker: Cameron International Corp (CAM)
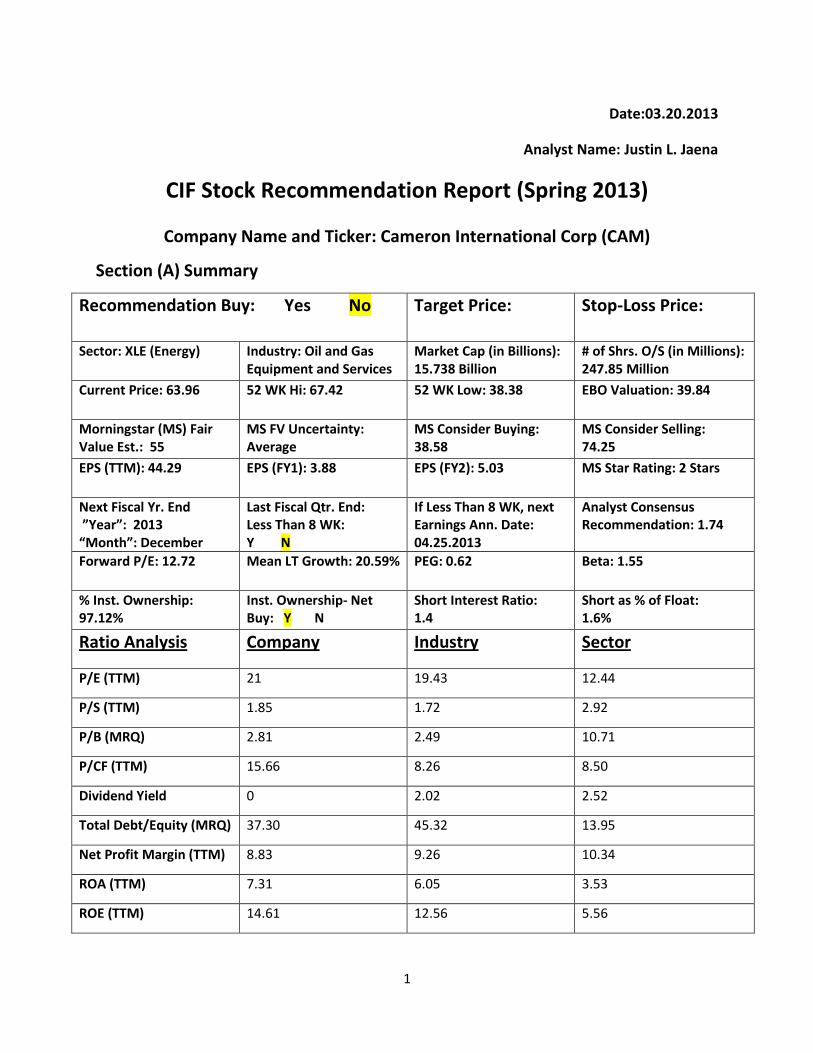
Section (A) Summary
Recommendation Buy: Yes No Target Price: Stop-Loss Price:
Sector: XLE (Energy) Industry: Oil and Gas Equipment and Services
Market Cap (in Billions): 15.738 Billion
# of Shrs. O/S (in Millions): 247.85 Million
Current Price: 63.96 52 WK Hi: 67.42
52 WK Low: 38.38 EBO Valuation: 39.84
Morningstar (MS) Fair Value Est.: 55
MS FV Uncertainty: Average
MS Consider Buying: 38.58
MS Consider Selling: 74.25
EPS (TTM): 44.29 EPS (FY1): 3.88 EPS (FY2): 5.03 MS Star Rating: 2 Stars
Next Fiscal Yr. End ”Year”: 2013 “Month”: December
Last Fiscal Qtr. End: Less Than 8 WK: Y N
If Less Than 8 WK, next Earnings Ann. Date: 04.25.2013
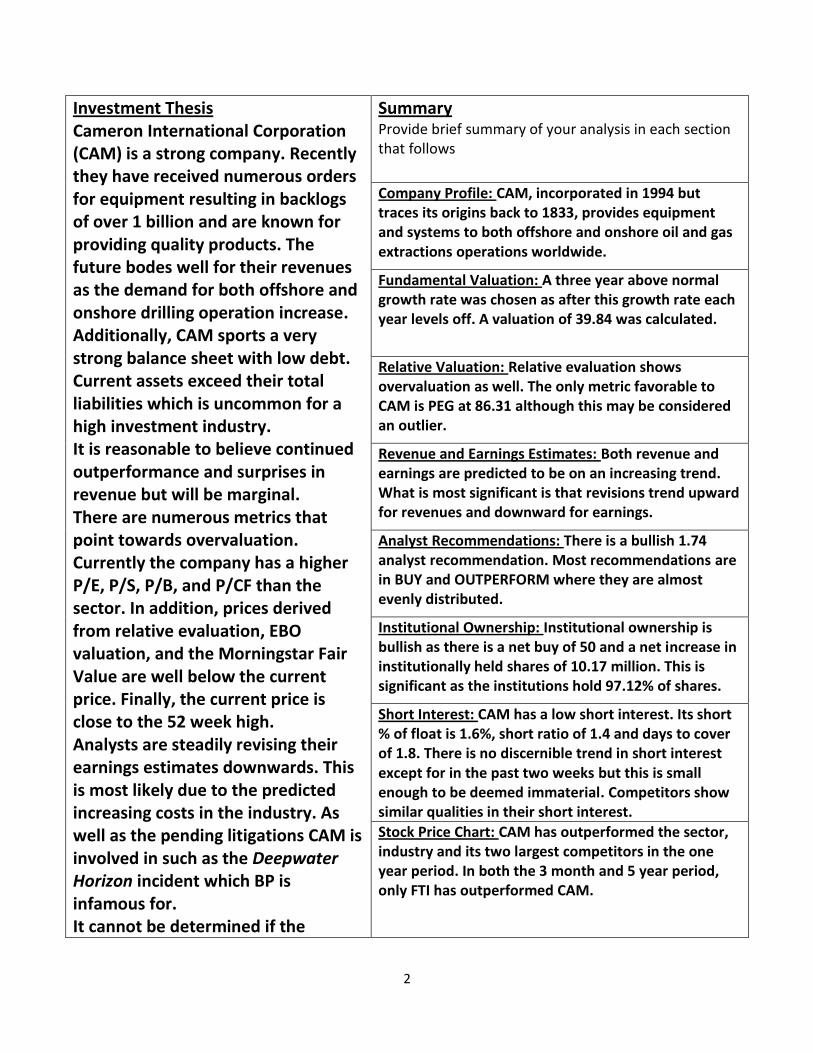
Investment Thesis Cameron International Corporation (CAM) is a strong company. Recently they have received numerous orders for equipment resulting in backlogs of over 1 billion and are known for providing quality products. The future bodes well for their revenues as the demand for both offshore and onshore drilling operation increase. Additionally, CAM sports a very strong balance sheet with low debt. Current assets exceed their total liabilities which is uncommon for a high investment industry. It is reasonable to believe continued outperformance and surprises in revenue but will be marginal. There are numerous metrics that point towards overvaluation. Currently the company has a higher P/E, P/S, P/B, and P/CF than the sector. In addition, prices derived from relative evaluation, EBO valuation, and the Morningstar Fair Value are well below the current price. Finally, the current price is close to the 52 week high. Analysts are steadily revising their earnings estimates downwards. This is most likely due to the predicted increasing costs in the industry. As well as the pending litigations CAM is involved in such as the Deepwater Horizon incident which BP is infamous for. It cannot be determined if the
Summary Provide brief summary of your analysis in each section that follows
Company Profile: CAM, incorporated in 1994 but traces its origins back to 1833, provides equipment and systems to both offshore and onshore oil and gas extractions operations worldwide.
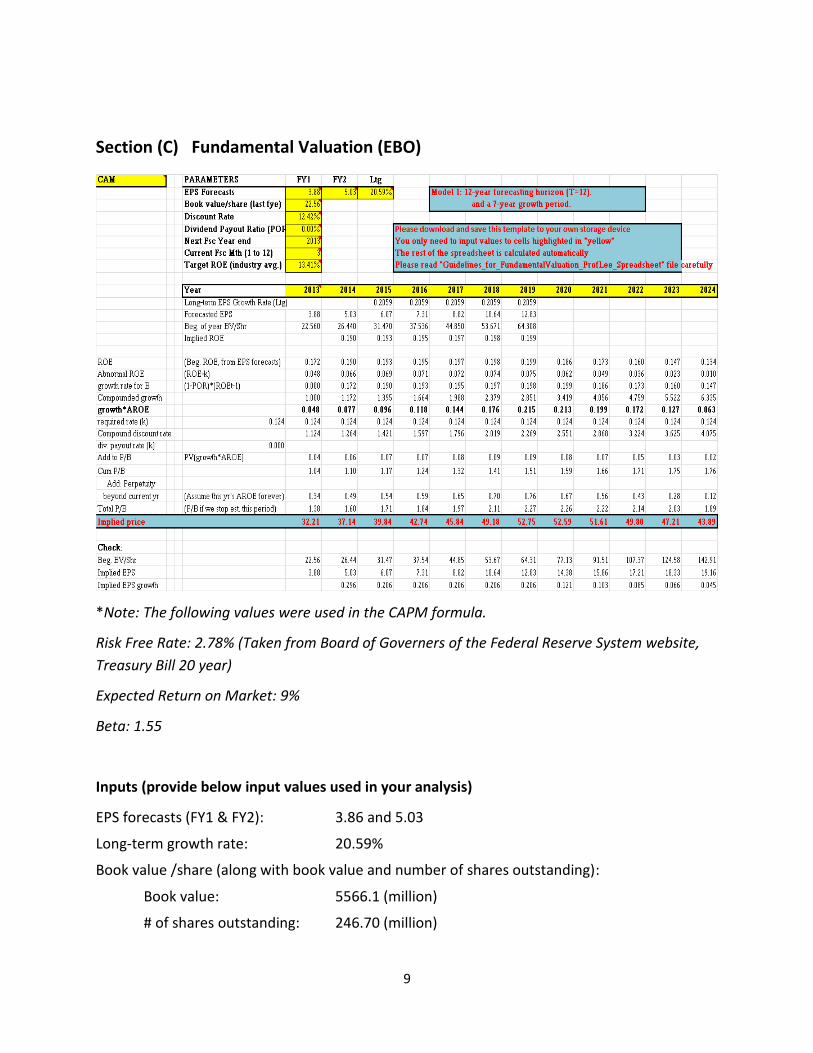
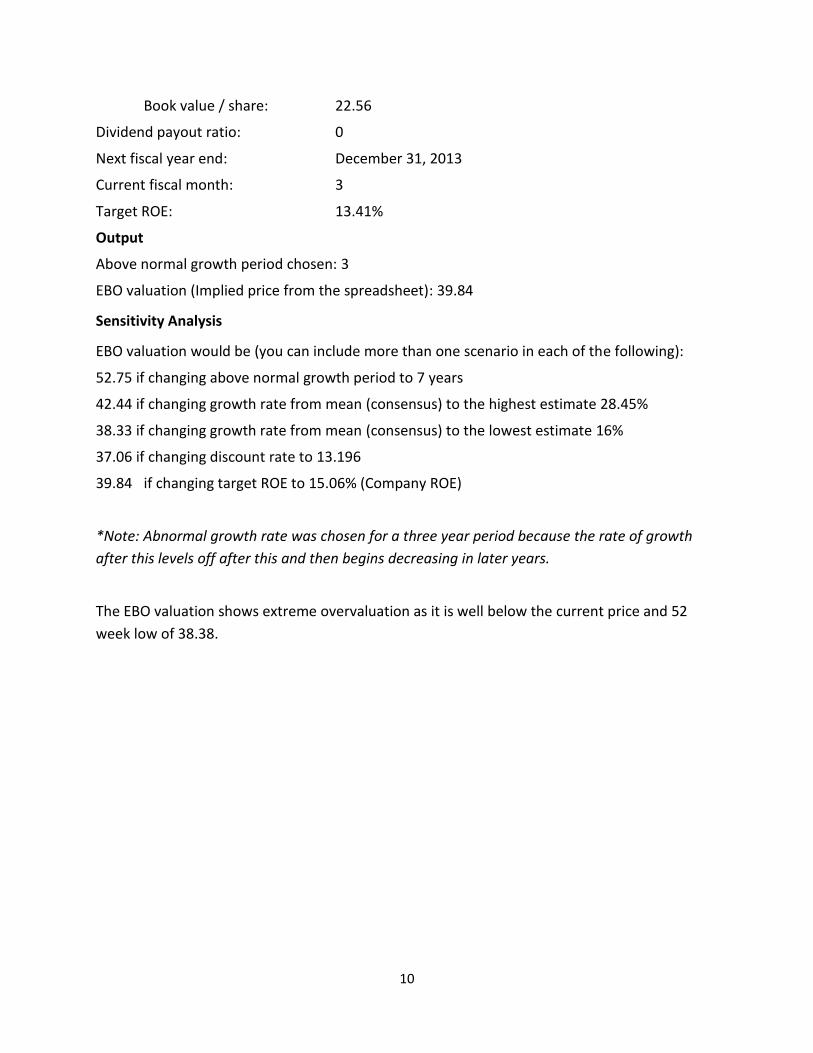
Fundamental Valuation: A three year above normal growth rate was chosen as after this growth rate each year levels off. A valuation of 39.84 was calculated.
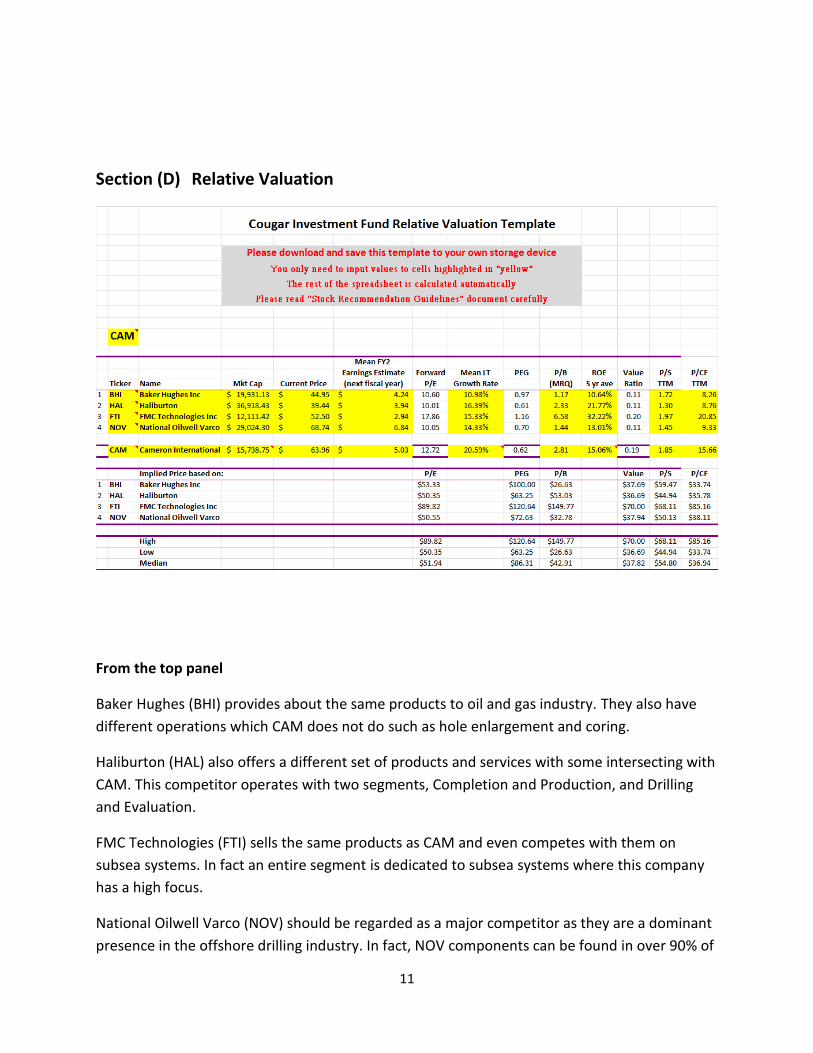
Relative Valuation: Relative evaluation shows overvaluation as well. The only metric favorable to CAM is PEG at 86.31 although this may be considered an outlier.
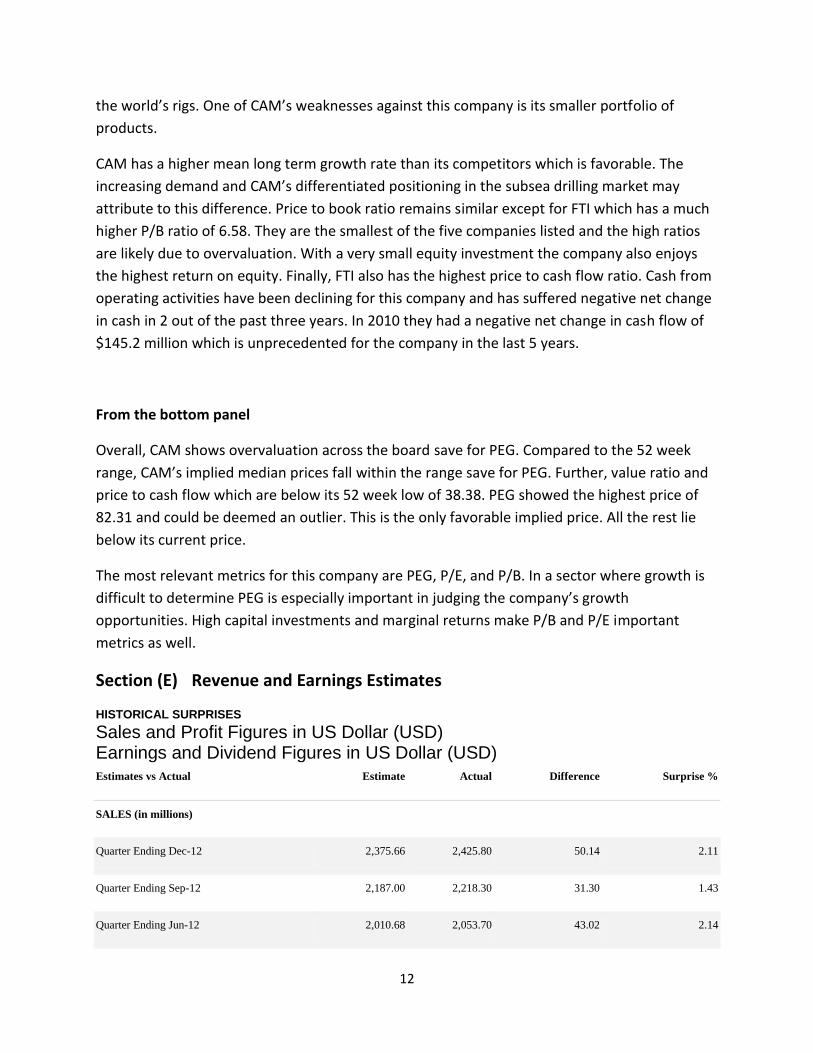
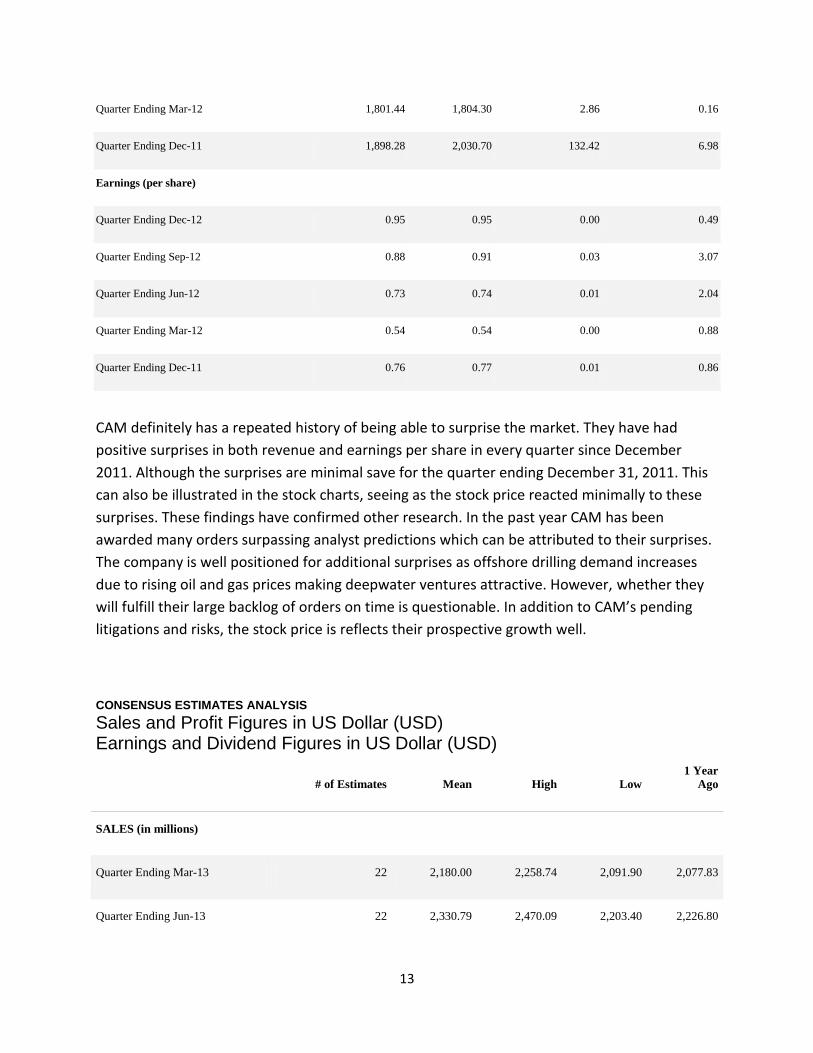
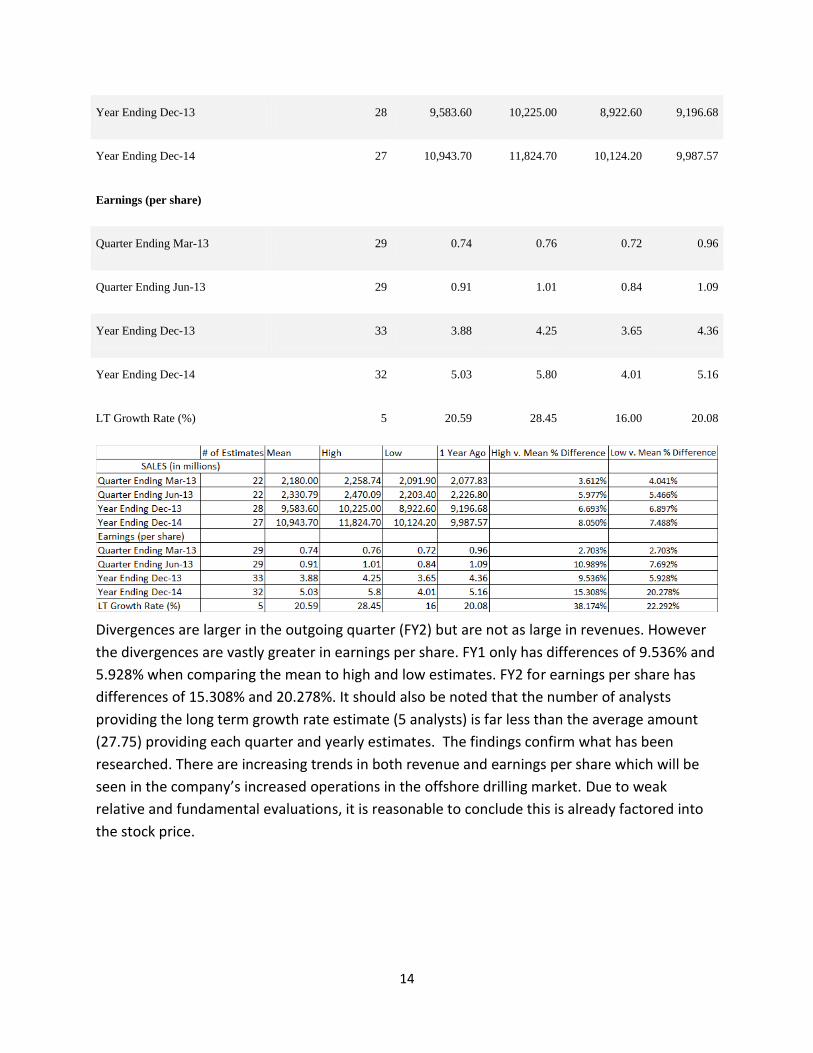
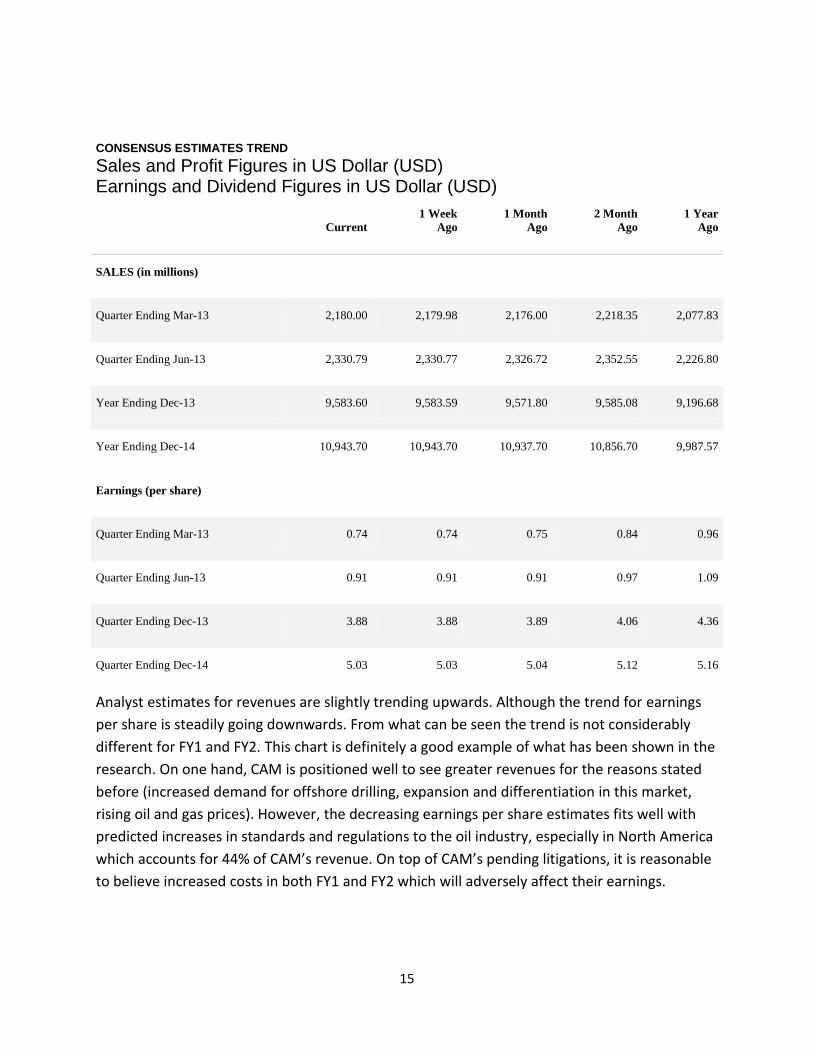
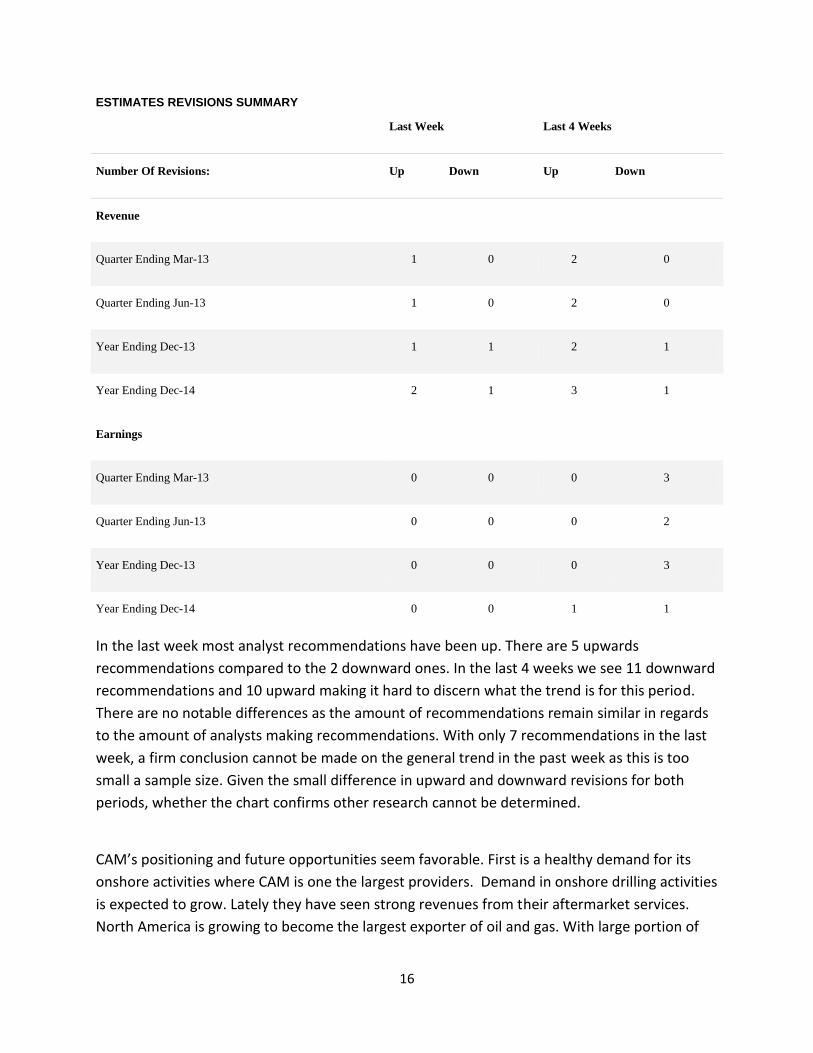
Revenue and Earnings Estimates: Both revenue and earnings are predicted to be on an increasing trend. What is most significant is that revisions trend upward for revenues and downward for earnings.
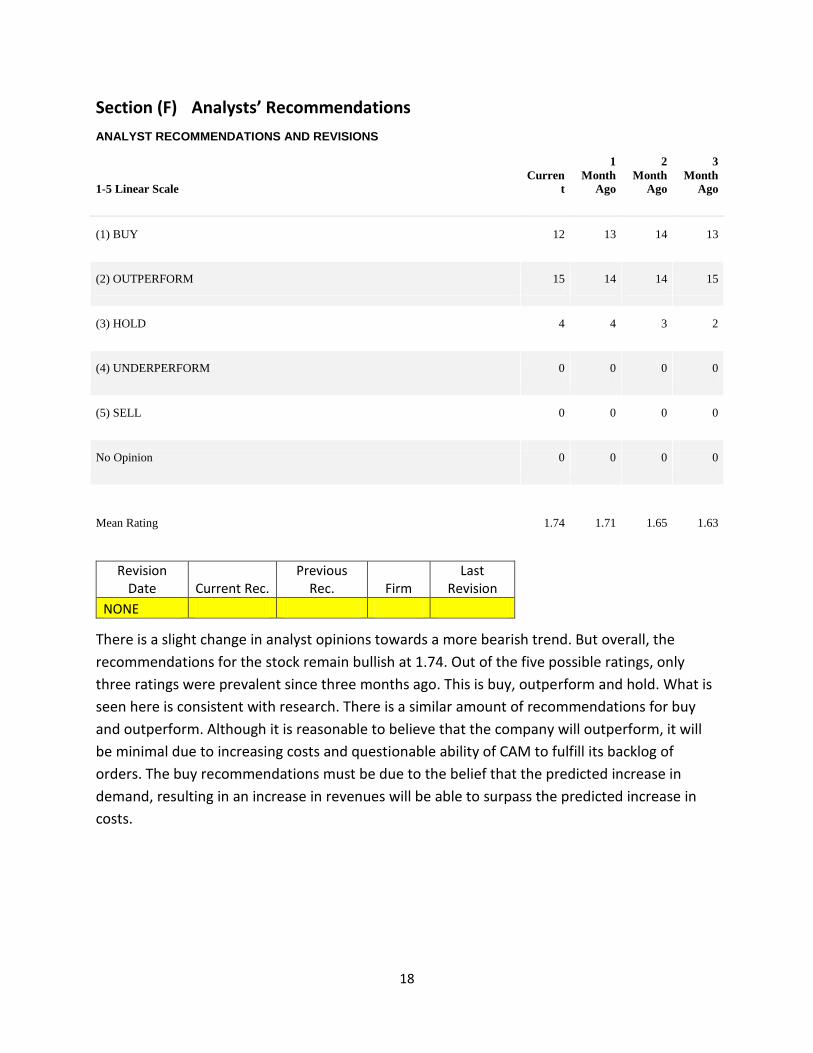
Analyst Recommendations: There is a bullish 1.74 analyst recommendation. Most recommendations are in BUY and OUTPERFORM where they are almost evenly distributed.
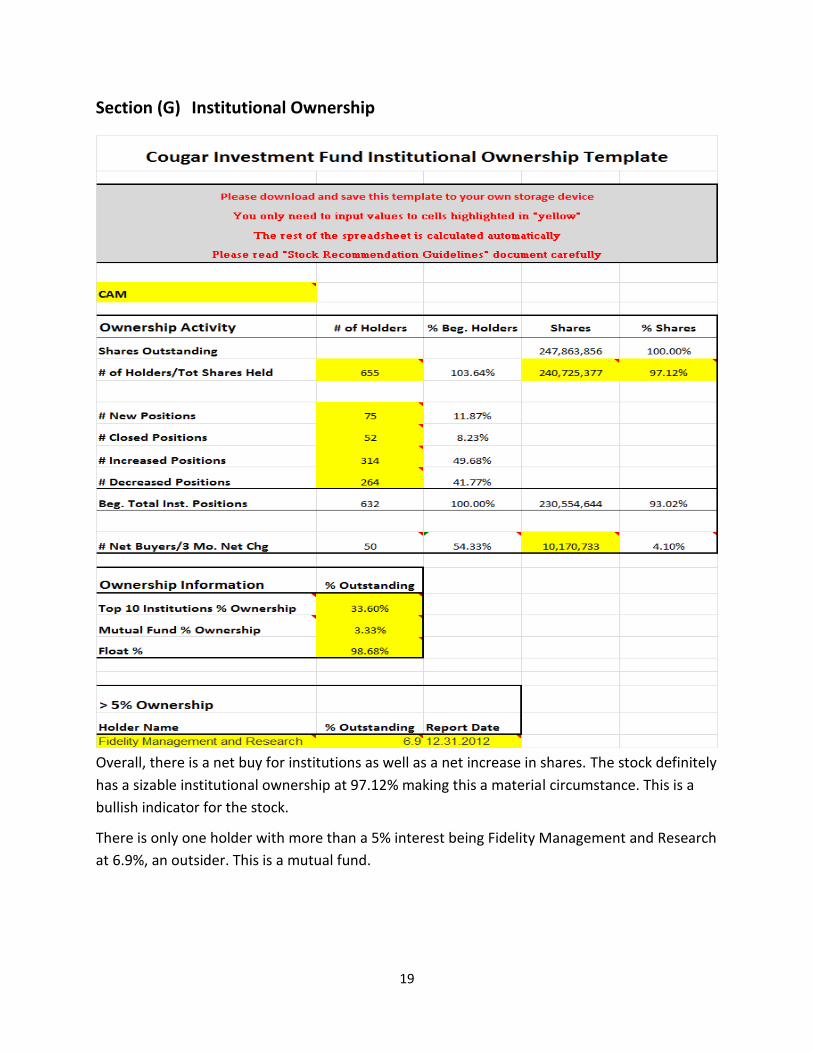
Institutional Ownership: Institutional ownership is bullish as there is a net buy of 50 and a net increase in institutionally held shares of 10.17 million. This is significant as the institutions hold 97.12% of shares.
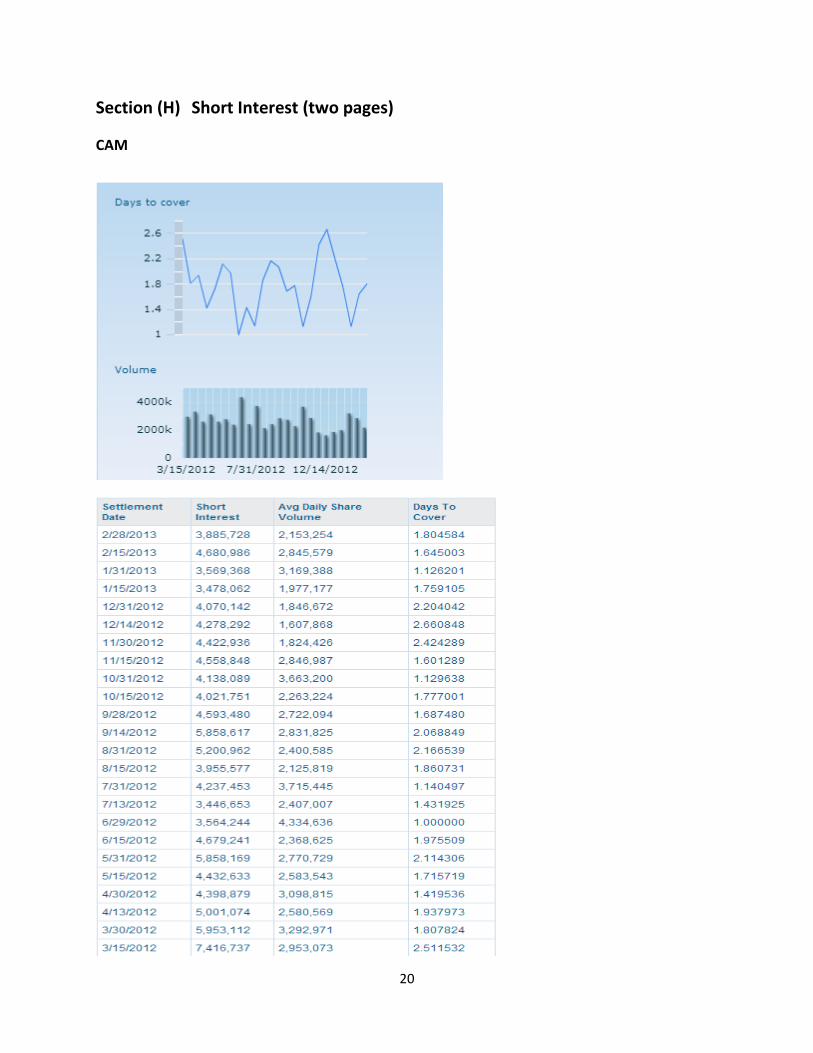
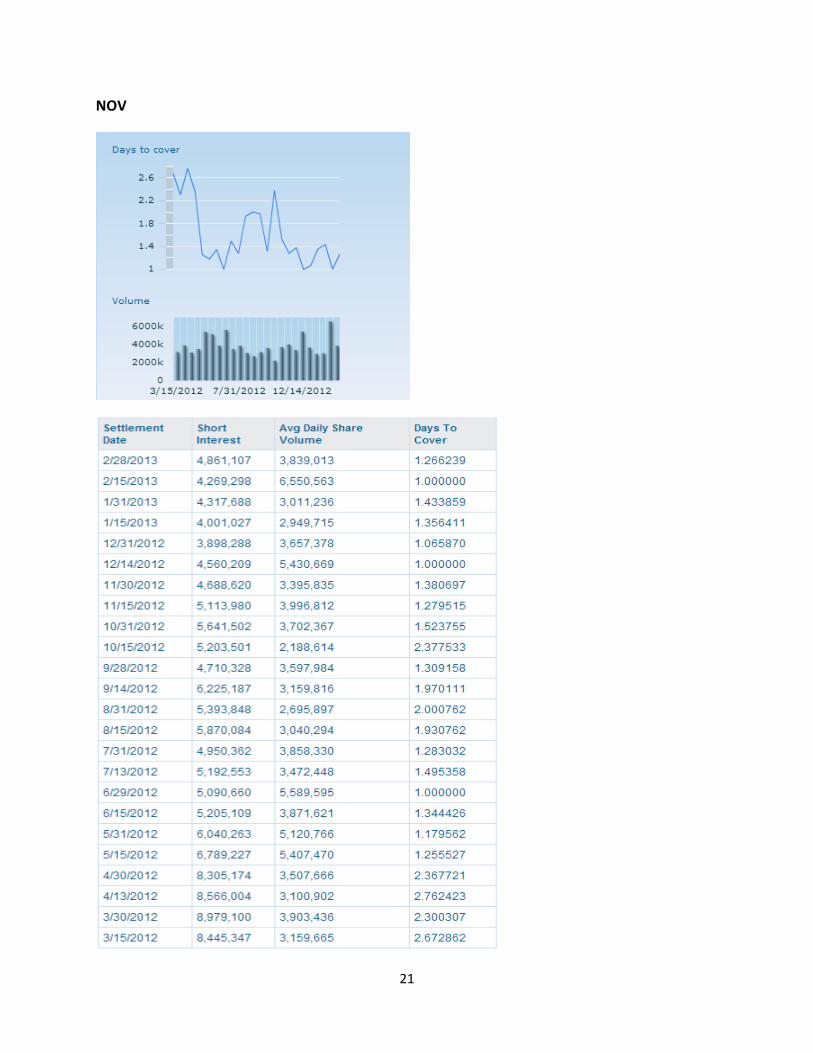
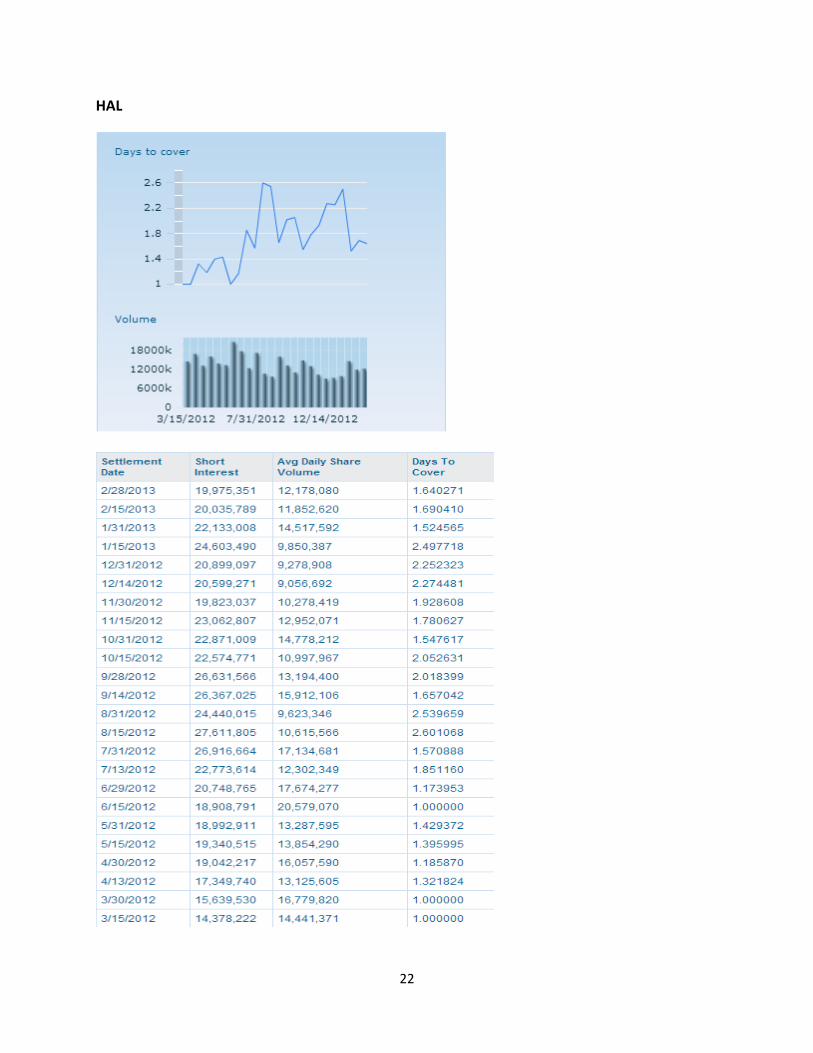
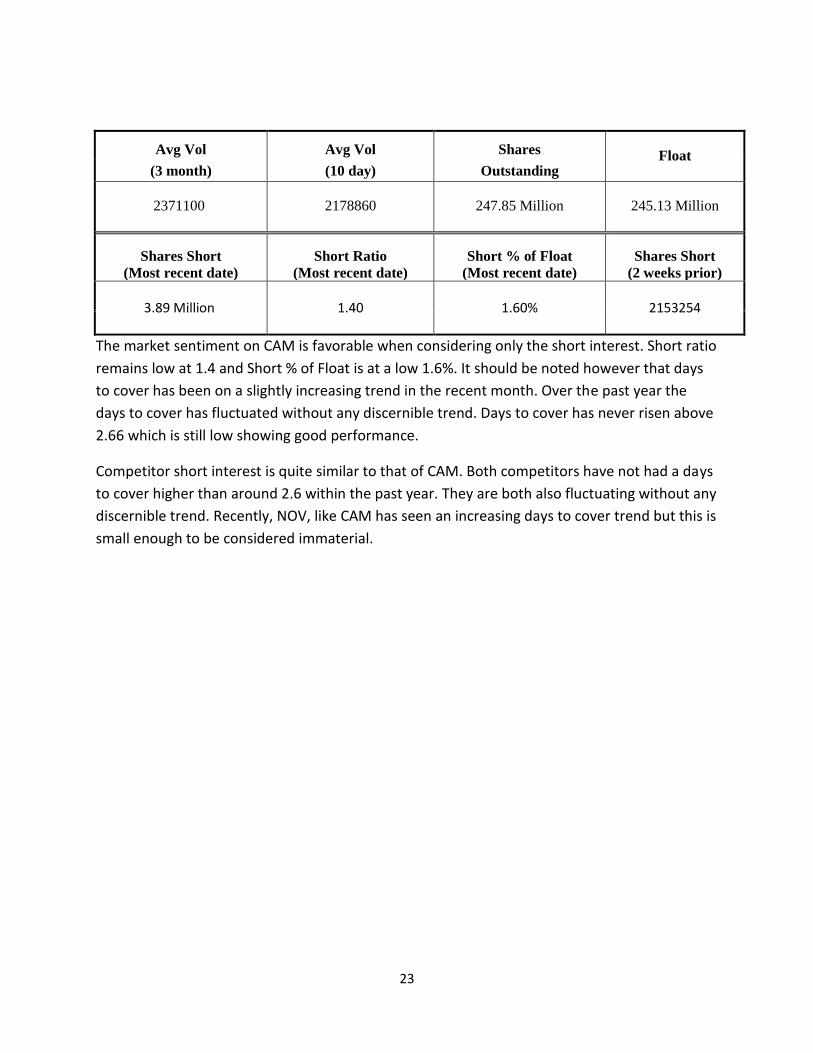
Short Interest: CAM has a low short interest. Its short % of float is 1.6%, short ratio of 1.4 and days to cover of 1.8. There is no discernible trend in short interest except for in the past two weeks but this is small enough to be deemed immaterial. Competitors show similar qualities in their short interest.
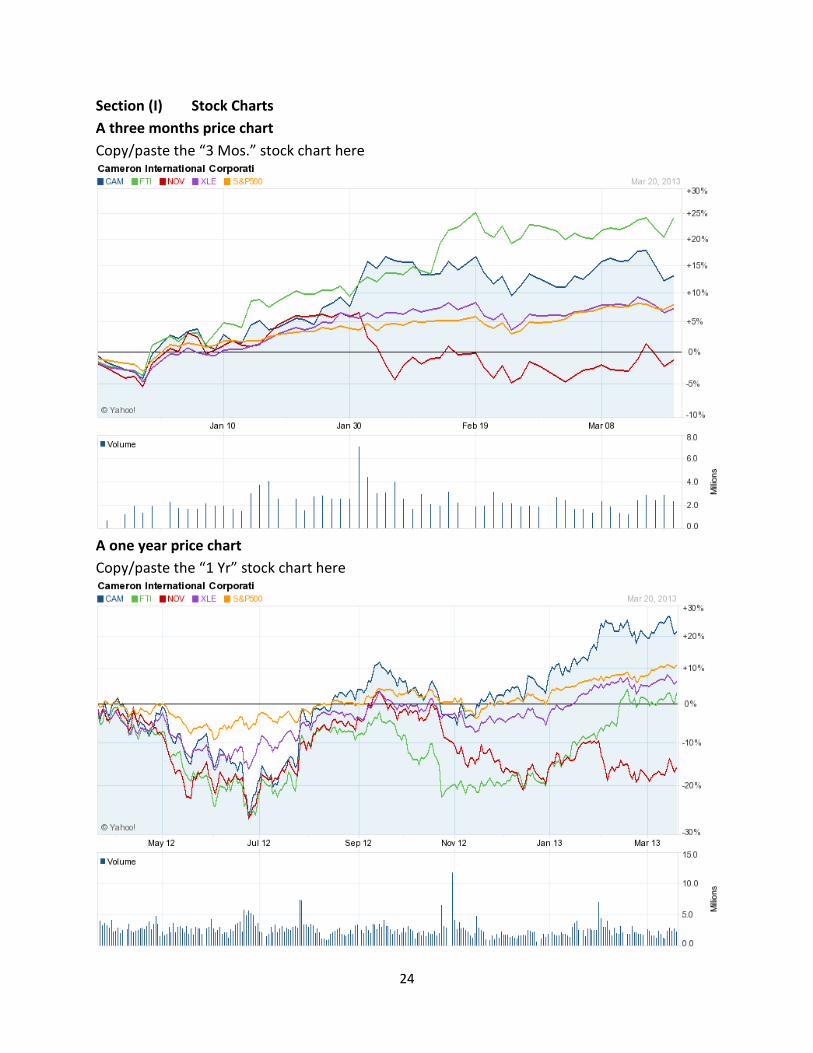
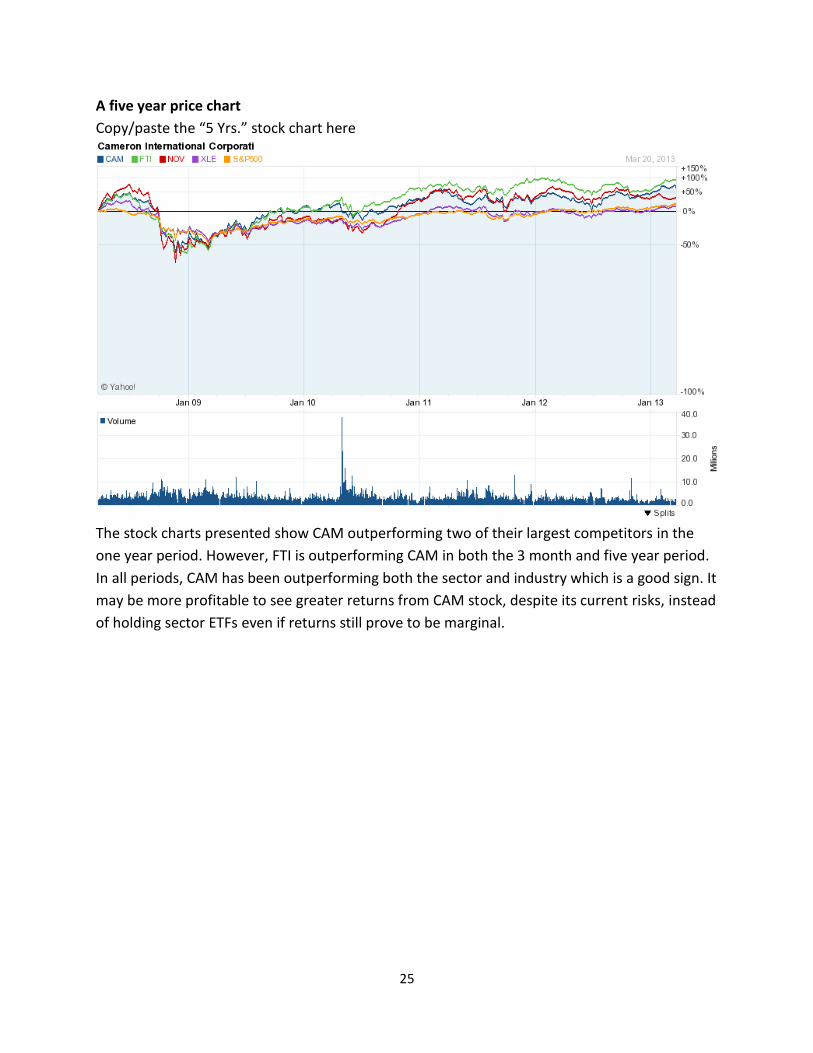
Stock Price Chart: CAM has outperformed the sector, industry and its two largest competitors in the one year period. In both the 3 month and 5 year period, only FTI has outperformed CAM.
3
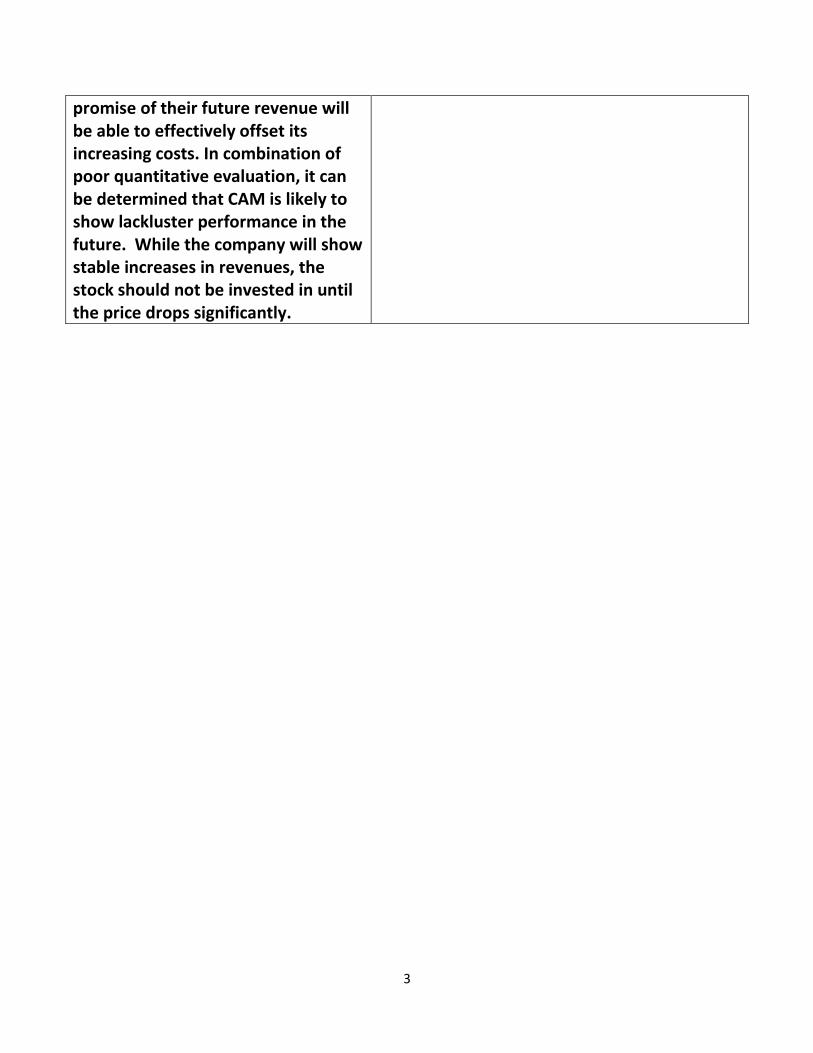
promise of their future revenue will be able to effectively offset its increasing costs. In combination of poor quantitative evaluation, it can be determined that CAM is likely to show lackluster performance in the future. While the company will show stable increases in revenues, the stock should not be invested in until the price drops significantly.
4
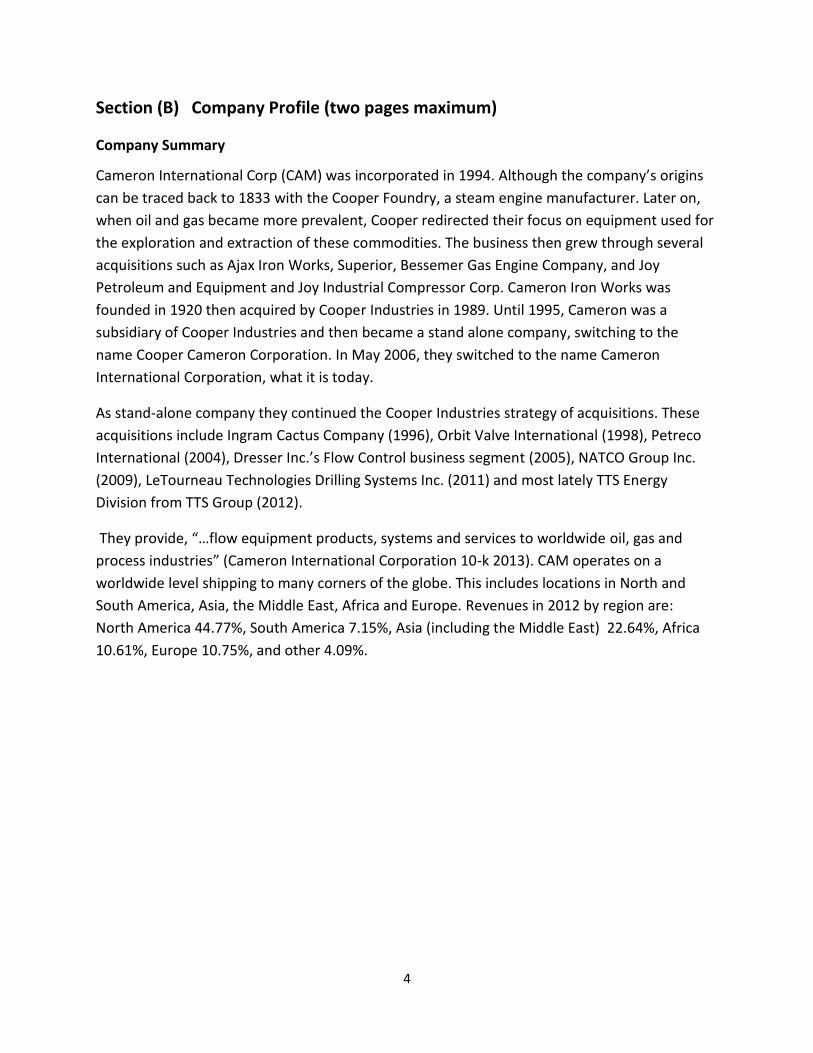
Section (B) Company Profile (two pages maximum)
Company Summary
Cameron International Corp (CAM) was incorporated in 1994. Although the company’s origins
can be traced back to 1833 with the Cooper Foundry, a steam engine manufacturer. Later on,
when oil and gas became more prevalent, Cooper redirected their focus on equipment used for
the exploration and extraction of these commodities. The business then grew through several
acquisitions such as Ajax Iron Works, Superior, Bessemer Gas Engine Company, and Joy
Petroleum and Equipment and Joy Industrial Compressor Corp. Cameron Iron Works was
founded in 1920 then acquired by Cooper Industries in 1989. Until 1995, Cameron was a
subsidiary of Cooper Industries and then became a stand alone company, switching to the
name Cooper Cameron Corporation. In May 2006, they switched to the name Cameron
International Corporation, what it is today.
As stand-alone company they continued the Cooper Industries strategy of acquisitions. These
acquisitions include Ingram Cactus Company (1996), Orbit Valve International (1998), Petreco
International (2004), Dresser Inc.’s Flow Control business segment (2005), NATCO Group Inc.
(2009), LeTourneau Technologies Drilling Systems Inc. (2011) and most lately TTS Energy
Division from TTS Group (2012).
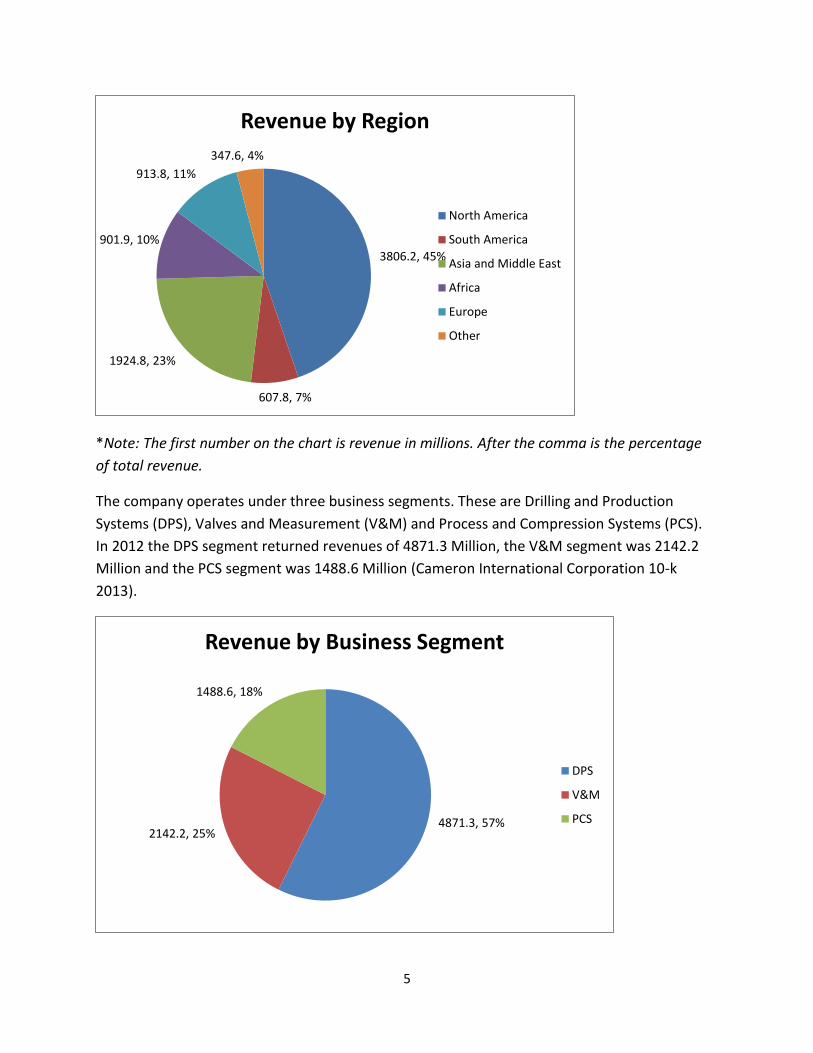
They provide, “…flow equipment products, systems and services to worldwide oil, gas and
process industries” (Cameron International Corporation 10-k 2013). CAM operates on a
worldwide level shipping to many corners of the globe. This includes locations in North and
South America, Asia, the Middle East, Africa and Europe. Revenues in 2012 by region are:
North America 44.77%, South America 7.15%, Asia (including the Middle East) 22.64%, Africa
10.61%, Europe 10.75%, and other 4.09%.
5
*Note: The first number on the chart is revenue in millions. After the comma is the percentage
of total revenue.
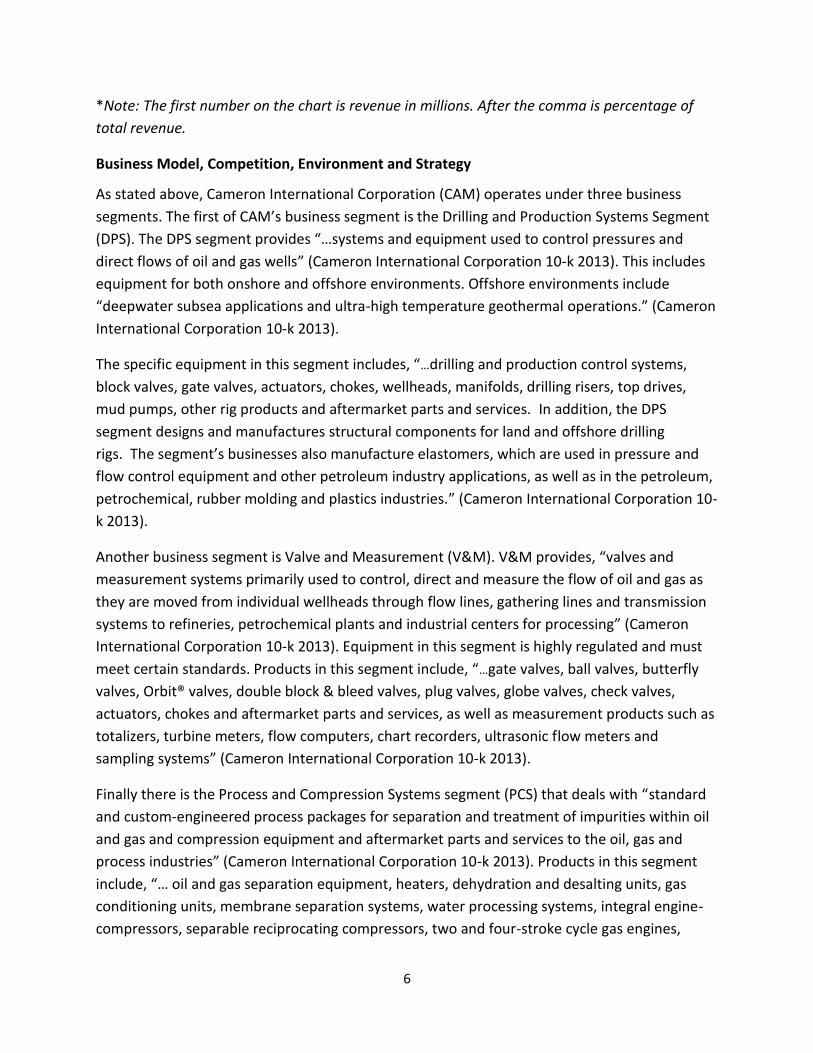
The company operates under three business segments. These are Drilling and Production
Systems (DPS), Valves and Measurement (V&M) and Process and Compression Systems (PCS).
In 2012 the DPS segment returned revenues of 4871.3 Million, the V&M segment was 2142.2
Million and the PCS segment was 1488.6 Million (Cameron International Corporation 10-k
2013).
3806.2, 45%
607.8, 7%
1924.8, 23%
901.9, 10%
913.8, 11%
347.6, 4%
Revenue by Region
North America
South America
Asia and Middle East
Africa
Europe
Other
4871.3, 57% 2142.2, 25%
1488.6, 18%
Revenue by Business Segment
DPS
V&M
PCS
6
*Note: The first number on the chart is revenue in millions. After the comma is percentage of
total revenue.
Business Model, Competition, Environment and Strategy
As stated above, Cameron International Corporation (CAM) operates under three business
segments. The first of CAM’s business segment is the Drilling and Production Systems Segment
(DPS). The DPS segment provides “…systems and equipment used to control pressures and
direct flows of oil and gas wells” (Cameron International Corporation 10-k 2013). This includes
equipment for both onshore and offshore environments. Offshore environments include
“deepwater subsea applications and ultra-high temperature geothermal operations.” (Cameron
International Corporation 10-k 2013).
The specific equipment in this segment includes, “…drilling and production control systems,