27
1 CII NATIONAL AWARD FOR EXCELLENCE IN ENERGY MANAGEMENT 2017 TCS-SYNERGY PARK, HYDERABAD
| Date post: | 18-May-2018 |
| Category: |
Documents |
| Upload: | vuonghuong |
| View: | 217 times |
| Download: | 1 times |

1
CII NATIONAL AWARD FOR EXCELLENCE IN ENERGY MANAGEMENT 2017 TCS-SYNERGY PARK, HYDERABAD

2
Tata Consultancy Services
• India’s largest IT Company , leader in the global marketplace and amongthe top 10 technology firms in the world.
• Over 3,87,000 Associates , 130 nationalities across 55 countries.
• First Company in the world to receive an integrated Enterprise wideCMMI Level 5 and PCMM Level 5 assessment.
• TCS Integrated Quality Management System (iQMS) is a vibrant,integrated, process-driven, people-oriented and customer-focusedquality management system. It is an integrated approach towardsimplementing quality practices of world-class benchmarking models,including ISO 9001, CMMI® for Development, CMMI® for Services, ISO27001, ISO 22301, ISO 20000, TL 9000, AS 9100, ISO 13485, ISO 14001and OHSAS 18001.

3
Synergy park
Phase I having 3 buildings, with spread over of 31,945Sqm built-up area.
• Mini lake designed in the low lying areas of the site,harvested rain water used in the water cooled chillersand for irrigation as well.
• The floor plates of the structures comprise primarily alinear work space, the longer side oriented in the northsouth direction. Service and meeting spaces areplanned along the length on the southern side, in a wayacting as a heat buffer.
• Have installed 104 Energy meters to track area wiseand feeder wise power consumption.
• Zero Discharge Facility.• Recycling of Organic waste at campus.

4
Roadmap –2013-14 to2018-19 & where we stand Today?
Roadmap –2013-14 to2017-18 & where we stand Today
277
234
208
151.6
101.6
0
50
100
150
200
250
300
2013-14 2014-15 2015-16 2016-17 2017-18
KW
H.S
QM
YEAR
kWh/Sqm/Annum
Today, we stand at-178.16kwh/sqm/annum
BEE Bench Mark- :
< 140 kWh/Sqm/Annum
(Three Star-Rating)

5
Reduction in Specific Energy Consumption
0
50
100
150
200
250
300
2014-15 2015-16 2016-17
297.56256.69
217.61
kWh
/Sq
m
Year
EPI-Total Building Including Data center
0
50
100
150
200
250
2014-15 2015-16 2016-17
234.2
208.3178.16
kW
h/S
qm
Year
EPI-Building Without Data Center
1.6
1.7
1.8
1.9
2
2.1
2.2
2013-14 2014-15 2015-16 2016-17
2.2
1.94
1.86 1.84
Data Center -PUE
Global Benchmark-Apple-75
0
20
40
60
80
100
120
140
160
180
TCS Garimapark
TCS Sahyadri
TCS Pepul Park
TCS Synergy
Park
101.7113.45 114.47
178.16
kW
h/S
qm
National and Global Benchmarking

6
Low cost Energy Savings Projects
• Optimization of chiller operation with reference to climatic conditions aswell as occupancy.
• Thermography of all equipment/switch boards and rectification duringannual power shutdown.
• External lights are controlled by Photo electric sensor based switch.• Water coolers been switched off after office hours.• Maximum demand is reduced from 2600 kva to 2000 kva.• Power quality analysis and implementation of remedial actions.• Energy Audit conducted for the facility.

7
Treatment of STP through Natural and Safe , Non pathogen micro organisms which can degrade
Organic waste quickly and effectively.
GenerationPoints of
Sewage
GenerationPoints of
Sewage
Collection of Sewage –
Screening Stage
STP Product
Aeration and
Settling
Final Treated Water Tank
Air Diffusers
- Ecofriendly technology
- Harmless to environment
- No harsh chemicals and toxic fumes
- Savings in Electricity Consumption
- Treated water is used for Landscaping /Flushing
Project: Biological Sewage Treatment Process
Power Savings, 2280 kWh/Month

8
Ambient Comfort Feedback System by Associates
• Introduced AmbientComfort tool in allSystems(Desktop/Laptop/Mobile), Associates cangive the feedback onlighting and Cooling atany given moment.

TCS Resource Operation-SP Location
Implementation of automatic chemical dosing system for Condenser
Technology:- Automated chemical dosing happensbased on the water parameters. It maintains thewater quality and prevent the scale in thecondenser which in turn improves efficiency.
Advantages:- Decrease the condenser descalingfrequency, Improve the chiller heat exchangerefficiency.
Investment: 4,20,000 INR
Energy Savings (kWh)/Annum: 33000

10
UPS OPTIMISATION
Energy Conservation Projects
Revamping of kitchen exhaust system (37.5 KW Motor, belt driven fan replaced with 4 no of 4 KW, plug fans)
- Annual Energy Savings : 37,842 kWh- Total Project cost : 15,00000 INR
Savings due to running DX units from evening 8.00 PMto morning 8.00 AM for 24 X 7 projects instead ofWater cooled chillers
- Annual energy savings : 3,18,408 kWh- Total Project Cost : 30,00000 INR
Application of Heat Reflective Roof Coating at Terrace at SP1- Annual energy Savings : 49,393 kWh- Total Project Cost : 10,000,000 INR

11
VFD Installation for STP blowers- Annual energy savings : 12,925 kWh- Total Project Cost : 1,50,000 INR
Conversion of Lightings to LEDs: - Annual Energy Savings : 5,28,891 kWh- Total Project cost : 49,50,000 INR
UPS Optimization at Facility- Annual energy Savings : 3,21,090 kWh- Total Project Cost : 17,90,000 INR
Energy Conservation Projects

12
UPS OPTIMISATION
Energy Conservation Projects
Building UPS /Desktop Power Management :- Desktop Power Management- Use of Energy Efficient Desktops- Annual energy savings : 81,719 kWh- Total Project Cost : Nil
Improvements to HVAC System and operational controls based on ambient and Occupancy:
- Annual energy Savings : 3,10,338 kWh- Total Project Cost : Nil
Datacenter Server Consolidation/PUE :- Annual energy savings : 3,06,047 kWh- Total Project Cost : Nil

13
Energy Expenditure, Savings and Investment-Million INR
0
10
20
30
40
50
60
70
80
90
100
FY 13-14 FY 14-15 FY 15-16 FY 16-17
83.5869.29
57.61 52.31
014.29
25.97 31.27
13.77.39 1.72 1.22
Energy Expenditure Energy Savings in Milliion INR Investment in Million INR

14
Renewable Energy initiatives
Installation of 20 kW solar Power plantfor External Lighting.
Renewable Energy Generation:-29,250 Units/Annum
Total Cost of Project:- 30,00,000 INR
Installed 5000 liters Solar Water Heaterfor Cafeteria
Equivalent amount of Energy Saved for2016-17 is 21,930 Units/Annum
Total cost of the Project: 700,000 INR

15
Utilization of Waste as Fuel
Oorja Stoves in canteen resulted in 50 %reduction of LPG.
Total amount of LPG replaced in 2015-16& 2016-17 by using oorja at facility
With usage of Bio pellets resulted inreduction of LPG closely saves 3696 Kgsin 2015-16 , and 4096 kgs in 2016-17
Reduction of closely 11.05 TCo2/Annumin 2015-16 and 12.25TCo2/Annum in2016-17

16
GHG Emission Reduction
2.66
2.21
1.94
0
0.5
1
1.5
2
2.5
3
2014-15 2015-16 2016-17
CARBON EMISSIONS REDUCTION IN TCO2E/EMPLOYEE
17
Environmental Projects
Inverter Type Split AC
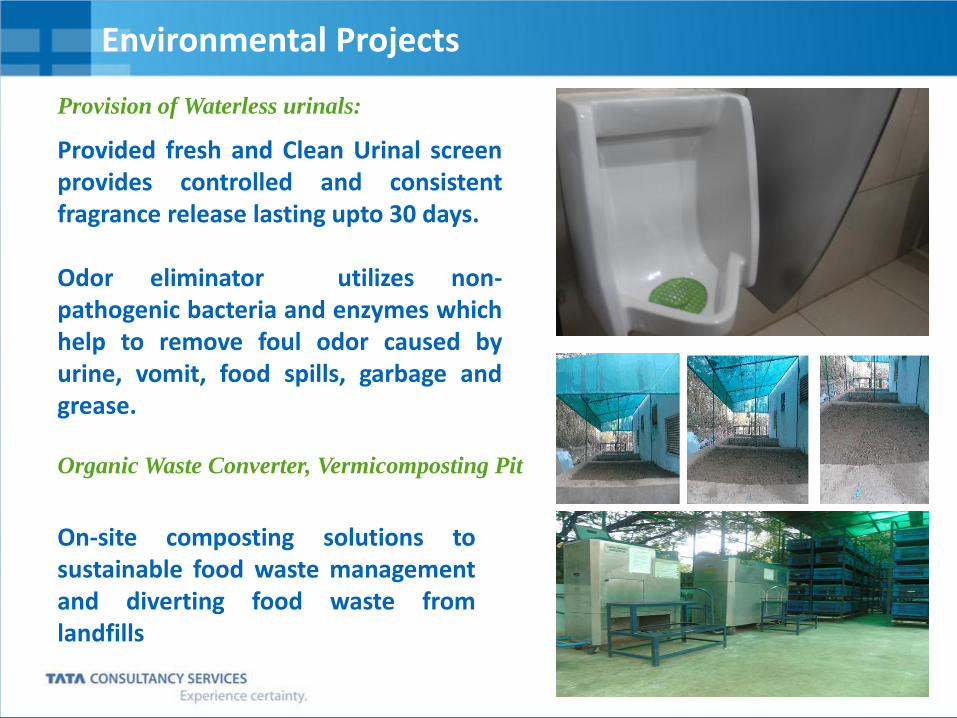
Provision of Waterless urinals:
Provided fresh and Clean Urinal screenprovides controlled and consistentfragrance release lasting upto 30 days.
Odor eliminator utilizes non-pathogenic bacteria and enzymes whichhelp to remove foul odor caused byurine, vomit, food spills, garbage andgrease.
Organic Waste Converter, Vermicomposting Pit
On-site composting solutions tosustainable food waste managementand diverting food waste fromlandfills

18
Provision of Aerators to Taps at SP location.
• Earlier hand wash basins are consisting of Conventional taps which dispensewater at constant flow rate and always there is possibility of wastage.
• It has the optimal flow rate / less consumption per usage compared toconventional flow rate.
Environmental Projects

19
BEFORE
Arranged the cable trenches to PDBs from
Scrap of MS.
AFTER
Utilization of Waste Materials
BEFORE AFTER
Unwanted Cable entry holes are closed with
scrap of MS
Secondary containers made from GI Scrap

20
Utilization of Waste Materials

21
CFO – Finance
Energy Budgeting
ECO Sustainability Team Initiatives
REMC – ROC
Monitoring Alerts
FM Team
Operational Efficiency
Administration
Implementation / Tracking
ESHS
Implementation of ISO14001:2015 , ISO 18001:2007
Energy Conservation
Team
Team
Team
Team Work & Energy Conservation
Team
Team
Team
22
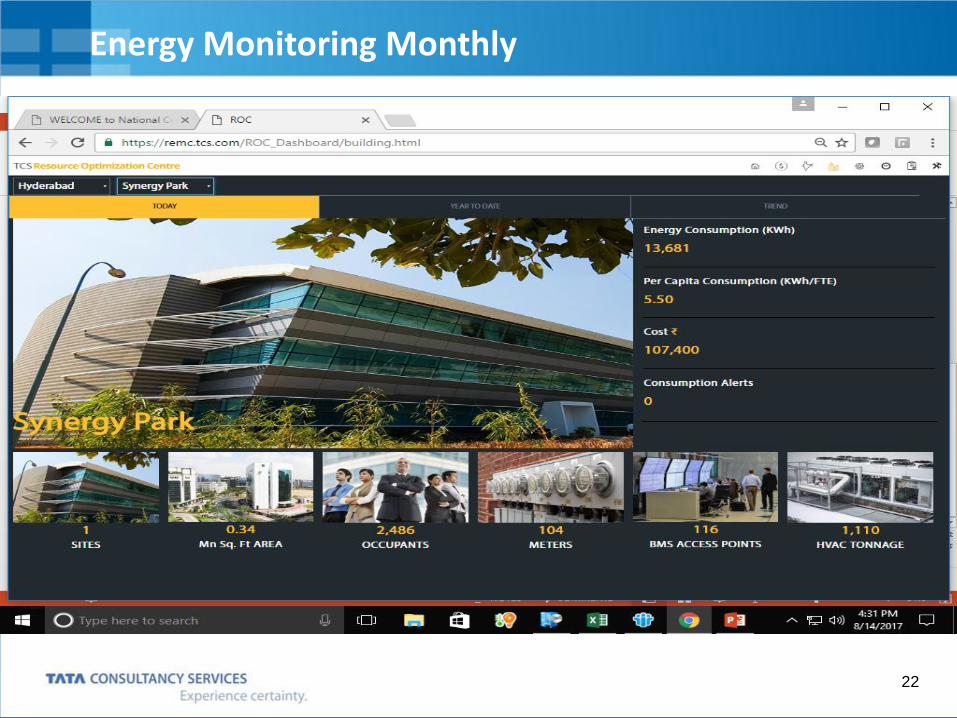
Energy Monitoring Monthly

23
Road Map Status
Completed
Completed
Have installed ABT meters and Open access application is submittedCooling tower
Refurbishment is done
Shifted to Next year

24
Road Map Ahead.
Replacement
of
conventional
light fittings
with LED
95580 Kwh/Yr
Installation of
Solar Power
plant
80000 Kwh/Yr
Offsite Solar
Purchase
1460000 Kwh/Yr
Data Centre
Server
Consolidation
7,50,000
Kwh/Yr

25
Best Practices on Energy Conservation Implemented
Deployment of Go Green Tool.
Remote Energy Monitoring and Control.
Onsite Renewable Energy.
20% renewable energy consumption by 2020.
Requirements pertains to Environment/Energy will be consideredduring vendor evaluations.
Heat recovery wheel.
Creating awareness among the employees on Energy Conservationthrough mails and also communicating importance of Proper WasteManagement.
Installed 104 Energy meters at facility.

26
External & Internal Audit/Certifications
Area Purpose of Audit Total Nos
Facility To study Energy
Conservation Potential at
facility
1
Facility To find out the concerns
pertains to Environment
and Safety with respective
Internal and External audit
of OHSAS 18001 and ISO 14001:2015.
Internal audits-2
External Audit -1
All observations -Closed
Facility Carbon disclosure project-carried out by Third party
2

27


