131
CIM REVISION CARDS
Marketing Research and InformationJohn Williams
AMSTERDAM l BOSTON l HEIDELBERG l LONDON l NEW YORK l OXFORDPARIS l SAN DIEGO l SAN FRANCISCO l SINGAPORE l SYDNEY l TOKYO
Elsevier Butterworth-HeinemannLinacre House, Jordan Hill, Oxford OX2 8DP30, Corporate Drive, Burlington, MA 01803
First published 2004
Copyright � 2004, Elsevier Ltd. All rights reserved
No part of this publication may be reproduced in any material form (including photocopying or storing in any medium by electronic meansand whether or not transiently or incidentally to some other use of this publication) without the written permission of the copyright holderexcept in accordance with the provisions of the Copyright, Designs and Patents Act 1988 or under the terms of a licence issued by theCopyright Licensing Agency Ltd, 90 Tottenham Court Road, London, England W1T 4LP. Applications for the copyright holder’s writtenpermission to reproduce any part of this publication should be addressed to the publisher.
Permissions may be sought directly from Elsevier’s Science & Technology Rights Department in Oxford, UK: phone: (+44) 1865 843830,fax: (+44) 1865 853333, e-mail: [email protected]. You may also complete your request on-line via the Elseiver homepage(http://www.elsevier.com), by selecting ‘Customer Support’ and then ‘Obtaining Permissions’
British Library Cataloguing in Publication DataA catalogue record for this book is available from the British Library
Library of Congress Cataloging in Publication DataA catalogue record for this book is available from the Library of Congress
ISBN 07506 62891
Printed and bound in Great Britain
For information on all Elsevier Butterworth-Heinemann publications visit our website at http://books.elsevier.com
TABLE OF CONTENTS
Preface .. . . . . . . . . . . . . . . . . . . . . . . . . . . . . . . . . . . . . . . . . . . . . . . . . . . . . . . . . . . . . . . . . . . . . . . . . . iv1. Marketing research and information .. . . . . . . . . . . . . . . . . . . . . . . . . . . . . . . . . . . . . . . . . 12. Information in the knowledge economy .. . . . . . . . . . . . . . . . . . . . . . . . . . . . . . . . . . . . . 113. The marketing database .. . . . . . . . . . . . . . . . . . . . . . . . . . . . . . . . . . . . . . . . . . . . . . . . . . . . . . 284. The marketing research process .. . . . . . . . . . . . . . . . . . . . . . . . . . . . . . . . . . . . . . . . . . . . . 405. Using secondary research.. . . . . . . . . . . . . . . . . . . . . . . . . . . . . . . . . . . . . . . . . . . . . . . . . . . . . 616. Observation research .. . . . . . . . . . . . . . . . . . . . . . . . . . . . . . . . . . . . . . . . . . . . . . . . . . . . . . . . . . 677. Qualitative research.. . . . . . . . . . . . . . . . . . . . . . . . . . . . . . . . . . . . . . . . . . . . . . . . . . . . . . . . . . . . 758. Quantitative data .. . . . . . . . . . . . . . . . . . . . . . . . . . . . . . . . . . . . . . . . . . . . . . . . . . . . . . . . . . . . . . . 849. Questionnaire design .. . . . . . . . . . . . . . . . . . . . . . . . . . . . . . . . . . . . . . . . . . . . . . . . . . . . . . . . . . 9410. Sampling .. . . . . . . . . . . . . . . . . . . . . . . . . . . . . . . . . . . . . . . . . . . . . . . . . . . . . . . . . . . . . . . . . . . . . . . . 10411. Quantitative data analysis . . . . . . . . . . . . . . . . . . . . . . . . . . . . . . . . . . . . . . . . . . . . . . . . . . . . . . 11212. Presenting marketing research .. . . . . . . . . . . . . . . . . . . . . . . . . . . . . . . . . . . . . . . . . . . . . . . 121
Bibliography .. . . . . . . . . . . . . . . . . . . . . . . . . . . . . . . . . . . . . . . . . . . . . . . . . . . . . . . . . . . . . . . . . . . . 125
PREFACEWelcome to the CIM Revision Cards from Elsevier/Butterworth–Heinemann. We hope you will find these useful torevise for your CIM exam. The cards are designed to be used in conjunction with the CIM Coursebooks fromElsevier/Butterworth–Heinemann, and have been written specifically with revision in mind. They also serve asinvaluable reviews of the complete modules, perfect for those studying via the assignment route.
n Learning outcomes at the start of each chapter identify the main points
n Key topics are simmarized, helping you commit the information to memory quickly and easily
n Examination and revision tips are provided to give extra guidance when preparing for the exam
n Key diagrams are featured to aid the learning process
n The compact size ensures the cards are easily transportable, so you can revise any time, anywhere
To get the most out of your revision cards, try to look over them as frequently as you can when taking your CIMcourse. When read alongside the Coursebook they serve as the ideal companion to the main text. Good luck –we wish you every success with your CIM qualification
MARKETING RESEARCH ANDINFORMATIONINTRODUCT ION
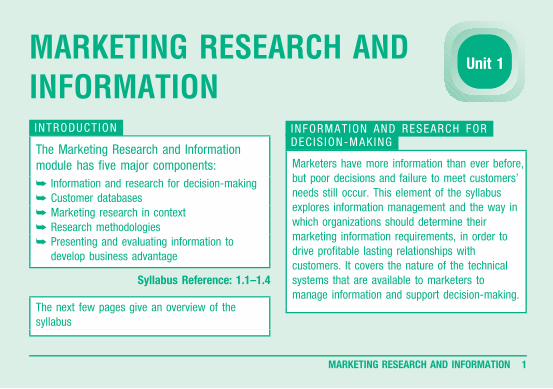
The Marketing Research and Informationmodule has five major components:
� Information and research for decision-making� Customer databases� Marketing research in context� Research methodologies� Presenting and evaluating information to
develop business advantage
Syllabus Reference: 1.1–1.4
The next few pages give an overview of thesyllabus
INFORMAT ION AND RESEARCH FORDEC IS ION-MAK ING
Marketers have more information than ever before,but poor decisions and failure to meet customers’needs still occur. This element of the syllabusexplores information management and the way inwhich organizations should determine theirmarketing information requirements, in order todrive profitable lasting relationships withcustomers. It covers the nature of the technicalsystems that are available to marketers tomanage information and support decision-making.
Unit 1
MARKETING RESEARCH AND INFORMATION 1
Customer Databases
See the diagram on page 3. Syllabus Reference: 2.1–2.5
Example
TGI customer database
TGI is a research service run by BMRB. In this example it is run against an internal database and commoncharacteristics identified.
MARKETING RESEARCH AND INFORMATION 2
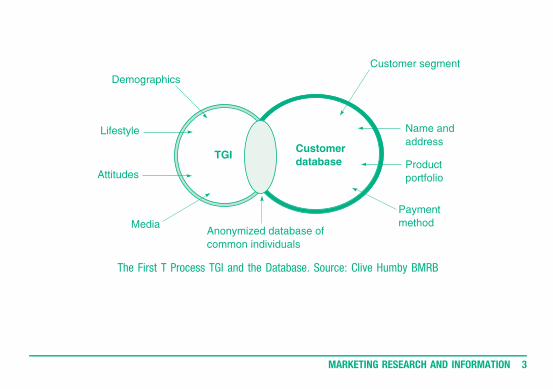
The First T Process TGI and the Database. Source: Clive Humby BMRB
MARKETING RESEARCH AND INFORMATION 3
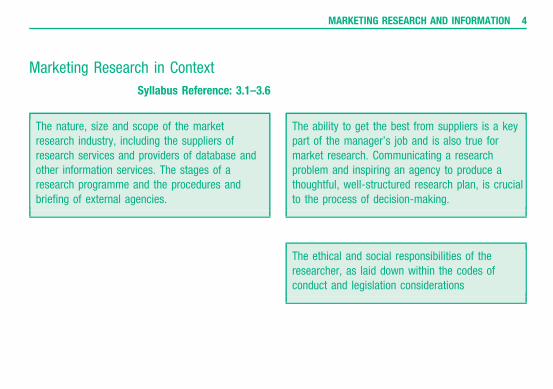
Marketing Research in Context
Syllabus Reference: 3.1–3.6
The nature, size and scope of the marketresearch industry, including the suppliers ofresearch services and providers of database andother information services. The stages of aresearch programme and the procedures andbriefing of external agencies.
The ability to get the best from suppliers is a keypart of the manager’s job and is also true formarket research. Communicating a researchproblem and inspiring an agency to produce athoughtful, well-structured research plan, is crucialto the process of decision-making.
The ethical and social responsibilities of theresearcher, as laid down within the codes ofconduct and legislation considerations
MARKETING RESEARCH AND INFORMATION 4
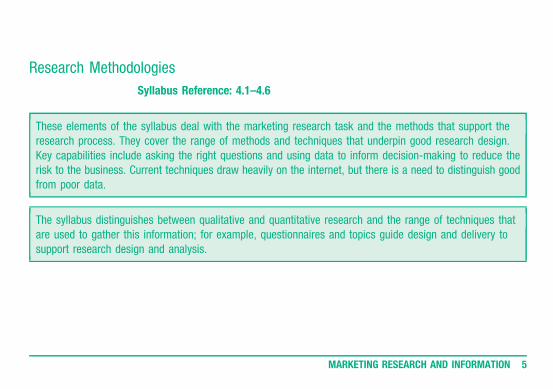
Research Methodologies
Syllabus Reference: 4.1–4.6
These elements of the syllabus deal with the marketing research task and the methods that support theresearch process. They cover the range of methods and techniques that underpin good research design.Key capabilities include asking the right questions and using data to inform decision-making to reduce therisk to the business. Current techniques draw heavily on the internet, but there is a need to distinguish goodfrom poor data.
The syllabus distinguishes between qualitative and quantitative research and the range of techniques thatare used to gather this information; for example, questionnaires and topics guide design and delivery tosupport research design and analysis.
MARKETING RESEARCH AND INFORMATION 5
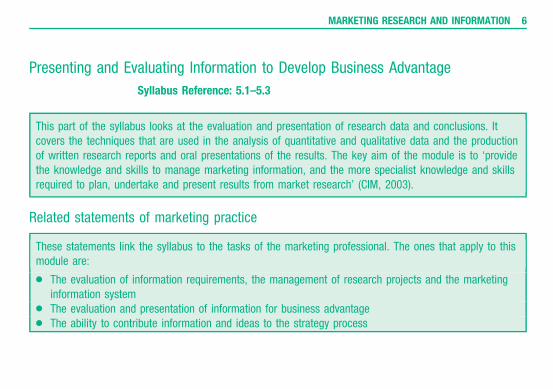
Presenting and Evaluating Information to Develop Business Advantage
Syllabus Reference: 5.1–5.3
This part of the syllabus looks at the evaluation and presentation of research data and conclusions. Itcovers the techniques that are used in the analysis of quantitative and qualitative data and the productionof written research reports and oral presentations of the results. The key aim of the module is to ‘providethe knowledge and skills to manage marketing information, and the more specialist knowledge and skillsrequired to plan, undertake and present results from market research’ (CIM, 2003).
Related statements of marketing practice
These statements link the syllabus to the tasks of the marketing professional. The ones that apply to thismodule are:
l The evaluation of information requirements, the management of research projects and the marketinginformation system
l The evaluation and presentation of information for business advantagel The ability to contribute information and ideas to the strategy process
MARKETING RESEARCH AND INFORMATION 6
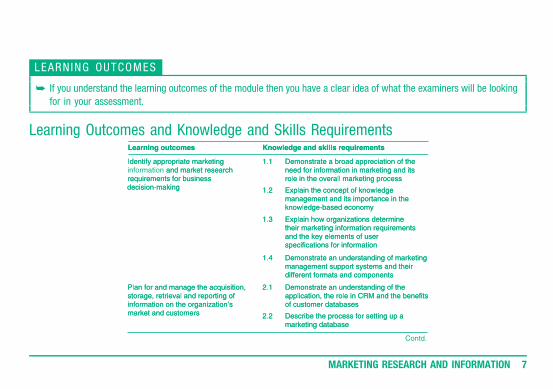
LEARN ING OUTCOMES
� If you understand the learning outcomes of the module then you have a clear idea of what the examiners will be looking
for in your assessment.
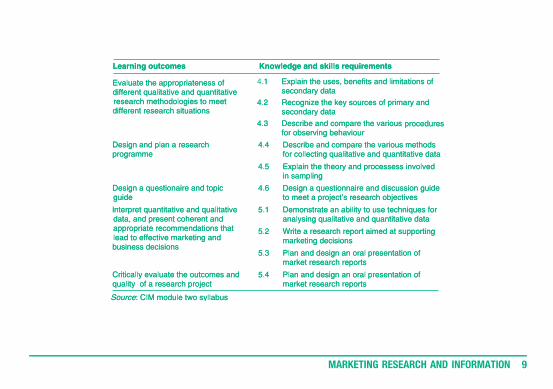
Learning Outcomes and Knowledge and Skills Requirements
Contd.
MARKETING RESEARCH AND INFORMATION 7
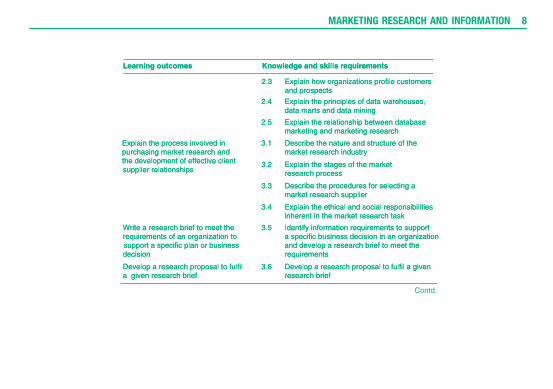
Contd.
MARKETING RESEARCH AND INFORMATION 8
I
MARKETING RESEARCH AND INFORMATION 9
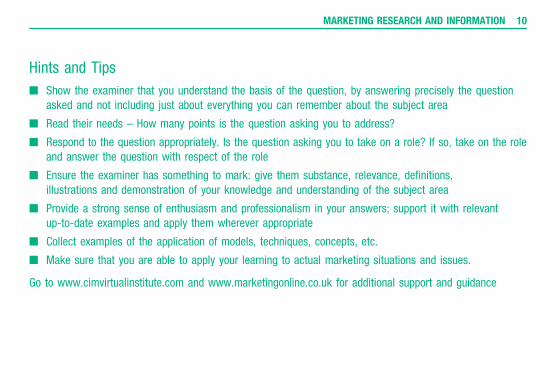
Hints and Tips
n Show the examiner that you understand the basis of the question, by answering precisely the questionasked and not including just about everything you can remember about the subject area
n Read their needs – How many points is the question asking you to address?
n Respond to the question appropriately. Is the question asking you to take on a role? If so, take on the roleand answer the question with respect of the role
n Ensure the examiner has something to mark: give them substance, relevance, definitions,illustrations and demonstration of your knowledge and understanding of the subject area
n Provide a strong sense of enthusiasm and professionalism in your answers; support it with relevantup-to-date examples and apply them wherever appropriate
n Collect examples of the application of models, techniques, concepts, etc.
n Make sure that you are able to apply your learning to actual marketing situations and issues.
Go to www.cimvirtualinstitute.com and www.marketingonline.co.uk for additional support and guidance
MARKETING RESEARCH AND INFORMATION 10
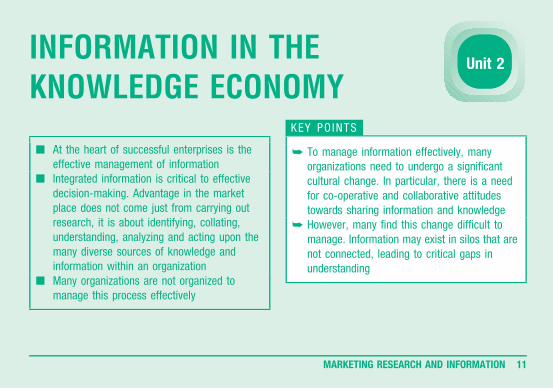
INFORMATION IN THEKNOWLEDGE ECONOMY
n At the heart of successful enterprises is theeffective management of information
n Integrated information is critical to effectivedecision-making. Advantage in the marketplace does not come just from carrying outresearch, it is about identifying, collating,understanding, analyzing and acting upon themany diverse sources of knowledge andinformation within an organization
n Many organizations are not organized tomanage this process effectively
KEY POINTS
� To manage information effectively, manyorganizations need to undergo a significantcultural change. In particular, there is a needfor co-operative and collaborative attitudestowards sharing information and knowledge
� However, many find this change difficult tomanage. Information may exist in silos that arenot connected, leading to critical gaps inunderstanding
Unit 2
MARKETING RESEARCH AND INFORMATION 11
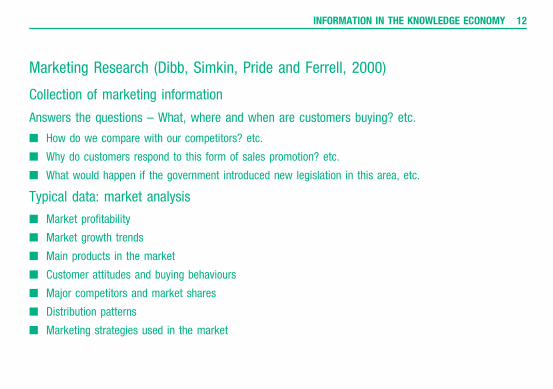
Marketing Research (Dibb, Simkin, Pride and Ferrell, 2000)
Collection of marketing information
Answers the questions – What, where and when are customers buying? etc.
n How do we compare with our competitors? etc.
n Why do customers respond to this form of sales promotion? etc.
n What would happen if the government introduced new legislation in this area, etc.
Typical data: market analysis
n Market profitability
n Market growth trends
n Main products in the market
n Customer attitudes and buying behaviours
n Major competitors and market shares
n Distribution patterns
n Marketing strategies used in the market
INFORMATION IN THE KNOWLEDGE ECONOMY 12
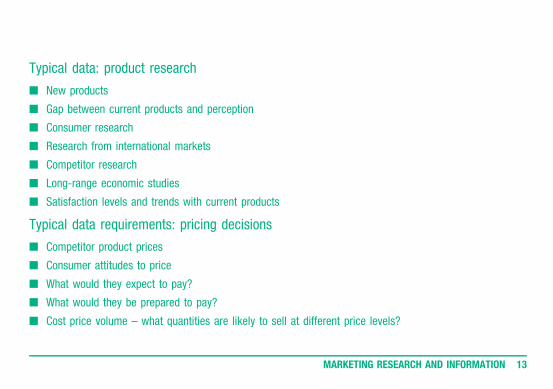
Typical data: product research
n New products
n Gap between current products and perception
n Consumer research
n Research from international markets
n Competitor research
n Long-range economic studies
n Satisfaction levels and trends with current products
Typical data requirements: pricing decisions
n Competitor product prices
n Consumer attitudes to price
n What would they expect to pay?
n What would they be prepared to pay?
n Cost price volume – what quantities are likely to sell at different price levels?
MARKETING RESEARCH AND INFORMATION 13
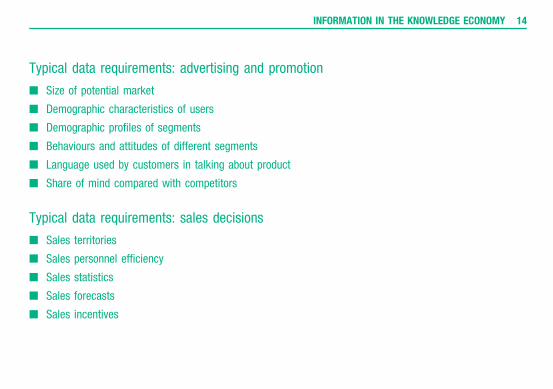
Typical data requirements: advertising and promotion
n Size of potential market
n Demographic characteristics of users
n Demographic profiles of segments
n Behaviours and attitudes of different segments
n Language used by customers in talking about product
n Share of mind compared with competitors
Typical data requirements: sales decisions
n Sales territories
n Sales personnel efficiency
n Sales statistics
n Sales forecasts
n Sales incentives
INFORMATION IN THE KNOWLEDGE ECONOMY 14
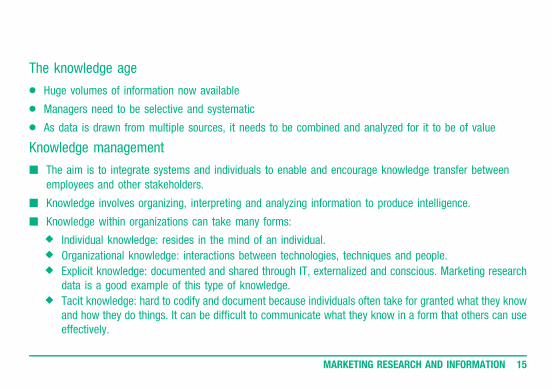
The knowledge age
l Huge volumes of information now available
l Managers need to be selective and systematic
l As data is drawn from multiple sources, it needs to be combined and analyzed for it to be of value
Knowledge management
n The aim is to integrate systems and individuals to enable and encourage knowledge transfer betweenemployees and other stakeholders.
n Knowledge involves organizing, interpreting and analyzing information to produce intelligence.
n Knowledge within organizations can take many forms:
• Individual knowledge: resides in the mind of an individual.• Organizational knowledge: interactions between technologies, techniques and people.• Explicit knowledge: documented and shared through IT, externalized and conscious. Marketing research
data is a good example of this type of knowledge.• Tacit knowledge: hard to codify and document because individuals often take for granted what they know
and how they do things. It can be difficult to communicate what they know in a form that others can useeffectively.
MARKETING RESEARCH AND INFORMATION 15
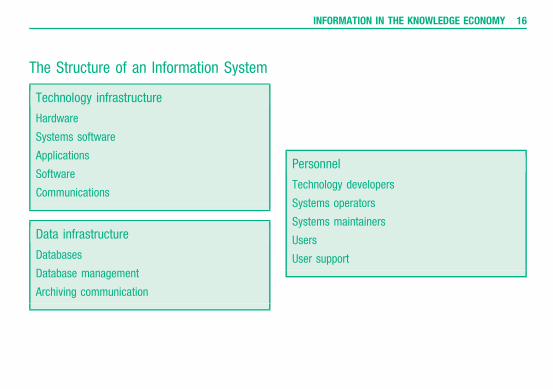
The Structure of an Information System
Technology infrastructure
Hardware
Systems software
Applications
Software
Communications
Data infrastructure
Databases
Database management
Archiving communication
Personnel
Technology developers
Systems operators
Systems maintainers
Users
User support
INFORMATION IN THE KNOWLEDGE ECONOMY 16
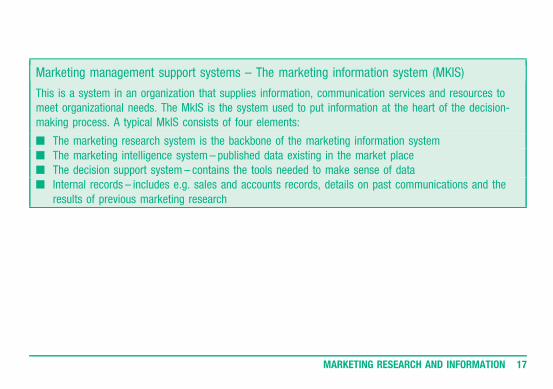
Marketing management support systems – The marketing information system (MKIS)
This is a system in an organization that supplies information, communication services and resources tomeet organizational needs. The MkIS is the system used to put information at the heart of the decision-making process. A typical MkIS consists of four elements:
n The marketing research system is the backbone of the marketing information systemn The marketing intelligence system – published data existing in the market placen The decision support system – contains the tools needed to make sense of datan Internal records – includes e.g. sales and accounts records, details on past communications and the
results of previous marketing research
MARKETING RESEARCH AND INFORMATION 17
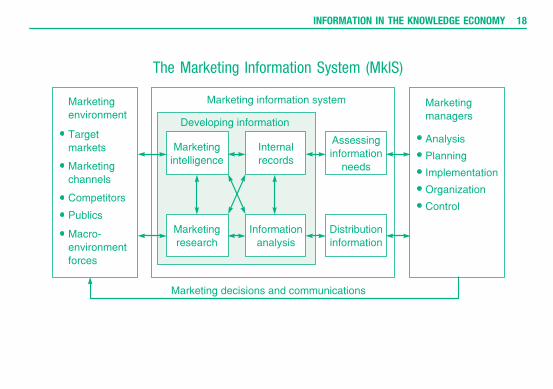
The Marketing Information System (MkIS)
INFORMATION IN THE KNOWLEDGE ECONOMY 18
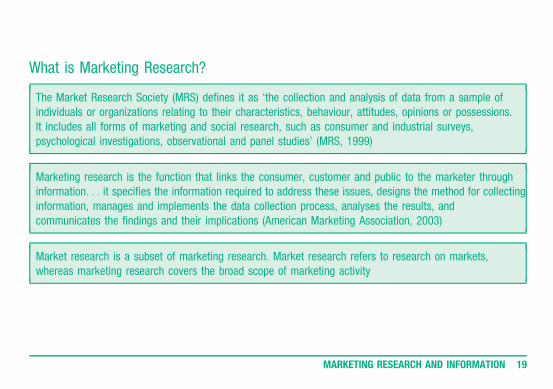
What is Marketing Research?
The Market Research Society (MRS) defines it as ‘the collection and analysis of data from a sample ofindividuals or organizations relating to their characteristics, behaviour, attitudes, opinions or possessions.It includes all forms of marketing and social research, such as consumer and industrial surveys,psychological investigations, observational and panel studies’ (MRS, 1999)
Marketing research is the function that links the consumer, customer and public to the marketer throughinformation. . . it specifies the information required to address these issues, designs the method for collectinginformation, manages and implements the data collection process, analyses the results, andcommunicates the findings and their implications (American Marketing Association, 2003)
Market research is a subset of marketing research. Market research refers to research on markets,whereas marketing research covers the broad scope of marketing activity
MARKETING RESEARCH AND INFORMATION 19
Databases
A database does not have to be computer-based but access to database technology is easy and cheap.A database will collect data about past, potential and current customers. A database differs from an accountingsystem in that the data must be relevant to marketing decision-making. It is important that data fed into themarketing database is relevant to marketing decisions, now and in the future.
Wilson (2003) suggests that marketers develop customer databases for four reasons:
1. To personalize marketing communications
2. To improve customer service
3. To understand customer behaviour
4. To assess the effectiveness of the organization’s marketing and service activities.
INFORMATION IN THE KNOWLEDGE ECONOMY 20
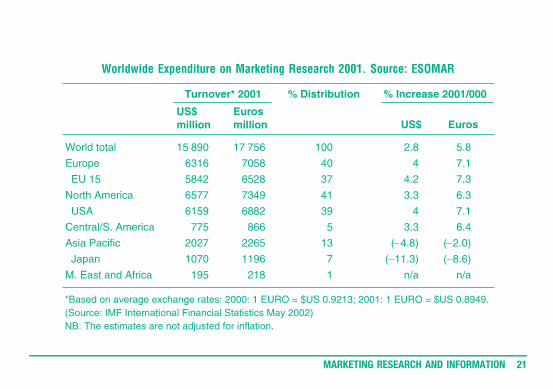
Worldwide Expenditure on Marketing Research 2001. Source: ESOMAR
MARKETING RESEARCH AND INFORMATION 21
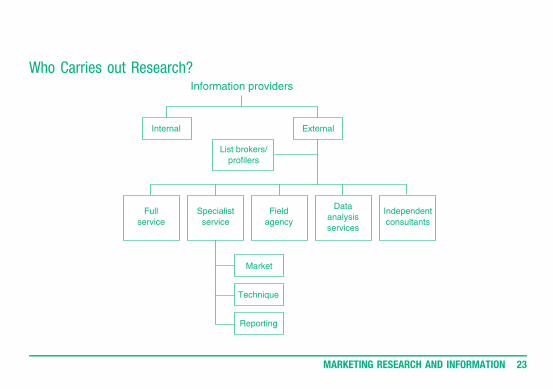
Who Carries out Research?
Alan Wilson (2003) identifies the following:
n List brokers – Suppliers of lists of contacts for marketing purposes. They may include names andaddresses, telephone numbers and e-mail addresses
n Full service agencies – Agencies that provide a full range of research services, e.g. TN Sofres
n Specialist service agencies – Specialize in certain types of research, e.g. international research or onlineresearch
n Field agencies – Specialize in the delivery of fieldwork and administration of questionnaires
n Data analysis companies – Specialize in the analysis of data
n Consultants – Independent consultants who may offer a range of services
n Other suppliers to the industry include database bureaux who may host an external database
INFORMATION IN THE KNOWLEDGE ECONOMY 22
Who Carries out Research?
MARKETING RESEARCH AND INFORMATION 23
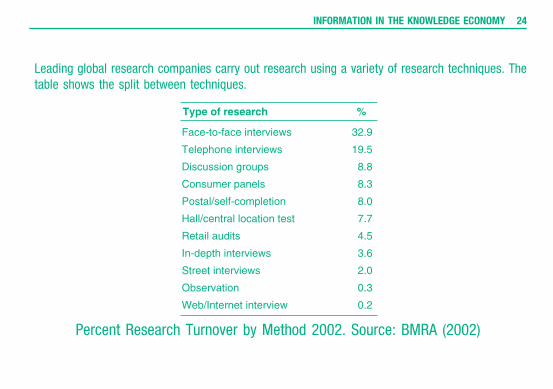
Leading global research companies carry out research using a variety of research techniques. Thetable shows the split between techniques.
Percent Research Turnover by Method 2002. Source: BMRA (2002)
INFORMATION IN THE KNOWLEDGE ECONOMY 24
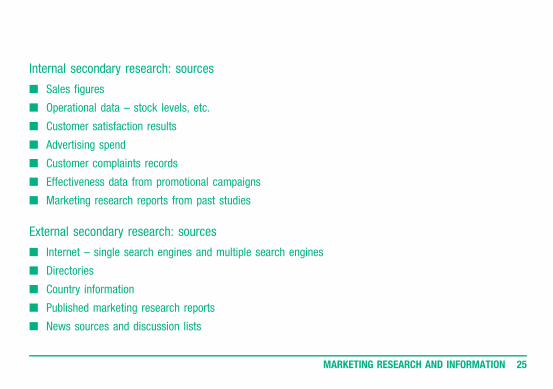
Internal secondary research: sources
n Sales figures
n Operational data – stock levels, etc.
n Customer satisfaction results
n Advertising spend
n Customer complaints records
n Effectiveness data from promotional campaigns
n Marketing research reports from past studies
External secondary research: sources
n Internet – single search engines and multiple search engines
n Directories
n Country information
n Published marketing research reports
n News sources and discussion lists
MARKETING RESEARCH AND INFORMATION 25
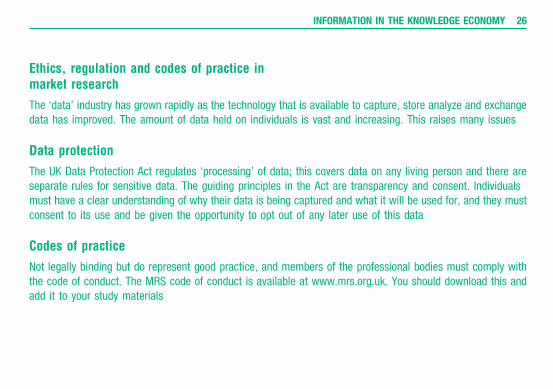
Ethics, regulation and codes of practice inmarket research
The ‘data’ industry has grown rapidly as the technology that is available to capture, store analyze and exchangedata has improved. The amount of data held on individuals is vast and increasing. This raises many issues
Data protection
The UK Data Protection Act regulates ‘processing’ of data; this covers data on any living person and there areseparate rules for sensitive data. The guiding principles in the Act are transparency and consent. Individualsmust have a clear understanding of why their data is being captured and what it will be used for, and they mustconsent to its use and be given the opportunity to opt out of any later use of this data
Codes of practice
Not legally binding but do represent good practice, and members of the professional bodies must comply withthe code of conduct. The MRS code of conduct is available at www.mrs.org.uk. You should download this andadd it to your study materials
INFORMATION IN THE KNOWLEDGE ECONOMY 26
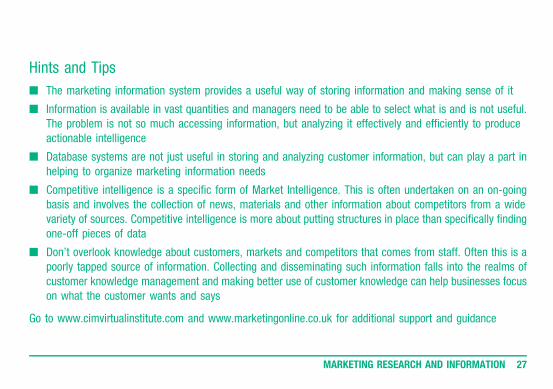
Hints and Tips
n The marketing information system provides a useful way of storing information and making sense of it
n Information is available in vast quantities and managers need to be able to select what is and is not useful.The problem is not so much accessing information, but analyzing it effectively and efficiently to produceactionable intelligence
n Database systems are not just useful in storing and analyzing customer information, but can play a part inhelping to organize marketing information needs
n Competitive intelligence is a specific form of Market Intelligence. This is often undertaken on an on-goingbasis and involves the collection of news, materials and other information about competitors from a widevariety of sources. Competitive intelligence is more about putting structures in place than specifically findingone-off pieces of data
n Don’t overlook knowledge about customers, markets and competitors that comes from staff. Often this is apoorly tapped source of information. Collecting and disseminating such information falls into the realms ofcustomer knowledge management and making better use of customer knowledge can help businesses focuson what the customer wants and says
Go to www.cimvirtualinstitute.com and www.marketingonline.co.uk for additional support and guidance
MARKETING RESEARCH AND INFORMATION 27
THE MARKETING DATABASESyllabus Reference: 2.1–2.5
After completing this unit you will:
n Be able to define the marketing database and its role within Customer Relationship Management systems
n Understand the marketing applications supported by the marketing database
n Understand the management process involved in building, maintaining and enhancing the database
n Understand and define the concepts of data warehouses and data mining
Unit 3
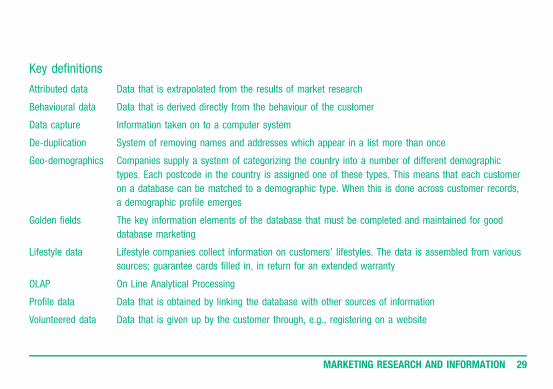
Key definitions
Attributed data Data that is extrapolated from the results of market research
Behavioural data Data that is derived directly from the behaviour of the customer
Data capture Information taken on to a computer system
De-duplication System of removing names and addresses which appear in a list more than once
Geo-demographics Companies supply a system of categorizing the country into a number of different demographic
types. Each postcode in the country is assigned one of these types. This means that each customer
on a database can be matched to a demographic type. When this is done across customer records,
a demographic profile emerges
Golden fields The key information elements of the database that must be completed and maintained for good
database marketing
Lifestyle data Lifestyle companies collect information on customers’ lifestyles. The data is assembled from various
sources; guarantee cards filled in, in return for an extended warranty
OLAP On Line Analytical Processing
Profile data Data that is obtained by linking the database with other sources of information
Volunteered data Data that is given up by the customer through, e.g., registering on a website
MARKETING RESEARCH AND INFORMATION 29
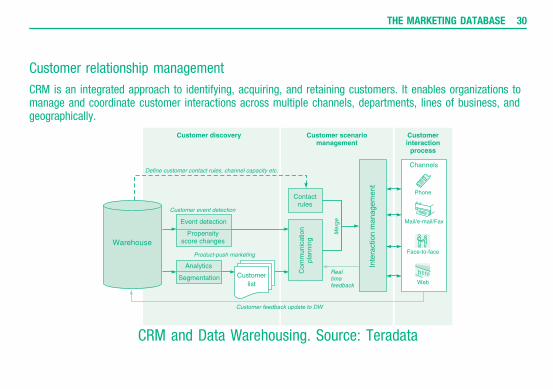
Customer relationship management
CRM is an integrated approach to identifying, acquiring, and retaining customers. It enables organizations tomanage and coordinate customer interactions across multiple channels, departments, lines of business, andgeographically.
CRM and Data Warehousing. Source: Teradata
THE MARKETING DATABASE 30
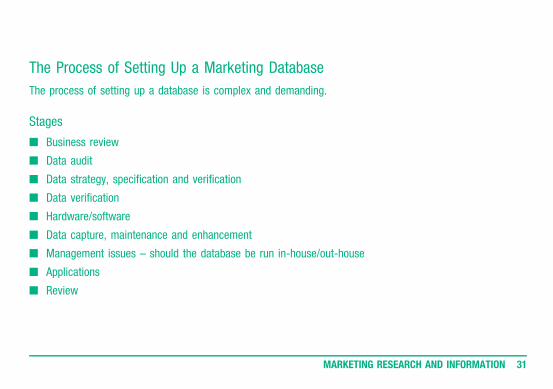
The Process of Setting Up a Marketing Database
The process of setting up a database is complex and demanding.
Stages
n Business review
n Data audit
n Data strategy, specification and verification
n Data verification
n Hardware/software
n Data capture, maintenance and enhancement
n Management issues – should the database be run in-house/out-house
n Applications
n Review
MARKETING RESEARCH AND INFORMATION 31
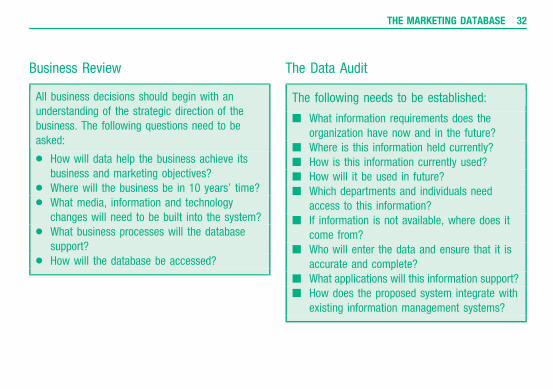
Business Review
All business decisions should begin with anunderstanding of the strategic direction of thebusiness. The following questions need to beasked:
l How will data help the business achieve itsbusiness and marketing objectives?
l Where will the business be in 10 years’ time?l What media, information and technology
changes will need to be built into the system?l What business processes will the database
support?l How will the database be accessed?
The Data Audit
The following needs to be established:
n What information requirements does theorganization have now and in the future?
n Where is this information held currently?n How is this information currently used?n How will it be used in future?n Which departments and individuals need
access to this information?n If information is not available, where does it
come from?n Who will enter the data and ensure that it is
accurate and complete?n What applications will this information support?n How does the proposed system integrate with
existing information management systems?
THE MARKETING DATABASE 32
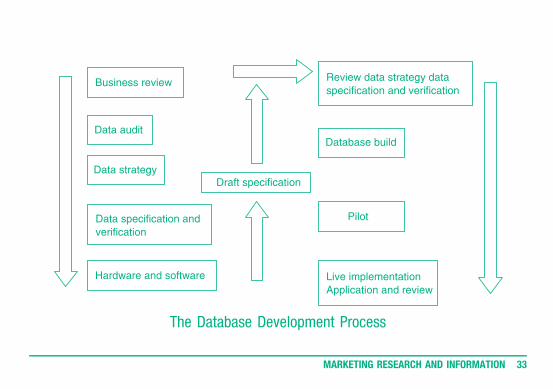
The Database Development Process
MARKETING RESEARCH AND INFORMATION 33
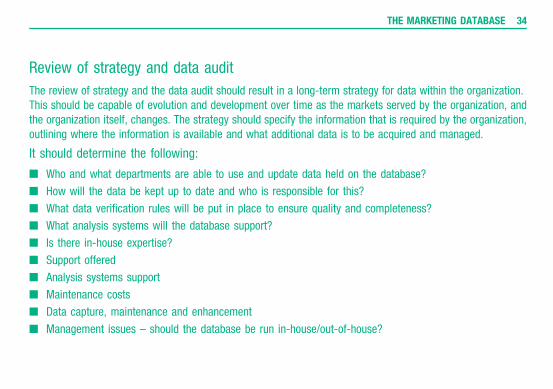
Review of strategy and data audit
The review of strategy and the data audit should result in a long-term strategy for data within the organization.This should be capable of evolution and development over time as the markets served by the organization, andthe organization itself, changes. The strategy should specify the information that is required by the organization,outlining where the information is available and what additional data is to be acquired and managed.
It should determine the following:
n Who and what departments are able to use and update data held on the database?
n How will the data be kept up to date and who is responsible for this?
n What data verification rules will be put in place to ensure quality and completeness?
n What analysis systems will the database support?
n Is there in-house expertise?
n Support offered
n Analysis systems support
n Maintenance costs
n Data capture, maintenance and enhancement
n Management issues – should the database be run in-house/out-of-house?
THE MARKETING DATABASE 34
Profiling
Because of the range of information that is captured on customers, quite sophisticated profiles can be created.By linking a data base to services like Mosaic, the profile can be extended significantly. Simple profiling mightbe used to identify the best value customers, according to certain demographic or lifestyle indicators. Thiswould be based on the value of past purchases, how often they purchased, and when they last purchased. Thisis known as recency, frequency and value analysis, or RFV analysis. It is also written as FRAC analysis(Frequency Recency Amount and Category). By matching this to other data, e.g. income, family status andpostcode, people with similar profiles can be targeted.
MARKETING RESEARCH AND INFORMATION 35
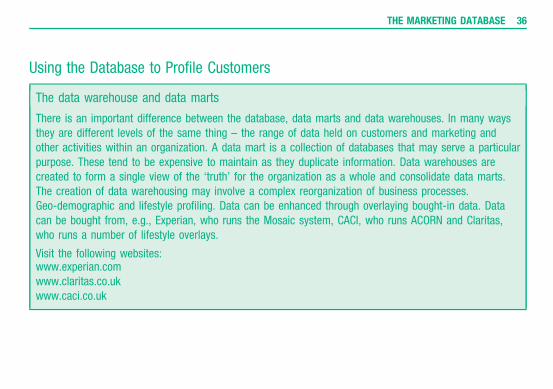
Using the Database to Profile Customers
The data warehouse and data marts
There is an important difference between the database, data marts and data warehouses. In many waysthey are different levels of the same thing – the range of data held on customers and marketing andother activities within an organization. A data mart is a collection of databases that may serve a particularpurpose. These tend to be expensive to maintain as they duplicate information. Data warehouses arecreated to form a single view of the ‘truth’ for the organization as a whole and consolidate data marts.The creation of data warehousing may involve a complex reorganization of business processes.Geo-demographic and lifestyle profiling. Data can be enhanced through overlaying bought-in data. Datacan be bought from, e.g., Experian, who runs the Mosaic system, CACI, who runs ACORN and Claritas,who runs a number of lifestyle overlays.
Visit the following websites:www.experian.comwww.claritas.co.ukwww.caci.co.uk
THE MARKETING DATABASE 36
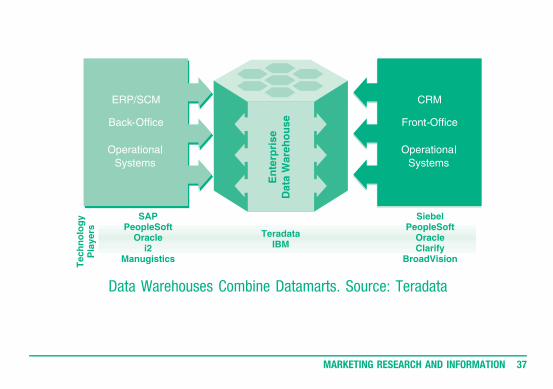
Data Warehouses Combine Datamarts. Source: Teradata
MARKETING RESEARCH AND INFORMATION 37
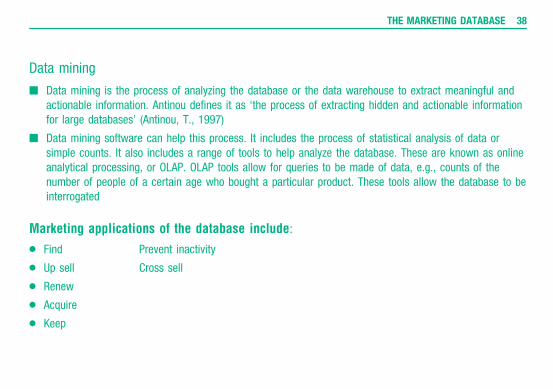
Data mining
n Data mining is the process of analyzing the database or the data warehouse to extract meaningful andactionable information. Antinou defines it as ‘the process of extracting hidden and actionable informationfor large databases’ (Antinou, T., 1997)
n Data mining software can help this process. It includes the process of statistical analysis of data orsimple counts. It also includes a range of tools to help analyze the database. These are known as onlineanalytical processing, or OLAP. OLAP tools allow for queries to be made of data, e.g., counts of thenumber of people of a certain age who bought a particular product. These tools allow the database to beinterrogated
Marketing applications of the database include:
l Find Prevent inactivity
l Up sell Cross sell
l Renew
l Acquire
l Keep
THE MARKETING DATABASE 38
Hints and Tips
n Thomas and Housden’s book Direct Marketing in Practice contains a useful chapter on the database and itsapplications
n Technology has enabled the development of the database into a powerful tool for the management ofcustomer information
n It is essential that any database is kept up-to-date through regular ‘cleaning’, or customer relationships canbe damaged rather than enhanced
n Customer databases provide information on purchase behaviour, customer loyalty and customer response,but they only describe ‘what’ and not ‘why’
n A data warehouse is a large database, storing transactional data and enabling insightful analysis
n Data mining selects, explores and models large amounts of data to uncover previously unknownrelationships and patterns
n Marketing research should be transparent about database usage and should not be used to ‘sell’ torespondents
n Much marketing intelligence information can come from making better use of existing information. Forinstance, by carrying out database analysis on orders taken, it may be possible to understand where thereare cross-sale and up-sale opportunities, or to understand what type of customers are the most profitable
Go to www.cimvirtualinstitute.com and www.marketingonline.co.uk for additional support and guidance
MARKETING RESEARCH AND INFORMATION 39
THE MARKETINGRESEARCH PROCESS
Syllabus Reference: 3.2–3.6
After completing this unit you will:
n Be able to identify the stages of a marketing research plan
n Identify and brief a range of marketing research suppliers
n Be able to construct a proposal document in response to a marketing research brief
Unit 4
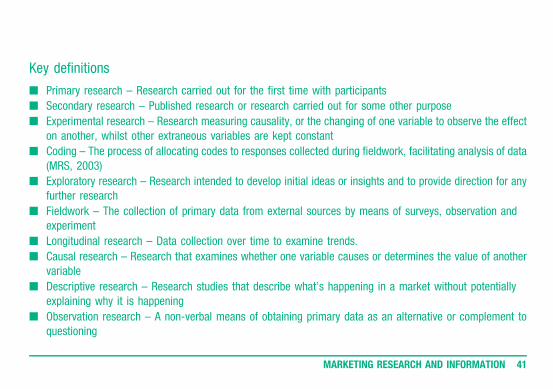
Key definitions
n Primary research – Research carried out for the first time with participants
n Secondary research – Published research or research carried out for some other purpose
n Experimental research – Research measuring causality, or the changing of one variable to observe the effecton another, whilst other extraneous variables are kept constant
n Coding – The process of allocating codes to responses collected during fieldwork, facilitating analysis of data(MRS, 2003)
n Exploratory research – Research intended to develop initial ideas or insights and to provide direction for anyfurther research
n Fieldwork – The collection of primary data from external sources by means of surveys, observation andexperiment
n Longitudinal research – Data collection over time to examine trends.
n Causal research – Research that examines whether one variable causes or determines the value of anothervariable
n Descriptive research – Research studies that describe what’s happening in a market without potentiallyexplaining why it is happening
n Observation research – A non-verbal means of obtaining primary data as an alternative or complement toquestioning
MARKETING RESEARCH AND INFORMATION 41
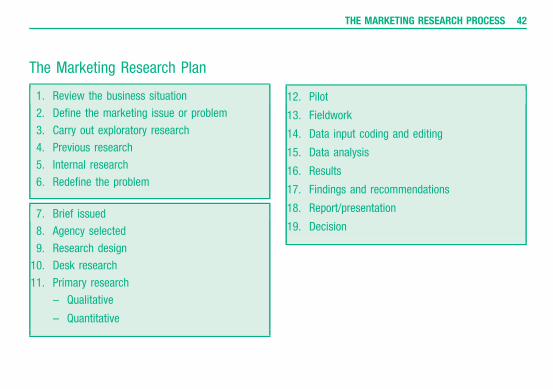
The Marketing Research Plan
1. Review the business situation
2. Define the marketing issue or problem
3. Carry out exploratory research
4. Previous research
5. Internal research
6. Redefine the problem
7. Brief issued
8. Agency selected
9. Research design
10. Desk research
11. Primary research
– Qualitative
– Quantitative
12. Pilot
13. Fieldwork
14. Data input coding and editing
15. Data analysis
16. Results
17. Findings and recommendations
18. Report/presentation
19. Decision
THE MARKETING RESEARCH PROCESS 42
Review the Business Situation
Start the process with a review of the current business position. Restating the values and missionof the business, identifying markets served and a unique selling proposition helps to focus theresearch process on the broader goals of the business. It may help to state the marketingobjectives of the business and summarize the current marketing plan, which should provide theunderpinning for all activities.
n Marketing decisions need to be made in response to a constantly changing business environment andresearch may be needed to inform these decisions
n The review of the business environment is an ongoing process and research requirements may reflect thedynamic nature of this environment
n Environmental scanning may be the responsibility of the research department
n The business case needs to be established, as resources within the marketing function are always underpressure. The research proposed needs to be fully informed by the business situation and an assessment ofrelative costs and benefits
MARKETING RESEARCH AND INFORMATION 43
Defining the Issues or Problem
Poor problem definition can lead to expensive and unnecessary work being carried out. Exploratory researchshould clarify the research problem. It is largely informal and may involve a range of techniques. It shouldinvolve discussions with those who are involved with the problem and its solution. The aim is to inform theprocess and to become ‘immersed’ in the problem and its potential solutions. An understanding of thecommercial constraints of carrying out research needs to be worked out. It is incumbent on the personmaking the business case to clarify the assumptions that they are making and explaining the rationale thatwill lead to increased sales. This information is needed for critical internal scrutiny
THE MARKETING RESEARCH PROCESS 44
Internal Research
This should be reviewed to see if the problem has been dealt with elsewhere. It may be that the solutionlies in the work that has been done in other departments. Internal research will involve the use of the MkISand the database. It may be that the problem can be solved at this stage.
Redefine the Problem
The output of this stage is a clear statement of the research problem that is agreed by all parties. After this,a brief can be written.
Research Design
Wilson identifies three types of marketingresearch. These are:
1. Exploratory
2. Conclusive – descriptive research
3. Conclusive – causal research
Whilst these are not mutually exclusive, they represent a continuum, from purely descriptive to the causal.
MARKETING RESEARCH AND INFORMATION 45
Desk Research
Desk or secondary research is information that has already been gathered for some other purpose. It is usuallyaccessible from a desk via the Intranet, online, or in hard copy.
Primary Research
Primary research is ‘new to the world research’. It uses methods such as telephone research, face-to-faceinterviews, or online research.
Quantitative Research
Quantitative research provides answers to the questions ‘who’ and ‘how many’, rather than the depth of insightas to ‘why’. It uses a structured approach to problem-solving, using a sample of the population to makestatistically based assumptions about the behaviour of the population as a whole. Quantitative research isusually gathered and recorded via a questionnaire. It can be delivered via a number of different media, includingface-to-face, telephone, mail, or online.
THE MARKETING RESEARCH PROCESS 46
The Pilot
Research should be piloted or tested to check that the data collection methods are sound. Pilots will helpwith the structure and sequencing of questions and may identify areas of questioning that have not beenconsidered
Fieldwork
Fieldwork covers the collection of observational, quantitative and qualitative data. The administration of amajor study may involve serious logistical considerations. The management of fieldwork is often given tospecialist field managers or fieldwork agencies. The process is important, as failure to adhere to thecorrect methodology at this stage may compromise the entire project
MARKETING RESEARCH AND INFORMATION 47
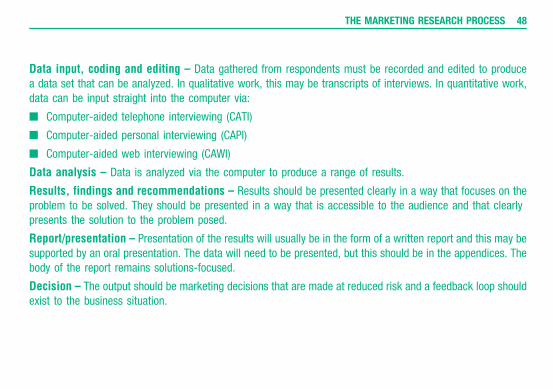
Data input, coding and editing – Data gathered from respondents must be recorded and edited to producea data set that can be analyzed. In qualitative work, this may be transcripts of interviews. In quantitative work,data can be input straight into the computer via:
n Computer-aided telephone interviewing (CATI)
n Computer-aided personal interviewing (CAPI)
n Computer-aided web interviewing (CAWI)
Data analysis – Data is analyzed via the computer to produce a range of results.
Results, findings and recommendations – Results should be presented clearly in a way that focuses on theproblem to be solved. They should be presented in a way that is accessible to the audience and that clearlypresents the solution to the problem posed.
Report/presentation – Presentation of the results will usually be in the form of a written report and this may besupported by an oral presentation. The data will need to be presented, but this should be in the appendices. Thebody of the report remains solutions-focused.
Decision – The output should be marketing decisions that are made at reduced risk and a feedback loop shouldexist to the business situation.
THE MARKETING RESEARCH PROCESS 48
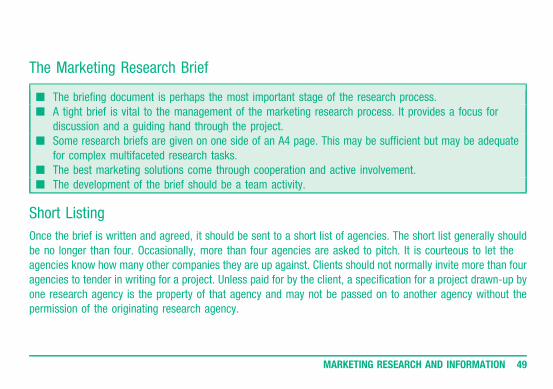
The Marketing Research Brief
n The briefing document is perhaps the most important stage of the research process.n A tight brief is vital to the management of the marketing research process. It provides a focus for
discussion and a guiding hand through the project.n Some research briefs are given on one side of an A4 page. This may be sufficient but may be adequate
for complex multifaceted research tasks.n The best marketing solutions come through cooperation and active involvement.n The development of the brief should be a team activity.
Short Listing
Once the brief is written and agreed, it should be sent to a short list of agencies. The short list generally shouldbe no longer than four. Occasionally, more than four agencies are asked to pitch. It is courteous to let theagencies know how many other companies they are up against. Clients should not normally invite more than fouragencies to tender in writing for a project. Unless paid for by the client, a specification for a project drawn-up byone research agency is the property of that agency and may not be passed on to another agency without thepermission of the originating research agency.
MARKETING RESEARCH AND INFORMATION 49
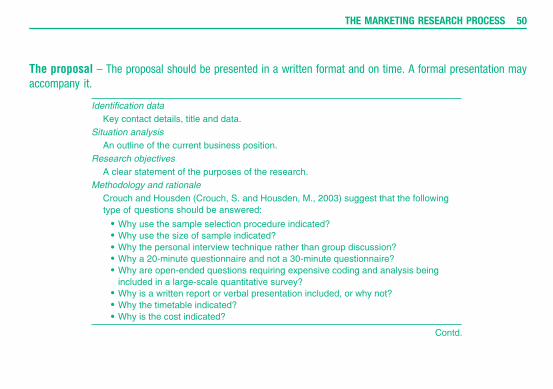
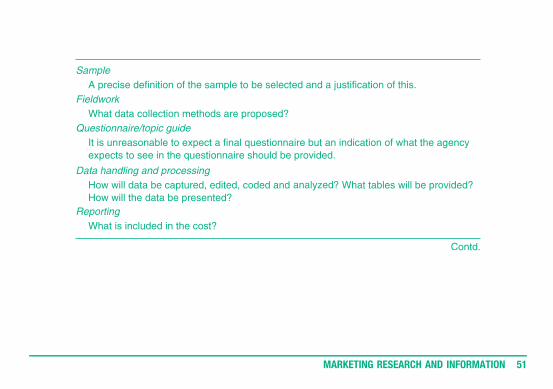
The proposal – The proposal should be presented in a written format and on time. A formal presentation mayaccompany it.
THE MARKETING RESEARCH PROCESS 50
MARKETING RESEARCH AND INFORMATION 51
THE MARKETING RESEARCH PROCESS 52
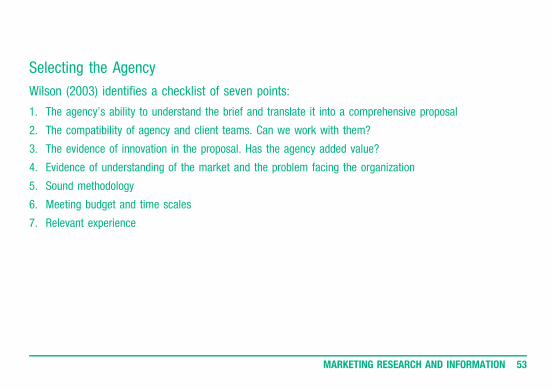
Selecting the Agency
Wilson (2003) identifies a checklist of seven points:
1. The agency’s ability to understand the brief and translate it into a comprehensive proposal
2. The compatibility of agency and client teams. Can we work with them?
3. The evidence of innovation in the proposal. Has the agency added value?
4. Evidence of understanding of the market and the problem facing the organization
5. Sound methodology
6. Meeting budget and time scales
7. Relevant experience
MARKETING RESEARCH AND INFORMATION 53
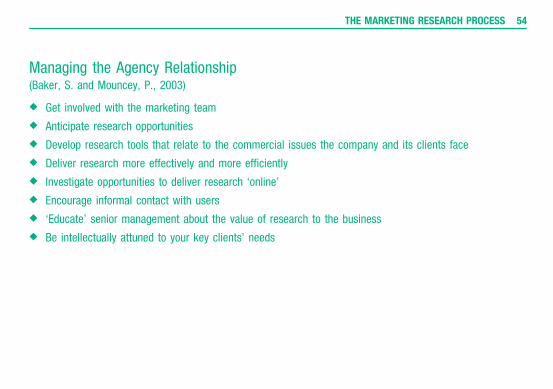
Managing the Agency Relationship(Baker, S. and Mouncey, P., 2003)
• Get involved with the marketing team
• Anticipate research opportunities
• Develop research tools that relate to the commercial issues the company and its clients face
• Deliver research more effectively and more efficiently
• Investigate opportunities to deliver research ‘online’
• Encourage informal contact with users
• ‘Educate’ senior management about the value of research to the business
• Be intellectually attuned to your key clients’ needs
THE MARKETING RESEARCH PROCESS 54
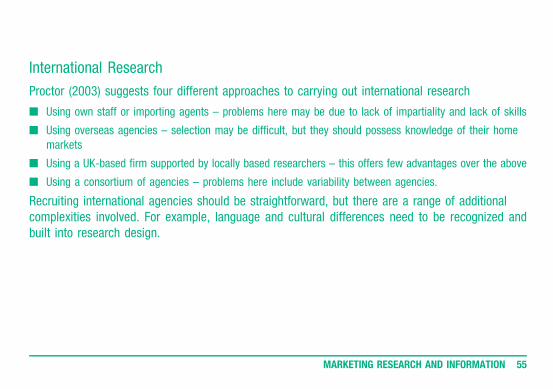
International Research
Proctor (2003) suggests four different approaches to carrying out international research
n Using own staff or importing agents – problems here may be due to lack of impartiality and lack of skills
n Using overseas agencies – selection may be difficult, but they should possess knowledge of their homemarkets
n Using a UK-based firm supported by locally based researchers – this offers few advantages over the above
n Using a consortium of agencies – problems here include variability between agencies.
Recruiting international agencies should be straightforward, but there are a range of additionalcomplexities involved. For example, language and cultural differences need to be recognized andbuilt into research design.
MARKETING RESEARCH AND INFORMATION 55
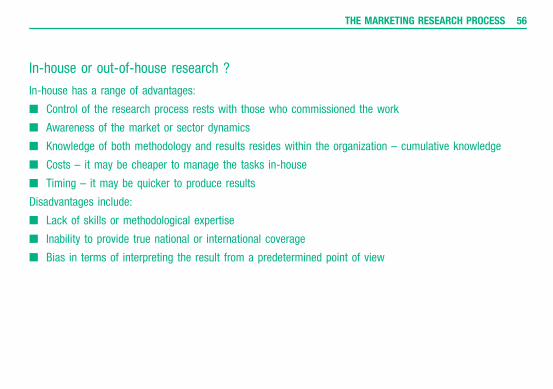
In-house or out-of-house research ?
In-house has a range of advantages:
n Control of the research process rests with those who commissioned the work
n Awareness of the market or sector dynamics
n Knowledge of both methodology and results resides within the organization – cumulative knowledge
n Costs – it may be cheaper to manage the tasks in-house
n Timing – it may be quicker to produce results
Disadvantages include:
n Lack of skills or methodological expertise
n Inability to provide true national or international coverage
n Bias in terms of interpreting the result from a predetermined point of view
THE MARKETING RESEARCH PROCESS 56
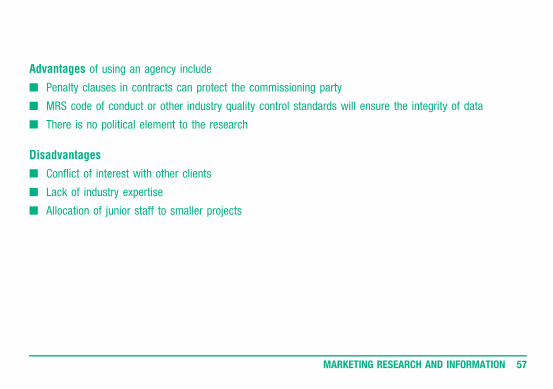
Advantages of using an agency include
n Penalty clauses in contracts can protect the commissioning party
n MRS code of conduct or other industry quality control standards will ensure the integrity of data
n There is no political element to the research
Disadvantages
n Conflict of interest with other clients
n Lack of industry expertise
n Allocation of junior staff to smaller projects
MARKETING RESEARCH AND INFORMATION 57
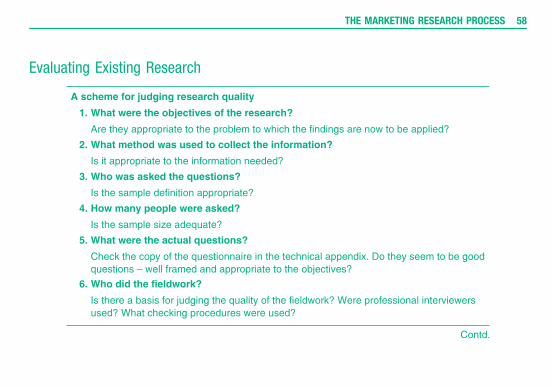
Evaluating Existing Research
THE MARKETING RESEARCH PROCESS 58
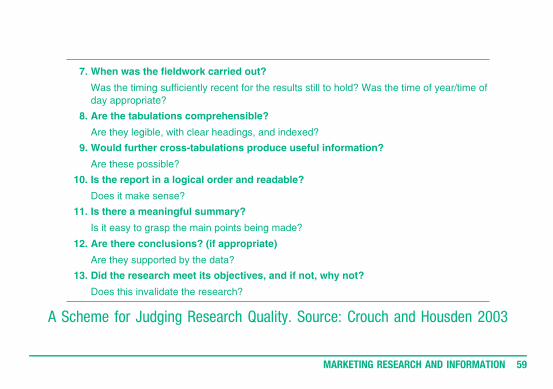
A Scheme for Judging Research Quality. Source: Crouch and Housden 2003
MARKETING RESEARCH AND INFORMATION 59
Hints and Tips
n The market research industry is made up of full service agencies, specialist service agencies, field agencies,data analysis services and independent consultants
n The industry is self-regulated by professional bodies such as the Market Research Society
n External suppliers can be useful as they may be more objective, have specialist skills, specialist facilities andexperience in the specific market/topic
n Base selection on experience, technical expertise, resources, reputation, communication skills and length oftime in industry
n The research proposal is the most important of the whole research project. The proposal is based on the briefgiven and provides a template and contract for the project
n The process of defining the initial research problem can be helped by internal and exploratory research. Theuse of research should be justified, where possible, by examining the cost of making a poor marketingdecision, compared to the anticipated profit from making a better marketing decision
n Start with the cheapest sources of information; that is, secondary or desk research. If this does not producethe required information, then primary research should be considered
n Qualitative work should precede and inform the development and use of quantitative methods
Go to www.cimvirtualinstitute.com and www.marketingonline.co.uk for additional support and guidance
THE MARKETING RESEARCH PROCESS 60
USING SECONDARYRESEARCH
Syllabus Reference: 4.1, 4.2
On completing this unit you will be able:
l To define secondary marketing researchl To explain types of secondary datal To understand where to find secondary datal To understand the limitations and strengths of secondary researchl To look for data onlinel To understand the applications of secondary research
Unit 5
MARKETING RESEARCH AND INFORMATION 61
Key Definitions
n External data – Data that is held by external organizations
n Internet – A network of computers
n World Wide Web – An Internet protocol supervised by the world wide web consortium at www.w3.org
n Intranet – A closed private company network based on web technology
n Extranet – A process that shares information from internal sources with selected external organizations
n Search engines – Internet-based tools for searching for Uniform Resource Location (URL) or web addresses
n Newsgroups – Web-based bulletin board services
n Chat rooms – Locations on the Internet enabling web-based text or video-based real time interaction
n ISP – Internet service provider
Crouch and Housden (Crouch, S. and Housden, M., 2003) define secondary desk research as ‘data that hasalready been published by someone else, at some other time period, usually for some other reason than thepresent researcher has in mind. The researcher is therefore a secondary user of already existing data which canbe obtained and worked on at a desk’
USING SECONDARY RESEARCH 62
The strengths and weaknesses of secondary data
Strengths
n It is cheap or free of charge. Costs vary, but very often a full report on markets or market sectors can be puttogether very quickly and cheaply.
n It may provide an answer to the problem – this will save enormous time and effort.
n It can guide or provide direction for primary work.
n It can suggest methodologies for data collection.
n It can indicate problems with particular methodologies.
n It can provide historic or comparative data to enable longitudinal studies.
MARKETING RESEARCH AND INFORMATION 63
Weaknesses
n It is not related to the research question and the temptation may be to force the data to fit the question.
n It may not be directly comparable. This is particularly the case in international markets where markets maybe defined differently.
n Data may be incomplete.
n It may not be available. It may be that there are certain markets that are not adequately covered.
n The data may have been gathered for a particular purpose. Production statistics in certain markets areunreliable. Data may be presented to portray a company or government in a more favourable light.
n Data for international markets may be more expensive and unreliable.
n Data for international markets may be in a foreign language. Translating costs in business markets areexpensive.
n Time series data may be interrupted by definition changes, e.g., in the way inflation is calculated.
Both Wilson (2003) and Crouch and Housden (2003) have significant resources outlined in the relevant chapters.
USING SECONDARY RESEARCH 64
Evaluating secondary data
When looking at published research reports, the user should ask the following questions:
n Who published the study? Was it a national government? Was it a trade association?
n What is the nature of the organization? Is the publisher of the data the same as the organization thatcollected the data?
n For what purpose? Is the study designed to sell a service? Is it designed to counter negative publicity? Is itdesigned to generate publicity?
n When was the data gathered? Is it relevant?
n How was the data collected? Was the data capture mechanism reliable? Was it a self-selecting sample?
n Who collected the data? Are they independent? Are they trained? Are they members of a professional body?What sample was used?
n How reliable is the data?
n Is raw data presented?
n Can I replicate the study? Is the methodology included? Can I test the data for accuracy?
n Is the data comparable?
MARKETING RESEARCH AND INFORMATION 65
Hints and Tips
n Both Wilson (Wilson, A., 2003) and Crouch and Housden (Crouch, S. and Housden, M., 2003) have significantresources outlined in the relevant chapters. You should scan these chapters and add relevant websites toyour list of favourites
n Secondary data is information that has been previously gathered for some purpose other than the currentproject. It helps to clarify the requirements, enables more insightful interpretation of primary data, providescomparative data, and provides information that cannot be obtained through primary research
n Secondary data is faster and less expensive to collect – the Internet has improved this still further, but itslimitations include availability, applicability, accuracy and comparability and its use should be evaluatedbefore going ahead
Go to www.cimvirtualinstitute.com and www.marketingonline.co.uk for additional support and guidance
USING SECONDARY RESEARCH 66
OBSERVATION RESEARCHSyllabus Reference:
After completing this unit you will be able to:
n Define observational research
n Understand the methods of observational research
n Understand and define the role of audits in marketing research
n Understand the application of mystery shopping techniques
n Identify online observation techniques
n Outline the ethical issues in observational research
Key definition
n Observation – A non-verbal means of obtaining primary data as an alternative or complement to questioning(MRS, 2003).
n Panels – A permanent representative sample, maintained by a market research agency, from whichinformation is obtained on more than one occasion, either for continuous research or for ad hoc projects(MRS, 2003).
Contd.
Unit 6
MARKETING RESEARCH AND INFORMATION 67
n Audit – The measurement of product volume and value through the distribution network. Audit may bewholesale, retail or consumer.
n Mystery shopping – The use of individuals trained to observe, experience and measure the customer serviceprocess, by acting as a prospective customer and undertaking a series of predetermined tasks (MRS, 1997).
n Peoplemeter – The mechanical device used by BARB to collect data on TV audiences in the UK.
n EPOS – Electronic Point Of Sale equipment.
n Cookies – A file stored on your hard drive, used to identify your computer and other information, includingpreferences to another remote computer.
n Ethnographic research – Observation involving total immersion in the life of the subject.
Definitions of observation research
The MRS defines observation as ‘A non-verbal means of obtaining primary data as an alternative or complementto questioning’ (MRS, 2003). Wilson defines it as ‘a data gathering approach where information on the behaviourof people, objects and organizations is collected without any questions being asked of the participant’ (Wilson, A.,2003)
OBSERVATION RESEARCH 68
Observation strengths
n It is not dependent on the respondent’s memory. It records exactly what has happened, not what therespondent believes has happened.
n The potential for bias in research may be reduced, as the researcher is the witness of behaviour rather thanactively asking for information – the way an interviewer asks for information can influence responses.
n Mechanical recording of observed behaviour may reduce the incidence of reporting errors.
n Observation does not rely on the verbal skills of a respondent to describe the behaviour.
n Observation measures what has happened, not what respondents say that they will do in a certain situation.
n Observation can counter the high refusal rates in some markets.
n Observation can be used to monitor behaviour preceding an action, e.g., picking up and looking at competingproducts before making a final decision.
n Observation does not interfere with the respondents’ day-to-day life. It is their activity that is of interest. Theydo not have to fill in diaries or complete questionnaires.
MARKETING RESEARCH AND INFORMATION 69
Disadvantages
n Observation does not measure the reasons for certain behaviour. It cannot uncover motivation or attitudes.
n Observation cannot measure the likelihood of repeat behaviour.
n Only public behaviour can be assessed. Private behaviour is very difficult to research in this way, althoughefforts have been made to manage this process.
Observation methodologies
There are a range of observational techniques that are used throughout the research industry.
OBSERVATION RESEARCH 70
Audits and scanner-based observation
An audit measures product movement and consumption through the value chain.
There are three types of audit – wholesale, retail and home. The use of Electronic Point Of Sale (EPOS) and hand-held scanning devices has changed this sector of the market significantly over the last 10 years.
Audits have been in place for some time, but the process of carrying them out was far more time consumingthan it is today. The use of EPOS technology has significantly reduced the amount of time taken to produceresults. Audit data can produce a huge range of analysis, and the services of AC Neilsen and TN Sofres providethe raw material for the marketing management of the retail and grocery marketing sector. The data includes:
n Market share
n Brand share
n Brand loyalty
n Category loyalty
n Retail sector analysis
n Retail share
n Retail price checks
n Average basket
n Sales promotion responses, etc.
MARKETING RESEARCH AND INFORMATION 71
Media measurement
The measurement of media is a key element of observation research. The most important is the Broadcaster’sAudience Research Board (BARB), which provides the measurement service for television viewing in the UK.Other media are audited in different ways – some are based on observation, some on other research methods.
Mystery shopping
The use of individuals trained to observe, experience and measure the customer service process, by acting as aprospective customer and undertaking a series of pre-determined tasks (MRS, 1997). This may be done bycompanies assessing the activities of competitors in the market, or by companies assessing the performance oftheir own sales staff.
Wilson (Wilson, A., 2003) identifies three main purposes for mystery shopping:
1. To act as a diagnostic tool, identifying failings and weak points in service delivery
2. To encourage and reward staff
3. To assess competitors
OBSERVATION RESEARCH 72
Online observation
The use of cookies allows a website owner to identify repeat visits. A cookie is a text file placed on the browser’scomputer that allows the browser’s computer to be identified on subsequent visits. A cookie may contain thecomputer’s address or the details of a customer registration. This means that, when the customer logs on, apersonalized greeting can be made or passwords provided. Most online retailers use this system, e.g. Amazonwill drive content to particular customers, based on their previous behaviour.
Browser behaviour through the site can also be captured and used.
Ethics in observation research
There are clearly significant ethical considerations in the use of observation research. The basic rule is that, ifobservation is to take place in a situation in which behaviour could not usually be observed, then permissionshould be asked.
MARKETING RESEARCH AND INFORMATION 73
Hints and Tips
n Observation measures behaviour, not reasons for the behaviour
n Mystery shopping measures service delivery, often retail, researchers work to a brief as a customer, aims tobe objective and collect facts, and more than one visit may be required
n Observation can be carried out mechanically through scanners, electronic TV viewing meters, Internetcookies, and security or CCTV cameras
n There are ethical issues that arise in observation research and ‘informed consent’ should be the principle toguide the observation of behaviour
n Make sure you are aware of the strengths and weaknesses of different approaches and for what purposesthey are most appropriate
n Collect actual examples of how observation research is used
Go to www.cimvirtualinstitute.com and www.marketingonline.co.uk for additional support and guidance
OBSERVATION RESEARCH 74
QUALITATIVE RESEARCHSyllabus Reference: 4.4–4.6
After completing this unit you will be able to:
n Define qualitative data
n Identify and apply methods for collecting qualitative data
n Understand the process of analyzing qualitative data
n Understand the techniques of online qualitative research
n Understand how to use qualitative research to inform marketing decision-making
Key definitions
n Projective techniques – A form of disguised questioning that encourages participants to attribute theirfeelings, beliefs or motivations. Examples of projective techniques are word association, sentencecompletion and thematic apperception tests (ESOMAR, 2003)
n Moderator – An individual who facilitates but does not influence a group discussion
Contd.
Unit 7
MARKETING RESEARCH AND INFORMATION 75
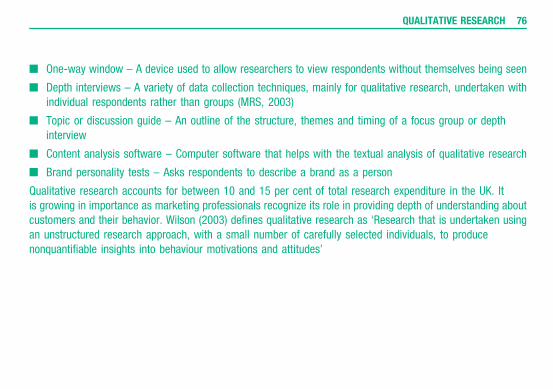
n One-way window – A device used to allow researchers to view respondents without themselves being seen
n Depth interviews – A variety of data collection techniques, mainly for qualitative research, undertaken withindividual respondents rather than groups (MRS, 2003)
n Topic or discussion guide – An outline of the structure, themes and timing of a focus group or depthinterview
n Content analysis software – Computer software that helps with the textual analysis of qualitative research
n Brand personality tests – Asks respondents to describe a brand as a person
Qualitative research accounts for between 10 and 15 per cent of total research expenditure in the UK. Itis growing in importance as marketing professionals recognize its role in providing depth of understanding aboutcustomers and their behavior. Wilson (2003) defines qualitative research as ‘Research that is undertaken usingan unstructured research approach, with a small number of carefully selected individuals, to producenonquantifiable insights into behaviour motivations and attitudes’
QUALITATIVE RESEARCH 76
Data Collection Techniques in Qualitative Research
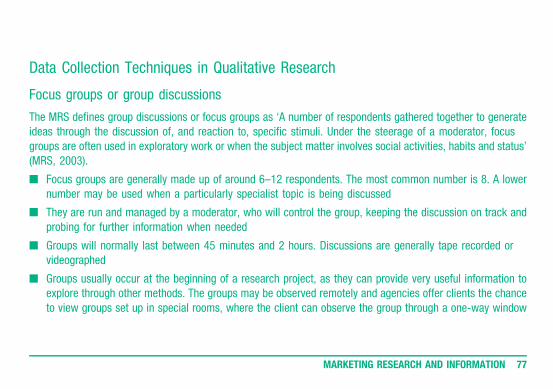
Focus groups or group discussions
The MRS defines group discussions or focus groups as ‘A number of respondents gathered together to generateideas through the discussion of, and reaction to, specific stimuli. Under the steerage of a moderator, focusgroups are often used in exploratory work or when the subject matter involves social activities, habits and status’(MRS, 2003).
n Focus groups are generally made up of around 6–12 respondents. The most common number is 8. A lowernumber may be used when a particularly specialist topic is being discussed
n They are run and managed by a moderator, who will control the group, keeping the discussion on track andprobing for further information when needed
n Groups will normally last between 45 minutes and 2 hours. Discussions are generally tape recorded orvideographed
n Groups usually occur at the beginning of a research project, as they can provide very useful information toexplore through other methods. The groups may be observed remotely and agencies offer clients the chanceto view groups set up in special rooms, where the client can observe the group through a one-way window
MARKETING RESEARCH AND INFORMATION 77
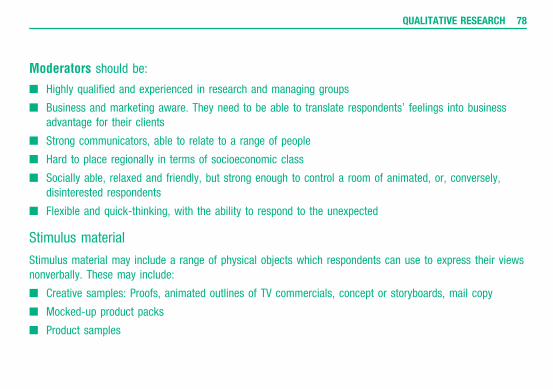
Moderators should be:
n Highly qualified and experienced in research and managing groups
n Business and marketing aware. They need to be able to translate respondents’ feelings into businessadvantage for their clients
n Strong communicators, able to relate to a range of people
n Hard to place regionally in terms of socioeconomic class
n Socially able, relaxed and friendly, but strong enough to control a room of animated, or, conversely,disinterested respondents
n Flexible and quick-thinking, with the ability to respond to the unexpected
Stimulus material
Stimulus material may include a range of physical objects which respondents can use to express their viewsnonverbally. These may include:
n Creative samples: Proofs, animated outlines of TV commercials, concept or storyboards, mail copy
n Mocked-up product packs
n Product samples
QUALITATIVE RESEARCH 78
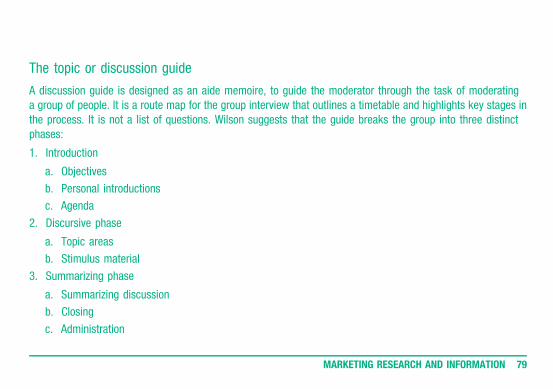
The topic or discussion guide
A discussion guide is designed as an aide memoire, to guide the moderator through the task of moderatinga group of people. It is a route map for the group interview that outlines a timetable and highlights key stages inthe process. It is not a list of questions. Wilson suggests that the guide breaks the group into three distinctphases:
1. Introduction
a. Objectives
b. Personal introductions
c. Agenda
2. Discursive phase
a. Topic areas
b. Stimulus material
3. Summarizing phase
a. Summarizing discussion
b. Closing
c. Administration
MARKETING RESEARCH AND INFORMATION 79
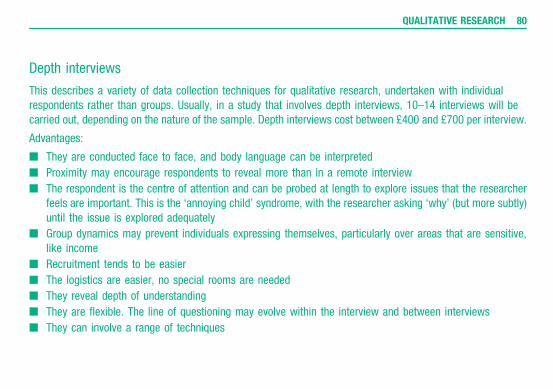
Depth interviews
This describes a variety of data collection techniques for qualitative research, undertaken with individualrespondents rather than groups. Usually, in a study that involves depth interviews, 10–14 interviews will becarried out, depending on the nature of the sample. Depth interviews cost between £400 and £700 per interview.
Advantages:
n They are conducted face to face, and body language can be interpreted
n Proximity may encourage respondents to reveal more than in a remote interview
n The respondent is the centre of attention and can be probed at length to explore issues that the researcherfeels are important. This is the ‘annoying child’ syndrome, with the researcher asking ‘why’ (but more subtly)until the issue is explored adequately
n Group dynamics may prevent individuals expressing themselves, particularly over areas that are sensitive,like income
n Recruitment tends to be easier
n The logistics are easier, no special rooms are needed
n They reveal depth of understanding
n They are flexible. The line of questioning may evolve within the interview and between interviews
n They can involve a range of techniques
QUALITATIVE RESEARCH 80
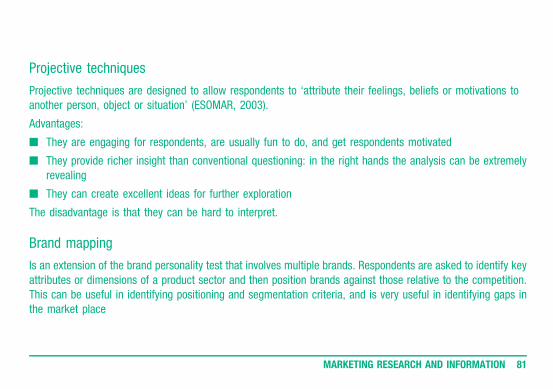
Projective techniques
Projective techniques are designed to allow respondents to ‘attribute their feelings, beliefs or motivations toanother person, object or situation’ (ESOMAR, 2003).
Advantages:
n They are engaging for respondents, are usually fun to do, and get respondents motivated
n They provide richer insight than conventional questioning: in the right hands the analysis can be extremelyrevealing
n They can create excellent ideas for further exploration
The disadvantage is that they can be hard to interpret.
Brand mapping
Is an extension of the brand personality test that involves multiple brands. Respondents are asked to identify keyattributes or dimensions of a product sector and then position brands against those relative to the competition.This can be useful in identifying positioning and segmentation criteria, and is very useful in identifying gaps inthe market place
MARKETING RESEARCH AND INFORMATION 81
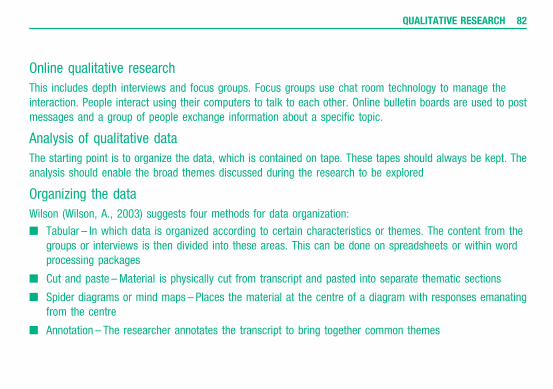
Online qualitative research
This includes depth interviews and focus groups. Focus groups use chat room technology to manage theinteraction. People interact using their computers to talk to each other. Online bulletin boards are used to postmessages and a group of people exchange information about a specific topic.
Analysis of qualitative data
The starting point is to organize the data, which is contained on tape. These tapes should always be kept. Theanalysis should enable the broad themes discussed during the research to be explored
Organizing the data
Wilson (Wilson, A., 2003) suggests four methods for data organization:
n Tabular – In which data is organized according to certain characteristics or themes. The content from thegroups or interviews is then divided into these areas. This can be done on spreadsheets or within wordprocessing packages
n Cut and paste –Material is physically cut from transcript and pasted into separate thematic sections
n Spider diagrams or mind maps – Places the material at the centre of a diagram with responses emanatingfrom the centre
n Annotation – The researcher annotates the transcript to bring together common themes
QUALITATIVE RESEARCH 82
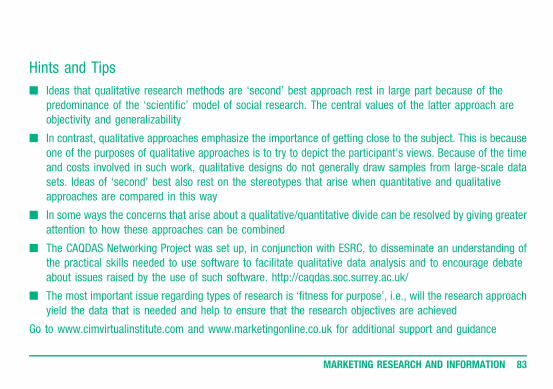
Hints and Tips
n Ideas that qualitative research methods are ‘second’ best approach rest in large part because of thepredominance of the ‘scientific’ model of social research. The central values of the latter approach areobjectivity and generalizability
n In contrast, qualitative approaches emphasize the importance of getting close to the subject. This is becauseone of the purposes of qualitative approaches is to try to depict the participant’s views. Because of the timeand costs involved in such work, qualitative designs do not generally draw samples from large-scale datasets. Ideas of ‘second’ best also rest on the stereotypes that arise when quantitative and qualitativeapproaches are compared in this way
n In some ways the concerns that arise about a qualitative/quantitative divide can be resolved by giving greaterattention to how these approaches can be combined
n The CAQDAS Networking Project was set up, in conjunction with ESRC, to disseminate an understanding ofthe practical skills needed to use software to facilitate qualitative data analysis and to encourage debateabout issues raised by the use of such software. http://caqdas.soc.surrey.ac.uk/
n The most important issue regarding types of research is ‘fitness for purpose’, i.e., will the research approachyield the data that is needed and help to ensure that the research objectives are achieved
Go to www.cimvirtualinstitute.com and www.marketingonline.co.uk for additional support and guidance
MARKETING RESEARCH AND INFORMATION 83
QUANTITATIVE DATASyllabus Reference: 4.4–4.6
After completing this unit you will be able to:
n Define quantitative datan Understand the methods for collecting quantitative datan Identify online methods for online quantitative data capturen Define and describe the use of CAPI, CATI and CAWIn Explore the range of applications enabled by quantitative research
Key definitions
n CAPI – Computer Aided Personal interviewingn CAWI – Computer Aided Web interviewingn CATI – Computer Aided Telephone interviewingn Omnibus surveys – ‘A survey covering a number of topics, usually for different clients. The samples tend to
be nationally representative and composed of types of people for which there is a general demand. Clientsare charged by the market research agency on the basis of the questionnaire space or the number ofquestions required’ (MRS, 2003)
Unit 8
What is quantitative data?
Wilson identifies five key characteristics of quantitative data:
n Data gathering is more structured
n Research involves larger samples than qualitative research
n The data gathered can provide answers that will quantify the incidence of particular behavior motivations andattitudes in the population under consideration
n Studies can be more easily replicated and direct comparisons can be made between studies
n Analysis is statistical in nature and will usually be done with the help of computer software
Survey methods
Surveys are defined by the MRS as ‘The systematic collection, analysis and interpretation of information aboutsome aspect of study. In market research, the term is applied particularly to the collection of information bymeans of sampling and interviews with the selected individuals’ (MRS, 2003)
MARKETING RESEARCH AND INFORMATION 85
Face-to-face interviews
These are interviews that are carried out with respondents in face-to-face contact with the interviewer; resultsare recorded on paper or digitally on a Personal Digital Assistant, palmtop or laptop computer. These can bedistinguished from interviewer-administered surveys that are carried out remotely via the telephone or a ‘helpme’ button on a web page
In-home or doorstep interviews
These are interviews carried out at the home of the respondent. These may be important if the sampleis determined by post code or type of dwelling. They have the advantage of putting the respondent at their easebut are generally hard to manage
QUANTITATIVE DATA 86
Street interviews
These are perhaps the most visible forms of marketing research. Street interviewing has a number ofadvantages:
n They are less expensive than home interviews
n They allow respondents who conform to quota specifications to be identified and approached – e.g. womenwith children or older men
Disadvantages include:
n Some shopping centres charge a fee or do not allow researchers to interview customers
n Respondents are unlikely to stop in the open air if it is raining
n Interviews need to be as short as possible
n There are many distractions to the respondent – e.g. children or friends who are impatient
CAPI
Computer Assisted Personal Interviewing is conducted face-to-face, usually employing Personal DigitalAssistants (PDAs) and, if these are connected to a mobile telephone network, results can be uploadedimmediately
MARKETING RESEARCH AND INFORMATION 87
Changing environment
n There is far greater acceptance of the telephone as a means of communication. Younger people are verycomfortable on the telephone. It is common to see people using their mobile phones to talk to each other,even when they are only 30 metres away from each other
n Over 30 per cent of Motor Insurance policies are sold over the telephone
n Two per cent of the entire UK work force is employed in the ‘call centre’ industry. This is more than mining,fishing and agriculture combined
n The UK is the largest user of call centres in Europe, employing 39 per cent of the total agents in Europe
n The UK has 5000–16,000 call centres, depending on the definition used
n Mobile phones and mobile Internet mean that research can use a range of methods to reach and stimulaterespondents
QUANTITATIVE DATA 88
Telephone
Advantages:
n The cost at around £10–£20 per interview is lower than face-to-face. Larger surveys can be administered viaa call centre, far cheaper than this at around £5 per call. The use of automated research is more common inthe USA but it is possible to run a research programme using voice recognition software.
n Control is much easier. The latest call centre software allows for call and interviews to be recorded ormonitored by research managers.
n Bias due to nonverbal influence is removed and verbal influence can be controlled through the monitoringprocess.
n It is good for geographically dispersed samples. These can be accessed through the telephone without theneed for the interviewer to travel. This saves time and money
n It is fast
n It is convenient for the interviewer and the respondent. Calls may be made that allow the interviewer to callback at a convenient time to deliver the interview
n Third generation mobile phones, mobile Internet and SMS text messaging, have extended the capability ofthe phone as a medium for data capture
MARKETING RESEARCH AND INFORMATION 89
Disadvantages:
n Generally the telephone has lower response rates than face-to-face interviews
n Respondents find it easier to say ‘no’ on the telephone
n They may screen their calls
n Research design is restricted. The use of stimuli is limited, even if the interview is carried out via mobileInternet. The length of the interview has to be shorter than face-to-face interviews, in order to maintain theinterest of the respondent
n Some social classes have a greater preponderance of ex-directory numbers
n Access to mobile telephone numbers may be difficult to obtain
n The use of cold calling by certain market sectors has created a problem for market researchers
n In certain international markets, issues of telephone access might be a concern
CATI – Computer Assisted Interviewing, over the telephone
CATI can facilitate the design administration and analysis of telephone interviewing
Questionnaires can be customized and verbal comments can be recorded
Inconsistencies can be highlighted and the researcher can probe to correct the inconsistency. Automated dialingallows for efficient management of the interviewer
QUANTITATIVE DATA 90
Web-based interviews
Whilst not strictly interview administered, the use of ‘call me’ or ‘help me’ buttons on web-administeredquestionnaires allows a degree of interviewer assistance to take place. ‘Help me’ buttons allow a pop-updialogue screen in which questions can be asked and answered. ‘Phone me’ allows the respondent to becontacted by telephone and helped through the questionnaire. In some instances, it is possible for a contactcentre to see the respondent’s screen. Use of CAWI is helping this process
Online methods have a number of advantages:
n They are cheap to administer, design, deliver and analyze
n They are flexible in content and can include image and sound files
n They are fast to administer and to report on
n They have immediate and low-cost global reach
n They can replicate customer behaviour in both consumer and business markets
n They can be used automatically as pop up as a browser scrolls over a part of the web page
n They are easy to control
n They can be completed at the respondent’s convenience
MARKETING RESEARCH AND INFORMATION 91
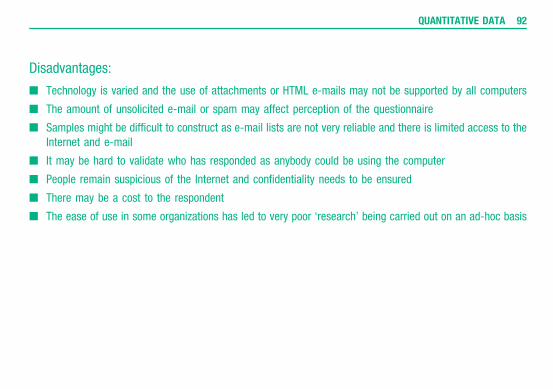
Disadvantages:
n Technology is varied and the use of attachments or HTML e-mails may not be supported by all computers
n The amount of unsolicited e-mail or spam may affect perception of the questionnaire
n Samples might be difficult to construct as e-mail lists are not very reliable and there is limited access to theInternet and e-mail
n It may be hard to validate who has responded as anybody could be using the computer
n People remain suspicious of the Internet and confidentiality needs to be ensured
n There may be a cost to the respondent
n The ease of use in some organizations has led to very poor ‘research’ being carried out on an ad-hoc basis
QUANTITATIVE DATA 92
Hints and Tips
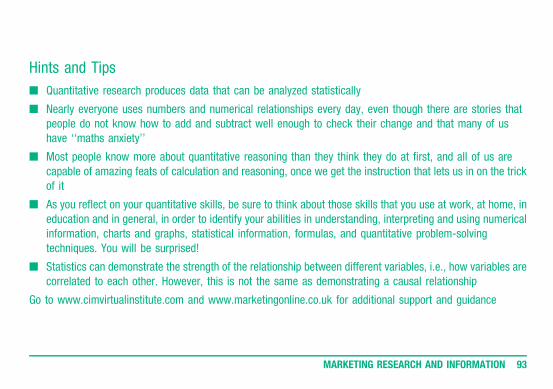
n Quantitative research produces data that can be analyzed statistically
n Nearly everyone uses numbers and numerical relationships every day, even though there are stories thatpeople do not know how to add and subtract well enough to check their change and that many of ushave ‘‘maths anxiety’’
n Most people know more about quantitative reasoning than they think they do at first, and all of us arecapable of amazing feats of calculation and reasoning, once we get the instruction that lets us in on the trickof it
n As you reflect on your quantitative skills, be sure to think about those skills that you use at work, at home, ineducation and in general, in order to identify your abilities in understanding, interpreting and using numericalinformation, charts and graphs, statistical information, formulas, and quantitative problem-solvingtechniques. You will be surprised!
n Statistics can demonstrate the strength of the relationship between different variables, i.e., how variables arecorrelated to each other. However, this is not the same as demonstrating a causal relationship
Go to www.cimvirtualinstitute.com and www.marketingonline.co.uk for additional support and guidance
MARKETING RESEARCH AND INFORMATION 93
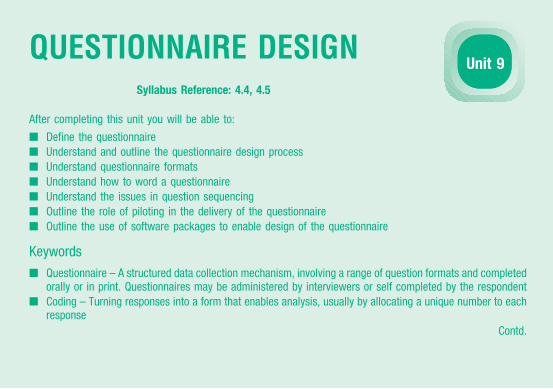
QUESTIONNAIRE DESIGNSyllabus Reference: 4.4, 4.5
After completing this unit you will be able to:
n Define the questionnaire
n Understand and outline the questionnaire design process
n Understand questionnaire formats
n Understand how to word a questionnaire
n Understand the issues in question sequencing
n Outline the role of piloting in the delivery of the questionnaire
n Outline the use of software packages to enable design of the questionnaire
Keywords
n Questionnaire – A structured data collection mechanism, involving a range of question formats and completedorally or in print. Questionnaires may be administered by interviewers or self completed by the respondent
n Coding – Turning responses into a form that enables analysis, usually by allocating a unique number to eachresponse
Contd.
Unit 9
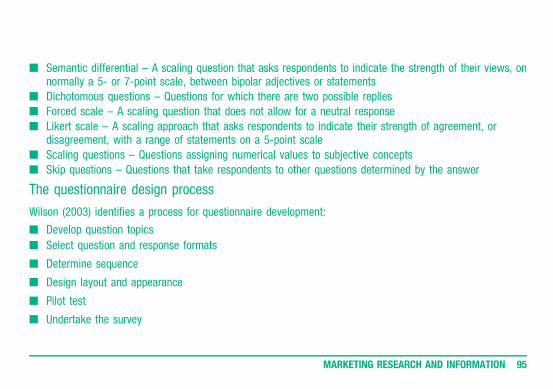
n Semantic differential – A scaling question that asks respondents to indicate the strength of their views, onnormally a 5- or 7-point scale, between bipolar adjectives or statements
n Dichotomous questions – Questions for which there are two possible replies
n Forced scale – A scaling question that does not allow for a neutral response
n Likert scale – A scaling approach that asks respondents to indicate their strength of agreement, ordisagreement, with a range of statements on a 5-point scale
n Scaling questions – Questions assigning numerical values to subjective concepts
n Skip questions – Questions that take respondents to other questions determined by the answer
The questionnaire design process
Wilson (2003) identifies a process for questionnaire development:
n Develop question topics
n Select question and response formats
n Determine sequence
n Design layout and appearance
n Pilot test
n Undertake the survey
MARKETING RESEARCH AND INFORMATION 95
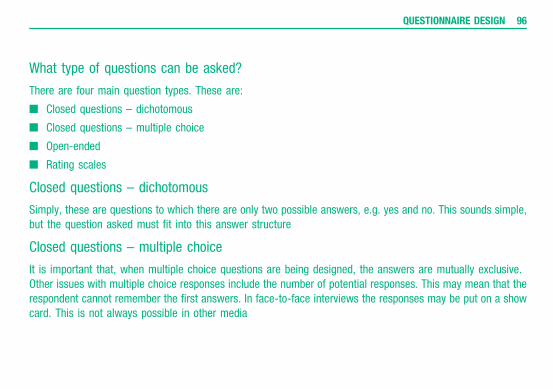
What type of questions can be asked?
There are four main question types. These are:
n Closed questions – dichotomous
n Closed questions – multiple choice
n Open-ended
n Rating scales
Closed questions – dichotomous
Simply, these are questions to which there are only two possible answers, e.g. yes and no. This sounds simple,but the question asked must fit into this answer structure
Closed questions – multiple choice
It is important that, when multiple choice questions are being designed, the answers are mutually exclusive.Other issues with multiple choice responses include the number of potential responses. This may mean that therespondent cannot remember the first answers. In face-to-face interviews the responses may be put on a showcard. This is not always possible in other media
QUESTIONNAIRE DESIGN 96
Open-ended questions
n Open-ended questions are questions in which an answer is not suggested. The respondent is free to respondin any way. The problem with open questions is analysis. If there are many categories of answers, then itmay be hard to code the responses and it may reduce the effectiveness of the analysis
n One way around this is to pilot the survey and produce a pre-coded list of potential responses, which allowsthe interviewer to interpret the response and code it
n Open-ended questions can be very useful and the difficulties in managing them within a questionnaire arenot huge. Their value can certainly outweigh these difficulties
Likert scales
The Likert scale asks respondents to indicate their level of agreement with a range of statements. Responses arescored from 1 to 5 and the result is an average score for each statement, indicating the level of agreement withthe statement
MARKETING RESEARCH AND INFORMATION 97
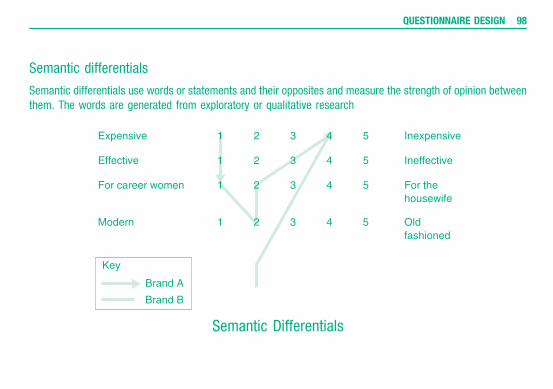
Semantic differentials
Semantic differentials use words or statements and their opposites and measure the strength of opinion betweenthem. The words are generated from exploratory or qualitative research
Semantic Differentials
QUESTIONNAIRE DESIGN 98
Select wording and phrasing
Avoid:
n Ambiguity
n Two questions in one
n Leading or loaded questions
n Making assumptions
n Generalization
n Negative questions
n Hypothetical questions
Sequencing
n Wilson suggests that the questionnaires should be funnel sequenced, i.e. going from the broad to the narrow.The interviewer asks the most general questions about the subject and moves to narrower and more focusedquestions
MARKETING RESEARCH AND INFORMATION 99
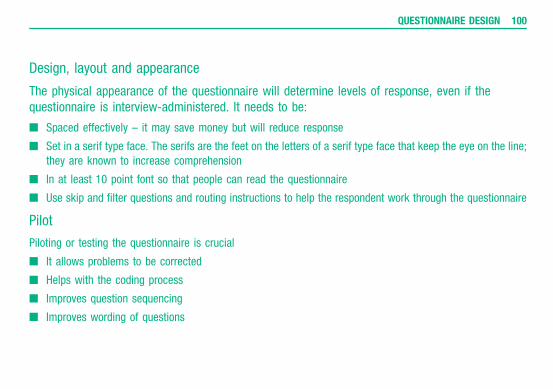
Design, layout and appearance
The physical appearance of the questionnaire will determine levels of response, even if thequestionnaire is interview-administered. It needs to be:
n Spaced effectively – it may save money but will reduce response
n Set in a serif type face. The serifs are the feet on the letters of a serif type face that keep the eye on the line;they are known to increase comprehension
n In at least 10 point font so that people can read the questionnaire
n Use skip and filter questions and routing instructions to help the respondent work through the questionnaire
Pilot
Piloting or testing the questionnaire is crucial
n It allows problems to be corrected
n Helps with the coding process
n Improves question sequencing
n Improves wording of questions
QUESTIONNAIRE DESIGN 100
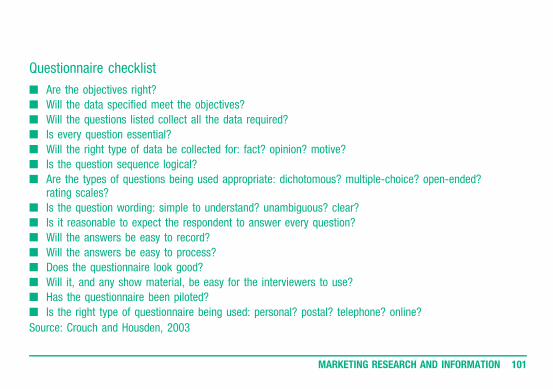
Questionnaire checklist
n Are the objectives right?
n Will the data specified meet the objectives?
n Will the questions listed collect all the data required?
n Is every question essential?
n Will the right type of data be collected for: fact? opinion? motive?
n Is the question sequence logical?
n Are the types of questions being used appropriate: dichotomous? multiple-choice? open-ended?rating scales?
n Is the question wording: simple to understand? unambiguous? clear?
n Is it reasonable to expect the respondent to answer every question?
n Will the answers be easy to record?
n Will the answers be easy to process?
n Does the questionnaire look good?
n Will it, and any show material, be easy for the interviewers to use?
n Has the questionnaire been piloted?
n Is the right type of questionnaire being used: personal? postal? telephone? online?
Source: Crouch and Housden, 2003
MARKETING RESEARCH AND INFORMATION 101
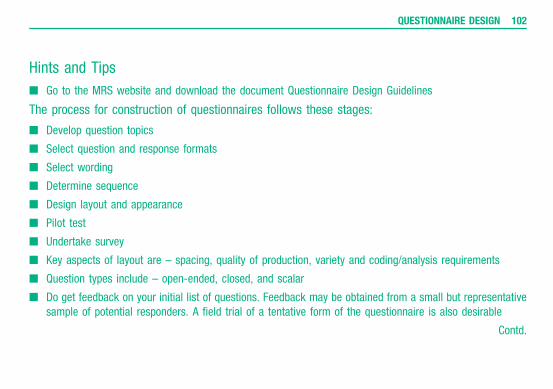
Hints and Tips
n Go to the MRS website and download the document Questionnaire Design Guidelines
The process for construction of questionnaires follows these stages:
n Develop question topics
n Select question and response formats
n Select wording
n Determine sequence
n Design layout and appearance
n Pilot test
n Undertake survey
n Key aspects of layout are – spacing, quality of production, variety and coding/analysis requirements
n Question types include – open-ended, closed, and scalar
n Do get feedback on your initial list of questions. Feedback may be obtained from a small but representativesample of potential responders. A field trial of a tentative form of the questionnaire is also desirable
Contd.
QUESTIONNAIRE DESIGN 102
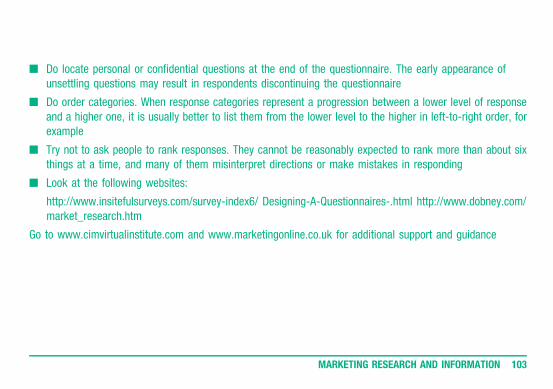
n Do locate personal or confidential questions at the end of the questionnaire. The early appearance ofunsettling questions may result in respondents discontinuing the questionnaire
n Do order categories. When response categories represent a progression between a lower level of responseand a higher one, it is usually better to list them from the lower level to the higher in left-to-right order, forexample
n Try not to ask people to rank responses. They cannot be reasonably expected to rank more than about sixthings at a time, and many of them misinterpret directions or make mistakes in responding
n Look at the following websites:
http://www.insitefulsurveys.com/survey-index6/ Designing-A-Questionnaires-.html http://www.dobney.com/market_research.htm
Go to www.cimvirtualinstitute.com and www.marketingonline.co.uk for additional support and guidance
MARKETING RESEARCH AND INFORMATION 103
SAMPLINGSyllabus Reference: 4.6, 5.1
After completing this unit you will be able to:
n Define sampling
n Understand how to construct a sample for a survey
n Understand and identify the sampling process
n Understand and apply the statistical basis of sampling
n Understand and evaluate different sampling methods
n Understand the concepts of population, census and sample
n Understand how the sampling frame is constructed
Key definitions
n Sample – A part or subset of a population taken to be representative of the population as a whole
n Sampling frame – A list of the population of interest that is used to draw the sample in a survey
n Population – A population is the total number of people in any defined group of interest
Contd.
Unit 10
n Census – A survey of the entire population
n Confidence level – The probability that the true population value will fall within a known range
n Probability sampling – A sampling method that uses objective sample selection, so that every member of apopulation has a known probability of being selected
n Cluster sampling – A procedure in which clusters of population units are selected at random and then all orsome of the units in the chosen clusters are studied
n Non-probability sampling – Non-probability sampling involves a subjective selection of respondents.Therefore, the probability of selecting respondents is unknown
n Sample error – The error in a survey caused by using a sample to estimate the value of a parameter in thepopulation
n Systematic sampling – A probability sampling method, in which respondents are selected using a 1 in ‘n’approach
n Stratified random sampling – A probability sampling method, in which the sample is forced to containrespondents from each of the key segments of a population
n Standard deviation – A measurement of dispersion that calculates the average distance of the values in adata set from the mean value
n Snowball sampling – A type of non-probability sampling, where initial respondents are selected at randomand subsequent respondents are then selected by referrals or information from the earlier respondents
MARKETING RESEARCH AND INFORMATION 105
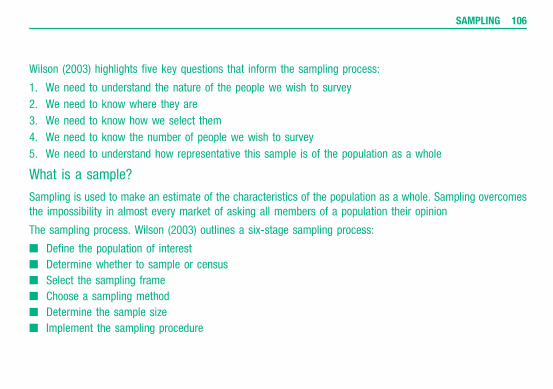
Wilson (2003) highlights five key questions that inform the sampling process:
1. We need to understand the nature of the people we wish to survey
2. We need to know where they are
3. We need to know how we select them
4. We need to know the number of people we wish to survey
5. We need to understand how representative this sample is of the population as a whole
What is a sample?
Sampling is used to make an estimate of the characteristics of the population as a whole. Sampling overcomesthe impossibility in almost every market of asking all members of a population their opinion
The sampling process. Wilson (2003) outlines a six-stage sampling process:
n Define the population of interest
n Determine whether to sample or census
n Select the sampling frame
n Choose a sampling method
n Determine the sample size
n Implement the sampling procedure
SAMPLING 106
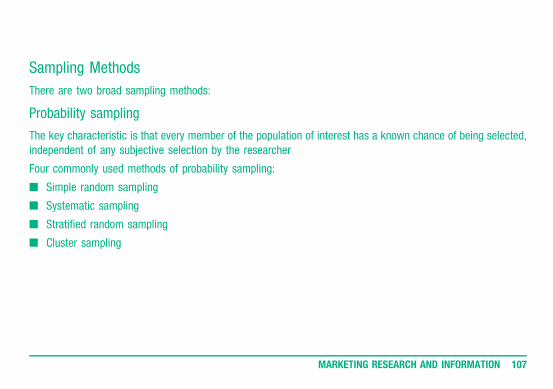
Sampling Methods
There are two broad sampling methods:
Probability sampling
The key characteristic is that every member of the population of interest has a known chance of being selected,independent of any subjective selection by the researcher
Four commonly used methods of probability sampling:
n Simple random sampling
n Systematic sampling
n Stratified random sampling
n Cluster sampling
MARKETING RESEARCH AND INFORMATION 107
Simple random sampling
Each member of the population has an equal chance of being selected for the survey. Members are randomlyselected by a computerized random number generator or tables until the required sample size is filled
Stratified random sampling
This method divides the population into two or more mutually exclusive groups, e.g., men or women, users ornon-users of a product, and takes random samples from within them, using either of the methods above
Cluster sampling
Cluster sampling is a procedure in which clusters of population units are selected at random and then all orsome of the units in the chosen clusters are studied. The technique works when a population can easilybe divided into representative clusters, e.g. in membership directories
SAMPLING 108
Non-probability sampling
Examples of non-probability sampling are:
Convenience sampling
Based on the convenience of the researcher
Judgement or purposive sampling
The researcher consciously selects a sample considered appropriate for the study. This may be based on certaincompanies representing a sector. The market might include all major department stores in the sample, as wellas a random selection of other outlets
Quota sampling
Is defined by ESOMAR as ‘A type of non-probability sample where the required number of units with particularcharacteristics are specified’. This is based on the idea that, if known characteristics of the population arereproduced in the same proportion in the sample, it is representative of that population; e.g. age, sex and socialclass can be used to select quotas
MARKETING RESEARCH AND INFORMATION 109
Advantages of quota sampling include:
n Speed and cost
n Allows sampling to take place where a sample frame may not be available but key characteristics of thepopulation are known – e.g. in overseas b2b research
n Interviewers do not have to interview named individuals, they are screened in or out via a small number ofclassification questions
n The data, when compared to random methods which are perhaps double the cost, has been proven to beacceptable, provided that the research is managed effectively
n Cost savings may be used to improve the quality of research, through increasing sample sizes or using adifferent method in support of the survey
n Its popularity shows that it works!
Disadvantages include:
n Whilst known characteristics may be distributed in correct proportions, unknown characteristics that may berelevant to the survey may not be. Hidden bias may exist that is not discovered
n Researchers may be biased as to the type of respondents they choose to interview
SAMPLING 110
Hints and Tips
n It is important to understand in what circumstances and for what purposes different approaches to samplingare used
n Ths objectives of the research will determine the type of sample that is needed, e.g., are the views of aparticular sub-set of the population required, or are the views of a representative group of the wholepopulation needed?
n Companies spend a lot of money trying to identify and reach sections of the population from which profitablecustomers can be drawn. Effective sampling for research can contribute to this objective
Go to www.cimvirtualinstitute.com and www.marketingonline.co.uk for additional support and guidance
MARKETING RESEARCH AND INFORMATION 111
QUANTITATIVE DATA ANALYSISSyllabus Reference: 4.6, 5.1
After completing this unit you will be able to:
n Understand the process of data management, entry, editing, coding and cleaning
n Understand concepts of tabulation and statistical analysis
n Understand the main techniques of statistical analysis, including descriptive statistics, statistical significanceand hypotheses testing, the measurement of relationships and multivariate analysis
n Understand the use of computer packages that can help with the process
Key definitions
n Coding – The process that allocates a number to each answer and it is this that allows analysis to take place
n Interval data – Similar to ordinal data, but with the added dimension that intervals between the values on ascale are equal
n Ratio data – Actual or real numbers that have a meaningful or absolute zero
Contd.
Unit 11
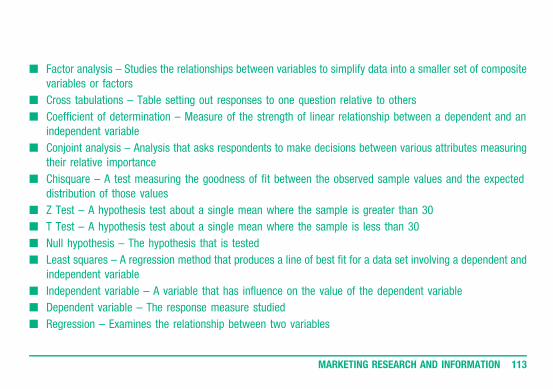
n Factor analysis – Studies the relationships between variables to simplify data into a smaller set of compositevariables or factors
n Cross tabulations – Table setting out responses to one question relative to others
n Coefficient of determination – Measure of the strength of linear relationship between a dependent and anindependent variable
n Conjoint analysis – Analysis that asks respondents to make decisions between various attributes measuringtheir relative importance
n Chisquare – A test measuring the goodness of fit between the observed sample values and the expecteddistribution of those values
n Z Test – A hypothesis test about a single mean where the sample is greater than 30
n T Test – A hypothesis test about a single mean where the sample is less than 30
n Null hypothesis – The hypothesis that is tested
n Least squares – A regression method that produces a line of best fit for a data set involving a dependent andindependent variable
n Independent variable – A variable that has influence on the value of the dependent variable
n Dependent variable – The response measure studied
n Regression – Examines the relationship between two variables
MARKETING RESEARCH AND INFORMATION 113

Introduction
The analysis of data is a key skill of the marketing manager. An ability to understand basic methods of dataanalysis is useful. Data analysis can be done easily now, using computer packages such as Excel and SPSS
Editing and coding
Before data is processed, it is assessed for completeness and coherence. The editing process involves computeror manual checking of the data, to look for respondent or interview errors or inconsistencies
Coding is the process that allocates a number to each answer and it is this that allows analysis to take place.Coding open questions involves using a sample of the completed questionnaires and developing a coding frame,or a list of codes for all possible responses to an open question
Data entry
Data entry may be carried out automatically through CAPI, CAWI and CATI systems, or scanned into the computerusing optical character recognitions software, or they may be entered by hand. Once this is complete, the datacan be analyzed
QUANTITATIVE DATA ANALYSIS 114
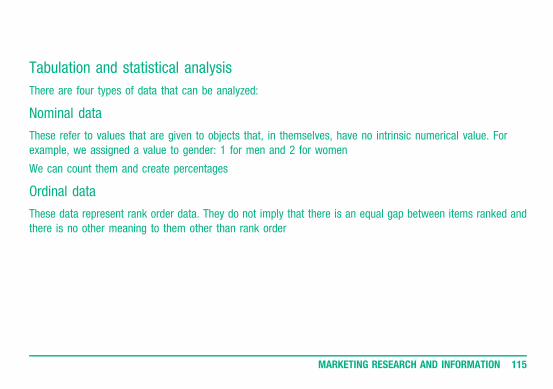
Tabulation and statistical analysis
There are four types of data that can be analyzed:
Nominal data
These refer to values that are given to objects that, in themselves, have no intrinsic numerical value. Forexample, we assigned a value to gender: 1 for men and 2 for women
We can count them and create percentages
Ordinal data
These data represent rank order data. They do not imply that there is an equal gap between items ranked andthere is no other meaning to them other than rank order
MARKETING RESEARCH AND INFORMATION 115
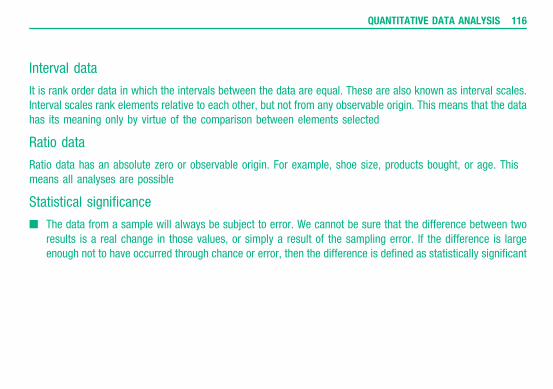
Interval data
It is rank order data in which the intervals between the data are equal. These are also known as interval scales.Interval scales rank elements relative to each other, but not from any observable origin. This means that the datahas its meaning only by virtue of the comparison between elements selected
Ratio data
Ratio data has an absolute zero or observable origin. For example, shoe size, products bought, or age. Thismeans all analyses are possible
Statistical significance
n The data from a sample will always be subject to error. We cannot be sure that the difference between tworesults is a real change in those values, or simply a result of the sampling error. If the difference is largeenough not to have occurred through chance or error, then the difference is defined as statistically significant
QUANTITATIVE DATA ANALYSIS 116
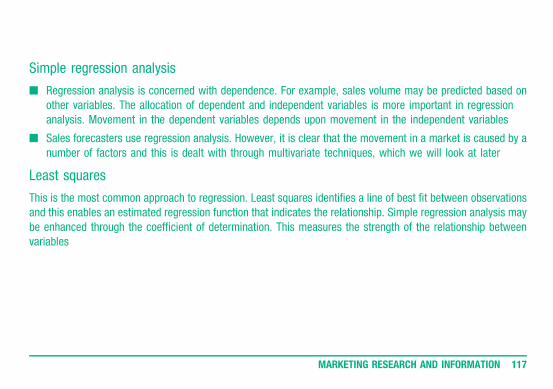
Simple regression analysis
n Regression analysis is concerned with dependence. For example, sales volume may be predicted based onother variables. The allocation of dependent and independent variables is more important in regressionanalysis. Movement in the dependent variables depends upon movement in the independent variables
n Sales forecasters use regression analysis. However, it is clear that the movement in a market is caused by anumber of factors and this is dealt with through multivariate techniques, which we will look at later
Least squares
This is the most common approach to regression. Least squares identifies a line of best fit between observationsand this enables an estimated regression function that indicates the relationship. Simple regression analysis maybe enhanced through the coefficient of determination. This measures the strength of the relationship betweenvariables
MARKETING RESEARCH AND INFORMATION 117
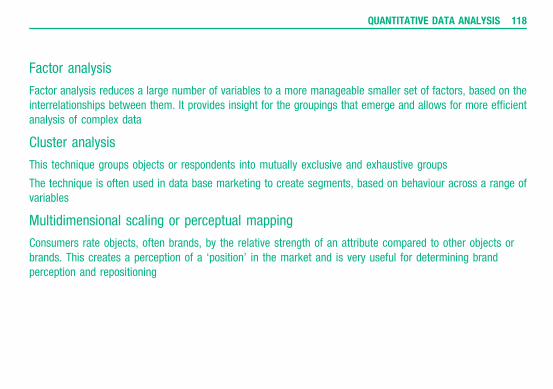
Factor analysis
Factor analysis reduces a large number of variables to a more manageable smaller set of factors, based on theinterrelationships between them. It provides insight for the groupings that emerge and allows for more efficientanalysis of complex data
Cluster analysis
This technique groups objects or respondents into mutually exclusive and exhaustive groups
The technique is often used in data base marketing to create segments, based on behaviour across a range ofvariables
Multidimensional scaling or perceptual mapping
Consumers rate objects, often brands, by the relative strength of an attribute compared to other objects orbrands. This creates a perception of a ‘position’ in the market and is very useful for determining brandperception and repositioning
QUANTITATIVE DATA ANALYSIS 118
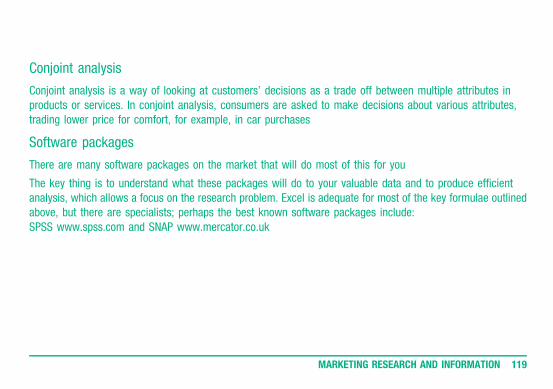
Conjoint analysis
Conjoint analysis is a way of looking at customers’ decisions as a trade off between multiple attributes inproducts or services. In conjoint analysis, consumers are asked to make decisions about various attributes,trading lower price for comfort, for example, in car purchases
Software packages
There are many software packages on the market that will do most of this for you
The key thing is to understand what these packages will do to your valuable data and to produce efficientanalysis, which allows a focus on the research problem. Excel is adequate for most of the key formulae outlinedabove, but there are specialists; perhaps the best known software packages include:SPSS www.spss.com and SNAP www.mercator.co.uk
MARKETING RESEARCH AND INFORMATION 119
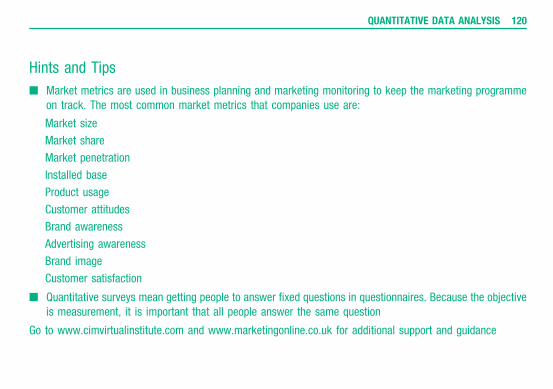
Hints and Tips
n Market metrics are used in business planning and marketing monitoring to keep the marketing programmeon track. The most common market metrics that companies use are:
Market size
Market share
Market penetration
Installed base
Product usage
Customer attitudes
Brand awareness
Advertising awareness
Brand image
Customer satisfaction
n Quantitative surveys mean getting people to answer fixed questions in questionnaires. Because the objectiveis measurement, it is important that all people answer the same question
Go to www.cimvirtualinstitute.com and www.marketingonline.co.uk for additional support and guidance
QUANTITATIVE DATA ANALYSIS 120
PRESENTING MARKETINGRESEARCH
Syllabus Reference: 5.2–5.4
After completing this unit you will be able to:
n Identify the structure for the presentation of a research report
n Outline the key features of an oral presentation
n Know how to make the most of a presentation
n Understand the use of graphics in presentation of data
Key definitions
n Oral presentation – A verbal presentation of research findings, using a range of supporting material
n Executive summary – A precis of the report
The final report to the client is perhaps the most important part of the research planning process
Unit 12
MARKETING RESEARCH AND INFORMATION 121
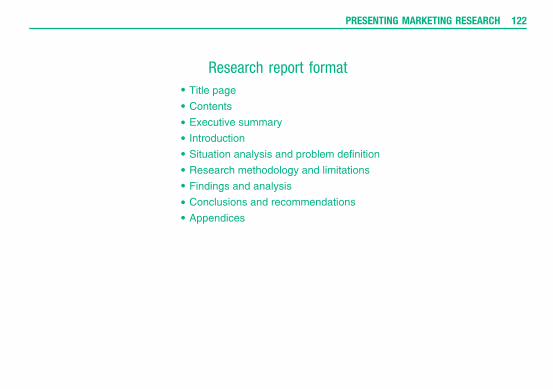
Research report format
PRESENTING MARKETING RESEARCH 122
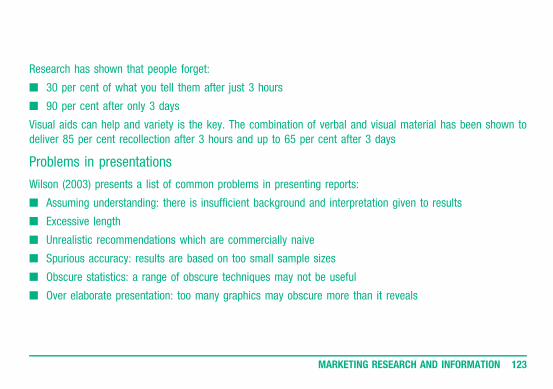
Research has shown that people forget:
n 30 per cent of what you tell them after just 3 hours
n 90 per cent after only 3 days
Visual aids can help and variety is the key. The combination of verbal and visual material has been shown todeliver 85 per cent recollection after 3 hours and up to 65 per cent after 3 days
Problems in presentations
Wilson (2003) presents a list of common problems in presenting reports:
n Assuming understanding: there is insufficient background and interpretation given to results
n Excessive length
n Unrealistic recommendations which are commercially naive
n Spurious accuracy: results are based on too small sample sizes
n Obscure statistics: a range of obscure techniques may not be useful
n Over elaborate presentation: too many graphics may obscure more than it reveals
MARKETING RESEARCH AND INFORMATION 123
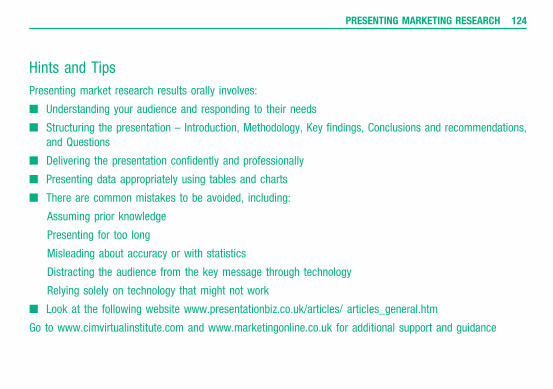
Hints and Tips
Presenting market research results orally involves:
n Understanding your audience and responding to their needs
n Structuring the presentation – Introduction, Methodology, Key findings, Conclusions and recommendations,and Questions
n Delivering the presentation confidently and professionally
n Presenting data appropriately using tables and charts
n There are common mistakes to be avoided, including:
Assuming prior knowledge
Presenting for too long
Misleading about accuracy or with statistics
Distracting the audience from the key message through technology
Relying solely on technology that might not work
n Look at the following website www.presentationbiz.co.uk/articles/ articles_general.htm
Go to www.cimvirtualinstitute.com and www.marketingonline.co.uk for additional support and guidance
PRESENTING MARKETING RESEARCH 124
BIBLIOGRAPHYAdmap (2001). Who is Killing CRM, Admap
American Marketing Association (2003). www.marketingpower.com/live/content.php? Item_ID¼4620
Antinou, T. (1997). Drilling or Mining? Handling and Analysis of Data between now and the Year 2000, Marketingand Research Today, pp. 115–120
Baker, S. and Mouncey, P. (2003). The Market Researcher’s Manifesto, International Journal of MarketingResearch, 45(4)
CIM (2003). www.cim.co.uk
Crouch, S. and Housden, M. (2003). Marketing Research for Managers, 3rd edition, Butterworth–Heinemann
ESOMAR (2003). www.esomar.nl
Gamble, P., Stone, M. and Woodcock, N. (2001). Up Close and Personal, Kogan Page
Kotler, P. et al. (1999). Principles of Marketing, 2nd European edition. Prentice Hall Europe
MRS (1999). Code of Conduct, MRS
Reichheld, F. (2001). The Loyalty Effect, HBSP
Thomas, B. and Housden, M. (2003). Direct Marketing in Practice, Butterworth-Heinemann
Wilson, A. (2003). Marketing Research: An Integrated Approach, FT Prentice Hall
Yahya, S. and Goh, W. (2002). Managing Human resources: Towards Achieving Knowledge Management, Journalof Knowledge Management, 6(5)
MARKETING RESEARCH AND INFORMATION 125

This Page Intentionally Left Blank


![[Marketing Knowledge] CIM Revision Card Marketing(Book4me.org)(2)](https://static.documents.pub/doc/80x56/577cce441a28ab9e788db690/marketing-knowledge-cim-revision-card-marketingbook4meorg2.jpg)


![Revision Cards[1]](https://static.documents.pub/doc/80x56/577d24681a28ab4e1e9c674b/revision-cards1.jpg)
![[Marketing Knowledge] CIM Revision Cards Marketing(BookFi.org)](https://static.documents.pub/doc/80x56/55cf9aef550346d033a4125b/marketing-knowledge-cim-revision-cards-marketingbookfiorg.jpg)

![[Karen Beamish] CIM Revision Cards Analysis and Ev(BookFi.org)](https://static.documents.pub/doc/80x56/553fe46f550346a57f8b48d0/karen-beamish-cim-revision-cards-analysis-and-evbookfiorg.jpg)
