576
CIMA Paper F2 Financial Management Study Notes
| Date post: | 20-Jan-2016 |
| Category: |
Documents |
| Upload: | orosz-carmen |
| View: | 243 times |
| Download: | 22 times |

CIMA Paper F2 Financial Management Study Notes
CIMA Publishing is an imprint of Elsevier The Boulevard, Langford Lane, Kidlington, Oxford, OX5 1GB, UK 225 Wyman Street, Waltham, MA02451, USA Kaplan Publishing UK, Unit 2 The Business Centre, Molly Millars Lane, Wokingham, Berkshire RG41 2QZ
Copyright © 2011 Elsevier Limited and Kaplan Publishing Limited. All rights reserved.
No part of this publication may be reproduced, stored in a retrieval system or transmitted in any form or by any means electronic, mechanical, photocopying, recording or otherwise without the prior written permission of the publisher.
Permissions may be sought directly from Elsevier's Science and Technology Rights Department in Oxford, UK: phone: (+44) (0) 1865 843830; fax: (+44) (0) 1865 853333; email: [email protected]. You may also complete your request online via the Elsevier homepage (http://elsevier.com), by selecting Support & Contact then Copyright and Permission and then Obtaining Permissions.
Notice No responsibility is assumed by the publisher for any injury and/or damage to persons or property as a matter of products liability, negligence or otherwise, or from any use or operation of any methods, products, instructions or ideas contained in the material herein.
British Library Cataloguing in Publication Data A catalogue record for this book is available from the British Library
Printed and bound in Great Britain
11 12 11 10 9 8 7 6 5 4 3 2 1
ii KAPLAN PUBLISHING
Contents
Page
Chapter 1 CIMA verb hierarchy 1
Chapter 2 Analysis and interpretation of financial accounts 7
Chapter 3 Earnings per share 61
Chapter 4 Consolidated statement of financial position 81
Chapter 5 Consolidated statement of comprehensive income and statement of changes in equity
141
Chapter 6 Associates and joint ventures 189
Chapter 7 Changes in group structure 227
Chapter 8 Complex groups 291
Chapter 9 Foreign currency translation 349
Chapter 10 Group statement of cash flows 383
Chapter 11 Developments in external reporting 427
Chapter 12 Changing price levels 453
Chapter 13 Financial instruments 467
Chapter 14 Sharebased payments 505
Chapter 15 Pension benefits 517
Chapter 16 Substance over form 539
KAPLAN PUBLISHING iii

iv KAPLAN PUBLISHING

Paper Introduction
v
chapterIntro

How to Use the Materials
These Official CIMA learning materials brought to you by Elsevier/CIMA Publishing and Kaplan Publishing have been carefully designed to make your learning experience as easy as possible and to give you the best chances of success in your Financial Management examinations.
The product range contains a number of features to help you in the study process. They include:
This Study Text has been designed with the needs of homestudy and distancelearning candidates in mind. Such students require very full coverage of the syllabus topics, and also the facility to undertake extensive question practice. However, the Study Text is also ideal for fully taught courses.
The main body of the text is divided into a number of chapters, each of which is organised on the following pattern:
• a detailed explanation of all syllabus areas;
• extensive 'practical' materials, including readings from relevant journals;
• generous question practice, together with full solutions;
• a specimen paper, complete with solutions.
• Detailed learning outcomes. You should assimilate these before beginning detailed work on the chapter, so that you can appreciate where your studies are leading.
• Stepbystep topic coverage. This is the heart of each chatper, containing detailed explanatory text supported, where appropriate, by worked examples and exercises. You should work carefully through this section, ensuring that you understand the material being explained and can tackle the examples and exercises successfully. Remember that in many cases knowledge is cumulative; if you fail to digest earlier material thoroughly, you may struggle to understand later chapters.
• Readings and activities. Most chapters are illustrated by more practical elements, such as relevant journal articles or other readings, together with comments and questions designed to stimulate discussion.
vi KAPLAN PUBLISHINGvi KAPLAN PUBLISHING

Having worked through the chapters you are ready to begin your final preparations for the examination. The final section of this Study Text provides you with a specimen paper. You should attempt this under strict exam conditions before fully reviewing the solutions provided.
If you work conscientiously through this official CIMA Study Text according to the guidelines above you will be giving yourself an excellent chance of exam success. Good luck with your studies.
• Question practice. The test of how well you have learned the material is your ability to tackle questions. Make a serious attempt at producing your own answers, but at this stage don't be too concerned about attempt the questions under exam conditions. In particular, it is more important to absorb the material thoroughly by completing a full solution than to observe the time limits that would apply in the actual exam.
• Solutions. Avoid the temptation merely to 'audit' the solutions provided. It is an illusion to think that this provides the same benefits as you would gain from a serious attempt of your own. However, if you are struggling to get started on a question you should read the introductory guidance provided at the beginning of the solution, and then make your own attempt before referring back to the full solution.
KAPLAN PUBLISHING vii
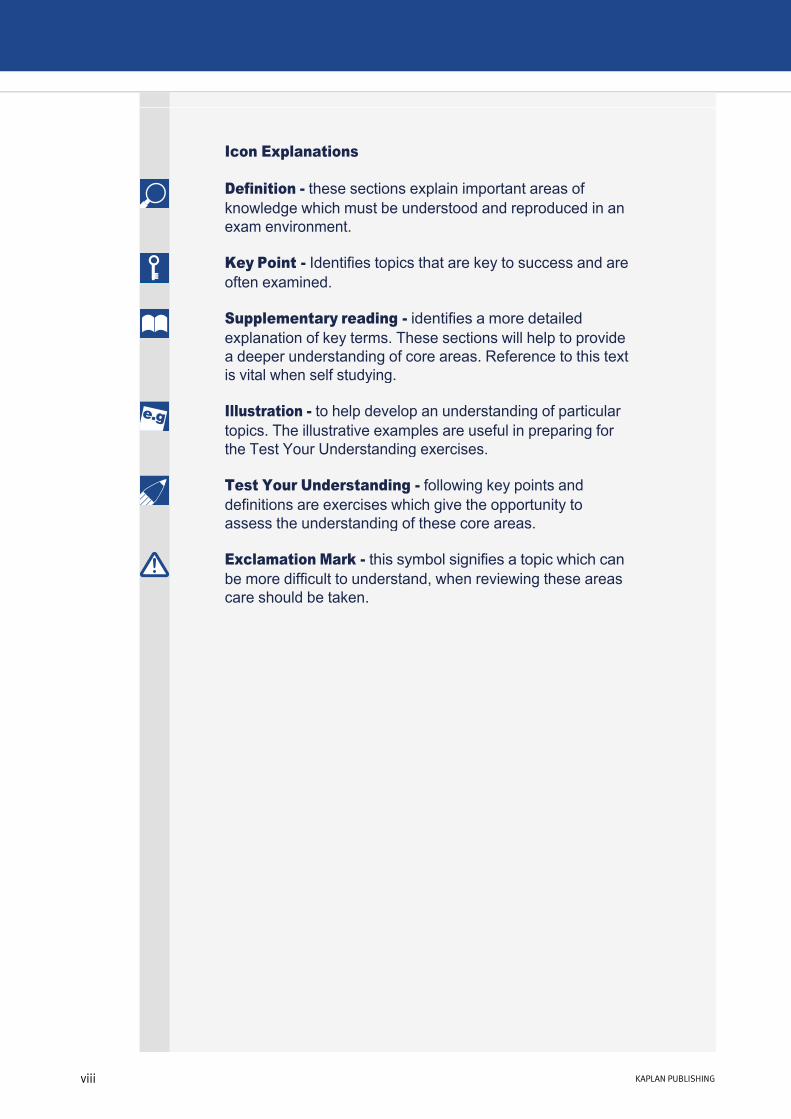
Icon Explanations
Definition these sections explain important areas of knowledge which must be understood and reproduced in an exam environment.
Key Point Identifies topics that are key to success and are often examined.
Supplementary reading identifies a more detailed explanation of key terms. These sections will help to provide a deeper understanding of core areas. Reference to this text is vital when self studying.
Illustration to help develop an understanding of particular topics. The illustrative examples are useful in preparing for the Test Your Understanding exercises.
Test Your Understanding following key points and definitions are exercises which give the opportunity to assess the understanding of these core areas.
Exclamation Mark this symbol signifies a topic which can be more difficult to understand, when reviewing these areas care should be taken.
viii KAPLAN PUBLISHING
Study technique
Passing exams is partly a matter of intellectual ability, but however accomplished you are in that respect you can improve your chances significantly by the use of appropriate study and revision techniques. In this section we briefly outline some tips for effective study during the earlier stages of your approach to the exam.
Planning
To begin with, formal planning is essential to get the best return from the time you spend studying. Estimate how much time in total you are going to need for each subject you are studying. Remember that you need to allow time for revision as well as for initial study of the material. You may find it helpful to read 'Pass First Time!' second edition by David R. Harris, ISBN 9781856177986. This book will provide you with proven study techniques. Chapter by chapter it covers the building blocks of successful learning and examination techniques. This is the ultimate guide to passing your CIMA exams, written by a past CIMA examiner and shows you how to earn all the marks you deserve, and explains how to avoid the most common pitfalls. You may also find "The E Word: Kaplan's Guide to Passing Exams" by Stuart PedleySmith, ISBN: 9780857322050, helpful. Stuart PedleySmith is a senior lecturer at Kaplan Financial and a qualified accountant specialising in financial management. His natural curiosity and wider interests have led him to look beyond the technical content of financial management to the processes and journey that we call education. He has become fascinated by the whole process of learning and the exam skills and techniques that contribute towards success in the classroom. This book is for anyone who has to sit and exam and wants to give themselves a better chance of passing. It is easy to read, written in a common sense style and full of anecdotes, facts, and practical tips. It also contains synopses of interviews with people involved in the learning and examining process.
With your study material before you, decide which chapters you are going to study each week, and which weeks you will devote to revision and final question practice.
Prepare a written schedule summarising the above and stick to it!
KAPLAN PUBLISHING ix

It is essential to know your syllabus. As your studies progress, you will become more familiar with how long it takes to cover topics in sufficient depth. Your timetable may need to be adapted to allocate enough time for the whole syllabus.
Students are advised to refer to the notice of examinable legislation published regularly in CIMA's magazine (Financial Management), the students enewsletter (Velocity) and on the CIMA website, to ensure they are uptodate.
Tips for effective studying(1) Aim to find a quiet and undisturbed location for your
study, and plan as far as possible to use the same period of time each day. Getting into a routine helps to avoid wasting time. Make sure that you have all the materials you need before you begin so as to minimise interruptions.
(2) Store all your materials in one place, so that you do not waste time searching for items around the house. If you have to pack everything away after each study period, keep them in a box, or even a suitcase, which will not be disturbed until next time.
(3) Limit distractions. To make the most effective use of your study periods you should be able to apply total concentration, so turn off the TV, set your phones to message mode, and put up your 'do not disturb' sign.
(4) Your timetable will tell you which topic to study. However, before diving in and becoming engrossed in the fine points, make sure you have an overall picture of all the areas that need to be covered by the end of that session. After an hour, allow yourself a short break and move away from your books. With experience, you will learn to assess the pace you need to work at. You should also allow enough time to read relevant articles from newspapers and journals, which will supplement your knowledge and demonstrate a wider perspective.
(5) Work carefully through a chapter, making notes as you go. When you have covered a suitable amount of material, vary the pattern by attempting a practice question. Preparing an answer plan is a good habit to get into, while you are both studying and revising, and also in the examination room. It helps to impose a structure on your solutions and avoid rambling. When you have finished your attempt, make notes of any mistakes you made, or any areas that you failed to cover or covered more briefly.
x KAPLAN PUBLISHING
(6) Make notes as you study, and discover the techniques that work best for you. Your notes may be in the form of lists, bullet points, diagrams, summaries, 'mind maps' or the written word, but remember that you will need to refer back to them at a later date, so they must be intelligible. If you are on a taught course, make sure you highlight any issues you would like to follow up with your lecturer.
(7) Organise your notes. Make sure that all your notes, calculations etc., can be effectively filed and easily retrieved later.
The Examination
Examination format
The examination is a three hour written paper, plus 20 minutes of preexamination question paper reading time. All questions are compulsory. It will contain both computational and discursive elements.
Some questions will adopt a scenario/case study approach.
An individual question may often involve elements that relate to different areas of the syllabus. For example, an analysis and interpretation question could include matters relating to substance or financial instruments.
Questions may ask candidates to comment on the appropriateness or acceptability of management's opinion or chosen accounting treatment.
Questions will test an understanding of accounting principles and concepts and how these are applied to practical examples.
The examination paper will have the following sections:
Section A – 50 marks
Five compulsory medium answer questions, each worth 10 marks. Short scenarios may be given, to which some or all questions relate.
KAPLAN PUBLISHING xi
Section B – 50 marks
One or two compulsory questions. Short scenarios may be given, to which questions relate.
Paper based examination tips
Spend the first few minutes of the examination reading the paper.
Divide the time you spend on questions in proportion to the marks on offer. One suggestion for this examination is to allocate 1.8 minutes to each mark available, so a 10mark question should be completed in approximately 18 minutes.
Unless you know exactly how to answer the question, spend some time planning your answer. Stick to the question and tailor your answer to what you are asked. Pay particular attention to the verbs in the question.
Spend the last five minutes reading through your answers and making any additions or corrections.
If you get completely stuck with a question, leave space in your answer book and return to it later.
If you do not understand what a question is asking, state your assumptions. Even if you do not answer in precisely the way the examiner hoped, you should be given some credit, if your assumptions are reasonable.
You should do everything you can to make things easy for the marker. The marker will find it easier to identify the points you have made if your answers are legible.
• Medium answer questions: These might ask for numerical answers, but could also ask you to write a definition of a word or phrase, or to use a formula.
• Essay questions: Make a quick plan in your answer book and under each main point list all the relevant facts you can think of. Then write out your answer developing each point fully. Your essay should have a clear structure; it should contain a brief introduction, a main section and a conclusion. Be concise. It is better to write a little about a lot of different points than a great deal about one or two points.
xii KAPLAN PUBLISHING

• Computations: It is essential to include all your workings in your answers. Many computational questions require the use of a standard format: company income statement, statement of financial position and statement of cash flows for example. Be sure you know these formats thoroughly before the examination and use the layouts that you see in the answers given in this resource. If you are asked to comment or make recommendations on a computation, you must do so. There are important marks to be gained here. Even if your computation contains mistakes, you may still gain marks if your reasoning is correct.
• Reports, memos and other documents: Some questions ask you to present your answer in the form of a report or a memo or other document. Use the correct format – there could be easy marks to gain here.
Examinable legislation
For the most uptodate list of examinable documents please visit the student section of the CIMA website: http://www.cimaglobal.com.
IFRS 3
In January 2008 the IASB issued IFRS3 (revised 2008) Business Combinations and IAS 27 (revised 2008) Consolidated and Separate Financial Statements. These standards are examinable at F2 from 2010.
The cause of the changes to these standards is further harmonisation with the US Generally Accepted Accounting Practice (GAAP). There is also a new emphasis in several theoretical areas, and in turn this will have practical effects. For example the group accounts are now regarded as being prepared on the entity basis and not just the parent company basis. This helps to explain why the changes in respect of goodwill have been made.
The new standards also bring a greater emphasis on control being the critical economic event. For example changes in the group interest (whether an increase or decrease) where there is control before and after, will not result in any gain or loss being reported or any change in the measurement of goodwill.
KAPLAN PUBLISHING xiii

The new standards also place a greater emphasis on the use of fair values, so that arguably there will be more subjectivity. However the standards do contain detailed guidance on recognising and measuring the fair value of the identifiable assets and liabilities of the acquired subsidiary.
It is of course hoped that the new standards will naturally result in a greater consistency in the way that business combinations are accounted for as they provide more detailed guidance.
The major changes are as follows.
Goodwill and the non controlling interest
Goodwill can be recognised in full even if control is achieved by less than 100% ownership.
The previous accounting (which is still allowed as an option) required that goodwill arising on acquisition should only be recognised with respect to the part of the subsidiary undertaking that is attributable to the interest held by the parent entity. In other words there was a matching of the parent’s cost of the investment with the parent’s share of the subsidiary’s net assets; so naturally the goodwill that comes from this calculation is wholly attributable to the parent company and none is attributable to the non controlling interest (the minority interest). Where goodwill is recognised in full this means that the non controlling interest will be measured at fair value and participate in goodwill.
Refer to chapter 6 for further information on noncontrolling interests under the new IFRS 3 rules.
Acquisition related costs
In determining the fair value of the cost of the investment, the new emphasis is on what the vendor (seller) actually receives rather than what the acquirer (buyer) has actually spent. One practical impact of this is that transaction costs will no longer be capitalised, instead they will be written off to income.
Contingent consideration
The previous accounting required that contingent consideration only be accounted for if it was probable and changes in the value of the contingent consideration were accounted for by retrospectively changing the cost of the investment and hence goodwill.
xiv KAPLAN PUBLISHING

The new accounting treatment is that contingent consideration is to be measured at fair value.
If subsequently it transpires that the further consideration is not paid because the profits targets are not met then the provision will be extinguished and a gain reported in income.
Step acquisitions
The subsidiary is consolidated only from the date on which the parent achieves control, directly or indirectly.
Refer to chapters 7 and 8 for further information on step acquisitions and how the new IFRS 3 rules are applied.
Disposals
The complete disposal of an investment is dealt with in the same manner as under prior IFRS 3 rules i.e. again or loss arises and is reported in the income statement.
If there is a partial disposal such that control is lost but an interest does remain (e.g. 80% to 10% or 80% to 40%), a gain or loss arises and is reported in the income statement. The proceeds here include the value of the retained interest as if the total investment has been disposed of and a noncontrolling interest purchased.
A partial disposal resulting in control being retained no longer requires a gain or loss to be calculated. The transaction is dealt with as one between equity holders.
Refer to chapter 7 for further information on disposals and how the new IFRS 3 rules are applied.
KAPLAN PUBLISHING xv

xvi KAPLAN PUBLISHING
CIMA verb hierarchyChapter learning objectives
CIMA VERB HIERARCHY
CIMA place great importance on the choice of verbs in exam question requirements. It is thus critical that you answer the question according to the definition of the verb used.
1
chapter
1

1 Managerial level verbs
In managerial level exams you will mainly meet verbs from levels 2, 3 and 4. Very occasionally you will also see level 1 verbs but these should not account for more than 510% of the marks in total.
Level 2 – COMPREHENSION
What you are expected to understand
Level 3 – APPLICATION
How you are expected to apply your knowledge
VERBS USED DEFINITION
Describe
Distinguish
Explain
Identify
Illustrate
Communicate the key features of.
Highlight the differences between.
Make clear or intelligible/state the meaning or purpose of.
Recognise, establish or select after consideration.
Use an example to describe or explain something.
VERBS USED DEFINITION
Apply
Calculate
Demonstrate
Prepare
Reconcile
Solve
Tabulate
Put to practical use.
Ascertain or reckon mathematically.
Prove with certainty or exhibit by practical means.
Make or get ready for use.
Make or prove consistent/compatible.
Find an answer to.
Arrange in a table.
CIMA verb hierarchy
2 KAPLAN PUBLISHING2 KAPLAN PUBLISHING
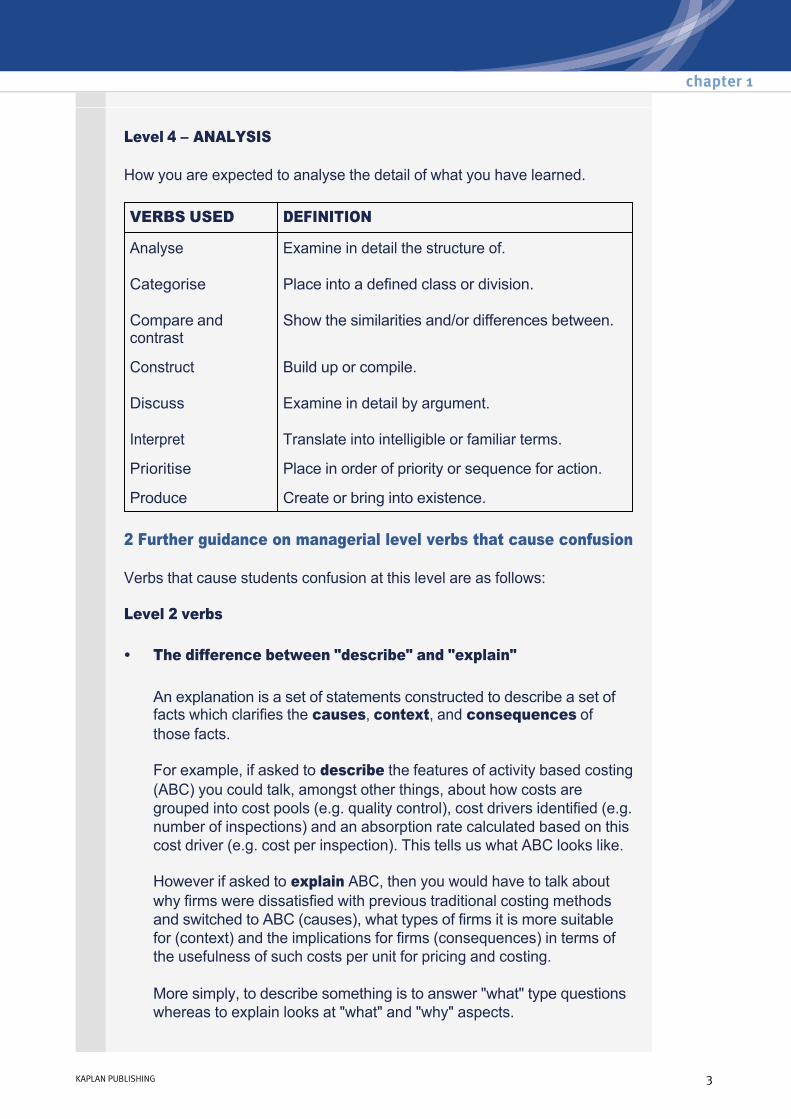
Level 4 – ANALYSIS
How you are expected to analyse the detail of what you have learned.
VERBS USED DEFINITION
Analyse
Categorise
Compare and contrast
Examine in detail the structure of.
Place into a defined class or division.
Show the similarities and/or differences between.
Construct
Discuss
Interpret
Build up or compile.
Examine in detail by argument.
Translate into intelligible or familiar terms.
Prioritise Place in order of priority or sequence for action.
Produce Create or bring into existence.
2 Further guidance on managerial level verbs that cause confusion
Verbs that cause students confusion at this level are as follows:
Level 2 verbs
An explanation is a set of statements constructed to describe a set of facts which clarifies the causes, context, and consequences of those facts.
For example, if asked to describe the features of activity based costing (ABC) you could talk, amongst other things, about how costs are grouped into cost pools (e.g. quality control), cost drivers identified (e.g. number of inspections) and an absorption rate calculated based on this cost driver (e.g. cost per inspection). This tells us what ABC looks like.
However if asked to explain ABC, then you would have to talk about why firms were dissatisfied with previous traditional costing methods and switched to ABC (causes), what types of firms it is more suitable for (context) and the implications for firms (consequences) in terms of the usefulness of such costs per unit for pricing and costing.
More simply, to describe something is to answer "what" type questions whereas to explain looks at "what" and "why" aspects.
• The difference between "describe" and "explain"
chapter 1
KAPLAN PUBLISHING 3
The key thing about illustrating something is that you may have to decide on a relevant example to use. This could involve drawing a diagram, performing supporting calculations or highlighting a feature or person in the scenario given. Most of the time the question will be structured so calculations performed in part (a) can be used to illustrate a concept in part (b).
For example, you could be asked to explain and illustrate what is meant by an "adverse variance".
Level 3 verbs
Given that all level 3 verbs involve application, the verb "apply" is rare in the real exam. Instead one of the other more specific verbs are used instead.
This is a numerical requirement and usually involves starting with one of the figures, adjusting it and ending up with the other.
For example, in a bank reconciliation you start with the recorded cash at bank figure, adjust it for unpresented cheques, etc, and (hopefully!) end up with the stated balance in the cash "T account".
The verb "to demonstrate" can be used in two main ways.
Firstly it could mean to prove that a given statement is true or consistent with circumstances given. For example, the Finance Director may have stated in the question that the company will not exceed its overdraft limit in the next six months. The requirement then asks you to demonstrate that the Director is wrong. You could do this by preparing a cash flow forecast for the next six months.
Secondly you could be asked to demonstrate how a stated model, framework, technique or theory could be used in the particular scenario to achieve a specific result for example, how a probability matrix could be used to make a production decision. Ensure in such questions that you do not merely describe the model but use it to generate the desired outcome.
• The verb "to illustrate"
• The verb "to apply"
• The verb "to reconcile"
• The verb "to demonstrate"
CIMA verb hierarchy
4 KAPLAN PUBLISHING
Level 4 verbs
To analyse something is to examine it in detail in order to discover its meaning or essential features. This will usually involve breaking the scenario down and looking at the fine detail, possibly with additional calculations, and then stepping back to see the bigger picture to identify any themes to support conclusions.
For example, if asked to analyse a set of financial statements, then the end result will be a set of statements about the performance of the business with supporting evidence. This could involve the following:
The main error students make is that they fail to draw out any themes and conclusions and simply present the marker with a collection of uninterpreted, unexplained facts and figures.
To discuss something is very similar to analysing it, except that discussion usually involves two or more different viewpoints or arguments as the context, rather than a set of figures, say. To discuss viewpoints will involve looking at their underlying arguments, examining them critically, trying to assess whether one argument is more persuasive than the other and then seeking to reach a conclusion.
For example, if asked to discuss whether a particular technique could be used by a company, you would examine the arguments for and against, making reference to the specific circumstances in the question, and seek to conclude.
• The verb "to analyse"
(1) You could break down your analysis into areas of profitability, liquidity, gearing and so on.
(2) Under each heading look at key figures in the financial statements, identifying trends (e.g. sales growth) and calculating supporting ratios (e.g. margins).
(3) Try to explain what the figures mean and why they have occurred (e.g. why has the operating margin fallen?)
(4) Start considering the bigger picture are the ratios presenting a consistent message or do they contradict each other? Can you identify common causes?
(5) Finally you would then seek to pull all this information together and interpret it to make some higher level comments about overall performance.
• The verb "to discuss"
chapter 1
KAPLAN PUBLISHING 5

To prioritise is to place objects in an order. The key issue here is to decide upon the criteria to use to perform the ordering. For example, prioritising the external threats facing a firm could be done by considering the scale of financial consequences, immediacy, implications for the underlying business model and so on.
The main mistake students make is that they fail to justify their prioritisation why is this the most important issue?
• The verb "to prioritise"
CIMA verb hierarchy
6 KAPLAN PUBLISHING

Analysis and interpretation of financial accountsChapter learning objectives
On completion of their studies students should be able to:
• Calculate and interpret a full range of accounting ratios;
• Analyse financial statements in the context of information provided in the accounts and corporate report to evaluate performance and position;
• Prepare a concise report on the results of an analysis of financial statements;
• Explain and discuss the limitations of accounting ratio analysis and analysis based on financial statements;
• Prepare and discuss segmental analysis, with interfirm and international comparisons taking account of possible aggressive or unusual accounting policies and pressures on ethical behaviour.
7
chapter
2

1 Session content
2 Interpretation and analysis
The IASB Framework states:
The objective of financial statements is to provide information … that is useful to a wide range of users in making economic decisions.
Interpretation and analysis of the financial statements is the process of arranging, examining and comparing the results in order that users are equipped to make such economic decisions.
The interpretation process is assisted by adopting an analytical approach. The main components of an appropriate approach are:
• identification of the user of the analysis;
• an understanding of the nature of the business, industry and organisation;
• identification of relevant sources of data for analysis;
• numerical analysis of the data available;
• interpretation of the results of the analysis;
• writing the report detailing the analysis of the results and recommendations.
Analysis and interpretation of financial accounts
8 KAPLAN PUBLISHING8 KAPLAN PUBLISHING
3 Identify the user of the analysis
Examination questions will usually identify the type of user for whom a report is being prepared, so it is important to recognise the differences between users and their needs. It is important that any analysis and interpretation exercise is oriented towards the needs of the particular user who requires a report.
There is a wide range of user groups that may be interested in an entity’s financial statements. Historically the financial statements have been prepared for investors. However, other users will also be interested in them.
4 Understand the business
It is often thought that financial analysis involves purely the application of a standard set of numerical calculations to a set of published accounts. This is only one part of the task. In order to interpret those calculations it is important to understand the business’s current position.
The history of the business underlies the current position and future outlook. Furthermore, the owners and their individual characteristics will influence factors such as the level of risk in the business and dividend policy. Knowledge of the quality, qualifications and experience of management will assist in evaluating the performance and position of the business.
Financial analysis requires an understanding of the products, services and operating characteristics of the business. This will assist in understanding data such as turnover, profitability, inventories and working capital.
The business operates within an industry consisting of businesses with similar operating characteristics. If the analysis requires comparison of the business with the industry norms, it is important to identify the key characteristics of the industry and to establish benchmarks such as gross profit ratios, receivables collection days etc.
5 Identify relevant sources of data
In practice, the analyst needs to consider carefully the possible sources of information available about an entity, starting with the annual report. This will contain financial information but there may be additional voluntary disclosures that will be helpful to the analyst, such as the entity’s environmental impact, employment reports, graphs, pie charts and ratio calculations.
chapter 2
KAPLAN PUBLISHING 9
Users of financial statements
In the Financial Management examination it will not be possible, because of time restrictions, to carry out an analysis in great depth, and there are obvious limitations on the amount of information that can be provided in an examination question. The information provided for analysis in a question is likely to include one or more of the following:
Working with this information and with any descriptive background provided in the question, we need to gain an understanding of the business and the relationships between the data. Where information in the form of extracts from the financial statements is given, it is often possible (and is often specifically required by the requirements of the question) to calculate a set of financial ratios as the basis for further analysis and comment. The rest of this chapter examines numerical data analysis in the form of the most frequently used accounting ratios.
• income statement data for one or more years;
• cash flow data for one or more years;
• industry wide ratios and benchmarks;
• statement of financial position data for one or more years;
• budget data, and variance analysis;
• data regarding a competitor, potential subsidiary or customer applying for credit.
6 Calculation of ratios
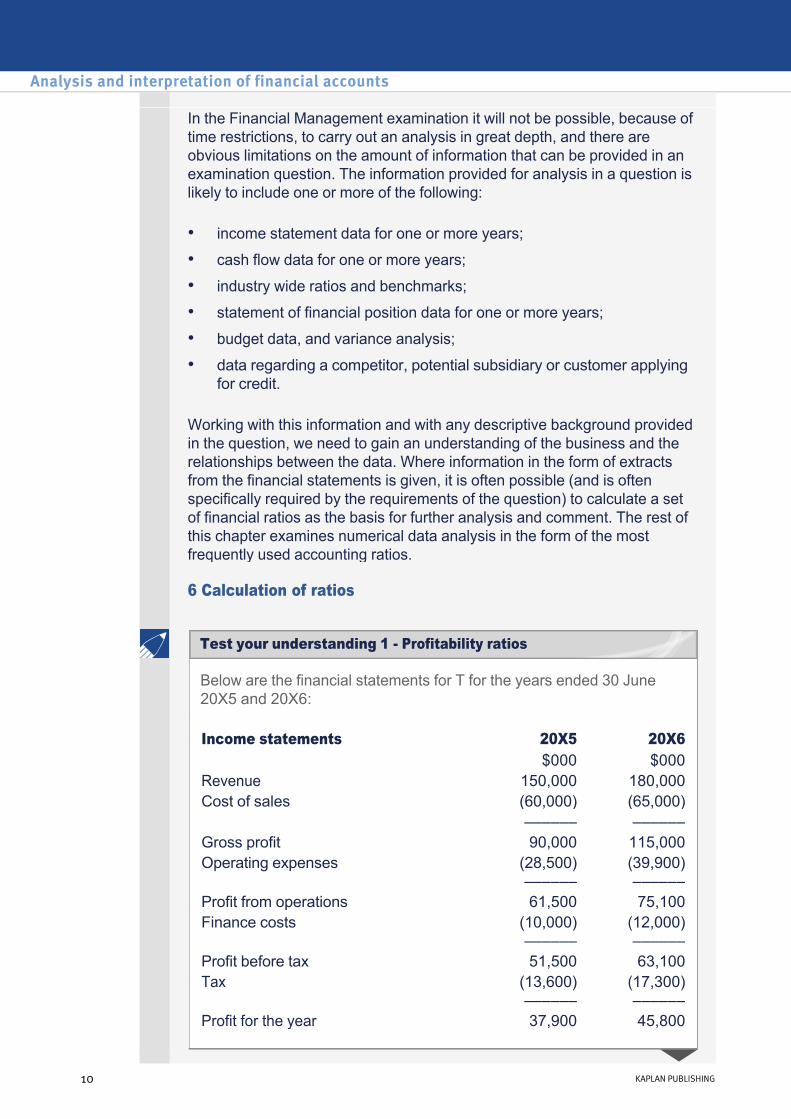
Below are the financial statements for T for the years ended 30 June 20X5 and 20X6:
Income statements 20X5 20X6 $000 $000
Revenue 150,000 180,000Cost of sales (60,000) (65,000)
–––––– –––––– Gross profit 90,000 115,000Operating expenses (28,500)
–––––– (39,900) ––––––
Profit from operations 61,500 75,100Finance costs (10,000)
–––––– (12,000) ––––––
Profit before tax 51,500 63,100Tax (13,600)
–––––– (17,300) ––––––
Profit for the year 37,900 45,800
Analysis and interpretation of financial accounts
10 KAPLAN PUBLISHING
Test your understanding 1 Profitability ratios

Dividends of $25m were paid to shareholders in each year.
Statements of financial position
20X5 20X6 $000 $000
Property, plant and equipment 190,000 266,200Current assets Inventory 12,000 15,000 Receivables 37,500 49,300 Bank 500
––––
––––
50,000 ––––––
64,300 ––––––
240,000 ––––––
330,500 ––––––
Share capital 10,000 12,000Share premium 4,000 5,000Revaluation reserve − 30,000Retained earnings 78,900 99,700 –––––– –––––– 92,900 146,700 Noncurrent liabilities Loan 125,000 150,000 Current liabilities Trade payables 10,600 11,700 Overdraft − 9,100 Taxation 11,500 13,000
–––– –––– 22,100 33,800 –––––– –––––– 240,000 330,500 –––––– ––––––
chapter 2
KAPLAN PUBLISHING 11
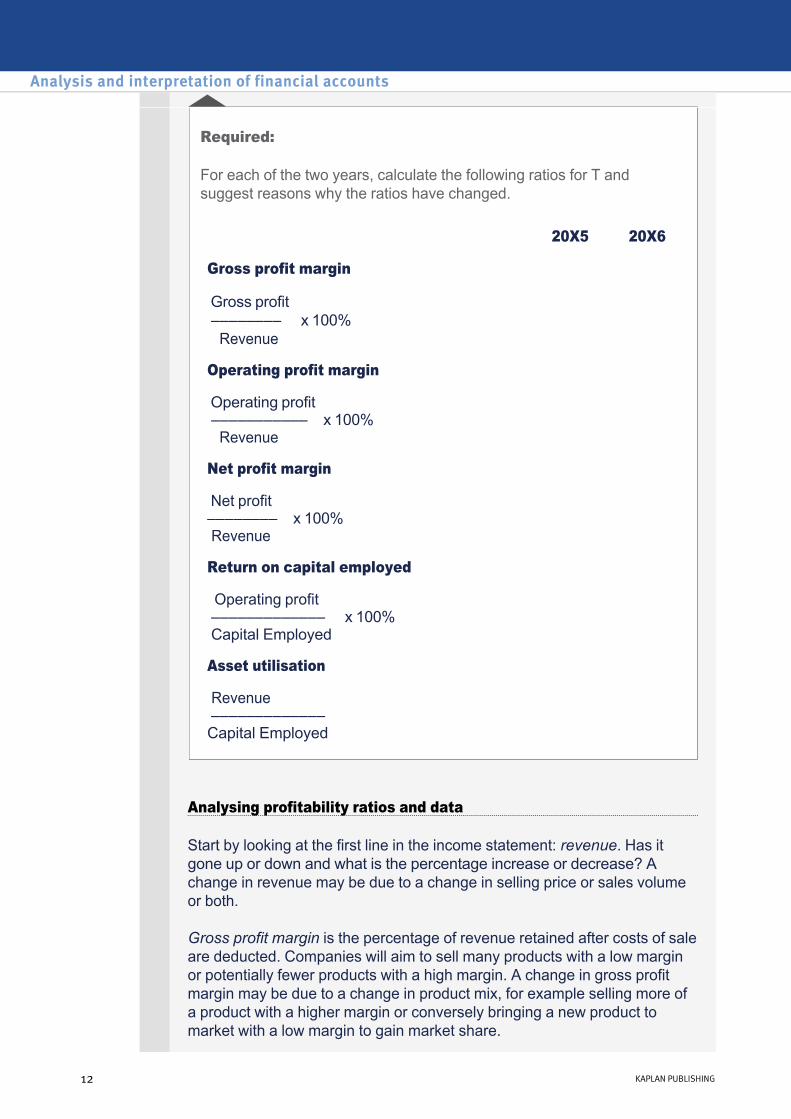
Required:
For each of the two years, calculate the following ratios for T and suggest reasons why the ratios have changed.
20X5 20X6
Gross profit margin
Gross profit –––––––– x 100% Revenue
Operating profit margin
Operating profit ––––––––––– x 100% Revenue
Net profit margin
Net profit –––––––– x 100% Revenue
Return on capital employed
Operating profit ––––––––––––– x 100% Capital Employed
Asset utilisation
Revenue ––––––––––––– Capital Employed
Analysing profitability ratios and data
Start by looking at the first line in the income statement: revenue. Has it gone up or down and what is the percentage increase or decrease? A change in revenue may be due to a change in selling price or sales volume or both.
Gross profit margin is the percentage of revenue retained after costs of sale are deducted. Companies will aim to sell many products with a low margin or potentially fewer products with a high margin. A change in gross profit margin may be due to a change in product mix, for example selling more of a product with a higher margin or conversely bringing a new product to market with a low margin to gain market share.
Analysis and interpretation of financial accounts
12 KAPLAN PUBLISHING

The operating profit margin is the trading or operating profit in relation to revenue, expressed as a percentage. The difference between gross profit margin and operating profit margin is the operating costs of the business such as administration costs, telephone costs and advertising costs. You need to use any background information provided to assess how these expenses may differ to the prior year or to another company.
Net profit margin expresses the relationship between net profit and sales. Net profit for this purpose would be profit after deduction of finance cost. It may be calculated on either pretax or posttax profit.
Noncurrent asset policies (see Illustration 1) can have a substantial effect ratios and comparison between entities. For example, there may be differences in whether an entity owns or leases assets and whether assets are measured at historical cost or are revalued. Depreciation charges will be higher for revalued assets. Depreciation may be categorised as a cost of sale or operating expense.
Exceptional items such as a profit on disposal of a noncurrent asset should be removed from the analysis to enable comparisons to be made.
Return on capital employed (ROCE) is a very useful measure when analysing performance. It assesses the efficiency with which the entity uses its assets to produce revenue and profits. You should consider any changes in capital employed and for example, whether an increase occurred towards the end of an accounting period and hence there has not yet been an opportunity for the entity to use the capital to generate increased revenue.
Asset turnover or asset utilisation is another measure of how much revenue is produced by the capital invested.
EBITDA
EBITDA is an acronym for earnings before interest, tax, depreciation and amortisation.
In recent years many large entities have adopted EBITDA as a key measure of financial performance. Sceptics suggest that they do this in order to publicise a higher measure of earnings than profit from operations (this type of measurement is sometimes cynically referred to as EBB – earnings before the bad bits).
chapter 2
KAPLAN PUBLISHING 13
Further analysis of profitability
However, it does make some sense to measure EBITDA, provided that the user fully understands what is included and what is left out. Depreciation and amortisation are accounting adjustments, not representing cash flows, that are determined by management. It can therefore be argued that excluding these items in assessing earnings eliminates a major area where management bias can operate.
Unfortunately, EBITDA is consequently often misunderstood as being a measurement of cash flow, which of course it is not. Even though two categories of noncash adjustment are eliminated, financial statements are prepared on an accruals basis. EBITDA makes no adjustments in respect of accruals or working capital movements, and so is emphatically not a cash flow measurement.
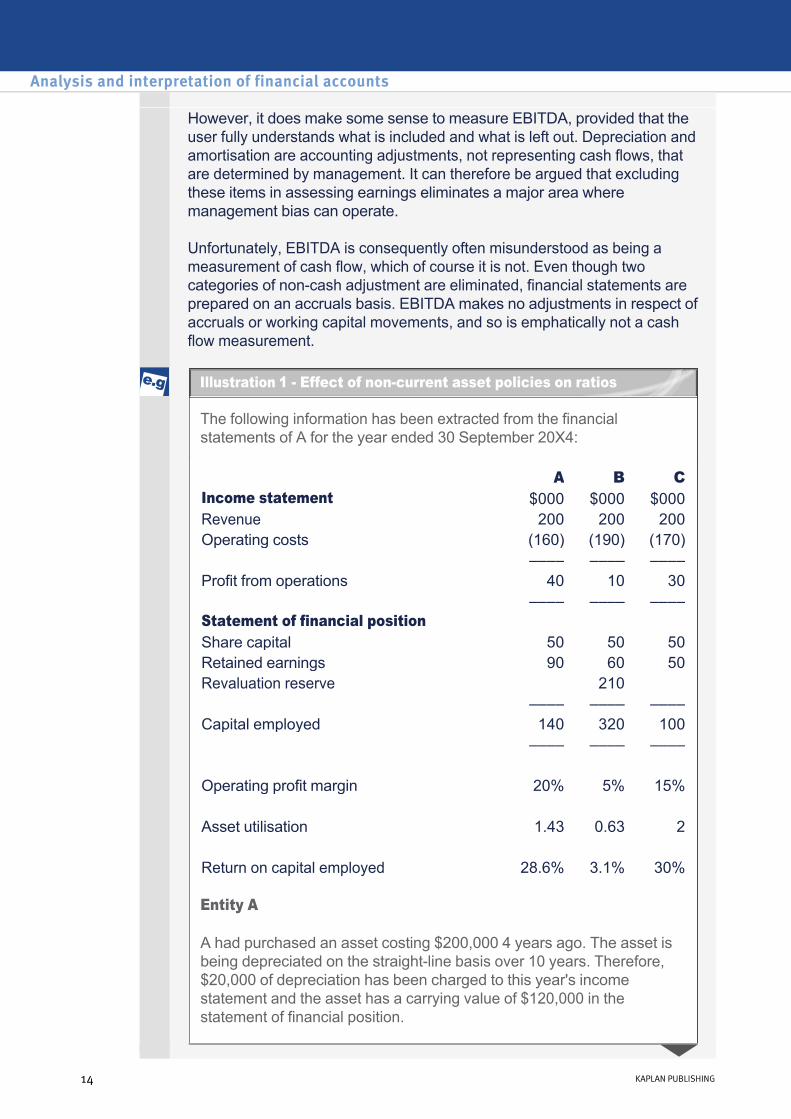
The following information has been extracted from the financial statements of A for the year ended 30 September 20X4:
Entity A
A had purchased an asset costing $200,000 4 years ago. The asset is being depreciated on the straightline basis over 10 years. Therefore, $20,000 of depreciation has been charged to this year's income statement and the asset has a carrying value of $120,000 in the statement of financial position.
A B C Income statement $000 $000 $000Revenue 200 200 200Operating costs (160) (190) (170) –––– –––– –––– Profit from operations 40 10 30 –––– –––– –––– Statement of financial position Share capital 50 50 50Retained earnings 90 60 50Revaluation reserve 210 –––– –––– –––– Capital employed 140 320 100 –––– –––– –––– Operating profit margin 20% 5% 15% Asset utilisation 1.43 0.63 2 Return on capital employed 28.6% 3.1% 30%
Analysis and interpretation of financial accounts
14 KAPLAN PUBLISHING
Illustration 1 Effect of noncurrent asset policies on ratios
B and C as entities hold a similar asset to A but have adopted the following treatments in their financial statements. They are identical to A in all other respects.
Entity B
B revalued the asset to its current value of $350,000 at the start of the current year. As a result a revaluation gain of $210,000 has been recognised and depreciation has been increased to $50,000 per annum, i.e. additional depreciation of $30,000 has been charged to the income statement in the current year.
The revaluation has caused the operating profit margin to fall due to the extra depreciation. Asset utilisation has also fallen due to the revaluation reserve being included in capital employed.
Hence the entity looks to be generating a lower return.
Entity C
C has been leasing the asset under an operating lease agreement, paying an annual rental of $30,000 which has been charged to operating expenses.
This causes the operating profit margin to fall due to the lease payments being higher than depreciation. However, the asset utilisation is higher than A since the asset is not included on the statement of financial position but is still being used by the business to generate sales.
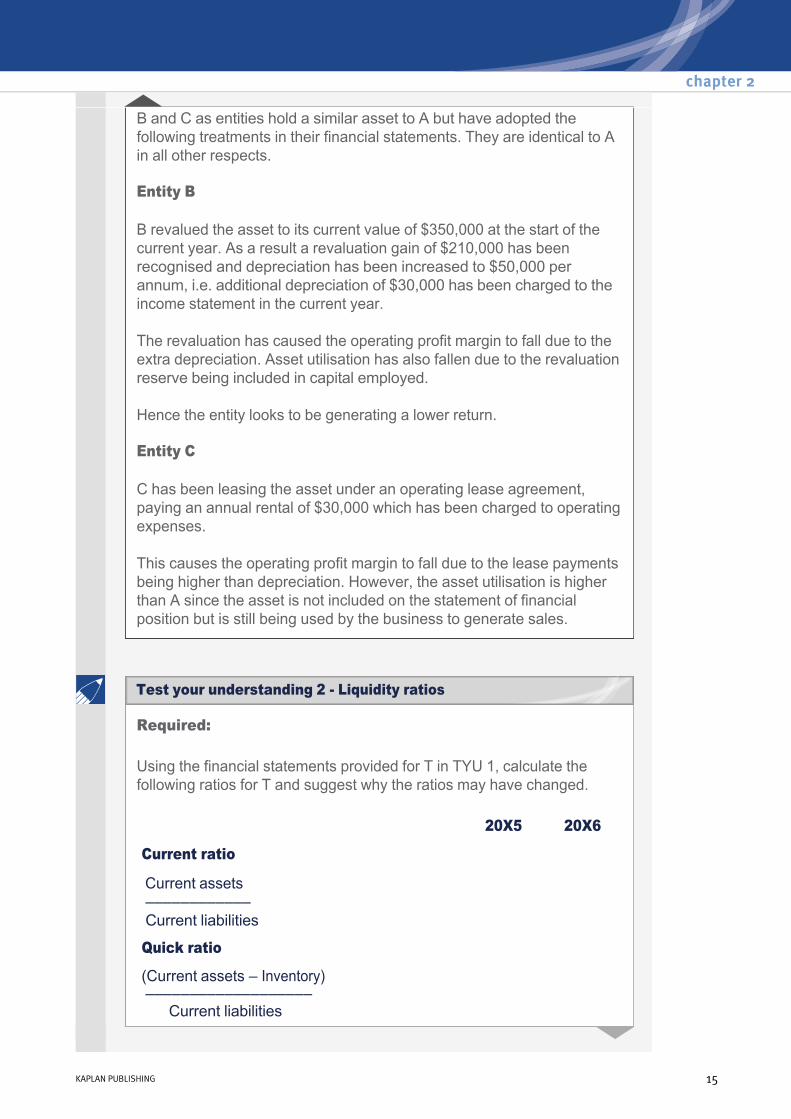
Required:
Using the financial statements provided for T in TYU 1, calculate the following ratios for T and suggest why the ratios may have changed.
20X5 20X6
Current ratio
Current assets –––––––––––– Current liabilities
Quick ratio
(Current assets – Inventory) ––––––––––––––––––– Current liabilities
chapter 2
KAPLAN PUBLISHING 15
Test your understanding 2 Liquidity ratios

Inventory holding period
Inventory ––––––––– × 365 days Cost of sales
Receivables collection period
Receivables ––––––––– × 365 days Revenue
Payables payment period
Trade payables ––––––––––– × 365 days Cost of Sales
Analysing liquidity ratios and data
The analysis of the liquidity of an entity should start with a review of the actual bank balance in absolute terms. Has the bank balance increased or decreased significantly? It could be that the overdraft is near to its permitted limit or that high cash resources indicate a good takeover prospect.
The current ratio compares current assets to current liabilities. A ratio greater than 1 indicates there are more current assets than current liabilities. The current ratio guides us to the extent the business is able to meet its current liabilities as they fall due.
The quick ratio compares current assets, excluding inventory, to current liabilities. The quick ratio gives a better indicator of liquidity if the inventory of an entity is difficult to realise into cash, for example, a whisky distillery that requires a number of months to mature before being sold.
The inventory holding period indicates how much working capital is tied up in goods in the warehouse by giving an average number of days that inventory is held before being sold. A business must balance the need to supply goods on time to customers with the risk of obsolescence.
The receivables collection period tells us the number of days it takes on average to receive payment from credit customers. It should be based on the credit agreement with customers. Cash should be collected efficiently whilst bearing in mind customers in a strong negotiating position.
The payables payment period is the length of time it takes to pay suppliers for goods bought on credit. This is effectively a free source of finance but the business should make sure suppliers are paid on a timely basis to avoid the risk of stockouts.
Analysis and interpretation of financial accounts
16 KAPLAN PUBLISHING
When a business is growing rapidly there may be a risk of overtrading, i.e. expanding the business without adequate long term finance. Inventory, receivables and payables increase but there is a decline in cash and the business may be unable to pay its suppliers as debts fall due.
You must also be aware of liquidity issues not reflected on the statement of financial position, for example contingent liabilities.
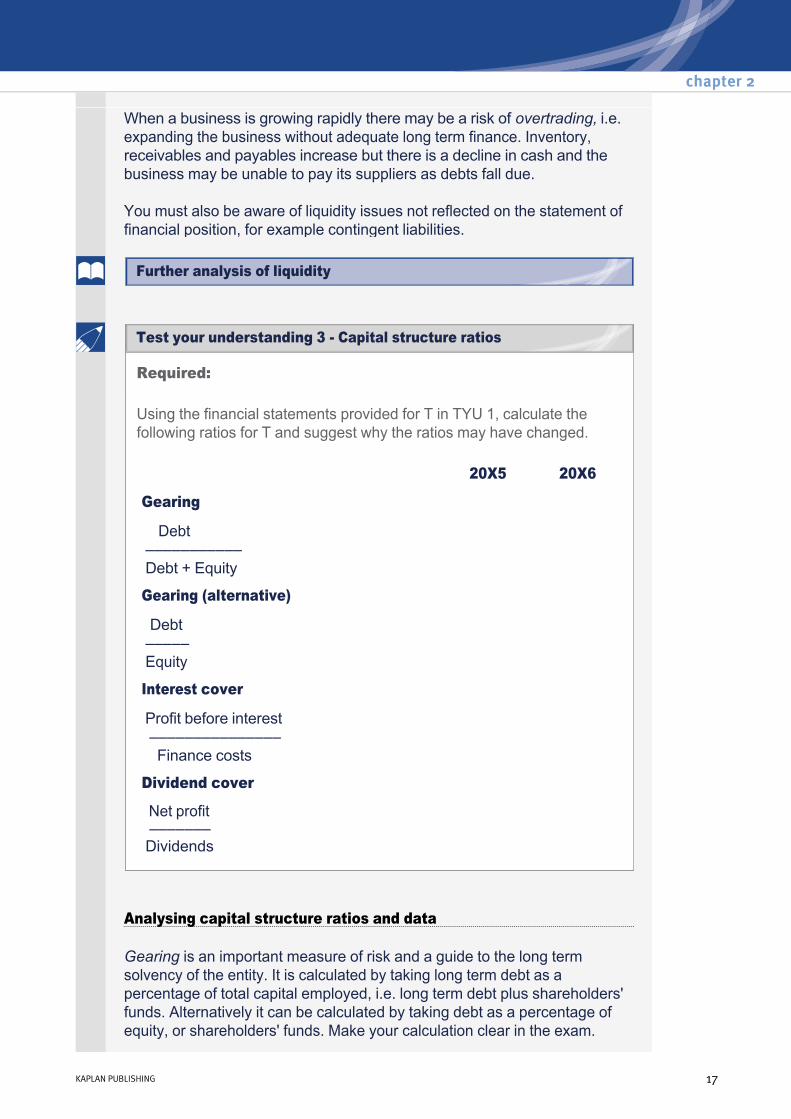
Required:
Using the financial statements provided for T in TYU 1, calculate the following ratios for T and suggest why the ratios may have changed.
20X5 20X6
Gearing
Debt ––––––––––– Debt + Equity
Gearing (alternative)
Debt ––––– Equity
Interest cover
Profit before interest ––––––––––––––– Finance costs
Dividend cover
Net profit ––––––– Dividends
Analysing capital structure ratios and data
Gearing is an important measure of risk and a guide to the long term solvency of the entity. It is calculated by taking long term debt as a percentage of total capital employed, i.e. long term debt plus shareholders' funds. Alternatively it can be calculated by taking debt as a percentage of equity, or shareholders' funds. Make your calculation clear in the exam.
chapter 2
KAPLAN PUBLISHING 17
Further analysis of liquidity
Test your understanding 3 Capital structure ratios
It is important to assess the gearing ratio against the industry average and to ensure that the debt finance is put to good use to generate revenue and profits.
The interest charged on debt finance should be compared to interest rates available to the entity from other sources. Also, debt is often secured on assets for security so there needs to be sufficient assets for this to be possible.
Interest cover indicates the number of times profits will cover the interest charge; the higher the ratio, the better. When looking at interest cover, the stability of profits is important as the interest must be paid consistently out of available profits otherwise the company may default on its debt and may have to repay it at short notice.
Dividend cover indicates the number of times profits will cover the dividend; the higher the ratio, the better as shareholders may expect a sustainable dividend payment.
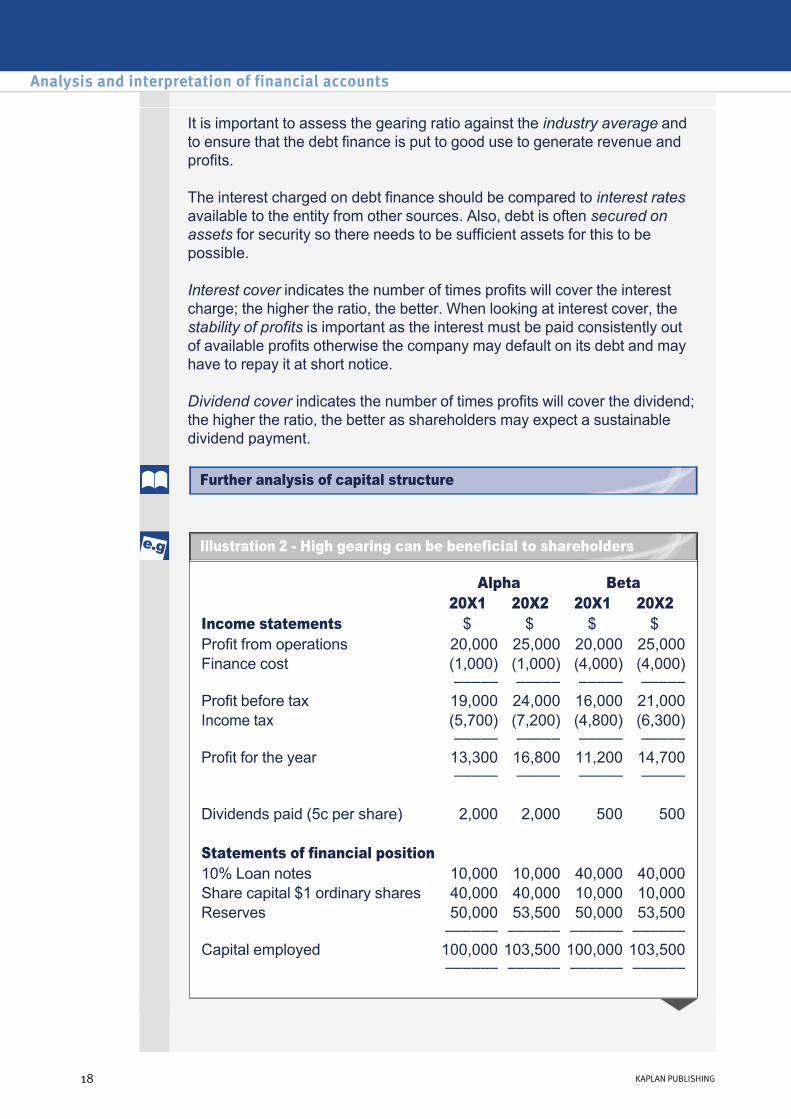
Alpha Beta 20X1 20X2 20X1 20X2 Income statements $ $ $ $Profit from operations 20,000 25,000 20,000 25,000Finance cost (1,000)
––––– (1,000) –––––
(4,000) –––––
(4,000) –––––
Profit before tax 19,000 24,000 16,000 21,000Income tax (5,700)
––––– (7,200) –––––
(4,800) –––––
(6,300) –––––
Profit for the year 13,300 –––––
16,800 –––––
11,200 –––––
14,700 –––––
Dividends paid (5c per share) 2,000 2,000 500 500 Statements of financial position 10% Loan notes 10,000 10,000 40,000 40,000Share capital $1 ordinary shares 40,000 40,000 10,000 10,000Reserves 50,000
–––––– 53,500 ––––––
50,000 ––––––
53,500 ––––––
Capital employed 100,000 ––––––
103,500 ––––––
100,000 ––––––
103,500 ––––––
Analysis and interpretation of financial accounts
18 KAPLAN PUBLISHING
Illustration 2 High gearing can be beneficial to shareholders
Further analysis of capital structure

Beta is more highly geared than Alpha in 20X1, but both companies have the same amount of capital employed in total and generate the same returns overall:
In 20X2 there is a 25% increase in the profits of both companies. However the shareholders of Beta benefit more than the shareholders of Alpha:
Alpha Beta 20X1 20X1 Gearing (Debt/ debt + equity) 10% 40%ROCE (Operating profit/ debt + equity) 20% 20%
Alpha Beta 20X1 20X2 20X1 20X2 Return on equity 14.8% 18.0% 18.7% 23.1%(Net profit/ equity) Increase on prior year +22.4% +23.5%Earnings per share (see chapter 3) 33.25c 42c 112c 147c(Net profit/ no. of shares) Increase on prior year +26.3% +31.25%
Analysing investor ratios and data
When appraising a company as a potential investment, all the ratios discussed above may be used. This information may be supplemented by further ratios specifically for investors.
The market price of an ordinary share if often used in this analysis.
Price earnings ratio
A common benchmark for investors analysing different companies is the use of the price/earnings (P/E) ratio:
Earnings per share is basically the earnings available for distribution divided by the number of ordinary shares in issue. The calculation of earnings per share is covered in detail in Chapter 3.
The P/E ratio calculation produces a number which can be useful for assessing the relative risk of an investment.
Current market price per share––––––––––––––––––––––
Earnings per share
chapter 2
KAPLAN PUBLISHING 19

V WCurrent market price per share
396c 288c
Most recent earnings per share
13.4c 35.6c
P/E ratio 29.6 8.1
W has much higher earnings per share than V, but the price of one share in W is lower than one share in V, giving rise to two very different P/E ratios. Generally, the lower the P/E ratio the greater the indication of risk for the investor.
The rational expectations of buyers and sellers in the stock market tend to be incorporated in the price of the share. The P/E ratios of these entities tend to suggest that the market considers investment in W to be riskier than investment in V.
There may be reasons to account for this difference, for example:
As usual, the process of analysis leads to demands for more information. A better picture could be obtained of V and W if share price graphs for the last year, for example, were available, so that the analyst could see whether the share prices quoted above are near to average or not.
• The numerator of the fraction is current (an uptodate market price can be obtained easily during the market’s opening hours), but the EPS figure is the latest available which, for a listed entity in many markets, can be up to 6 months old. The EPS of either entity may therefore be quite significantly out of date.
• W may have issued a profits warning, or might have suffered adverse events, such as, for example, the loss of a major contract or the resignation of a key director. These events may have depressed the share price.
• W may be in a sector which is unfashionable or relatively undervalued.
• W may have had a difficult recent history with a volatile pattern of earnings. On the whole, markets prefer companies with a smooth profit record.
Analysis and interpretation of financial accounts
20 KAPLAN PUBLISHING
Illustration 3 P/E ratios

Dividend related ratios
Growth potential and the ability to generate future wealth in the business may depend on the amount of profits retained. This relationship may be measured using the profit retention ratio:
The higher the proportion of earnings retained, the higher the growth potential. Cash is retained in the business for growth as opposed to being paid to shareholders.
When analysing financial statements from an investor’s point of view it is important to identify the objectives of the investor. Does the investor require high capital growth, usually associated with high risk, or a lower risk fixed dividend payment and low capital growth?
Dividend yield will indicate the return on capital investment, relative to market price:
Dividend cover measures the ability of the entity to maintain the existing level of dividend and is used in conjunction with the dividend yield:
The higher the dividend cover, the more likely it is that the dividend yield can be maintained.
Profit after dividends –––––––––––––––––––––– x 100
Profit before dividends
Dividend per share –––––––––––––––––––– x 100Market price per share
Earnings per share––––––––––––––––––––
Dividends per share
chapter 2
KAPLAN PUBLISHING 21
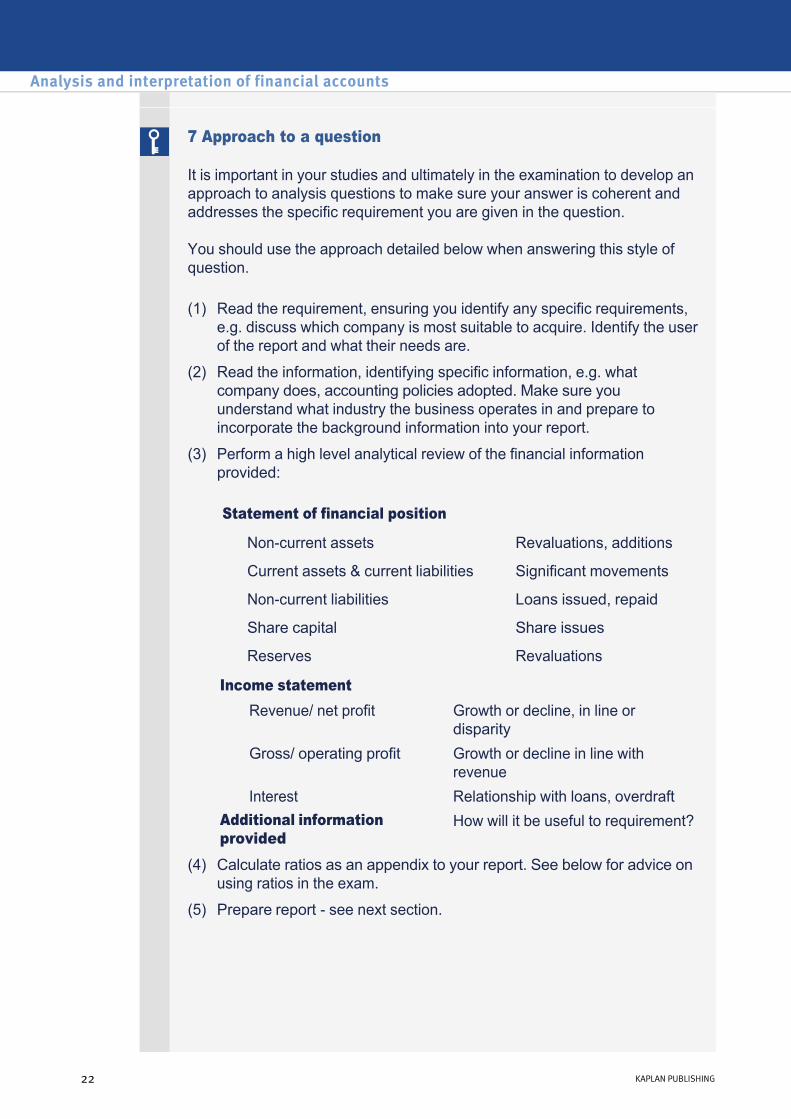
7 Approach to a question
It is important in your studies and ultimately in the examination to develop an approach to analysis questions to make sure your answer is coherent and addresses the specific requirement you are given in the question.
You should use the approach detailed below when answering this style of question.
(1) Read the requirement, ensuring you identify any specific requirements, e.g. discuss which company is most suitable to acquire. Identify the user of the report and what their needs are.
(2) Read the information, identifying specific information, e.g. what company does, accounting policies adopted. Make sure you understand what industry the business operates in and prepare to incorporate the background information into your report.
(3) Perform a high level analytical review of the financial information provided:
Statement of financial position
Noncurrent assets Revaluations, additions
Current assets & current liabilities Significant movements
Noncurrent liabilities Loans issued, repaid
Share capital Share issues
Reserves Revaluations
Income statement Revenue/ net profit Growth or decline, in line or
disparityGross/ operating profit Growth or decline in line with
revenueInterest Relationship with loans, overdraft
Additional information provided
How will it be useful to requirement?
(4) Calculate ratios as an appendix to your report. See below for advice on using ratios in the exam.
(5) Prepare report see next section.
Analysis and interpretation of financial accounts
22 KAPLAN PUBLISHING

It is important that candidates read the additional information in the context of the scenario presented. This often provides further insight into the obstacles facing/changes to the entity under scrutiny. At the very least this should guide observations (and, if required, the choice of ratios calculated) to ensure responses are applied, rather than just robotic. It is also important that candidates do not hypothesise about a subject, only to find their assumptions are contradicted by the additional information.
Using ratios in the exam
When answering a Financial Management question it is important to be able to calculate ratios with a fair degree of accuracy from the information provided. However, students should bear in mind the following points:
• Only a proportion of the marks will be awarded for calculation, and this proportion may be relatively small. Generally, the majority of the marks will be awarded for the analysis and interpretation of data given in the question. Therefore, it is important not to get too absorbed in the calculations themselves; they are a means to an end. So far the calculations have been introduced; the next sections provide much more detailed guidance as to the interpretation and analysis of financial statements.
• Where a question asks for calculation of, say, ‘relevant ratios’, it is best to be fairly selective. Calculating the full range of ratios, as given in this chapter, may be inappropriate for the circumstances of the question. Time can be wasted in calculating ratios that are really not very useful.
• Some ratios may be of limited use, or may even be misleading in the context of service businesses. For example, care should be taken in respect of return on capital ratios in businesses with a low level of conventional noncurrent assets but a high level of unrecognised intellectual capital ‘assets’.
• It is appropriate to round to no more than one decimal place.
• The selection of ratios is important. Do not just select the same ratios that were used in a different question or favoured ratios; this will inevitably lead to a vague/generalised response. Select ratios that are appropriate to the circumstances of the scenario and the audience of your report. For example: if you are responding to a bank liquidity and gearing ratios are likely to be of prime importance. If you are responding to a potential shareholder then dividend ratios and EPS are likely to be key.
8 Preparing a report
Format
It is best practice to format your answer in a report style, i.e. use headings for To, From, Date and Subject. When addressing your report to somebody, think about who the report is for and what their needs are.
chapter 2
KAPLAN PUBLISHING 23
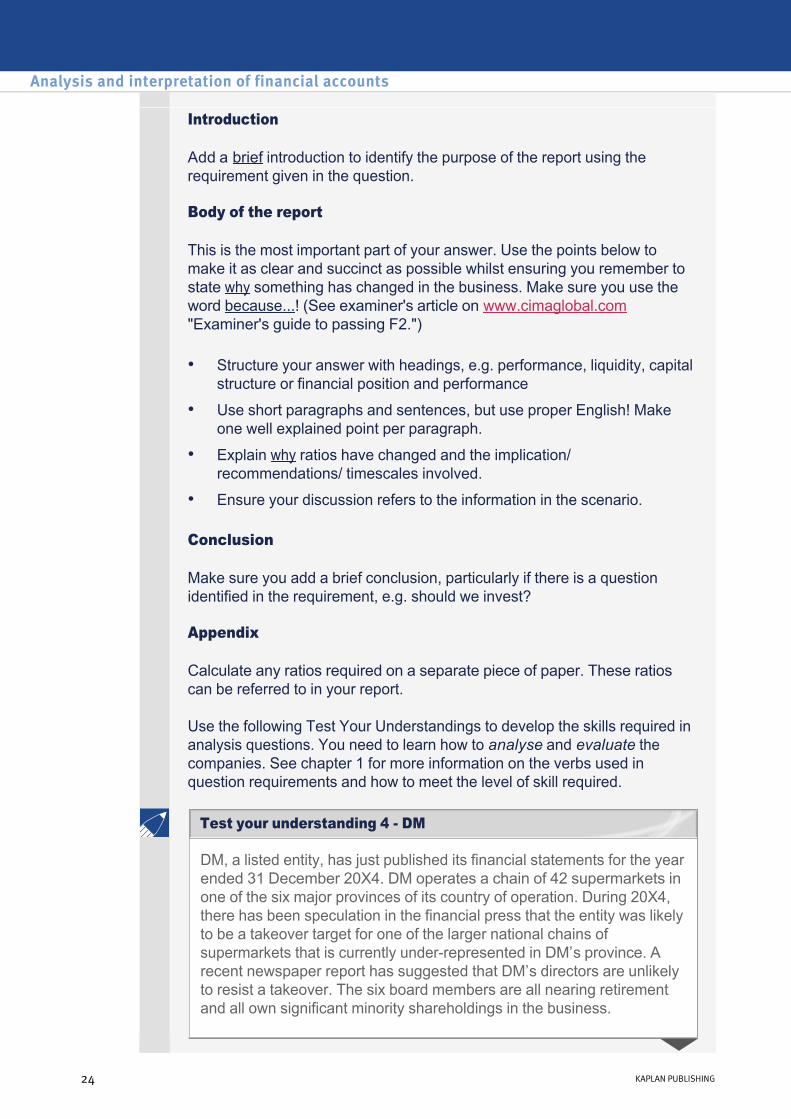
Introduction
Add a brief introduction to identify the purpose of the report using the requirement given in the question.
Body of the report
This is the most important part of your answer. Use the points below to make it as clear and succinct as possible whilst ensuring you remember to state why something has changed in the business. Make sure you use the word because...! (See examiner's article on www.cimaglobal.com "Examiner's guide to passing F2.")
Conclusion
Make sure you add a brief conclusion, particularly if there is a question identified in the requirement, e.g. should we invest?
Appendix
Calculate any ratios required on a separate piece of paper. These ratios can be referred to in your report.
Use the following Test Your Understandings to develop the skills required in analysis questions. You need to learn how to analyse and evaluate the companies. See chapter 1 for more information on the verbs used in question requirements and how to meet the level of skill required.
• Structure your answer with headings, e.g. performance, liquidity, capital structure or financial position and performance
• Use short paragraphs and sentences, but use proper English! Make one well explained point per paragraph.
• Explain why ratios have changed and the implication/ recommendations/ timescales involved.
• Ensure your discussion refers to the information in the scenario.
DM, a listed entity, has just published its financial statements for the year ended 31 December 20X4. DM operates a chain of 42 supermarkets in one of the six major provinces of its country of operation. During 20X4, there has been speculation in the financial press that the entity was likely to be a takeover target for one of the larger national chains of supermarkets that is currently underrepresented in DM’s province. A recent newspaper report has suggested that DM’s directors are unlikely to resist a takeover. The six board members are all nearing retirement and all own significant minority shareholdings in the business.
Analysis and interpretation of financial accounts
24 KAPLAN PUBLISHING
Test your understanding 4 DM

You have been approached by a private shareholder in DM. She is concerned that the directors have a conflict of interests and that the financial statements for 20X4 may have been manipulated.
The income statement and summarised statement of changes in equity of DM, with comparatives, for the year ended 31 December 20X4, and a statement of financial position, with comparatives, at that date are as follows:
Income statements
20X4 20X3 $m $m
Revenue 1,255 1,220Cost of sales (1,177) (1,145)
–—–– –—–– Gross profit 78 75Operating expenses (21) (29) ––– —–– Profit from operations 57 46Finance cost (10) (10) –—– ––– Profit before tax 47 36Income tax (14) (13) —–– —–– Net profit 33 23 —–– —–– Summarised statements of changes in equity 20X4 20X3
$m $mOpening balance 276 261Profit for the period 33 23Dividends (8) (8) –—– —–– Closing balance 301 276 –—– –—–
chapter 2
KAPLAN PUBLISHING 25
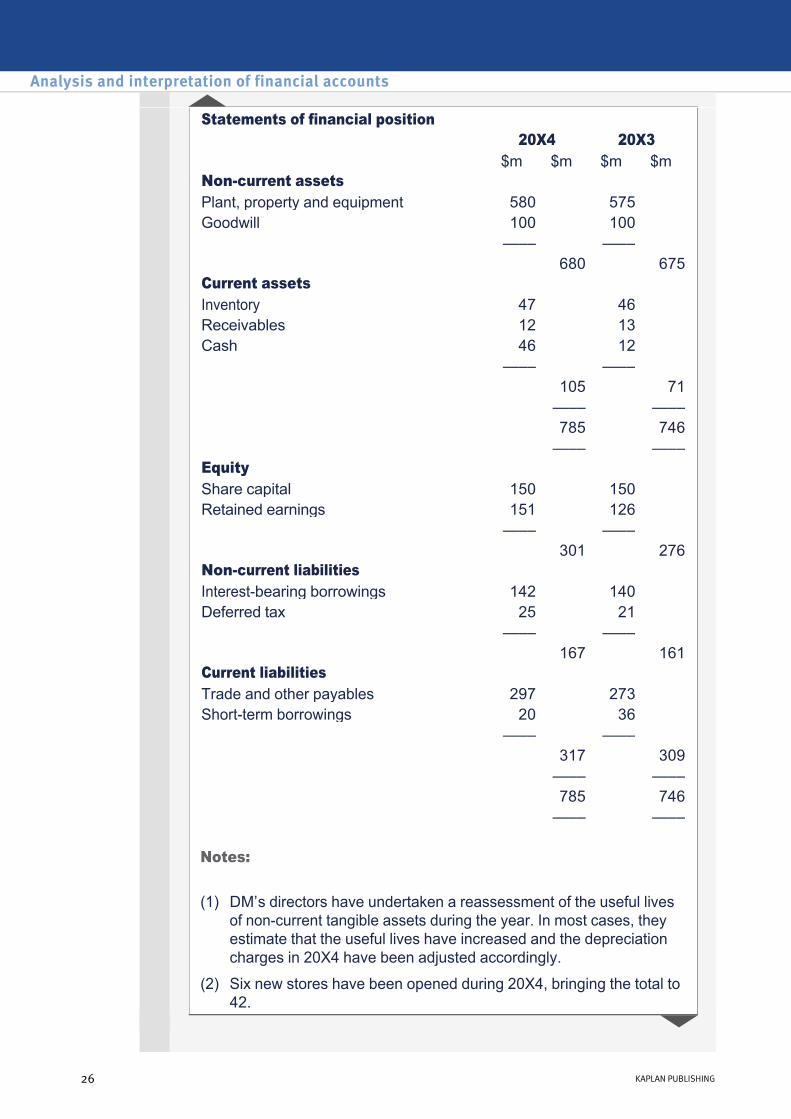
Notes:
Statements of financial position 20X4 20X3
$m $m $m $mNoncurrent assets Plant, property and equipment 580 575 Goodwill 100 100 —–– —–– 680 675Current assets Inventory 47 46 Receivables 12 13 Cash 46 12 —–– —–– 105 71 —–– —–– 785 746 —–– —–– Equity Share capital 150 150 Retained earnings 151 126 —–– —–– 301 276Noncurrent liabilities Interestbearing borrowings 142 140 Deferred tax 25 21 —–– —–– 167 161Current liabilities Trade and other payables 297 273 Shortterm borrowings 20 36 —–– —–– 317 309
—–– —–– 785 746 —–– —––
(1) DM’s directors have undertaken a reassessment of the useful lives of noncurrent tangible assets during the year. In most cases, they estimate that the useful lives have increased and the depreciation charges in 20X4 have been adjusted accordingly.
(2) Six new stores have been opened during 20X4, bringing the total to 42.
Analysis and interpretation of financial accounts
26 KAPLAN PUBLISHING

Required:
(3) Four key ratios for the supermarket sector (based on the latest available financial statements of 12 listed entities in the sector) are as follows: (i) Annual sales per store: $27.6m
(ii) Gross profit margin: 5.9%
(iii) Net profit margin: 3.9%
(iv) Noncurrent asset turnover (including both tangible and intangible noncurrent assets): 1.93.
(a) Prepare a report, addressed to the investor, analysing the performance and position of DM based on the financial statements and supplementary information provided above. The report should also include comparisons with the key sector ratios, and it should address the investor’s concerns about the possible manipulation of the 20X4 financial statements.
(b) Explain the limitations of the use of sector comparatives in financial analysis.
You are the management accountant of Expand, a company incorporated in Dollarland. The company is seeking to grow by acquisition and has identified two potential investment opportunities. One of these, Hone, is also a company incorporated in Dollarland. The other, Over, is a company incorporated in Francland.
You have been presented with financial information relating to both companies. The financial information is extracted from their published financial statements. In both cases, the financial statements conform to domestic accounting standards. The financial statements of Hone were drawn up in dollars ($) while those of Over were drawn up in Francs. The information relating to Over has been expressed in dollars by taking the figures in Francs and dividing by 1.55 – the dollar/franc exchange rate at 31 December 20X2. The financial information is given below.
chapter 2
KAPLAN PUBLISHING 27
Test your understanding 5 Expand
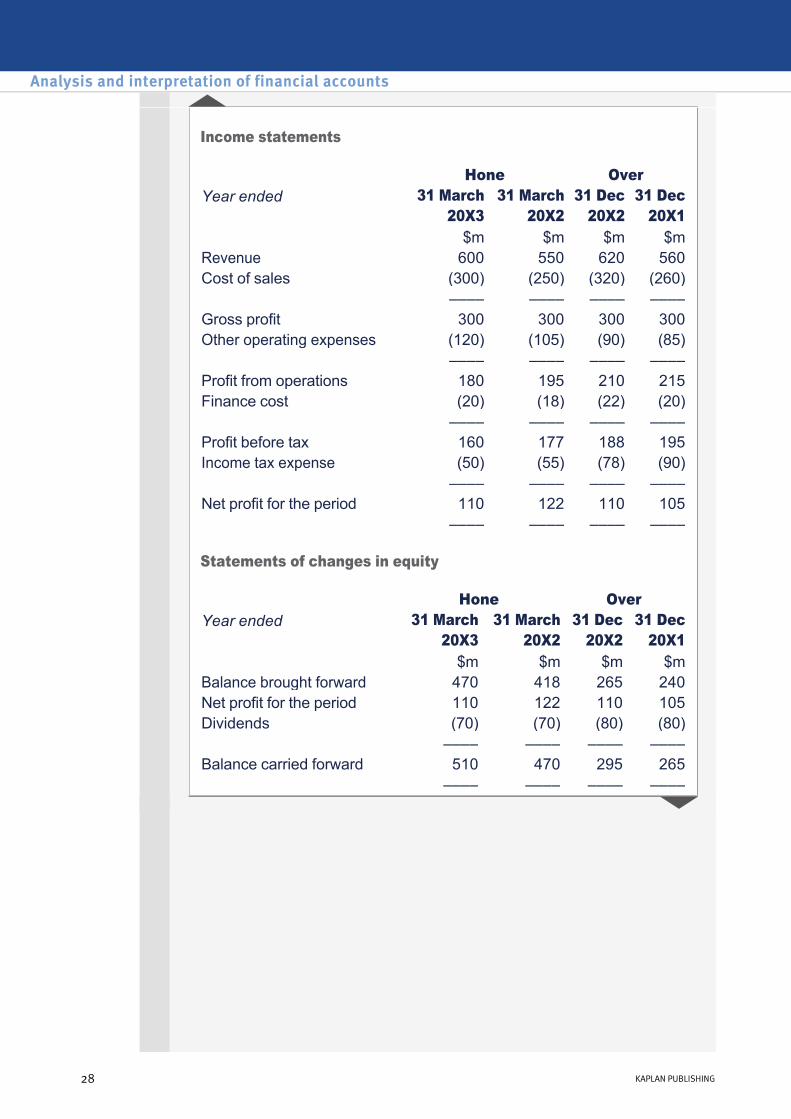
Income statements
Statements of changes in equity
Hone Over Year ended 31 March 31 March 31 Dec 31 Dec
20X3 20X2 20X2 20X1 $m $m $m $m
Revenue 600 550 620 560Cost of sales (300) (250) (320) (260) –––– –––– –––– –––– Gross profit 300 300 300 300Other operating expenses (120) (105) (90) (85) –––– –––– –––– –––– Profit from operations 180 195 210 215Finance cost (20) (18) (22) (20) –––– –––– –––– –––– Profit before tax 160 177 188 195Income tax expense (50) (55) (78) (90) –––– –––– –––– –––– Net profit for the period 110 122 110 105
–––– –––– –––– ––––
Hone Over Year ended 31 March 31 March 31 Dec 31 Dec
20X3 20X2 20X2 20X1 $m $m $m $m
Balance brought forward 470 418 265 240Net profit for the period 110 122 110 105Dividends (70) (70) (80) (80) –––– –––– –––– –––– Balance carried forward 510 470 295 265
–––– –––– –––– ––––
Analysis and interpretation of financial accounts
28 KAPLAN PUBLISHING
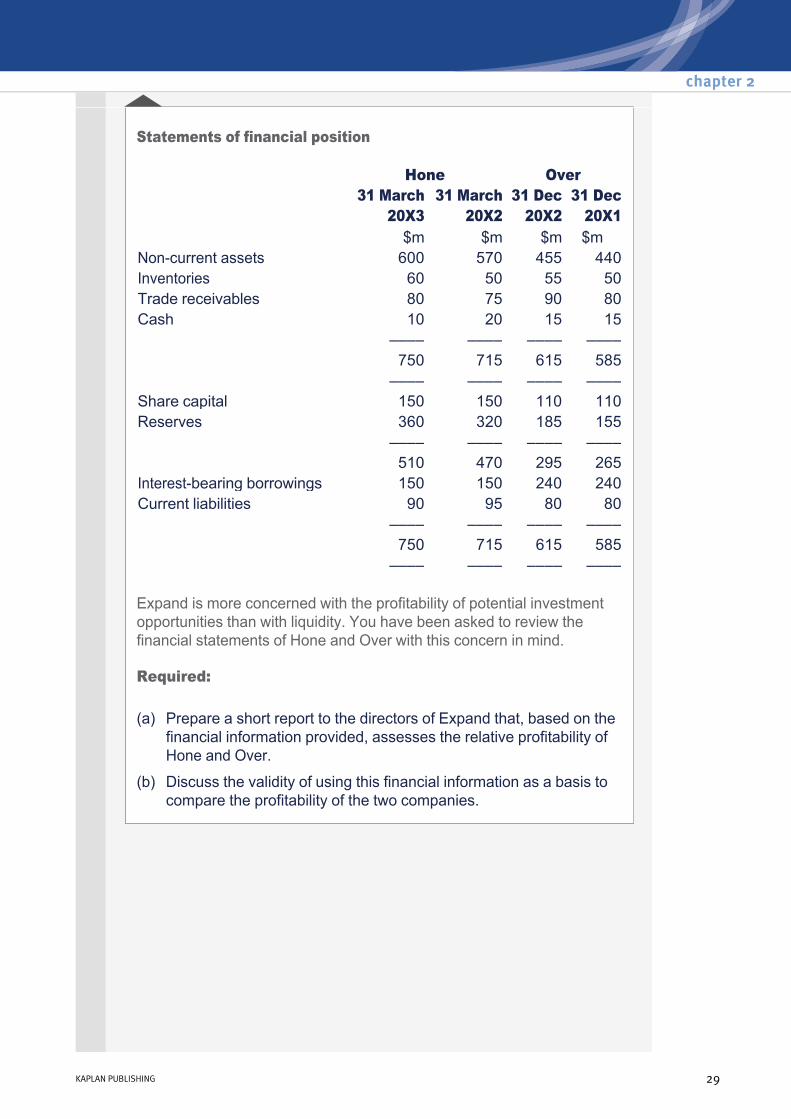
Statements of financial position
Expand is more concerned with the profitability of potential investment opportunities than with liquidity. You have been asked to review the financial statements of Hone and Over with this concern in mind.
Required:
Hone Over 31 March 31 March 31 Dec 31 Dec 20X3 20X2 20X2 20X1 $m $m $m $m
Noncurrent assets 600 570 455 440Inventories 60 50 55 50Trade receivables 80 75 90 80Cash 10 20 15 15 –––– –––– –––– –––– 750 715 615 585 –––– –––– –––– –––– Share capital 150 150 110 110Reserves 360 320 185 155 –––– –––– –––– –––– 510 470 295 265Interestbearing borrowings 150 150 240 240Current liabilities 90 95 80 80
–––– –––– –––– –––– 750 715 615 585 –––– –––– –––– ––––
(a) Prepare a short report to the directors of Expand that, based on the financial information provided, assesses the relative profitability of Hone and Over.
(b) Discuss the validity of using this financial information as a basis to compare the profitability of the two companies.
chapter 2
KAPLAN PUBLISHING 29
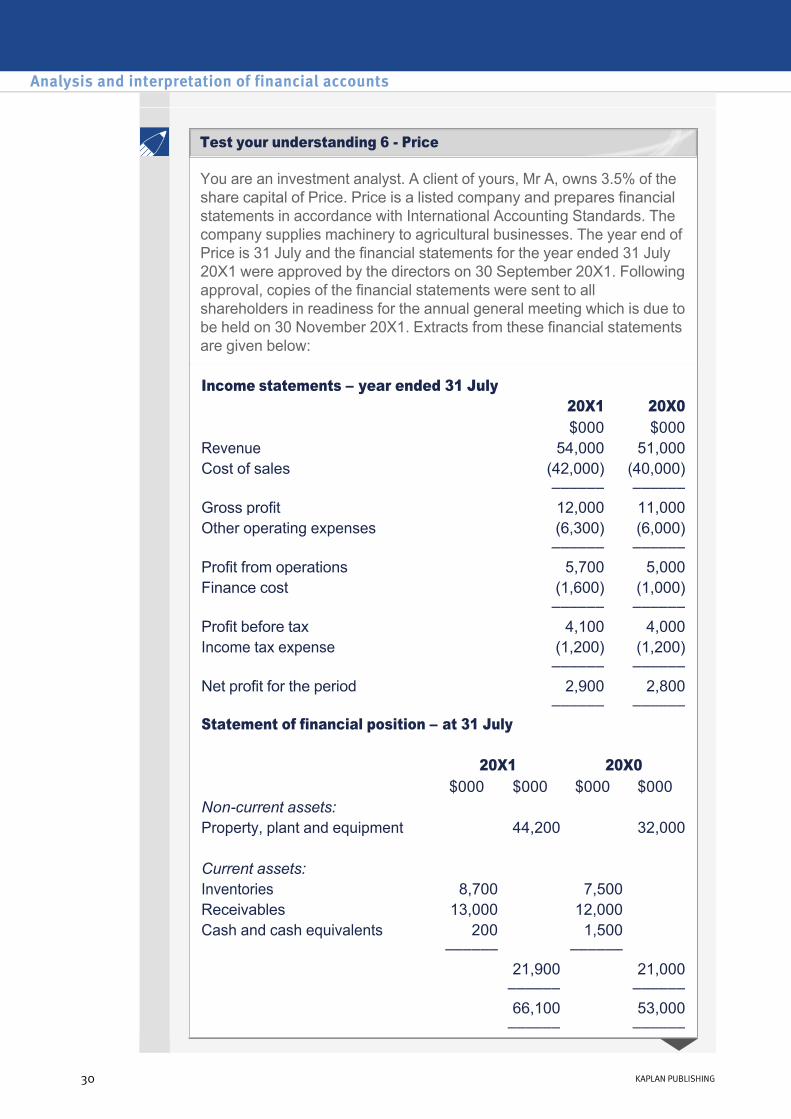
You are an investment analyst. A client of yours, Mr A, owns 3.5% of the share capital of Price. Price is a listed company and prepares financial statements in accordance with International Accounting Standards. The company supplies machinery to agricultural businesses. The year end of Price is 31 July and the financial statements for the year ended 31 July 20X1 were approved by the directors on 30 September 20X1. Following approval, copies of the financial statements were sent to all shareholders in readiness for the annual general meeting which is due to be held on 30 November 20X1. Extracts from these financial statements are given below:
Income statements – year ended 31 July 20X1 20X0
$000 $000Revenue 54,000 51,000Cost of sales (42,000)
–––––– (40,000) ––––––
Gross profit 12,000 11,000Other operating expenses (6,300)
–––––– (6,000) ––––––
Profit from operations 5,700 5,000Finance cost (1,600)
–––––– (1,000) ––––––
Profit before tax 4,100 4,000Income tax expense (1,200)
–––––– (1,200) ––––––
Net profit for the period 2,900 ––––––
2,800 ––––––
Statement of financial position – at 31 July
20X1 20X0 $000 $000 $000 $000
Noncurrent assets: Property, plant and equipment 44,200 32,000
Current assets: Inventories 8,700 7,500 Receivables 13,000 12,000 Cash and cash equivalents 200
–––––– 1,500 ––––––
21,900 ––––––
21,000 ––––––
66,100 ––––––
53,000 ––––––
Analysis and interpretation of financial accounts
30 KAPLAN PUBLISHING
Test your understanding 6 Price
Extracts from notes to the financial statements
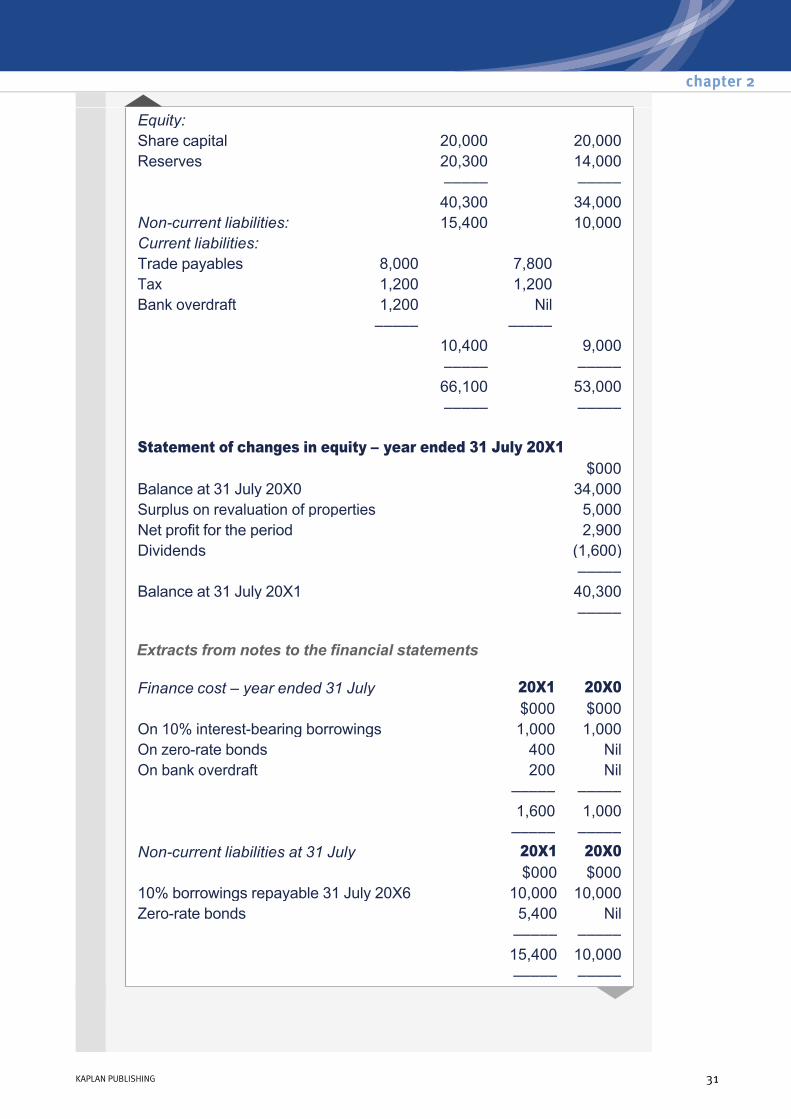
Equity: Share capital 20,000 20,000Reserves 20,300 14,000 ––––– ––––– 40,300 34,000Noncurrent liabilities: 15,400 10,000Current liabilities: Trade payables 8,000 7,800 Tax 1,200 1,200 Bank overdraft 1,200 Nil
––––– ––––– 10,400 9,000 ––––– ––––– 66,100 53,000 ––––– –––––
Statement of changes in equity – year ended 31 July 20X1 $000Balance at 31 July 20X0 34,000Surplus on revaluation of properties 5,000Net profit for the period 2,900Dividends (1,600) ––––– Balance at 31 July 20X1 40,300 –––––
Finance cost – year ended 31 July 20X1 20X0 $000 $000
On 10% interestbearing borrowings 1,000 1,000On zerorate bonds 400 NilOn bank overdraft 200 Nil
––––– ––––– 1,600 1,000 ––––– –––––
Noncurrent liabilities at 31 July 20X1 20X0 $000 $000
10% borrowings repayable 31 July 20X6 10,000 10,000Zerorate bonds 5,400 Nil
––––– ––––– 15,400 10,000 ––––– –––––
chapter 2
KAPLAN PUBLISHING 31
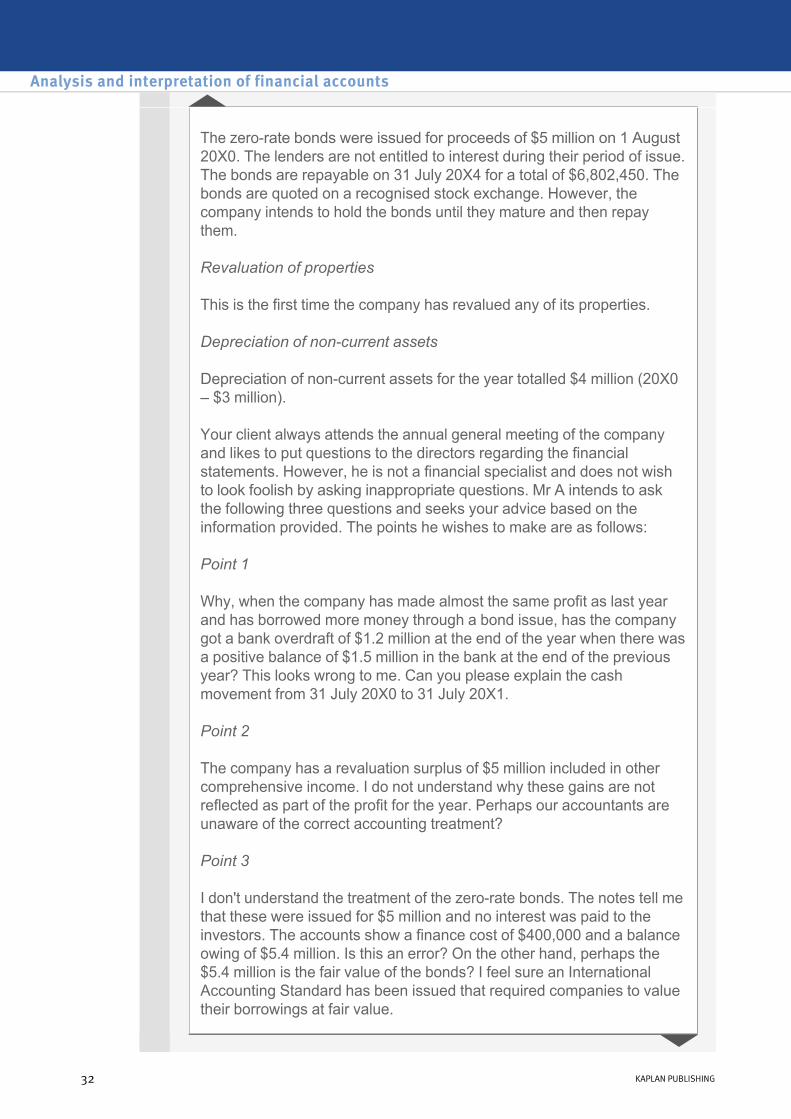
The zerorate bonds were issued for proceeds of $5 million on 1 August 20X0. The lenders are not entitled to interest during their period of issue. The bonds are repayable on 31 July 20X4 for a total of $6,802,450. The bonds are quoted on a recognised stock exchange. However, the company intends to hold the bonds until they mature and then repay them.
Revaluation of properties
This is the first time the company has revalued any of its properties.
Depreciation of noncurrent assets
Depreciation of noncurrent assets for the year totalled $4 million (20X0 – $3 million).
Your client always attends the annual general meeting of the company and likes to put questions to the directors regarding the financial statements. However, he is not a financial specialist and does not wish to look foolish by asking inappropriate questions. Mr A intends to ask the following three questions and seeks your advice based on the information provided. The points he wishes to make are as follows:
Point 1
Why, when the company has made almost the same profit as last year and has borrowed more money through a bond issue, has the company got a bank overdraft of $1.2 million at the end of the year when there was a positive balance of $1.5 million in the bank at the end of the previous year? This looks wrong to me. Can you please explain the cash movement from 31 July 20X0 to 31 July 20X1.
Point 2
The company has a revaluation surplus of $5 million included in other comprehensive income. I do not understand why these gains are not reflected as part of the profit for the year. Perhaps our accountants are unaware of the correct accounting treatment?
Point 3
I don't understand the treatment of the zerorate bonds. The notes tell me that these were issued for $5 million and no interest was paid to the investors. The accounts show a finance cost of $400,000 and a balance owing of $5.4 million. Is this an error? On the other hand, perhaps the $5.4 million is the fair value of the bonds? I feel sure an International Accounting Standard has been issued that required companies to value their borrowings at fair value.
Analysis and interpretation of financial accounts
32 KAPLAN PUBLISHING

Required:
Prepare a reply to Mr A that evaluates the issues he has raised in the three points and provides appropriate advice. You should support your advice with references to International Accounting Standards.
9 Analysis of the statement of cash flows
The cash flow of an entity is regarded by many users as being of primary importance in understanding the operations of the business. After all, a business that cannot generate sufficient cash will, sooner or later, fail.
The statement of cash flows provides valuable information for the analysis of a business’s operations and position. Students should note that the analysis of cash flow statements is examinable in Financial Management.
The statement of cash flows prepared in accordance with IAS 7 categorises cash flow under three principal headings: cash flows from operating activities, investing activities and financing activities. As well as comparing these totals from year to year, cash flows in the following areas should be reviewed:
There are also useful ratios that can be calculated, see supplementary reading for further information.
• cash generation from trading operations
• dividend and interest payments
• capital expenditure
• financial investment
• management of financing
• net cash flow
chapter 2
KAPLAN PUBLISHING 33
Cash flow ratios
Detailed analysis of the statement of cash flows
10 Segmental analysis
One of the limitations mentioned above is that different entities may have different segments to their business. Comparing businesses as a whole may not be appropriate if the segments account for different proportions of the overall business and the activities of each segment are not similar.
It is also beneficial for users to be aware of how the individual segments of a business contribute to its overall financial performance and position and how changes in its segments may impact on the business as whole.
IFRS 8 Operating Segments addresses these issues and requires entities to disclose certain segmental information.
IFRS 8 was issued in November 2006 and replaced the existing standard IAS 14 Segment Reporting. The principal reason for issuing a new standard in this area was to achieve convergence with US GAAP. In this instance convergence was achieved by adopting many aspects of the US standard. IFRS 8 has been subject to a degree of criticism in some quarters (and especially within the European Union) because the IASB is seen as having uncritically adopted US regulation, and also because there are, it is argued, flaws in the new standard. These will be identified and discussed below.
The requirements of IFRS 8 only apply to publicly listed entities, although nonlisted entities are encouraged to comply.
Identification of operating segments
Operating segments are identified on the basis of internal reports that are regularly reviewed by the chief operating decision maker.
IFRS 8 defines an operating segment as a component of an entity:
Not all operations of an entity will necessarily be an operating segment. For example, the corporate headquarters does not earn revenue therefore is not an operating segment.
However, the definition does include business segments whose activities are principally concerned with trading intragroup.
• that engages in business activities from which it may earn revenues and incur expenses (including intragroup revenues and expenses);
• whose operating results are reviewed regularly by the entity’s chief operating decision maker to make decisions about resources to be allocated to the segment and assess its performance; and
• for which discrete financial information is available.
Analysis and interpretation of financial accounts
34 KAPLAN PUBLISHING
Reportable segments
IFRS 8 sets quantitative thresholds for reporting. Entities should report information about an operating segment that meets the 10% rule:
10% rule
Segments should be classed as reportable segments if they account for more than 10% of total revenue, more than 10% of total profit or hold more than 10% of total assets.
75% rule
If, after allocating segments according to the 10% rule, the revenue of reportable segments is less than 75% of the total revenue of the entity, additional segments will be classified as reportable segments even though they do not meet the 10% rule.
Benefits of segmental information
More appropriate assessment of performance of entity
Separate segments may have wide ranges of profitability, cash flows, growth, future prospects and risks. Without information on these segments, users would not be able to identify these differences and it would be impossible to properly assess performance and future prospects of the entity.
IFRS 8 requires information to be provided on the revenue, expense, profits, assets and liabilities of each segment. With this information, users can calculate the profit margins, asset utilisation and return on capital employed of each segment and so further analyse the performance of each segment.
IFRS 8 is designed to allow users to see the type and categories of information that are used at the highest levels in the entity for decisionmaking. There is the further advantage that disclosure, while in many cases extensive, should not be excessively costly because it is based upon information reported and used within the business.
chapter 2
KAPLAN PUBLISHING 35
Limitations of segmental information
Defining segments
One of the criticisms of IFRS 8 is that it allows an entity’s managers to determine what is a reportable segment. Managers, therefore, are potentially able to conceal information by judicious selection of segments. A further, related, criticism is that comparability of segment information between businesses suffers because segment identification is likely to differ between businesses. However, it should be recognised that comparability between businesses is often problematic, and users should in any case be very cautious when comparing entities even if they appear, superficially, to be quite similar in their operations.
Measurement of segment information
IFRS 8 also does not define segment revenue, segment expense, segment result, segment assets or segment liabilities, but does require an explanation of how segment profit or loss, segment assets and segment liabilities are measured for each operating segment.
As a consequence, entities will have more discretion in determining what is included in segment profit or loss under IFRS 8, limited only by their internal reporting practices.
Apportionment of 'common' items
Allocations of revenues, expenses, gains and losses are included only if they are included when the chief operating decision maker reviews the information. The same goes for assets and liabilities which can be difficult to apportion.
IFRS 8 does not prescribe how centrally incurred expenses should be allocated or whether they should be allocated at all. IFRS 8 simply states that amounts should be allocated on a reasonable basis.
This results in increased subjectivity and these allocations can significantly affect segment results.
Analysis and interpretation of financial accounts
36 KAPLAN PUBLISHING
Disclosure requirements for segmental reporting

Shown below are the summarised financial statements for Boston, a publicly listed company, for the years ended 31 March 20X8 and 20X9, together with some segment information analysed by class of business for the year ended 31 March 20X9 only:
Income statements
Carpeting Hotels House building
Total Total
31 March 20X9
31 March 20X8
$m $m $m $m $mRevenue 90 130 280 500 450Cost of sales (30) (95) (168) (293) (260)(note (i)) –––– –––– –––– –––– –––– Gross profit 60 35 112 207 190Operating expenses
(25) (15) (32) (72) (60)
–––– –––– –––– –––– –––– Segment result 35 20 80 135 130 –––– –––– –––– Unallocated corporate expenses
(60) (50)
–––– –––– Profit from operations
75 80
Finance costs (10) (5) –––– ––––
Profit before tax 65 75Income tax expense (25) (30) –––– –––– Profit for the period 40 45 –––– ––––
chapter 2
KAPLAN PUBLISHING 37
Test your understanding 7 Boston
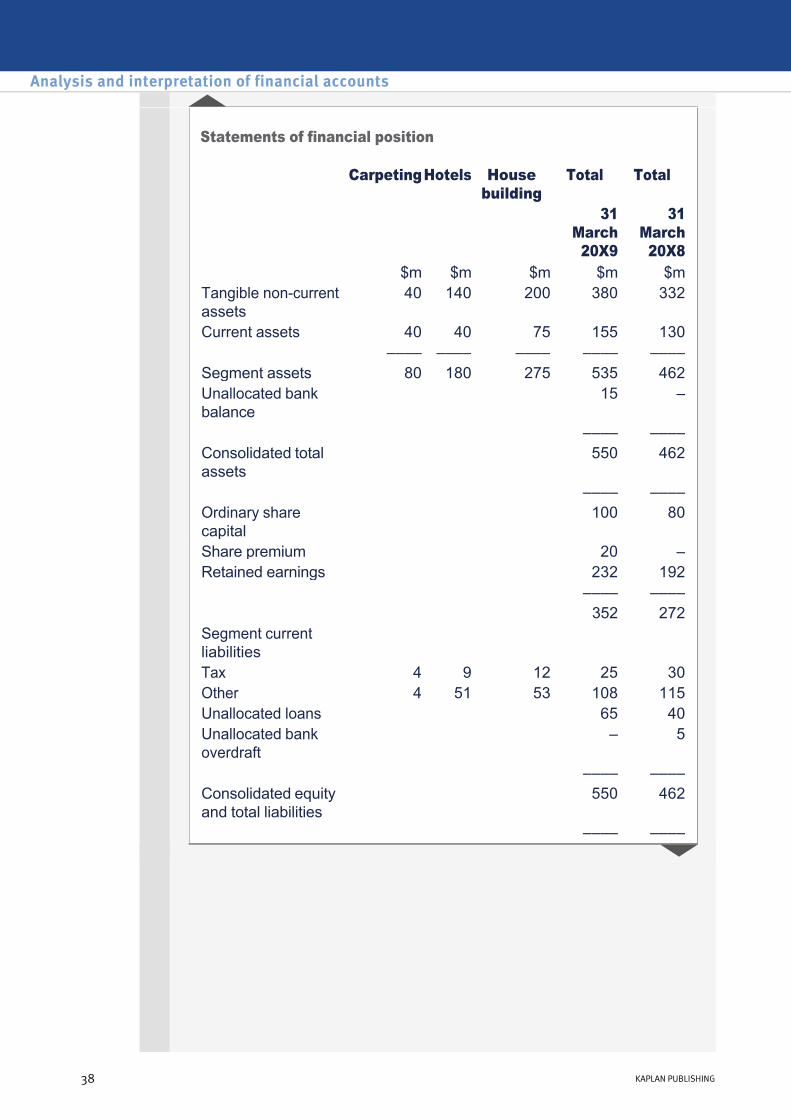
Statements of financial position
Carpeting Hotels House building
Total Total
31 March 20X9
31 March 20X8
$m $m $m $m $mTangible noncurrent assets
40 140 200 380 332
Current assets 40 40 75 155 130 –––– –––– –––– –––– –––– Segment assets 80 180 275 535 462Unallocated bank balance
15 –
–––– –––– Consolidated total assets
550 462
–––– –––– Ordinary share capital
100 80
Share premium 20 – Retained earnings 232 192
–––– –––– 352 272
Segment current liabilities
Tax 4 9 12 25 30Other 4 51 53 108 115Unallocated loans 65 40Unallocated bank overdraft
– 5
–––– –––– Consolidated equity and total liabilities
550 462
–––– ––––
Analysis and interpretation of financial accounts
38 KAPLAN PUBLISHING

The following notes are relevant:
(i) Depreciation for the year to 31 March 20X9 was $35 million. During the year a hotel with a carrying amount of $40 million was sold at a loss of $12 million. Depreciation and the loss on the sale of noncurrent assets are charged to cost of sales. There were no other noncurrent asset disposals. As part of the company’s overall acquisition of new noncurrent assets, the hotel segment acquired $104 million of new hotels during the year.
(ii) The above figures are based on historical cost values. The fair values of the segment net assets are:
Carpeting Hotel House building
$m $m $m31 March 20X8 80 150 25031 March 20X9 97 240 265
(iii) The following ratios (which can be taken to be correct) have been calculated based on the overall group results:Year ended: 31 March
20X9 31 March
20X8 Return on capital employed 18.0% 25.6%Gross profit margin 41.4% 42.2%Operating profit margin 15.0% 17.8%Net asset turnover 1.2 times 1.4 timesCurrent ratio 1.3:1 0.9:1Gearing 15.6% 12.8%
(iv) The following segment ratios (which can be taken to be correct) have been calculated for the year ended 31 March 20X9 only:
Carpeting Hotel House building
Segment return on net assets
48.6% 16.7% 38.1%
Segment asset turnover 1.3 times 1.1 times 1.3 timesGross profit margin 66.7% 26.9% 40%Net profit margin 38.9% 15.4% 28.6%Current ratio (excluding bank)
5:1 0.7:1 1.2:1
chapter 2
KAPLAN PUBLISHING 39
Required:
Using the ratios provided, write a report to the Board of Boston analysing the company’s financial performance and position for the year ended 31 March 20X9.
Note: Your answer should make reference to the segmental information and consider the implication of the fair value information.
11 Limitations of analysis of financial statements
There are limitations to the analysis that can be performed when given an annual report or in examination questions. Sometimes it may be necessary to discuss these limitations.
It is important to answer the question requirement carefully, i.e. are you asked for limitations of financial information or the limitations of using ratios for analysis? It is also important to make your answer specific to the entity in question, if you are provided with one.
Limitations of financial reporting information
Difficulties in drawing comparisons between different entities
• Only provide historic data.
• Only provide financial information.
• Filed at least 3 months after reporting date reducing its relevance.
• Limited information to be able to identify trends over time.
• Lack of detailed information.
• Historic cost accounting does not take into account inflation.
• Comparisons affected by changes in the business, for example selling an operation.
• Different accounting policies between different entities, e.g. revaluations.
• Different accounting practices between different entities, e.g. debt factoring.
• Different entities within the same industry may have different activities.
• Non coterminous accounting periods.
• Different entities may not be comparable in terms of size.
• Comparisons between entities operating in different countries will be influenced by different legal and regulatory systems, the relative strength and weakness of the national economy and exchange rate fluctuations.
Analysis and interpretation of financial accounts
40 KAPLAN PUBLISHING

Limitations of ratio analysis
Creative accounting
These are, of course, generic limitations that are not necessarily applicable to all businesses in all circumstances. In an exam situation limitations must be applied to the unique traits of a business, for example: if you are asked compare two entities it makes sense to consider whether they use the same accounting policies (e.g. depreciation rates) and business methods (e.g. acquiring or leasing assets). Please refer to the following expandable text sections for further guidance on these areas.
• Where ratios have been provided, there may be discrepancies between how they have been calculated for each entity/period, e.g. gearing.
• Distortions when using yearend figures, particularly in seasonal industries and when entities have different accounting dates.
• Distortions due to not being able to use most appropriate figures, e.g. total sales revenue rather than credit sales when calculating receivables days.
• It is difficult to identify reasons behind ratio movements without significant additional information.
• Timing of transactions may be delayed/speeded up to improve results, e.g. not investing in noncurrent assets to ensure ROCE does not fall.
• Profit smoothing using choices allowed, e.g. inventory valuation method.
• Classification of items, e.g. expenses v noncurrent assets; ordinary v extraordinary.
• Offbalance sheet financing to improve gearing and ROCE.
• Revenue recognition policies.
• Managing market expectations.
chapter 2
KAPLAN PUBLISHING 41
Creative accounting
Limitations of ratio analysis
Limitations of financial reporting information

12 Additional information
In practice and in examinations it is likely that the information available in the financial statements may not be enough to produce a detailed and thorough analysis of the business. This is particularly the case given the limitations of financial reporting information discussed in the previous section.
You may require additional information, financial and nonfinancial, to develop a better understanding of the business and its industry. In the examination it is imperative that you relate any additional information requested to the entity in the question and to the user for whom the report is being prepared. The following examples of additional information are for illustrative purposes only. There are questions in the exam practice kit to further this knowledge and to develop your higher skills.
You may require additional financial information such as:
You may also require other nonfinancial information such as:
• budgeted figures
• other management information
• industry averages
• figures for a similar business
• figures for the business over a longer period of time.
• market share
• key employee information
• sales mix information
• product range information
• the size of the order book
• the longterm plans of management.
Analysis and interpretation of financial accounts
42 KAPLAN PUBLISHING

13 Chapter summary
chapter 2
KAPLAN PUBLISHING 43

Test your understanding answers
Profitability
Possible reasons why T's ratios have changed:
Gross profit margin increased:
20X5 20X6 Gross profit margin
Gross profit –––––––– Revenue
90/150 = 60%
115/180 = 63.9%
Operating profit margin
Operating profit ––––––––––– Revenue
61.5/150 = 41%
75.1/180 = 41.7%
Net profit margin
Net profit –––––––– Revenue
37.9/150 =
25.3%
45.8/180 = 25.4%
Return on capital employed
Operating profit –––––––––––
Capital Employed
61.5/(92.9+125)
= 28.2%
75.1/(146.7+150)
= 25.3%
Asset utilisation
Revenue –––––––––––
Capital Employed
150/(92.9+125)
= 0.69 times
180/(146.7+150)
= 0.61 times
• Increase in sales due to increasing volume sold and so economies of scale result in lower costs per unit sold;
• Increase in sales price per unit;
• Changes in product mix.
Analysis and interpretation of financial accounts
44 KAPLAN PUBLISHING
Test your understanding 1 Profitability ratios
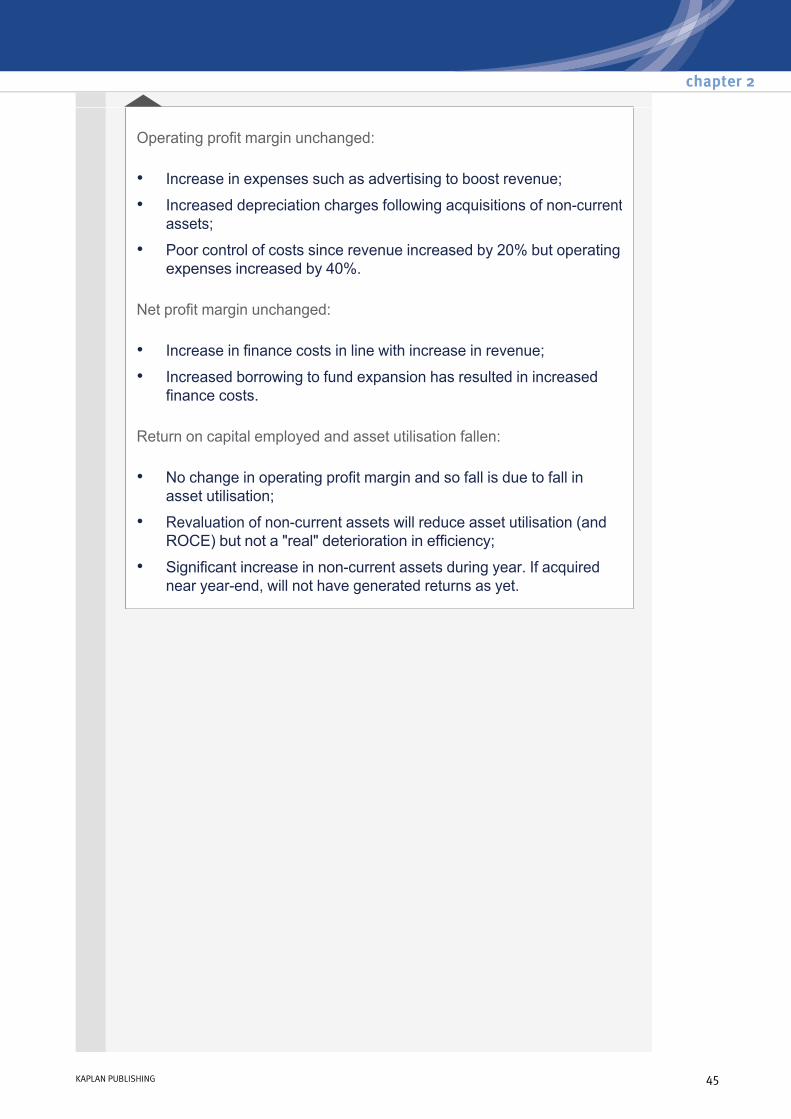
Operating profit margin unchanged:
Net profit margin unchanged:
Return on capital employed and asset utilisation fallen:
• Increase in expenses such as advertising to boost revenue;
• Increased depreciation charges following acquisitions of noncurrent assets;
• Poor control of costs since revenue increased by 20% but operating expenses increased by 40%.
• Increase in finance costs in line with increase in revenue;
• Increased borrowing to fund expansion has resulted in increased finance costs.
• No change in operating profit margin and so fall is due to fall in asset utilisation;
• Revaluation of noncurrent assets will reduce asset utilisation (and ROCE) but not a "real" deterioration in efficiency;
• Significant increase in noncurrent assets during year. If acquired near yearend, will not have generated returns as yet.
chapter 2
KAPLAN PUBLISHING 45

Liquidity
Possible reasons why T's ratios have changed:
Inventory holding period increased:
Receivables collection period increased:
Payables payment period largely unchanged.
20X5 20X6
Current ratio
Current assets –––––––––––– Current liabilities
50,000/22,100 =
2.3:1
64,300/33,800 =
1.9:1
Quick ratio
(Current assets – Inventory) –––––––––––––––––––
Current liabilities
38,000/22,100 =
1.7:1
49,300/33,800 =
1.5:1
Inventory holding period
Inventory ––––––––– × 365 days Cost of sales
12,000/60,000 × 365 = 73 days
15,000/65,000 × 365 = 84 days
Receivables collection period
Receivables ––––––––– × 365 days Revenue
37,500/150,000 ×
365 =91 days
49,300/180,000 × 365 = 100 days
Payables payment period
Trade payables ––––––––––– × 365 days Cost of Sales
10,600/60,000 × 365 = 65 days
11,700/65,000 × 365 = 66 days
• Build up of inventory levels as a result of increased capacity following expansion of noncurrent assets;
• Increasing inventory levels in response to increased demand for product.
• Deliberate policy to attract customers;
• Poor credit control procedures.
Analysis and interpretation of financial accounts
46 KAPLAN PUBLISHING
Test your understanding 2 Liquidity ratios
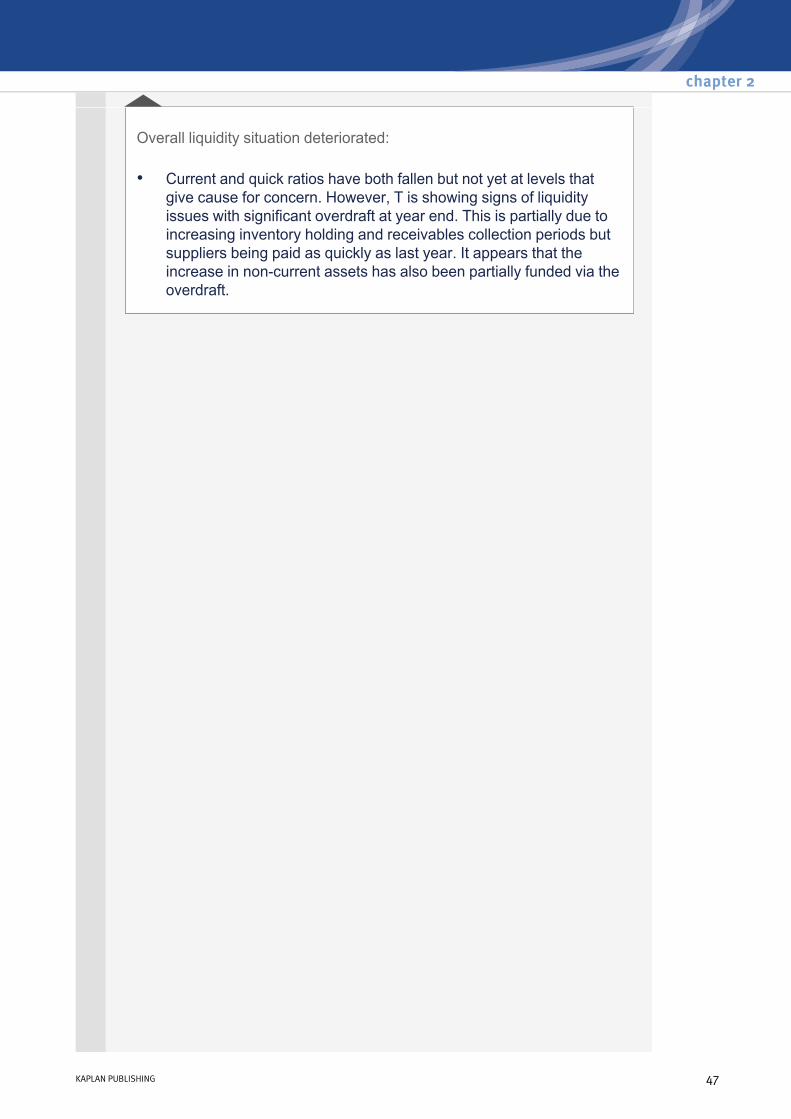
Overall liquidity situation deteriorated:
• Current and quick ratios have both fallen but not yet at levels that give cause for concern. However, T is showing signs of liquidity issues with significant overdraft at year end. This is partially due to increasing inventory holding and receivables collection periods but suppliers being paid as quickly as last year. It appears that the increase in noncurrent assets has also been partially funded via the overdraft.
chapter 2
KAPLAN PUBLISHING 47
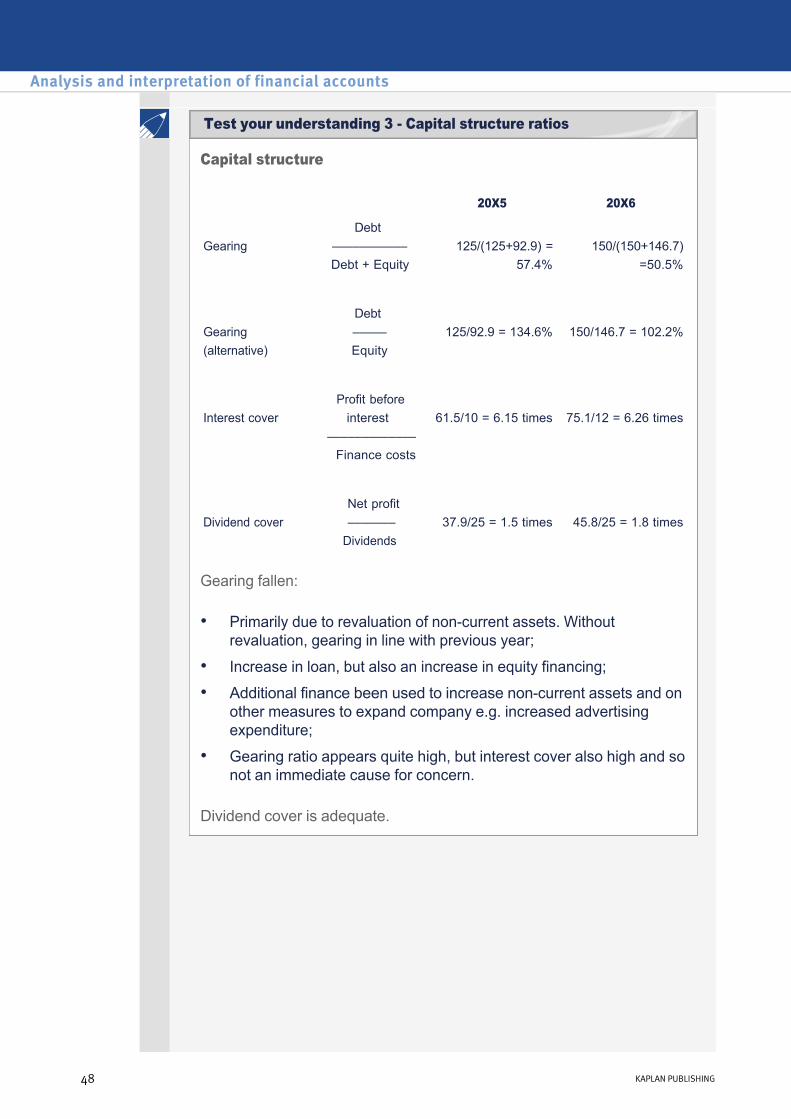
Capital structure
Gearing fallen:
Dividend cover is adequate.
20X5 20X6
Gearing
Debt ––––––––––– Debt + Equity
125/(125+92.9) =
57.4%
150/(150+146.7)
=50.5%
Gearing (alternative)
Debt ––––– Equity
125/92.9 = 134.6%
150/146.7 = 102.2%
Interest cover
Profit before interest
––––––––––––– Finance costs
61.5/10 = 6.15 times
75.1/12 = 6.26 times
Dividend cover
Net profit ––––––– Dividends
37.9/25 = 1.5 times
45.8/25 = 1.8 times
• Primarily due to revaluation of noncurrent assets. Without revaluation, gearing in line with previous year;
• Increase in loan, but also an increase in equity financing;
• Additional finance been used to increase noncurrent assets and on other measures to expand company e.g. increased advertising expenditure;
• Gearing ratio appears quite high, but interest cover also high and so not an immediate cause for concern.
Analysis and interpretation of financial accounts
48 KAPLAN PUBLISHING
Test your understanding 3 Capital structure ratios
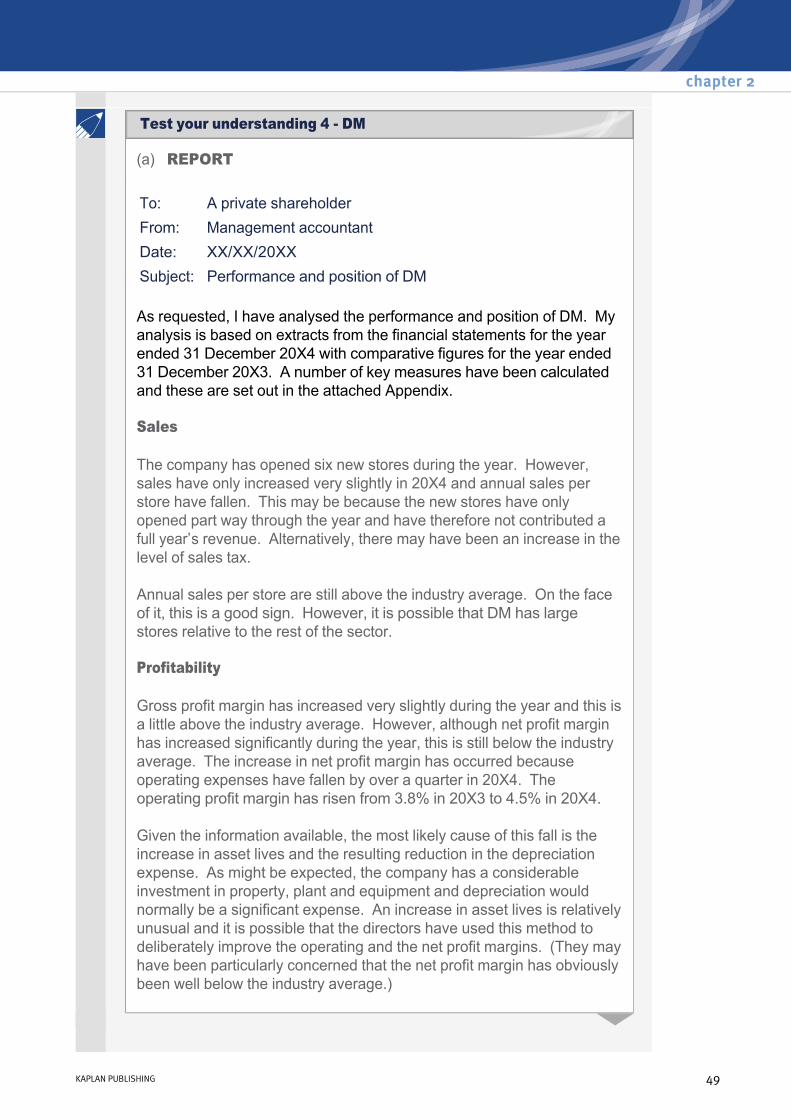
(a) REPORT
As requested, I have analysed the performance and position of DM. My analysis is based on extracts from the financial statements for the year ended 31 December 20X4 with comparative figures for the year ended 31 December 20X3. A number of key measures have been calculated and these are set out in the attached Appendix.
Sales
The company has opened six new stores during the year. However, sales have only increased very slightly in 20X4 and annual sales per store have fallen. This may be because the new stores have only opened part way through the year and have therefore not contributed a full year’s revenue. Alternatively, there may have been an increase in the level of sales tax.
Annual sales per store are still above the industry average. On the face of it, this is a good sign. However, it is possible that DM has large stores relative to the rest of the sector.
Profitability
Gross profit margin has increased very slightly during the year and this is a little above the industry average. However, although net profit margin has increased significantly during the year, this is still below the industry average. The increase in net profit margin has occurred because operating expenses have fallen by over a quarter in 20X4. The operating profit margin has risen from 3.8% in 20X3 to 4.5% in 20X4.
Given the information available, the most likely cause of this fall is the increase in asset lives and the resulting reduction in the depreciation expense. As might be expected, the company has a considerable investment in property, plant and equipment and depreciation would normally be a significant expense. An increase in asset lives is relatively unusual and it is possible that the directors have used this method to deliberately improve the operating and the net profit margins. (They may have been particularly concerned that the net profit margin has obviously been well below the industry average.)
To: A private shareholderFrom: Management accountantDate: XX/XX/20XXSubject: Performance and position of DM
chapter 2
KAPLAN PUBLISHING 49
Test your understanding 4 DM
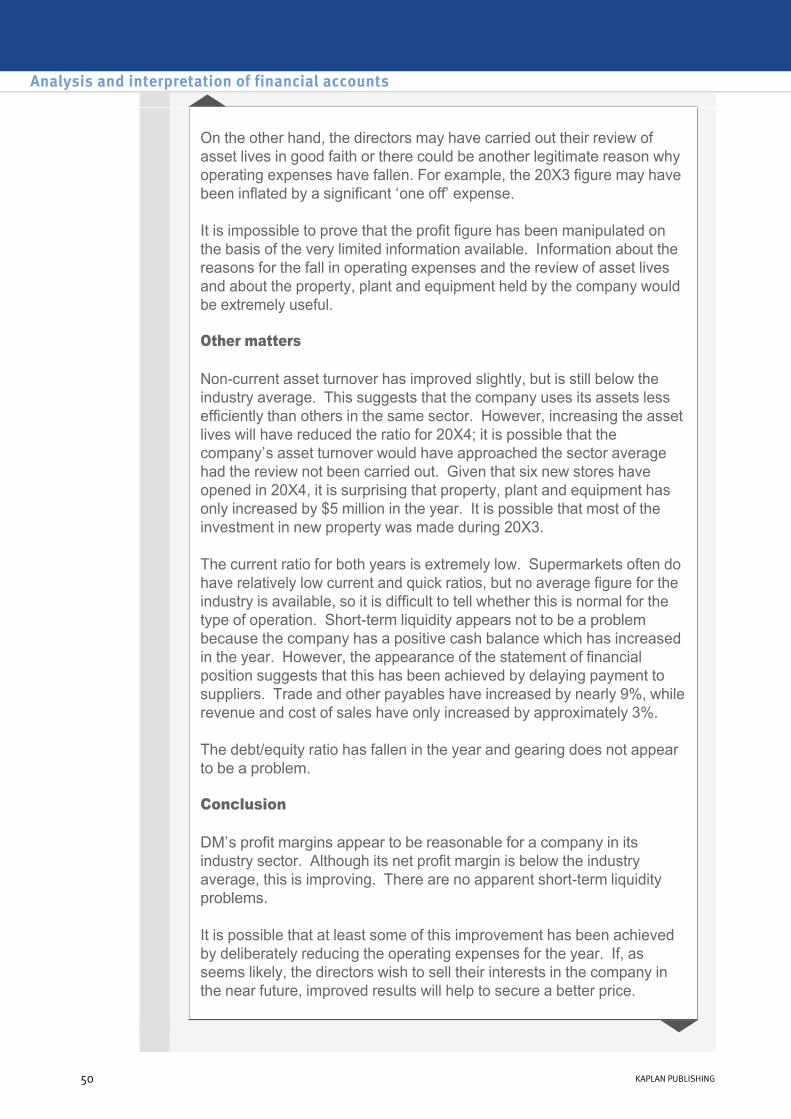
On the other hand, the directors may have carried out their review of asset lives in good faith or there could be another legitimate reason why operating expenses have fallen. For example, the 20X3 figure may have been inflated by a significant ‘one off’ expense.
It is impossible to prove that the profit figure has been manipulated on the basis of the very limited information available. Information about the reasons for the fall in operating expenses and the review of asset lives and about the property, plant and equipment held by the company would be extremely useful.
Other matters
Noncurrent asset turnover has improved slightly, but is still below the industry average. This suggests that the company uses its assets less efficiently than others in the same sector. However, increasing the asset lives will have reduced the ratio for 20X4; it is possible that the company’s asset turnover would have approached the sector average had the review not been carried out. Given that six new stores have opened in 20X4, it is surprising that property, plant and equipment has only increased by $5 million in the year. It is possible that most of the investment in new property was made during 20X3.
The current ratio for both years is extremely low. Supermarkets often do have relatively low current and quick ratios, but no average figure for the industry is available, so it is difficult to tell whether this is normal for the type of operation. Shortterm liquidity appears not to be a problem because the company has a positive cash balance which has increased in the year. However, the appearance of the statement of financial position suggests that this has been achieved by delaying payment to suppliers. Trade and other payables have increased by nearly 9%, while revenue and cost of sales have only increased by approximately 3%.
The debt/equity ratio has fallen in the year and gearing does not appear to be a problem.
Conclusion
DM’s profit margins appear to be reasonable for a company in its industry sector. Although its net profit margin is below the industry average, this is improving. There are no apparent shortterm liquidity problems.
It is possible that at least some of this improvement has been achieved by deliberately reducing the operating expenses for the year. If, as seems likely, the directors wish to sell their interests in the company in the near future, improved results will help to secure a better price.
Analysis and interpretation of financial accounts
50 KAPLAN PUBLISHING

However, it is impossible to be certain that this has happened without much more detailed information about the reason for the fall in operating expenses. There may be a legitimate explanation for the improvement in the company’s profit margins.
Appendix
20X4 20X3 Key sector ratio
Annual sales per store
1,255/ 42 = $29.9m
1,220/ 36 = $33.9m
$27.6m
Gross profit margin
78/ 1,255 x 100% = 6.2%
75/ 1,220 x 100% = 6.1%
5.9%
Operating profit margin
57/ 1,255 x 100% = 4.5%
46/ 1,220 x 100% = 3.8%
–
Net profit margin 33/ 1,255 x 100% = 2.6%
23/ 1,220 x 100% = 1.9%
3.9%
Noncurrent asset turnover
1,255/ 680 = 1.85 times
1,220/ 675 = 1.81 times
1.93 times
Current ratio 105/ 317 = 0.33:1
71/ 309 = 0.23:1 –
Debt/ equity 142/ 301 x 100% = 47.2%
140/ 276 x 100% = 50.7%
–
chapter 2
KAPLAN PUBLISHING 51

It can often be useful to compare ratios for an individual company with averages for the sector. However, this type of analysis has a number of limitations:
(b) Limitations of the use of sector comparatives
– Some accounting ratios can be calculated in different ways. Therefore a sector average may be based on ratios that have not been calculated consistently.
– The figures in the financial statements are affected by the accounting policies adopted and by accounting estimates. Accounting estimates (such as the useful lives of assets) require judgement. Some international accounting standards still allow a choice of accounting policies.
– Entities in the same sector may operate under different business environments. For example, DM operates in one of six provinces. Conditions may be very different in the other five; so DM’s financial performance and position may not be strictly comparable with companies operating in other provinces.
– Sector comparatives are normally based on an average of several entities. The average can be distorted by one entity that is significantly out of line with the others. Also, the smaller the number of entities, the less reliable the average figure will be. For example, 12 entities is quite a small number.
– Published sector averages may exclude some important ratios. For example, it would be useful to know the average current ratio and debt/equity ratio for DM’s industry sector.
Analysis and interpretation of financial accounts
52 KAPLAN PUBLISHING
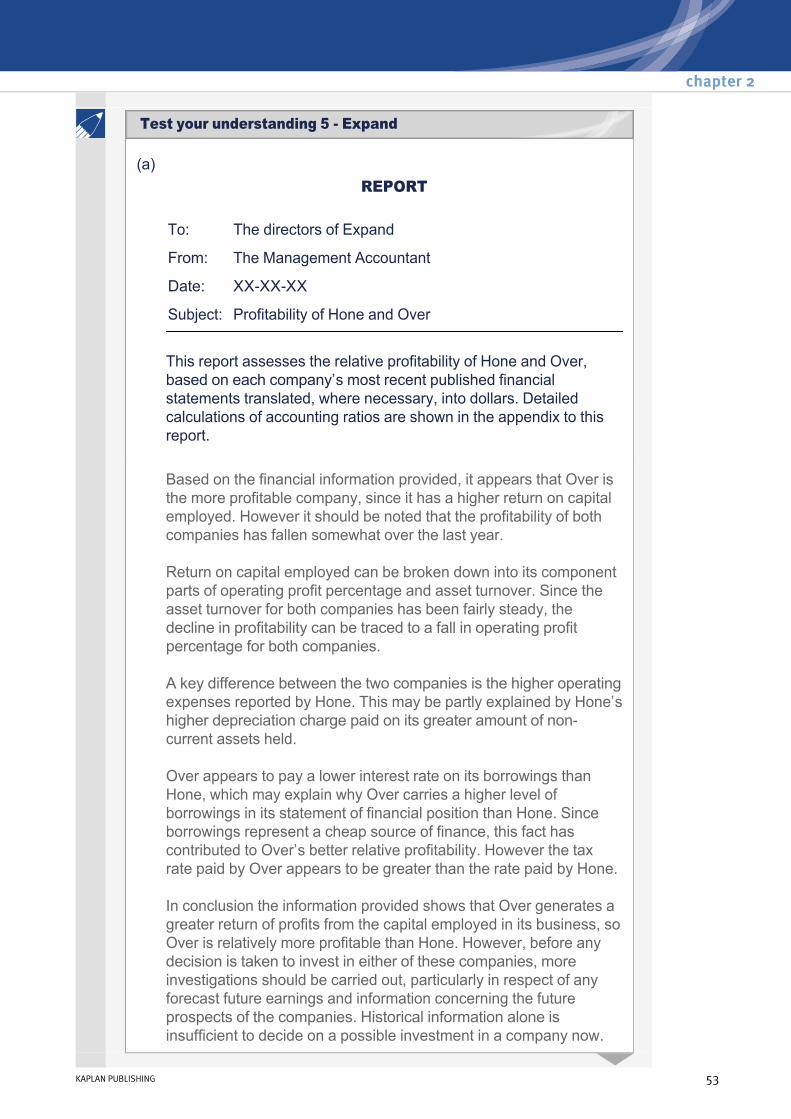
(a)
This report assesses the relative profitability of Hone and Over, based on each company’s most recent published financial statements translated, where necessary, into dollars. Detailed calculations of accounting ratios are shown in the appendix to this report.
REPORT
To: The directors of Expand
From: The Management Accountant
Date: XXXXXX
Subject: Profitability of Hone and Over
Based on the financial information provided, it appears that Over is the more profitable company, since it has a higher return on capital employed. However it should be noted that the profitability of both companies has fallen somewhat over the last year.
Return on capital employed can be broken down into its component parts of operating profit percentage and asset turnover. Since the asset turnover for both companies has been fairly steady, the decline in profitability can be traced to a fall in operating profit percentage for both companies.
A key difference between the two companies is the higher operating expenses reported by Hone. This may be partly explained by Hone’s higher depreciation charge paid on its greater amount of noncurrent assets held.
Over appears to pay a lower interest rate on its borrowings than Hone, which may explain why Over carries a higher level of borrowings in its statement of financial position than Hone. Since borrowings represent a cheap source of finance, this fact has contributed to Over’s better relative profitability. However the tax rate paid by Over appears to be greater than the rate paid by Hone.
In conclusion the information provided shows that Over generates a greater return of profits from the capital employed in its business, so Over is relatively more profitable than Hone. However, before any decision is taken to invest in either of these companies, more investigations should be carried out, particularly in respect of any forecast future earnings and information concerning the future prospects of the companies. Historical information alone is insufficient to decide on a possible investment in a company now.
chapter 2
KAPLAN PUBLISHING 53
Test your understanding 5 Expand

Appendix – Key accounting ratios assessing profitability
(b) There are serious limitations in using the financial information provided as a basis to compare the profitability of the two companies. First, we must consider the translation of the Over results. This has been done using a single exchange rate that is in force at 31 December 20X2. It would have been better to translate the 31 December 20X1 balance sheet using the exchange rate at that date, and to have used average exchange rates for 20X1 and 20X2 to translate the income statements respectively for 20X1 and 20X2.
A further problem arises in that the two companies have different yearend dates. If both companies earn their profits evenly over each year, then this will not be a problem. However it is more likely that there will be seasonal variations in the financial performance of each company, in which case the balance sheets comparisons in particular will not be comparing like with like.
A further problem arises in that each company has drawn up their financial statements in accordance with the domestic accounting standards of the country in which they operate. No information is given of how similar the GAAP in Dollarland is to the GAAP in Francland. Different accounting practices could have a major effect on the reported profitability of the companies, such that a direct comparison is not valid.
Analysis and interpretation of financial accounts
54 KAPLAN PUBLISHING
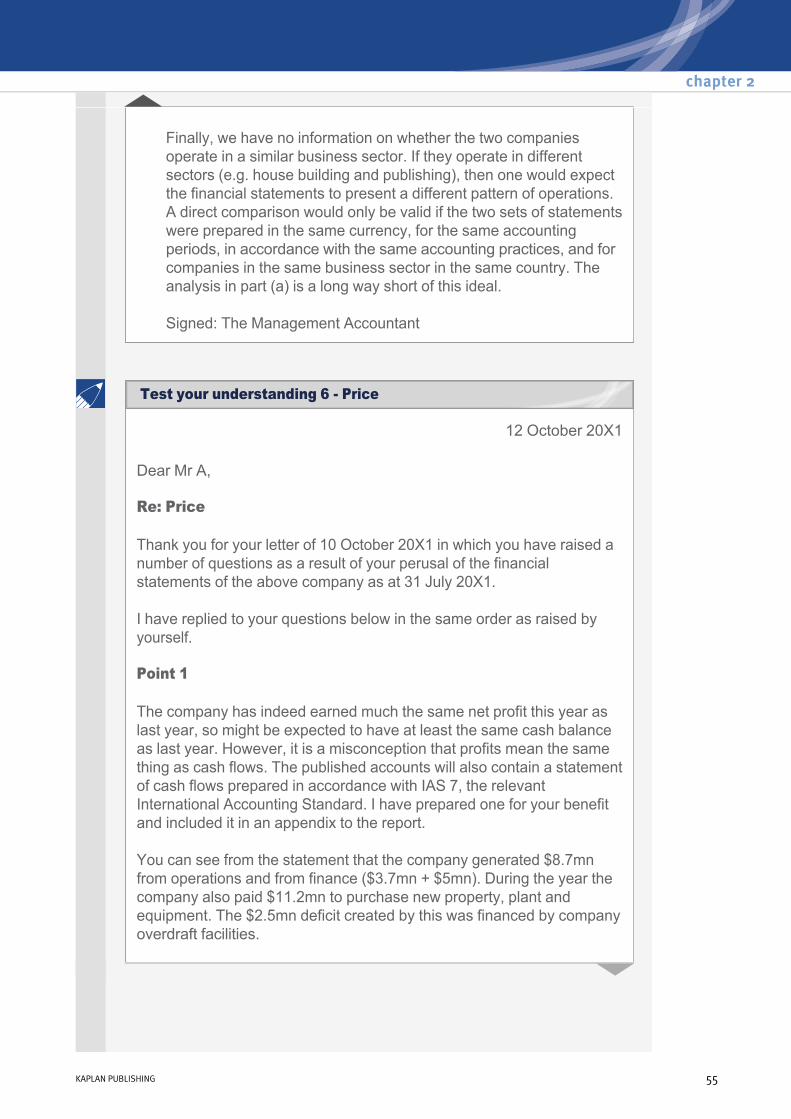
Finally, we have no information on whether the two companies operate in a similar business sector. If they operate in different sectors (e.g. house building and publishing), then one would expect the financial statements to present a different pattern of operations. A direct comparison would only be valid if the two sets of statements were prepared in the same currency, for the same accounting periods, in accordance with the same accounting practices, and for companies in the same business sector in the same country. The analysis in part (a) is a long way short of this ideal.
Signed: The Management Accountant
12 October 20X1
Dear Mr A,
Re: Price
Thank you for your letter of 10 October 20X1 in which you have raised a number of questions as a result of your perusal of the financial statements of the above company as at 31 July 20X1.
I have replied to your questions below in the same order as raised by yourself.
Point 1
The company has indeed earned much the same net profit this year as last year, so might be expected to have at least the same cash balance as last year. However, it is a misconception that profits mean the same thing as cash flows. The published accounts will also contain a statement of cash flows prepared in accordance with IAS 7, the relevant International Accounting Standard. I have prepared one for your benefit and included it in an appendix to the report.
You can see from the statement that the company generated $8.7mn from operations and from finance ($3.7mn + $5mn). During the year the company also paid $11.2mn to purchase new property, plant and equipment. The $2.5mn deficit created by this was financed by company overdraft facilities.
chapter 2
KAPLAN PUBLISHING 55
Test your understanding 6 Price
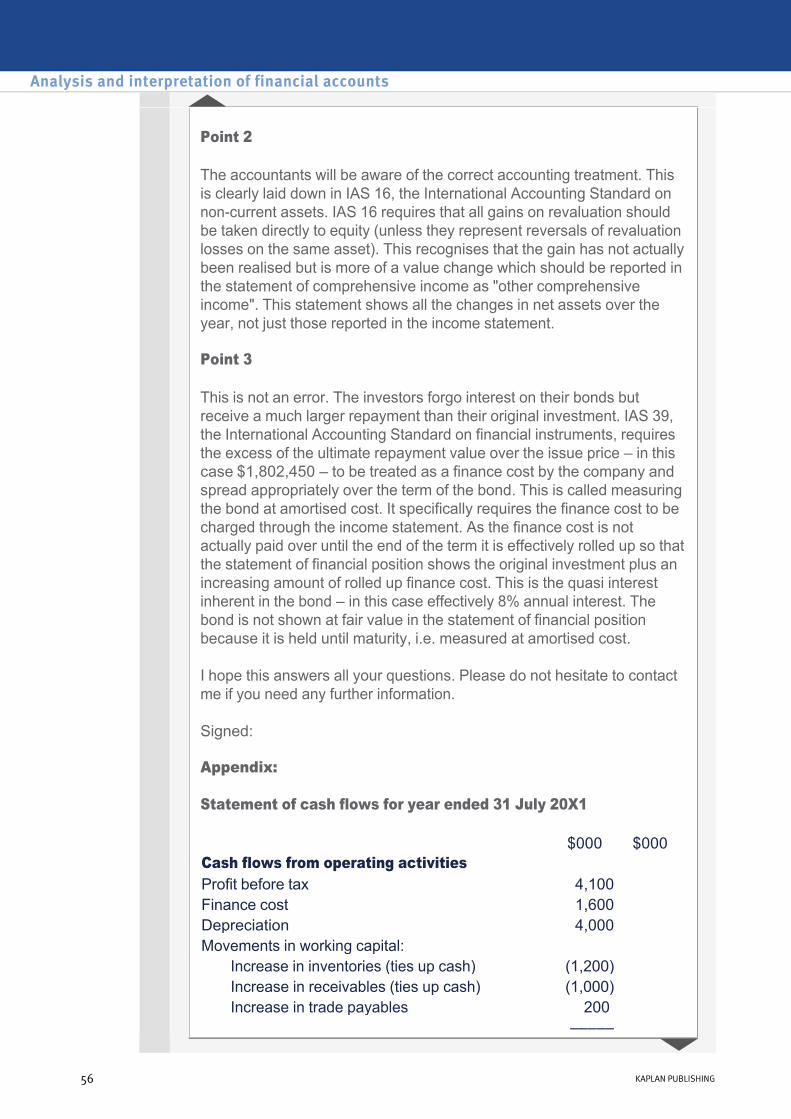
Point 2
The accountants will be aware of the correct accounting treatment. This is clearly laid down in IAS 16, the International Accounting Standard on noncurrent assets. IAS 16 requires that all gains on revaluation should be taken directly to equity (unless they represent reversals of revaluation losses on the same asset). This recognises that the gain has not actually been realised but is more of a value change which should be reported in the statement of comprehensive income as "other comprehensive income". This statement shows all the changes in net assets over the year, not just those reported in the income statement.
Point 3
This is not an error. The investors forgo interest on their bonds but receive a much larger repayment than their original investment. IAS 39, the International Accounting Standard on financial instruments, requires the excess of the ultimate repayment value over the issue price – in this case $1,802,450 – to be treated as a finance cost by the company and spread appropriately over the term of the bond. This is called measuring the bond at amortised cost. It specifically requires the finance cost to be charged through the income statement. As the finance cost is not actually paid over until the end of the term it is effectively rolled up so that the statement of financial position shows the original investment plus an increasing amount of rolled up finance cost. This is the quasi interest inherent in the bond – in this case effectively 8% annual interest. The bond is not shown at fair value in the statement of financial position because it is held until maturity, i.e. measured at amortised cost.
I hope this answers all your questions. Please do not hesitate to contact me if you need any further information.
Signed:
Appendix:
Statement of cash flows for year ended 31 July 20X1
$000 $000Cash flows from operating activities Profit before tax 4,100 Finance cost 1,600 Depreciation 4,000 Movements in working capital:
Increase in inventories (ties up cash) (1,200) Increase in receivables (ties up cash) (1,000) Increase in trade payables 200
–––––
Analysis and interpretation of financial accounts
56 KAPLAN PUBLISHING
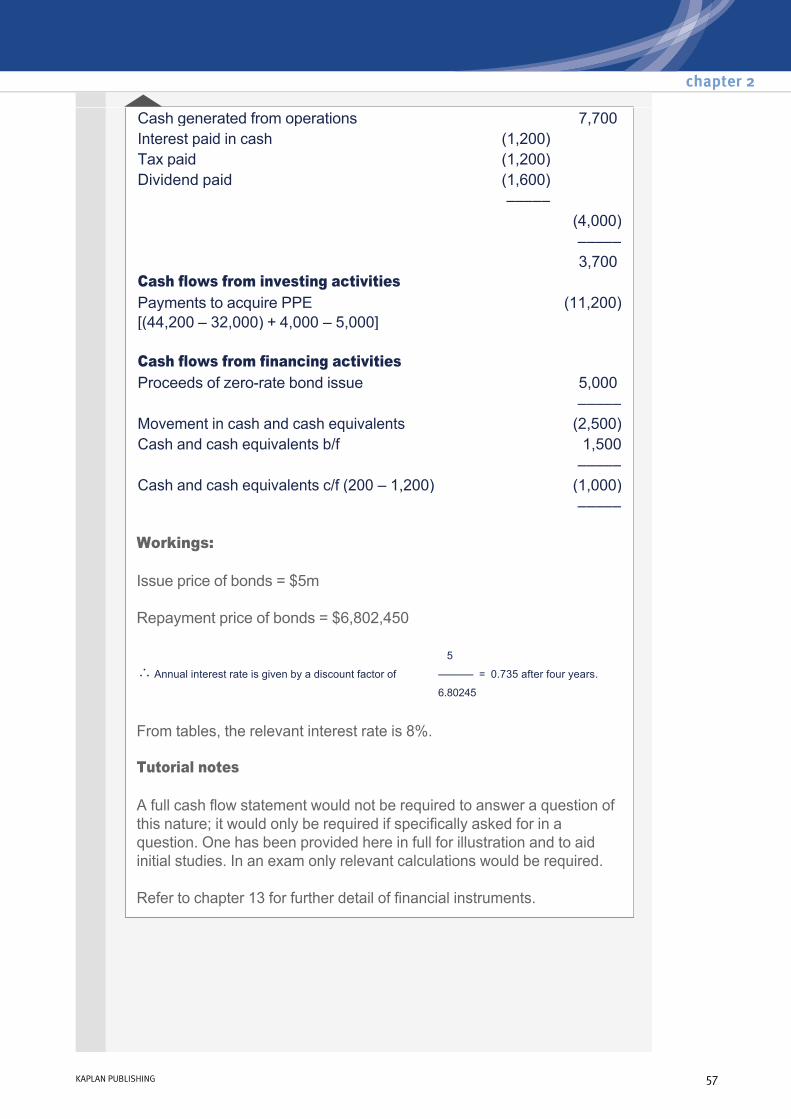
Workings:
Issue price of bonds = $5m
Repayment price of bonds = $6,802,450
From tables, the relevant interest rate is 8%.
Tutorial notes
A full cash flow statement would not be required to answer a question of this nature; it would only be required if specifically asked for in a question. One has been provided here in full for illustration and to aid initial studies. In an exam only relevant calculations would be required.
Refer to chapter 13 for further detail of financial instruments.
Cash generated from operations 7,700 Interest paid in cash (1,200) Tax paid (1,200) Dividend paid (1,600) ––––– (4,000) ––––– 3,700 Cash flows from investing activities Payments to acquire PPE (11,200)[(44,200 – 32,000) + 4,000 – 5,000] Cash flows from financing activities Proceeds of zerorate bond issue 5,000 ––––– Movement in cash and cash equivalents (2,500)Cash and cash equivalents b/f 1,500 ––––– Cash and cash equivalents c/f (200 – 1,200) (1,000) –––––
∴ Annual interest rate is given by a discount factor of
5
–––––– = 0.735 after four years.
6.80245
chapter 2
KAPLAN PUBLISHING 57
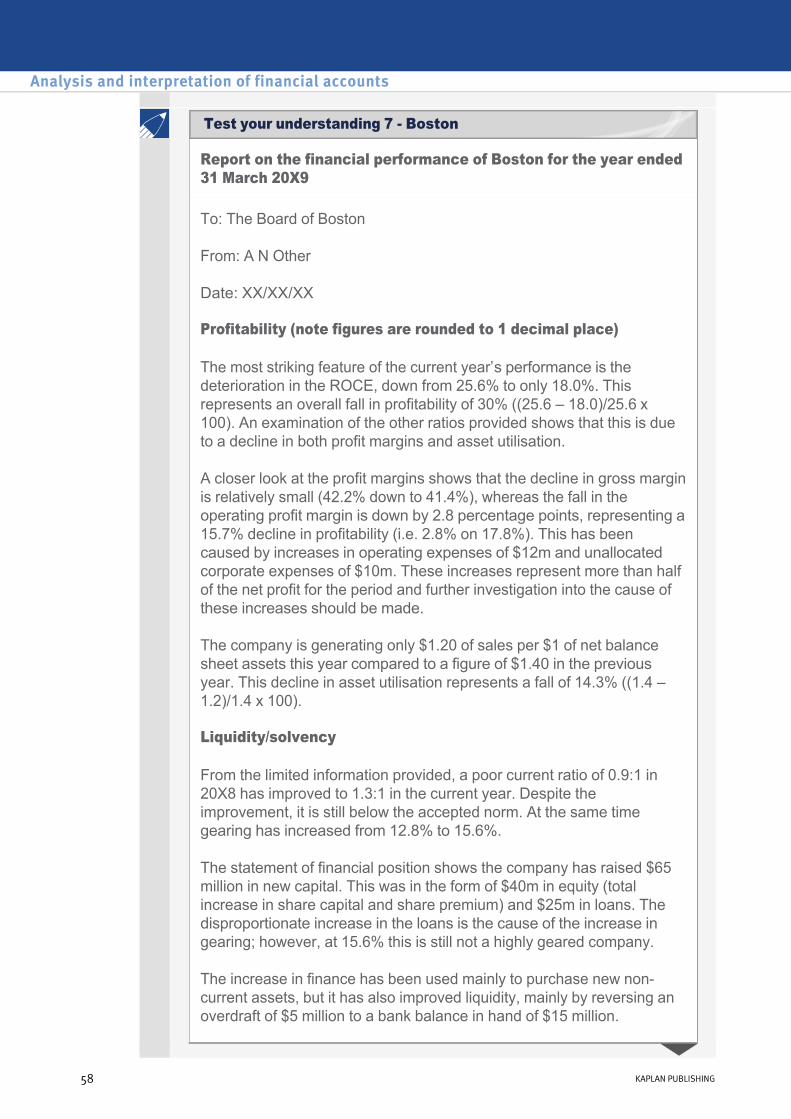
Report on the financial performance of Boston for the year ended 31 March 20X9
To: The Board of Boston
From: A N Other
Date: XX/XX/XX
Profitability (note figures are rounded to 1 decimal place)
The most striking feature of the current year’s performance is the deterioration in the ROCE, down from 25.6% to only 18.0%. This represents an overall fall in profitability of 30% ((25.6 – 18.0)/25.6 x 100). An examination of the other ratios provided shows that this is due to a decline in both profit margins and asset utilisation.
A closer look at the profit margins shows that the decline in gross margin is relatively small (42.2% down to 41.4%), whereas the fall in the operating profit margin is down by 2.8 percentage points, representing a 15.7% decline in profitability (i.e. 2.8% on 17.8%). This has been caused by increases in operating expenses of $12m and unallocated corporate expenses of $10m. These increases represent more than half of the net profit for the period and further investigation into the cause of these increases should be made.
The company is generating only $1.20 of sales per $1 of net balance sheet assets this year compared to a figure of $1.40 in the previous year. This decline in asset utilisation represents a fall of 14.3% ((1.4 – 1.2)/1.4 x 100).
Liquidity/solvency
From the limited information provided, a poor current ratio of 0.9:1 in 20X8 has improved to 1.3:1 in the current year. Despite the improvement, it is still below the accepted norm. At the same time gearing has increased from 12.8% to 15.6%.
The statement of financial position shows the company has raised $65 million in new capital. This was in the form of $40m in equity (total increase in share capital and share premium) and $25m in loans. The disproportionate increase in the loans is the cause of the increase in gearing; however, at 15.6% this is still not a highly geared company.
The increase in finance has been used mainly to purchase new noncurrent assets, but it has also improved liquidity, mainly by reversing an overdraft of $5 million to a bank balance in hand of $15 million.
Analysis and interpretation of financial accounts
58 KAPLAN PUBLISHING
Test your understanding 7 Boston

A common feature of new investment is that there is often a delay between making the investment and benefiting from the returns. This may be the case with Boston, and it may be that in future years the increased investment will be rewarded with higher returns. Another aspect of the investment that may have caused the lower return on assets is that the investment is likely to have occurred part way through the year (maybe even near the year end). This means that the income statement may not include returns for a full year, whereas in future years it will.
Segment issues
Segment information is intended to help the users to better assess the performance of an enterprise by looking at the detailed contribution made by the differing activities that comprise the enterprise as a whole.
Referring to the segment ratios it appears that the carpeting segment is giving the greatest contribution to overall profitability, achieving a 48.6% return on its segment assets, whereas the equivalent return for house building is 38.1% and for hotels it is only 16.7%.
The main reason for the better return from carpeting is due to its higher segment net profit margin of 38.9% compared to hotels at 15.4% and house building at 28.6%. Carpeting’s higher segment net profit is in turn a reflection of its underlying very high gross margin (66.7%). The segment net asset turnover of the hotels (1.1 times) is also very much lower than the other two segments (1.3 times).
It should be noted that hotel profits have been reduced due to the loss of $12 million on the sale of a hotel. This should potentially be treated as an exceptional item and excluded from the analysis for comparability purposes.
It seems that the hotel segment is also responsible for the group’s fairly poor liquidity ratios. Ignoring the bank balances, the segment current liabilities are 50% greater than its current assets ($60m compared to $40m); the opposite of this would be a more acceptable current ratio.
These figures are based on historical values. Most commentators argue that the use of fair values is more consistent and thus provides more reliable information on which to base assessments (they are less misleading than the use of historical values). If fair values are used, all segments understandably show lower returns and poorer performance (as fair values are higher than historical values), but the figures for the hotels are proportionately much worse, falling by a half of the historic values (as the fair values of the hotel segment are exactly double the historical values).
chapter 2
KAPLAN PUBLISHING 59
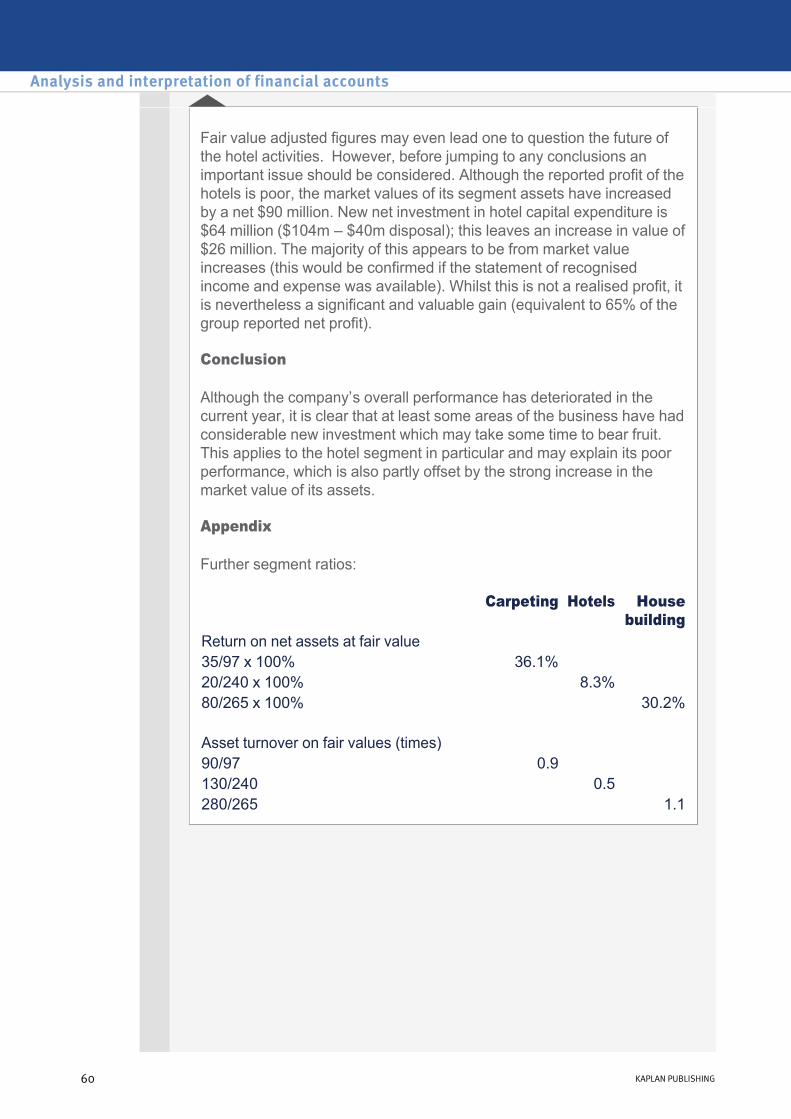
Fair value adjusted figures may even lead one to question the future of the hotel activities. However, before jumping to any conclusions an important issue should be considered. Although the reported profit of the hotels is poor, the market values of its segment assets have increased by a net $90 million. New net investment in hotel capital expenditure is $64 million ($104m – $40m disposal); this leaves an increase in value of $26 million. The majority of this appears to be from market value increases (this would be confirmed if the statement of recognised income and expense was available). Whilst this is not a realised profit, it is nevertheless a significant and valuable gain (equivalent to 65% of the group reported net profit).
Conclusion
Although the company’s overall performance has deteriorated in the current year, it is clear that at least some areas of the business have had considerable new investment which may take some time to bear fruit. This applies to the hotel segment in particular and may explain its poor performance, which is also partly offset by the strong increase in the market value of its assets.
Appendix
Further segment ratios:
Carpeting Hotels House building
Return on net assets at fair value 35/97 x 100% 36.1% 20/240 x 100% 8.3% 80/265 x 100% 30.2% Asset turnover on fair values (times) 90/97 0.9 130/240 0.5 280/265 1.1
Analysis and interpretation of financial accounts
60 KAPLAN PUBLISHING
Earnings per shareChapter learning objectives
On completion of their studies students should be able to:
• Calculate earnings per share under IAS 33 to include the effect of bonus issues, rights issues and convertible stock.
61
chapter
3
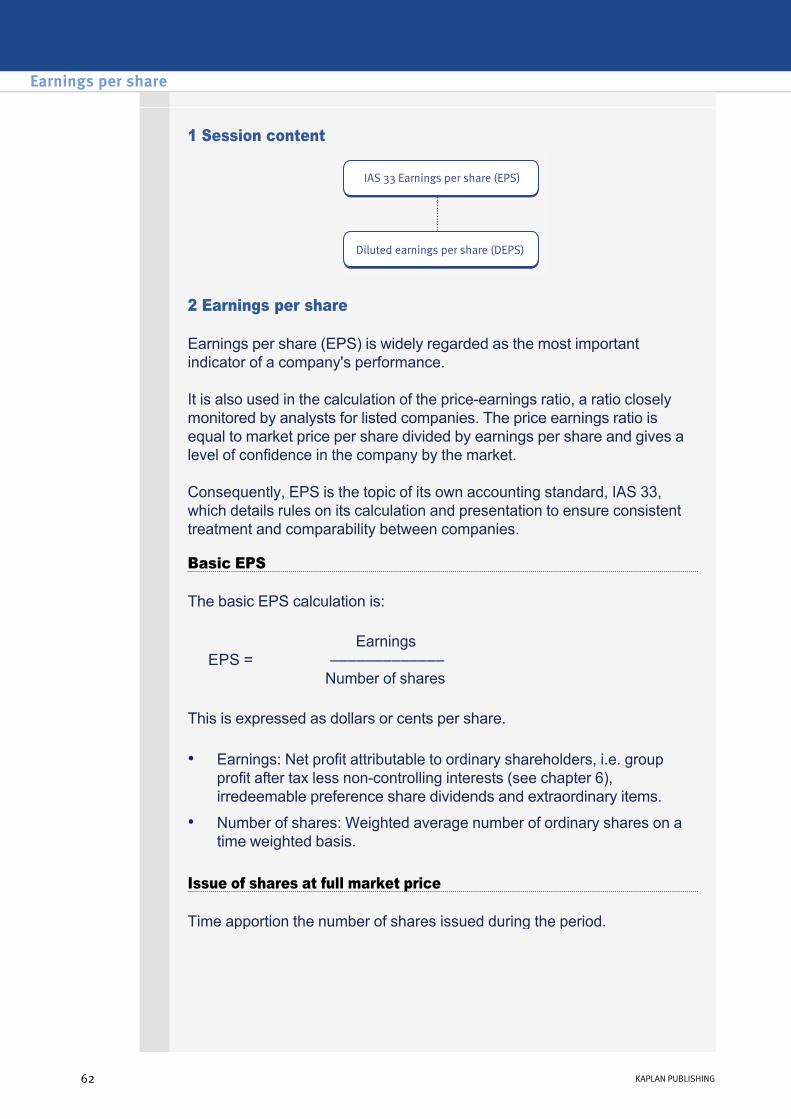
1 Session content
2 Earnings per share
Earnings per share (EPS) is widely regarded as the most important indicator of a company's performance.
It is also used in the calculation of the priceearnings ratio, a ratio closely monitored by analysts for listed companies. The price earnings ratio is equal to market price per share divided by earnings per share and gives a level of confidence in the company by the market.
Consequently, EPS is the topic of its own accounting standard, IAS 33, which details rules on its calculation and presentation to ensure consistent treatment and comparability between companies.
Basic EPS
The basic EPS calculation is:
This is expressed as dollars or cents per share.
Issue of shares at full market price
Time apportion the number of shares issued during the period.
EPS =
Earnings ––––––––––––– Number of shares
• Earnings: Net profit attributable to ordinary shareholders, i.e. group profit after tax less noncontrolling interests (see chapter 6), irredeemable preference share dividends and extraordinary items.
• Number of shares: Weighted average number of ordinary shares on a time weighted basis.
Earnings per share
62 KAPLAN PUBLISHING62 KAPLAN PUBLISHING

A has earnings of $300,000 during the year ended 31 December 20X6. On 1 January 20X6 A had share capital of 100,000 $1 shares. On 1 March 20X6 a further 60,000 shares were issued at $3.25 per share.
Required:
What is the basic EPS figure for the year ended 31 March 20X6?
Solution
EarningsEPS = –––––––––––––– Number of shares $300,000EPS = ––––––––––––––––––– (100,000 x 2/12) +
(160,000 x 10/12) $300,000EPS = ––––––––– 150,000 EPS = $2/ share
Gerard's earnings for the year ended 31 December 20X4 are $2,208,000. On 1 January 20X4, the issued share capital of Gerard was 8,280,000 ordinary shares of $1 each. The company issued 3,312,000 shares at full market value on 30 June 20X4.
Required:
Calculate the EPS for Gerard for 20X4.
chapter 3
KAPLAN PUBLISHING 63
Illustration 1 Weighted average number of shares
Example 1 New issue of shares at market price
Test your understanding 1
Example 1 answer

Bonus issue
A bonus issue (or capitalisation issue or scrip issue):
• does not provide additional resources to the issuer.
• means that the shareholder owns the same proportion of the business before and after the issue.
In the calculation of EPS:
The EPS calculation becomes:
E.g. Company B holds 100,000 shares and makes a 1 for 10 bonus issue. 100,000/10 = 10,000 new shares issued.
• the bonus shares are deemed to have been issued at the start of the year.
• comparative figures are restated to allow for the proportional increase in share capital caused by the bonus issue.
EPS =
Earnings ––––––––––––––––––––––––––––––––– No. of shares before bonus x bonus fraction
Bonus
fraction =
No. of shares after bonus issue –––––––––––––––––––––––––– No. of shares before bonus issue
Bonus
fraction =
110,000 ––––––– 100,000
11 = –– 10
• to adjust the comparative figures, multiply the previous year's basic EPS by the inverse of the bonus fraction, i.e. 100,000/110,000 or 10/11.
Earnings per share
64 KAPLAN PUBLISHING
Example 2 answer
Example 2 Bonus issue

Dorabella had 7 million $1 ordinary shares on 1 April 20X1.
Dorabella makes a bonus issue, of one share for every seven held, on 31 August 20X2.
Dorabella's results are as follows:
Required:
Calculate EPS for the year ending 31 March 20X3, together with the comparative EPS for 20X2 that would be presented in the 20X3 accounts.
20X3 20X2 $000 $000
Profit after tax 1,150 750–––––– ––––––
Rights issue
Rights issues present special problems:
Therefore, they combine the characteristics of issues at full market price and bonus issues.
• they contribute additional resources; and
• they are normally priced below full market price.
Determining the weighted average capital, therefore, involves two steps as follows:
(1) adjust for the bonus element in the rights issue, by multiplying capital in issue before the rights issue by the following fraction:
Actual cum rights price–––––––––––––––––––– Theoretical ex rights price
(2) calculate the weighted average capital in the issue as above.
– The cum rights price is usually provided to you in the exam question. It is the share price on the last trading day before the rights issue, i.e. the price of a share 'including' the rights.
– The theoretical exrights price is the theoretical share price after the rights issue has occurred. This must be calculated.
chapter 3
KAPLAN PUBLISHING 65
Test your understanding 2
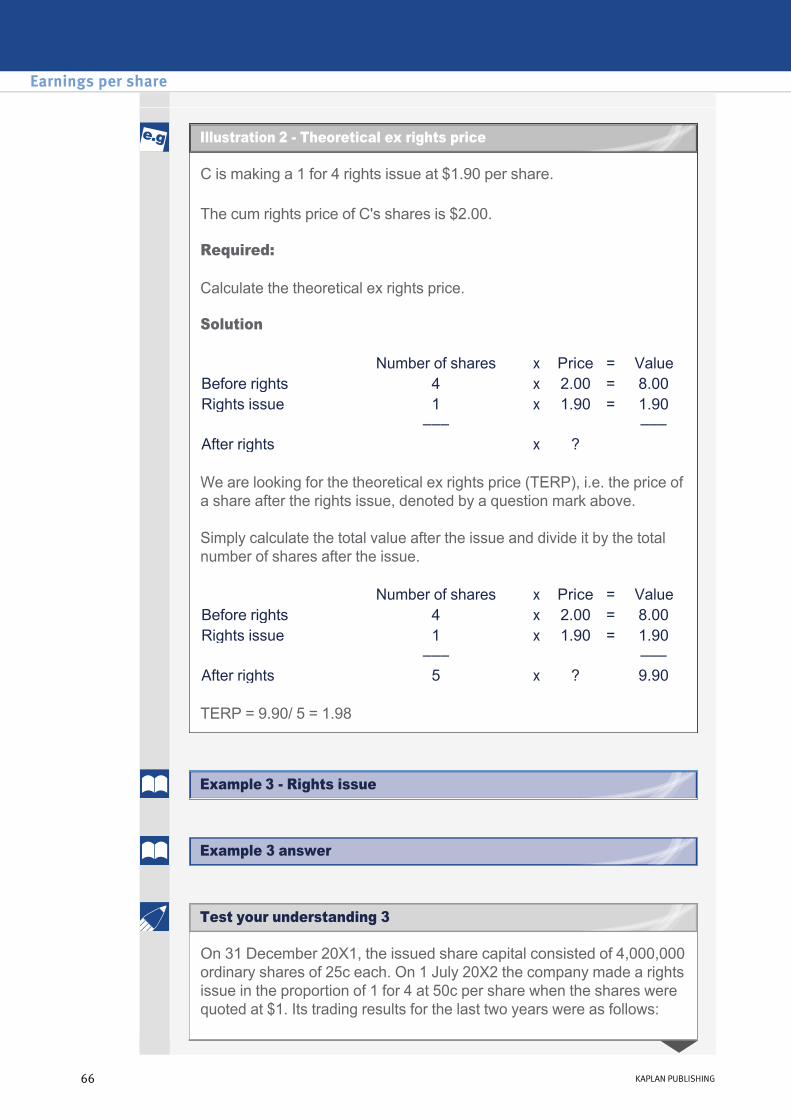
C is making a 1 for 4 rights issue at $1.90 per share.
The cum rights price of C's shares is $2.00.
Required:
Calculate the theoretical ex rights price.
Solution
We are looking for the theoretical ex rights price (TERP), i.e. the price of a share after the rights issue, denoted by a question mark above.
Simply calculate the total value after the issue and divide it by the total number of shares after the issue.
TERP = 9.90/ 5 = 1.98
Number of shares x Price = ValueBefore rights 4 x 2.00 = 8.00Rights issue 1 x 1.90 = 1.90 ––– –––After rights x ?
Number of shares x Price = ValueBefore rights 4 x 2.00 = 8.00Rights issue 1 x 1.90 = 1.90 ––– –––After rights 5 x ? 9.90
On 31 December 20X1, the issued share capital consisted of 4,000,000 ordinary shares of 25c each. On 1 July 20X2 the company made a rights issue in the proportion of 1 for 4 at 50c per share when the shares were quoted at $1. Its trading results for the last two years were as follows:
Earnings per share
66 KAPLAN PUBLISHING
Example 3 Rights issue
Illustration 2 Theoretical ex rights price
Test your understanding 3
Example 3 answer
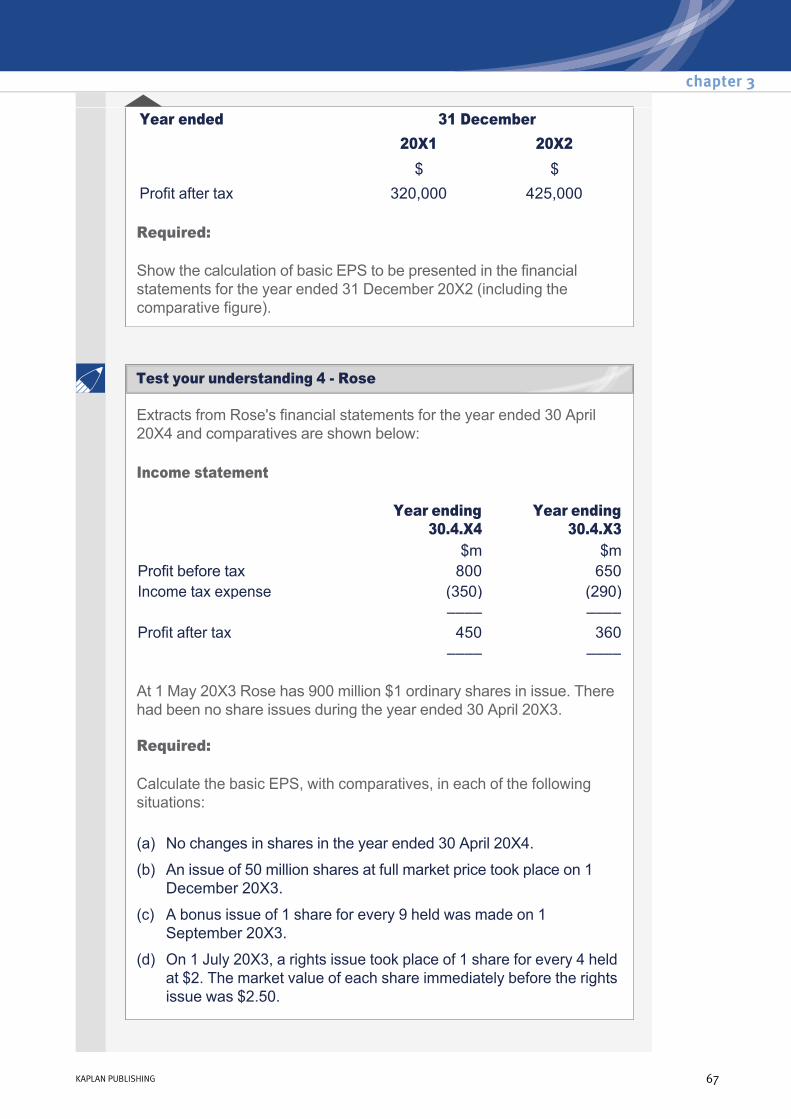
Required:
Show the calculation of basic EPS to be presented in the financial statements for the year ended 31 December 20X2 (including the comparative figure).
Year ended 31 December 20X1 20X2 $ $
Profit after tax 320,000 425,000
Extracts from Rose's financial statements for the year ended 30 April 20X4 and comparatives are shown below:
Income statement
At 1 May 20X3 Rose has 900 million $1 ordinary shares in issue. There had been no share issues during the year ended 30 April 20X3.
Required:
Calculate the basic EPS, with comparatives, in each of the following situations:
Year ending 30.4.X4
Year ending 30.4.X3
$m $mProfit before tax 800 650Income tax expense (350) (290) –––– –––– Profit after tax 450 360 –––– ––––
(a) No changes in shares in the year ended 30 April 20X4.
(b) An issue of 50 million shares at full market price took place on 1 December 20X3.
(c) A bonus issue of 1 share for every 9 held was made on 1 September 20X3.
(d) On 1 July 20X3, a rights issue took place of 1 share for every 4 held at $2. The market value of each share immediately before the rights issue was $2.50.
chapter 3
KAPLAN PUBLISHING 67
Test your understanding 4 Rose
3 Diluted earnings per share (DEPS)Introduction
Equity share capital may change in the future owing to circumstances which exist now. The provision of a diluted EPS figure attempts to alert shareholders to the potential impact of these changes on the EPS figure.
Examples of dilutive factors are:
When the potential ordinary shares are issued the total number of shares in issue will increase and this can have a dilutive effect on EPS i.e. it may fall. It will fall where the increase in shares outweighs any increase in profits e.g. due to interest payments falling.
• the conversion terms for convertible bonds;
• the conversion terms for convertible preference shares;
• the exercise price for options and the subscription price for warrants.
Basic principles of calculation
To deal with potential ordinary shares, adjust basic earnings and number of shares assuming convertibles, options, etc. had converted to equity shares on the first day of the accounting period, or on the date of issue, if later.
DEPS is calculated as follows:
Earnings + notional extra earnings ––––––––––––––––––––––––––––––– Number of shares + notional extra shares
Convertibles
The principles of convertible bonds and convertible preference shares are similar and will be dealt with together.
If the convertible bonds/preference shares had been converted:
Note: There will be an interest saving on bonds but not on preference dividends as they are not tax deductible.
• the interest/dividend would be saved therefore earnings would be higher;
• the number of shares would increase.
Earnings per share
68 KAPLAN PUBLISHING
Importance of DEPS

Note: If there is an option to convert the debt into a variable number of ordinary shares depending on when conversion takes place, the maximum possible number of additional shares is used in the calculation.
A company had 8.28 million shares in issue at the start of the year and made no new issue of shares during the year ended 31 December 20X4, but on that date it had in issue convertible loan stock 20X620X9.
Assuming the conversion was fully subscribed there would be an increase of 2,070,000 ordinary shares in issue. The liability element of the loan stock is $2,300,000 and the effective interest rate is 10%.
Assume a tax rate of 30%.The earnings for the year were $2,208,000.
Required:
Calculate the fully diluted EPS for the year ended 31 December 20X4.
Options and warrants to subscribe for shares
An option or warrant gives the holder the right to buy shares at some time in the future at a predetermined price.
The cash received by the entity when the option is exercised is less than the market price of the shares. An option will only be exercised if the option or exercise price is lower than the market price. The increase in resources does not therefore match the increase in resources if the issue of shares were at market value. The option will consequently have a dilutive effect of EPS.
The total number of shares issued on the exercise of the option or warrant is split into two:
• the number of shares that would have been issued if the cash received had been used to buy shares at fair value (using the average price of the shares during the period);
• the remainder, which are treated like a bonus issue (i.e. as having been issued for no consideration).
chapter 3
KAPLAN PUBLISHING 69
Example 4 Convertibles
Test your understanding 5
Example 4 answer
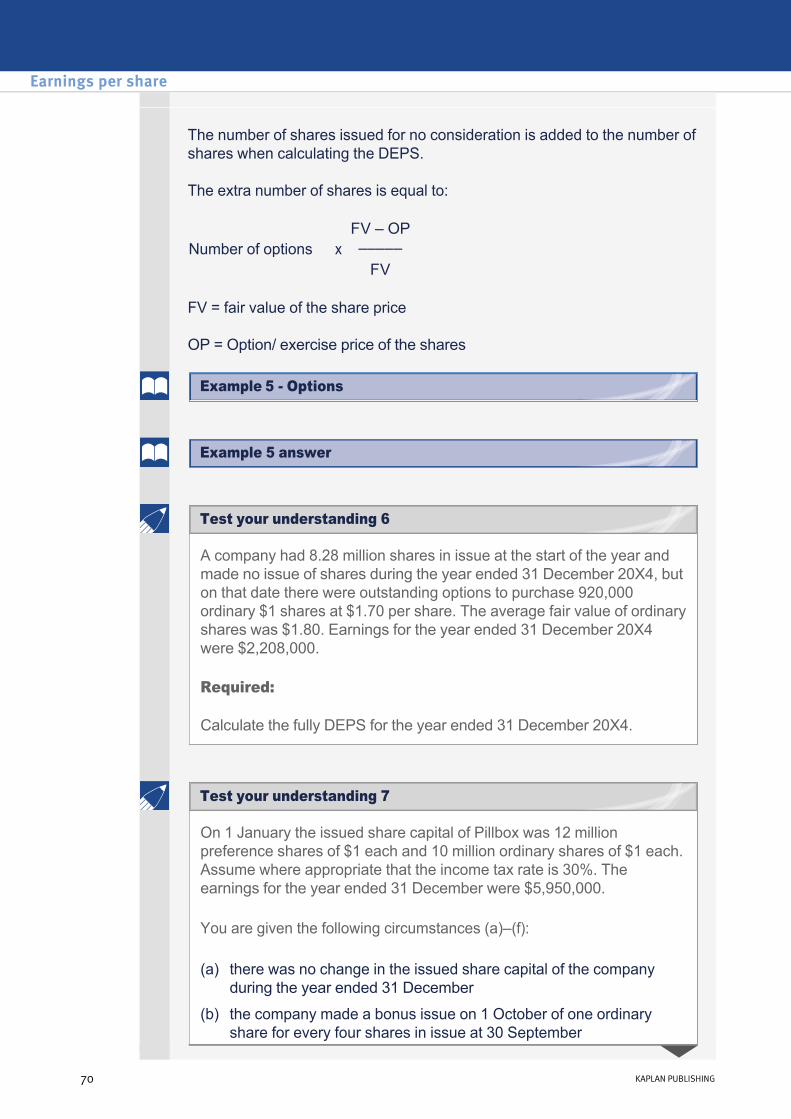
The number of shares issued for no consideration is added to the number of shares when calculating the DEPS.
The extra number of shares is equal to:
FV = fair value of the share price
OP = Option/ exercise price of the shares
FV – OP Number of options x ––––– FV
A company had 8.28 million shares in issue at the start of the year and made no issue of shares during the year ended 31 December 20X4, but on that date there were outstanding options to purchase 920,000 ordinary $1 shares at $1.70 per share. The average fair value of ordinary shares was $1.80. Earnings for the year ended 31 December 20X4 were $2,208,000.
Required:
Calculate the fully DEPS for the year ended 31 December 20X4.
On 1 January the issued share capital of Pillbox was 12 million preference shares of $1 each and 10 million ordinary shares of $1 each. Assume where appropriate that the income tax rate is 30%. The earnings for the year ended 31 December were $5,950,000.
You are given the following circumstances (a)–(f):
(a) there was no change in the issued share capital of the company during the year ended 31 December
(b) the company made a bonus issue on 1 October of one ordinary share for every four shares in issue at 30 September
Earnings per share
70 KAPLAN PUBLISHING
Test your understanding 7
Example 5 answer
Test your understanding 6
Example 5 Options

Required:
Calculate the EPS separately in respect of the year ended 31 December for each of the circumstances (a)(f).
(c) the company issued 1 share for every 10 on 1 August at full market value of $4
(d) the company made a rights issue of $1 ordinary shares on 1 October in the proportion of 1 of every 3 shares held, at a price of $3. The middle market price for the shares on the last day of quotation cum rights was $4 per share
(e) the company made no new issue of shares during the year ended 31 December, but on that date it had in issue convertible bonds. Assuming the conversion was fully subscribed there would be an increase of 2,340,000 ordinary shares in issue. The liability element of the bond is $2,600,000 and the effective interest rate is 10%.
(f) the company made no issue of shares during the year ended 31 December, but on that date there were outstanding options to purchase 74,000 ordinary $1 shares at $2.50 per share. Share price during the year was $4.
chapter 3
KAPLAN PUBLISHING 71
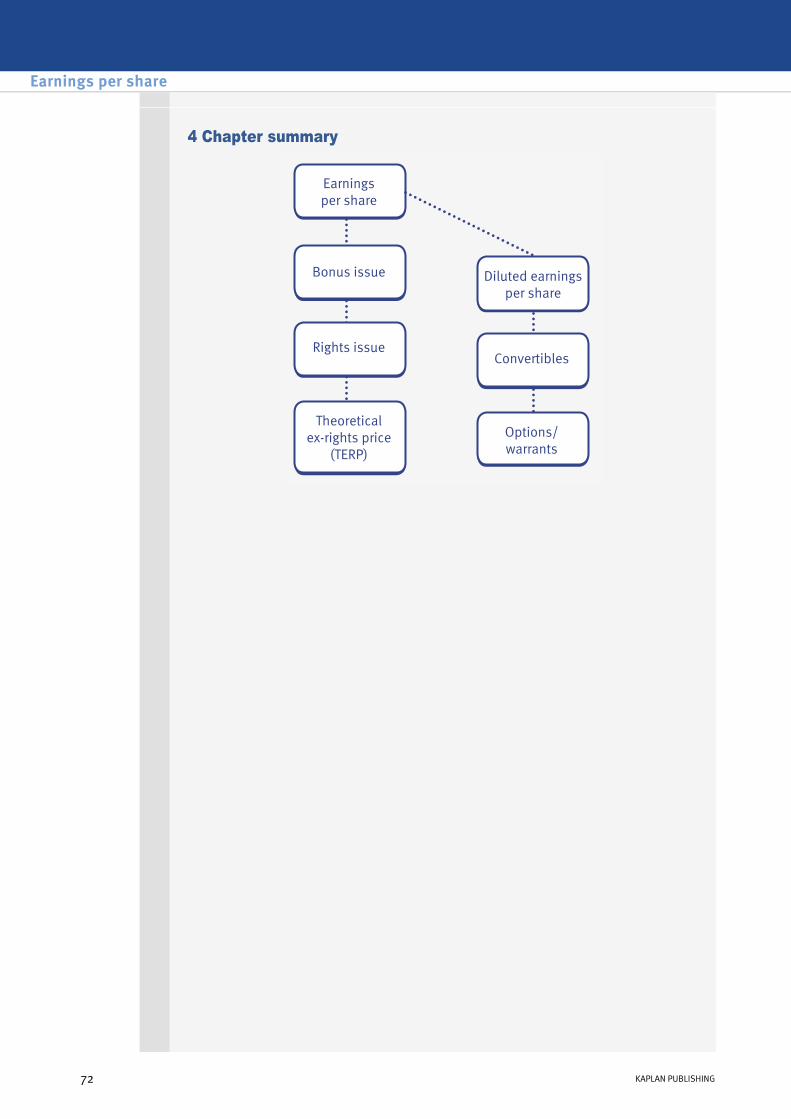
4 Chapter summary
Earnings per share
72 KAPLAN PUBLISHING

Test your understanding answers
Issue at full market price Date Actual number of
shares Fraction of
year Total
1 January 20X4 8,280,000 6/12 4,140,00030 June 20X4 11,592,000 (W1) 6/12 5,796,000
––––––– Number of shares in EPS calculation
9,936,000
–––––––
The earnings per share for 20X4 would now be calculated as:
(W1) New number of shares Original number 8,280,000New issue 3,312,000
––––––––– New number 11,592,000
$2,208,000–––––––––– = 22.2c9,936,000
The number of shares to be used in the EPS calculation for both years is 7,000,000 + 1,000,000 = 8,000,000.
The EPS for 20X2 is 750,000 / 8,000,000 × 100 c = 9.4c
The EPS for 20X3 is 1,150,000 / 8,000,000 × 100 c = 14.4c
Alternatively adjust last year’s EPS:
20X2 EPS = 750,000 / 7,000,000 = 10.7c
20X2 adjusted comparative = 10.7 × 7/8 = 9.4c.
chapter 3
KAPLAN PUBLISHING 73
Test your understanding 1
Test your understanding 2

20X2 EPS
20X1 EPS
Applying correction factor to calculate adjusted comparative figure of EPS:
(W1) Current year weighted average number of shares
Number of shares 1 July 20X1 to 31 December 20X1 (as adjusted):
Number of shares 1 January 20X2 to 30 June 20X2 (actual):
Total adjusted shares for year 4,722,222
(W2) Theoretical ex rights price
Because the rights issue contains a bonus element, the comparative EPS figures should be adjusted by the factor:
$425,000EPS = –––––––– = 9.0c per share
4,722,222 (W1)
Theoretical ex rights price 90c (W2)8c (W3) × –––––––––––––––––––– = 8c × –––– = 7.2c per share
Actual cum rights price 100c
Actual cum rights price 6 months4,000,000 × –––––––––––––––––––– × ––––––
Theoretical cum rights price 12 months
100 64,000,000 × ––– × –– = 2,222,222 shares
90 (W2) 12
6––– × 5,000,000 = 2,500,000 shares12
Theoretical ex rights price–––––––––––––––––––– Actual cum rights price
Earnings per share
74 KAPLAN PUBLISHING
Test your understanding 3
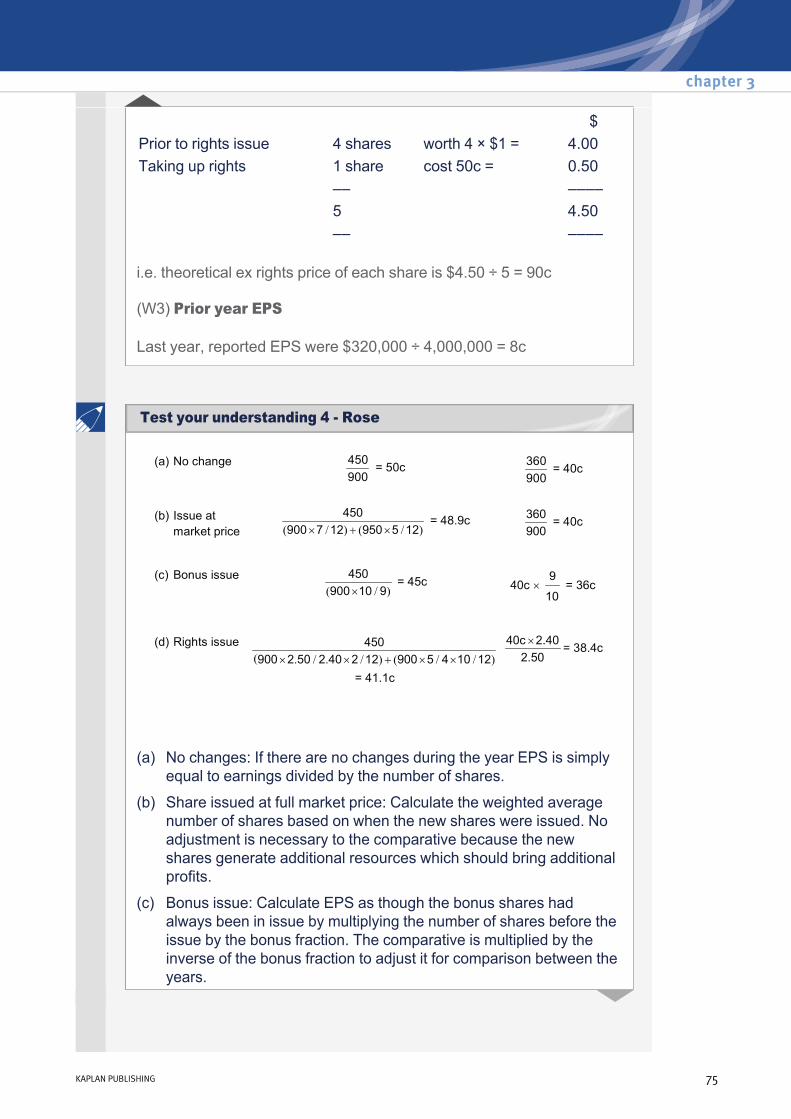
i.e. theoretical ex rights price of each share is $4.50 ÷ 5 = 90c
(W3) Prior year EPS
Last year, reported EPS were $320,000 ÷ 4,000,000 = 8c
$Prior to rights issue 4 shares worth 4 × $1 = 4.00Taking up rights 1 share cost 50c = 0.50
–– –––– 5 4.50–– ––––
(a) No changes: If there are no changes during the year EPS is simply equal to earnings divided by the number of shares.
(b) Share issued at full market price: Calculate the weighted average number of shares based on when the new shares were issued. No adjustment is necessary to the comparative because the new shares generate additional resources which should bring additional profits.
(c) Bonus issue: Calculate EPS as though the bonus shares had always been in issue by multiplying the number of shares before the issue by the bonus fraction. The comparative is multiplied by the inverse of the bonus fraction to adjust it for comparison between the years.
chapter 3
KAPLAN PUBLISHING 75
Test your understanding 4 Rose
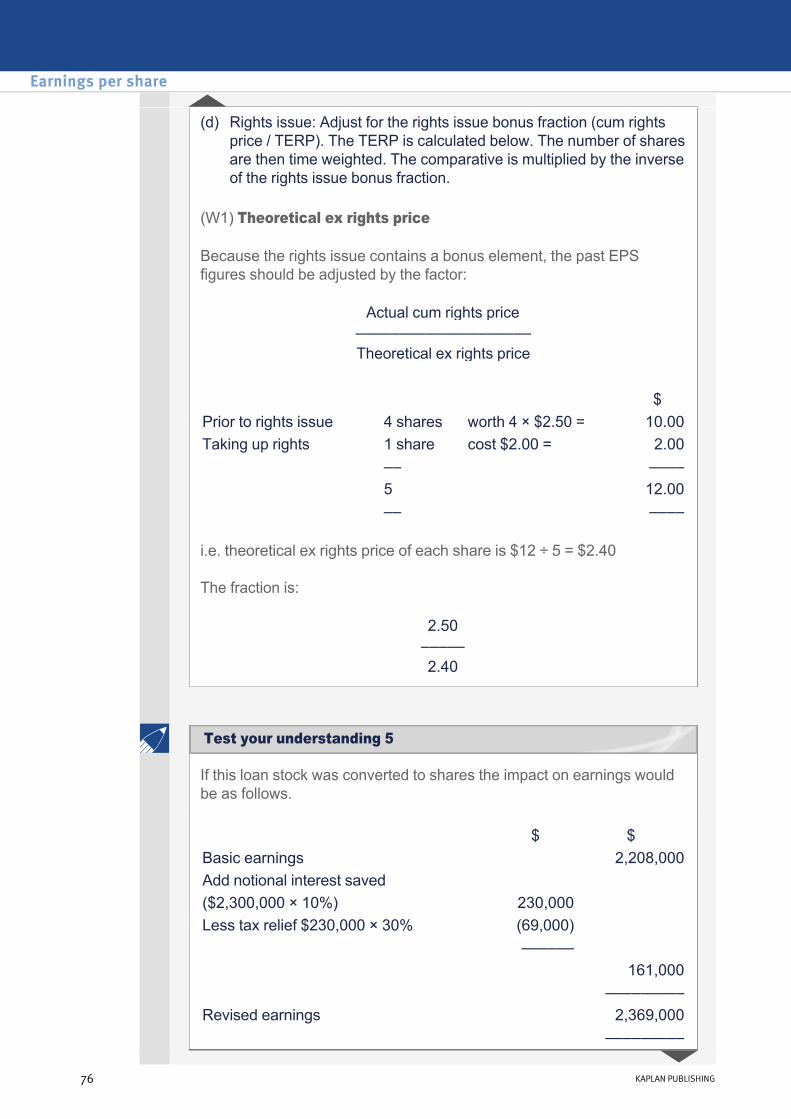
(W1) Theoretical ex rights price
Because the rights issue contains a bonus element, the past EPS figures should be adjusted by the factor:
i.e. theoretical ex rights price of each share is $12 ÷ 5 = $2.40
The fraction is:
(d) Rights issue: Adjust for the rights issue bonus fraction (cum rights price / TERP). The TERP is calculated below. The number of shares are then time weighted. The comparative is multiplied by the inverse of the rights issue bonus fraction.
Actual cum rights price–––––––––––––––––––– Theoretical ex rights price
$Prior to rights issue 4 shares worth 4 × $2.50 = 10.00Taking up rights 1 share cost $2.00 = 2.00
–– –––– 5 12.00–– ––––
2.50––––– 2.40
If this loan stock was converted to shares the impact on earnings would be as follows.
$ $Basic earnings 2,208,000Add notional interest saved ($2,300,000 × 10%) 230,000Less tax relief $230,000 × 30% (69,000)
–––––– 161,000 –––––––––
Revised earnings 2,369,000 –––––––––
Earnings per share
76 KAPLAN PUBLISHING
Test your understanding 5
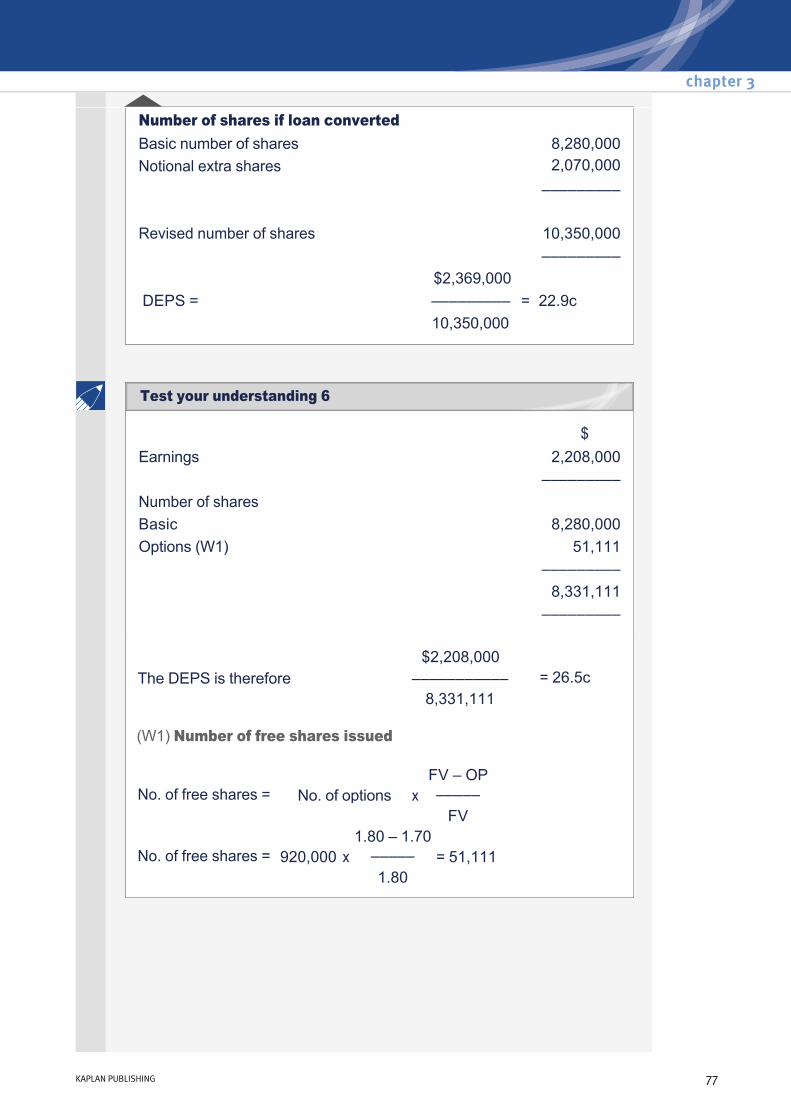
Number of shares if loan converted Basic number of shares 8,280,000Notional extra shares 2,070,000
–––––––––
Revised number of shares 10,350,000 –––––––––
$2,369,000 DEPS = ––––––––– = 22.9c 10,350,000
$ Earnings 2,208,000
––––––––– Number of sharesBasic 8,280,000Options (W1) 51,111
––––––––– 8,331,111
–––––––––
(W1) Number of free shares issued
$2,208,000The DEPS is therefore ––––––––––– = 26.5c
8,331,111
FV – OP No. of free shares = No. of options x ––––– FV 1.80 – 1.70 No. of free shares = 920,000 x ––––– = 51,111 1.80
chapter 3
KAPLAN PUBLISHING 77
Test your understanding 6
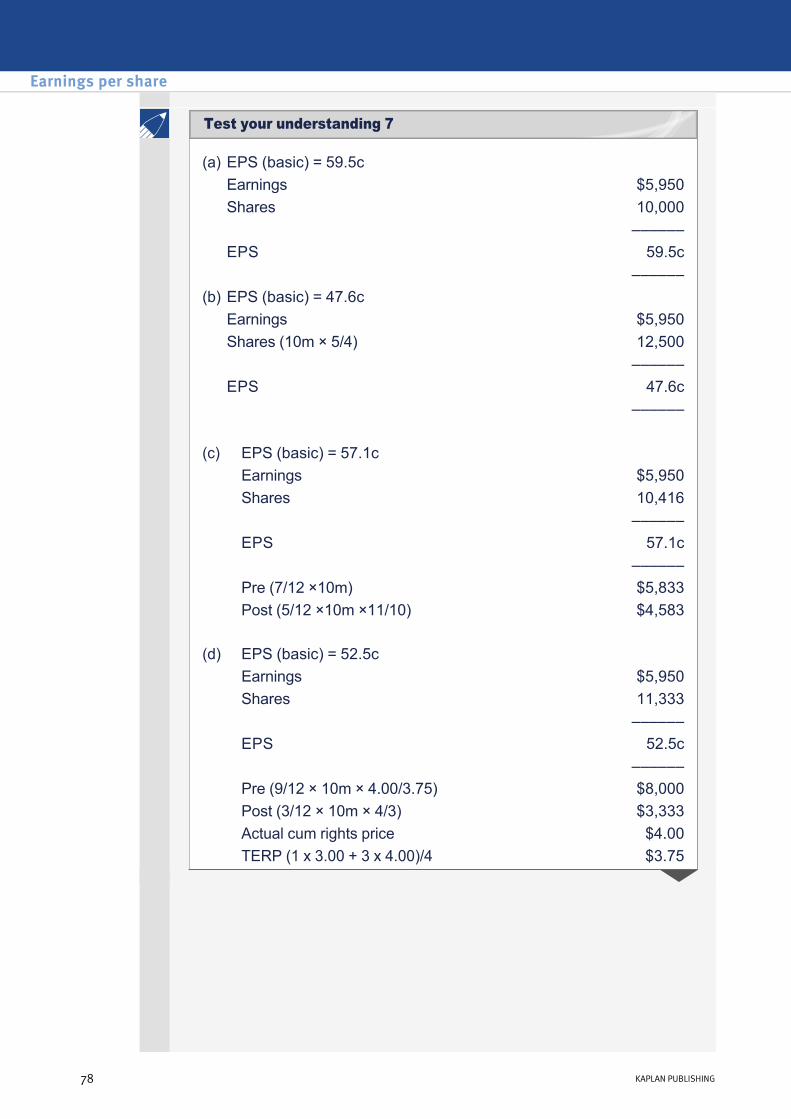
(a) EPS (basic) = 59.5c Earnings $5,950Shares 10,000
–––––– EPS 59.5c
–––––– (b) EPS (basic) = 47.6c
Earnings $5,950Shares (10m × 5/4) 12,500
–––––– EPS 47.6c
––––––
(c) EPS (basic) = 57.1c Earnings $5,950Shares 10,416
–––––– EPS 57.1c
–––––– Pre (7/12 ×10m) $5,833Post (5/12 ×10m ×11/10) $4,583
(d) EPS (basic) = 52.5c
Earnings $5,950Shares 11,333
–––––– EPS 52.5c
–––––– Pre (9/12 × 10m × 4.00/3.75) $8,000Post (3/12 × 10m × 4/3) $3,333Actual cum rights price $4.00TERP (1 x 3.00 + 3 x 4.00)/4 $3.75
Earnings per share
78 KAPLAN PUBLISHING
Test your understanding 7
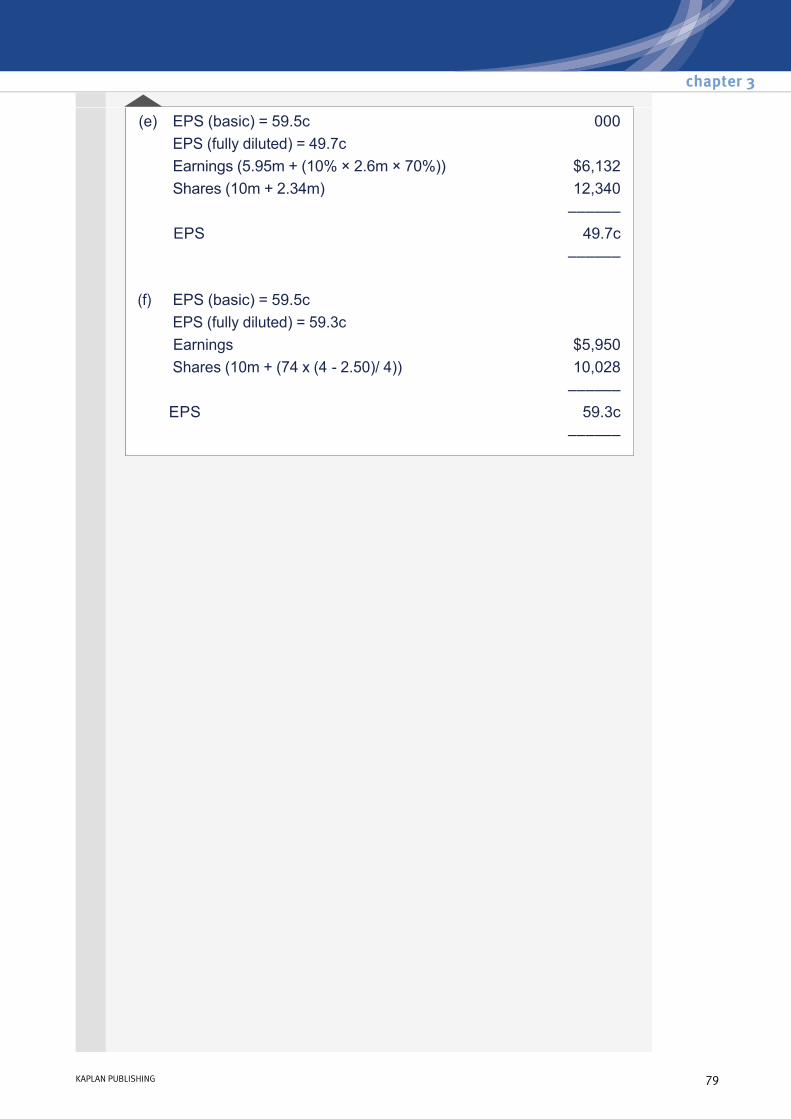
(e) EPS (basic) = 59.5c 000 EPS (fully diluted) = 49.7c Earnings (5.95m + (10% × 2.6m × 70%)) $6,132 Shares (10m + 2.34m) 12,340
–––––– EPS 49.7c
–––––– (f) EPS (basic) = 59.5c
EPS (fully diluted) = 59.3c Earnings $5,950 Shares (10m + (74 x (4 2.50)/ 4)) 10,028
–––––– EPS 59.3c
––––––
chapter 3
KAPLAN PUBLISHING 79

Earnings per share
80 KAPLAN PUBLISHING
Consolidated statement of financial positionChapter learning objectives
On completion of their studies students should be able to:
• Explain the relationships between investors and investees and the meaning of control;
• Identify the circumstances in which a subsidiary is excluded from consolidation;
• Prepare consolidated financial statements for a group of companies;
• Explain the treatment in consolidated financial statements of noncontrolling interests, pre and postacquisition reserves, goodwill (including its impairment), fair value adjustments, intragroup transactions and dividends.
81
chapter
4
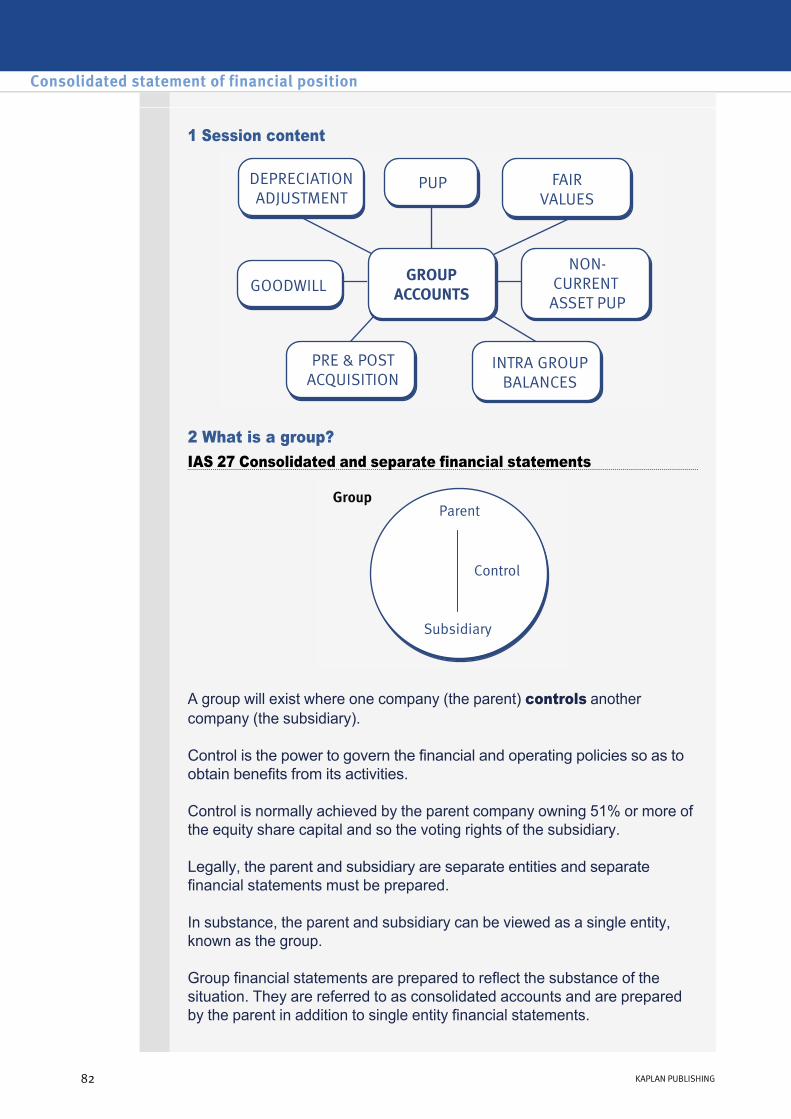
1 Session content
2 What is a group? IAS 27 Consolidated and separate financial statements
A group will exist where one company (the parent) controls another company (the subsidiary).
Control is the power to govern the financial and operating policies so as to obtain benefits from its activities.
Control is normally achieved by the parent company owning 51% or more of the equity share capital and so the voting rights of the subsidiary.
Legally, the parent and subsidiary are separate entities and separate financial statements must be prepared.
In substance, the parent and subsidiary can be viewed as a single entity, known as the group.
Group financial statements are prepared to reflect the substance of the situation. They are referred to as consolidated accounts and are prepared by the parent in addition to single entity financial statements.
Consolidated statement of financial position
82 KAPLAN PUBLISHING82 KAPLAN PUBLISHING

The boundary of a group is defined by control.
There are situations in which a parent may not own the majority of the voting rights, but control still exists:
• Power over the majority of the voting rights by virtue of an agreement with other investors;
• Power to govern the financial and operating policies by statute or agreement;
• Power to appoint/remove the majority of the board of directors;
• Power to cast the majority of votes at meetings of the board of directors.
Exclusions of subsidiaries
If on acquisition, a subsidiary meets the criteria to be classified as “Held for Sale” in accordance with IFRS 5: Noncurrent assets held for sale and discontinued operations it shall be excluded from consolidation.
3 Acquisition accounting
This requires the following rules to be followed:
• Add the parent and subsidiary's assets, liabilities, income and expenses in full;
• Recognise the noncontrolling interest's holding in the subsidiary;
• Recognise goodwill in accordance with IFRS 3 (revised) Business Combinations as the difference between the parent's cost of investment in the subsidiary together with the value of the noncontrolling interest's holding and the fair value of the subsidiary's net assets;
• The share capital of the group is only the share capital of the parent;
• Adjustments are made to record the subsidiary's net assets at fair value at the date of acquisition;
• Intragroup balances and transactions must be eliminated in full;
• Profits/losses on intragroup transactions are eliminated in full (the PUP adjustment);
• Uniform accounting policies must be used.
chapter 4
KAPLAN PUBLISHING 83
Subsidiaries classed as "Held for sale"
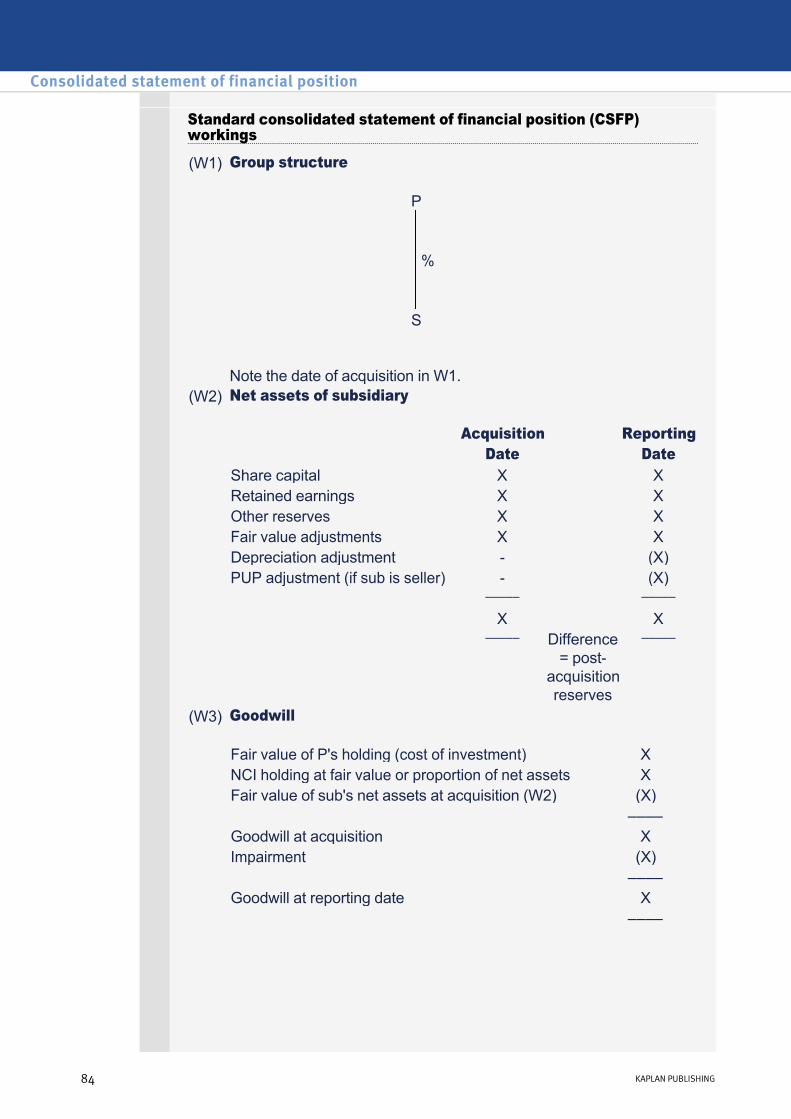
Standard consolidated statement of financial position (CSFP) workings
(W1) Group structure
Note the date of acquisition in W1.
P % S
(W2) Net assets of subsidiary
Acquisition Reporting Date Date Share capital X XRetained earnings X XOther reserves X XFair value adjustments X XDepreciation adjustment (X)PUP adjustment (if sub is seller) (X) ––––– ––––– X X ––––– Difference
= postacquisition reserves
–––––
(W3) Goodwill
Fair value of P's holding (cost of investment) XNCI holding at fair value or proportion of net assets XFair value of sub's net assets at acquisition (W2) (X) –––– Goodwill at acquisition XImpairment (X) –––– Goodwill at reporting date X ––––
Consolidated statement of financial position
84 KAPLAN PUBLISHING

(W4) Noncontrolling interests
NCI holding at acquisition (W3) (at fair value or proportion of net assets)
X
NCI% x post acquisition reserves (W2) XNCI% x impairment (W3) (fair value method only) (X) –––– X ––––
(W5) Group reserves
Retained earnings
Other reserves
Parent's reserves X XSub (P% × postacquisition reserves (W2))
X X
Impairment (W3) (use P% for fair value method)
(X) –
–––– –––– X X –––– ––––
4 Noncontrolling interest and goodwill
In paper F1 (Financial Operations), only fully owned (100%) subsidiaries were examinable. The F2 syllabus requires knowledge of how to consolidate nonfully owned subsidiaries.
By definition, a subsidiary is an entity that is controlled by another entity – the parent. Control is normally achieved by the parent owning a majority i.e. more than 50% of the equity shares of the subsidiary.
Noncontrolling interest (NCI) shareholders own the shares in the subsidiary not owned by the parent entity.
NCI shareholders are considered to be shareholders of the group and thus their ownership interest in the subsidiary’s net assets is reflected within equity.
Additionally, when calculating goodwill at acquisition the value of the NCI’s holding is added to the value of the parent’s holding in the subsidiary so that the value of the subsidiary as a whole (100%) is compared against all of its net assets.
chapter 4
KAPLAN PUBLISHING 85

IFRS 3 (2008) allows two methods to be used to value the NCI’s holding at the date of acquisition:
IFRS 3 (2008) permits groups to choose their policy on how to value NCI on an acquisition by acquisition basis. In other words, it is possible for a group to have some subsidiaries where the fair value method is being adopted, but other subsidiaries where the proportion of net assets method is adopted. An exam question will state which method is to be used.
Fair value method
The fair value of the noncontrolling interest's holding may be calculated using the market value of the subsidiary’s shares as at acquisition or other valuation techniques if the subsidiary’s shares are not traded in an active market. In exam questions, it is likely that you will be told the fair value of the NCI’s holding (or given the subsidiary’s share price in order to be able to calculate it).
Proportion of net assets method
Under this method, the NCI’s holding is measured by calculating their share of the fair value of the subsidiary’s net assets at acquisition.
• Fair value
• Proportion of net assets
Wellington purchased 80% of the equity share capital of Boot for $1,200,000 on 1 April 20X8. Boot’s share capital is made up of 200,000 $1 shares and it had retained earnings of $800,000 at the date of acquisition. The book value of Boot’s net assets was deemed to be equal to their fair value. The fair value of the NCI’s holding as at 1 April 20X8 was $250,000.
Consolidated statement of financial position
86 KAPLAN PUBLISHING
Example 1
Exampe 1 answer
Test your understanding 1 Wellington
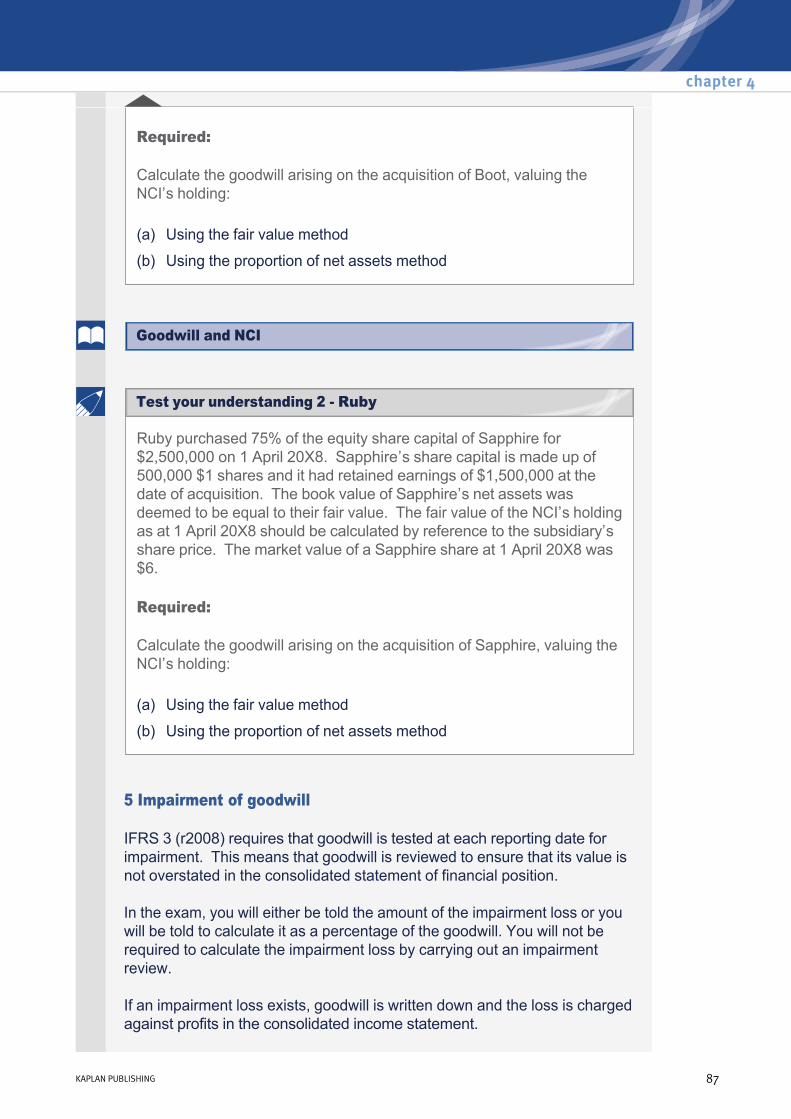
Required:
Calculate the goodwill arising on the acquisition of Boot, valuing the NCI’s holding:
(a) Using the fair value method
(b) Using the proportion of net assets method
Ruby purchased 75% of the equity share capital of Sapphire for $2,500,000 on 1 April 20X8. Sapphire’s share capital is made up of 500,000 $1 shares and it had retained earnings of $1,500,000 at the date of acquisition. The book value of Sapphire’s net assets was deemed to be equal to their fair value. The fair value of the NCI’s holding as at 1 April 20X8 should be calculated by reference to the subsidiary’s share price. The market value of a Sapphire share at 1 April 20X8 was $6.
Required:
Calculate the goodwill arising on the acquisition of Sapphire, valuing the NCI’s holding:
(a) Using the fair value method
(b) Using the proportion of net assets method
5 Impairment of goodwill
IFRS 3 (r2008) requires that goodwill is tested at each reporting date for impairment. This means that goodwill is reviewed to ensure that its value is not overstated in the consolidated statement of financial position.
In the exam, you will either be told the amount of the impairment loss or you will be told to calculate it as a percentage of the goodwill. You will not be required to calculate the impairment loss by carrying out an impairment review.
If an impairment loss exists, goodwill is written down and the loss is charged against profits in the consolidated income statement.
chapter 4
KAPLAN PUBLISHING 87
Test your understanding 2 Ruby
Goodwill and NCI

This charge against profits will result in a reduction in the equity section of the CSFP. How the impairment loss is charged against equity in the CSFP will depend on the method adopted for valuing the NCI’s holding, or in other words, the method used to calculate goodwill.
Fair value method
As discussed in the expandable text "Goodwill and NCI", valuing the NCI holding at fair value is equivalent to recognising goodwill in full, i.e. goodwill attributable to both the parent and NCI shareholders is recognised.
Consequently, any impairment loss is charged to both the parent and NCI shareholders in the equity section of the CSFP in accordance with their ownership ratio of the subsidiary.
To record the impairment loss:
Proportion of net assets method
As discussed in the expandable text above, valuing the NCI holding at their proportion of the subsidiary’s net assets is equivalent to recognising only the goodwill attributable to the parent shareholders.
Consequently, any impairment loss is only charged to the parent shareholders in the equity section of the CSFP.
To record the impairment loss:
• Reduce Goodwill W3 by the full amount of the impairment loss;
• Reduce NCI’s W4 by the NCI% of the impairment loss;
• Reduce Retained earnings W5 by the P% of the impairment loss
• Reduce Goodwill W3 by the amount of the impairment loss;
• Reduce Retained earnings W5 by the amount of the impairment loss.
Consolidated statement of financial position
88 KAPLAN PUBLISHING
Example 2 answer
Example 2
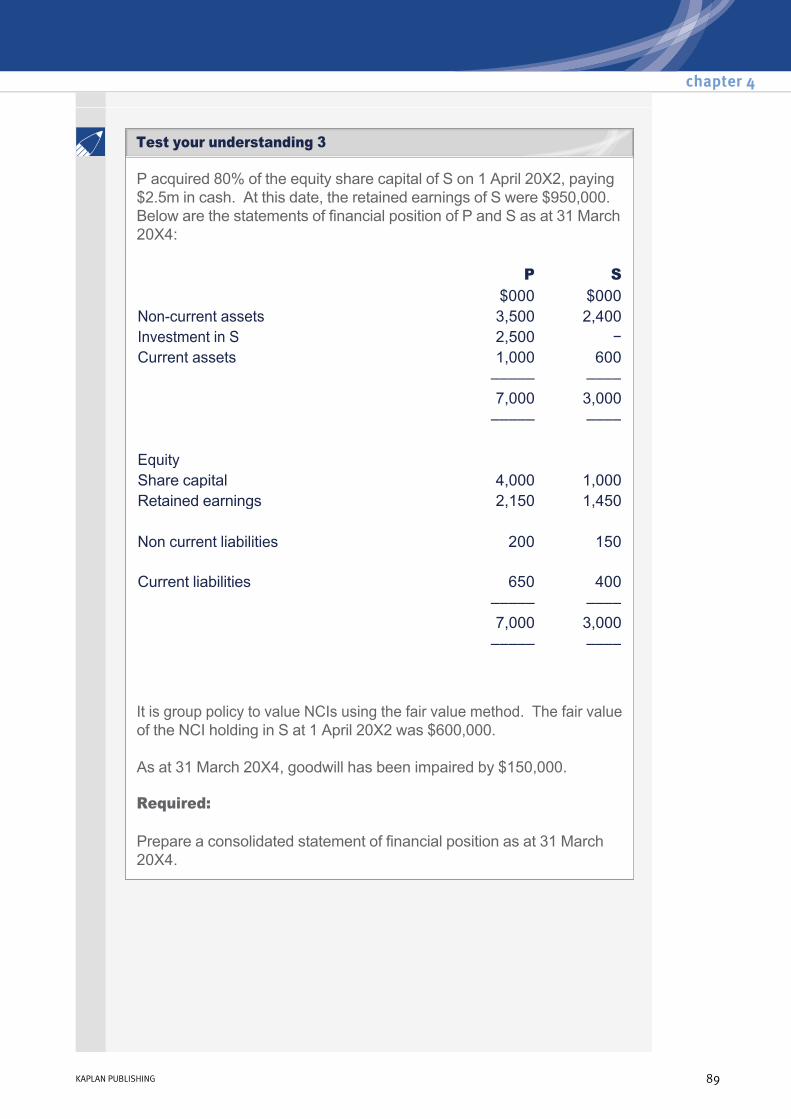
P acquired 80% of the equity share capital of S on 1 April 20X2, paying $2.5m in cash. At this date, the retained earnings of S were $950,000. Below are the statements of financial position of P and S as at 31 March 20X4:
It is group policy to value NCIs using the fair value method. The fair value of the NCI holding in S at 1 April 20X2 was $600,000.
As at 31 March 20X4, goodwill has been impaired by $150,000.
Required:
Prepare a consolidated statement of financial position as at 31 March 20X4.
P S $000 $000Noncurrent assets 3,500 2,400Investment in S 2,500 −Current assets 1,000 600 ––––– –––– 7,000 3,000 ––––– –––– Equity Share capital 4,000 1,000Retained earnings 2,150 1,450 Non current liabilities 200 150 Current liabilities 650 400
––––– –––– 7,000 3,000
––––– ––––
chapter 4
KAPLAN PUBLISHING 89
Test your understanding 3
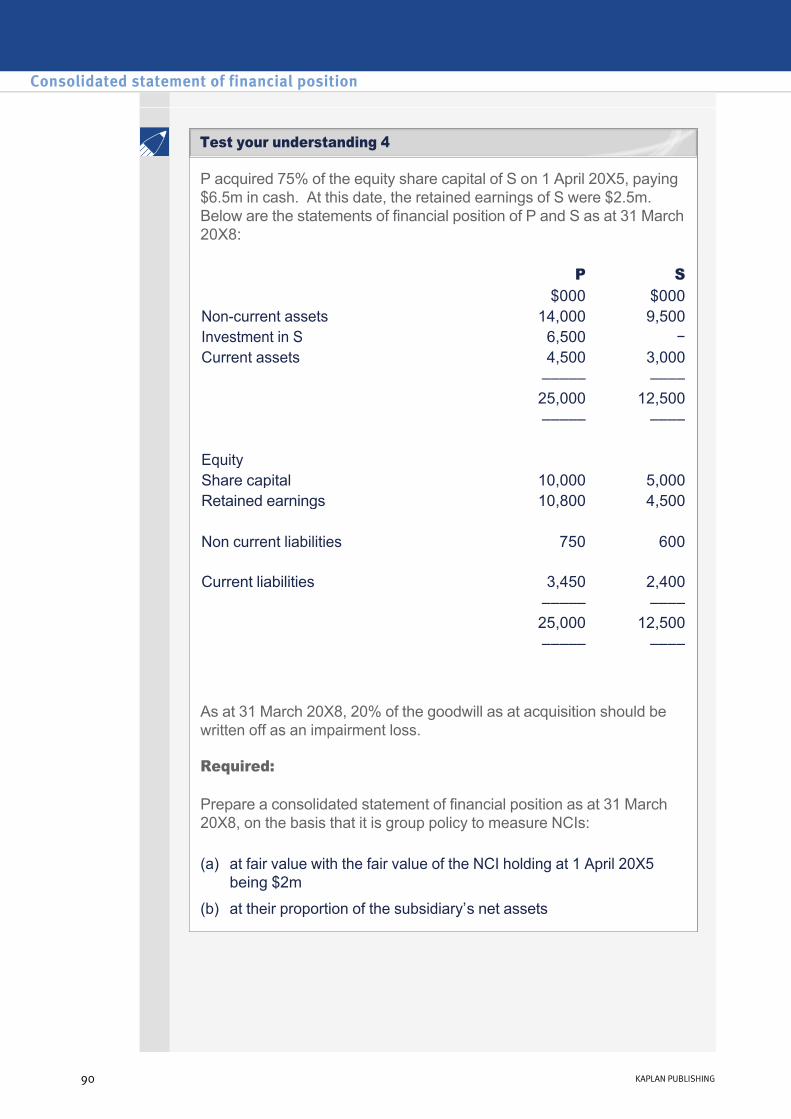
P acquired 75% of the equity share capital of S on 1 April 20X5, paying $6.5m in cash. At this date, the retained earnings of S were $2.5m. Below are the statements of financial position of P and S as at 31 March 20X8:
As at 31 March 20X8, 20% of the goodwill as at acquisition should be written off as an impairment loss.
Required:
Prepare a consolidated statement of financial position as at 31 March 20X8, on the basis that it is group policy to measure NCIs:
P S $000 $000Noncurrent assets 14,000 9,500Investment in S 6,500 −Current assets 4,500 3,000 ––––– –––– 25,000 12,500 ––––– –––– Equity Share capital 10,000 5,000Retained earnings 10,800 4,500 Non current liabilities 750 600 Current liabilities 3,450 2,400
––––– –––– 25,000 12,500
––––– ––––
(a) at fair value with the fair value of the NCI holding at 1 April 20X5 being $2m
(b) at their proportion of the subsidiary’s net assets
Consolidated statement of financial position
90 KAPLAN PUBLISHING
Test your understanding 4
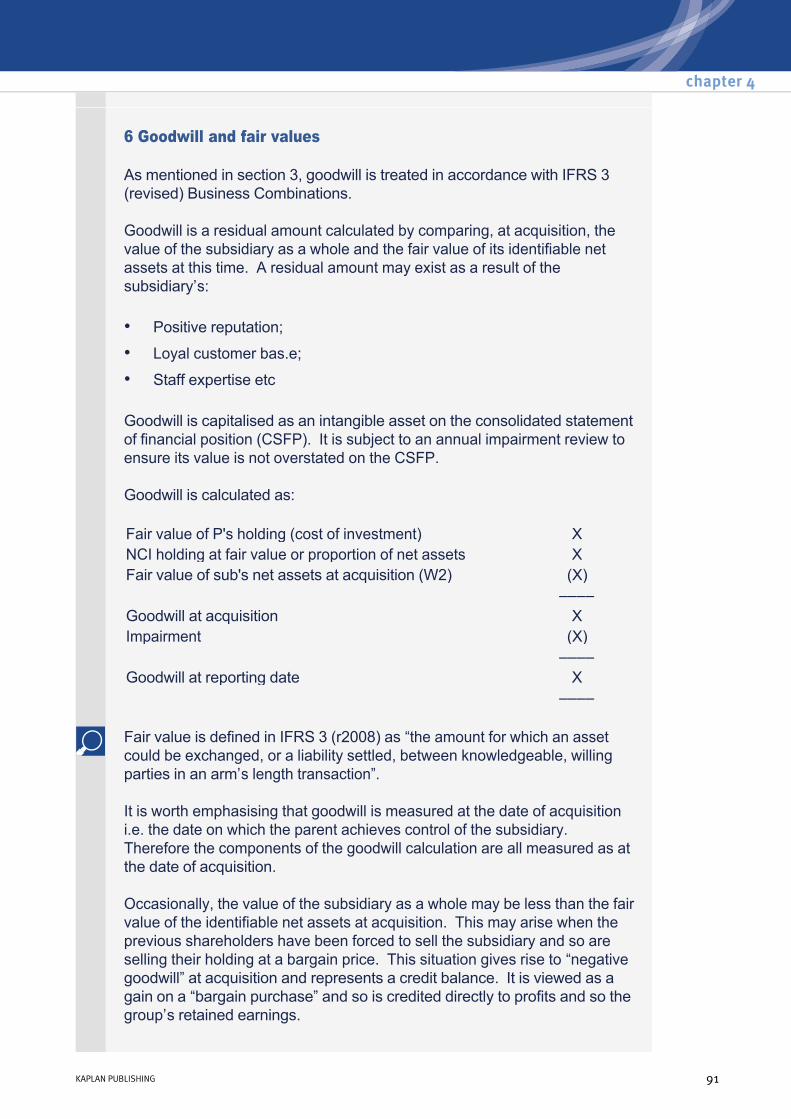
6 Goodwill and fair values
As mentioned in section 3, goodwill is treated in accordance with IFRS 3 (revised) Business Combinations.
Goodwill is a residual amount calculated by comparing, at acquisition, the value of the subsidiary as a whole and the fair value of its identifiable net assets at this time. A residual amount may exist as a result of the subsidiary’s:
Goodwill is capitalised as an intangible asset on the consolidated statement of financial position (CSFP). It is subject to an annual impairment review to ensure its value is not overstated on the CSFP.
Goodwill is calculated as:
• Positive reputation;
• Loyal customer bas.e;
• Staff expertise etc
Fair value of P's holding (cost of investment) XNCI holding at fair value or proportion of net assets XFair value of sub's net assets at acquisition (W2) (X) –––– Goodwill at acquisition XImpairment (X) –––– Goodwill at reporting date X ––––
Fair value is defined in IFRS 3 (r2008) as “the amount for which an asset could be exchanged, or a liability settled, between knowledgeable, willing parties in an arm’s length transaction”.
It is worth emphasising that goodwill is measured at the date of acquisition i.e. the date on which the parent achieves control of the subsidiary. Therefore the components of the goodwill calculation are all measured as at the date of acquisition.
Occasionally, the value of the subsidiary as a whole may be less than the fair value of the identifiable net assets at acquisition. This may arise when the previous shareholders have been forced to sell the subsidiary and so are selling their holding at a bargain price. This situation gives rise to “negative goodwill” at acquisition and represents a credit balance. It is viewed as a gain on a “bargain purchase” and so is credited directly to profits and so the group’s retained earnings.
chapter 4
KAPLAN PUBLISHING 91
Section 4 has already discussed how the NCI’s holding is valued at acquisition. Sections 7 and 8 explain how to measure the fair value of the parent’s holding and the fair value of the subsidiary’s net assets.
7 Fair value of parent's holding
The value of the parent’s holding in the subsidiary comprises the fair value as at the date of acquisition of all consideration given by the parent company in return for their holding in the subsidiary. It is effectively the parent’s cost of the investment in the subsidiary and is recognised within “Investments” in their individual statement of financial position.
It can be made up of several forms of consideration:
Note that directly attributable costs incurred in acquiring the subsidiary such as professional or legal fees are not included. They are expensed to the parent’s Income Statement. This is because they are not part of what the parent gives in return for the shareholding in the subsidiary and so do not represent part of the value of that shareholding.
Additionally, provisions for future losses or expenses are not part of the value of the parent’s holding in the subsidiary. However, they may be provided for in the parent’s individual financial statements in accordance with IAS 37 Provisions if the recognition criteria are met.
Deferred consideration
This is consideration, normally cash, which will be paid in the future.
It is measured at its present value at acquisition for inclusion within the goodwill calculation, i.e. the future cash flow is discounted.
It is recorded in the parent’s individual financial statements by:
Dr Investments
Cr Deferred consideration liability
Cash XShares issued by parent company (at market value)
X
Deferred consideration (at present value of future cash flows)
X
Contingent consideration (at fair value)
X
–––Fair value of P's holding X –––
Consolidated statement of financial position
92 KAPLAN PUBLISHING

Every year after acquisition, the liability will need to be increased to reflect that that payment is one year closer and so the present value has increased. This is referred to as unwinding the discount. The increase in the liability is charged as a finance cost. Therefore, the entry recorded in the parent’s individual financial statements is:
Dr Finance cost (and so reduces the parent’s retained earnings)
Cr Deferred consideration liability
Contingent consideration
Contingent consideration is consideration that may be paid in the future if certain future events occur or conditions are met. For example, cash may be paid in the future if certain profit targets are met.
Contingent consideration is measured at its fair value as at the date of acquisition, to be consistent with how other forms of consideration are measured.
In exam questions, the fair value will be given or you will be told how to calculate it.
Adjustments to the value of contingent consideration arising due to events after the acquisition date, e.g. a profit target not being met, are normally charged to profits.
Duck has invested in 60% of Wicket’s 10,000 $1 equity shares. Duck paid $5,000 cash consideration and issued 2 shares for every 3 shares acquired. At the date of acquisition the market value of a Duck share was $2.25.
Duck agreed to pay $3,000 cash 2 years after acquisition. A further $1,000 cash will be paid 3 years after acquisition if Wicket achieves a certain profit target. The fair value of this contingent consideration was deemed to be $700.
At acquisition the fair value of the NCI holding was measured at $10,000 and the fair value of Wicket’s net assets was $15,000.
Assume a discount rate of 10%.
chapter 4
KAPLAN PUBLISHING 93
Example 3 answer
Example 3
Test your understanding 5

Required:
Using the fair value method, calculate the goodwill arising on the acquisition of Wicket.
8 Fair value of subsidiary's net assets
At acquisition, the subsidiary’s net assets must be measured at fair value for inclusion within the consolidated financial statements.
The group must recognise the identifiable assets acquired and liabilities assumed of the subsidiary.
For example, costs relating to restructuring the subsidiary that will arise after acquisition do not meet the definition of a liability as at acquisition.
Consequently certain intangible assets such as brand names, patents and customer relationships that are not recognised in the subsidiary’s individual financial statements may be recognised on consolidation if they are identifiable.
Contingent liabilities are not recognised in the subsidiary’s individual financial statements. (In accordance with IAS 37 they are simply disclosed by note.) On consolidation, however, a contingent liability will be recognised as a liability if it's fair value can be measured reliably, i.e. it is recognised even if it is not probable.
In the majority of exam questions, you are told the fair value of the subsidiary’s assets / liabilities or are told the adjustment required to certain items. However, it may be required that you will need to calculate the fair value of certain assets / liabilities, in which case IFRS 3 provides guidance on how to do this.
• An asset or liability may only be recognised if it meets the definition of an asset or liability as at the acquisition date.
• An asset is identifiable if it either: – Is capable of being separated (regardless of whether the
subsidiary intends to sell it); or
– Arises from contractual or other legal rights.
Consolidated statement of financial position
94 KAPLAN PUBLISHING
Measuring fair value
Example 4
Recording fair value adjustments
The fair value of the subsidiary’s net assets at acquisition represents the “cost” of the net assets to the group at the date of acquisition. Recording fair value adjustments is therefore in accordance with the historic cost concept.
It also ensures an accurate measurement of goodwill. Assuming the fair value of the subsidiary’s net assets is higher than their book value, goodwill would be overstated if the fair value adjustment were not recognised.
To record fair value adjustments:
Impact on depreciation
Fair value adjustments often involve adjusting noncurrent asset values which will consequently involve an adjustment to depreciation.
Depreciation in the group accounts must be based on the carrying value of the related noncurrent asset in the group accounts. Therefore if the noncurrent asset values are adjusted at acquisition then so must depreciation charges be adjusted in the post acquisition period.
To record depreciation adjustments
• Adjust W2 in both columns (unless the asset / liability no longer exists at the reporting date)
• Face of CSFP
• Adjust W2 in reporting date column only
• Face of CSFP
chapter 4
KAPLAN PUBLISHING 95
Example 5
Example 4 answer
Example 5 answer

The following summarised statements of financial position are provided for King and Lear as at 31 December 20X7:
King purchased 60% of Lear’s equity shares 1 January 20X5 for $1.2m when Lear’s retained earnings were $100,000.
At this date Lear’s noncurrent assets had a fair value of $1m and the assets had a remaining useful economic life of 5 years. Their book value at the date of acquisition was $850,000.
It is group policy to measure the NCI holding at fair value. The fair value of the NCI holding in Lear at 1 January 20X5 was $700,000.
As at 31 December 20X7, an impairment loss of $50,000 has arisen on goodwill.
Required:
Prepare the consolidated statement of financial position at 31 December 20X7.
King Lear $000 $000
Noncurrent assets 2,000 1,000Investment in Lear 1,200 Current assets 200 450 ––––– –––– 3,400 1,450 ––––– –––– Equity Share capital ($1) 2,000 750Retained earnings 1,250 300 Current liabilities 150 400
––––– –––– 3,400 1,450
––––– ––––
Consolidated statement of financial position
96 KAPLAN PUBLISHING
Test your understanding 6 King and Lear
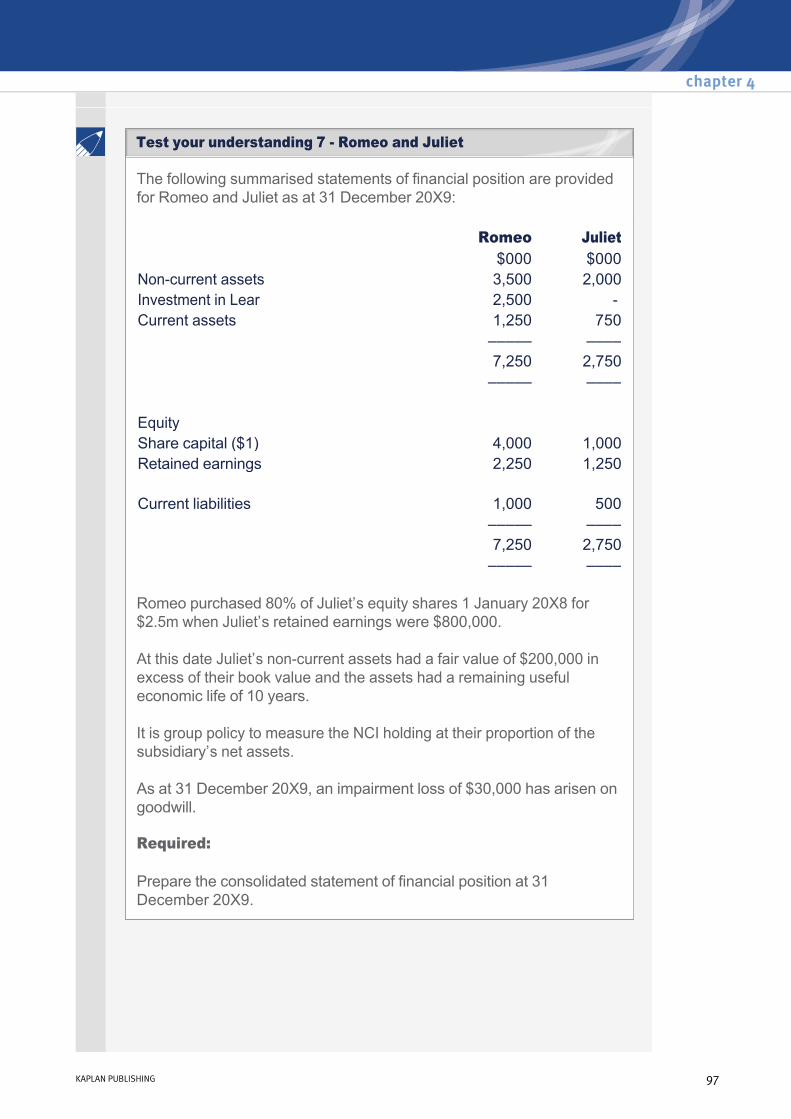
The following summarised statements of financial position are provided for Romeo and Juliet as at 31 December 20X9:
Romeo purchased 80% of Juliet’s equity shares 1 January 20X8 for $2.5m when Juliet’s retained earnings were $800,000.
At this date Juliet’s noncurrent assets had a fair value of $200,000 in excess of their book value and the assets had a remaining useful economic life of 10 years.
It is group policy to measure the NCI holding at their proportion of the subsidiary’s net assets.
As at 31 December 20X9, an impairment loss of $30,000 has arisen on goodwill.
Required:
Prepare the consolidated statement of financial position at 31 December 20X9.
Romeo Juliet $000 $000
Noncurrent assets 3,500 2,000Investment in Lear 2,500 Current assets 1,250 750 ––––– –––– 7,250 2,750 ––––– –––– Equity Share capital ($1) 4,000 1,000Retained earnings 2,250 1,250 Current liabilities 1,000 500
––––– –––– 7,250 2,750
––––– ––––
chapter 4
KAPLAN PUBLISHING 97
Test your understanding 7 Romeo and Juliet
9 Intragroup balances
Intragroup balances must be eliminated in full, since the group as a single entity cannot owe balances to/from itself.
Intragroup balances may arise in the following situations:
Adjust
Current account balances may disagree. This is most likely to be due to cash in transit or goods in transit.
Cash in transit
Cash has been sent by one group company, but has not been received and so is not recorded in the books of the other group company. The following adjustment will be required:
Goods in transit
Goods have been sent by one company, but have not been received and so are not recorded in the books of the other group company. The following adjustment will be required:
• P and S trading with each other, resulting in current account balances i.e. receivables and payables
• Intragroup loans, resulting in an investment and loan balance
• Face of CSFP by reducing the relevant asset and liability
CrReceivables (with the higher amount)
DrBank (with the amount in transit i.e. the difference)
DrPayables (with the lower amount)
CrReceivables (with the higher amount)
Dr Inventory (with the amount in transit i.e. the difference)
DrPayables (with the lower amount)
Consolidated statement of financial position
98 KAPLAN PUBLISHING
Example 6 answer
Example 6

The following summarised statements of financial position are provided for P and S as at 31 December 20X8:
P acquired 90% of S five years ago when the balance on the retained earnings of S was $300,000.
Some of the noncurrent assets of S had a fair value of $1.2m at the date of acquisition by P. Their book value at this time was $1m. These noncurrent assets will be depreciated on a straight line basis over 20 years from the date of acquisition.
P and S traded with each other and at the reporting date, P owed S $25,000. This balance is stated after P had recorded that they had sent a cheque for $5,000 to S shortly before the yearend which S had not received by the reporting date.
It is group policy to record the NCI holding at their proportion of the subsidiary’s net assets. At the reporting date, goodwill should be written down by $500,000 for impairment.
P S $000 $000
Noncurrent assets 5,400 2,000Investment in S 3,700 Current assets
Inventory 750 140Receivables 650 95Cash 400 85
––––– –––– 10,900 2,320
––––– –––– Equity Share capital $1 7,000 1,400Share premium 1,950 280Retained earnings 1,050 440 Current liabilities
Payables 900 200 ––––– –––– 10,900 2,320
––––– ––––
chapter 4
KAPLAN PUBLISHING 99
Test your understanding 8
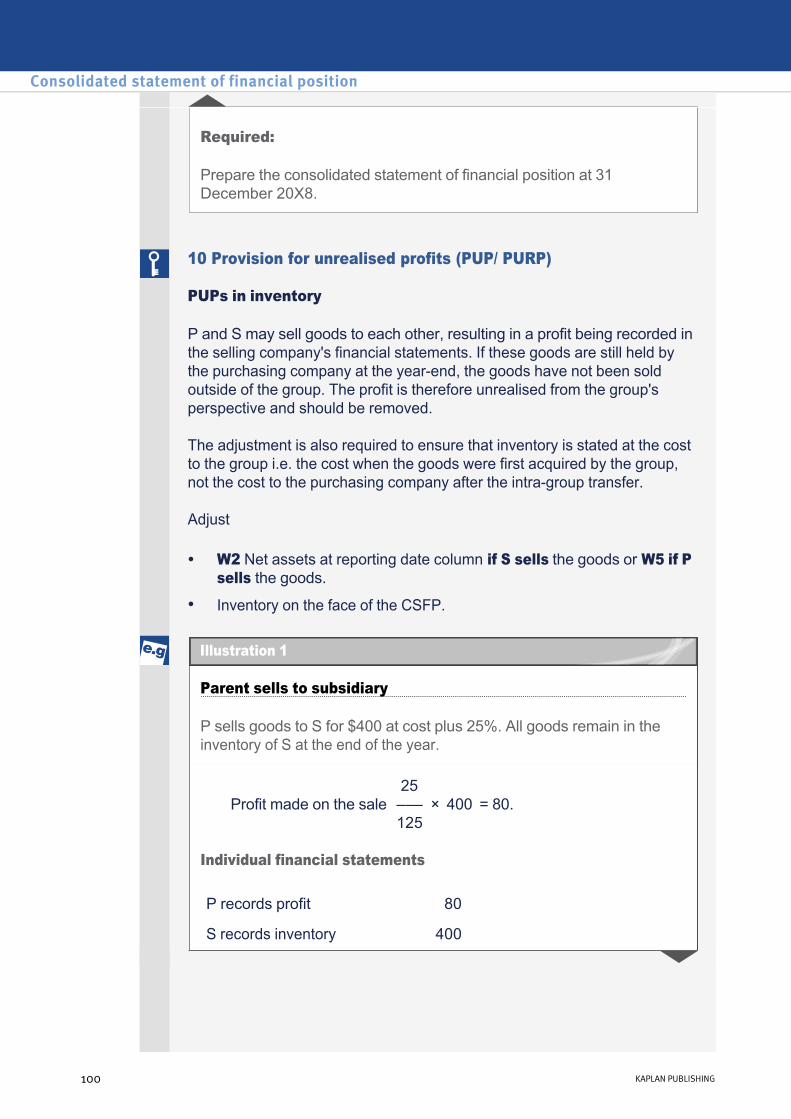
Required:
Prepare the consolidated statement of financial position at 31 December 20X8.
10 Provision for unrealised profits (PUP/ PURP)
PUPs in inventory
P and S may sell goods to each other, resulting in a profit being recorded in the selling company's financial statements. If these goods are still held by the purchasing company at the yearend, the goods have not been sold outside of the group. The profit is therefore unrealised from the group's perspective and should be removed.
The adjustment is also required to ensure that inventory is stated at the cost to the group i.e. the cost when the goods were first acquired by the group, not the cost to the purchasing company after the intragroup transfer.
Adjust
• W2 Net assets at reporting date column if S sells the goods or W5 if P sells the goods.
• Inventory on the face of the CSFP.
Parent sells to subsidiary
P sells goods to S for $400 at cost plus 25%. All goods remain in the inventory of S at the end of the year.
Individual financial statements
Profit made on the sale
25 ––– × 400 125
= 80.
P records profit 80
S records inventory 400
Consolidated statement of financial position
100 KAPLAN PUBLISHING
Illustration 1
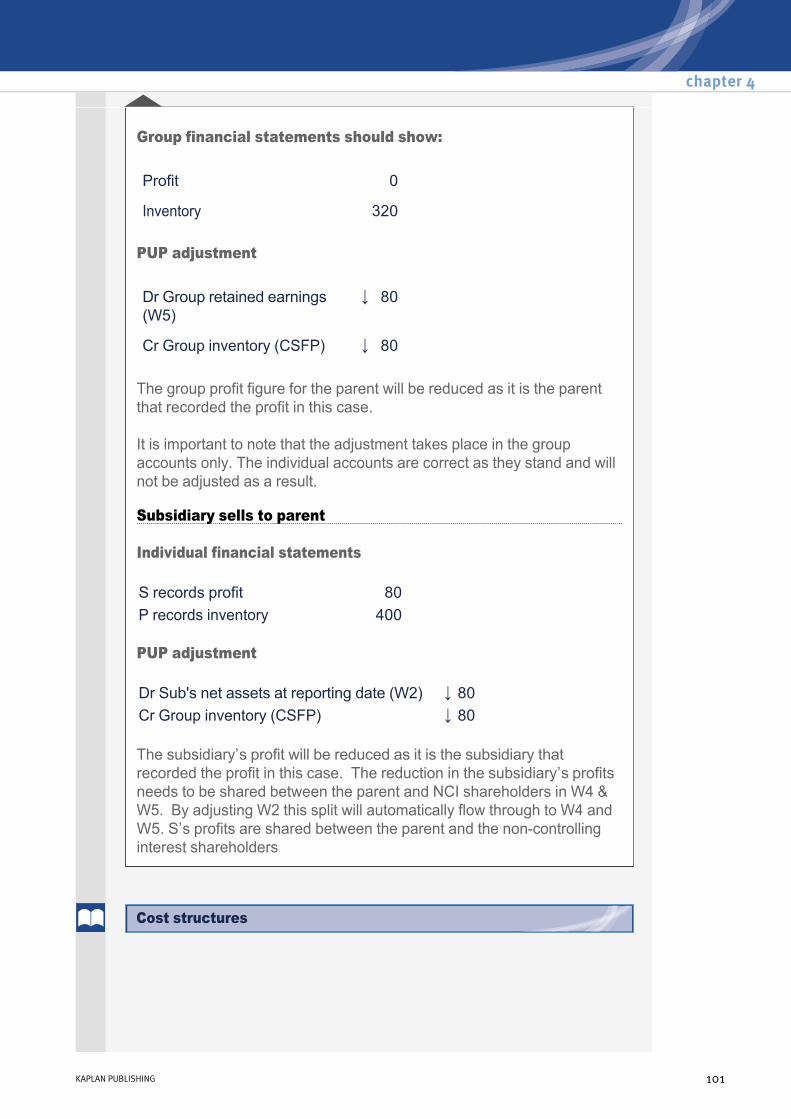
Group financial statements should show:
PUP adjustment
The group profit figure for the parent will be reduced as it is the parent that recorded the profit in this case.
It is important to note that the adjustment takes place in the group accounts only. The individual accounts are correct as they stand and will not be adjusted as a result.
Subsidiary sells to parent
Individual financial statements
PUP adjustment
The subsidiary’s profit will be reduced as it is the subsidiary that recorded the profit in this case. The reduction in the subsidiary’s profits needs to be shared between the parent and NCI shareholders in W4 & W5. By adjusting W2 this split will automatically flow through to W4 and W5. S’s profits are shared between the parent and the noncontrolling interest shareholders
Profit 0
Inventory 320
Dr Group retained earnings (W5)
↓ 80
Cr Group inventory (CSFP) ↓ 80
S records profit 80P records inventory 400
Dr Sub's net assets at reporting date (W2) ↓ 80Cr Group inventory (CSFP) ↓ 80
chapter 4
KAPLAN PUBLISHING 101
Cost structures
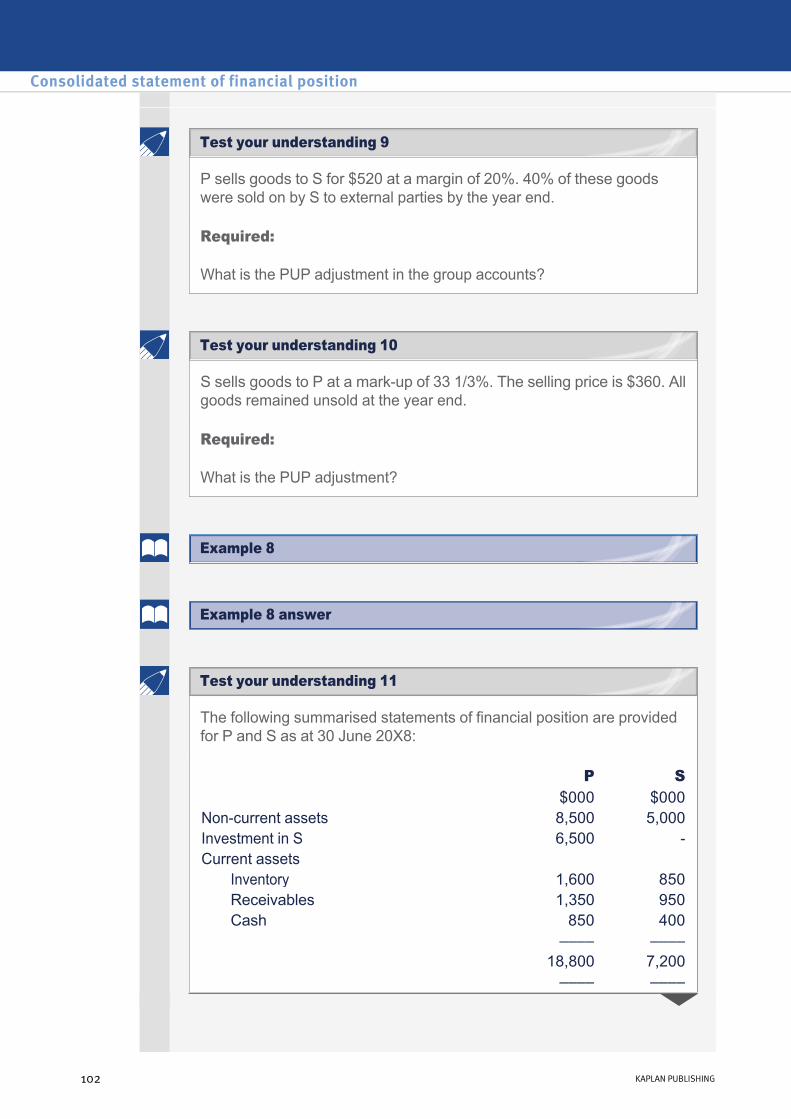
P sells goods to S for $520 at a margin of 20%. 40% of these goods were sold on by S to external parties by the year end.
Required:
What is the PUP adjustment in the group accounts?
S sells goods to P at a markup of 33 1/3%. The selling price is $360. All goods remained unsold at the year end.
Required:
What is the PUP adjustment?
The following summarised statements of financial position are provided for P and S as at 30 June 20X8:
P S $000 $000
Noncurrent assets 8,500 5,000Investment in S 6,500 Current assets
Inventory 1,600 850Receivables 1,350 950Cash 850 400
–––– –––– 18,800 7,200
–––– ––––
Consolidated statement of financial position
102 KAPLAN PUBLISHING
Test your understanding 10
Example 8
Example 8 answer
Test your understanding 11
Test your understanding 9
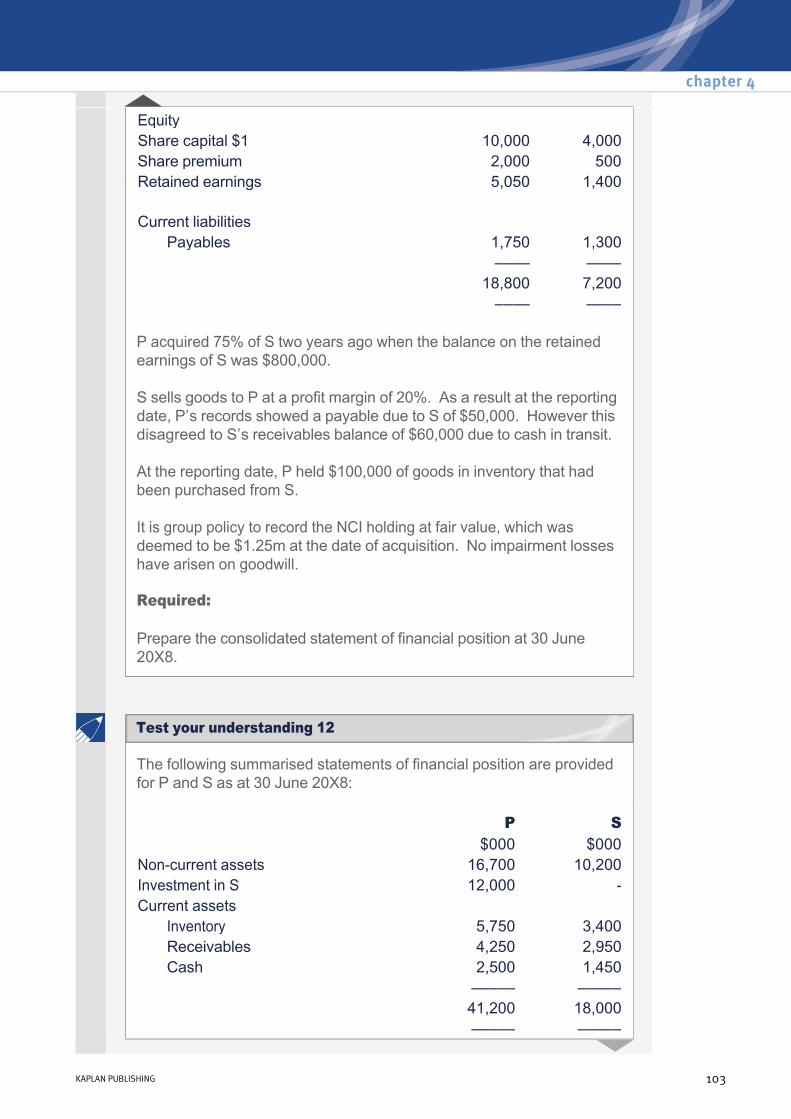
P acquired 75% of S two years ago when the balance on the retained earnings of S was $800,000.
S sells goods to P at a profit margin of 20%. As a result at the reporting date, P’s records showed a payable due to S of $50,000. However this disagreed to S’s receivables balance of $60,000 due to cash in transit.
At the reporting date, P held $100,000 of goods in inventory that had been purchased from S.
It is group policy to record the NCI holding at fair value, which was deemed to be $1.25m at the date of acquisition. No impairment losses have arisen on goodwill.
Required:
Prepare the consolidated statement of financial position at 30 June 20X8.
Equity Share capital $1 10,000 4,000Share premium 2,000 500Retained earnings 5,050 1,400 Current liabilities
Payables 1,750 1,300 –––– –––– 18,800 7,200
–––– ––––
The following summarised statements of financial position are provided for P and S as at 30 June 20X8:
P S $000 $000
Noncurrent assets 16,700 10,200Investment in S 12,000 Current assets
Inventory 5,750 3,400Receivables 4,250 2,950Cash 2,500 1,450
––––– ––––– 41,200 18,000
––––– –––––
chapter 4
KAPLAN PUBLISHING 103
Test your understanding 12
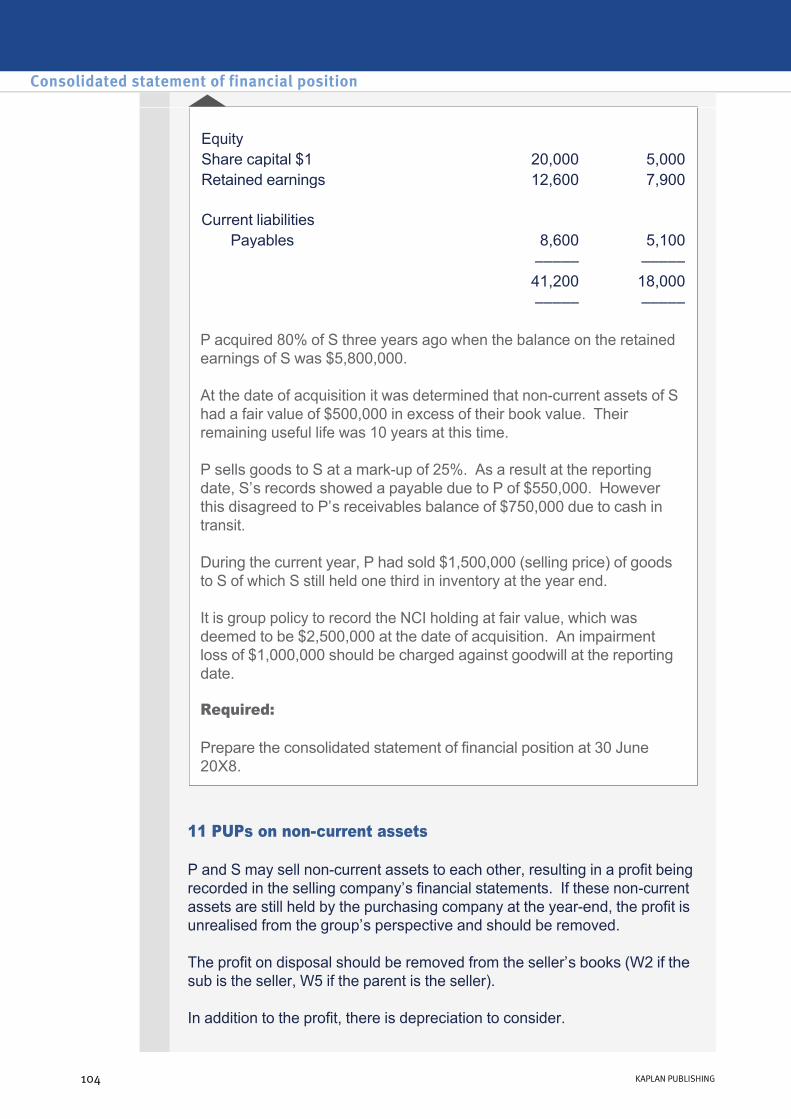
P acquired 80% of S three years ago when the balance on the retained earnings of S was $5,800,000.
At the date of acquisition it was determined that noncurrent assets of S had a fair value of $500,000 in excess of their book value. Their remaining useful life was 10 years at this time.
P sells goods to S at a markup of 25%. As a result at the reporting date, S’s records showed a payable due to P of $550,000. However this disagreed to P’s receivables balance of $750,000 due to cash in transit.
During the current year, P had sold $1,500,000 (selling price) of goods to S of which S still held one third in inventory at the year end.
It is group policy to record the NCI holding at fair value, which was deemed to be $2,500,000 at the date of acquisition. An impairment loss of $1,000,000 should be charged against goodwill at the reporting date.
Required:
Prepare the consolidated statement of financial position at 30 June 20X8.
Equity Share capital $1 20,000 5,000Retained earnings 12,600 7,900 Current liabilities
Payables 8,600 5,100 ––––– ––––– 41,200 18,000
––––– –––––
11 PUPs on noncurrent assets
P and S may sell noncurrent assets to each other, resulting in a profit being recorded in the selling company’s financial statements. If these noncurrent assets are still held by the purchasing company at the yearend, the profit is unrealised from the group’s perspective and should be removed.
The profit on disposal should be removed from the seller’s books (W2 if the sub is the seller, W5 if the parent is the seller).
In addition to the profit, there is depreciation to consider.
Consolidated statement of financial position
104 KAPLAN PUBLISHING

Prior to the transfer, the asset is depreciated based on the original cost. After the transfer depreciation is calculated on the transfer prices, i.e. a higher value. Therefore depreciation is higher after the transfer and this extra cost must be eliminated in the consolidated financial statements, i.e. profits need to be increased.
The extra depreciation that has been charged should be removed from the purchaser’s books.
Adjust:
• Profit on disposal – reduce W2 Net assets at reporting date if S sells the asset or reduce W5 if P sells the asset;
• Extra depreciation – increase W5 if S sells the asset or increase W2 Net assets at reporting date if P sells the asset;
• Decrease the noncurrent asset in the CSFP with the net amount.
If P transfers a noncurrent asset to its subsidiary
P acquired 80% of the share capital of S some years ago. P’s reporting date is 31 August. P transfers an asset on 1 March 20X7 for $75,000 when its carrying value is $60,000. The remaining useful life at the date of sale is 2.5 years. The group depreciation policy is straight line on a monthly basis.
What adjustment is required in the consolidated financial statements of P for the year ended 31 August 20X8?
Profit recorded on the sale: $75,000 $60,000 = $15,000
Extra depreciation: ($75,000 $60,000) x 1.5/2.5 = $9,000
Adjustment required:
DrRetained earnings (W5)
↓$15,000
CrSub's net assets at reporting date (W2)
↑ $9,000
CrNCA (CSFP) ↓ $6,000
chapter 4
KAPLAN PUBLISHING 105
Illustration 2
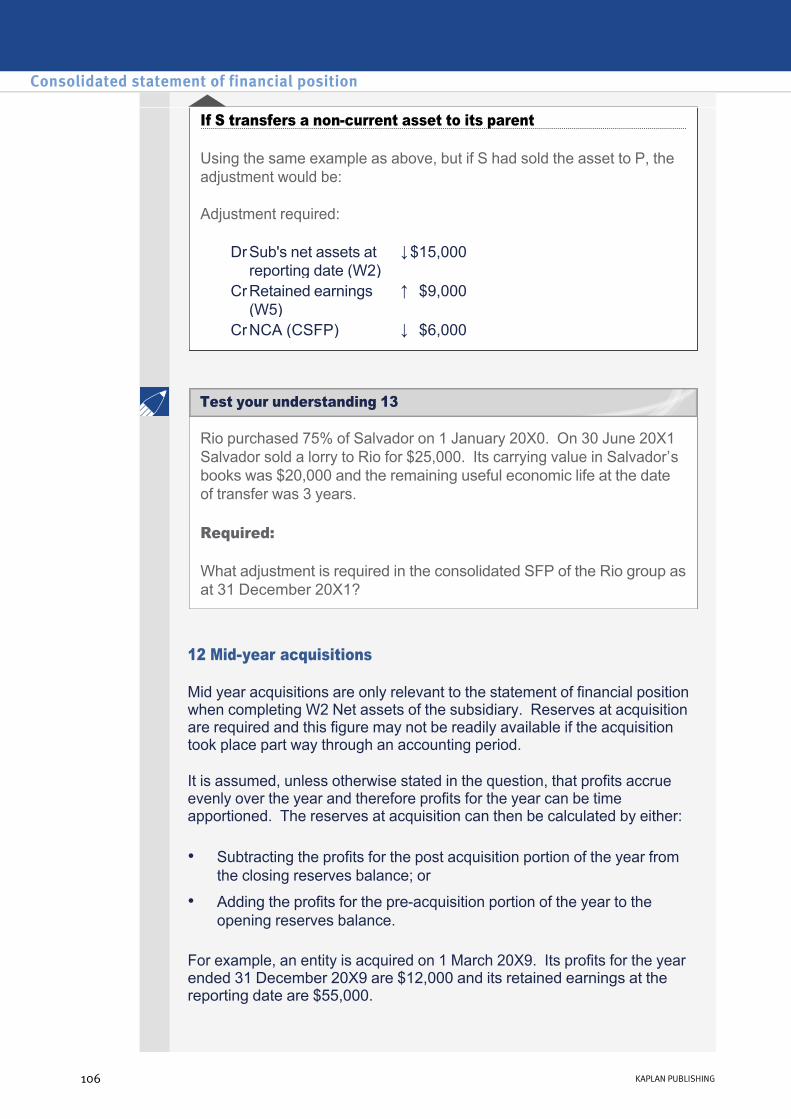
If S transfers a noncurrent asset to its parent
Using the same example as above, but if S had sold the asset to P, the adjustment would be:
Adjustment required:
DrSub's net assets at reporting date (W2)
↓$15,000
CrRetained earnings (W5)
↑ $9,000
CrNCA (CSFP) ↓ $6,000
Rio purchased 75% of Salvador on 1 January 20X0. On 30 June 20X1 Salvador sold a lorry to Rio for $25,000. Its carrying value in Salvador’s books was $20,000 and the remaining useful economic life at the date of transfer was 3 years.
Required:
What adjustment is required in the consolidated SFP of the Rio group as at 31 December 20X1?
12 Midyear acquisitions
Mid year acquisitions are only relevant to the statement of financial position when completing W2 Net assets of the subsidiary. Reserves at acquisition are required and this figure may not be readily available if the acquisition took place part way through an accounting period.
It is assumed, unless otherwise stated in the question, that profits accrue evenly over the year and therefore profits for the year can be time apportioned. The reserves at acquisition can then be calculated by either:
For example, an entity is acquired on 1 March 20X9. Its profits for the year ended 31 December 20X9 are $12,000 and its retained earnings at the reporting date are $55,000.
• Subtracting the profits for the post acquisition portion of the year from the closing reserves balance; or
• Adding the profits for the preacquisition portion of the year to the opening reserves balance.
Consolidated statement of financial position
106 KAPLAN PUBLISHING
Test your understanding 13

Retained earnings at acquisition will be $55,000 – (10/12 x $12,000) = $45,000.
Aston and Martin
Aston acquired 80% of the share capital of Martin for $40,000 on 1 January 20X4 when the balance on the retained earnings of Martin stood at $9,000. The statements of financial position of the two companies are as follows at the 31 December 20X7:
At the date of acquisition, the fair value of Martin’s property, plant and equipment was $5,000 higher than its carrying value. It was estimated to have a remaining useful economic life of ten years at this date. A full year’s depreciation charge is made in the year of acquisition. The fair value of all other net assets were equal to their carrying values.
Aston $000
Martin $000
Noncurrent assets Property, plant and equipment 88 39Investment in Martin 40 ––– ––– 128 39Current assets Inventory 80 26 Receivables 24 32 Bank and cash 15 ––– –––
104 73 ––– ––– 232 112 ––– –––
Equity Share capital 100 24Retained earnings 46 48 Current liabilities Overdraft 14 10 Payables 72 30
––– ––– 86 40 ––– ––– 232 112 ––– –––
chapter 4
KAPLAN PUBLISHING 107
Test your understanding 14 Aston and Martin
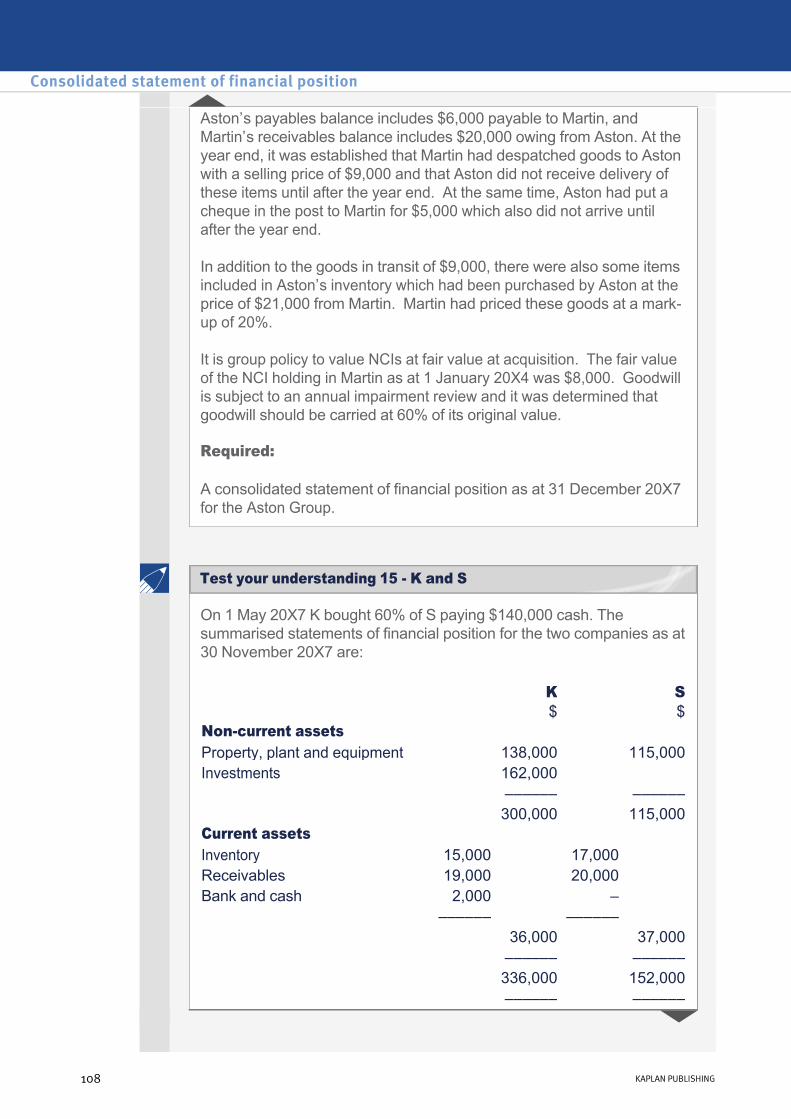
Aston’s payables balance includes $6,000 payable to Martin, and Martin’s receivables balance includes $20,000 owing from Aston. At the year end, it was established that Martin had despatched goods to Aston with a selling price of $9,000 and that Aston did not receive delivery of these items until after the year end. At the same time, Aston had put a cheque in the post to Martin for $5,000 which also did not arrive until after the year end.
In addition to the goods in transit of $9,000, there were also some items included in Aston’s inventory which had been purchased by Aston at the price of $21,000 from Martin. Martin had priced these goods at a markup of 20%.
It is group policy to value NCIs at fair value at acquisition. The fair value of the NCI holding in Martin as at 1 January 20X4 was $8,000. Goodwill is subject to an annual impairment review and it was determined that goodwill should be carried at 60% of its original value.
Required:
A consolidated statement of financial position as at 31 December 20X7 for the Aston Group.
On 1 May 20X7 K bought 60% of S paying $140,000 cash. The summarised statements of financial position for the two companies as at 30 November 20X7 are:
K $
S $
Noncurrent assets Property, plant and equipment 138,000 115,000Investments 162,000
–––––– –––––– 300,000 115,000Current assets Inventory 15,000 17,000 Receivables 19,000 20,000 Bank and cash 2,000 – –––––– –––––– 36,000 37,000 –––––– –––––– 336,000 152,000 –––––– ––––––
Consolidated statement of financial position
108 KAPLAN PUBLISHING
Test your understanding 15 K and S
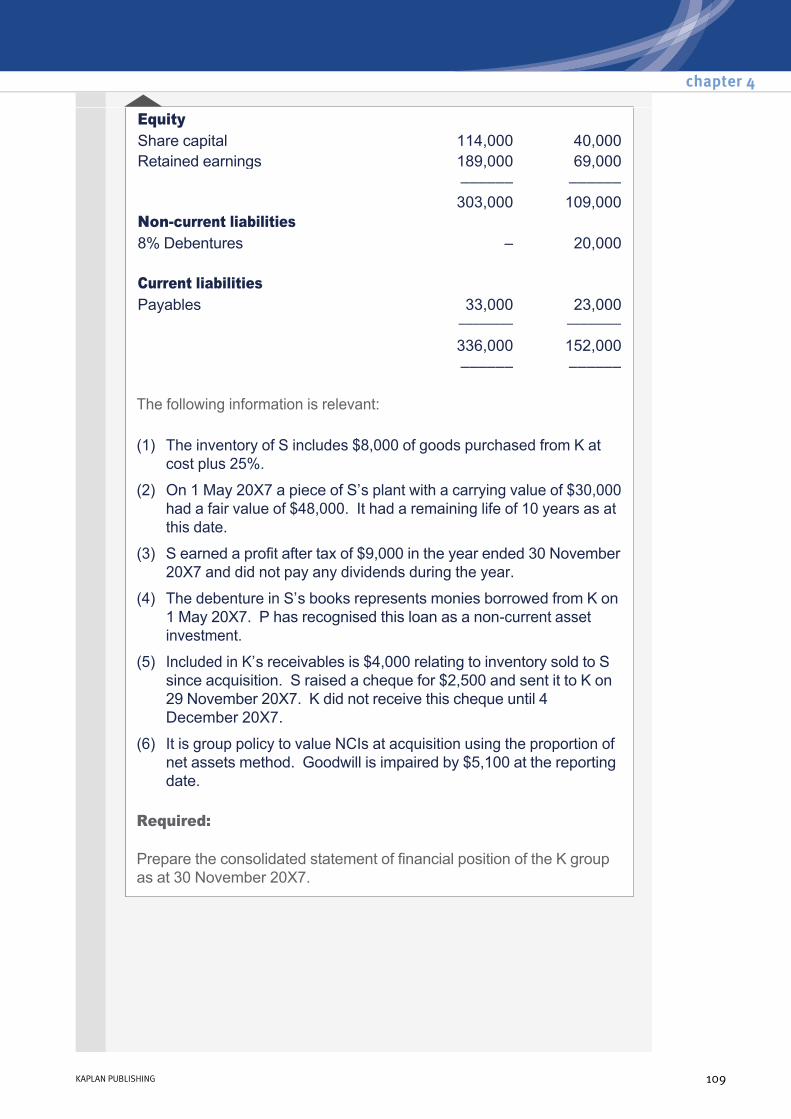
The following information is relevant:
Required:
Prepare the consolidated statement of financial position of the K group as at 30 November 20X7.
Equity Share capital 114,000 40,000Retained earnings 189,000 69,000 –––––– –––––– 303,000 109,000Noncurrent liabilities 8% Debentures – 20,000 Current liabilities Payables 33,000 23,000
–––––––– –––––––– 336,000 152,000 –––––– ––––––
(1) The inventory of S includes $8,000 of goods purchased from K at cost plus 25%.
(2) On 1 May 20X7 a piece of S’s plant with a carrying value of $30,000 had a fair value of $48,000. It had a remaining life of 10 years as at this date.
(3) S earned a profit after tax of $9,000 in the year ended 30 November 20X7 and did not pay any dividends during the year.
(4) The debenture in S’s books represents monies borrowed from K on 1 May 20X7. P has recognised this loan as a noncurrent asset investment.
(5) Included in K’s receivables is $4,000 relating to inventory sold to S since acquisition. S raised a cheque for $2,500 and sent it to K on 29 November 20X7. K did not receive this cheque until 4 December 20X7.
(6) It is group policy to value NCIs at acquisition using the proportion of net assets method. Goodwill is impaired by $5,100 at the reporting date.
chapter 4
KAPLAN PUBLISHING 109
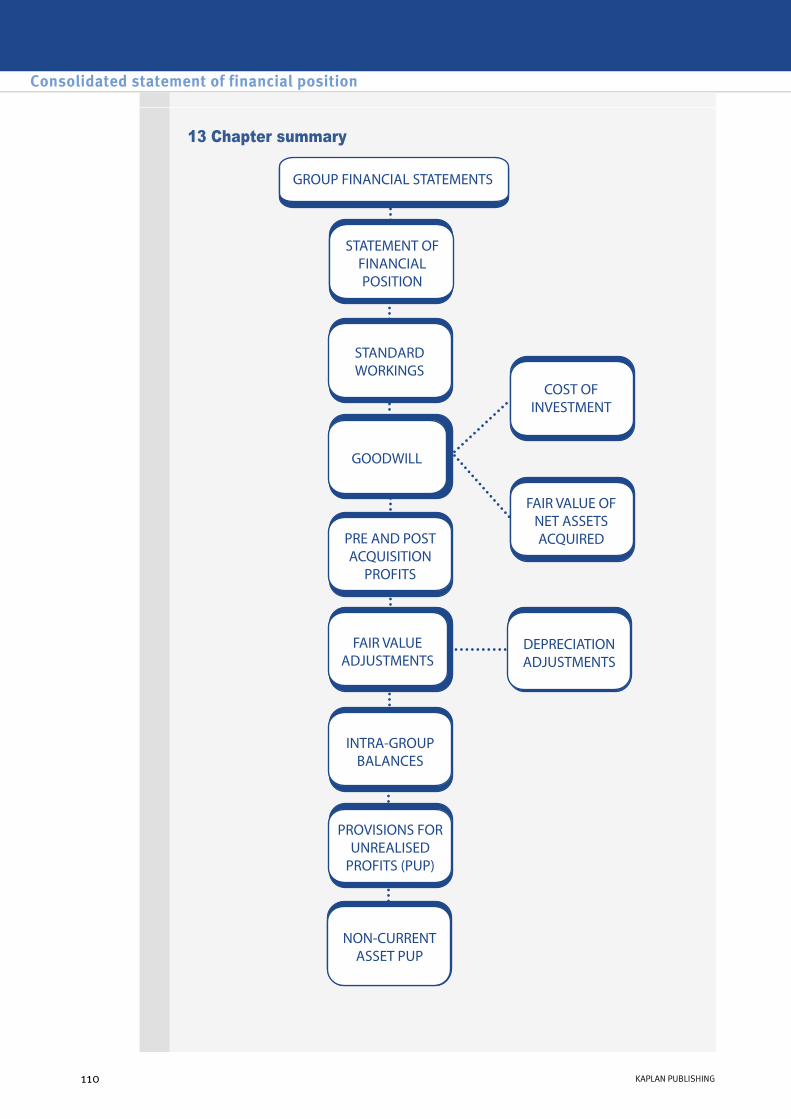
13 Chapter summary
Consolidated statement of financial position
110 KAPLAN PUBLISHING

Test your understanding answers
Goodwill
(W1) Group structure
(W2) Net assets of subsidiary
Fair value method
Proportion of net assets method
$000 $000Fair value of P's holding 1,200 1,200NCI's holding
Fair value (given) 250 Proportion of net assets (20% x 1,000 (W2))
200
Fair value S's net assets (W2) (1,000) (1,000) ––––– ––––– Goodwill at acquisition 450 400 ––––– –––––
P 80% 1 April 20X8 S
Acquisition $000
Share capital 200Retained earnings 800 ––––– 1,000 –––––
chapter 4
KAPLAN PUBLISHING 111
Test your understanding 1 Wellington

Goodwill
(W1) Group structure
(W2) Net assets of subsidiary
Fair value method
Proportion of net assets method
$000 $000Fair value of P's holding 2,500 2,500NCI's holding
Fair value (25% x 500 x $6)
750
Proportion of net assets (25% x 2,000 (W2))
500
Fair value S's net assets (W2) (2,000) (2,000) ––––– ––––– Goodwill at acquisition 1,250 1,000 ––––– –––––
P 75% 1 April 20X8 S
Acquisition $000
Share capital 500Retained earnings 1,500 ––––– 2,000 –––––
Consolidated statement of financial position
112 KAPLAN PUBLISHING
Test your understanding 2 Ruby
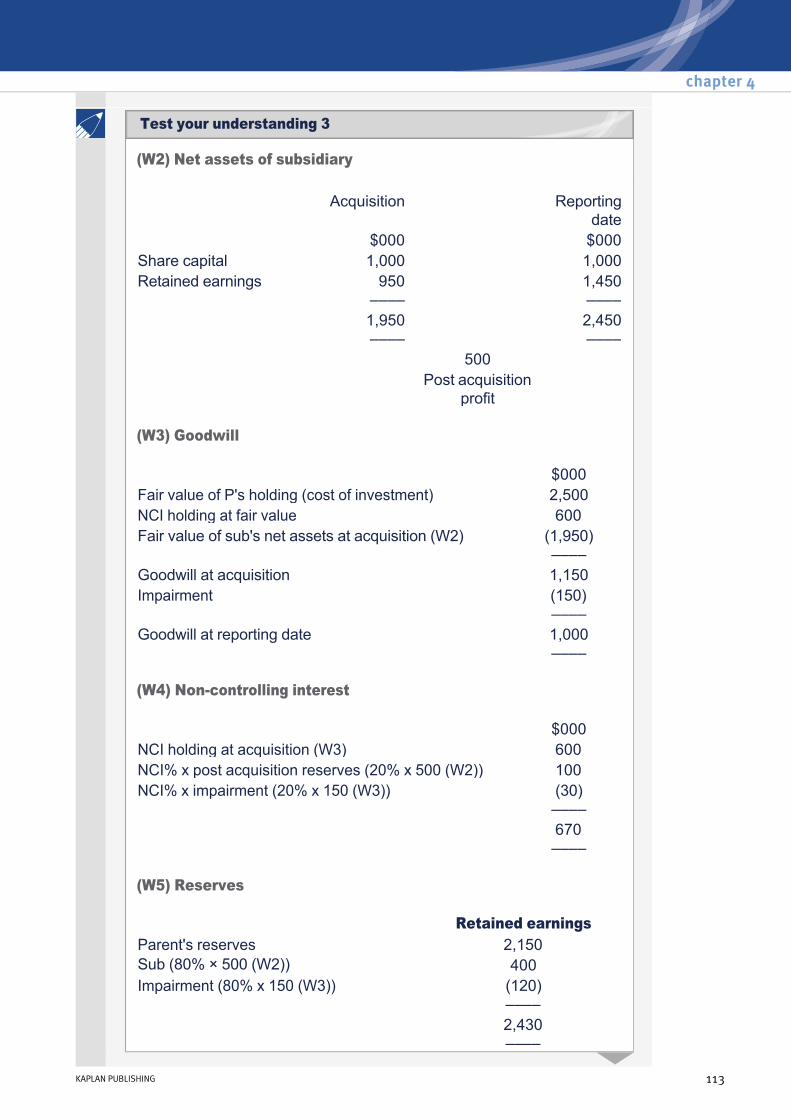
(W2) Net assets of subsidiary
(W3) Goodwill
(W4) Noncontrolling interest
(W5) Reserves
Acquisition Reporting date
$000 $000Share capital 1,000 1,000Retained earnings 950
–––– 1,450
–––– 1,950
–––– 2,450
–––– 500 Post acquisition
profit
$000Fair value of P's holding (cost of investment) 2,500NCI holding at fair value 600Fair value of sub's net assets at acquisition (W2) (1,950)
–––– Goodwill at acquisition 1,150Impairment (150)
–––– Goodwill at reporting date 1,000
––––
$000NCI holding at acquisition (W3) 600NCI% x post acquisition reserves (20% x 500 (W2)) 100NCI% x impairment (20% x 150 (W3)) (30)
–––– 670
––––
Retained earnings Parent's reserves 2,150Sub (80% × 500 (W2)) 400Impairment (80% x 150 (W3)) (120)
–––– 2,430
––––
chapter 4
KAPLAN PUBLISHING 113
Test your understanding 3

(W1) Group structure
Consolidated statement of financial position as at 31 March 20X4
$000
Noncurrent assets (3,500 + 2,400) 5,900Goodwill (W3) 1,000Current assets (1,000 + 600) 1,600 –––– 8,500 –––– Equity Share capital 4,000Retained earnings (W5) 2,430 –––– 6,430Noncontrolling interest (W4) 670 –––– 7,100 Noncurrent liabilities (200 + 150) 350Current liabilities (650 + 400) 1,050 –––– 8,500 ––––
P 80% 1 April 20X2 i.e. 2 years since acquisition S
Consolidated statement of financial position
114 KAPLAN PUBLISHING
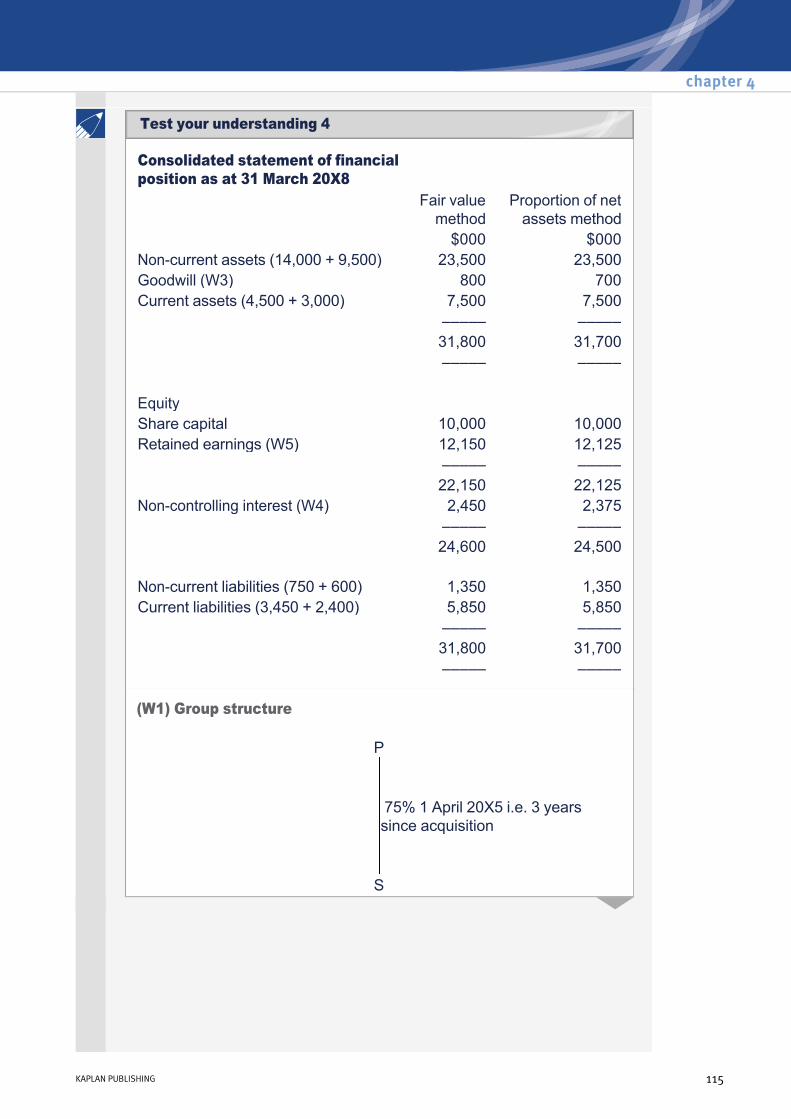
Consolidated statement of financial position as at 31 March 20X8
Fair value method
Proportion of net assets method
$000 $000Noncurrent assets (14,000 + 9,500) 23,500 23,500Goodwill (W3) 800 700Current assets (4,500 + 3,000) 7,500 7,500 ––––– ––––– 31,800 31,700 ––––– ––––– Equity Share capital 10,000 10,000Retained earnings (W5) 12,150 12,125 ––––– ––––– 22,150 22,125Noncontrolling interest (W4) 2,450 2,375 ––––– ––––– 24,600 24,500 Noncurrent liabilities (750 + 600) 1,350 1,350Current liabilities (3,450 + 2,400) 5,850 5,850 ––––– ––––– 31,800 31,700 ––––– –––––
(W1) Group structure
P 75% 1 April 20X5 i.e. 3 years since acquisition S
chapter 4
KAPLAN PUBLISHING 115
Test your understanding 4

(W2) Net assets of subsidiary
(W3) Goodwill
(W4) Noncontrolling interest
Acquisition Reporting date
$000 $000Share capital 5,000 5,000Retained earnings 2,500 4,500 –––– –––– 7,500 9,500 –––– –––– 2,000 Post acquisition
profit
Fair value method
Proportion of net assets method
$000 $000Fair value of P's holding (cost of investment) 6,500 6,500NCI holding at fair value 2,000 at proportion of net assets (25% x 7,500 (W2)) 1,875Fair value of sub's net assets at acquisition (W2) (7,500) (7,500) –––– –––– Goodwill at acquisition 1,000 875Impairment (20% x goodwill at acquisition) (200) (175) –––– –––– Goodwill at reporting date 800 700 –––– ––––
Fair value method
Proportion of net assets method
$000 $000NCI holding at acquisition (W3) 2,000 1,875NCI% x post acquisition reserves (25% x 2,000 (W2))
500 500
NCI% x impairment (25% x 200 (W3)) (50) –––– –––– 2,450 2,375 –––– ––––
Consolidated statement of financial position
116 KAPLAN PUBLISHING

(W5) Reserves
Fair value method
Proportion of net assets method
$000 $000Parent's reserves 10,800 10,800Sub (75% × 2,000 (W2)) 1,500 1,500Impairment loss FV method (75% x 200 (W3)) (150) Proportion of net assets method (W3)
(175)
–––– –––– 12,150 12,125 –––– ––––
Goodwill $Fair value of P's holding (cost of investment)
Cash 5,000Shares (60% x 10,000 x 2/3 x $2.25) 9,000Deferred consideration ($3,000 x 0.826) 2,478Contingent consideration 700
––––– 17,178NCI holding at fair value or proportion of net assets 10,000Fair value of sub's net assets at acquisition (15,000) ––––– Goodwill on acquisition 12,178Impairment ––––– Goodwill at reporting date (in CSFP) 12,178 –––––
chapter 4
KAPLAN PUBLISHING 117
Test your understanding 5
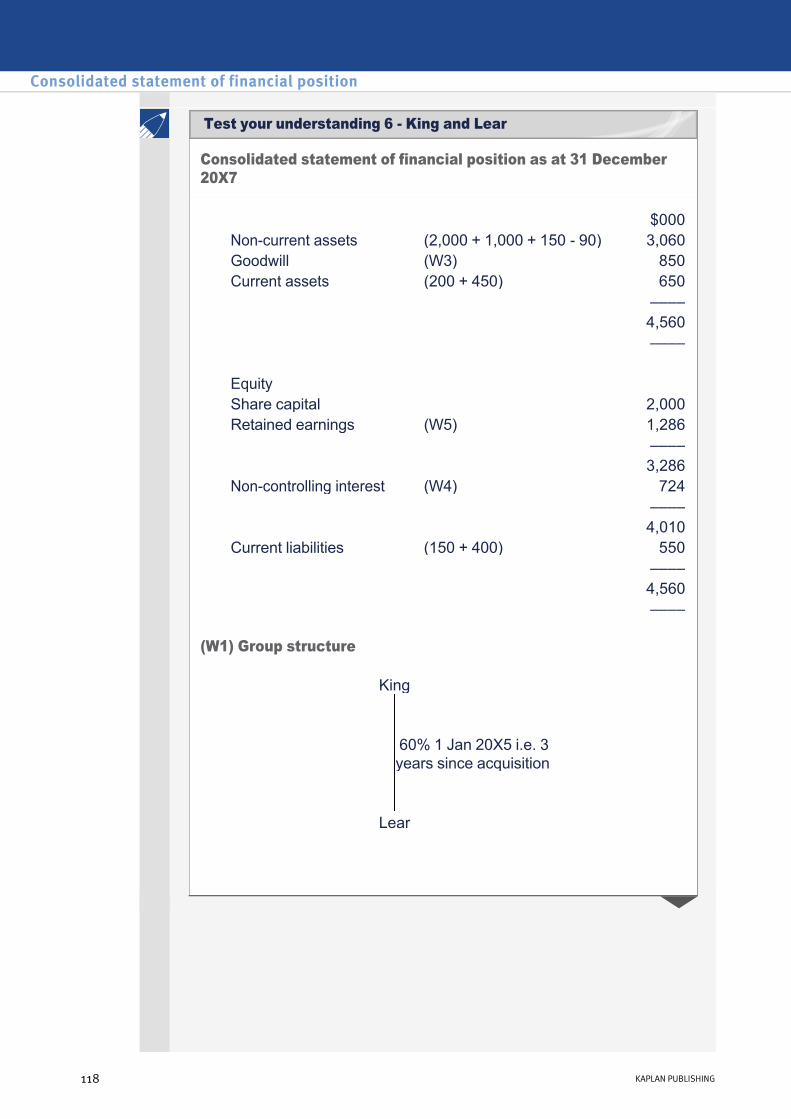
Consolidated statement of financial position as at 31 December 20X7
(W1) Group structure
$000Noncurrent assets (2,000 + 1,000 + 150 90) 3,060Goodwill (W3) 850Current assets (200 + 450) 650
–––– 4,560 ––––
Equity Share capital 2,000Retained earnings (W5) 1,286
–––– 3,286
Noncontrolling interest (W4) 724 –––– 4,010
Current liabilities (150 + 400) 550 –––– 4,560 ––––
King 60% 1 Jan 20X5 i.e. 3 years since acquisition
Lear
Consolidated statement of financial position
118 KAPLAN PUBLISHING
Test your understanding 6 King and Lear

(W2) Net assets of subsidiary
(W3) Goodwill
(W4) Noncontrolling interest
Acquisition Reporting date
$000 $000Share capital 750 750Retained earnings 100 300Fair value adjustment (1,000 850)
150 150
Depreciation adj (150 x 3/5) (90) –––– –––– 1,000 1,110 –––– –––– 110 Post acquisition
profit
$000Fair value of P's holding (cost of investment) 1,200NCI holding at fair value 700Fair value of sub's net assets at acquisition (W2) (1,000) –––– Goodwill at acquisition 900Impairment (50) –––– Goodwill at reporting date 850 ––––
$000NCI holding at acquisition (W3) 700NCI% x post acquisition reserves (40% x 110 (W2)) 44NCI% x impairment (40% x 50 (W3)) (20) –––– 724 ––––
chapter 4
KAPLAN PUBLISHING 119

(W5) Reserves
Retained earnings Parent's reserves 1,250Sub (60% × 110 (W2)) 66Impairment (60% x 50 (W3)) (30) –––– 1,286 ––––
Consolidated statement of financial position
120 KAPLAN PUBLISHING
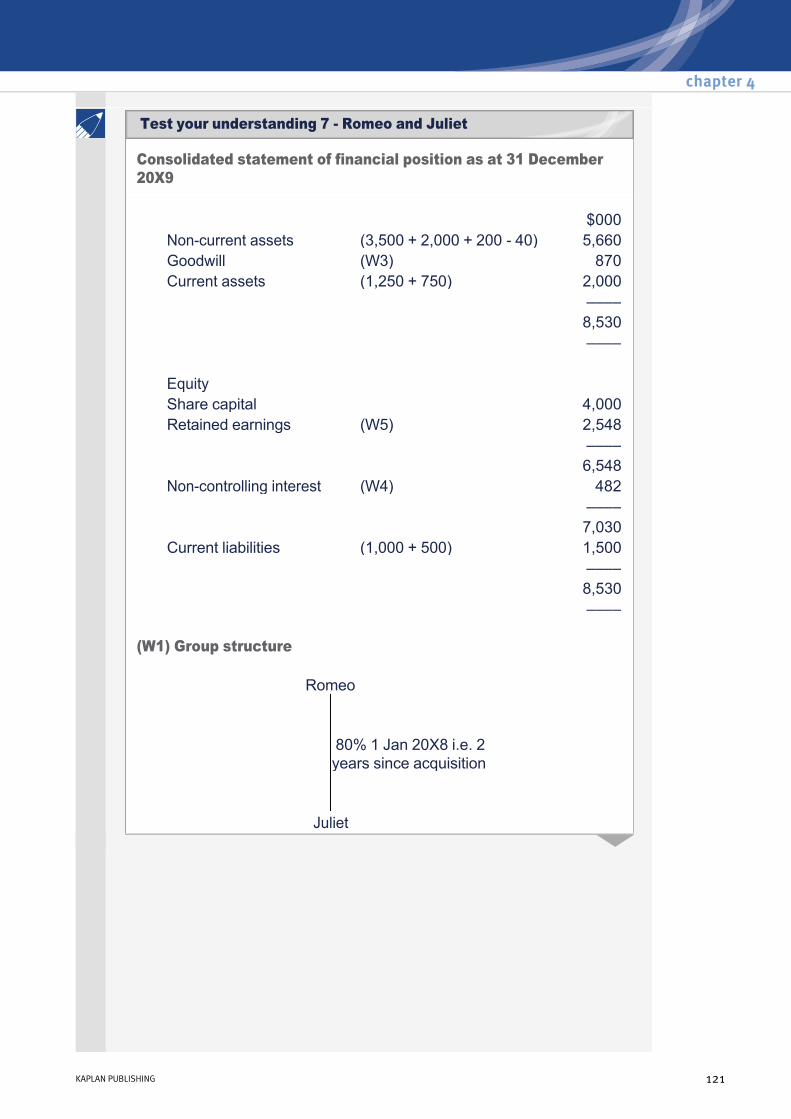
Consolidated statement of financial position as at 31 December 20X9
(W1) Group structure
$000Noncurrent assets (3,500 + 2,000 + 200 40) 5,660Goodwill (W3) 870Current assets (1,250 + 750) 2,000
–––– 8,530 ––––
Equity Share capital 4,000Retained earnings (W5) 2,548
–––– 6,548
Noncontrolling interest (W4) 482 –––– 7,030
Current liabilities (1,000 + 500) 1,500 –––– 8,530 ––––
Romeo 80% 1 Jan 20X8 i.e. 2 years since acquisition
Juliet
chapter 4
KAPLAN PUBLISHING 121
Test your understanding 7 Romeo and Juliet

(W2) Net assets of subsidiary
(W3) Goodwill
(W4) Noncontrolling interest
Acquisition Reporting date
$000 $000Share capital 1,000 1,000Retained earnings 800 1,250Fair value adjustment 200 200Depreciation adj (200 x 2/10)
(40)
–––– –––– 2,000 2,410 –––– –––– 410 Post acquisition
profit
$000Fair value of P's holding (cost of investment) 2,500NCI holding at proportion of net assets (20% x 2,000 (W2))
400
Fair value of sub's net assets at acquisition (W2) (2,000) –––– Goodwill at acquisition 900Impairment (30) –––– Goodwill at reporting date 870 ––––
$000NCI holding at acquisition (W3) 400NCI% x post acquisition reserves (20% x 410 (W2)) 82 –––– 482 ––––
Consolidated statement of financial position
122 KAPLAN PUBLISHING

(W5) Reserves
Retained earnings Parent's reserves 2,250Sub (80% × 410 (W2)) 328Impairment (W3) (30) –––– 2,548 ––––
chapter 4
KAPLAN PUBLISHING 123
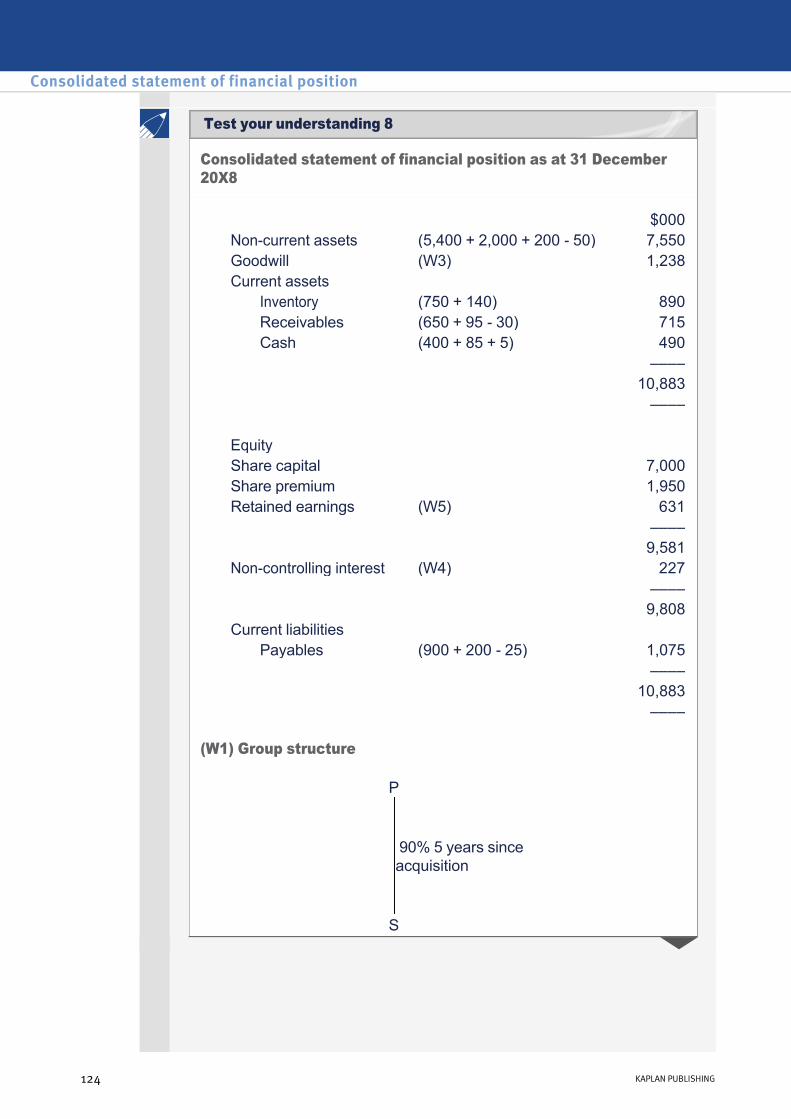
Consolidated statement of financial position as at 31 December 20X8
(W1) Group structure
$000Noncurrent assets (5,400 + 2,000 + 200 50) 7,550Goodwill (W3) 1,238Current assets
Inventory (750 + 140) 890Receivables (650 + 95 30) 715Cash (400 + 85 + 5) 490
–––– 10,883 ––––
Equity Share capital 7,000Share premium 1,950Retained earnings (W5) 631
–––– 9,581
Noncontrolling interest (W4) 227 –––– 9,808
Current liabilities Payables (900 + 200 25) 1,075
–––– 10,883 ––––
P 90% 5 years since acquisition S
Consolidated statement of financial position
124 KAPLAN PUBLISHING
Test your understanding 8
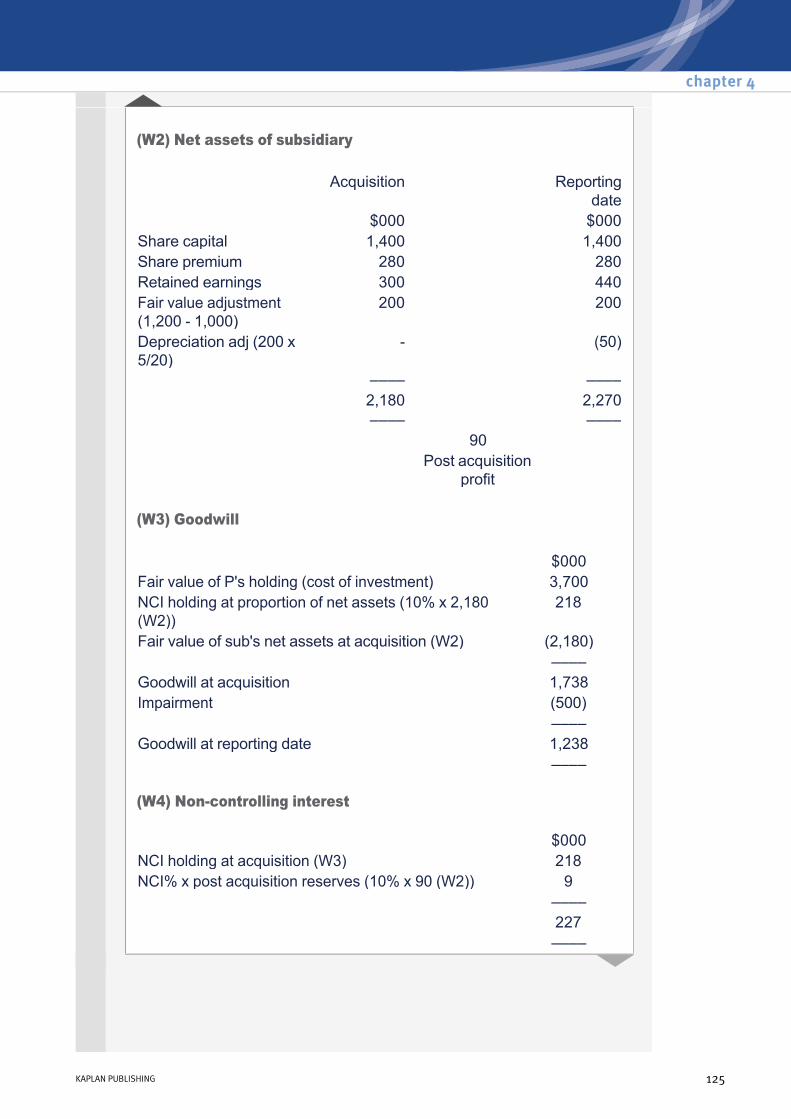
(W2) Net assets of subsidiary
(W3) Goodwill
(W4) Noncontrolling interest
Acquisition Reporting date
$000 $000Share capital 1,400 1,400Share premium 280 280Retained earnings 300 440Fair value adjustment (1,200 1,000)
200 200
Depreciation adj (200 x 5/20)
(50)
–––– –––– 2,180 2,270 –––– –––– 90 Post acquisition
profit
$000Fair value of P's holding (cost of investment) 3,700NCI holding at proportion of net assets (10% x 2,180 (W2))
218
Fair value of sub's net assets at acquisition (W2) (2,180) –––– Goodwill at acquisition 1,738Impairment (500) –––– Goodwill at reporting date 1,238 ––––
$000NCI holding at acquisition (W3) 218NCI% x post acquisition reserves (10% x 90 (W2)) 9 –––– 227 ––––
chapter 4
KAPLAN PUBLISHING 125
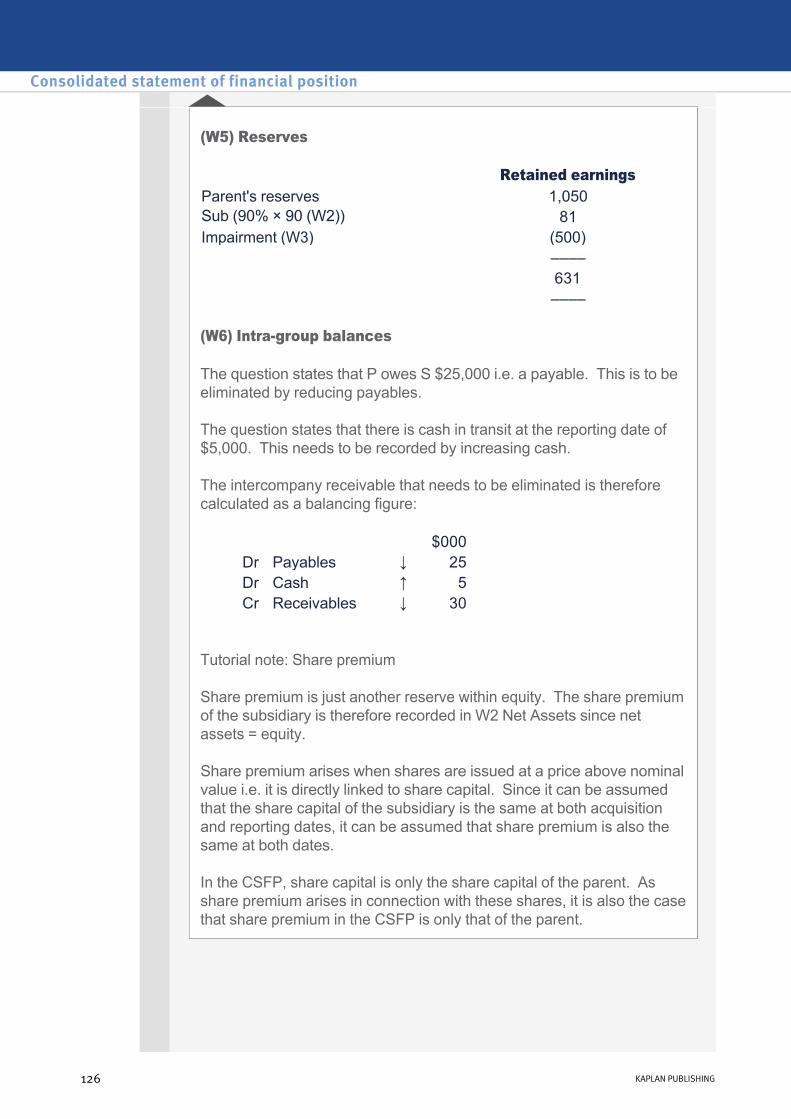
(W5) Reserves
(W6) Intragroup balances
The question states that P owes S $25,000 i.e. a payable. This is to be eliminated by reducing payables.
The question states that there is cash in transit at the reporting date of $5,000. This needs to be recorded by increasing cash.
The intercompany receivable that needs to be eliminated is therefore calculated as a balancing figure:
Tutorial note: Share premium
Share premium is just another reserve within equity. The share premium of the subsidiary is therefore recorded in W2 Net Assets since net assets = equity.
Share premium arises when shares are issued at a price above nominal value i.e. it is directly linked to share capital. Since it can be assumed that the share capital of the subsidiary is the same at both acquisition and reporting dates, it can be assumed that share premium is also the same at both dates.
In the CSFP, share capital is only the share capital of the parent. As share premium arises in connection with these shares, it is also the case that share premium in the CSFP is only that of the parent.
Retained earnings Parent's reserves 1,050Sub (90% × 90 (W2)) 81Impairment (W3) (500) –––– 631 ––––
$000Dr Payables ↓ 25Dr Cash ↑ 5Cr Receivables ↓ 30
Consolidated statement of financial position
126 KAPLAN PUBLISHING

The PUP will be:
Profit on the sale = 20% x $520 = $104
Profit in inventory = 60% x $104 = $62.4
The parent is the seller and so reduce W5 & Inventory by $62.4
The PUP will be:
The subsidiary is the seller and so reduce W2 NAs at reporting date & Inventory by $90.
(360 ×
33⅓ ––––– ) 133⅓
= 90
chapter 4
KAPLAN PUBLISHING 127
Test your understanding 10
Test your understanding 9

Consolidated statement of financial position as at 30 June 20X8
(W1) Group structure
$000Noncurrent assets (8,500 + 5,000) 13,500Goodwill (W3) 2,450Current assets
Inventory (1,600 + 850 20) 2,430Receivables (1,350 + 950 60) 2,240Cash (850 + 400 + 10) 1,260
––––– 21,880 –––––
Equity Share capital 10,000Share premium 2,000Retained earnings (W5) 5,485
––––– 17,485
Noncontrolling interest (W4) 1,395 ––––– 18,880
Current liabilities Payables (1,750 + 1,300 50) 3,000
––––– 21,880 –––––
P 75% 2 years since acquisition S
Consolidated statement of financial position
128 KAPLAN PUBLISHING
Test your understanding 11
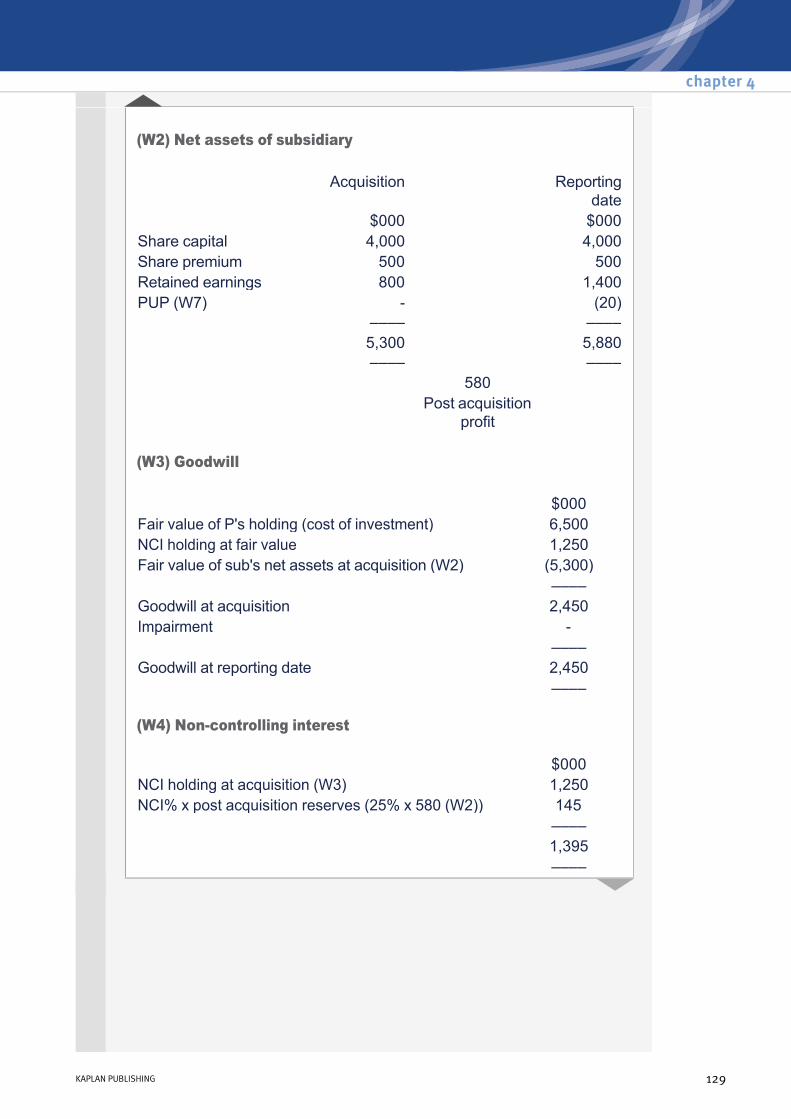
(W2) Net assets of subsidiary
(W3) Goodwill
(W4) Noncontrolling interest
Acquisition Reporting date
$000 $000Share capital 4,000 4,000Share premium 500 500Retained earnings 800 1,400PUP (W7) (20) –––– –––– 5,300 5,880 –––– –––– 580 Post acquisition
profit
$000Fair value of P's holding (cost of investment) 6,500NCI holding at fair value 1,250Fair value of sub's net assets at acquisition (W2) (5,300) –––– Goodwill at acquisition 2,450Impairment –––– Goodwill at reporting date 2,450 ––––
$000NCI holding at acquisition (W3) 1,250NCI% x post acquisition reserves (25% x 580 (W2)) 145 –––– 1,395 ––––
chapter 4
KAPLAN PUBLISHING 129
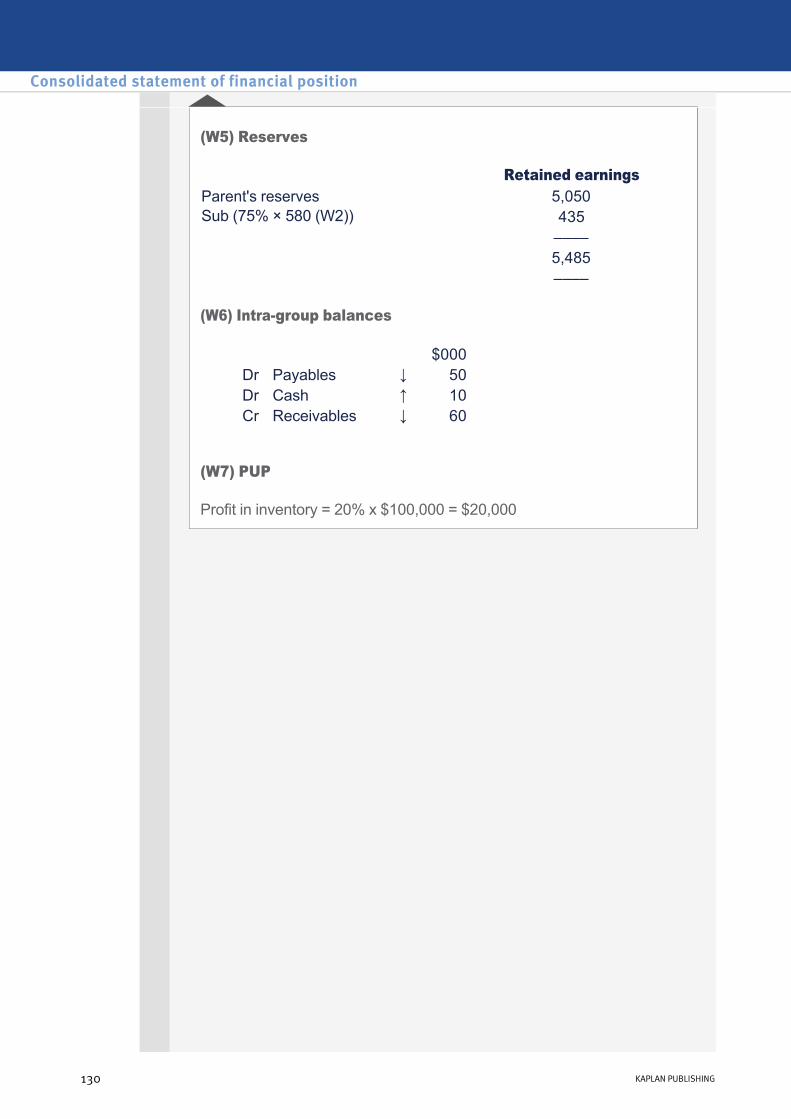
(W5) Reserves
(W6) Intragroup balances
(W7) PUP
Profit in inventory = 20% x $100,000 = $20,000
Retained earnings Parent's reserves 5,050Sub (75% × 580 (W2)) 435 –––– 5,485 ––––
$000Dr Payables ↓ 50Dr Cash ↑ 10Cr Receivables ↓ 60
Consolidated statement of financial position
130 KAPLAN PUBLISHING

Consolidated statement of financial position as at 30 June 20X8
(W1) Group structure
$000Noncurrent assets (16,700 + 10,200 + 500 150) 27,250Goodwill (W3) 2,200Current assets
Inventory (5,750 + 3,400 100) 9,050Receivables (4,250 + 2,950 750) 6,450Cash (2,500 + 1,450 + 200) 4,150
––––– 49,100 –––––
Equity Share capital 20,000Retained earnings (W5) 13,260
––––– 33,260
Noncontrolling interest (W4) 2,690 ––––– 35,950
Current liabilities Payables (8,600 + 5,100 550) 13,150
––––– 49,100 –––––
P 80% 3 years since acquisition S
chapter 4
KAPLAN PUBLISHING 131
Test your understanding 12
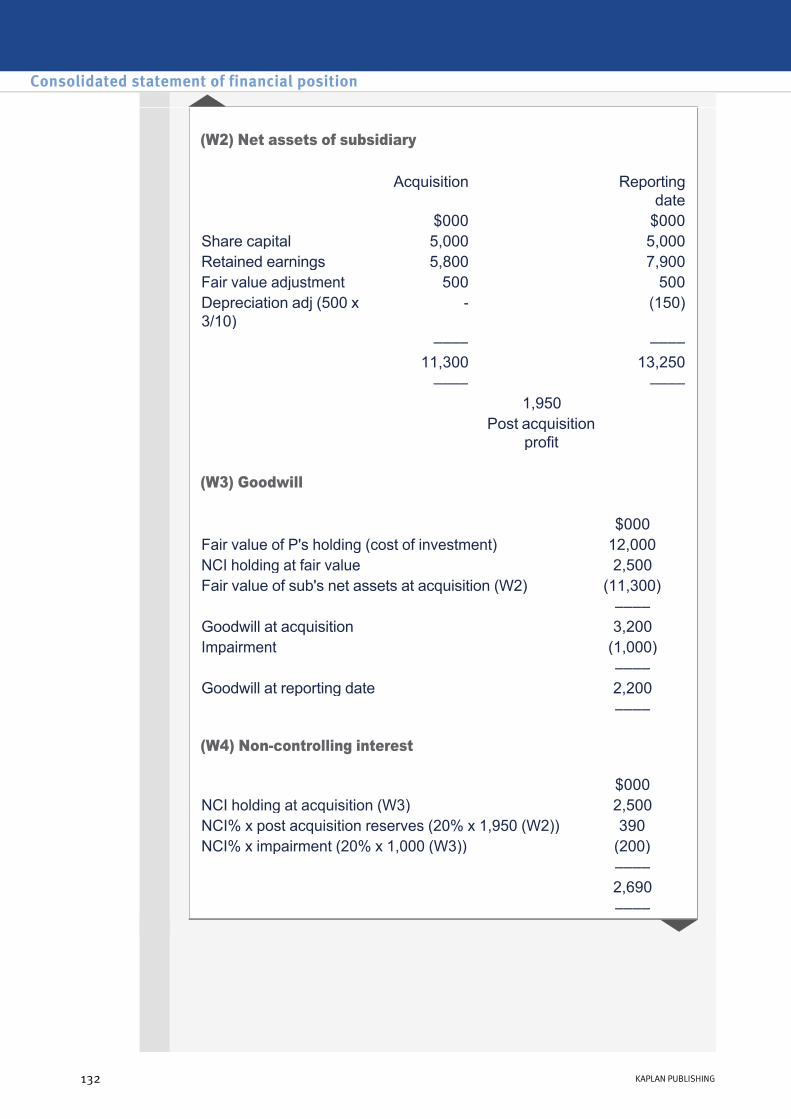
(W2) Net assets of subsidiary
(W3) Goodwill
(W4) Noncontrolling interest
Acquisition Reporting date
$000 $000Share capital 5,000 5,000Retained earnings 5,800 7,900Fair value adjustment 500 500Depreciation adj (500 x 3/10)
(150)
–––– –––– 11,300 13,250 –––– –––– 1,950 Post acquisition
profit
$000Fair value of P's holding (cost of investment) 12,000NCI holding at fair value 2,500Fair value of sub's net assets at acquisition (W2) (11,300) –––– Goodwill at acquisition 3,200Impairment (1,000) –––– Goodwill at reporting date 2,200 ––––
$000NCI holding at acquisition (W3) 2,500NCI% x post acquisition reserves (20% x 1,950 (W2)) 390NCI% x impairment (20% x 1,000 (W3)) (200) –––– 2,690 ––––
Consolidated statement of financial position
132 KAPLAN PUBLISHING

(W5) Reserves
(W6) Intragroup balances
(W7) PUP
Profit on sale = 25/125 x $1,500,000 = $300,000
Profit in inventory = 1/3 x $300,000 = $100,000
Retained earnings Parent's reserves 12,600Sub (80% × 1,950 (W2)) 1,560Impairment (80% x 1,000 (W3)) (800)PUP (W7) (100) –––– 13,260 ––––
$000Dr Payables ↓ 550Dr Cash ↑ 200Cr Receivables ↓ 750
Salvador, the subsidiary, has sold the lorry to Rio, the parent, so the profit on disposal must be removed from W2 and the additional depreciation removed from W5.
Profit on disposal = $25,000 $20,000 = $5,000
Extra depreciation = ($25,000 $20,000) x 0.5/3 = $833
The adjustment will be:
Dr Sub's net assets at reporting date (W2)
↓ $5,000
Cr Retained earnings (W5) ↑ $833Cr NCA (CSFP) ↓ $4,167
chapter 4
KAPLAN PUBLISHING 133
Test your understanding 13
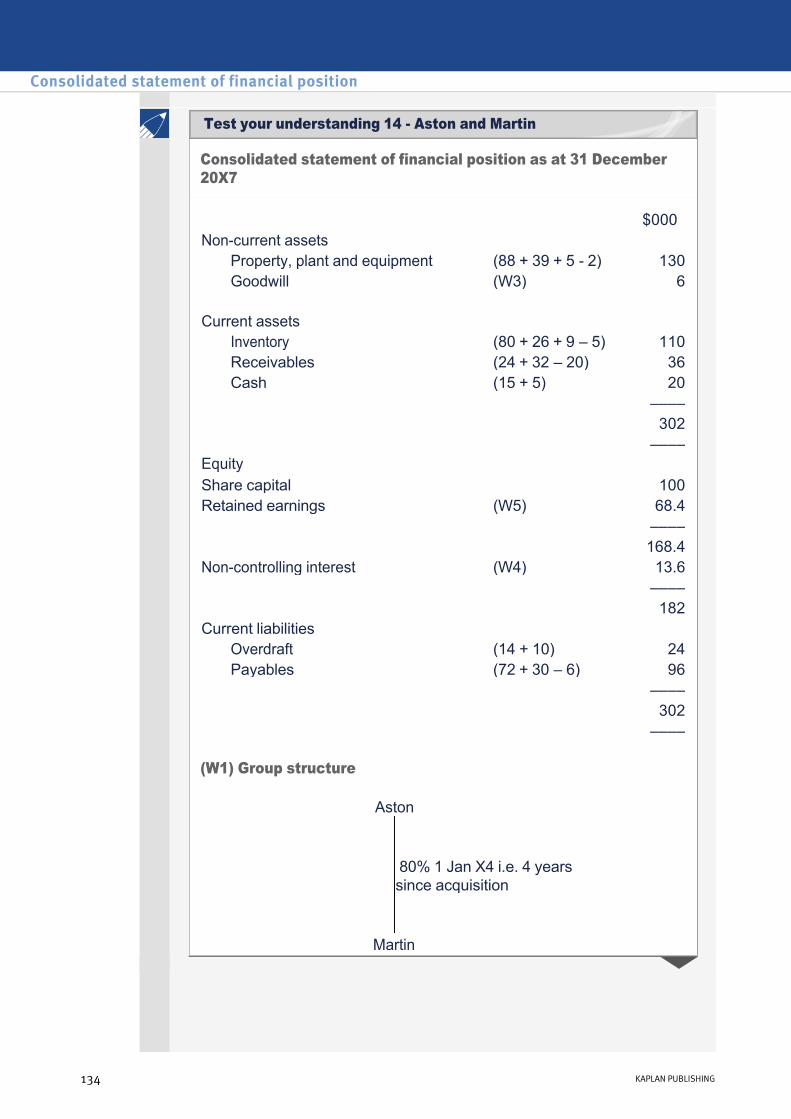
Consolidated statement of financial position as at 31 December 20X7
(W1) Group structure
$000Noncurrent assets
Property, plant and equipment (88 + 39 + 5 2) 130Goodwill (W3) 6
Current assets
Inventory (80 + 26 + 9 – 5) 110Receivables (24 + 32 – 20) 36Cash (15 + 5) 20
–––– 302 –––– Equity Share capital 100Retained earnings (W5) 68.4 –––– 168.4Noncontrolling interest (W4) 13.6 –––– 182Current liabilities
Overdraft (14 + 10) 24Payables (72 + 30 – 6) 96
–––– 302 ––––
Aston 80% 1 Jan X4 i.e. 4 years since acquisition
Martin
Consolidated statement of financial position
134 KAPLAN PUBLISHING
Test your understanding 14 Aston and Martin

(W2) Net assets of subsidiary
(W3) Goodwill
(W4) Noncontrolling interest
Acquisition Reporting date
$000 $000Share capital 24 24Retained earnings 9 48Fair value adjustment 5 5Depreciation adj (5 x 4/10) (2)PUP (W7) (5) ––– ––– 38 70 ––– ––– 32 Post acquisition
profit
$000Fair value of P's holding (cost of investment) 40NCI holding at fair value 8Fair value of sub's net assets at acquisition (W2) (38) –––– Goodwill at acquisition 10Impairment (4) –––– Goodwill at reporting date 6 ––––
$000NCI holding at acquisition (W3) 8NCI% x post acquisition reserves (20% x 32 (W2)) 6.4NCI% x impairment (20% x 4 (W3)) (0.8) –––– 13.6 ––––
chapter 4
KAPLAN PUBLISHING 135
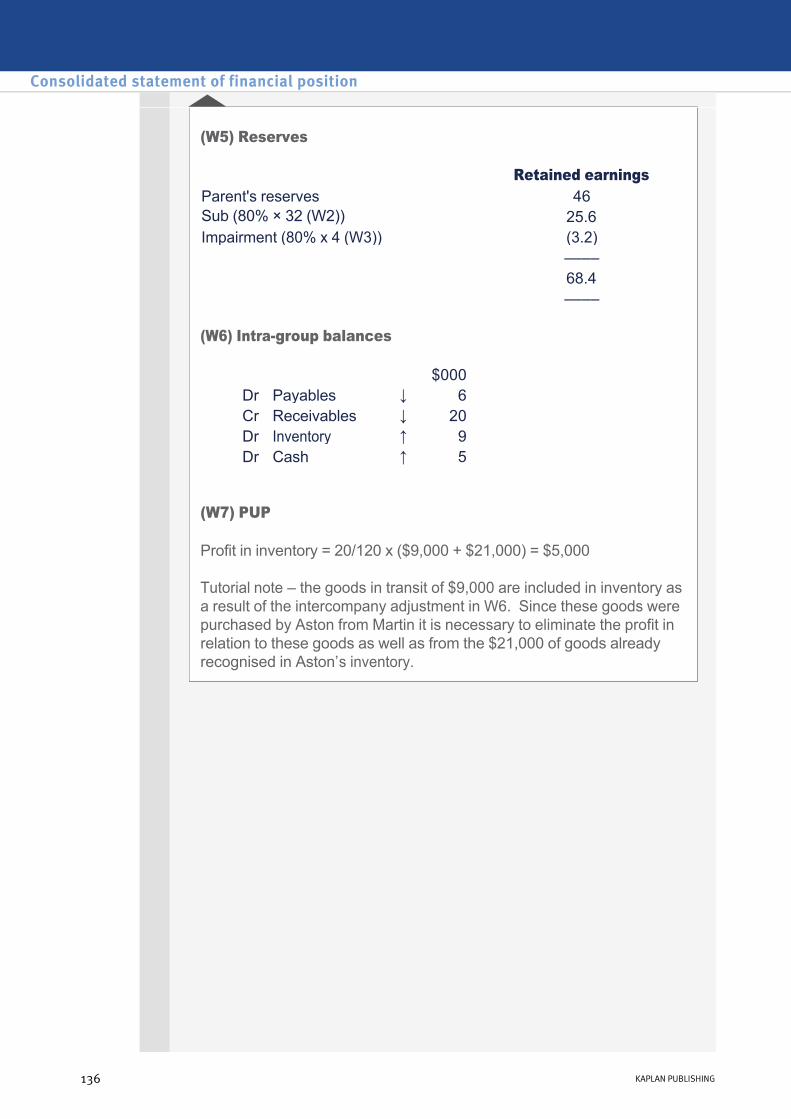
(W5) Reserves
(W6) Intragroup balances
(W7) PUP
Profit in inventory = 20/120 x ($9,000 + $21,000) = $5,000
Tutorial note – the goods in transit of $9,000 are included in inventory as a result of the intercompany adjustment in W6. Since these goods were purchased by Aston from Martin it is necessary to eliminate the profit in relation to these goods as well as from the $21,000 of goods already recognised in Aston’s inventory.
Retained earnings Parent's reserves 46Sub (80% × 32 (W2)) 25.6Impairment (80% x 4 (W3)) (3.2) –––– 68.4 ––––
$000Dr Payables ↓ 6Cr Receivables ↓ 20Dr Inventory ↑ 9Dr Cash ↑ 5
Consolidated statement of financial position
136 KAPLAN PUBLISHING
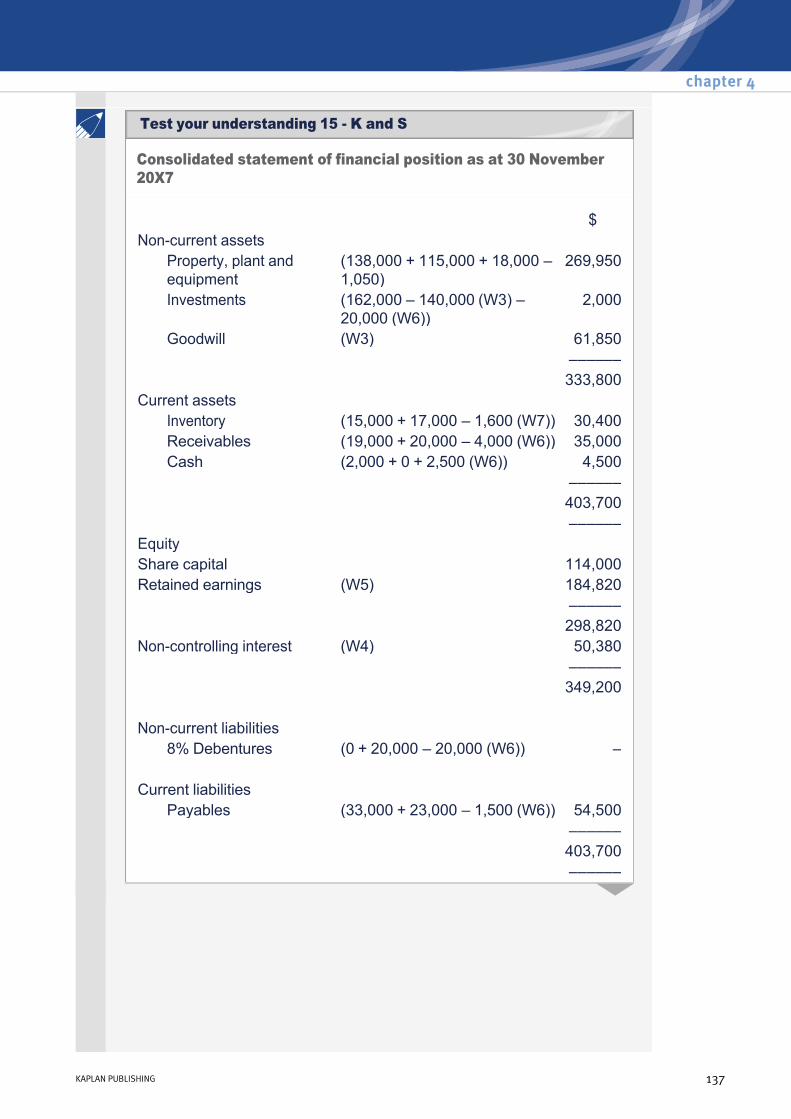
Consolidated statement of financial position as at 30 November 20X7
$Noncurrent assets
Property, plant and equipment
(138,000 + 115,000 + 18,000 – 1,050)
269,950
Investments (162,000 – 140,000 (W3) – 20,000 (W6))
2,000
Goodwill (W3) 61,850 –––––– 333,800Current assets
Inventory (15,000 + 17,000 – 1,600 (W7)) 30,400Receivables (19,000 + 20,000 – 4,000 (W6)) 35,000Cash (2,000 + 0 + 2,500 (W6)) 4,500
–––––– 403,700 –––––– Equity Share capital 114,000Retained earnings (W5) 184,820 –––––– 298,820Noncontrolling interest (W4) 50,380 –––––– 349,200 Noncurrent liabilities
8% Debentures (0 + 20,000 – 20,000 (W6)) – Current liabilities
Payables (33,000 + 23,000 – 1,500 (W6)) 54,500 –––––– 403,700 ––––––
chapter 4
KAPLAN PUBLISHING 137
Test your understanding 15 K and S

(W1) Group structure
(W2) Net assets of subsidiary
K 60% 1 May 20X7 i.e. 7 months since acquisition S
Acquisition Reporting date
$ $Share capital 40,000 40,000Retained earnings (69,000 (7/12 x 9,000))
63,750 69,000
Fair value adjustment (48,000 30,000)
18,000 18,000
Depreciation adj (18,000 x 1/10 x 7/12)
(1,050)
–––– –––– 121,750 125,950 –––– –––– 4,200 Post acquisition
profit
Consolidated statement of financial position
138 KAPLAN PUBLISHING
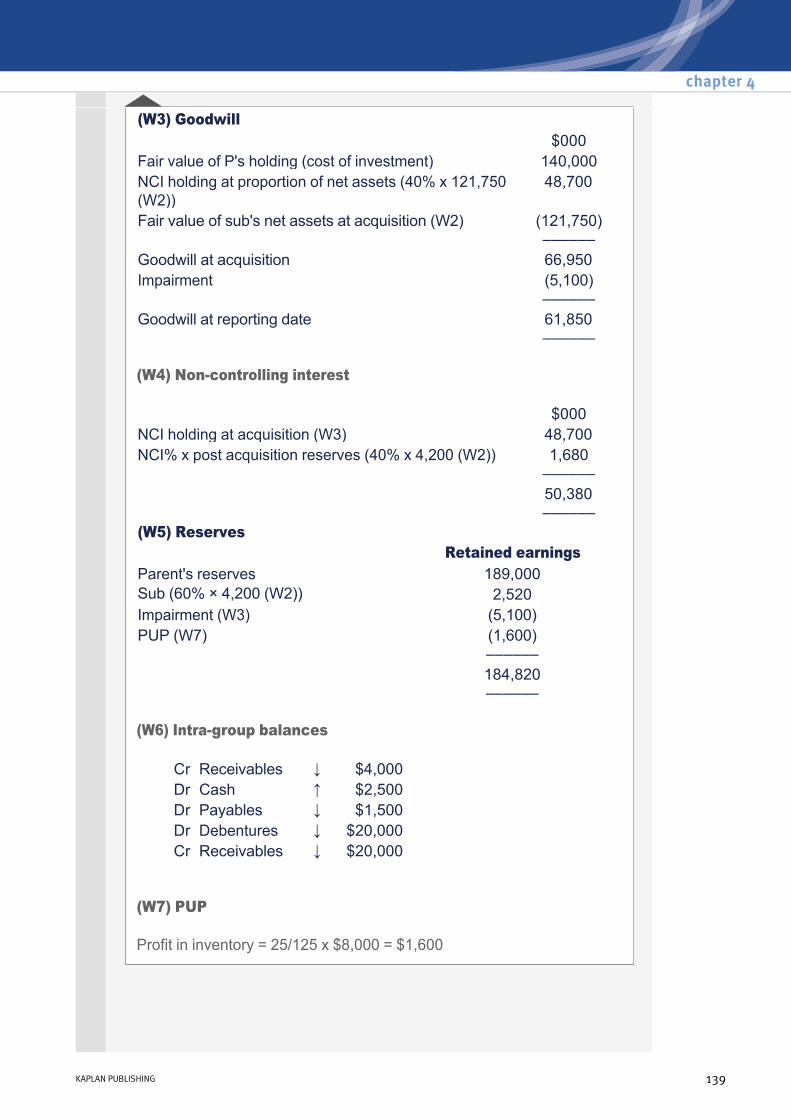
(W4) Noncontrolling interest
(W6) Intragroup balances
(W7) PUP
Profit in inventory = 25/125 x $8,000 = $1,600
(W3) Goodwill $000Fair value of P's holding (cost of investment) 140,000NCI holding at proportion of net assets (40% x 121,750 (W2))
48,700
Fair value of sub's net assets at acquisition (W2) (121,750) ––––––
Goodwill at acquisition 66,950Impairment (5,100)
–––––– Goodwill at reporting date 61,850
––––––
$000NCI holding at acquisition (W3) 48,700NCI% x post acquisition reserves (40% x 4,200 (W2)) 1,680
–––––– 50,380
–––––– (W5) Reserves Retained earnings Parent's reserves 189,000Sub (60% × 4,200 (W2)) 2,520Impairment (W3) (5,100)PUP (W7) (1,600)
–––––– 184,820
––––––
Cr Receivables ↓ $4,000Dr Cash ↑ $2,500Dr Payables ↓ $1,500Dr Debentures ↓ $20,000Cr Receivables ↓ $20,000
chapter 4
KAPLAN PUBLISHING 139

Consolidated statement of financial position
140 KAPLAN PUBLISHING
Consolidated statement of comprehensive income and statement of changes in equityChapter learning objectives
On completion of their studies students should be able to:
• Prepare consolidated financial statements (including the statement of changes in equity) for a group of companies;
• Explain the treatment in consolidated financial statements of pre and postacquisition reserves, goodwill (including its impairment), fair value adjustments, intragroup transactions and dividends and midyear acquisitions.
141
chapter
5
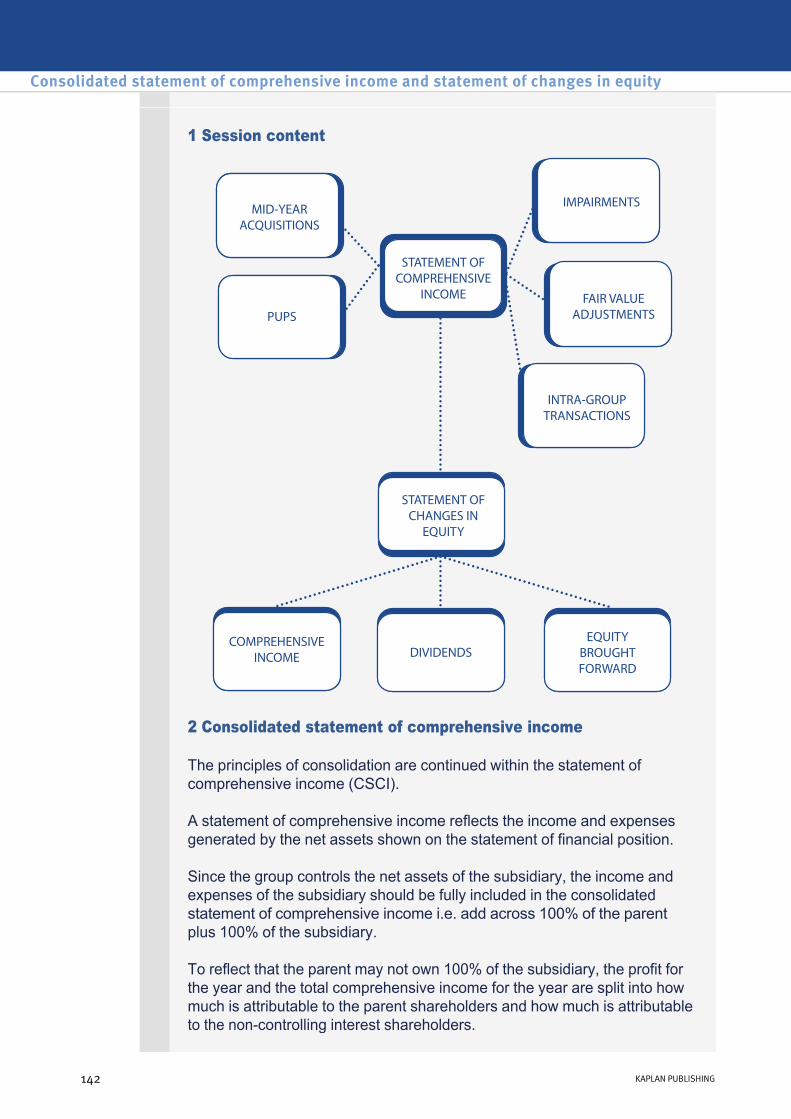
1 Session content
2 Consolidated statement of comprehensive income
The principles of consolidation are continued within the statement of comprehensive income (CSCI).
A statement of comprehensive income reflects the income and expenses generated by the net assets shown on the statement of financial position.
Since the group controls the net assets of the subsidiary, the income and expenses of the subsidiary should be fully included in the consolidated statement of comprehensive income i.e. add across 100% of the parent plus 100% of the subsidiary.
To reflect that the parent may not own 100% of the subsidiary, the profit for the year and the total comprehensive income for the year are split into how much is attributable to the parent shareholders and how much is attributable to the noncontrolling interest shareholders.
Consolidated statement of comprehensive income and statement of changes in equity
142 KAPLAN PUBLISHING142 KAPLAN PUBLISHING

3 CSCI adjustments
Adjustments will be necessary to the parent and subsidiary’s individual SCIs when preparing the group SCI to reflect that the group is a single entity.
Consolidation adjustments should be dealt with as follows:
Impairments
Impairments of goodwill relating to the current accounting period will be charged as an expense (normally administration expenses) in the consolidated statement of comprehensive income.
Fair value adjustments
Fair value adjustments may be required as seen in Chapter 4 Consolidated Statement of Financial Position in order to reflect the fair value of the subsidiaries net assets at acquisition. This may then result in a change to the profits of the subsidiary for consolidation purposes. For example, an adjustment is required to increase the depreciation expense in the CSCI if a fair value uplift is made to a depreciable noncurrent asset in the CSFP.
Intragroup transactions
The group as a single entity cannot report transactions with itself and so intragroup transactions reported within the individual SCIs will need eliminating e.g. sales between parent and subsidiaries, dividends from subsidiary to parent and interest income/expenses between parent and subsidiary.
Provision for unrealised profit on inventory
An adjustment is required to increase the cost of the sales (and so reduce profit) of the selling company to remove the unrealised profit included within inventories at the reporting date.
Midyear acquisitions
The income and expenses of the subsidiary should be time apportioned to reflect the period of control i.e. if a subsidiary is acquired on 1 September and the accounting period is the year to 31 December, 4/12 of the subsidiary’s income and expenses should be consolidated.
chapter 5
KAPLAN PUBLISHING 143

Noncontrolling interests
The share of profit and total comprehensive income that belongs to the NCIs is to be calculated as follows:
$ $Sub's profit for the year per S's SCI (time apportioned if mid year acquisition)
X
Depreciation adjustment (X) PUP (if S is seller) (X) Impairment expense (fair value method only)
(X)
––– X NCI share of profits x NCI% XSub's other comprehensive income per S's SCI (time apportioned if mid year acquisition)
X
––– X NCI share of total comprehensive income
x NCI% X
Consolidated statement of comprehensive income and statement of changes in equity
144 KAPLAN PUBLISHING
Example 1
Example 1 answer
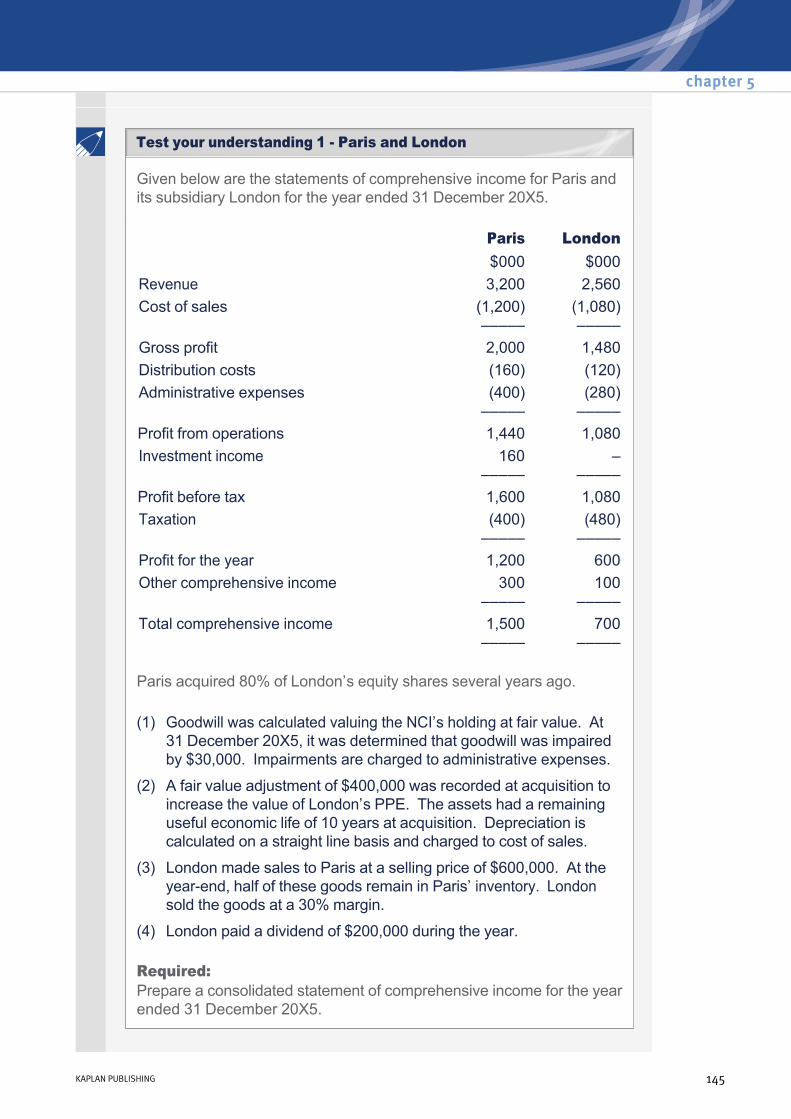
Given below are the statements of comprehensive income for Paris and its subsidiary London for the year ended 31 December 20X5.
Paris acquired 80% of London’s equity shares several years ago.
Required: Prepare a consolidated statement of comprehensive income for the year ended 31 December 20X5.
Paris London $000 $000
Revenue 3,200 2,560Cost of sales (1,200)
––––– (1,080) –––––
Gross profit 2,000 1,480Distribution costs (160) (120)Administrative expenses (400)
––––– (280) –––––
Profit from operations 1,440 1,080Investment income 160
––––– –
––––– Profit before tax 1,600 1,080Taxation (400)
––––– (480) –––––
Profit for the year 1,200 600Other comprehensive income 300
––––– 100
––––– Total comprehensive income 1,500
––––– 700
–––––
(1) Goodwill was calculated valuing the NCI’s holding at fair value. At 31 December 20X5, it was determined that goodwill was impaired by $30,000. Impairments are charged to administrative expenses.
(2) A fair value adjustment of $400,000 was recorded at acquisition to increase the value of London’s PPE. The assets had a remaining useful economic life of 10 years at acquisition. Depreciation is calculated on a straight line basis and charged to cost of sales.
(3) London made sales to Paris at a selling price of $600,000. At the yearend, half of these goods remain in Paris’ inventory. London sold the goods at a 30% margin.
(4) London paid a dividend of $200,000 during the year.
chapter 5
KAPLAN PUBLISHING 145
Test your understanding 1 Paris and London

Below are the statements of comprehensive income for Rome and its subsidiary Madrid for the year ended 30 June 20X9.
Required:
Prepare a consolidated statement of comprehensive income for the Rome Group for the year ended 30 June 20X9.
Rome Madrid $000 $000
Revenue 10,350 8,400Cost of sales (6,200)
––––– (5,150) –––––
Gross profit 4,150 3,250Distribution costs (1,200) (800)Administrative expenses (1,150)
––––– (750) –––––
Profit from operations 1,800 1,700Finance costs (100)
––––– (50)
––––– Profit before tax 1,700 1,650Taxation (550)
––––– (450) –––––
Profit for the year 1,150 1,200Other comprehensive income 850
––––– 300
––––– Total comprehensive income 2,000
––––– 1,500 –––––
(1) Rome acquired 60% of Madrid’s equity shares on 1 July 20X7 paying $6 million. At this date the fair value of Madrid’s net assets was $5 million. It is Rome’s group policy to value NCIs at acquisition using the proportion of net assets method. As at 30 June 20X9 it was determined that goodwill on acquisition had been impaired by 20%. No impairment loss had arisen previously.
(2) A fair value adjustment of $200,000 had been recorded at acquisition in relation to Madrid’s depreciable noncurrent assets. The remaining life of these assets was 5 years as at the date of acquisition. Depreciation is calculated on a straight line basis and charged to cost of sales.
(3) During the year ended 30 June 20X9, Rome sold $1 million of goods to Madrid at a margin of 30%. Half of these goods remained in the inventory of Madrid at the reporting date.
Consolidated statement of comprehensive income and statement of changes in equity
146 KAPLAN PUBLISHING
Test your understanding 2 Rome and Madrid
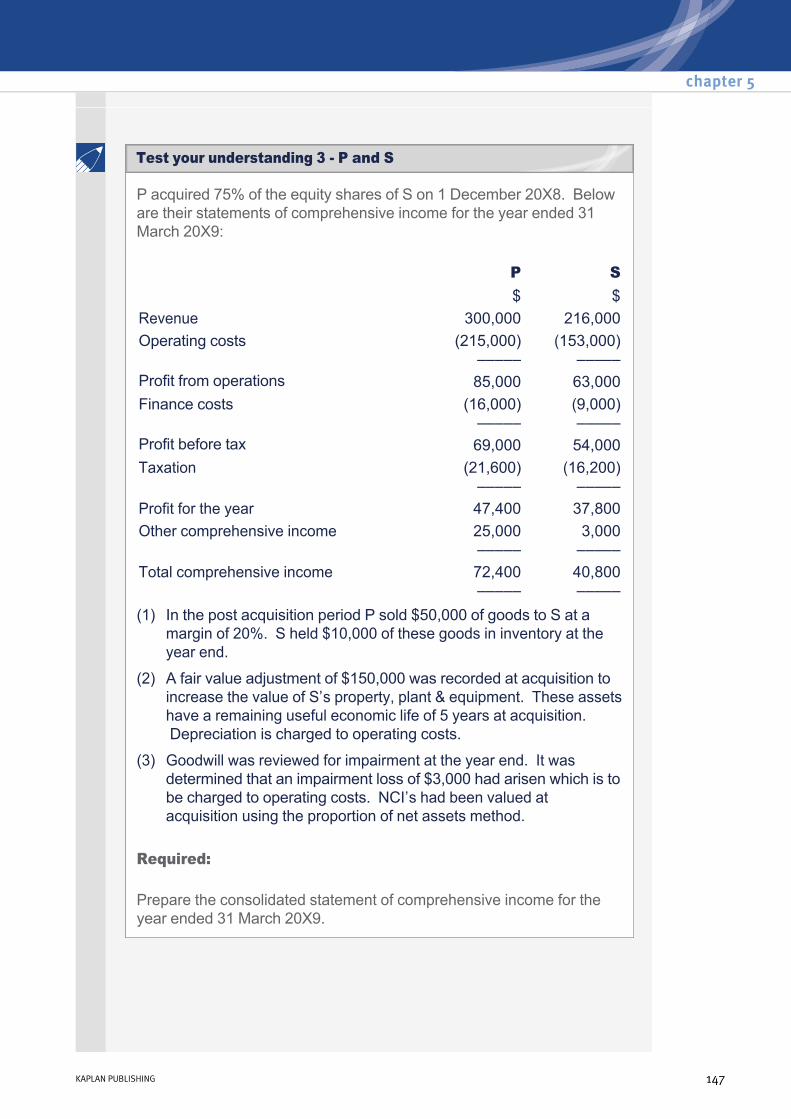
P acquired 75% of the equity shares of S on 1 December 20X8. Below are their statements of comprehensive income for the year ended 31 March 20X9:
Required:
Prepare the consolidated statement of comprehensive income for the year ended 31 March 20X9.
P S $ $
Revenue 300,000 216,000Operating costs (215,000)
––––– (153,000)
––––– Profit from operations 85,000 63,000Finance costs (16,000)
––––– (9,000) –––––
Profit before tax 69,000 54,000Taxation (21,600)
––––– (16,200) –––––
Profit for the year 47,400 37,800Other comprehensive income 25,000
––––– 3,000 –––––
Total comprehensive income 72,400 –––––
40,800 –––––
(1) In the post acquisition period P sold $50,000 of goods to S at a margin of 20%. S held $10,000 of these goods in inventory at the year end.
(2) A fair value adjustment of $150,000 was recorded at acquisition to increase the value of S’s property, plant & equipment. These assets have a remaining useful economic life of 5 years at acquisition. Depreciation is charged to operating costs.
(3) Goodwill was reviewed for impairment at the year end. It was determined that an impairment loss of $3,000 had arisen which is to be charged to operating costs. NCI’s had been valued at acquisition using the proportion of net assets method.
chapter 5
KAPLAN PUBLISHING 147
Test your understanding 3 P and S

On 1 July 20X4 Tudor purchased 80% of the shares in Windsor. The summarised draft statement of comprehensive income for each company for the year ended 31 March 20X5 was as follows:
Tudor Windsor $000 $000
Revenue 60,000 24,000Cost of sales (42,000)
––––– (20,000) –––––
Gross profit 18,000 4,000Operating costs (6,000)
––––– (200) –––––
Profit from operations 12,000 3,800Investment income 75 Finance costs
––––– (200) –––––
Profit before tax 12,075 3,600Taxation (3,000)
––––– (600) –––––
Profit for the year 9,075 3,000Other comprehensive income 1,500
––––– 500
––––– Total comprehensive income 10,575
––––– 3,500 –––––
(1) The fair values of Windsor’s assets at the date of acquisition were mostly equal to their book values with the exception of plant, which was stated in the books at $2 million but had a fair value of $5.2 million. The remaining useful life of the plant in question was four years at the date of acquisition. Depreciation is charged to cost of sales and is time apportioned on a monthly basis.
(2) During the post acquisition period Tudor sold Windsor some goods for $12 million. The goods had originally cost $9 million. By the year end Windsor had sold $10 million of these goods (at cost to Windsor) to third parties for $13 million.
(3) Tudor invested $1 million in Windsor’s 10% loan notes on 1 July 20X4. At 31 March 20X5 it was determined that an impairment loss of $100,000 had arisen in respect of goodwill. The
(4) NCI holding in Windsor was measured at fair value at acquisition. Impairment losses should be charged to operating costs.
Consolidated statement of comprehensive income and statement of changes in equity
148 KAPLAN PUBLISHING
Test your understanding 4 Tudor and Windsor
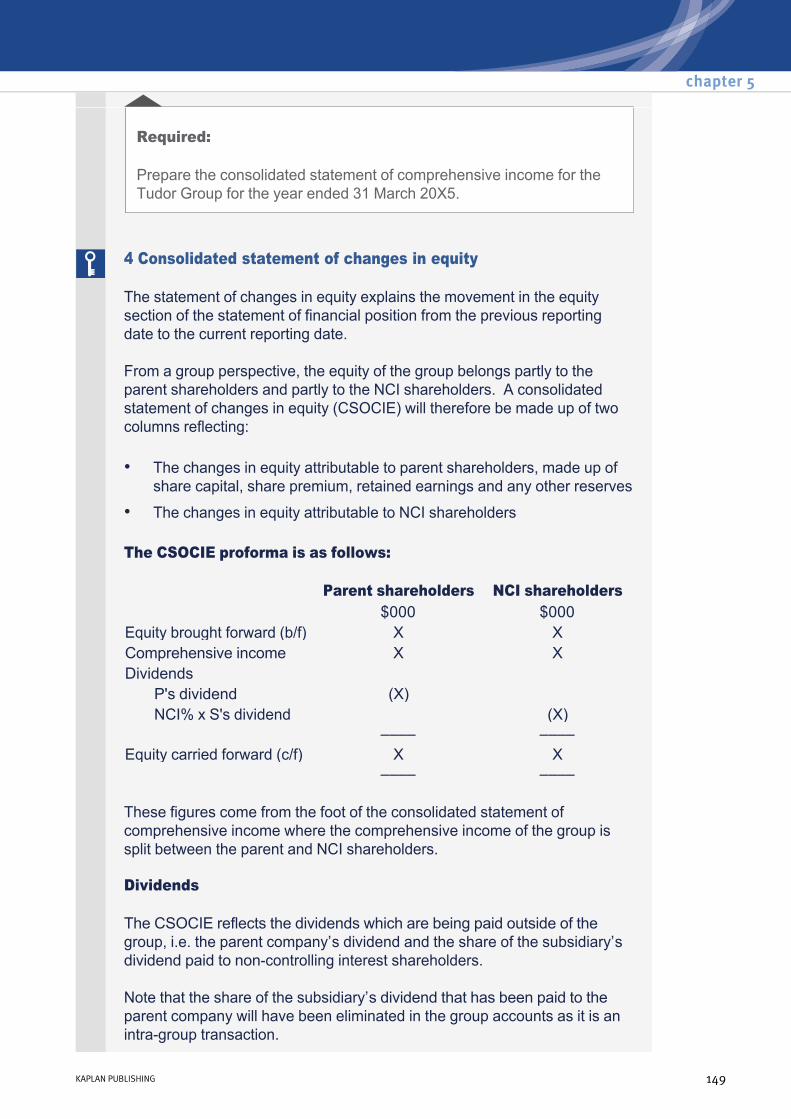
Required:
Prepare the consolidated statement of comprehensive income for the Tudor Group for the year ended 31 March 20X5.
4 Consolidated statement of changes in equity
The statement of changes in equity explains the movement in the equity section of the statement of financial position from the previous reporting date to the current reporting date.
From a group perspective, the equity of the group belongs partly to the parent shareholders and partly to the NCI shareholders. A consolidated statement of changes in equity (CSOCIE) will therefore be made up of two columns reflecting:
The CSOCIE proforma is as follows:
These figures come from the foot of the consolidated statement of comprehensive income where the comprehensive income of the group is split between the parent and NCI shareholders.
Dividends
The CSOCIE reflects the dividends which are being paid outside of the group, i.e. the parent company’s dividend and the share of the subsidiary’s dividend paid to noncontrolling interest shareholders.
Note that the share of the subsidiary’s dividend that has been paid to the parent company will have been eliminated in the group accounts as it is an intragroup transaction.
• The changes in equity attributable to parent shareholders, made up of share capital, share premium, retained earnings and any other reserves
• The changes in equity attributable to NCI shareholders
Parent shareholders NCI shareholders $000 $000
Equity brought forward (b/f) X XComprehensive income X XDividends
P's dividend (X) NCI% x S's dividend (X)
–––– ––––Equity carried forward (c/f) X X –––– ––––
chapter 5
KAPLAN PUBLISHING 149

Equity b/f
Parent shareholders
This is made up of the share capital, share premium, retained earnings and any other reserves as reported in last year’s CSFP.
Share capital and share premium is that of the parent company only. Retained earnings and other reserves are calculated using W5. Therefore equity b/f can be calculated using the same format as W5 but starting with the parent’s equity rather than just the parent’s reserves. Also, only include the subsidiary’s post acquisition reserves up to the b/f date.
NCI shareholders
This is the NCI figure as per W4 but again remembering to include only post acquisition reserves up to the b/f date.
Equity c/f
Parent shareholders
The equity c/f figures can be calculated using W5 but remembering to include the parent’s share capital and share premium balances as well as their retained earnings / other reserves. In other words the working will start with the parent’s equity c/f.
When including the subsidiary, post acquisition reserves up to the c/f date (i.e. reporting date) will be included.
NCI shareholders
This is the NCI figure as calculated for a CSFP using W4.
Consolidated statement of comprehensive income and statement of changes in equity
150 KAPLAN PUBLISHING
Example 2
Example 2 answer
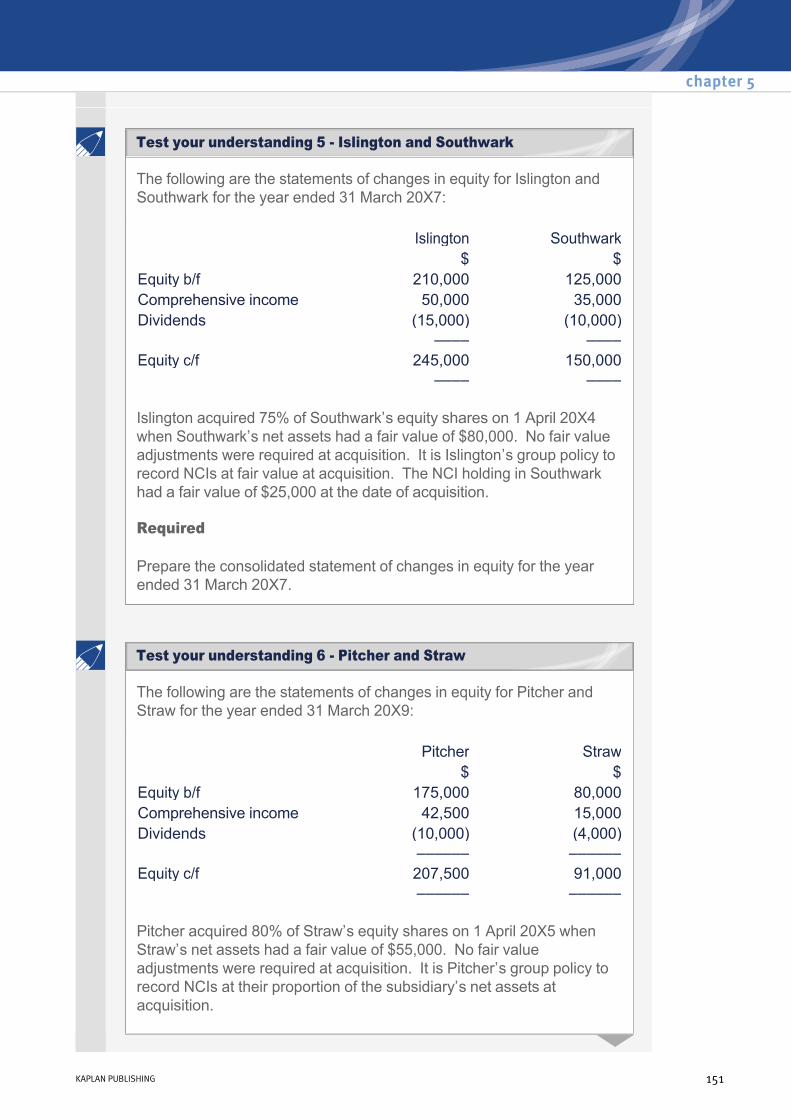
The following are the statements of changes in equity for Islington and Southwark for the year ended 31 March 20X7:
Islington acquired 75% of Southwark’s equity shares on 1 April 20X4 when Southwark’s net assets had a fair value of $80,000. No fair value adjustments were required at acquisition. It is Islington’s group policy to record NCIs at fair value at acquisition. The NCI holding in Southwark had a fair value of $25,000 at the date of acquisition.
Required
Prepare the consolidated statement of changes in equity for the year ended 31 March 20X7.
Islington Southwark $ $
Equity b/f 210,000 125,000Comprehensive income 50,000 35,000Dividends (15,000) (10,000) –––– –––– Equity c/f 245,000 150,000 –––– ––––
The following are the statements of changes in equity for Pitcher and Straw for the year ended 31 March 20X9:
Pitcher acquired 80% of Straw’s equity shares on 1 April 20X5 when Straw’s net assets had a fair value of $55,000. No fair value adjustments were required at acquisition. It is Pitcher’s group policy to record NCIs at their proportion of the subsidiary’s net assets at acquisition.
Pitcher Straw $ $
Equity b/f 175,000 80,000Comprehensive income 42,500 15,000Dividends (10,000) (4,000) –––––– –––––– Equity c/f 207,500 91,000 –––––– ––––––
chapter 5
KAPLAN PUBLISHING 151
Test your understanding 6 Pitcher and Straw
Test your understanding 5 Islington and Southwark
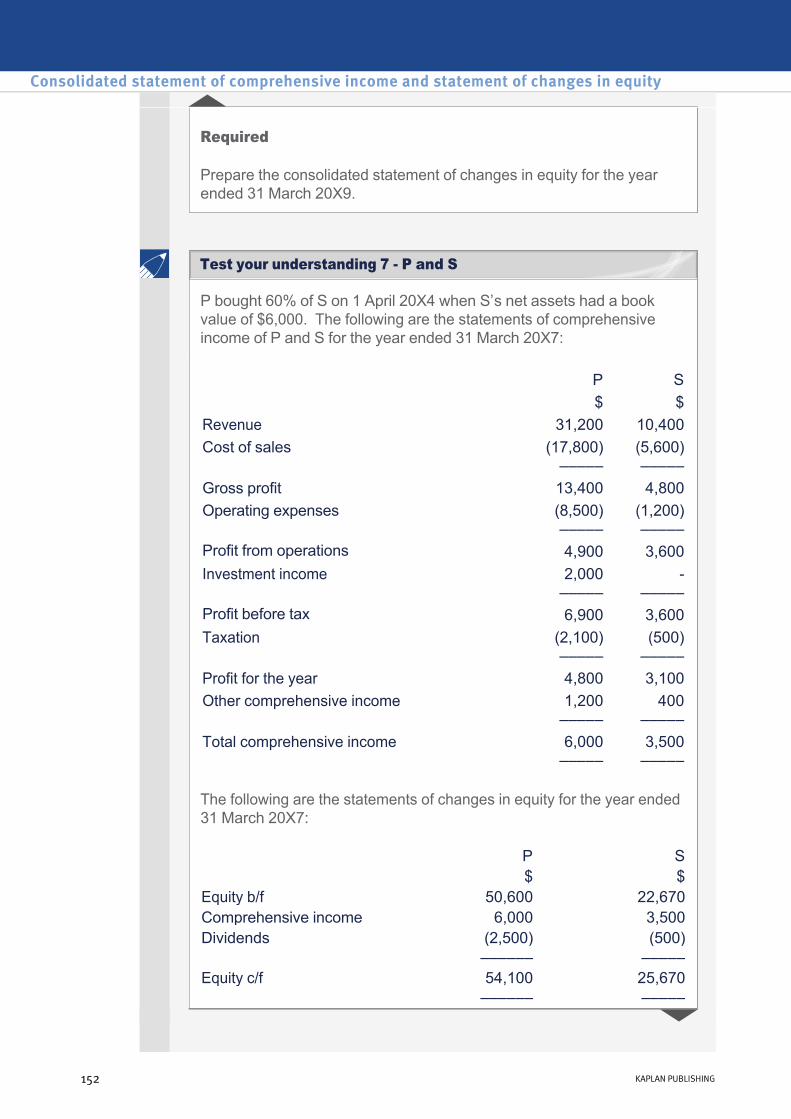
Required
Prepare the consolidated statement of changes in equity for the year ended 31 March 20X9.
P bought 60% of S on 1 April 20X4 when S’s net assets had a book value of $6,000. The following are the statements of comprehensive income of P and S for the year ended 31 March 20X7:
The following are the statements of changes in equity for the year ended 31 March 20X7:
P S$ $
Revenue 31,200 10,400Cost of sales (17,800)
––––– (5,600) –––––
Gross profit 13,400 4,800Operating expenses (8,500)
––––– (1,200) –––––
Profit from operations 4,900 3,600Investment income 2,000
–––––
––––– Profit before tax 6,900 3,600Taxation (2,100)
––––– (500) –––––
Profit for the year 4,800 3,100Other comprehensive income 1,200
––––– 400
––––– Total comprehensive income 6,000
––––– 3,500 –––––
P S $ $
Equity b/f 50,600 22,670Comprehensive income 6,000 3,500Dividends (2,500) (500) –––––– ––––– Equity c/f 54,100 25,670 –––––– –––––
Consolidated statement of comprehensive income and statement of changes in equity
152 KAPLAN PUBLISHING
Test your understanding 7 P and S
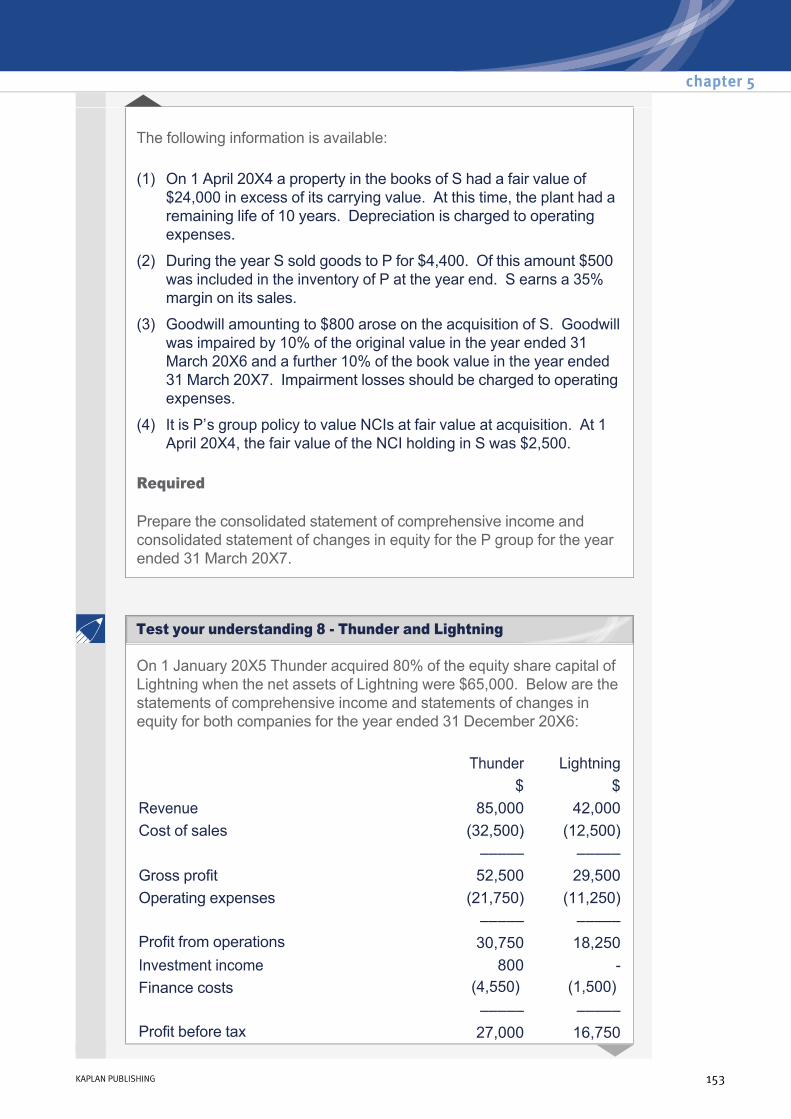
The following information is available:
Required
Prepare the consolidated statement of comprehensive income and consolidated statement of changes in equity for the P group for the year ended 31 March 20X7.
(1) On 1 April 20X4 a property in the books of S had a fair value of $24,000 in excess of its carrying value. At this time, the plant had a remaining life of 10 years. Depreciation is charged to operating expenses.
(2) During the year S sold goods to P for $4,400. Of this amount $500 was included in the inventory of P at the year end. S earns a 35% margin on its sales.
(3) Goodwill amounting to $800 arose on the acquisition of S. Goodwill was impaired by 10% of the original value in the year ended 31 March 20X6 and a further 10% of the book value in the year ended 31 March 20X7. Impairment losses should be charged to operating expenses.
(4) It is P’s group policy to value NCIs at fair value at acquisition. At 1 April 20X4, the fair value of the NCI holding in S was $2,500.
On 1 January 20X5 Thunder acquired 80% of the equity share capital of Lightning when the net assets of Lightning were $65,000. Below are the statements of comprehensive income and statements of changes in equity for both companies for the year ended 31 December 20X6:
Thunder Lightning$ $
Revenue 85,000 42,000Cost of sales (32,500) (12,500)
––––– ––––– Gross profit 52,500 29,500Operating expenses (21,750) (11,250)
––––– ––––– Profit from operations 30,750 18,250Investment income 800 Finance costs (4,550) (1,500)
––––– ––––– Profit before tax 27,000 16,750
chapter 5
KAPLAN PUBLISHING 153
Test your understanding 8 Thunder and Lightning
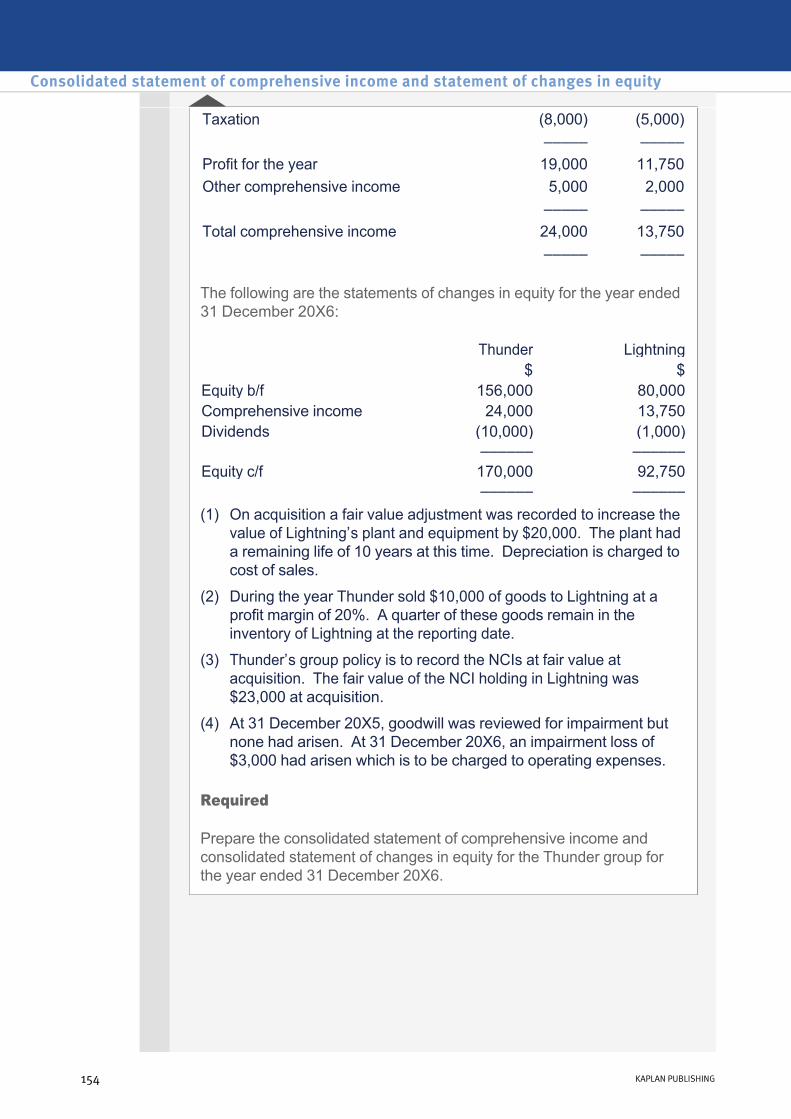
The following are the statements of changes in equity for the year ended 31 December 20X6:
Required
Prepare the consolidated statement of comprehensive income and consolidated statement of changes in equity for the Thunder group for the year ended 31 December 20X6.
Taxation (8,000) (5,000)––––– –––––
Profit for the year 19,000 11,750Other comprehensive income 5,000 2,000 ––––– ––––– Total comprehensive income 24,000 13,750 ––––– –––––
Thunder Lightning $ $
Equity b/f 156,000 80,000Comprehensive income 24,000 13,750Dividends (10,000) (1,000) –––––– –––––– Equity c/f 170,000 92,750 –––––– –––––– (1) On acquisition a fair value adjustment was recorded to increase the
value of Lightning’s plant and equipment by $20,000. The plant had a remaining life of 10 years at this time. Depreciation is charged to cost of sales.
(2) During the year Thunder sold $10,000 of goods to Lightning at a profit margin of 20%. A quarter of these goods remain in the inventory of Lightning at the reporting date.
(3) Thunder’s group policy is to record the NCIs at fair value at acquisition. The fair value of the NCI holding in Lightning was $23,000 at acquisition.
(4) At 31 December 20X5, goodwill was reviewed for impairment but none had arisen. At 31 December 20X6, an impairment loss of $3,000 had arisen which is to be charged to operating expenses.
Consolidated statement of comprehensive income and statement of changes in equity
154 KAPLAN PUBLISHING
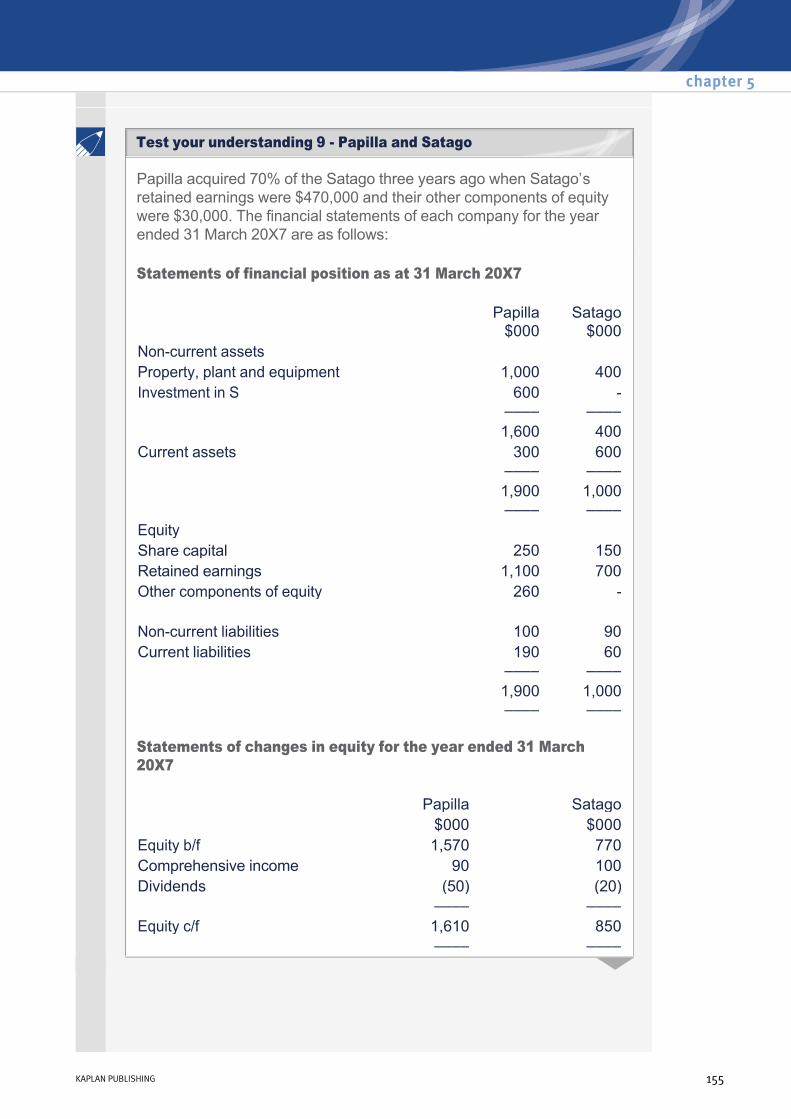
Papilla acquired 70% of the Satago three years ago when Satago’s retained earnings were $470,000 and their other components of equity were $30,000. The financial statements of each company for the year ended 31 March 20X7 are as follows:
Statements of financial position as at 31 March 20X7
Statements of changes in equity for the year ended 31 March 20X7
Papilla $000
Satago $000
Noncurrent assets Property, plant and equipment 1,000 400Investment in S 600
––––
–––– 1,600 400Current assets 300
–––– 600
–––– 1,900
–––– 1,000
–––– Equity Share capital 250 150Retained earnings 1,100 700Other components of equity 260 Noncurrent liabilities 100 90Current liabilities 190
–––– 60
–––– 1,900
–––– 1,000
––––
Papilla Satago $000 $000
Equity b/f 1,570 770Comprehensive income 90 100Dividends (50) (20) –––– –––– Equity c/f 1,610 850 –––– ––––
chapter 5
KAPLAN PUBLISHING 155
Test your understanding 9 Papilla and Satago

You are provided with the following additional information:
Required
Prepare the consolidated statement of financial position, consolidated statement of comprehensive income and consolidated statement of changes in equity for the Papilla group for the year ended 31 March 20X7.
Statements of comprehensive income for the year ended 31 March 20X7
Papilla Satago$ $
Revenue 1,000 260Cost of sales (750) (80)
––––– ––––– Gross profit 250 180Operating expenses (60) (35)
––––– ––––– Profit from operations 190 145Investment income 24 Finance costs (25) (15)
––––– ––––– Profit before tax 189 130Taxation (109) (30)
––––– ––––– Profit for the year 80 100Other comprehensive income 10 ––––– ––––– Total comprehensive income 90
––––– 100
–––––
(1) At the date of acquisition, land in the books of Satago with a carrying value of $100,000 had a fair value of $120,000.
(2) Papilla sold $40,000 of goods to Satago during the year at a mark up of 20%. 45% of the inventory remained unsold at the yearend. At the yearend Satago owes Papilla $6,000 which agrees with the receivable recorded in Papilla’s books.
(3) Papilla’s group policy is to value NCIs at fair value at acquisition. The NCI holding in Satago had a fair value of $250,000.
Consolidated statement of comprehensive income and statement of changes in equity
156 KAPLAN PUBLISHING

The following are the statements of changes in equity for Penguin and Smarties for the year ended 31 March 20X9:
Penguin acquired 80% of Smarties’ equity shares on 1 April 20X7 when Smarties’ net assets had a carrying value of $125,000. At this time property had a fair value of $40,000 in excess of its carrying value. The property had a remaining life of 20 years.
At 31 March 20X9, Smarties held inventory which had been purchased from Penguin for $20,000. Penguin had sold these goods at a margin of 25%.
It is Penguin’s group policy to record NCIs at their fair value at acquisition. The fair value of the NCI holding in Smarties at 1 April 20X7 was $30,000.
Required
Prepare the consolidated statement of changes in equity for the year ended 31 March 20X9.
Penguin Smarties $ $
Equity b/f 275,000 180,000Comprehensive income 100,000 50,000Dividends (20,000) (10,000) –––––– –––––– Equity c/f 355,000 220,000 –––––– ––––––
chapter 5
KAPLAN PUBLISHING 157
Test your understanding 10 Penguin and Smarties
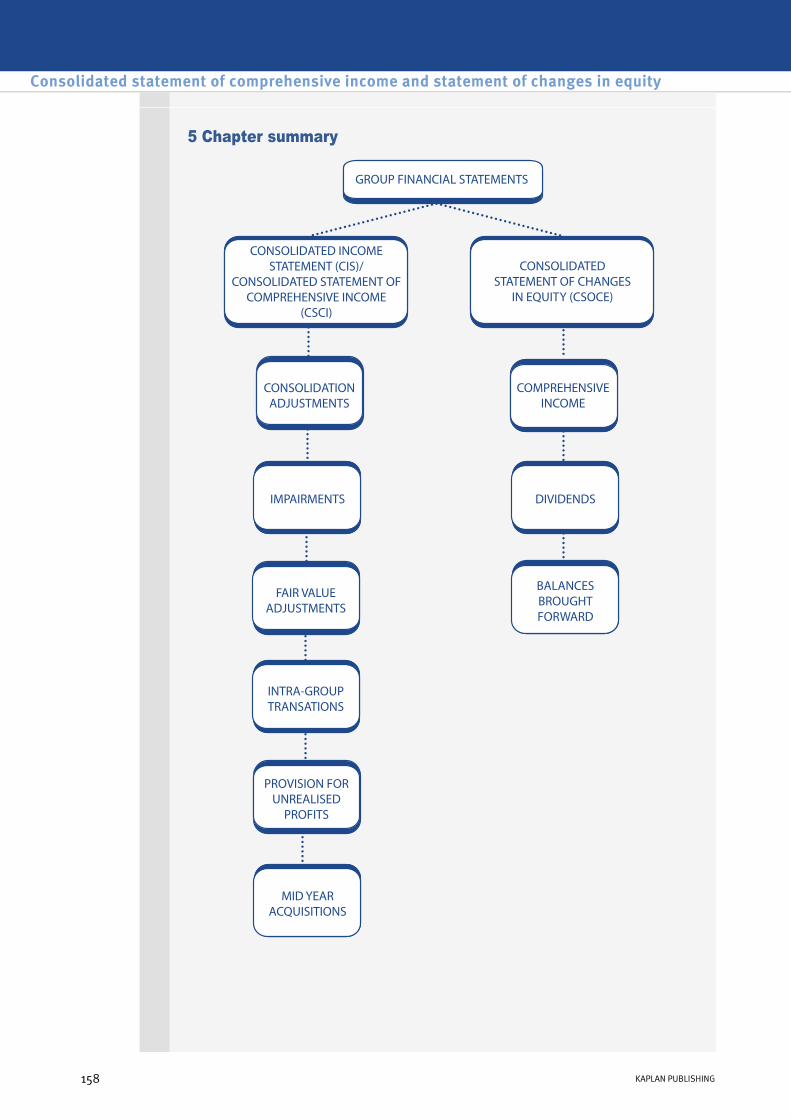
5 Chapter summary
Consolidated statement of comprehensive income and statement of changes in equity
158 KAPLAN PUBLISHING
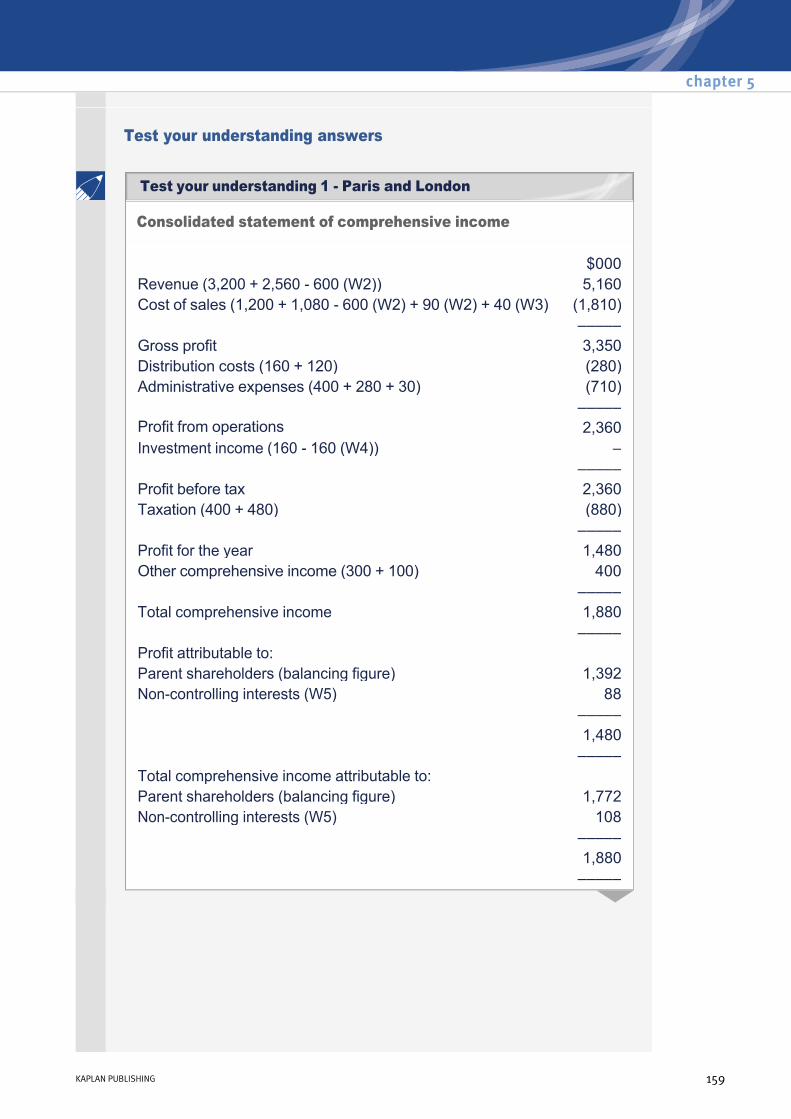
Test your understanding answers
Consolidated statement of comprehensive income
$000Revenue (3,200 + 2,560 600 (W2)) 5,160Cost of sales (1,200 + 1,080 600 (W2) + 90 (W2) + 40 (W3) (1,810)
––––– Gross profit 3,350Distribution costs (160 + 120) (280)Administrative expenses (400 + 280 + 30) (710)
––––– Profit from operations 2,360Investment income (160 160 (W4)) – ––––– Profit before tax 2,360Taxation (400 + 480) (880)
––––– Profit for the year 1,480Other comprehensive income (300 + 100) 400 ––––– Total comprehensive income 1,880 ––––– Profit attributable to:Parent shareholders (balancing figure) 1,392Noncontrolling interests (W5) 88
––––– 1,480 ––––– Total comprehensive income attributable to: Parent shareholders (balancing figure) 1,772Noncontrolling interests (W5) 108 ––––– 1,880 –––––
chapter 5
KAPLAN PUBLISHING 159
Test your understanding 1 Paris and London

Workings
(W1) Group structure
(W2) Intercompany sales and PUP
Intercompany sales of $600,000 to be eliminated by reducing both revenue and cost of sales
PUP adjustment to increase cost of sales:
Goods in inventory = 1/2 x $600,000 = $300,000
Profit in inventory = 30% x $300,000 = $90,000
(W3) Depreciation adjustment
Fair value adjustment = $400,000
Depreciation adjustment = 1/10 x $400,000 = $40,000
(W4) Intercompany dividend
Sub paid $200,000
Parent received (80% x $200,000) = $160,000
(W5) NCI share of profit and total comprehensive income
Paris
80% London
$000 $000Sub's profit for the year per S's SCI
600
PUP (sub seller) (W2) (90) Depreciation adjustment (W3)
(40)
Impairment expense (fair value method only)
(30)
––– 440
Consolidated statement of comprehensive income and statement of changes in equity
160 KAPLAN PUBLISHING
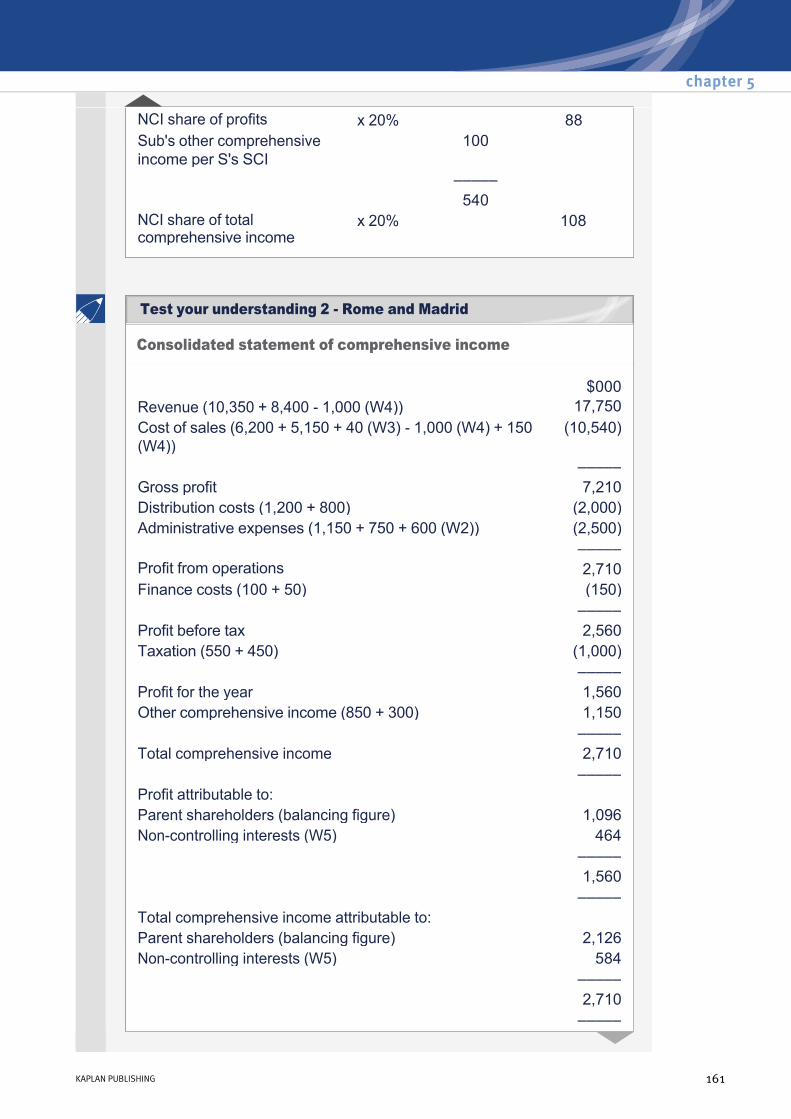
NCI share of profits x 20% 88Sub's other comprehensive income per S's SCI
100
––––– 540 NCI share of total comprehensive income
x 20% 108
Consolidated statement of comprehensive income
$000Revenue (10,350 + 8,400 1,000 (W4)) 17,750Cost of sales (6,200 + 5,150 + 40 (W3) 1,000 (W4) + 150 (W4))
(10,540)
––––– Gross profit 7,210Distribution costs (1,200 + 800) (2,000)Administrative expenses (1,150 + 750 + 600 (W2)) (2,500)
––––– Profit from operations 2,710Finance costs (100 + 50) (150) ––––– Profit before tax 2,560Taxation (550 + 450) (1,000)
––––– Profit for the year 1,560Other comprehensive income (850 + 300) 1,150 ––––– Total comprehensive income 2,710 ––––– Profit attributable to:Parent shareholders (balancing figure) 1,096Noncontrolling interests (W5) 464
––––– 1,560 ––––– Total comprehensive income attributable to: Parent shareholders (balancing figure) 2,126Noncontrolling interests (W5) 584 ––––– 2,710 –––––
chapter 5
KAPLAN PUBLISHING 161
Test your understanding 2 Rome and Madrid
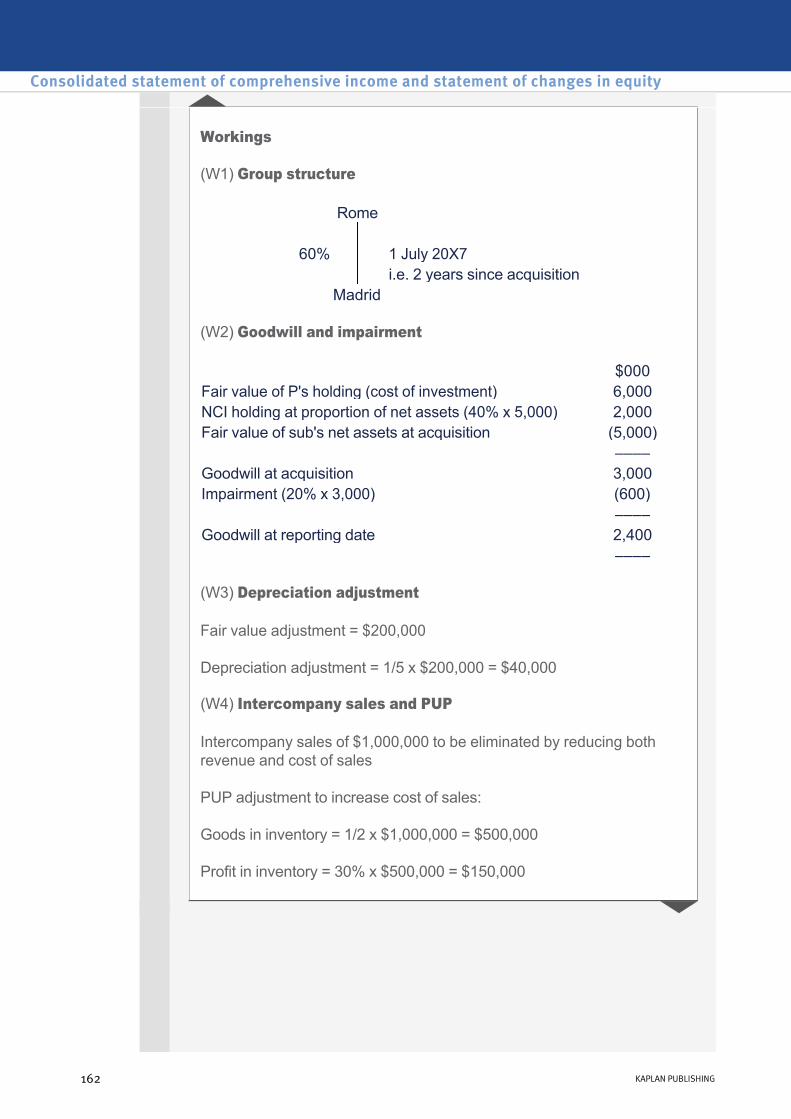
Workings
(W1) Group structure
(W2) Goodwill and impairment
(W3) Depreciation adjustment
Fair value adjustment = $200,000
Depreciation adjustment = 1/5 x $200,000 = $40,000
(W4) Intercompany sales and PUP
Intercompany sales of $1,000,000 to be eliminated by reducing both revenue and cost of sales
PUP adjustment to increase cost of sales:
Goods in inventory = 1/2 x $1,000,000 = $500,000
Profit in inventory = 30% x $500,000 = $150,000
Rome
60% 1 July 20X7 i.e. 2 years since acquisition Madrid
$000Fair value of P's holding (cost of investment) 6,000NCI holding at proportion of net assets (40% x 5,000) 2,000Fair value of sub's net assets at acquisition (5,000) –––– Goodwill at acquisition 3,000Impairment (20% x 3,000) (600) –––– Goodwill at reporting date 2,400 ––––
Consolidated statement of comprehensive income and statement of changes in equity
162 KAPLAN PUBLISHING
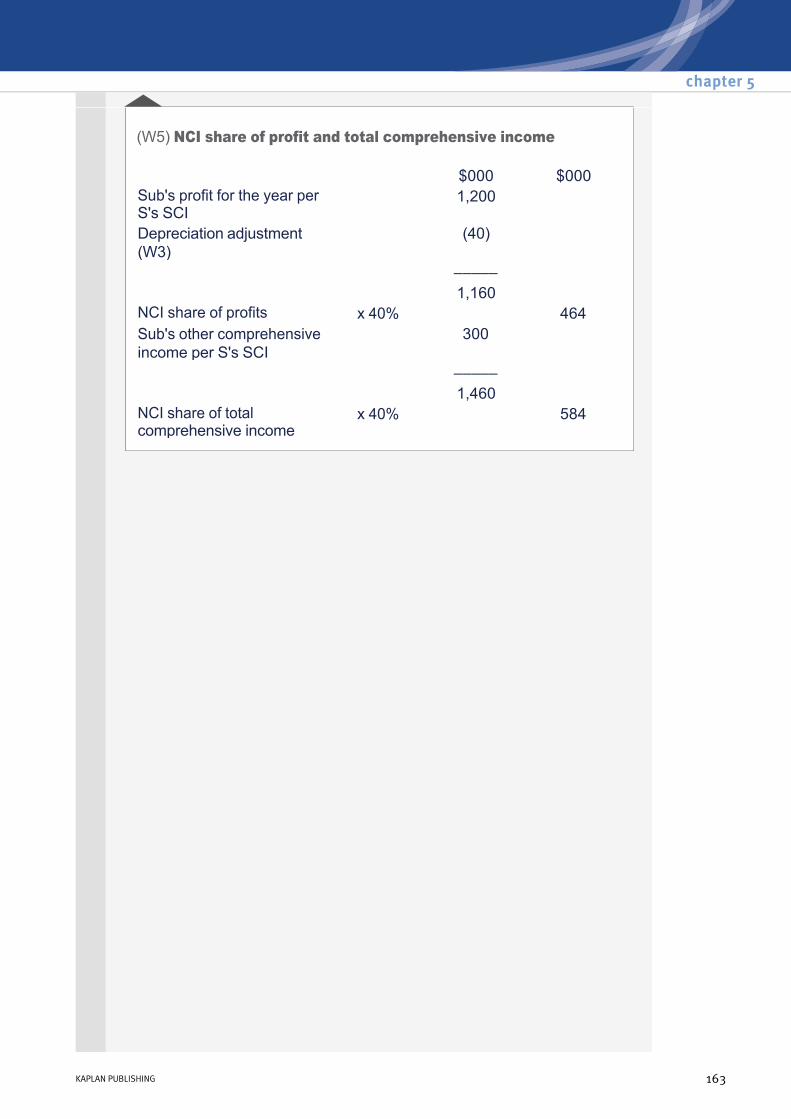
(W5) NCI share of profit and total comprehensive income
$000 $000Sub's profit for the year per S's SCI
1,200
Depreciation adjustment (W3)
(40)
––––– 1,160 NCI share of profits x 40% 464Sub's other comprehensive income per S's SCI
300
––––– 1,460 NCI share of total comprehensive income
x 40% 584
chapter 5
KAPLAN PUBLISHING 163
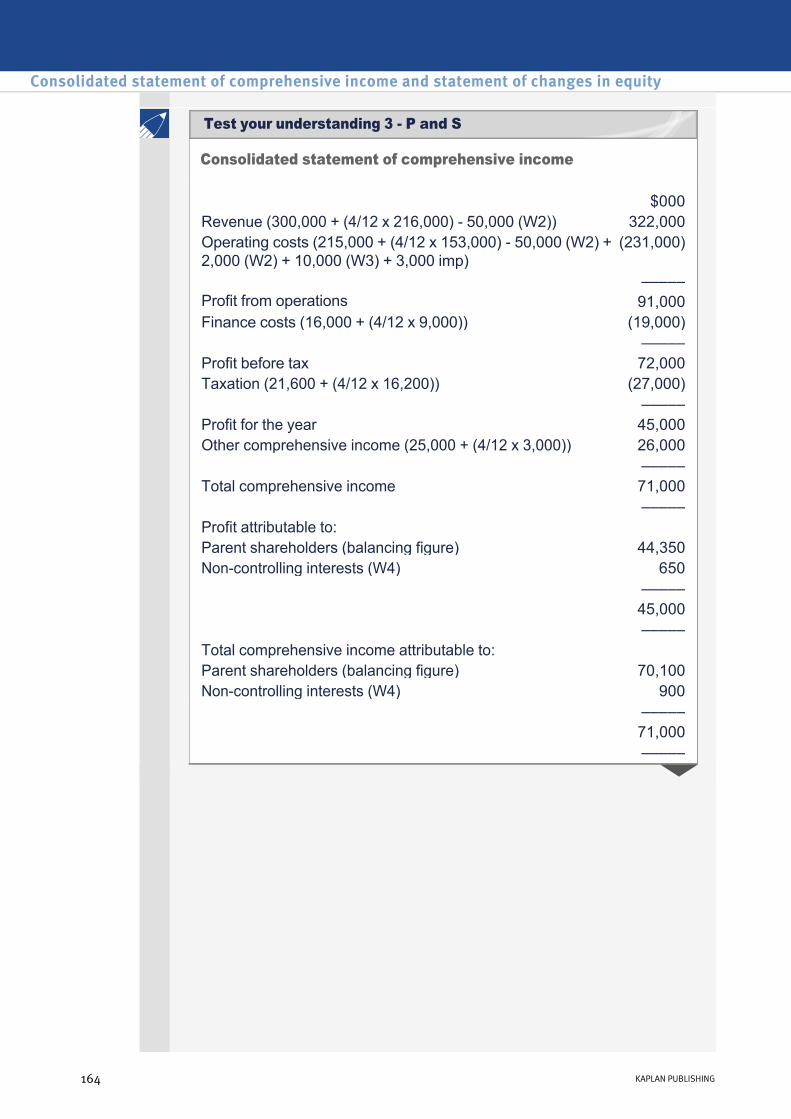
Consolidated statement of comprehensive income
$000Revenue (300,000 + (4/12 x 216,000) 50,000 (W2)) 322,000Operating costs (215,000 + (4/12 x 153,000) 50,000 (W2) + 2,000 (W2) + 10,000 (W3) + 3,000 imp)
(231,000)
––––– Profit from operations 91,000Finance costs (16,000 + (4/12 x 9,000)) (19,000) ––––– Profit before tax 72,000Taxation (21,600 + (4/12 x 16,200)) (27,000)
––––– Profit for the year 45,000Other comprehensive income (25,000 + (4/12 x 3,000)) 26,000 ––––– Total comprehensive income 71,000 ––––– Profit attributable to:Parent shareholders (balancing figure) 44,350Noncontrolling interests (W4) 650
––––– 45,000 ––––– Total comprehensive income attributable to: Parent shareholders (balancing figure) 70,100Noncontrolling interests (W4) 900 ––––– 71,000 –––––
Consolidated statement of comprehensive income and statement of changes in equity
164 KAPLAN PUBLISHING
Test your understanding 3 P and S

Workings
(W1) Group structure
(W2) Intercompany sales and PUP
Intercompany sales of $50,000 to be eliminated by reducing both revenue and cost of sales
PUP adjustment to increase cost of sales:
Profit in inventory = 20% x $10,000 = $2,000
(W3) Depreciation adjustment
Fair value adjustment = $150,000
Depreciation adjustment = 1/5 x 4/12 x $150,000 = $10,000
(W4) NCI share of profit and total comprehensive income
P
75% 1 December 20X8 i.e. 4 months since acquisition S
$000 $000Sub's profit for the year per S's SCI (4/12 x 37,800)
12,600
Depreciation adjustment (W3)
(10,000)
––––– 2,600 NCI share of profits x 25% 650Sub's other comprehensive income per S's SCI (4/12 x 3,000)
1,000
––––– 3,600 NCI share of total comprehensive income
x 25% 900
chapter 5
KAPLAN PUBLISHING 165
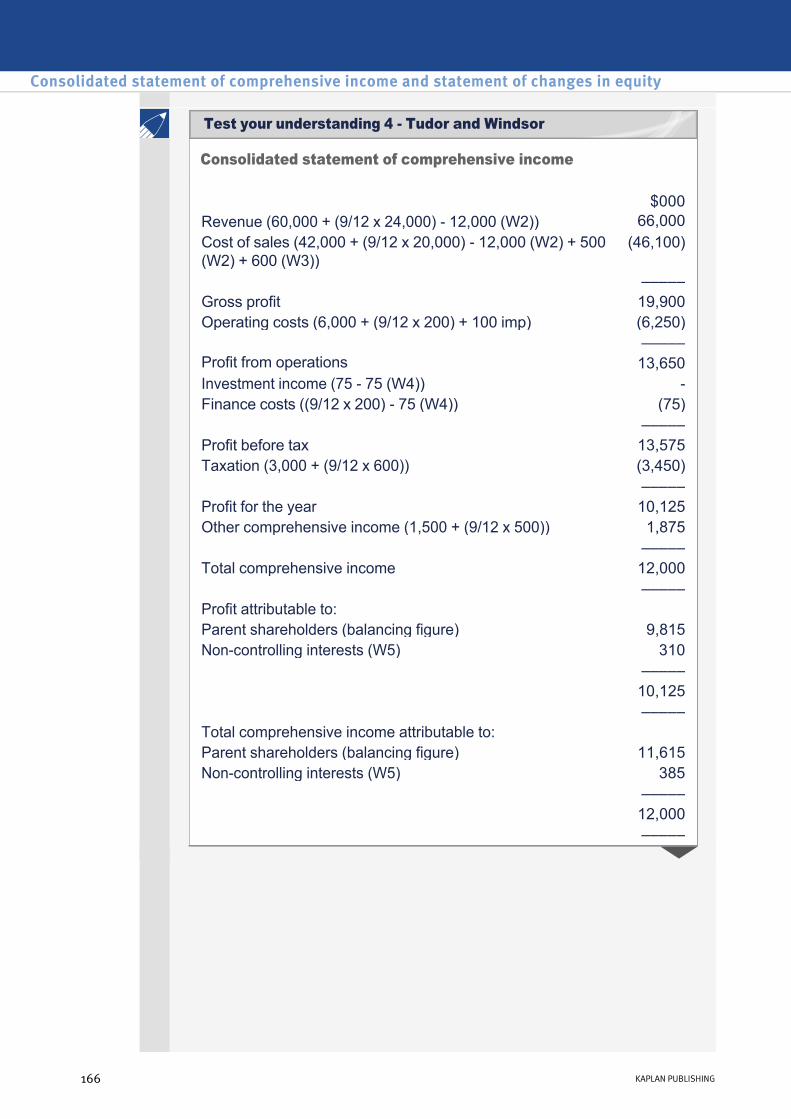
Consolidated statement of comprehensive income
$000Revenue (60,000 + (9/12 x 24,000) 12,000 (W2)) 66,000Cost of sales (42,000 + (9/12 x 20,000) 12,000 (W2) + 500 (W2) + 600 (W3))
(46,100)
––––– Gross profit 19,900Operating costs (6,000 + (9/12 x 200) + 100 imp) (6,250)
––––– Profit from operations 13,650Investment income (75 75 (W4)) Finance costs ((9/12 x 200) 75 (W4)) (75) ––––– Profit before tax 13,575Taxation (3,000 + (9/12 x 600)) (3,450)
––––– Profit for the year 10,125Other comprehensive income (1,500 + (9/12 x 500)) 1,875 ––––– Total comprehensive income 12,000 ––––– Profit attributable to:Parent shareholders (balancing figure) 9,815Noncontrolling interests (W5) 310
––––– 10,125 ––––– Total comprehensive income attributable to: Parent shareholders (balancing figure) 11,615Noncontrolling interests (W5) 385 ––––– 12,000 –––––
Consolidated statement of comprehensive income and statement of changes in equity
166 KAPLAN PUBLISHING
Test your understanding 4 Tudor and Windsor
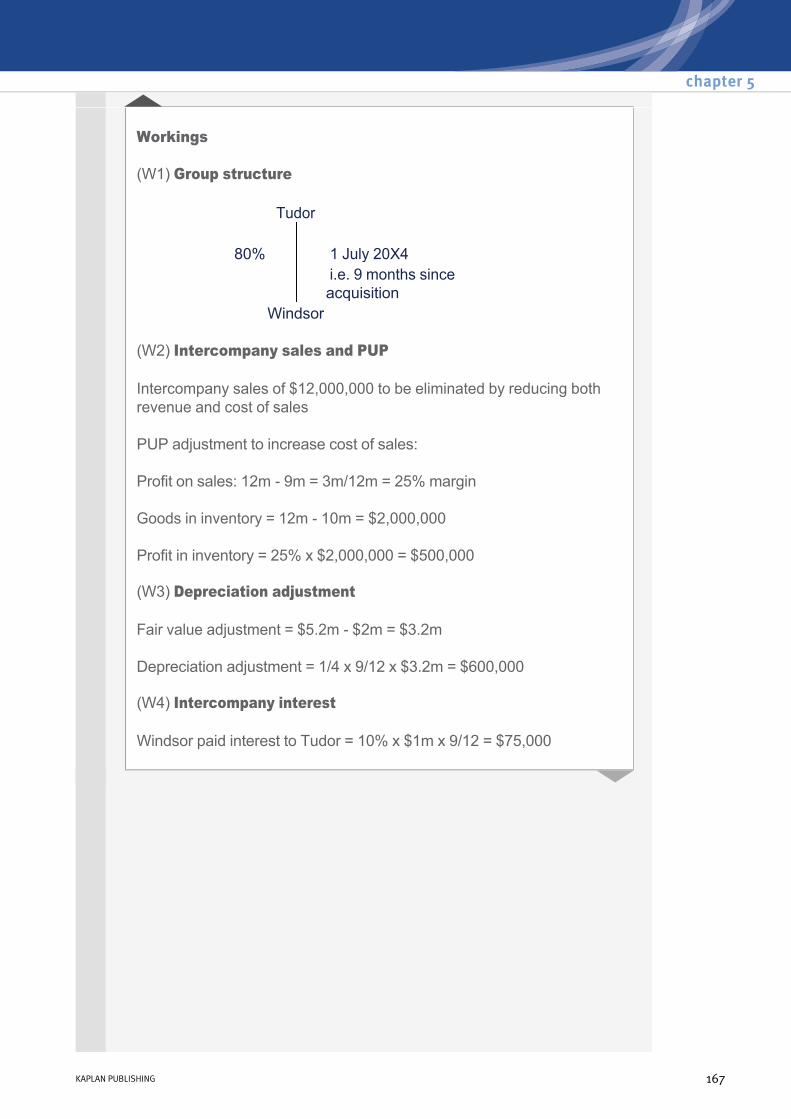
Workings
(W1) Group structure
(W2) Intercompany sales and PUP
Intercompany sales of $12,000,000 to be eliminated by reducing both revenue and cost of sales
PUP adjustment to increase cost of sales:
Profit on sales: 12m 9m = 3m/12m = 25% margin
Goods in inventory = 12m 10m = $2,000,000
Profit in inventory = 25% x $2,000,000 = $500,000
(W3) Depreciation adjustment
Fair value adjustment = $5.2m $2m = $3.2m
Depreciation adjustment = 1/4 x 9/12 x $3.2m = $600,000
(W4) Intercompany interest
Windsor paid interest to Tudor = 10% x $1m x 9/12 = $75,000
Tudor
80% 1 July 20X4 i.e. 9 months since
acquisition Windsor
chapter 5
KAPLAN PUBLISHING 167
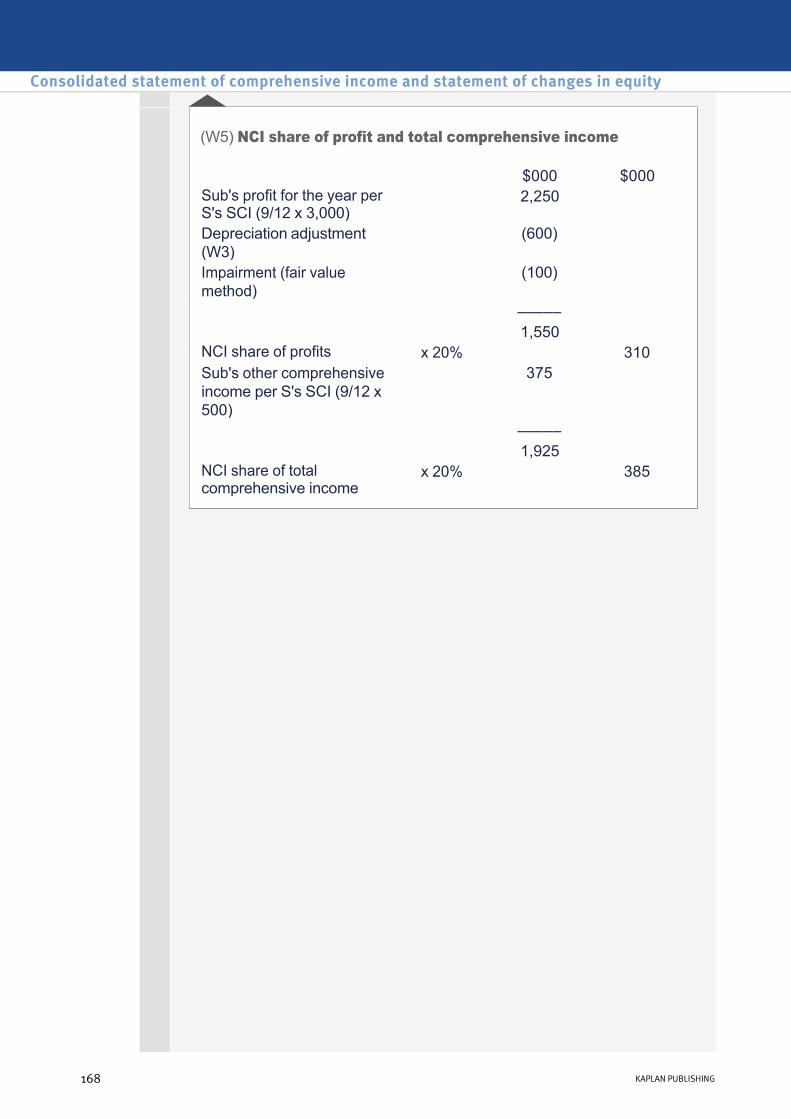
(W5) NCI share of profit and total comprehensive income
$000 $000Sub's profit for the year per S's SCI (9/12 x 3,000)
2,250
Depreciation adjustment (W3)
(600)
Impairment (fair value method)
(100)
––––– 1,550 NCI share of profits x 20% 310Sub's other comprehensive income per S's SCI (9/12 x 500)
375
––––– 1,925 NCI share of total comprehensive income
x 20% 385
Consolidated statement of comprehensive income and statement of changes in equity
168 KAPLAN PUBLISHING
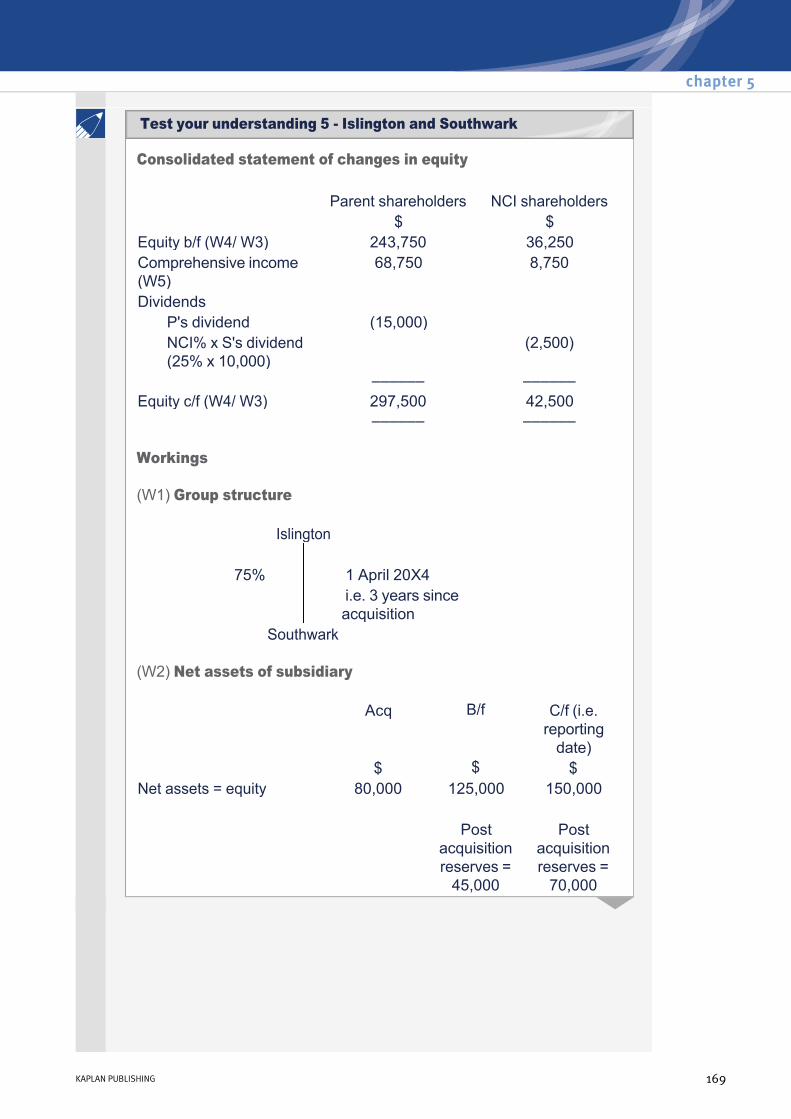
Consolidated statement of changes in equity
Workings
(W1) Group structure
(W2) Net assets of subsidiary
Parent shareholders NCI shareholders $ $
Equity b/f (W4/ W3) 243,750 36,250Comprehensive income (W5)
68,750 8,750
Dividends P's dividend (15,000) NCI% x S's dividend (25% x 10,000)
(2,500)
–––––– ––––––Equity c/f (W4/ W3) 297,500 42,500 –––––– ––––––
Islington
75% 1 April 20X4 i.e. 3 years since
acquisition Southwark
Acq B/f C/f (i.e. reporting date)
$ $ $Net assets = equity 80,000 125,000 150,000 Post
acquisition reserves = 45,000
Post acquisition reserves = 70,000
chapter 5
KAPLAN PUBLISHING 169
Test your understanding 5 Islington and Southwark
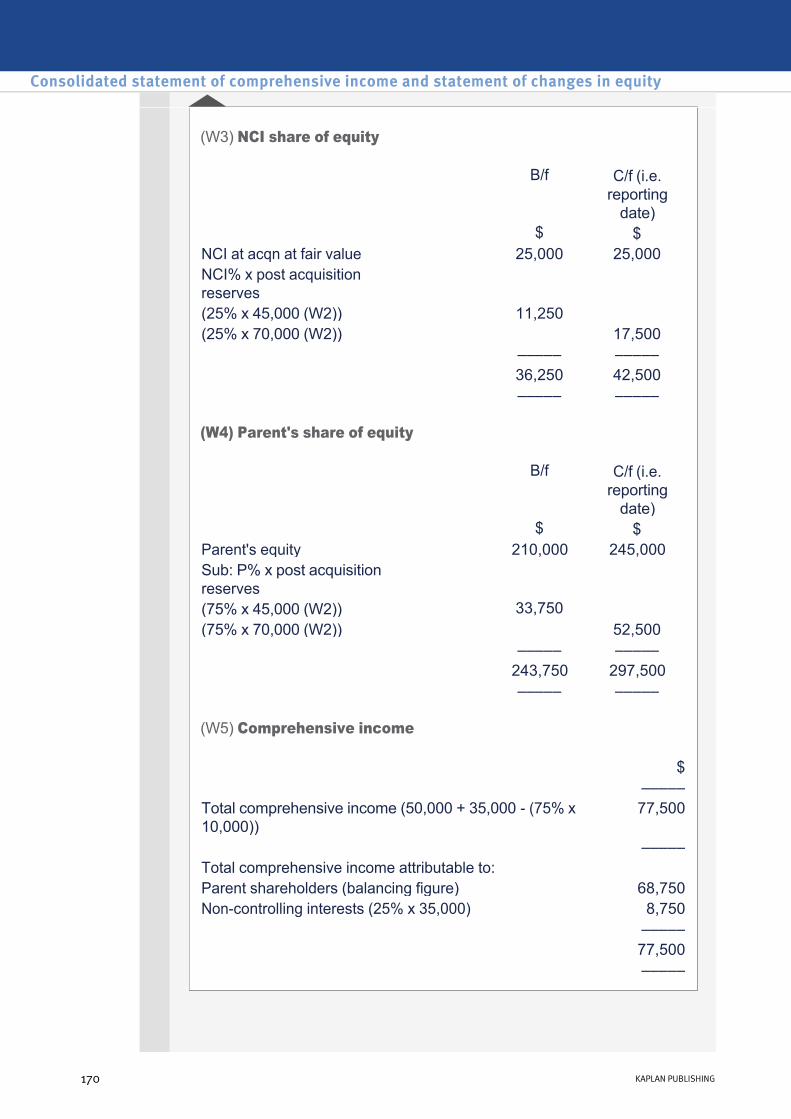
(W3) NCI share of equity
(W4) Parent's share of equity
(W5) Comprehensive income
B/f C/f (i.e. reporting date)
$ $NCI at acqn at fair value 25,000 25,000NCI% x post acquisition reserves
(25% x 45,000 (W2)) 11,250(25% x 70,000 (W2)) 17,500 ––––– ––––– 36,250 42,500 ––––– –––––
B/f C/f (i.e. reporting date)
$ $Parent's equity 210,000 245,000Sub: P% x post acquisition reserves
(75% x 45,000 (W2)) 33,750(75% x 70,000 (W2)) 52,500 ––––– ––––– 243,750 297,500 ––––– –––––
$ ––––– Total comprehensive income (50,000 + 35,000 (75% x 10,000))
77,500
––––– Total comprehensive income attributable to: Parent shareholders (balancing figure) 68,750Noncontrolling interests (25% x 35,000) 8,750 ––––– 77,500 –––––
Consolidated statement of comprehensive income and statement of changes in equity
170 KAPLAN PUBLISHING

Consolidated statement of changes in equity
Workings
(W1) Group structure
(W2) Net assets of subsidiary
Parent shareholders NCI shareholders $ $
Equity b/f (W4/ W3) 195,000 16,000Comprehensive income (W5)
51,300 3,000
Dividends P's dividend (10,000) NCI% x S's dividend (20% x 4,000)
(800)
––––– ––––– Equity c/f (W4/ W3) 236,300 18,200 ––––– –––––
Pitcher
80% 1 April 20X5 i.e. 4 years since acquisition Straw
Acq B/f C/f (i.e. reporting date)
$ $ $Net assets = equity 55,000 80,000 91,000 Post
acquisition reserves = 25,000
Post acquisition reserves = 36,000
chapter 5
KAPLAN PUBLISHING 171
Test your understanding 6 Pitcher and Straw

(W3) NCI share of equity
(W4) Parent's share of equity
(W5) Comprehensive income
B/f C/f (i.e. reporting date)
$ $NCI at acqn at proportion of net assets (20% x 55,000)
11,000 11,000
NCI% x post acquisition reserves
(20% x 25,000 (W2)) 5,000(20% x 36,000 (W2)) 7,200 ––––– ––––– 16,000 18,200 ––––– –––––
B/f C/f (i.e. reporting date)
$ $Parent's equity 175,000 207,500Sub: P% x post acquisition reserves
(80% x 25,000 (W2)) 20,000(80% x 36,000 (W2)) 28,800 ––––– ––––– 195,000 236,300 ––––– –––––
$ ––––– Total comprehensive income (42,500 + 15,000 (80% x 4,000)) 54,300 ––––– Total comprehensive income attributable to: Parent shareholders (balancing figure) 51,300Noncontrolling interests (20% x 15,000) 3,000 ––––– 54,300 –––––
Consolidated statement of comprehensive income and statement of changes in equity
172 KAPLAN PUBLISHING
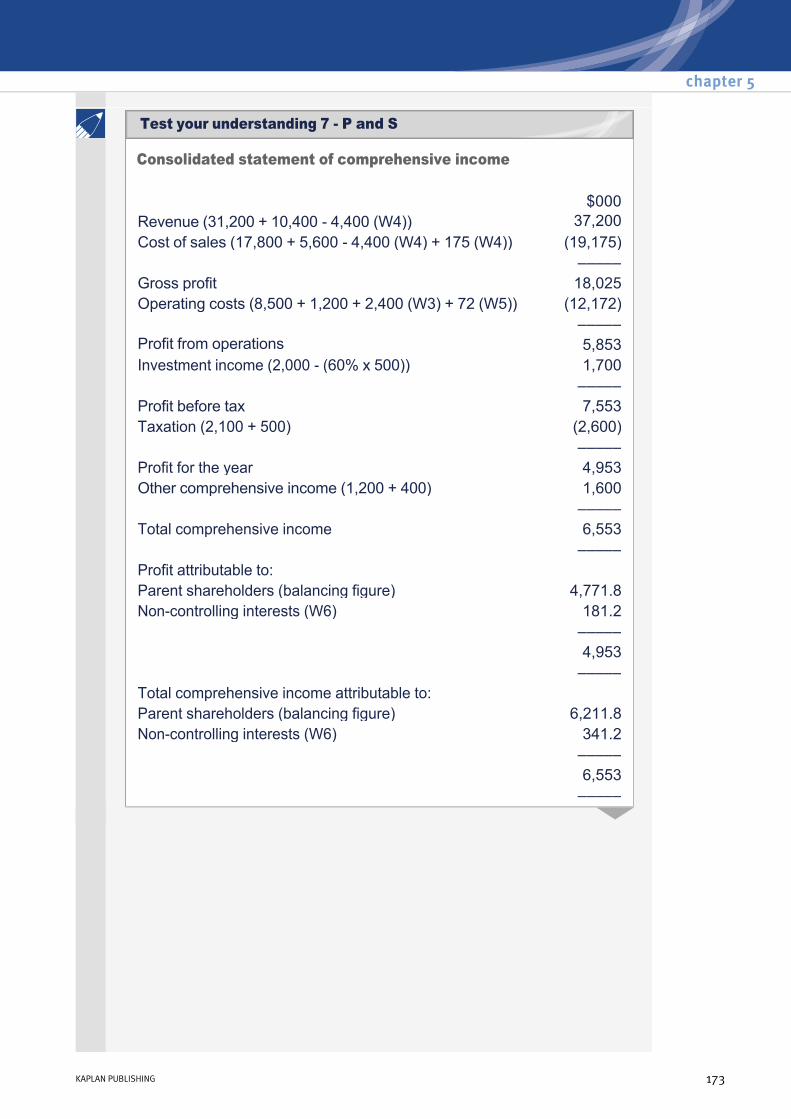
Consolidated statement of comprehensive income
$000Revenue (31,200 + 10,400 4,400 (W4)) 37,200Cost of sales (17,800 + 5,600 4,400 (W4) + 175 (W4)) (19,175)
––––– Gross profit 18,025Operating costs (8,500 + 1,200 + 2,400 (W3) + 72 (W5)) (12,172)
––––– Profit from operations 5,853Investment income (2,000 (60% x 500)) 1,700 ––––– Profit before tax 7,553Taxation (2,100 + 500) (2,600)
––––– Profit for the year 4,953Other comprehensive income (1,200 + 400) 1,600 ––––– Total comprehensive income 6,553 ––––– Profit attributable to:Parent shareholders (balancing figure) 4,771.8Noncontrolling interests (W6) 181.2
––––– 4,953 ––––– Total comprehensive income attributable to: Parent shareholders (balancing figure) 6,211.8Noncontrolling interests (W6) 341.2 ––––– 6,553 –––––
chapter 5
KAPLAN PUBLISHING 173
Test your understanding 7 P and S

Consolidated statement of changes in equity
Workings
(W1) Group structure
(W2) Net assets of subsidiary
Parent shareholders NCI shareholders $ $
Equity b/f (W7/ W8) 57,674 7,216Comprehensive income per CSCI
6,211.8 341.2
Dividends P's dividend (2,500) NCI% x S's dividend (40% x 500)
(200)
––––––– –––––– Equity c/f (W7/ W8) 61,385.8 7,357.2 ––––––– ––––––
P
60% 1 April 20X4 i.e. 3 years since acquisition S
Acq B/f C/f (i.e. reporting date)
$ $ $Net assets = equity 6,000 22,670 25,670Fair value adjustment 24,000 24,000 24,000Depreciation adjustment (W3)
(4,800) (7,200)
PUP (sub is seller) (W4) (175) ––––– ––––– ––––– 30,000 41,870 42,295 ––––– ––––– ––––– Post
acquisition reserves = 11,870
Post acquisition reserves = 12,295
Consolidated statement of comprehensive income and statement of changes in equity
174 KAPLAN PUBLISHING
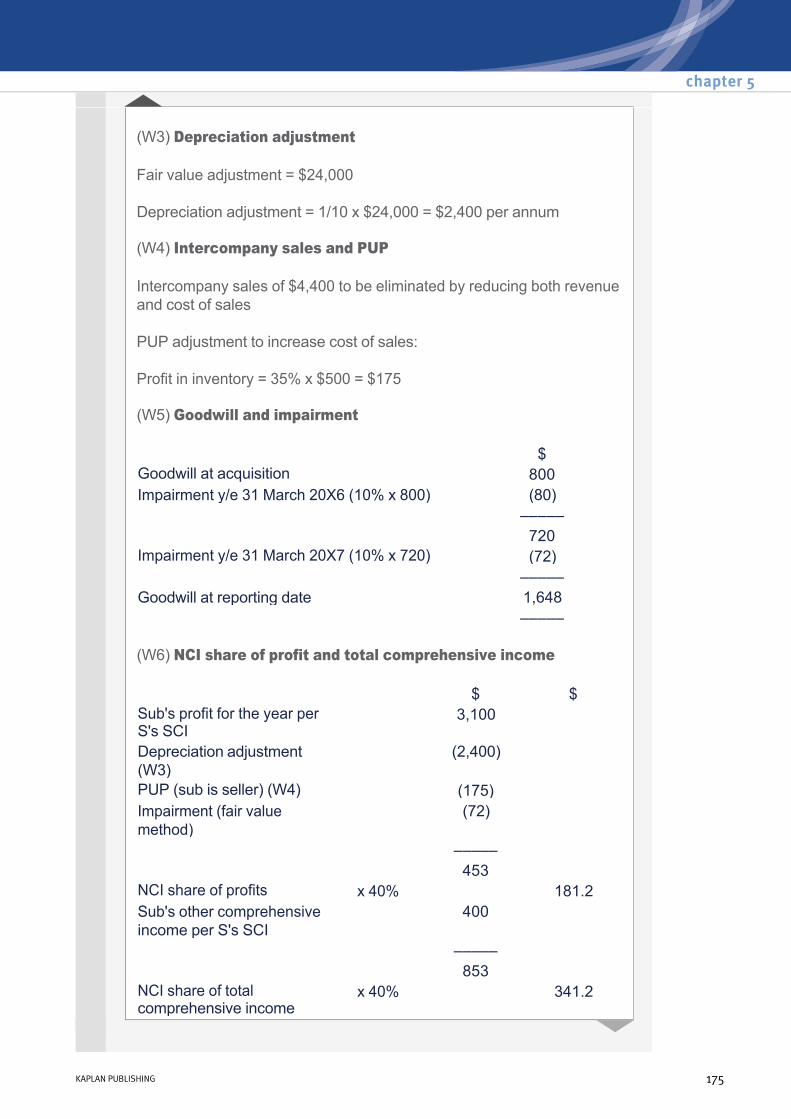
(W3) Depreciation adjustment
Fair value adjustment = $24,000
Depreciation adjustment = 1/10 x $24,000 = $2,400 per annum
(W4) Intercompany sales and PUP
Intercompany sales of $4,400 to be eliminated by reducing both revenue and cost of sales
PUP adjustment to increase cost of sales:
Profit in inventory = 35% x $500 = $175
(W5) Goodwill and impairment
(W6) NCI share of profit and total comprehensive income
$Goodwill at acquisition 800Impairment y/e 31 March 20X6 (10% x 800) (80) ––––– 720Impairment y/e 31 March 20X7 (10% x 720) (72) ––––– Goodwill at reporting date 1,648
–––––
$ $Sub's profit for the year per S's SCI
3,100
Depreciation adjustment (W3)
(2,400)
PUP (sub is seller) (W4) (175) Impairment (fair value method)
(72)
––––– 453 NCI share of profits x 40% 181.2Sub's other comprehensive income per S's SCI
400
––––– 853 NCI share of total comprehensive income
x 40% 341.2
chapter 5
KAPLAN PUBLISHING 175

(W7) Parent's share of equity
(W8) NCI share of equity
B/f C/f (i.e. reporting date)
$ $Parent's equity 50,600 54,100Sub: P% x post acquisition reserves
(60% x 11,870 (W2)) 7,122(60% x 12,295 (W2)) 7,377Impairment loss (60% x 80)/ (60% x 152) (W5)
(48) (91.2)
––––– ––––– 57,674 61,385.8 ––––– –––––
B/f C/f (i.e. reporting date)
$ $NCI at acqn at fair value 2,500 2,500NCI% x post acquisition reserves
(40% x 11,870 (W2)) 4,748(40% x 12,295 (W2)) 4,918NCI% x impairment loss (40% x 80)/ (40% x 152) (W5)
(32) (60.8)
––––– ––––– 7,216
––––– 7,357.2 –––––
Consolidated statement of comprehensive income and statement of changes in equity
176 KAPLAN PUBLISHING

Consolidated statement of comprehensive income
$Revenue (85,000 + 42,000 10,000 (W4)) 117,000Cost of sales (32,500 + 12,500 + 2,000 (W3) 10,000 (W4) + 500(W4))
(37,500)
––––– Gross profit 79,500Operating expenses (21,750 + 11,250 + 3,000 imp) (36,000)
––––– Profit from operations 43,500Investment income (800 (80% x 1,000)) Finance costs (4,550 + 1,500) (6,050) ––––– Profit before tax 37,450Taxation (8,000 + 5,000) (13,000)
––––– Profit for the year 24,450Other comprehensive income (5,000 + 2,000) 7,000 ––––– Total comprehensive income 31,450 ––––– Profit attributable to:Parent shareholders (balancing figure) 23,100Noncontrolling interests (W5) 1,350
––––– 24,450 ––––– Total comprehensive income attributable to: Parent shareholders (balancing figure) 29,700Noncontrolling interests (W5) 1,750 ––––– 31,450 –––––
chapter 5
KAPLAN PUBLISHING 177
Test your understanding 8 Thunder and Lightning

Consolidated statement of changes in equity
Workings
(W1) Group structure
(W2) Net assets of subsidiary
Parent shareholders NCI shareholders $ $
Equity b/f (W6/ W7) 166,400 25,600Comprehensive income per CSCI
29,700 1,750
Dividends P's dividend (10,000) NCI% x S's dividend (20% x 1,000)
(200)
––––––– –––––– Equity c/f (W6/ W7) 186,100 27,150 ––––––– ––––––
Thunder
80% 1 January 20X5 i.e. 2 years since
acquisition Lightning
Acq B/f C/f (i.e. reporting date)
$ $ $Net assets = equity 65,000 80,000 92,750Fair value adjustment 20,000 20,000 20,000Depreciation adjustment (W3)
(2,000) (4,000)
––––– ––––– ––––– 85,000 98,000 108,750 ––––– ––––– ––––– Post
acquisition reserves = 13,000
Post acquisition reserves = 23,750
Consolidated statement of comprehensive income and statement of changes in equity
178 KAPLAN PUBLISHING
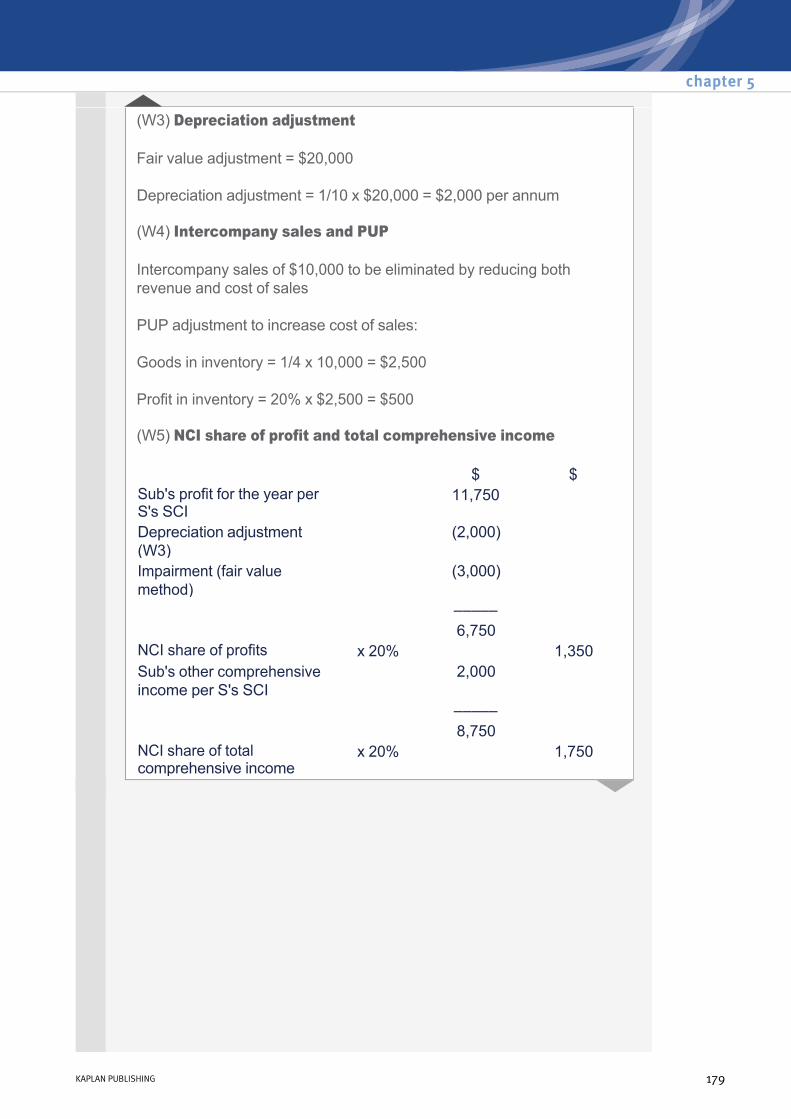
(W3) Depreciation adjustment
Fair value adjustment = $20,000
Depreciation adjustment = 1/10 x $20,000 = $2,000 per annum
(W4) Intercompany sales and PUP
Intercompany sales of $10,000 to be eliminated by reducing both revenue and cost of sales
PUP adjustment to increase cost of sales:
Goods in inventory = 1/4 x 10,000 = $2,500
Profit in inventory = 20% x $2,500 = $500
(W5) NCI share of profit and total comprehensive income
$ $Sub's profit for the year per S's SCI
11,750
Depreciation adjustment (W3)
(2,000)
Impairment (fair value method)
(3,000)
––––– 6,750 NCI share of profits x 20% 1,350Sub's other comprehensive income per S's SCI
2,000
––––– 8,750 NCI share of total comprehensive income
x 20% 1,750
chapter 5
KAPLAN PUBLISHING 179

(W6) Parent's share of equity
(W7) NCI share of equity
B/f C/f (i.e. reporting date)
$ $Parent's equity 156,000 170,000PUP (P is seller) (W4) (500)Sub: P% x post acquisition reserves
(80% x 13,000 (W2)) 10,400(80% x 23,750 (W2)) 19,000Impairment loss (80% x 3,000)
(2,400)
––––––– ––––––– 166,400 186,100 ––––––– –––––––
B/f C/f (i.e. reporting date)
$ $NCI at acqn at fair value 23,000 23,000NCI% x post acquisition reserves
(20% x 13,000 (W2)) 2,600(20% x 23,750 (W2)) 4,750NCI% x impairment loss (20% x 3,000)
(600)
––––– ––––– 25,600
––––– 27,150 –––––
Consolidated statement of comprehensive income and statement of changes in equity
180 KAPLAN PUBLISHING

Consolidated statement of financial position
Consolidated statement of comprehensive income
$000Noncurrent assets
Property, plant and equipment (1,000 + 400 + 20 (W2)) 1,420Goodwill (W3) 180
Current assets (300 + 600 6 (W6) 3 (W6) 891 –––– 2,491 –––– Equity Share capital 250Retained earnings (W5) 1,237Other components of equity 260 –––– 1,747Noncontrolling interest (W4) 310 –––– 2,057Noncurrent liabilities (100 + 90) 190 Current liabilities (190 + 60 6 (W6)) 244 –––– 2,491 ––––
$000Revenue (1,000 + 260 40 (W6)) 1,220Cost of sales (750 + 80 40 (W6) + 3 (W6)) (793)
––––– Gross profit 427Operating expenses (60 + 35) (95)
––––– Profit from operations 332Investment income (24 (70% x 20)) 10Finance costs (25 + 15) (40) ––––– Profit before tax 302Taxation (109 + 30) (139)
––––– Profit for the year 163
chapter 5
KAPLAN PUBLISHING 181
Test your understanding 9 Papilla and Satago
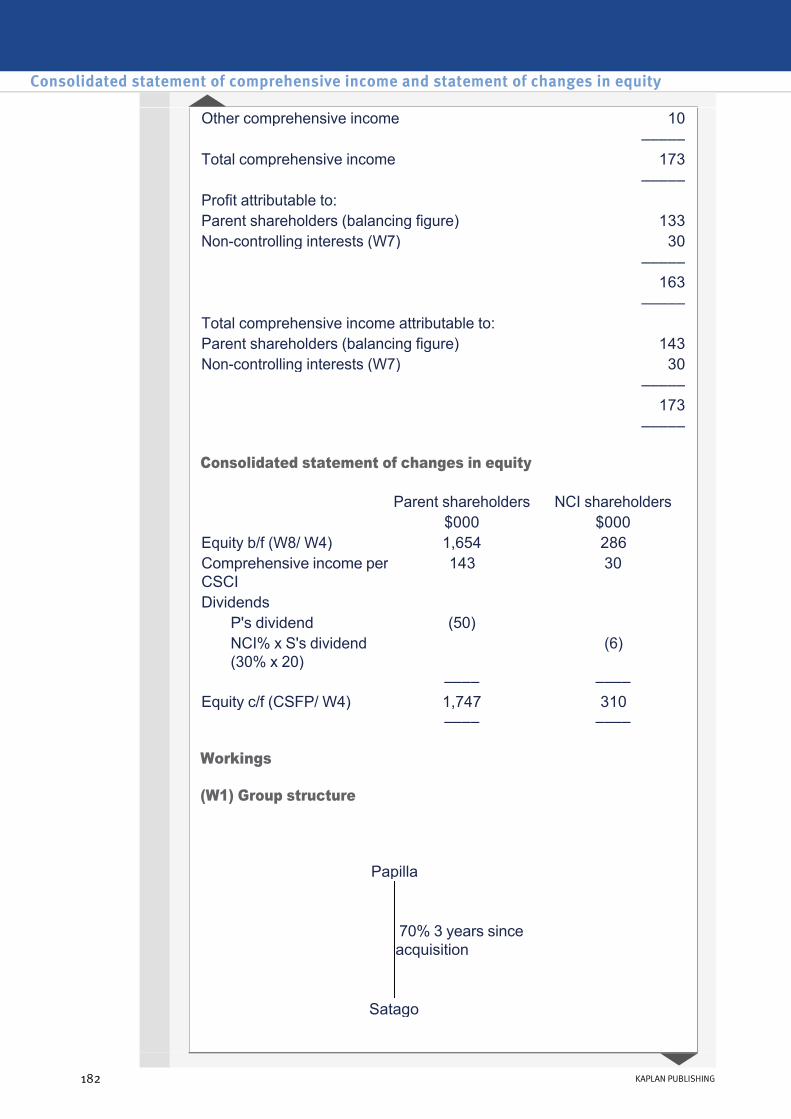
Consolidated statement of changes in equity
Workings
(W1) Group structure
Other comprehensive income 10 ––––– Total comprehensive income 173 ––––– Profit attributable to:Parent shareholders (balancing figure) 133Noncontrolling interests (W7) 30
––––– 163 ––––– Total comprehensive income attributable to: Parent shareholders (balancing figure) 143Noncontrolling interests (W7) 30 ––––– 173 –––––
Parent shareholders NCI shareholders $000 $000
Equity b/f (W8/ W4) 1,654 286Comprehensive income per CSCI
143 30
Dividends P's dividend (50) NCI% x S's dividend (30% x 20)
(6)
–––– ––––Equity c/f (CSFP/ W4) 1,747 310 –––– ––––
Papilla 70% 3 years since acquisition
Satago
Consolidated statement of comprehensive income and statement of changes in equity
182 KAPLAN PUBLISHING
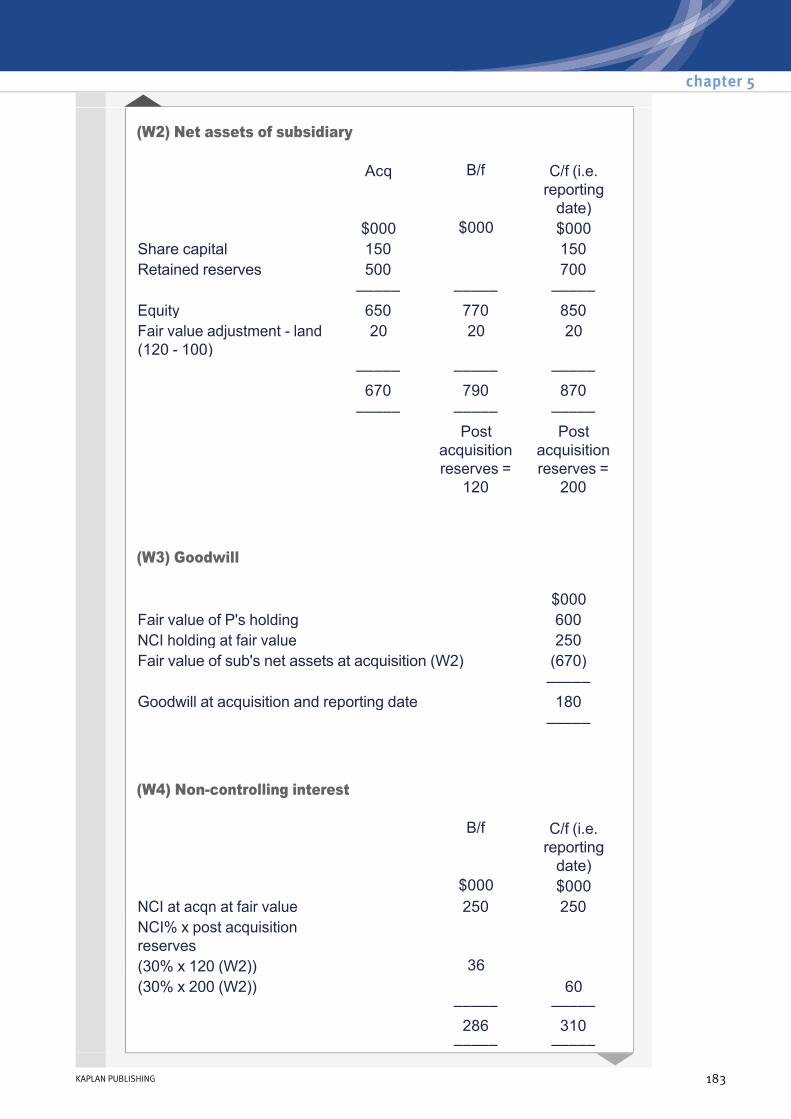
(W2) Net assets of subsidiary
(W3) Goodwill
(W4) Noncontrolling interest
Acq B/f C/f (i.e. reporting date)
$000 $000 $000Share capital 150 150Retained reserves 500 700 ––––– ––––– ––––– Equity 650 770 850Fair value adjustment land (120 100)
20 20 20
––––– ––––– ––––– 670 790 870 ––––– ––––– ––––– Post
acquisition reserves =
120
Post acquisition reserves =
200
$000Fair value of P's holding 600NCI holding at fair value 250Fair value of sub's net assets at acquisition (W2) (670) ––––– Goodwill at acquisition and reporting date 180 –––––
B/f C/f (i.e. reporting date)
$000 $000NCI at acqn at fair value 250 250NCI% x post acquisition reserves
(30% x 120 (W2)) 36(30% x 200 (W2))
––––– 60
––––– 286
––––– 310 –––––
chapter 5
KAPLAN PUBLISHING 183

(W5) Retained earnings
(W6) Intercompany sales and PUP
Intercompany sales of $40,000 to be eliminated by reducing both revenue and cost of sales.
Intercompany balance of $6,000 to be eliminated from current assets and current liabilities.
PUP adjustment to increase cost of sales:
Goods in inventory = 45% x 40,000 = $18,000
Profit in inventory = 20/120 x $18,000 = $3,000
Parent is the seller so eliminate from W5 and current assets and increase cost of sales.
(W7) NCI share of profit and total comprehensive income
(W8) Parent's share of equity b/f
$000P's retained earnings 1,100PUP (W6) (3)Sub: P% x post acquisition reserves
(70% x 200 (W2)) 140 –––––
1,237 –––––
$ $Sub's profit and total comprehensive income for the year per S's SCI
100
NCI share of profits x 30% 30
$000Parent's equity b/f 1,570Sub: P% x post acquisition reserves
(70% x 120 (W2)) 84 ––––– 1,654 –––––
Consolidated statement of comprehensive income and statement of changes in equity
184 KAPLAN PUBLISHING

Consolidated statement of changes in equity
Workings
(W1) Group structure
(W2) Net assets of subsidiary
Parent shareholders NCI shareholders $ $
Equity b/f (W3/ W4) 317,400 40,600Comprehensive income (W5)
125,400 9,600
Dividends P's dividend (20,000) NCI% x S's dividend (20% x 10,000)
(2,000)
–––––– ––––––Equity c/f (W3/ W4) 422,800 48,200 –––––– ––––––
Penguin
80% 1 April 20X7 i.e. 2 years since
acquisition Smarties
Acq B/f C/f (i.e. reporting date)
$ $ $Net assets = equity 125,000 180,000 220,000Fair value adjustment 40,000 40,000 40,000Depreciation adjustment (40,000 x 1/20) (2,000) (40,000 x 2/20) (4,000) ––––––– ––––––– –––––– 165,000 218,000 256,000 ––––––– ––––––– –––––– Post
acquisition reserves = 53,000
Post acquisition reserves = 91,000
chapter 5
KAPLAN PUBLISHING 185
Test your understanding 10 Penguin and Smarties
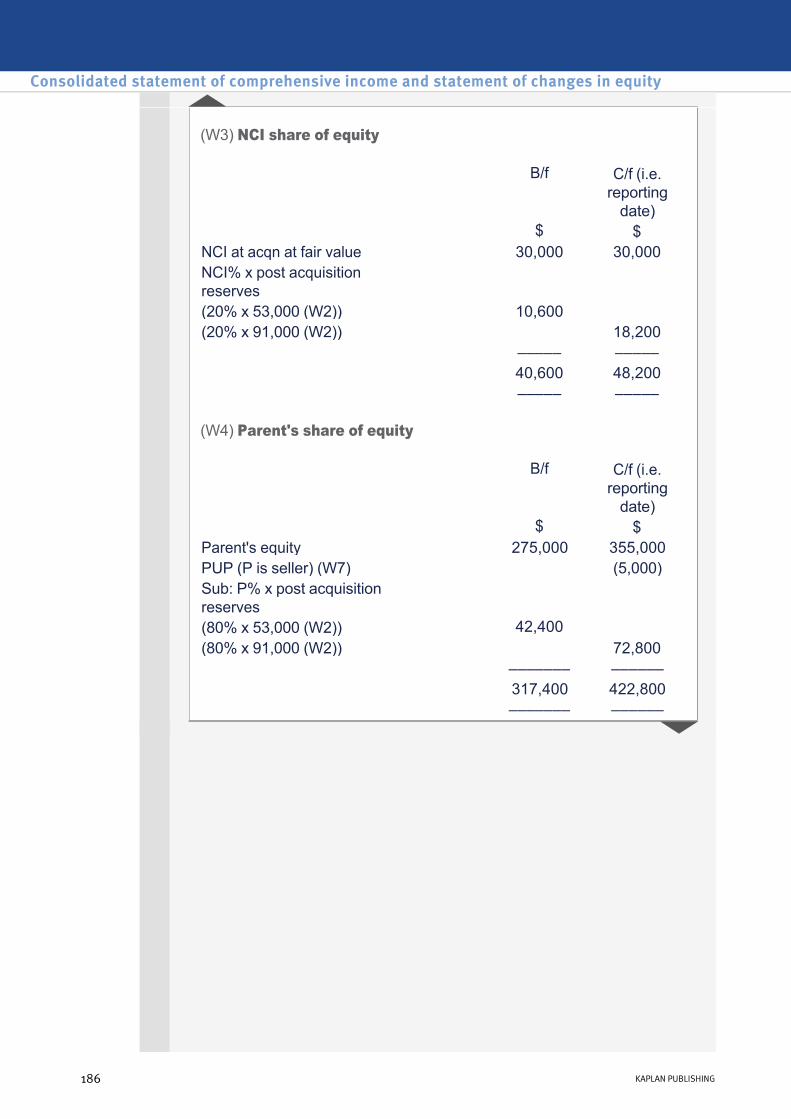
(W3) NCI share of equity
(W4) Parent's share of equity
B/f C/f (i.e. reporting date)
$ $NCI at acqn at fair value 30,000 30,000NCI% x post acquisition reserves
(20% x 53,000 (W2)) 10,600(20% x 91,000 (W2)) 18,200 ––––– ––––– 40,600 48,200 ––––– –––––
B/f C/f (i.e. reporting date)
$ $Parent's equity 275,000 355,000PUP (P is seller) (W7) (5,000)Sub: P% x post acquisition reserves
(80% x 53,000 (W2)) 42,400(80% x 91,000 (W2)) 72,800 ––––––– –––––– 317,400 422,800 ––––––– ––––––
Consolidated statement of comprehensive income and statement of changes in equity
186 KAPLAN PUBLISHING

(W5) Comprehensive income
(W6) NCI share of total comprehensive income
(W7) PUP
Profit in inventory = 25% x $20,000 = $5,000
(W8) Depreciation adjustment
Fair value adjustment = $40,000
Depreciation adjustment = 1/20 x $40,000 = $2,000 per annum
(W9) Intragroup dividend
Sub paid dividend $10,000
Parent received )80% x 10,000) $8,000
Will be eliminated from CSCI on consolidation.
$ –––––– Total comprehensive income (100,000 + 50,000 5,000 (W7) 2,000 (W8) 8,000 (W9))
135,000
–––––– Total comprehensive income attributable to: Parent shareholders (balancing figure) 125,400Noncontrolling interests (W6) 9,600 –––––– 135,000 ––––––
$ $Sub's total comprehensive income
50,000
Depreciation adjustment (W8)
(2,000)
––––– 48,000 NCI share of total comprehensive income
x 20% 9,600
chapter 5
KAPLAN PUBLISHING 187

Consolidated statement of comprehensive income and statement of changes in equity
188 KAPLAN PUBLISHING
Associates and joint venturesChapter learning objectives
On completion of their studies students should be able to:
• Prepare consolidated financial statements for a group of companies involving one or more subsidiaries and associates;
• Explain the accounting treatment of associates and joint ventures using the equity method and proportional consolidation method.
189
chapter
6
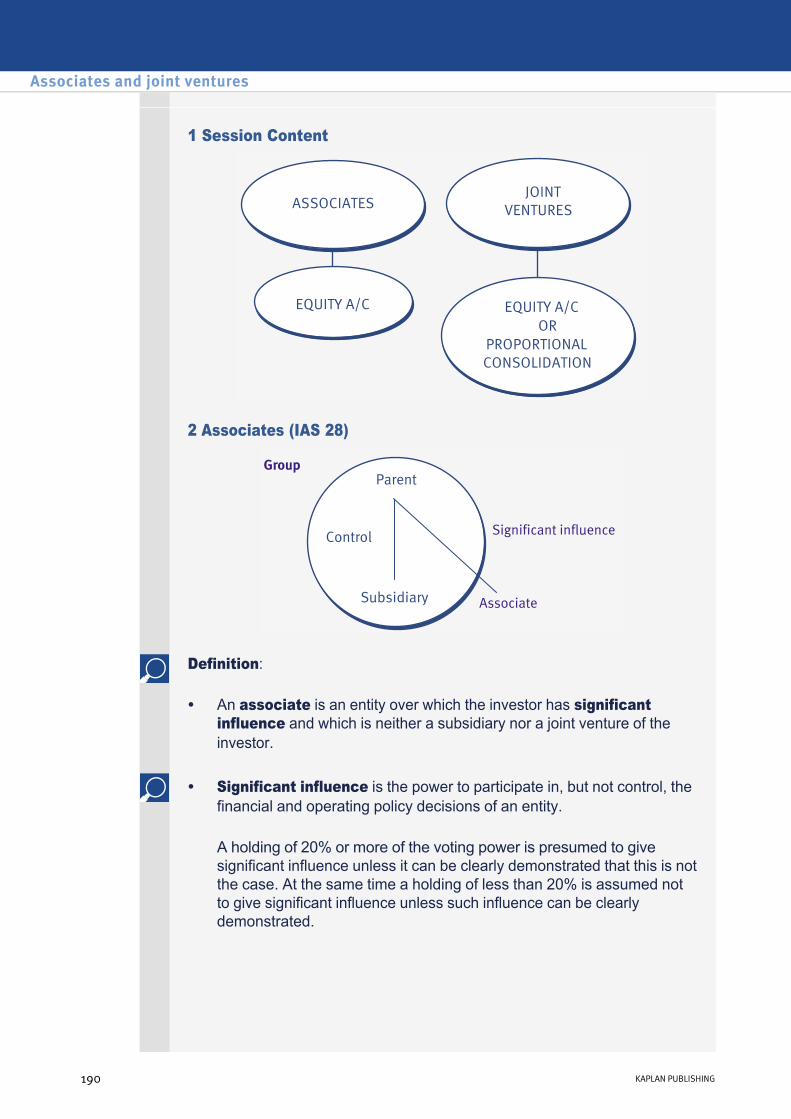
1 Session Content
2 Associates (IAS 28)
Definition:
• An associate is an entity over which the investor has significant influence and which is neither a subsidiary nor a joint venture of the investor.
A holding of 20% or more of the voting power is presumed to give significant influence unless it can be clearly demonstrated that this is not the case. At the same time a holding of less than 20% is assumed not to give significant influence unless such influence can be clearly demonstrated.
• Significant influence is the power to participate in, but not control, the financial and operating policy decisions of an entity.
Associates and joint ventures
190 KAPLAN PUBLISHING190 KAPLAN PUBLISHING
IAS 28 explains that an investor probably has significant influence if:
• It is represented on the board of directors.
• It participates in policymaking processes, including decisions about dividends or other distributions.
• There are material transactions between the investor and investee.
• There is interchange of managerial personnel.
• There is provision of essential technical information.
3 Accounting for associates
Associates are accounted for using equity accounting.
They are not consolidated as the parent does not have control.
Consolidated statement of financial position
The CSFP will include a single line within noncurrent assets called 'investment in associate' calculated as:
The above working would normally be set up as W6 within a consolidation question (W1 to W5 are as per Chapter 4).
The share of post acquisition reserves, impairment losses and PUP will also be recorded in W5 Retained earnings.
Investment in associate $Cost of investment XAdd: share of post acquisition reserves XLess: impairment losses (X)Less: PUP (if A has inventory – see later) (X)
___X___
chapter 6
KAPLAN PUBLISHING 191

Consolidated statement of comprehensive income
The CSCI will include a single line before profit before tax called “Income from Associate” calculated as:
If the associate has other comprehensive income, the investor’s share will also be recorded in the other comprehensive income section of CSCI.
Share of associate's profit for the year XLess: impairment loss (X)Less: PUP (if A is seller see later) (X) –– X ––
4 Adjustments with associatesFair value & depreciation adjustments
When calculating the postacquisition reserves for the associate, the effect of fair value adjustments should be included. The fair value adjustment may then result in a depreciation adjustment after acquisition. If such adjustments are in an exam question, it would then be advisable to prepare a W2 Net assets table in order to calculate the post acquisition reserves.
Intercompany transactions & balances
Intercompany transactions between the group (whether with the parent or subsidiary) and the associate are not eliminated within the CSCI or CSFP. This is because the associate is outside of the group. Thus the transactions / balances are with a third party to the group and so may be reported within the group financial statements.
However, unrealised profit on transactions must be eliminated on consolidation.
Provisions for unrealised profit (PUP)
IAS 28 requires unrealised profits on transactions between the group and the associate to be eliminated. Only the investor’s share of the profit is removed since the group financial statements only reflect the investor’s share of the associates profits in the first place.
The PUP adjustment is calculated as:
PUP = P% × unrealised profit in inventory
Associates and joint ventures
192 KAPLAN PUBLISHING
IAS 28 Investments in associates

Parent sells to associate
In the CSFP:
In the CSCI:
Associate sells to parent
In the CSFP:
In the CSCI:
• Reduce W5 retained earnings
• Reduce W6 investment in associate
• Increase cost of sales
• Reduce W5 retained earnings
• Reduce inventory
• Reduce income from associate
P owns 40% of the equity shares of A.
P has sold $200,000 of goods to A at a mark up on cost of 25%.
At the reporting date 60% of these items remain in A's inventory.
The intercompany sale of $200,000 is not eliminated in the consolidated financial statements. However a PUP adjustment is calculated as:
The adjustment will be:
In the CSCI, cost of sales will increase.
Goods in inventory 60% × $200,000 = $120,000
Profit in inventory 25/125 × $120,000 = $24,000
PUP 40% × $24,000 = $9,600
Dr Cost of sales $9,600
Cr Investment in associate $9,600
chapter 6
KAPLAN PUBLISHING 193
Illustration 1 Parent sells to associate

In the CSFP, retained earnings will therefore be reduced. The investment in Associate will also be reduced.
The associate is holding the inventory, but the associate’s inventory is not consolidated on the inventory line in the CSFP and so it is not appropriate to reduce inventory.
Using the same information as illustration 1, the adjustment will now be:
In the CSCI, income from associate will reduce.
In the CSFP, retained earnings will therefore be reduced. Inventory will also be reduced as it is the parent company holding the inventory.
Dr Income from associate $9,600
Cr Inventory $9,600
A parent company owns 25% of the equity shares of its associate. The parent made sales to the associate during the year amounting to $450,000. The sales price is cost plus 20%. At the reporting date, 30% of these items remain in the associate’s inventory.
Required: Identify the relevant adjustments to be made to the consolidated statement of financial position and consolidated statement of comprehensive income.
Associates and joint ventures
194 KAPLAN PUBLISHING
Illustration 2 Associate sells to parent
Test your understanding 1
Example 1 Tom, James and Emily
Example 1 answer

Below are the Statements of Financial Position of three entities as at 30 September 20X8:
P S A $000 $000 $000Noncurrent assets Property, plant & equipment 6,000 1,500 1,000Investments 1,800 – – ––––– ––––– –––––
7,800 1,500 1,000 Current assets 1,700 1,000 500 ––––– ––––– ––––– TOTAL ASSETS 9,500 2,500 1,500 ––––– ––––– ––––– EquityShare capital ($1 shares) 5,000 1,000 500Retained earnings 2,000 750 400 ––––– ––––– ––––– 7,000 1,750 900 Noncurrent liabilities 1,000 250 250 Current liabilities 1,500 500 350 ––––– ––––– ––––– TOTAL EQUITY & LIABILITIES 9,500 2,500 1,500 ––––– ––––– ––––– (1) P acquired 80% of the equity share capital of S several years ago,
paying $1.5 million in cash. At this time the balance on S’s retained earnings was $350,000.
(2) P’s group policy is to value NCIs at fair value at acquisition. The fair value of the NCI holding in S at acquisition was $350,000.
(3) P acquired 30% of the equity share capital of A on 1 October 20X7, paying $300,000 in cash. At 1 October 20X7 the balance on A’s retained earnings was $360,000.
(4) At the reporting date, it was determined that the investment in A was impaired by $5,000. No impairment losses had arisen in respect of the goodwill of S.
chapter 6
KAPLAN PUBLISHING 195
Test your understanding 2
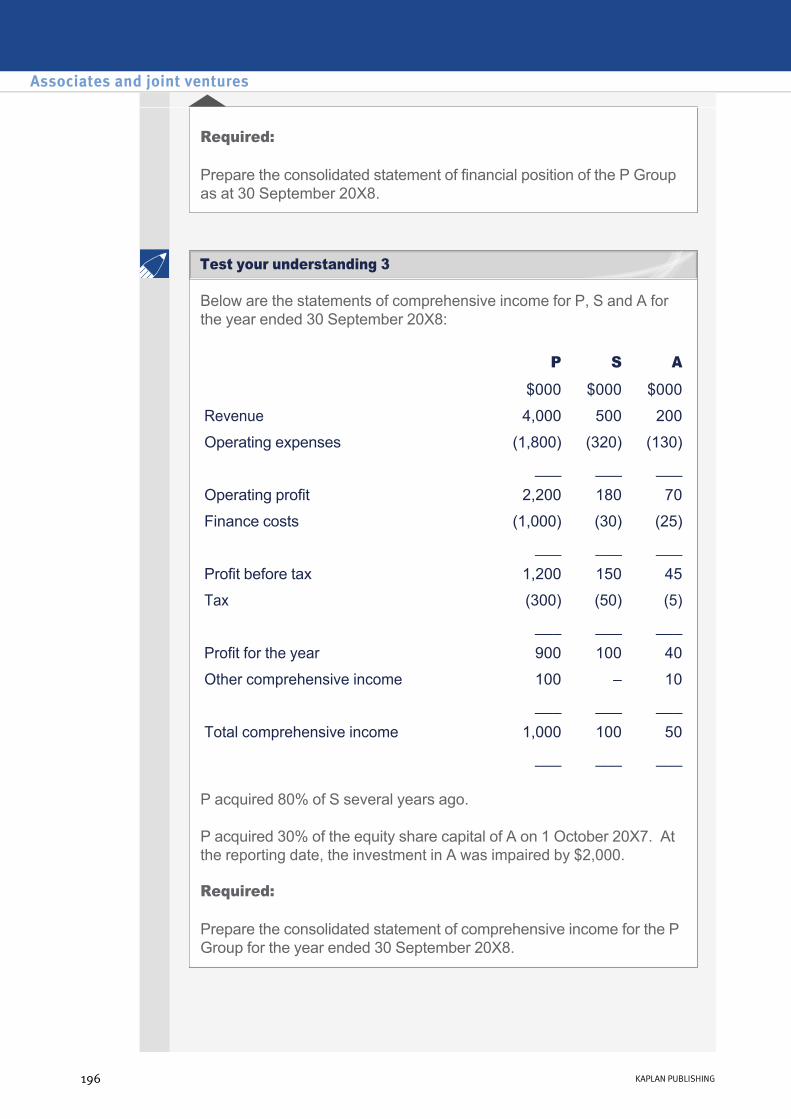
Required: Prepare the consolidated statement of financial position of the P Group as at 30 September 20X8.
Below are the statements of comprehensive income for P, S and A for the year ended 30 September 20X8:
P acquired 80% of S several years ago.
P acquired 30% of the equity share capital of A on 1 October 20X7. At the reporting date, the investment in A was impaired by $2,000.
Required:
Prepare the consolidated statement of comprehensive income for the P Group for the year ended 30 September 20X8.
P S A
$000 $000 $000
Revenue 4,000 500 200
Operating expenses (1,800) (320) (130)
___ ___ ___
Operating profit 2,200 180 70
Finance costs (1,000) (30) (25)
___ ___ ___
Profit before tax 1,200 150 45
Tax (300) (50) (5)
___ ___ ___
Profit for the year 900 100 40
Other comprehensive income 100 – 10 ___ ___ ___
Total comprehensive income 1,000 100 50 ___ ___ ___
Associates and joint ventures
196 KAPLAN PUBLISHING
Test your understanding 3
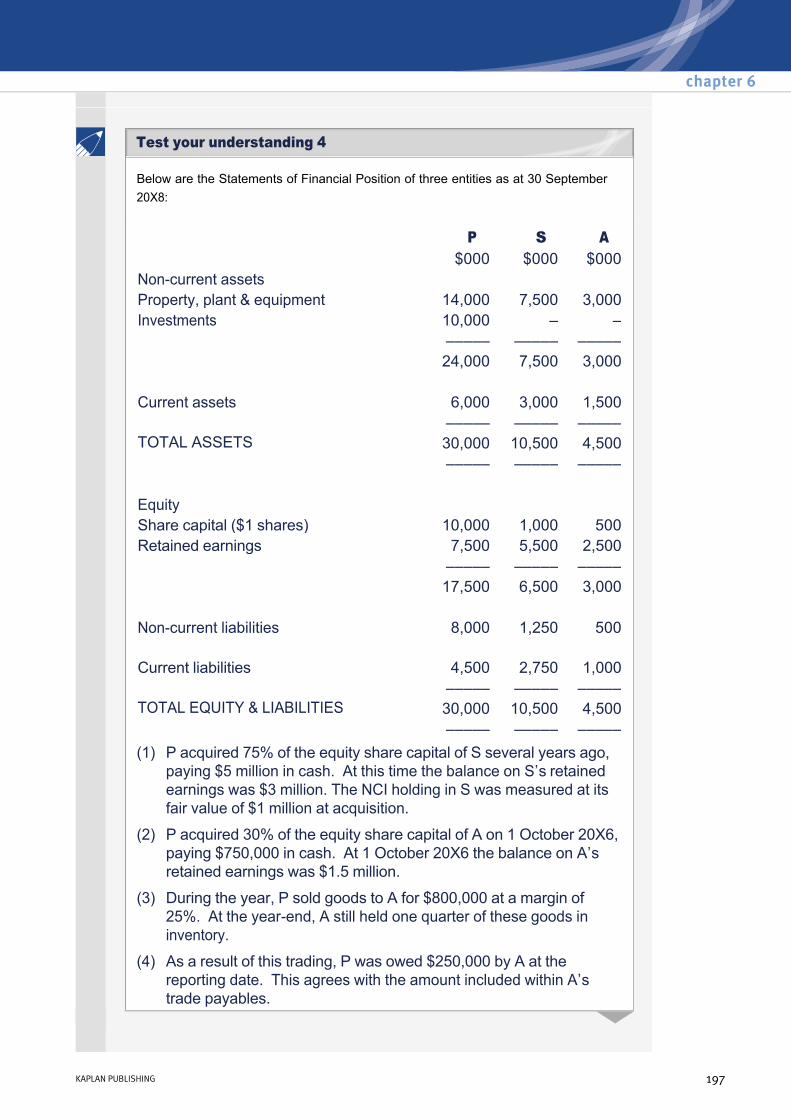
Below are the Statements of Financial Position of three entities as at 30 September 20X8:
P S A $000 $000 $000Noncurrent assets Property, plant & equipment 14,000 7,500 3,000Investments 10,000 – – ––––– ––––– –––––
24,000 7,500 3,000 Current assets 6,000 3,000 1,500 ––––– ––––– ––––– TOTAL ASSETS 30,000 10,500 4,500 ––––– ––––– ––––– EquityShare capital ($1 shares) 10,000 1,000 500Retained earnings 7,500 5,500 2,500 ––––– ––––– ––––– 17,500 6,500 3,000 Noncurrent liabilities 8,000 1,250 500 Current liabilities 4,500 2,750 1,000 ––––– ––––– ––––– TOTAL EQUITY & LIABILITIES 30,000 10,500 4,500 ––––– ––––– ––––– (1) P acquired 75% of the equity share capital of S several years ago,
paying $5 million in cash. At this time the balance on S’s retained earnings was $3 million. The NCI holding in S was measured at its fair value of $1 million at acquisition.
(2) P acquired 30% of the equity share capital of A on 1 October 20X6, paying $750,000 in cash. At 1 October 20X6 the balance on A’s retained earnings was $1.5 million.
(3) During the year, P sold goods to A for $800,000 at a margin of 25%. At the yearend, A still held one quarter of these goods in inventory.
(4) As a result of this trading, P was owed $250,000 by A at the reporting date. This agrees with the amount included within A’s trade payables.
chapter 6
KAPLAN PUBLISHING 197
Test your understanding 4

Required: Prepare the consolidated statement of financial position of the P Group as at 30 September 20X8.
(5) At 30 September 20X8, it was determined that the investment in the associate was impaired by $35,000.
Below are the statements of comprehensive income for P, S and A for the year ended 30 September 20X8:
P acquired 80% of S several years ago.
P acquired 30% of the equity share capital of A on 1 October 20X6.
During the year, A sold goods to P for $600,000 at a margin of 20%. At the yearend, P still held one quarter of these goods in inventory.
At 30 September 20X8, it was determined that an impairment loss of $20,000 had arisen in respect of the investment in A.
P S A
$000 $000 $000
Revenue 8,000 4,500 3,000
Operating expenses (4,750) (2,700) (2,050)
___ ___ ___
Operating profit 3,250 1,800 950
Finance costs (750) (100) (50)
___ ___ ___
Profit before tax 2,500 1,700 900
Tax (700) (500) (300)
___ ___ ___
Profit for the year 1,800 1,200 600
Other comprehensive income 200 – 250 ___ ___ ___
Total comprehensive income 2,000 1,200 850 ___ ___ ___
Associates and joint ventures
198 KAPLAN PUBLISHING
Test your understanding 5
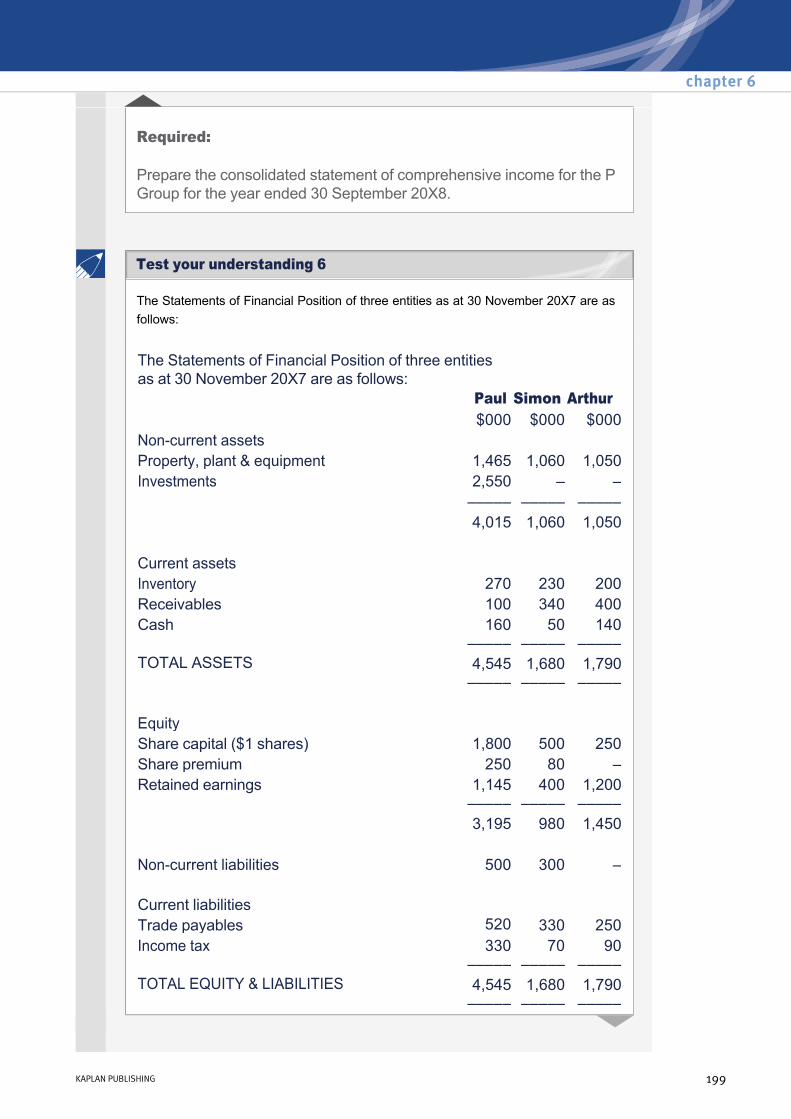
Required:
Prepare the consolidated statement of comprehensive income for the P Group for the year ended 30 September 20X8.
The Statements of Financial Position of three entities as at 30 November 20X7 are as follows:
The Statements of Financial Position of three entities as at 30 November 20X7 are as follows:
Paul Simon Arthur $000 $000 $000Noncurrent assets Property, plant & equipment 1,465 1,060 1,050Investments 2,550 – – ––––– ––––– –––––
4,015 1,060 1,050 Current assetsInventory 270 230 200Receivables 100 340 400Cash 160
––––– 50
––––– 140
––––– TOTAL ASSETS 4,545
––––– 1,680 –––––
1,790 –––––
EquityShare capital ($1 shares) 1,800 500 250Share premium 250 80 – Retained earnings 1,145
––––– 400
––––– 1,200 –––––
3,195 980 1,450 Noncurrent liabilities 500 300 – Current liabilities Trade payables 520 330 250Income tax 330
––––– 70
––––– 90
––––– TOTAL EQUITY & LIABILITIES 4,545
––––– 1,680 –––––
1,790 –––––
chapter 6
KAPLAN PUBLISHING 199
Test your understanding 6
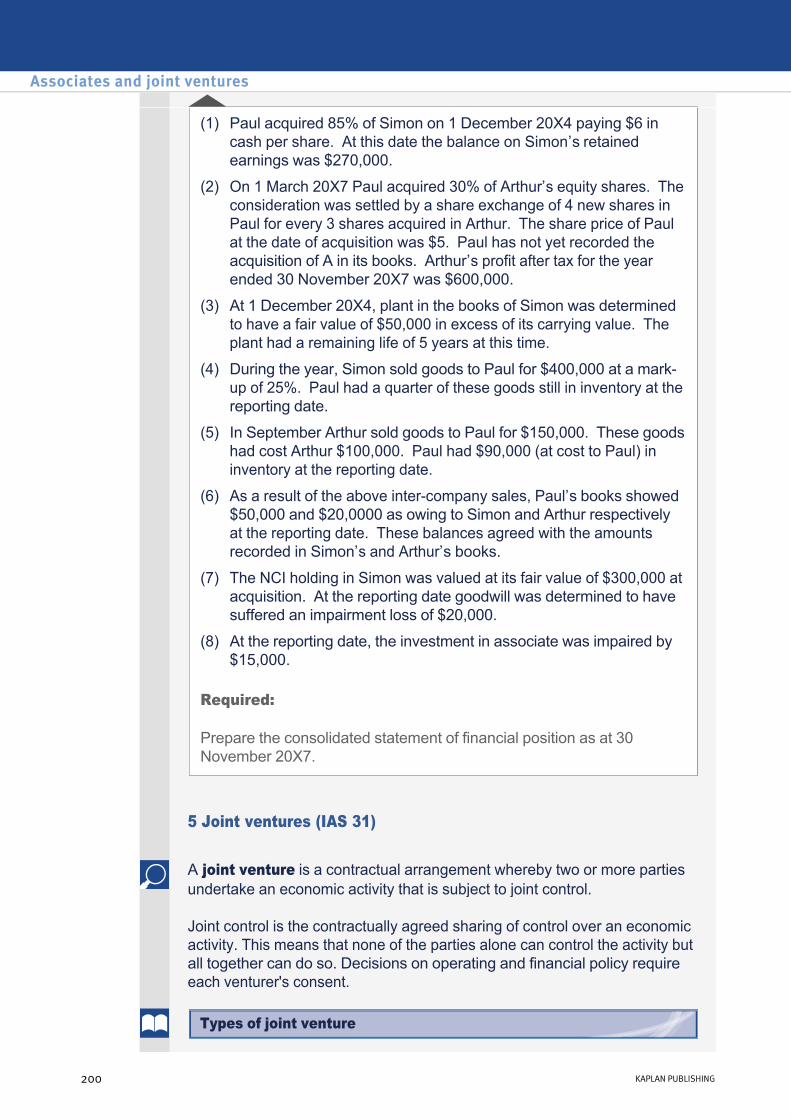
Required: Prepare the consolidated statement of financial position as at 30 November 20X7.
(1) Paul acquired 85% of Simon on 1 December 20X4 paying $6 in cash per share. At this date the balance on Simon’s retained earnings was $270,000.
(2) On 1 March 20X7 Paul acquired 30% of Arthur’s equity shares. The consideration was settled by a share exchange of 4 new shares in Paul for every 3 shares acquired in Arthur. The share price of Paul at the date of acquisition was $5. Paul has not yet recorded the acquisition of A in its books. Arthur’s profit after tax for the year ended 30 November 20X7 was $600,000.
(3) At 1 December 20X4, plant in the books of Simon was determined to have a fair value of $50,000 in excess of its carrying value. The plant had a remaining life of 5 years at this time.
(4) During the year, Simon sold goods to Paul for $400,000 at a markup of 25%. Paul had a quarter of these goods still in inventory at the reporting date.
(5) In September Arthur sold goods to Paul for $150,000. These goods had cost Arthur $100,000. Paul had $90,000 (at cost to Paul) in inventory at the reporting date.
(6) As a result of the above intercompany sales, Paul’s books showed $50,000 and $20,0000 as owing to Simon and Arthur respectively at the reporting date. These balances agreed with the amounts recorded in Simon’s and Arthur’s books.
(7) The NCI holding in Simon was valued at its fair value of $300,000 at acquisition. At the reporting date goodwill was determined to have suffered an impairment loss of $20,000.
(8) At the reporting date, the investment in associate was impaired by $15,000.
5 Joint ventures (IAS 31)
A joint venture is a contractual arrangement whereby two or more parties undertake an economic activity that is subject to joint control.
Joint control is the contractually agreed sharing of control over an economic activity. This means that none of the parties alone can control the activity but all together can do so. Decisions on operating and financial policy require each venturer's consent.
Associates and joint ventures
200 KAPLAN PUBLISHING
Types of joint venture
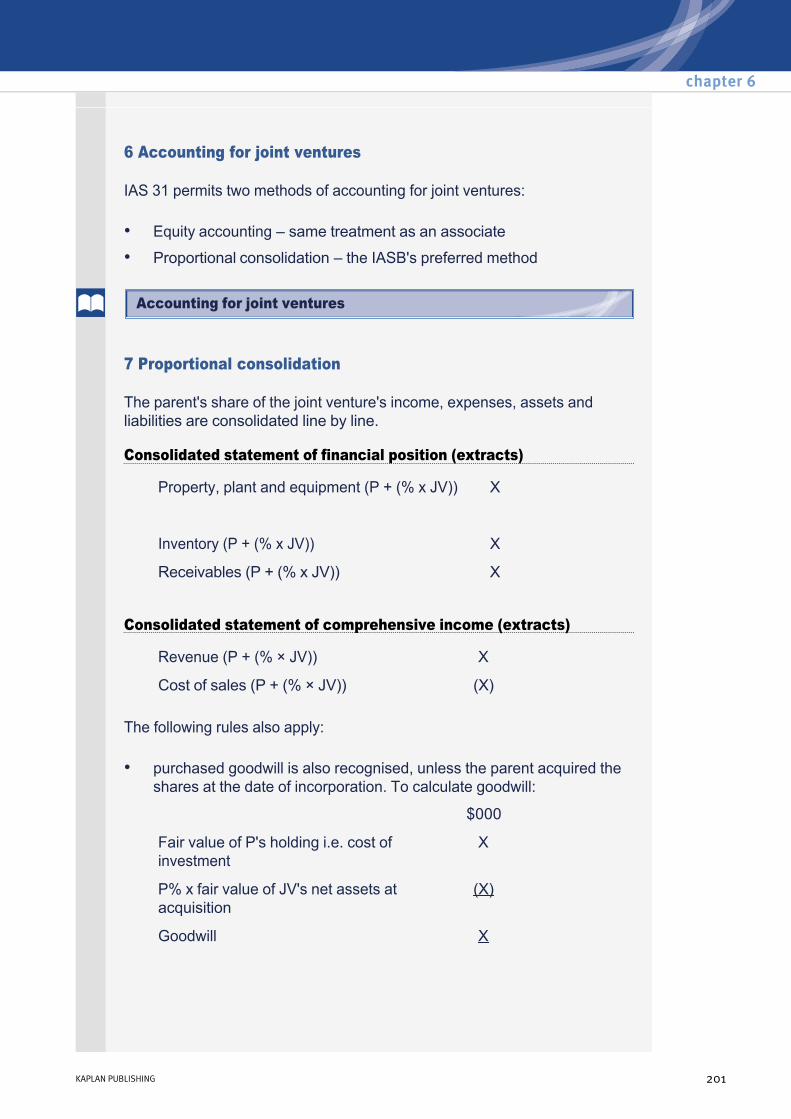
6 Accounting for joint ventures
IAS 31 permits two methods of accounting for joint ventures:
• Equity accounting – same treatment as an associate
• Proportional consolidation – the IASB's preferred method
7 Proportional consolidation
The parent's share of the joint venture's income, expenses, assets and liabilities are consolidated line by line.
Consolidated statement of financial position (extracts)
Consolidated statement of comprehensive income (extracts)
The following rules also apply:
Property, plant and equipment (P + (% x JV)) X
Inventory (P + (% x JV)) X
Receivables (P + (% x JV)) X
Revenue (P + (% × JV)) X
Cost of sales (P + (% × JV)) (X)
• purchased goodwill is also recognised, unless the parent acquired the shares at the date of incorporation. To calculate goodwill:
$000
Fair value of P's holding i.e. cost of investment
X
P% x fair value of JV's net assets at acquisition
(X)
Goodwill X
chapter 6
KAPLAN PUBLISHING 201
Accounting for joint ventures
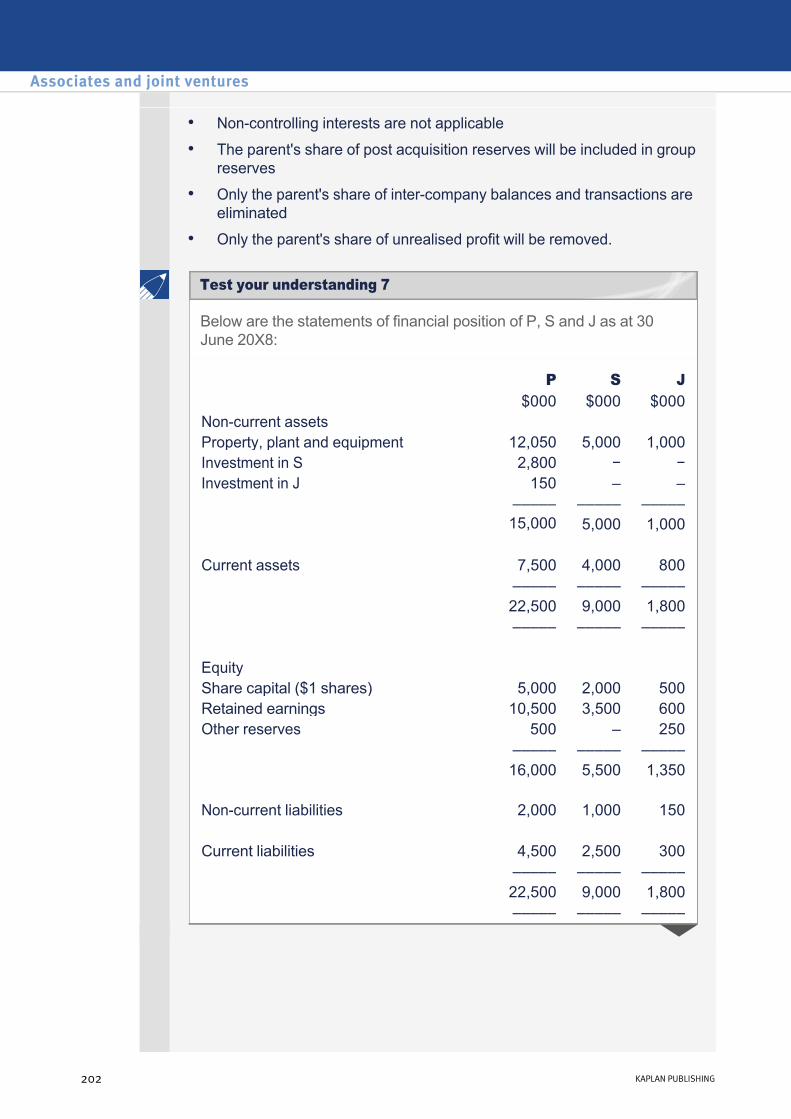
• Noncontrolling interests are not applicable
• The parent's share of post acquisition reserves will be included in group reserves
• Only the parent's share of intercompany balances and transactions are eliminated
• Only the parent's share of unrealised profit will be removed.
Below are the statements of financial position of P, S and J as at 30 June 20X8:
P S J $000 $000 $000
Noncurrent assets Property, plant and equipment 12,050 5,000 1,000Investment in S 2,800 − −Investment in J 150 – – ––––– ––––– –––––
15,000 5,000 1,000
Current assets 7,500 4,000 800 ––––– ––––– ––––– 22,500 9,000 1,800 ––––– ––––– ––––– Equity Share capital ($1 shares) 5,000 2,000 500Retained earnings 10,500 3,500 600Other reserves 500 – 250 ––––– ––––– ––––– 16,000 5,500 1,350 Noncurrent liabilities 2,000 1,000 150
Current liabilities 4,500 2,500 300 ––––– ––––– ––––– 22,500 9,000 1,800
––––– ––––– –––––
Associates and joint ventures
202 KAPLAN PUBLISHING
Test your understanding 7
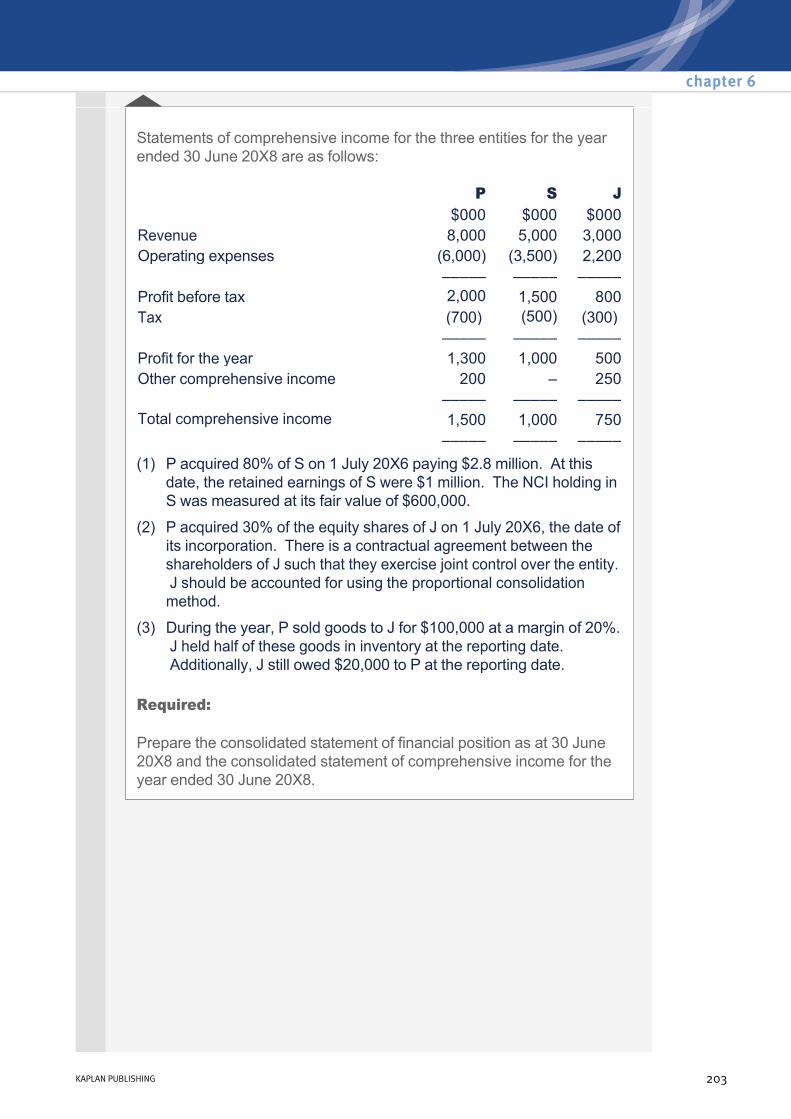
Statements of comprehensive income for the three entities for the year ended 30 June 20X8 are as follows:
Required:
Prepare the consolidated statement of financial position as at 30 June 20X8 and the consolidated statement of comprehensive income for the year ended 30 June 20X8.
P S J $000 $000 $000
Revenue 8,000 5,000 3,000Operating expenses (6,000) (3,500) 2,200 ––––– ––––– ––––– Profit before tax 2,000 1,500 800Tax (700) (500) (300) ––––– ––––– ––––– Profit for the year 1,300 1,000 500Other comprehensive income 200 – 250 ––––– ––––– ––––– Total comprehensive income 1,500 1,000 750 ––––– ––––– ––––– (1) P acquired 80% of S on 1 July 20X6 paying $2.8 million. At this
date, the retained earnings of S were $1 million. The NCI holding in S was measured at its fair value of $600,000.
(2) P acquired 30% of the equity shares of J on 1 July 20X6, the date of its incorporation. There is a contractual agreement between the shareholders of J such that they exercise joint control over the entity. J should be accounted for using the proportional consolidation method.
(3) During the year, P sold goods to J for $100,000 at a margin of 20%. J held half of these goods in inventory at the reporting date. Additionally, J still owed $20,000 to P at the reporting date.
chapter 6
KAPLAN PUBLISHING 203
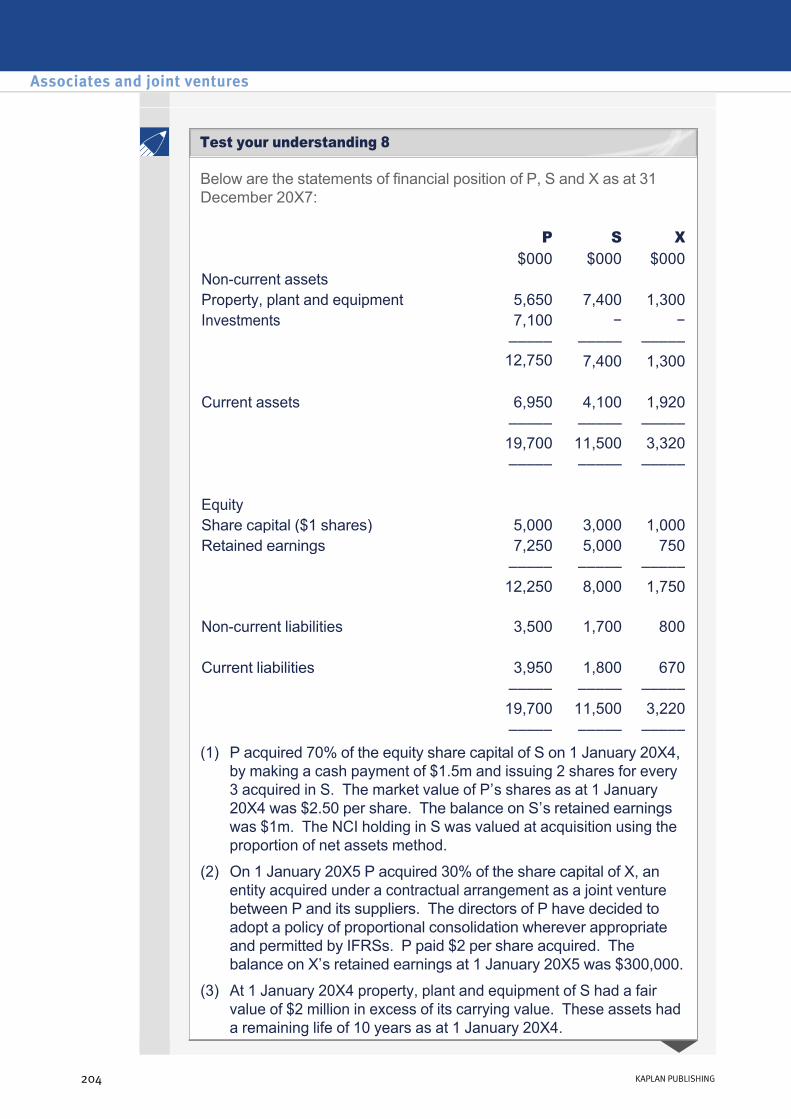
Below are the statements of financial position of P, S and X as at 31 December 20X7:
P S X $000 $000 $000
Noncurrent assets Property, plant and equipment 5,650 7,400 1,300Investments 7,100 − − ––––– ––––– –––––
12,750 7,400 1,300
Current assets 6,950 4,100 1,920 ––––– ––––– ––––– 19,700 11,500 3,320 ––––– ––––– ––––– Equity Share capital ($1 shares) 5,000 3,000 1,000Retained earnings 7,250 5,000 750 ––––– ––––– ––––– 12,250 8,000 1,750 Noncurrent liabilities 3,500 1,700 800
Current liabilities 3,950 1,800 670 ––––– ––––– ––––– 19,700 11,500 3,220
––––– ––––– ––––– (1) P acquired 70% of the equity share capital of S on 1 January 20X4,
by making a cash payment of $1.5m and issuing 2 shares for every 3 acquired in S. The market value of P’s shares as at 1 January 20X4 was $2.50 per share. The balance on S’s retained earnings was $1m. The NCI holding in S was valued at acquisition using the proportion of net assets method.
(2) On 1 January 20X5 P acquired 30% of the share capital of X, an entity acquired under a contractual arrangement as a joint venture between P and its suppliers. The directors of P have decided to adopt a policy of proportional consolidation wherever appropriate and permitted by IFRSs. P paid $2 per share acquired. The balance on X’s retained earnings at 1 January 20X5 was $300,000.
(3) At 1 January 20X4 property, plant and equipment of S had a fair value of $2 million in excess of its carrying value. These assets had a remaining life of 10 years as at 1 January 20X4.
Associates and joint ventures
204 KAPLAN PUBLISHING
Test your understanding 8

Required:
Prepare the consolidated statement of financial position as at 31 December 20X7.
(4) During the year, P sold goods to both S and X at a mark up of 20%. The values held in inventory at the reporting date were $360,000 held by S and $240,000 held by X. Furthermore, P’s receivables at the reporting date showed $250,000 and $100,000 as owing from S and X respectively. These amounts agreed with the payables balances reported in S’s and X’s books.
chapter 6
KAPLAN PUBLISHING 205
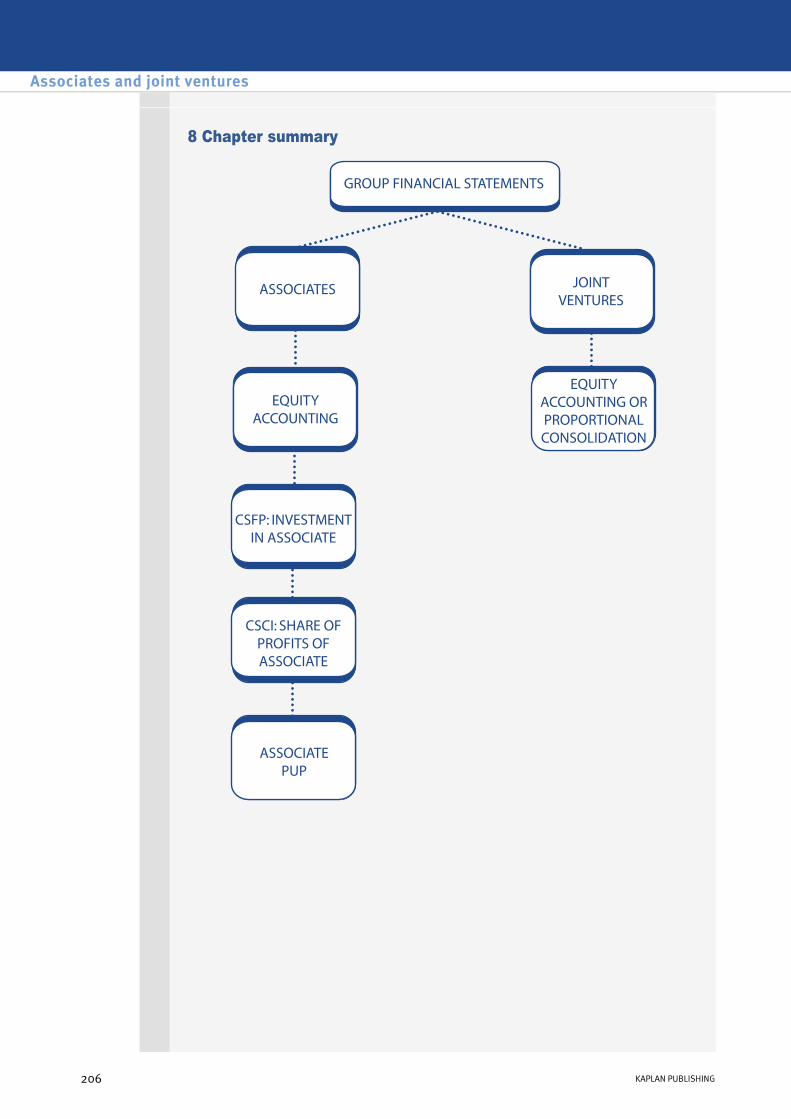
8 Chapter summary
Associates and joint ventures
206 KAPLAN PUBLISHING
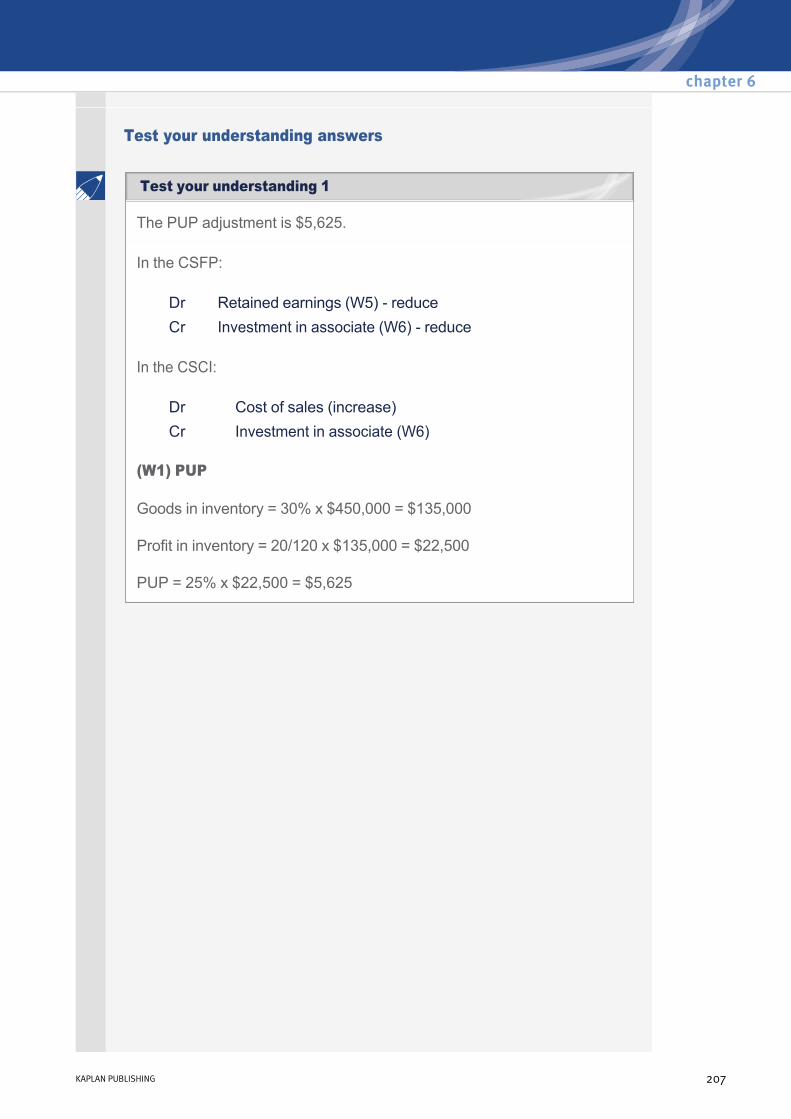
Test your understanding answers
The PUP adjustment is $5,625.
In the CSFP:
In the CSCI:
(W1) PUP
Goods in inventory = 30% x $450,000 = $135,000
Profit in inventory = 20/120 x $135,000 = $22,500
PUP = 25% x $22,500 = $5,625
Dr Retained earnings (W5) reduce Cr Investment in associate (W6) reduce
Dr Cost of sales (increase) Cr Investment in associate (W6)
chapter 6
KAPLAN PUBLISHING 207
Test your understanding 1
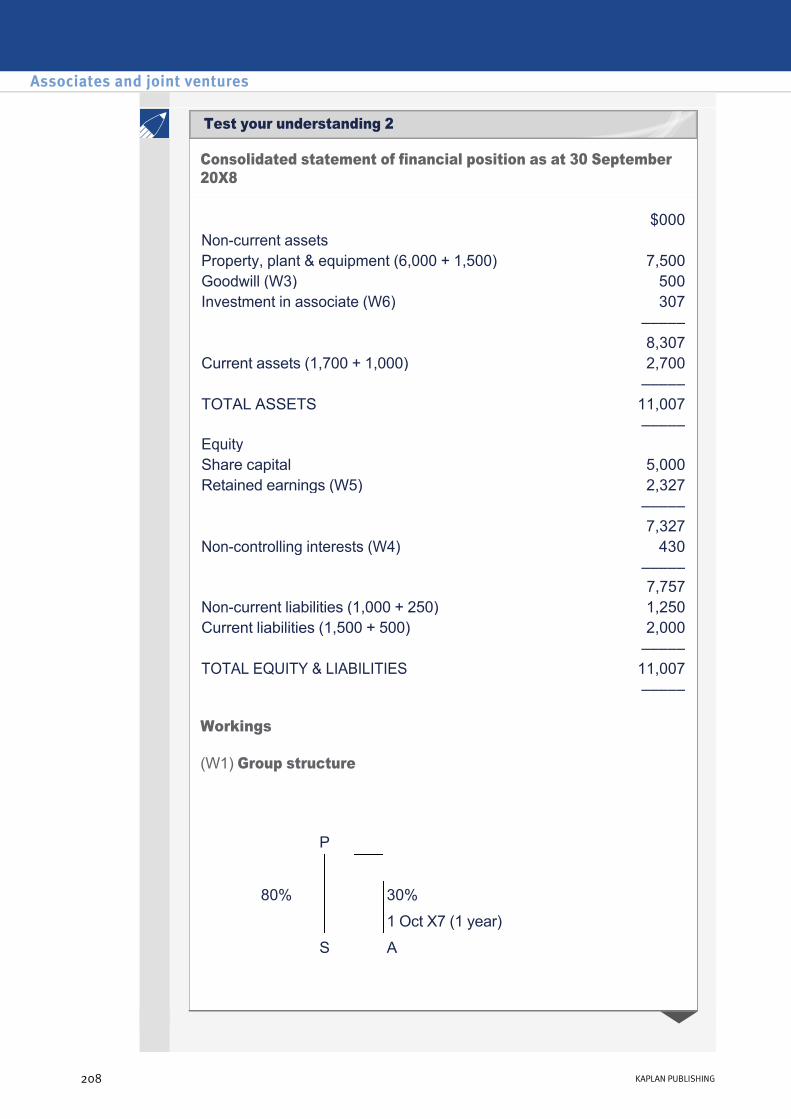
Consolidated statement of financial position as at 30 September 20X8
Workings
(W1) Group structure
$000Noncurrent assets Property, plant & equipment (6,000 + 1,500) 7,500Goodwill (W3) 500Investment in associate (W6) 307 ––––– 8,307Current assets (1,700 + 1,000) 2,700 ––––– TOTAL ASSETS 11,007 ––––– Equity Share capital 5,000Retained earnings (W5) 2,327 ––––– 7,327Noncontrolling interests (W4) 430 ––––– 7,757Noncurrent liabilities (1,000 + 250) 1,250Current liabilities (1,500 + 500) 2,000 ––––– TOTAL EQUITY & LIABILITIES 11,007 –––––
P
80% 30% 1 Oct X7 (1 year)
S A
Associates and joint ventures
208 KAPLAN PUBLISHING
Test your understanding 2
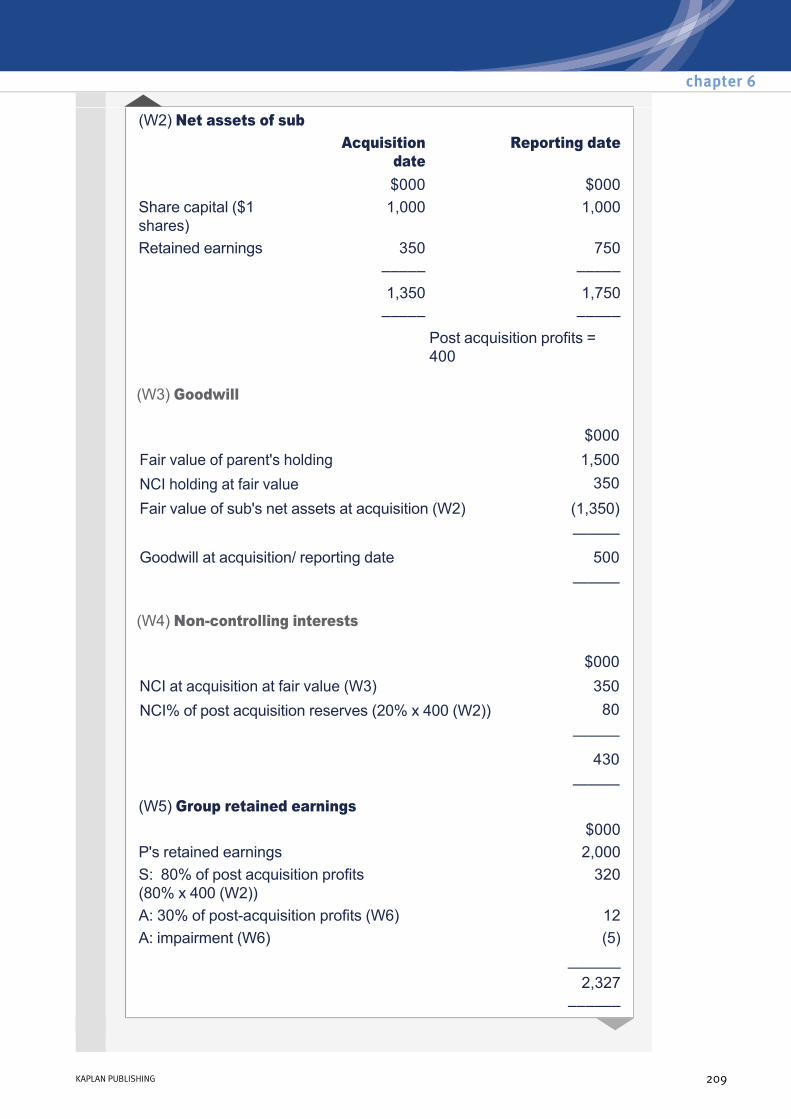
(W3) Goodwill
(W4) Noncontrolling interests
(W2) Net assets of sub Acquisition
date Reporting date
$000 $000Share capital ($1 shares)
1,000 1,000
Retained earnings 350 750––––– ––––– 1,350 1,750––––– –––––
Post acquisition profits = 400
$000Fair value of parent's holding 1,500NCI holding at fair value 350Fair value of sub's net assets at acquisition (W2) (1,350)
——— Goodwill at acquisition/ reporting date 500 ———
$000NCI at acquisition at fair value (W3) 350NCI% of post acquisition reserves (20% x 400 (W2)) 80
——— 430 ——— (W5) Group retained earnings
$000P's retained earnings 2,000S: 80% of post acquisition profits (80% x 400 (W2))
320
A: 30% of postacquisition profits (W6) 12A: impairment (W6) (5)
______2,327
––––––
chapter 6
KAPLAN PUBLISHING 209
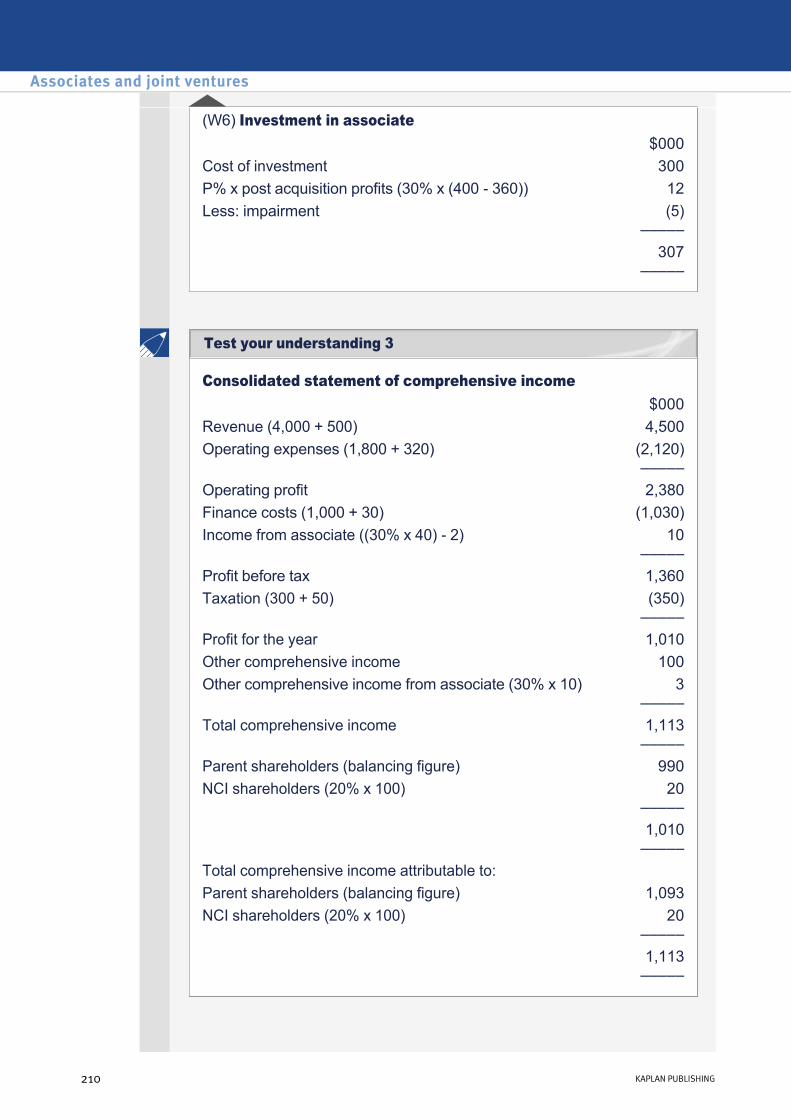
(W6) Investment in associate $000
Cost of investment 300P% x post acquisition profits (30% x (400 360)) 12Less: impairment (5)
––––– 307
–––––
Consolidated statement of comprehensive income $000Revenue (4,000 + 500) 4,500Operating expenses (1,800 + 320) (2,120)
––––– Operating profit 2,380Finance costs (1,000 + 30) (1,030)Income from associate ((30% x 40) 2) 10
––––– Profit before tax 1,360Taxation (300 + 50) (350)
––––– Profit for the year 1,010Other comprehensive income 100Other comprehensive income from associate (30% x 10) 3
––––– Total comprehensive income 1,113
––––– Parent shareholders (balancing figure) 990NCI shareholders (20% x 100) 20
––––– 1,010
––––– Total comprehensive income attributable to: Parent shareholders (balancing figure) 1,093NCI shareholders (20% x 100) 20
––––– 1,113
–––––
Associates and joint ventures
210 KAPLAN PUBLISHING
Test your understanding 3
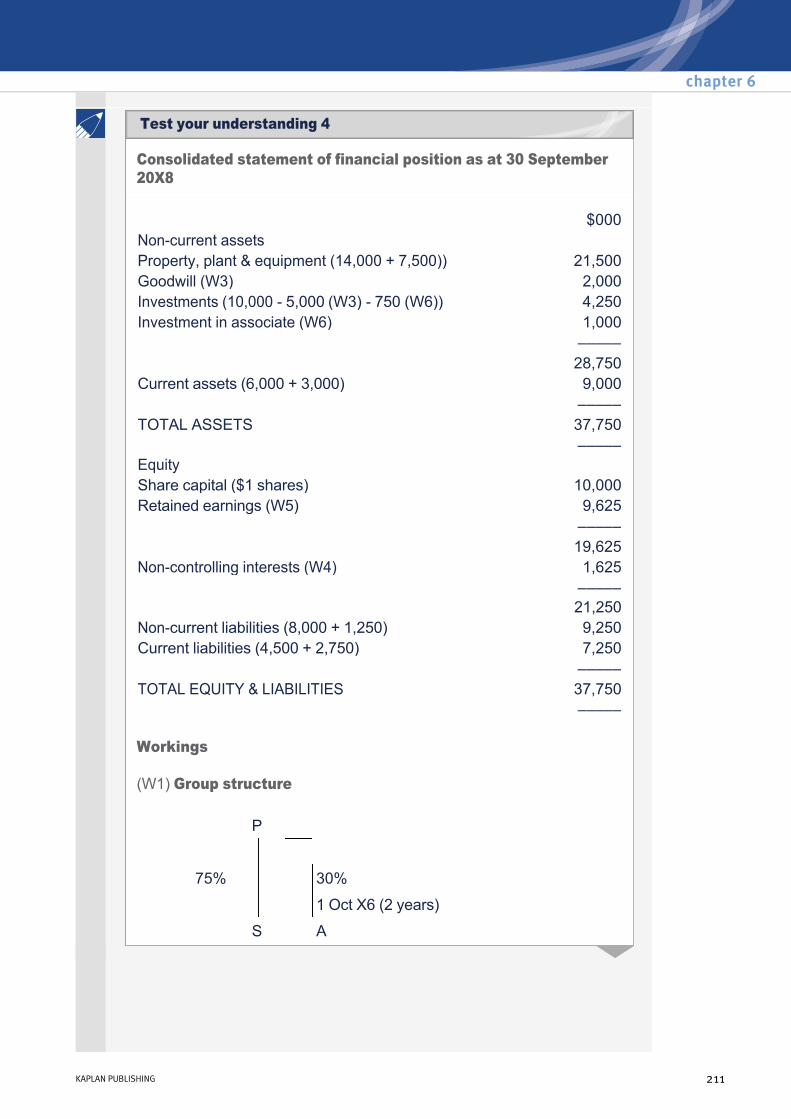
Consolidated statement of financial position as at 30 September 20X8
Workings
(W1) Group structure
$000Noncurrent assets Property, plant & equipment (14,000 + 7,500)) 21,500Goodwill (W3) 2,000Investments (10,000 5,000 (W3) 750 (W6)) 4,250Investment in associate (W6) 1,000 ––––– 28,750Current assets (6,000 + 3,000) 9,000 ––––– TOTAL ASSETS 37,750 ––––– Equity Share capital ($1 shares) 10,000Retained earnings (W5) 9,625 ––––– 19,625Noncontrolling interests (W4) 1,625 ––––– 21,250Noncurrent liabilities (8,000 + 1,250) 9,250Current liabilities (4,500 + 2,750) 7,250 ––––– TOTAL EQUITY & LIABILITIES 37,750 –––––
P
75% 30% 1 Oct X6 (2 years)
S A
chapter 6
KAPLAN PUBLISHING 211
Test your understanding 4
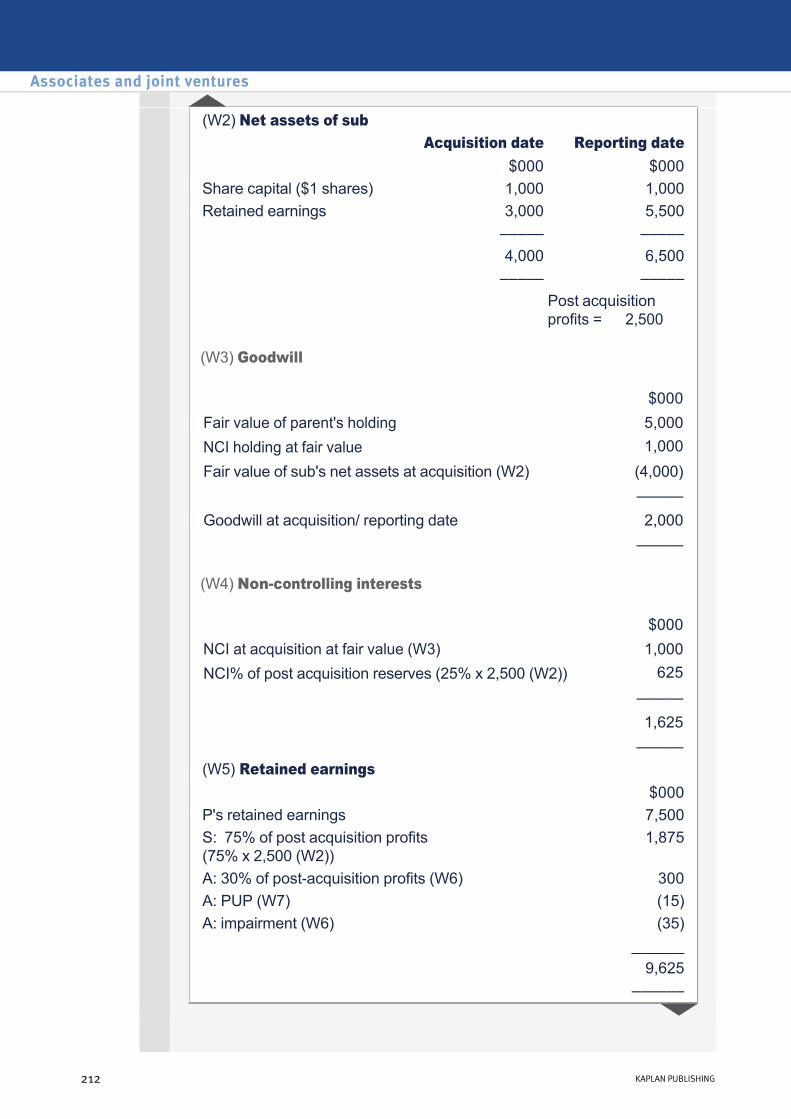
(W3) Goodwill
(W4) Noncontrolling interests
(W2) Net assets of sub Acquisition date Reporting date
$000 $000Share capital ($1 shares) 1,000 1,000Retained earnings 3,000 5,500
––––– ––––– 4,000 6,500––––– –––––
Post acquisition profits = 2,500
$000Fair value of parent's holding 5,000NCI holding at fair value 1,000Fair value of sub's net assets at acquisition (W2) (4,000)
——— Goodwill at acquisition/ reporting date 2,000 ———
$000NCI at acquisition at fair value (W3) 1,000NCI% of post acquisition reserves (25% x 2,500 (W2)) 625
——— 1,625 ——— (W5) Retained earnings
$000P's retained earnings 7,500S: 75% of post acquisition profits (75% x 2,500 (W2))
1,875
A: 30% of postacquisition profits (W6) 300A: PUP (W7) (15)A: impairment (W6) (35)
______9,625
––––––
Associates and joint ventures
212 KAPLAN PUBLISHING
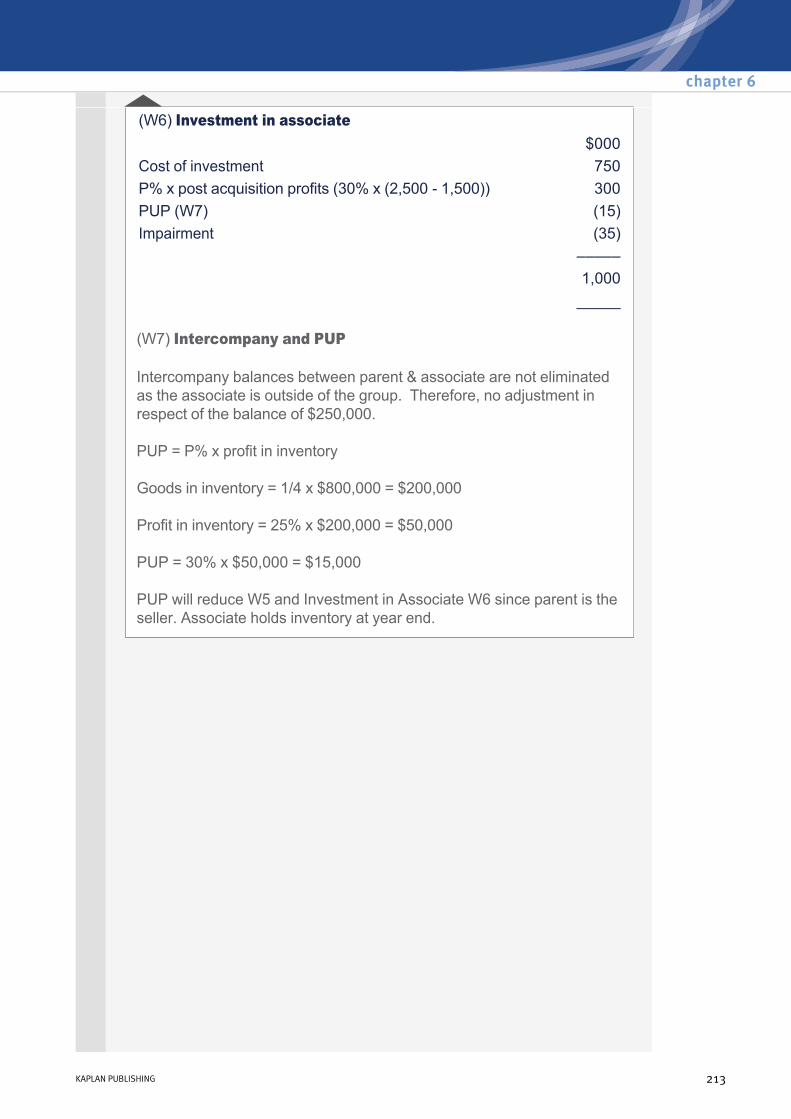
(W7) Intercompany and PUP
Intercompany balances between parent & associate are not eliminated as the associate is outside of the group. Therefore, no adjustment in respect of the balance of $250,000.
PUP = P% x profit in inventory
Goods in inventory = 1/4 x $800,000 = $200,000
Profit in inventory = 25% x $200,000 = $50,000
PUP = 30% x $50,000 = $15,000
PUP will reduce W5 and Investment in Associate W6 since parent is the seller. Associate holds inventory at year end.
(W6) Investment in associate $000
Cost of investment 750P% x post acquisition profits (30% x (2,500 1,500)) 300PUP (W7) (15)Impairment (35)
––––– 1,000_____
chapter 6
KAPLAN PUBLISHING 213

Consolidated statement of comprehensive income
(W1) Intercompany and PUP
Intercompany transactions between the parent and associate are not eliminated as the associate is outside of the group. Therefore, no adjustment in respect of the intercompany sales of $600,000.
PUP = P% x profit in inventory
Goods in inventory = 1/4 x $600,000 = $150,000
$000Revenue (8,000 + 4,500) 12,500Operating expenses (4,750 + 2,700) (7,450)
_____Operating profit 5,050Finance costs (750 + 100) (850)Income from associate ((30% x 600) 20 imp 9 (W1)) 151
_____Profit before tax 4,351Taxation (700 + 500) (1,200)
_____Profit for the year 3,151Other comprehensive income 200Other comprehensive income from associate (30% x 250) 75 _____Total comprehensive income 3,426 Profit attributable to:
_____
Parent shareholders (balancing figure) 2,911NCI shareholders (20% x 1,200) 240 _____ 3,151 _____Total comprehensive income attributable to: Parent shareholders (balancing figure) 3,186NCI shareholders (20% x 1,200) 240 _____ 3,426 _____
Associates and joint ventures
214 KAPLAN PUBLISHING
Test your understanding 5
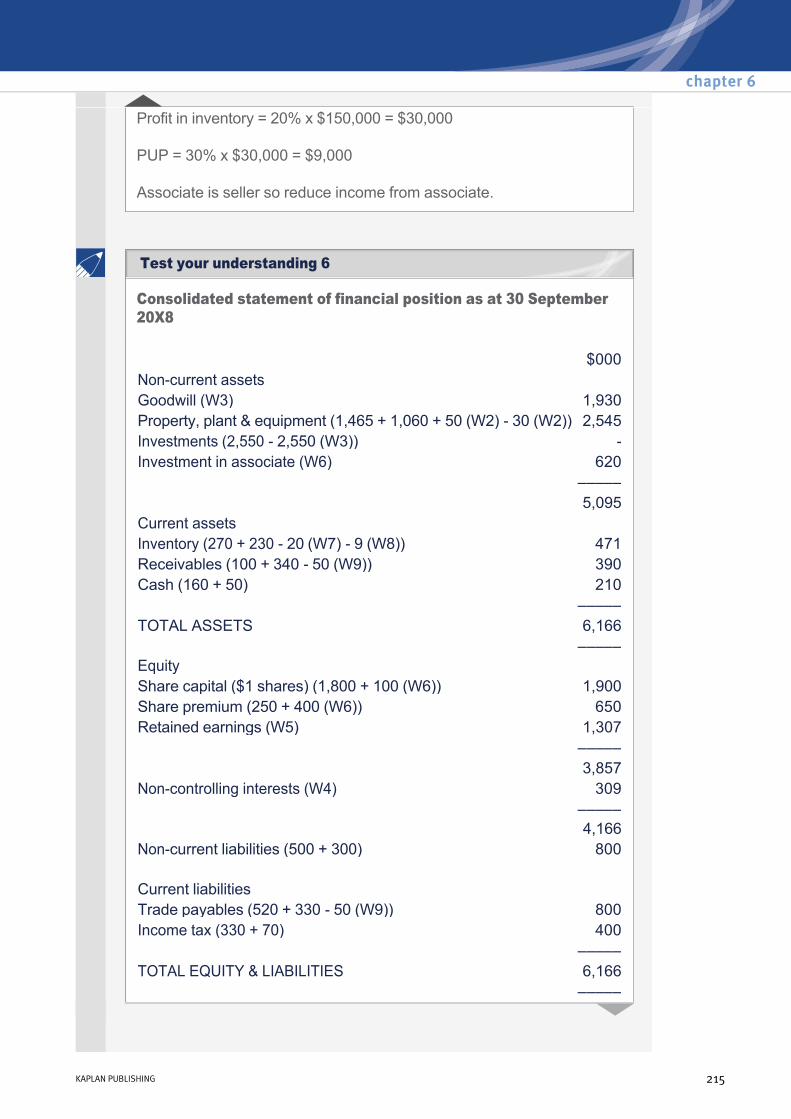
Profit in inventory = 20% x $150,000 = $30,000
PUP = 30% x $30,000 = $9,000
Associate is seller so reduce income from associate.
Consolidated statement of financial position as at 30 September 20X8
$000Noncurrent assets Goodwill (W3) 1,930Property, plant & equipment (1,465 + 1,060 + 50 (W2) 30 (W2)) 2,545Investments (2,550 2,550 (W3)) Investment in associate (W6) 620 ––––– 5,095Current assets Inventory (270 + 230 20 (W7) 9 (W8)) 471Receivables (100 + 340 50 (W9)) 390Cash (160 + 50) 210 ––––– TOTAL ASSETS 6,166 ––––– Equity Share capital ($1 shares) (1,800 + 100 (W6)) 1,900Share premium (250 + 400 (W6)) 650Retained earnings (W5) 1,307 ––––– 3,857Noncontrolling interests (W4) 309 ––––– 4,166Noncurrent liabilities (500 + 300) 800 Current liabilities Trade payables (520 + 330 50 (W9)) 800Income tax (330 + 70) 400 ––––– TOTAL EQUITY & LIABILITIES 6,166 –––––
chapter 6
KAPLAN PUBLISHING 215
Test your understanding 6
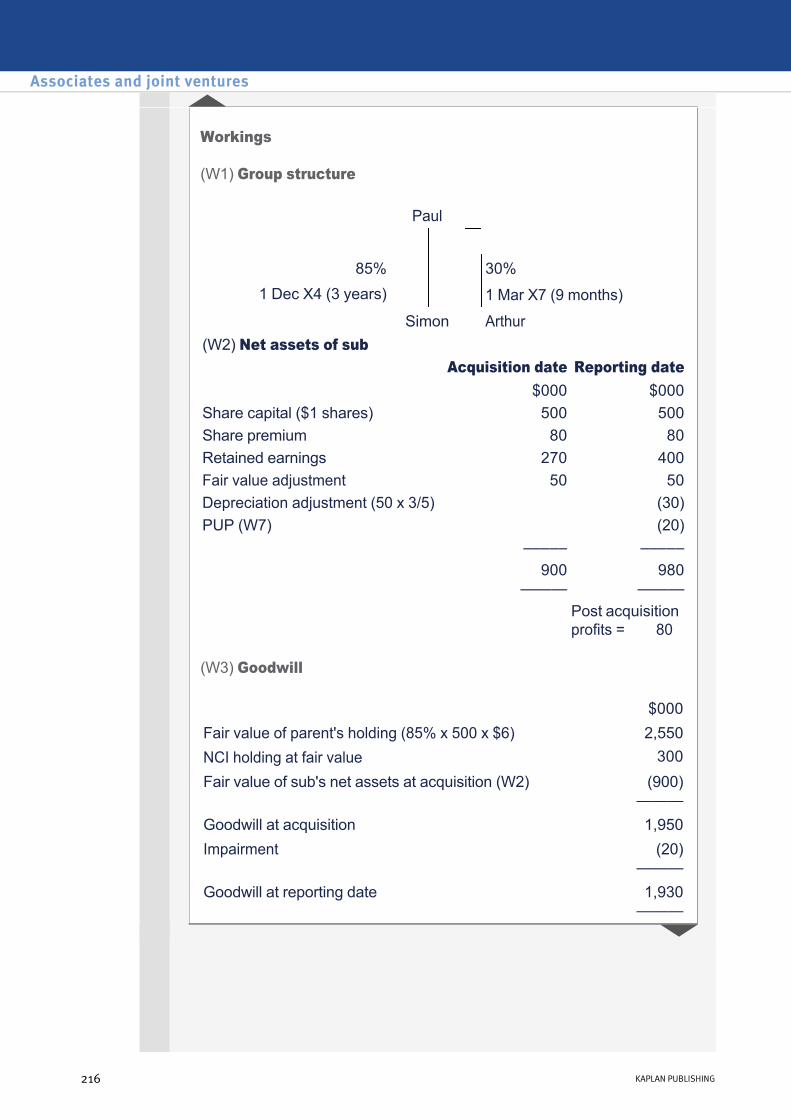
Workings
(W1) Group structure
(W3) Goodwill
Paul
85% 30%1 Dec X4 (3 years) 1 Mar X7 (9 months)
Simon Arthur(W2) Net assets of sub
Acquisition date Reporting date $000 $000
Share capital ($1 shares) 500 500Share premium 80 80Retained earnings 270 400Fair value adjustment 50 50Depreciation adjustment (50 x 3/5) (30)PUP (W7) (20)
––––– ––––– 900
——— 980
——— Post acquisition
profits = 80
$000Fair value of parent's holding (85% x 500 x $6) 2,550NCI holding at fair value 300Fair value of sub's net assets at acquisition (W2) (900)
——— Goodwill at acquisition 1,950Impairment (20)
——— Goodwill at reporting date 1,930
———
Associates and joint ventures
216 KAPLAN PUBLISHING
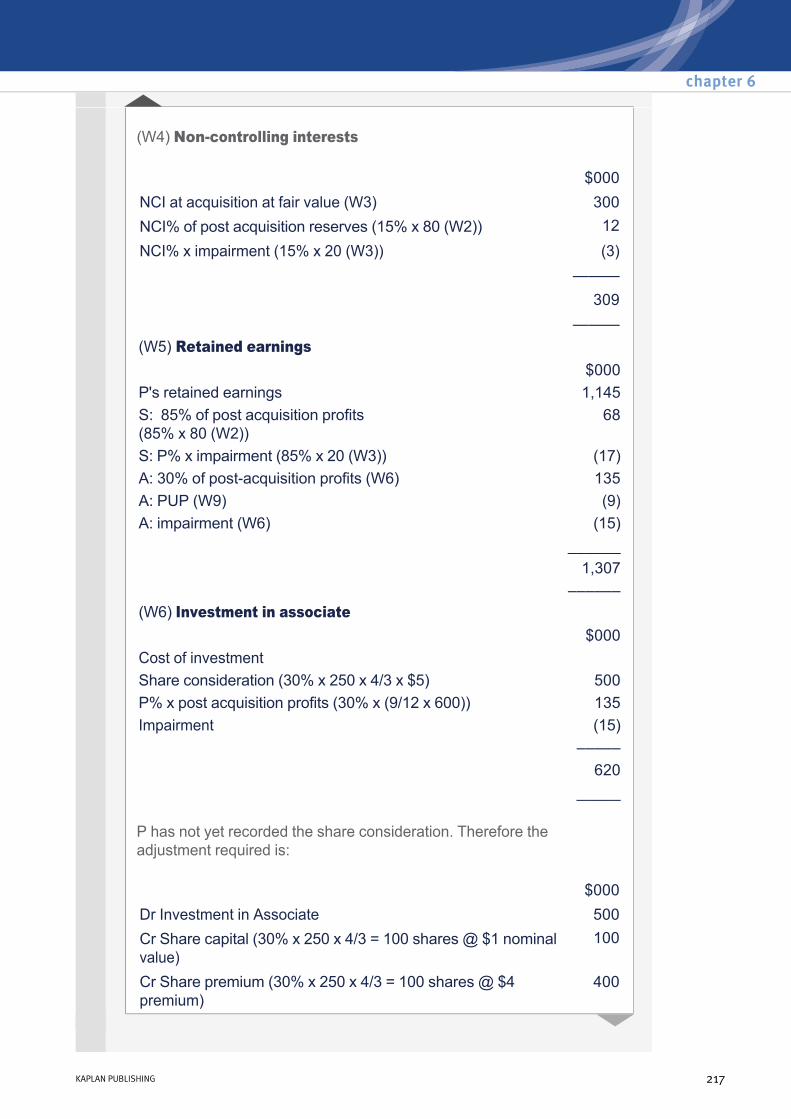
(W4) Noncontrolling interests
P has not yet recorded the share consideration. Therefore the adjustment required is:
$000NCI at acquisition at fair value (W3) 300NCI% of post acquisition reserves (15% x 80 (W2)) 12NCI% x impairment (15% x 20 (W3)) (3)
——— 309 ——— (W5) Retained earnings
$000P's retained earnings 1,145S: 85% of post acquisition profits (85% x 80 (W2))
68
S: P% x impairment (85% x 20 (W3)) (17)A: 30% of postacquisition profits (W6) 135A: PUP (W9) (9)A: impairment (W6) (15)
______1,307
–––––– (W6) Investment in associate
$000Cost of investment Share consideration (30% x 250 x 4/3 x $5) 500P% x post acquisition profits (30% x (9/12 x 600)) 135Impairment (15)
––––– 620
_____
$000Dr Investment in Associate 500Cr Share capital (30% x 250 x 4/3 = 100 shares @ $1 nominal value)
100
Cr Share premium (30% x 250 x 4/3 = 100 shares @ $4 premium)
400
chapter 6
KAPLAN PUBLISHING 217
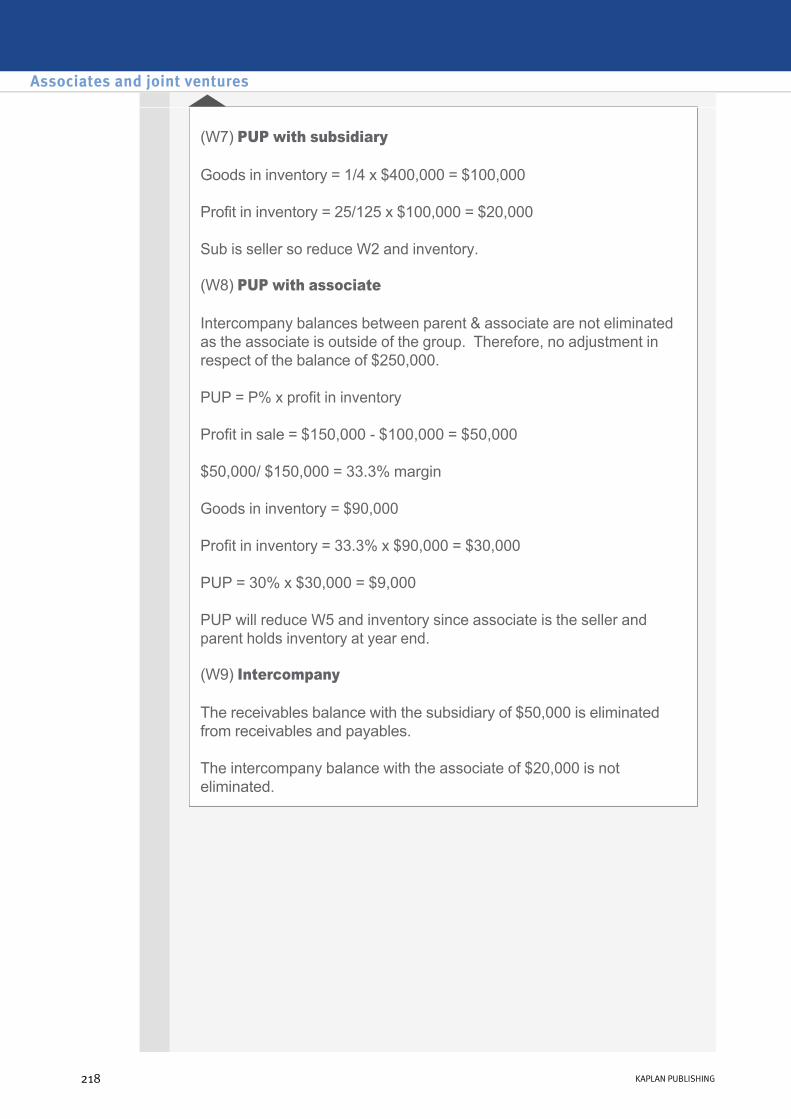
(W7) PUP with subsidiary
Goods in inventory = 1/4 x $400,000 = $100,000
Profit in inventory = 25/125 x $100,000 = $20,000
Sub is seller so reduce W2 and inventory.
(W8) PUP with associate
Intercompany balances between parent & associate are not eliminated as the associate is outside of the group. Therefore, no adjustment in respect of the balance of $250,000.
PUP = P% x profit in inventory
Profit in sale = $150,000 $100,000 = $50,000
$50,000/ $150,000 = 33.3% margin
Goods in inventory = $90,000
Profit in inventory = 33.3% x $90,000 = $30,000
PUP = 30% x $30,000 = $9,000
PUP will reduce W5 and inventory since associate is the seller and parent holds inventory at year end.
(W9) Intercompany
The receivables balance with the subsidiary of $50,000 is eliminated from receivables and payables.
The intercompany balance with the associate of $20,000 is not eliminated.
Associates and joint ventures
218 KAPLAN PUBLISHING

Consolidated statement of financial position as at 30 June 20X7
Consolidated statement of comprehensive income
$000Noncurrent assets Property, plant & equipment (12,050 + 5,000 + (30% x 1,000)) 17,350Goodwill (W3) 400 ––––– 17,750Current assets (7,500 + 4,000 + (30% x 800) 3 (W6) 6 (W6)) 11,731 ––––– TOTAL ASSETS 29,481 ––––– Equity Share capital ($1 shares) 5,000Retained earnings (W5) 12,677Other reserves (W5) 575 ––––– 18,252Noncontrolling interests (W4) 1,100 ––––– 19,352Noncurrent liabilities (2,000 + 1,000 + (30% x 150)) 3,045Current liabilities (4,500 + 2,500 + (30% x 300) 6 (W6)) 7,084 ––––– TOTAL EQUITY & LIABILITIES 29,481 –––––
$000Revenue (8,000 + 5,000 + (30% x 3,000) 30 (W6)) 13,870Operating expenses (6,000 + 3,500 + (30% x 2,200) 30 (W6) + 3 (W6))
(10,133)
_____Profit before tax 3,737Taxation (700 + 500 + (30% x 300)) (1,290)
_____Profit for the year 2,447Other comprehensive income (200 + (30% x 250)) 275 _____Total comprehensive income 2,722
_____
chapter 6
KAPLAN PUBLISHING 219
Test your understanding 7
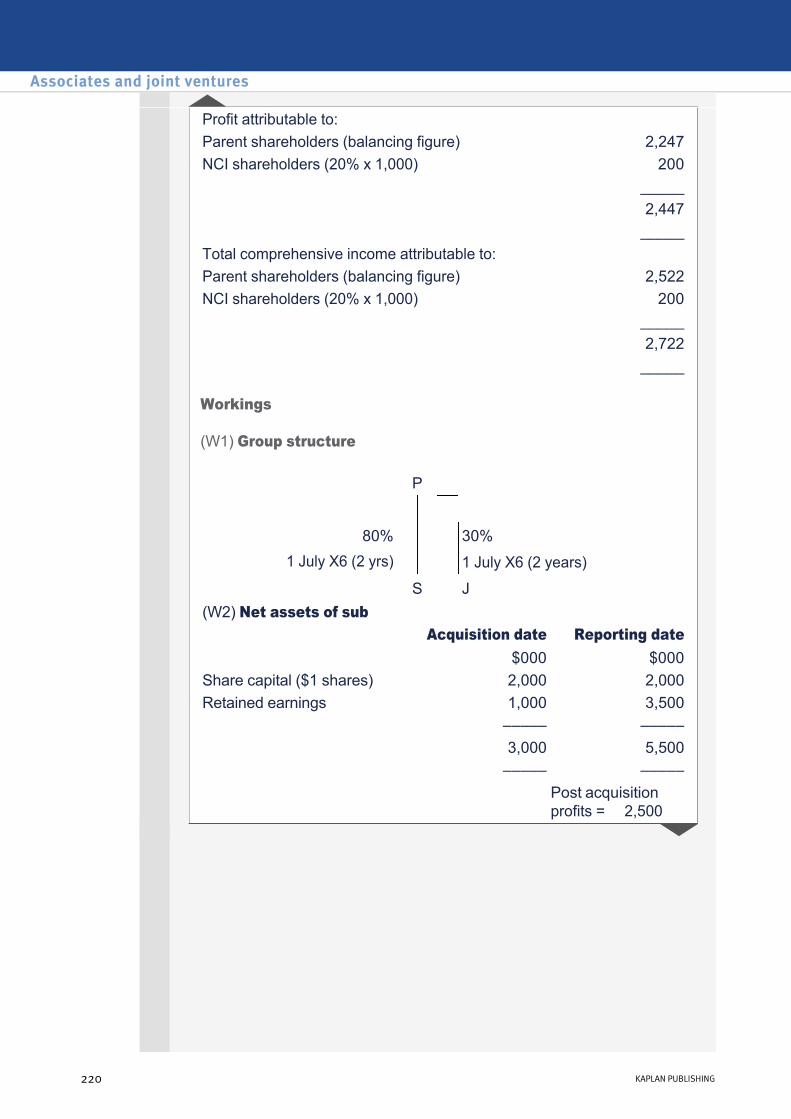
Workings
(W1) Group structure
Profit attributable to: Parent shareholders (balancing figure) 2,247NCI shareholders (20% x 1,000) 200 _____ 2,447 _____Total comprehensive income attributable to: Parent shareholders (balancing figure) 2,522NCI shareholders (20% x 1,000) 200 _____ 2,722 _____
P
80% 30%1 July X6 (2 yrs) 1 July X6 (2 years)
S J(W2) Net assets of sub
Acquisition date Reporting date $000 $000
Share capital ($1 shares) 2,000 2,000Retained earnings 1,000 3,500
––––– ––––– 3,000 5,500––––– –––––
Post acquisition profits = 2,500
Associates and joint ventures
220 KAPLAN PUBLISHING

(W3) Goodwill
(W4) Noncontrolling interests
$000Fair value of parent's holding 2,800NCI holding at fair value 600Fair value of sub's net assets at acquisition (W2) (3,000)
——— Goodwill at acquisition/reporting date 400 ———
$000NCI at acquisition at fair value (W3) 600NCI% of post acquisition reserves (20% x 2,500 (W2)) 500
——— 1,100 ——— (W5) Retained earnings
$000P's retained earnings 10,500S: 80% of post acquisition profits (80% x 2,500 (W2))
2,000
JV: 30% of postacquisition profits (30% x (600 0)) 180PUP (W6) (3)
______12,677––––––
Other reserves $000
P's other reserves 500JV: P% x post acquisition profits (30% x (250 0)) 75
––––– 575
_____
chapter 6
KAPLAN PUBLISHING 221

(W6) Intercompany and PUP
The parent's share of the intercompany sales is eliminated from sales and cost of sales:
30% x $100,000 = $30,000
The parent's share of the intercompany balance is eliminated from current assets and current liabilities:
30% x $20,000 = $6,000
PUP = P% x profit in inventory
Goods in inventory = 1/2 x $100,000 = $50,000
Profit in inventory = 20% x $50,000 = $10,000
Group share = 30% x $10,000 = $3,000
Parent is seller and so reduce W5 and inventory in CSFP.
Increase cost of sales in CSCI.
Associates and joint ventures
222 KAPLAN PUBLISHING

Consolidated statement of financial position as at 30 June 20X7
Workings
(W1) Group structure
$000Noncurrent assets Property, plant & equipment (5,650 + 7,400 + (30% x 1,300) + 2,000 (W2) 800 (W2))
14,640
Goodwill (800 + 210 (W3)) 1,010Investments (7,100 5,000 (W3) 600 (W3)) 1,500 ––––– 17,150Current assets (6,950 + 4,100 + (30% x 1,920) 72 (W6) 280 (W6))
11,274
––––– TOTAL ASSETS 28,424 ––––– Equity Share capital ($1 shares) 5,000Retained earnings (W5) 9,553 ––––– 14,553Noncontrolling interests (W4) 2,760 ––––– 17,313Noncurrent liabilities (3,500 + 1,700 + (30% x 800)) 5,440Current liabilities (3,950 + 1,800 + (30% x 670) 280 (W6)) 5,671 ––––– TOTAL EQUITY & LIABILITIES 28,424 –––––
P
70% 30%1 Jan X4 (4 yrs) 1 Jan X5 (3 years)
S X
chapter 6
KAPLAN PUBLISHING 223
Test your understanding 8
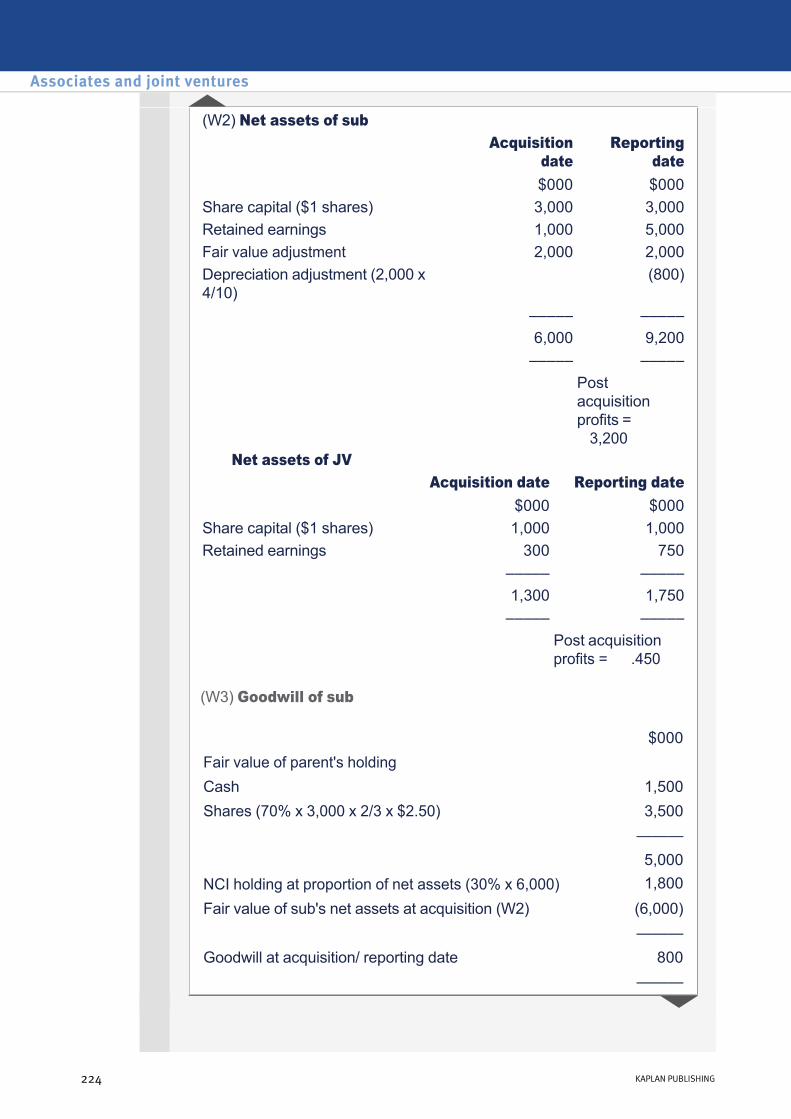
(W3) Goodwill of sub
(W2) Net assets of sub Acquisition
date Reporting
date $000 $000
Share capital ($1 shares) 3,000 3,000Retained earnings 1,000 5,000Fair value adjustment 2,000 2,000Depreciation adjustment (2,000 x 4/10)
(800)
––––– ––––– 6,000 9,200––––– –––––
Post acquisition profits = 3,200
Net assets of JV Acquisition date Reporting date
$000 $000Share capital ($1 shares) 1,000 1,000Retained earnings 300 750
––––– ––––– 1,300 1,750––––– –––––
Post acquisition profits = .450
$000Fair value of parent's holdingCash 1,500Shares (70% x 3,000 x 2/3 x $2.50) 3,500 ——— 5,000NCI holding at proportion of net assets (30% x 6,000) 1,800Fair value of sub's net assets at acquisition (W2) (6,000)
——— Goodwill at acquisition/ reporting date 800 ———
Associates and joint ventures
224 KAPLAN PUBLISHING

Goodwill of JV
(W4) Noncontrolling interests
(W6) Intercompany and PUP
$250,000 will be eliminated in respect of the intercompany balance with the subsidiary. 30% x $100,000 will be eliminated in respect of the intercompany balance with the JV. A total of $280,000 is, therefore, eliminated.
PUP with sub
Profit in inventory = 20/120 x $360,000 = $60,000
$000Fair value of parent's holding (30% x 1,000 x $2) 600P% x fair value of JV's net assets at acquisition (30% x 1,300 (W2))
(390)
—— Goodwill at acquisition/reporting date 210 ——
$000NCI at acquisition (W3) 1,800NCI% of post acquisition reserves (30% x 3,200 (W2)) 960
——— 2,760 ——— (W5) Retained earnings
$000P's retained earnings 7,250S: 70% of post acquisition profits (70% x 3,200 (W2))
2,240
JV: 30% of postacquisition profits (30% x 450 (W2)) 135PUP (W6) (72)
______9,553
––––––
chapter 6
KAPLAN PUBLISHING 225

PUP with JV
PUP = P% x profit in inventory
Profit in inventory = 20/120 x $240,000 = $40,000
Group share = 30% x $40,000 = $12,000
Total PUP adjustment is $72,000. Parent is seller and so reduce W5 and inventory.
Associates and joint ventures
226 KAPLAN PUBLISHING
Changes in group structureChapter learning objectives
On completion of their studies students should be able to:
• Prepare consolidated financial statements for a group of companies;
• Explain the treatment in consolidated financial statements of piecemeal and midyear acquisitions and disposals;
• Explain the accounting for reorganisations and capital reconstruction schemes.
227
chapter
7

1 Session content
2 Step acquisitions
So far we have considered the situations of the parent company acquiring shares in a single transaction which has resulted in the investment either being classified as a subsidiary, associate or joint venture. If the purchase of shares does not result in any of these classifications, the investment is simply classified as a trade investment.
However, it is possible that having purchased some shares, the parent subsequently purchases further shares. This is referred to as a step acquisition or sometimes, a piecemeal acquisition.
The possible scenarios can be classified into three situations:
E.g. a company acquires 10% of the equity shares and subsequently purchases a further 30% to now hold 40%.
(1) Noncontrol to noncontrol
Changes in group structure
228 KAPLAN PUBLISHING228 KAPLAN PUBLISHING
This situation is less examinable and is considered within the expandable text below.
E.g. a company acquires 40% of the equity shares and subsequently purchases a further 20% to now hold 60%.
E.g. a company acquires 60% of the equity shares and subsequently purchases a further 15% to now hold 75%.
These two situations are more examinable and are considered in further detail below.
(2) Noncontrol to control
(3) Control to control
3 Noncontrol to control
This scenario is accounted for as if the previously held interest has been disposed of at its current fair value and the controlling shareholding is then subsequently acquired. Therefore, it is necessary to:
The date on which control is achieved is considered to be the acquisition date. From this date, the investment is classified as a subsidiary and acquisition accounting is used. This means:
For the purposes of calculating goodwill, the cost of the investment is made up of:
(1) Remeasure the previously held interest to fair value.
(2) Recognise any resulting gain or loss within the income statement (and so retained earnings).
• consolidate income, expenses, assets and liabilities in full on a line by line basis;
• recognise goodwill;
• recognise noncontrolling interests.
Fair value of previously held interest XFair value of consideration to acquire additional interest X –– Fair value of P's controlling shareholding at acquisition date, i.e. cost of investment
X
chapter 7
KAPLAN PUBLISHING 229
Noncontrol to noncontrol
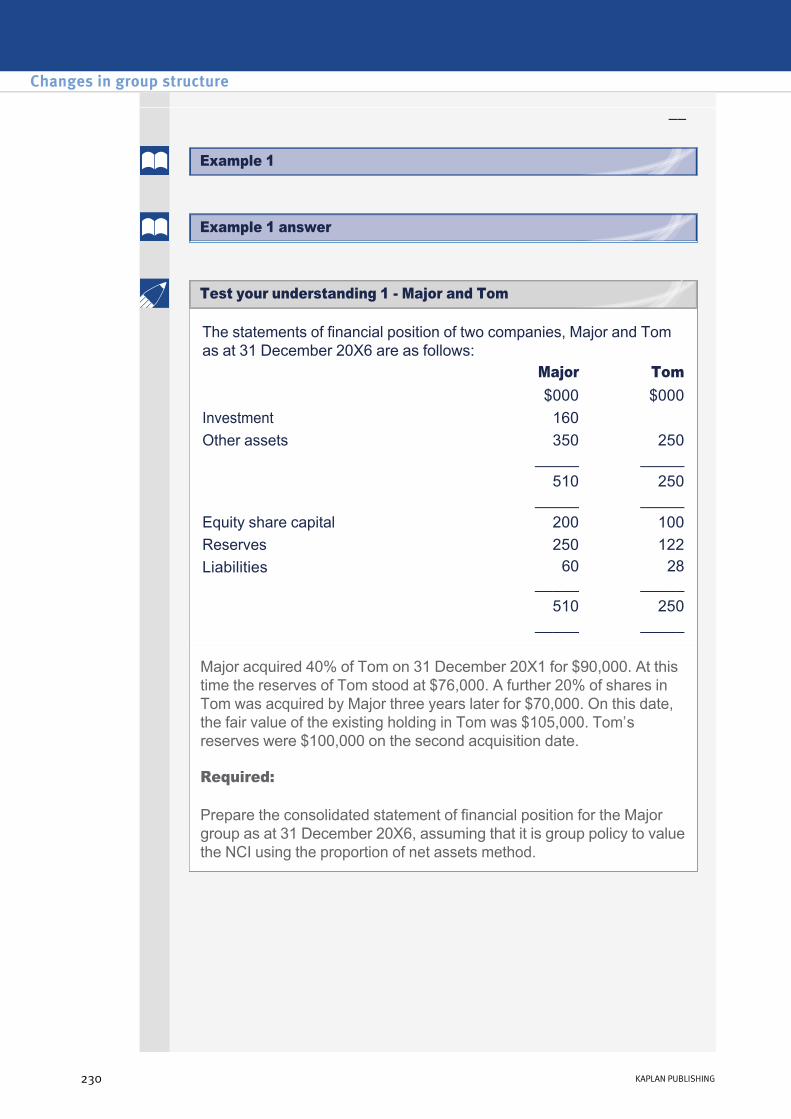
––
The statements of financial position of two companies, Major and Tom as at 31 December 20X6 are as follows:
Major Tom $000 $000
Investment 160Other assets 350
_____250
_____510
_____250
_____Equity share capital 200 100Reserves 250 122Liabilities 60
_____ 28
_____510
_____250
_____
Major acquired 40% of Tom on 31 December 20X1 for $90,000. At this time the reserves of Tom stood at $76,000. A further 20% of shares in Tom was acquired by Major three years later for $70,000. On this date, the fair value of the existing holding in Tom was $105,000. Tom’s reserves were $100,000 on the second acquisition date.
Required:
Prepare the consolidated statement of financial position for the Major group as at 31 December 20X6, assuming that it is group policy to value the NCI using the proportion of net assets method.
Changes in group structure
230 KAPLAN PUBLISHING
Test your understanding 1 Major and Tom
Example 1 answer
Example 1

The statements of financial position of two companies, Heat and Wave as at 30 June 20X5 are as follows:
Heat Wave $000 $000
Investment 142 – Other assets 358
_____225
_____500
_____225
_____Equity share capital 250 150Reserves 200 55Liabilities 50
_____ 20
_____500
_____225
_____
Heat acquired 35% of Wave on 1 July 20X3 for $62,000 when the reserves of Wave stood at $30,000. A further 40% of shares was acquired by Heat one year later for $80,000 when Wave's reserves were $45,000. On 1 July 20X4 the fair value of the existing holding in Wave was $70,000 and the fair value of the NCI share in Wave was $50,000.
Required:
Prepare the consolidated statement of financial position for the Heat group as at 30 June 20X5, assuming that it is group policy to value the NCI using the full method.
4 Control to control
Where the parent already owns a controlling shareholding and subsequently purchases additional shares, they are simply purchasing the shares from the NCI shareholders. This means that the transaction is between the owners of the group, with the parent’s share increasing and the NCI’s share decreasing.
For example if the parent holds 80% of the shares in a subsidiary and buys 5% more the relationship remains one of a parent and subsidiary. As such, the subsidiary will be consolidated in the group accounts in the normal way but the NCI has decreased from 20% to 15%.
chapter 7
KAPLAN PUBLISHING 231
Test your understanding 2 Heat and Wave
Noncontrol to control: W5 alternative calculation

Where there is such a transaction:
The transfer from NCI will represent the proportionate reduction in the NCI’s equity figure (i.e. the NCI’s share of net assets and goodwill under full goodwill) as at the date of the step acquisition which the parent is effectively purchasing from the NCI.
• There is no change in the goodwill asset
• The income, expenses, assets and liabilities continue to consolidated line by line
• If the step acquisition happens midyear, it will be necessary to time apportion profits when determining the NCI share of profits
• No gain or loss arises as this is a transaction within equity i.e. a transaction between owners
• A difference may arise that will be taken to equity which can be determined using the following proforma.
$Cash paid XTransfer from NCI to reduce NCI (X) –––– Difference to equity X ––––
Gordon has owned 80% of Mandy for many years.
Gordon is considering acquiring more shares in Mandy.
At acquisition the fair value of the NCI’s in Mandy was $100,000. The net assets of Mandy at acquisition were $300,000 and are currently $400,000.
Gordon's options are to either:
(a) Buy 10% of Mandy's shares for $50,000; or
(b) Buy 15% of Mandy's shares for $95,000.
Changes in group structure
232 KAPLAN PUBLISHING
Example 2
Example 2 answer
Test your understanding 3 Gordon and Mandy
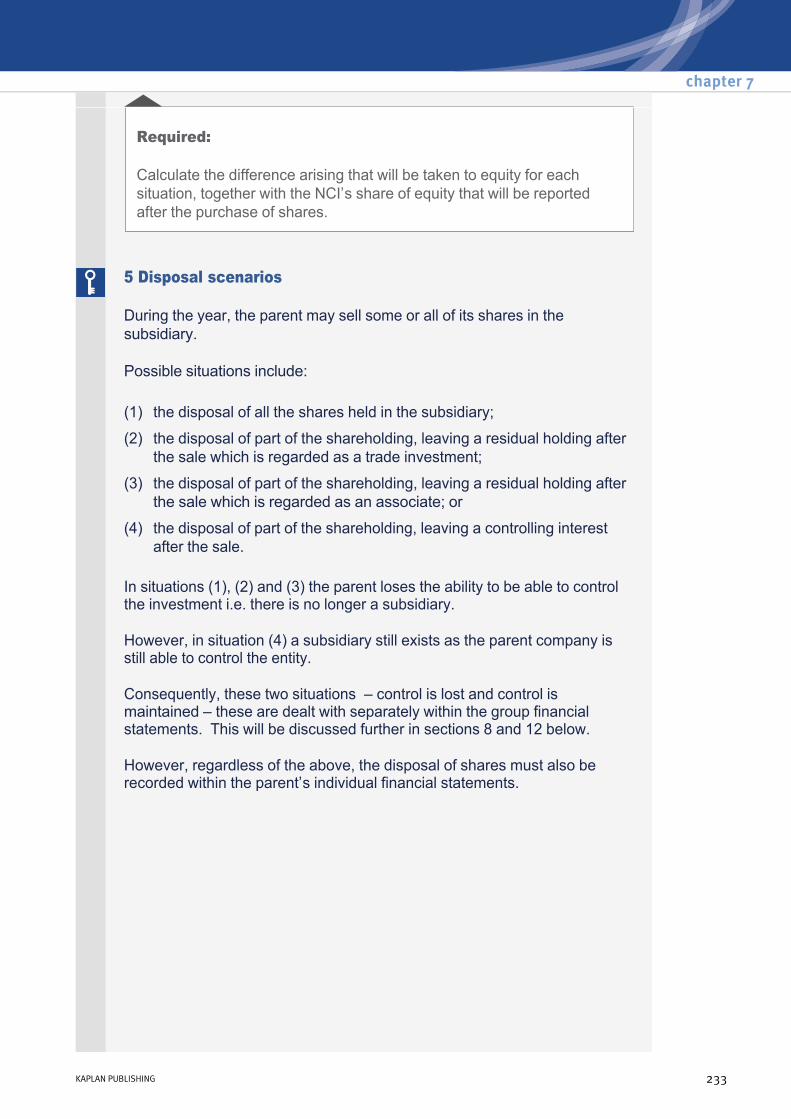
Required:
Calculate the difference arising that will be taken to equity for each situation, together with the NCI’s share of equity that will be reported after the purchase of shares.
5 Disposal scenarios
During the year, the parent may sell some or all of its shares in the subsidiary.
Possible situations include:
In situations (1), (2) and (3) the parent loses the ability to be able to control the investment i.e. there is no longer a subsidiary.
However, in situation (4) a subsidiary still exists as the parent company is still able to control the entity.
Consequently, these two situations – control is lost and control is maintained – these are dealt with separately within the group financial statements. This will be discussed further in sections 8 and 12 below.
However, regardless of the above, the disposal of shares must also be recorded within the parent’s individual financial statements.
(1) the disposal of all the shares held in the subsidiary;
(2) the disposal of part of the shareholding, leaving a residual holding after the sale which is regarded as a trade investment;
(3) the disposal of part of the shareholding, leaving a residual holding after the sale which is regarded as an associate; or
(4) the disposal of part of the shareholding, leaving a controlling interest after the sale.
chapter 7
KAPLAN PUBLISHING 233
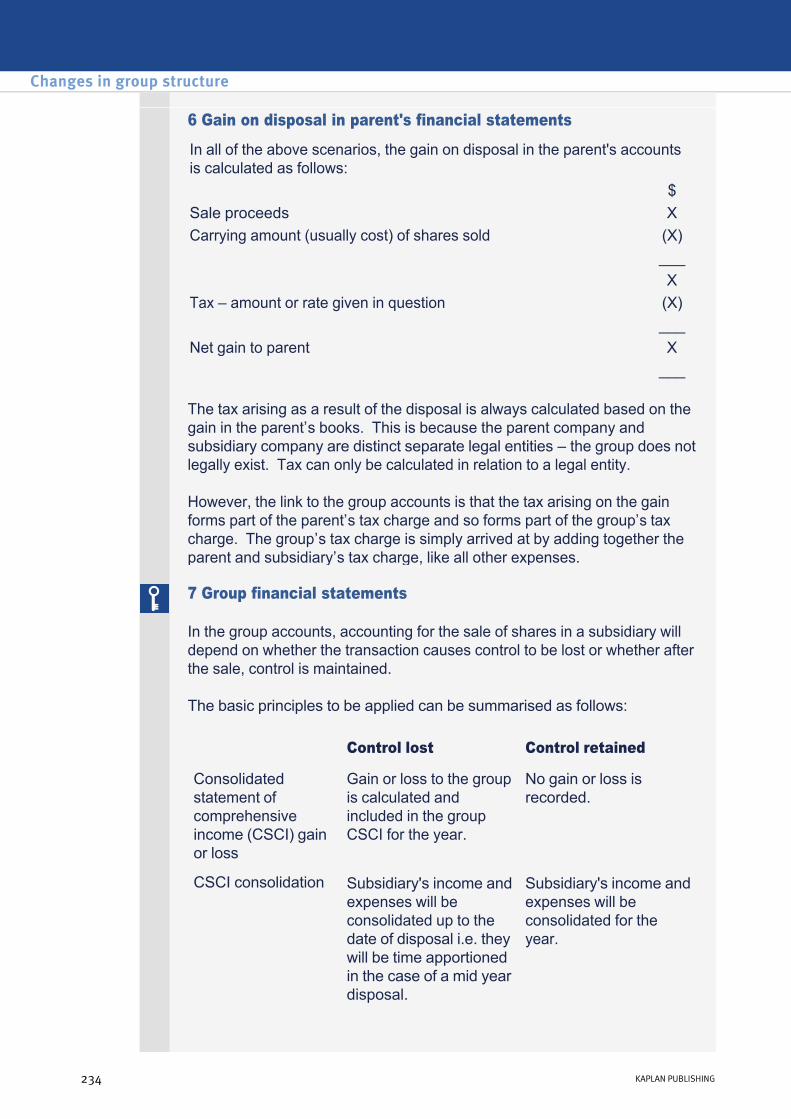
6 Gain on disposal in parent's financial statements
The tax arising as a result of the disposal is always calculated based on the gain in the parent’s books. This is because the parent company and subsidiary company are distinct separate legal entities – the group does not legally exist. Tax can only be calculated in relation to a legal entity.
However, the link to the group accounts is that the tax arising on the gain forms part of the parent’s tax charge and so forms part of the group’s tax charge. The group’s tax charge is simply arrived at by adding together the parent and subsidiary’s tax charge, like all other expenses.
In all of the above scenarios, the gain on disposal in the parent's accounts is calculated as follows: $Sale proceeds XCarrying amount (usually cost) of shares sold (X)
___X
Tax – amount or rate given in question (X)___
Net gain to parent X___
7 Group financial statements
In the group accounts, accounting for the sale of shares in a subsidiary will depend on whether the transaction causes control to be lost or whether after the sale, control is maintained.
The basic principles to be applied can be summarised as follows:
Control lost Control retained
Consolidated statement of comprehensive income (CSCI) gain or loss
Gain or loss to the group is calculated and included in the group CSCI for the year.
No gain or loss is recorded.
CSCI consolidation Subsidiary's income and expenses will be consolidated up to the date of disposal i.e. they will be time apportioned in the case of a mid year disposal.
Subsidiary's income and expenses will be consolidated for the year.
Changes in group structure
234 KAPLAN PUBLISHING
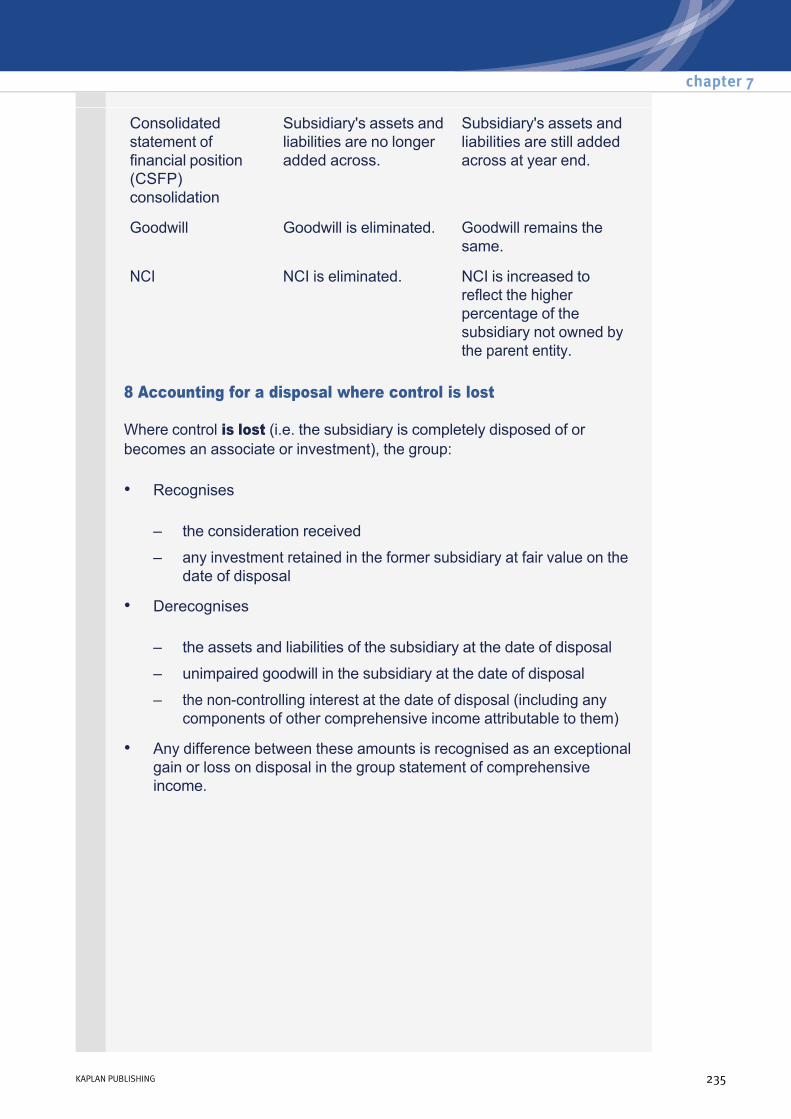
Consolidated statement of financial position (CSFP) consolidation
Subsidiary's assets and liabilities are no longer added across.
Subsidiary's assets and liabilities are still added across at year end.
Goodwill Goodwill is eliminated. Goodwill remains the same.
NCI NCI is eliminated. NCI is increased to reflect the higher percentage of the subsidiary not owned by the parent entity.
8 Accounting for a disposal where control is lost
Where control is lost (i.e. the subsidiary is completely disposed of or becomes an associate or investment), the group:
• Recognises
– the consideration received
– any investment retained in the former subsidiary at fair value on the date of disposal
• Derecognises
– the assets and liabilities of the subsidiary at the date of disposal
– unimpaired goodwill in the subsidiary at the date of disposal
– the noncontrolling interest at the date of disposal (including any components of other comprehensive income attributable to them)
• Any difference between these amounts is recognised as an exceptional gain or loss on disposal in the group statement of comprehensive income.
chapter 7
KAPLAN PUBLISHING 235

The following is a proforma that can be used to calculate the exceptional gain or loss on disposal:
The gain to the group is presented on the consolidated statement of comprehensive income after operating profit.
Proceeds XFair value of retained interest X
___X
Less: carrying value of subsidiary disposed of:Net assets of subsidiary at disposal date XUnimpaired goodwill at disposal date XLess: NCI at disposal date (X)
___(X)___
Gain/loss to the group X ___
9 Group accounts – entire disposal
Snooker purchased 80% of the shares in Billiards for $100,000 when the net assets of Billiards had a fair value of $62,500. The fair value of the NCI’s holding was $22,500. Goodwill has not suffered any impairment to date.
Snooker has just disposed of its entire shareholding in Billiards for $300,000 when the net assets were stated at $110,000. Tax is payable by Snooker at 30% on any gain on disposal of shares.
Changes in group structure
236 KAPLAN PUBLISHING
Example 3
Example 3 answer
Test your understanding 4 Snooker
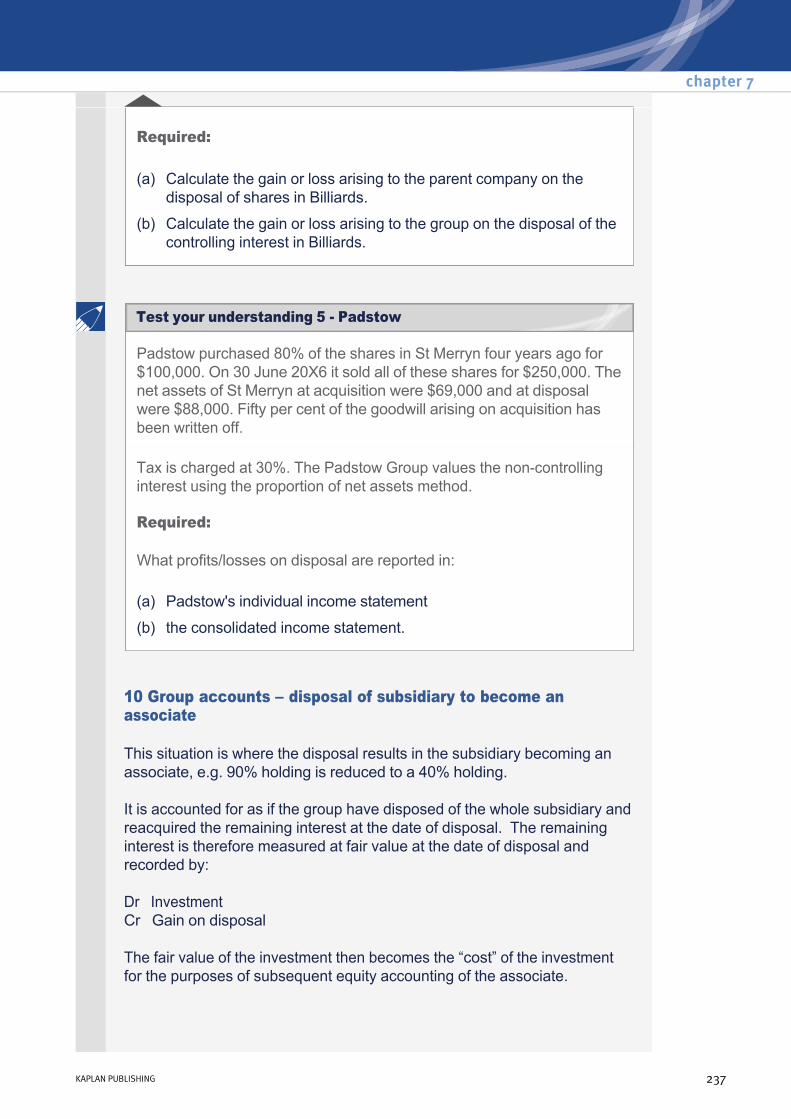
Required:
(a) Calculate the gain or loss arising to the parent company on the disposal of shares in Billiards.
(b) Calculate the gain or loss arising to the group on the disposal of the controlling interest in Billiards.
Padstow purchased 80% of the shares in St Merryn four years ago for $100,000. On 30 June 20X6 it sold all of these shares for $250,000. The net assets of St Merryn at acquisition were $69,000 and at disposal were $88,000. Fifty per cent of the goodwill arising on acquisition has been written off.
Tax is charged at 30%. The Padstow Group values the noncontrolling interest using the proportion of net assets method.
Required:
What profits/losses on disposal are reported in:
(a) Padstow's individual income statement
(b) the consolidated income statement.
10 Group accounts – disposal of subsidiary to become an associate
This situation is where the disposal results in the subsidiary becoming an associate, e.g. 90% holding is reduced to a 40% holding.
It is accounted for as if the group have disposed of the whole subsidiary and reacquired the remaining interest at the date of disposal. The remaining interest is therefore measured at fair value at the date of disposal and recorded by:
Dr Investment Cr Gain on disposal
The fair value of the investment then becomes the “cost” of the investment for the purposes of subsequent equity accounting of the associate.
chapter 7
KAPLAN PUBLISHING 237
Test your understanding 5 Padstow
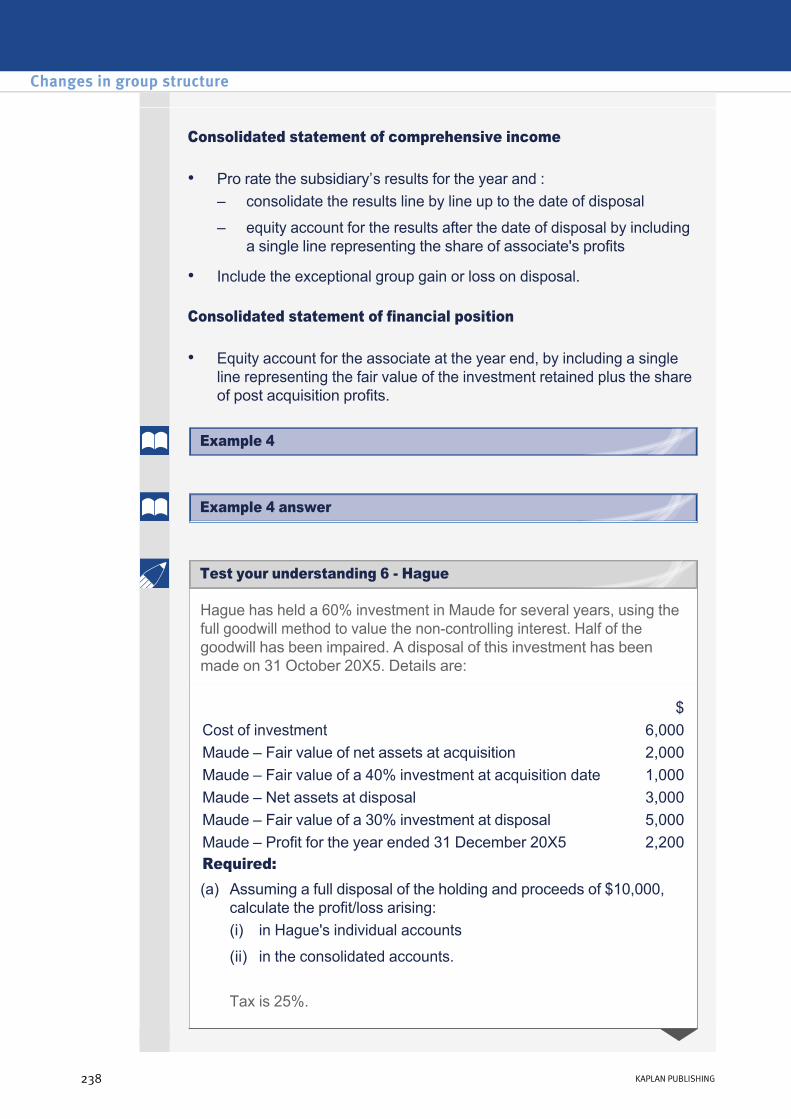
Consolidated statement of comprehensive income
Consolidated statement of financial position
• Pro rate the subsidiary’s results for the year and : – consolidate the results line by line up to the date of disposal
– equity account for the results after the date of disposal by including a single line representing the share of associate's profits
• Include the exceptional group gain or loss on disposal.
• Equity account for the associate at the year end, by including a single line representing the fair value of the investment retained plus the share of post acquisition profits.
Hague has held a 60% investment in Maude for several years, using the full goodwill method to value the noncontrolling interest. Half of the goodwill has been impaired. A disposal of this investment has been made on 31 October 20X5. Details are:
Tax is 25%.
$Cost of investment 6,000Maude – Fair value of net assets at acquisition 2,000Maude – Fair value of a 40% investment at acquisition date 1,000Maude – Net assets at disposal 3,000Maude – Fair value of a 30% investment at disposal 5,000Maude – Profit for the year ended 31 December 20X5 2,200Required: (a) Assuming a full disposal of the holding and proceeds of $10,000,
calculate the profit/loss arising: (i) in Hague's individual accounts
(ii) in the consolidated accounts.
Changes in group structure
238 KAPLAN PUBLISHING
Test your understanding 6 Hague
Example 4
Example 4 answer
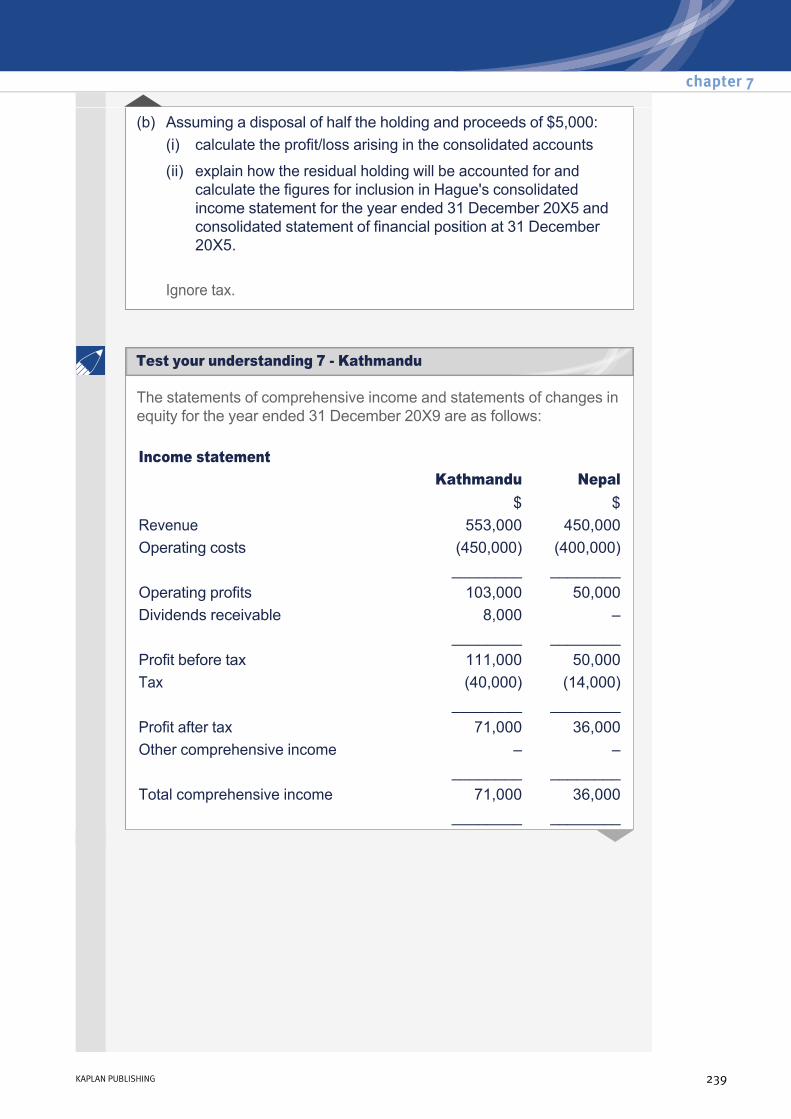
Ignore tax.
(b) Assuming a disposal of half the holding and proceeds of $5,000: (i) calculate the profit/loss arising in the consolidated accounts
(ii) explain how the residual holding will be accounted for and calculate the figures for inclusion in Hague's consolidated income statement for the year ended 31 December 20X5 and consolidated statement of financial position at 31 December 20X5.
The statements of comprehensive income and statements of changes in equity for the year ended 31 December 20X9 are as follows:
Income statement Kathmandu Nepal
$ $Revenue 553,000 450,000Operating costs (450,000) (400,000)
________ ________Operating profits 103,000 50,000Dividends receivable 8,000 –
________ ________Profit before tax 111,000 50,000Tax (40,000) (14,000)
________ ________Profit after tax 71,000 36,000Other comprehensive income – – ________ ________Total comprehensive income 71,000 36,000
________ ________
chapter 7
KAPLAN PUBLISHING 239
Test your understanding 7 Kathmandu
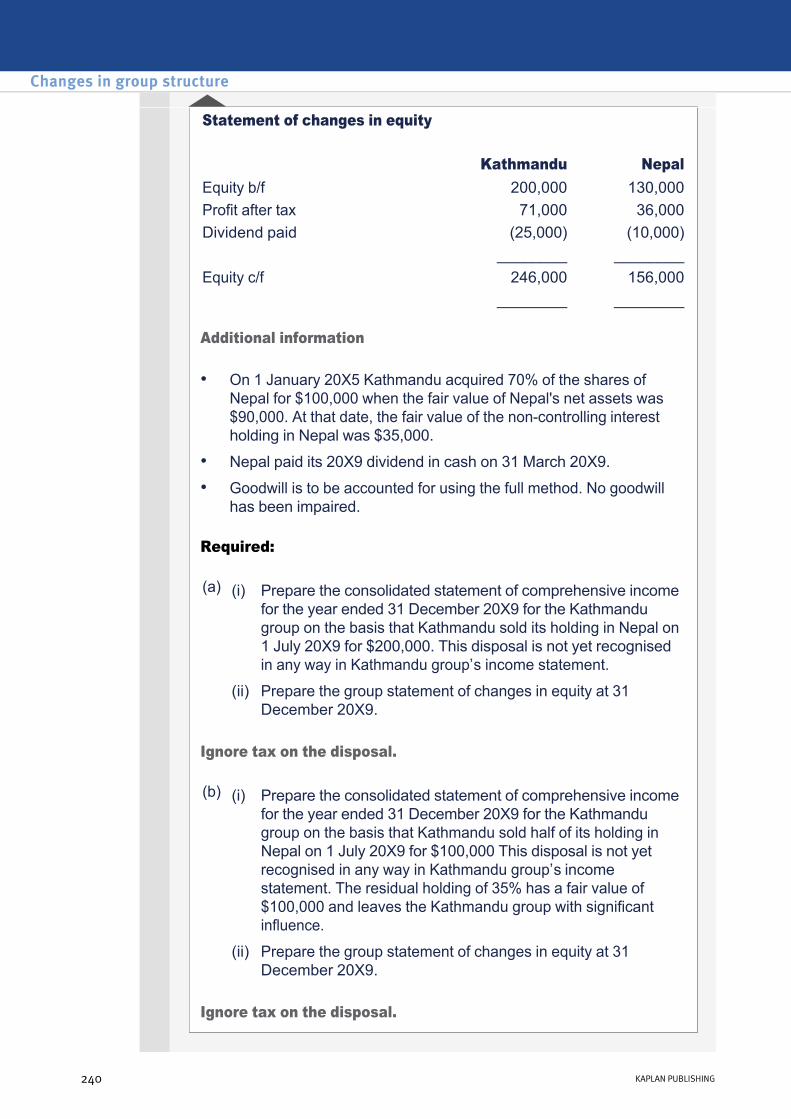
Additional information
Required:
Ignore tax on the disposal.
Ignore tax on the disposal.
Statement of changes in equity Kathmandu Nepal Equity b/f 200,000 130,000Profit after tax 71,000 36,000Dividend paid (25,000) (10,000) ________ ________Equity c/f 246,000 156,000 ________ ________
• On 1 January 20X5 Kathmandu acquired 70% of the shares of Nepal for $100,000 when the fair value of Nepal's net assets was $90,000. At that date, the fair value of the noncontrolling interest holding in Nepal was $35,000.
• Nepal paid its 20X9 dividend in cash on 31 March 20X9.
• Goodwill is to be accounted for using the full method. No goodwill has been impaired.
(a) (i) Prepare the consolidated statement of comprehensive income for the year ended 31 December 20X9 for the Kathmandu group on the basis that Kathmandu sold its holding in Nepal on 1 July 20X9 for $200,000. This disposal is not yet recognised in any way in Kathmandu group’s income statement.
(ii) Prepare the group statement of changes in equity at 31 December 20X9.
(b) (i) Prepare the consolidated statement of comprehensive income for the year ended 31 December 20X9 for the Kathmandu group on the basis that Kathmandu sold half of its holding in Nepal on 1 July 20X9 for $100,000 This disposal is not yet recognised in any way in Kathmandu group’s income statement. The residual holding of 35% has a fair value of $100,000 and leaves the Kathmandu group with significant influence.
(ii) Prepare the group statement of changes in equity at 31 December 20X9.
Changes in group structure
240 KAPLAN PUBLISHING
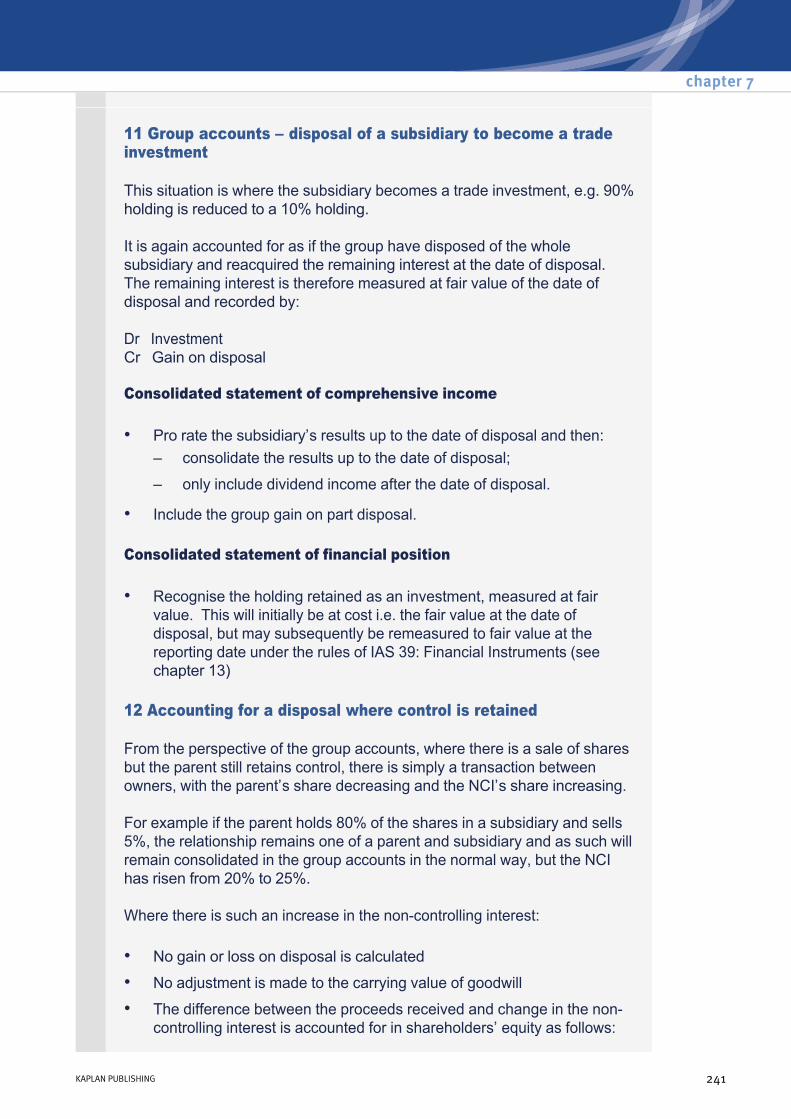
11 Group accounts – disposal of a subsidiary to become a trade investment
This situation is where the subsidiary becomes a trade investment, e.g. 90% holding is reduced to a 10% holding.
It is again accounted for as if the group have disposed of the whole subsidiary and reacquired the remaining interest at the date of disposal. The remaining interest is therefore measured at fair value of the date of disposal and recorded by:
Dr Investment Cr Gain on disposal
Consolidated statement of comprehensive income
Consolidated statement of financial position
• Pro rate the subsidiary’s results up to the date of disposal and then: – consolidate the results up to the date of disposal;
– only include dividend income after the date of disposal.
• Include the group gain on part disposal.
• Recognise the holding retained as an investment, measured at fair value. This will initially be at cost i.e. the fair value at the date of disposal, but may subsequently be remeasured to fair value at the reporting date under the rules of IAS 39: Financial Instruments (see chapter 13)
12 Accounting for a disposal where control is retained
From the perspective of the group accounts, where there is a sale of shares but the parent still retains control, there is simply a transaction between owners, with the parent’s share decreasing and the NCI’s share increasing.
For example if the parent holds 80% of the shares in a subsidiary and sells 5%, the relationship remains one of a parent and subsidiary and as such will remain consolidated in the group accounts in the normal way, but the NCI has risen from 20% to 25%.
Where there is such an increase in the noncontrolling interest:
• No gain or loss on disposal is calculated
• No adjustment is made to the carrying value of goodwill
• The difference between the proceeds received and change in the noncontrolling interest is accounted for in shareholders’ equity as follows:
chapter 7
KAPLAN PUBLISHING 241
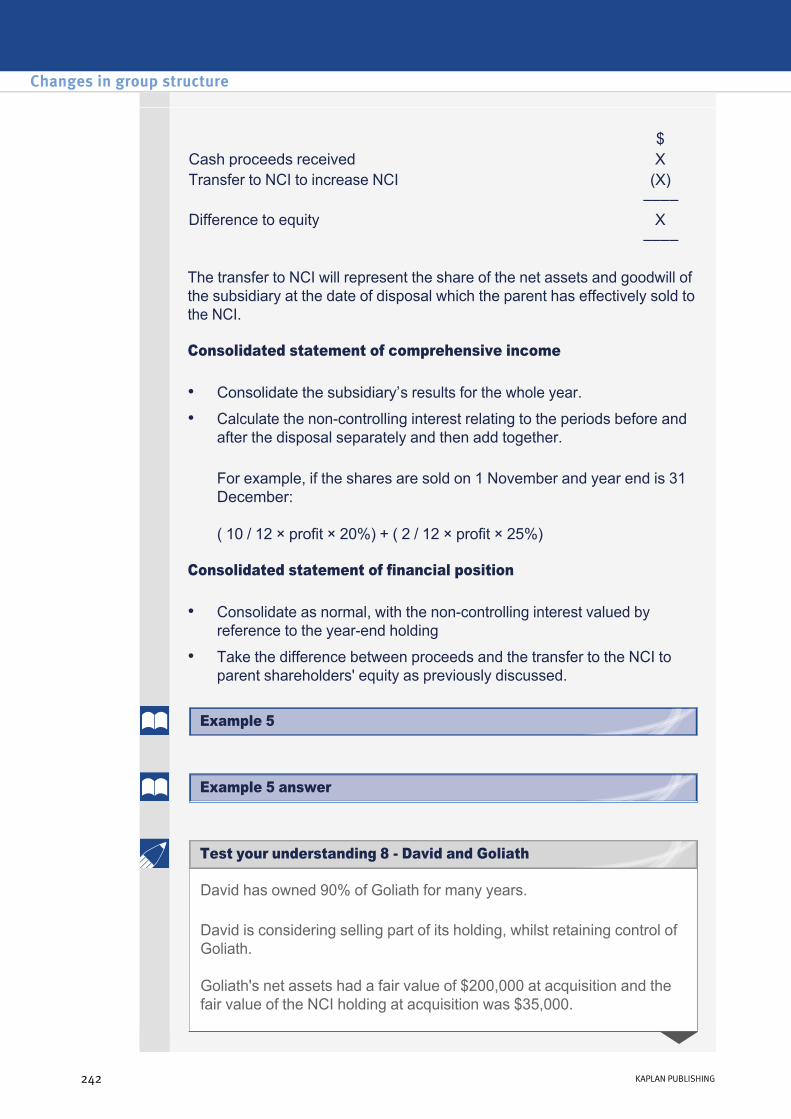
The transfer to NCI will represent the share of the net assets and goodwill of the subsidiary at the date of disposal which the parent has effectively sold to the NCI.
Consolidated statement of comprehensive income
For example, if the shares are sold on 1 November and year end is 31 December:
( 10 / 12 × profit × 20%) + ( 2 / 12 × profit × 25%)
Consolidated statement of financial position
$Cash proceeds received XTransfer to NCI to increase NCI (X) –––– Difference to equity X ––––
• Consolidate the subsidiary’s results for the whole year.
• Calculate the noncontrolling interest relating to the periods before and after the disposal separately and then add together.
• Consolidate as normal, with the noncontrolling interest valued by reference to the yearend holding
• Take the difference between proceeds and the transfer to the NCI to parent shareholders' equity as previously discussed.
David has owned 90% of Goliath for many years.
David is considering selling part of its holding, whilst retaining control of Goliath.
Goliath's net assets had a fair value of $200,000 at acquisition and the fair value of the NCI holding at acquisition was $35,000.
Changes in group structure
242 KAPLAN PUBLISHING
Example 5
Example 5 answer
Test your understanding 8 David and Goliath

The net assets of Goliath are currently $350,000 and the goodwill is $175,000.
David's options are to either:
Required:
Calculate the different arising that will be taken to equity for each situation, together with the NCI’s share of equity that will be reported after the sale of shares.
(a) Sell 5% of the Goliath shares for $60,000; or
(b) Sell 25% of the Goliath shares for $100,000.
Statements of financial position for three entities at the reporting date are as follows:
Pepsi acquired 80% of Sprite when Sprite’s retained earnings were $25,000, paying cash consideration of $300,000. The fair value of the NCI holding in Sprite at the date of acquisition was $65,000.
At the reporting date, Pepsi purchased an additional 8% of Sprite’s equity shares for cash consideration of $26,000. This amount has been debited to Pepsi’s Investment in Sprite.
Pepsi Sprite Tango $000 $000 $000Assets 1,000 800 500Investment in Sprite 326 – – Investment in Tango 165 – – ––––– ––––– ––––– 1,491 800 500 ––––– ––––– –––––Equity Equity shares $1 500 200 100Retained earnings 391 100 200 ––––– ––––– ––––– 891 300 300Liabilities 600 500 200 ––––– ––––– ––––– 1,491 800 500 ––––– ––––– –––––
chapter 7
KAPLAN PUBLISHING 243
Test your understanding 9 Pepsi
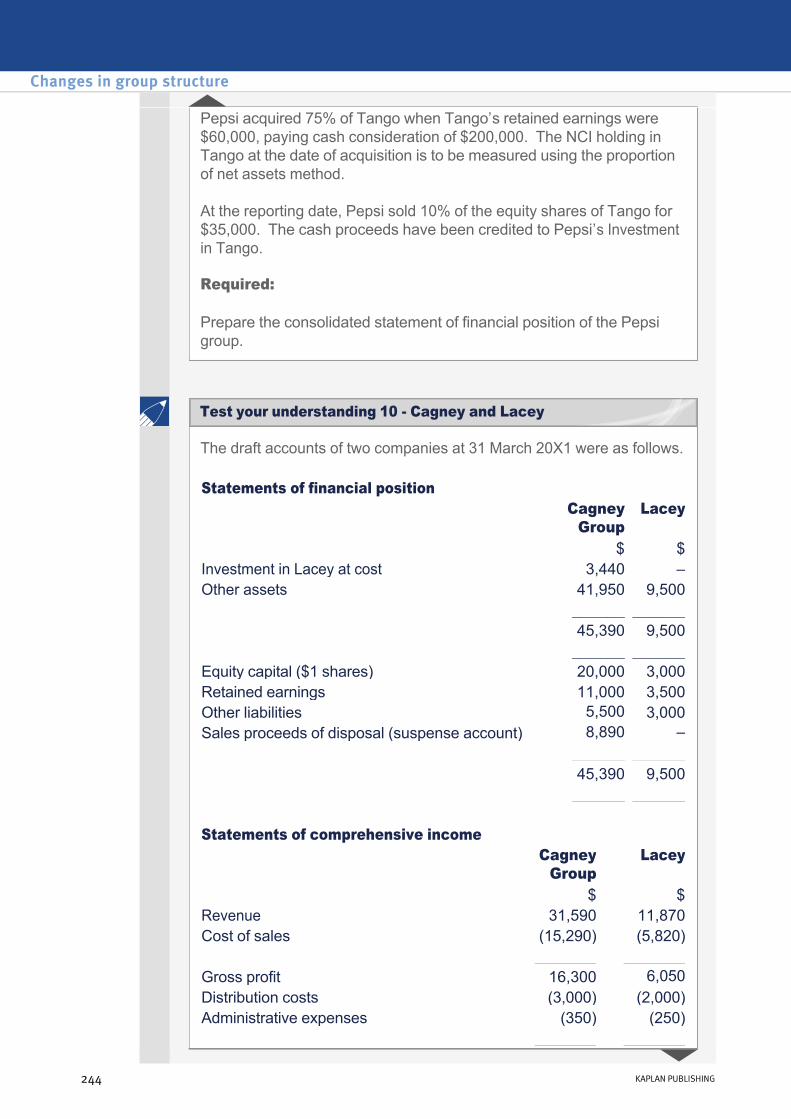
Pepsi acquired 75% of Tango when Tango’s retained earnings were $60,000, paying cash consideration of $200,000. The NCI holding in Tango at the date of acquisition is to be measured using the proportion of net assets method.
At the reporting date, Pepsi sold 10% of the equity shares of Tango for $35,000. The cash proceeds have been credited to Pepsi’s Investment in Tango.
Required:
Prepare the consolidated statement of financial position of the Pepsi group.
The draft accounts of two companies at 31 March 20X1 were as follows.
Statements of financial position Cagney
Group Lacey
$ $Investment in Lacey at cost 3,440 – Other assets 41,950 9,500 ______ ______ 45,390 9,500 ______ ______Equity capital ($1 shares) 20,000 3,000Retained earnings 11,000 3,500Other liabilities 5,500 3,000Sales proceeds of disposal (suspense account) 8,890 – ______ ______ 45,390 9,500 ______ ______ Statements of comprehensive income Cagney
Group Lacey
$ $Revenue 31,590 11,870Cost of sales (15,290) (5,820) _______ _______Gross profit 16,300 6,050Distribution costs (3,000) (2,000)Administrative expenses (350) (250) _______ _______
Changes in group structure
244 KAPLAN PUBLISHING
Test your understanding 10 Cagney and Lacey

The equity of each company on 1 April 20X0 was as follows:
Cagney had acquired 90% of Lacey when the reserves of Lacey were $700. Goodwill of $110 has been fully impaired. The Cagney group includes other fully owned subsidiaries.
On 31 December 20X0, Cagney sold 15% of the shares in Lacey .
Goodwill is calculated on a proportionate basis (i.e. share of net assets).
Required:
Prepare the Cagney Group statement of financial position at 31 March 20X1 and statement of comprehensive income for the year ended 31 March 20X1. Also prepare the statement of changes in equity for the current year.
Profit before tax 12,950 3,800Tax (5,400) (2,150) _______ ______Profit after tax for the year 7,550 1,650Other comprehensive income – – _______ _______Total comprehensive income 7,550 1,650
_______ _______
Cagney Lacey $ $
Equity brought forward 23,450 4,850
13 Business reorganisationsReasons for reorganisation
There are a number of reasons why a group may wish to reorganise. These include the following.
• A group may wish to list on a public stock exchange. This is usually facilitated by creating a new holding company and keeping the business of the group in subsidiary entities.
• Reorganisation is forced by a group of stakeholders e.g. by lender where debt covenants are breached.
• The ownership of subsidiaries may be transferred from one group company to another. This is often the case if the group wishes to sell a subsidiary, but retain its trade.
• Part of a business is hived off into a separate group (a 'demerger' arrangement).
chapter 7
KAPLAN PUBLISHING 245

• An unlisted entity may purchase a listed entity with the aim of achieving a stock exchange listing itself. This is called a reverse acquisition.
Types of group reorganisations
There are a number of ways of effecting a group reorganisation. The type of reorganisation will depend on what the group is trying to achieve.
New holding company
A group might set up a new holding entity for an existing group in order to improve coordination within the group or as a vehicle for flotation.
IFRS 3 excludes from its scope any business combination involving entities or businesses under ‘common control’, which is where the same parties control all of the combining entities/businesses both before and after the business combination.
As there is no mandatory guidance in accounting for these items, the acquisition method should certainly be used in examination questions.
• H becomes the new holding entity of S.
• Usually, H issues shares to the shareholders of S in exchange for shares of S, but occasionally the shareholders of S may subscribe for shares in H and H may pay cash for S.
Change of ownership of an entity within a group
This occurs when the internal structure of the group changes, for example, a parent may transfer the ownership of a subsidiary to another of its subsidiaries.
The key thing to remember is that the reorganisation of the entities within the group should not affect the group accounts, as shareholdings are transferred from one company to another and no assets will leave the group.
The individual accounts of the group companies will need to be adjusted for the effect of the transfer.
Changes in group structure
246 KAPLAN PUBLISHING
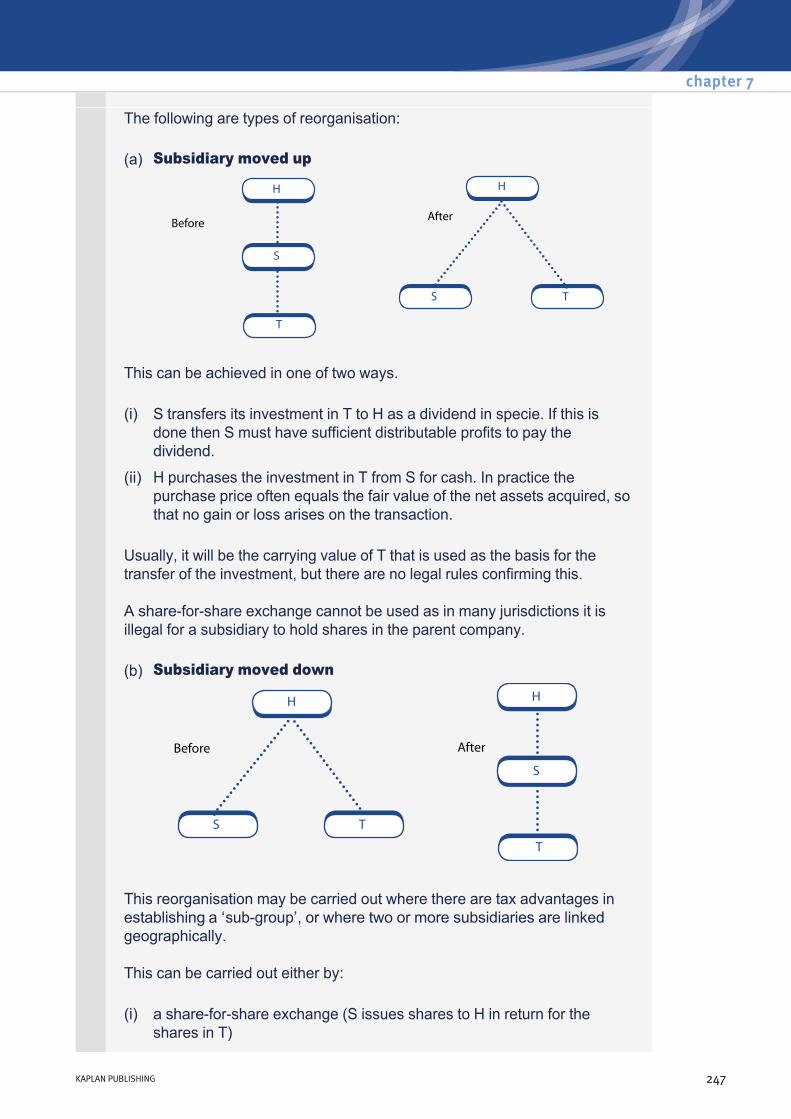
The following are types of reorganisation:
This can be achieved in one of two ways.
Usually, it will be the carrying value of T that is used as the basis for the transfer of the investment, but there are no legal rules confirming this.
A shareforshare exchange cannot be used as in many jurisdictions it is illegal for a subsidiary to hold shares in the parent company.
This reorganisation may be carried out where there are tax advantages in establishing a ‘subgroup’, or where two or more subsidiaries are linked geographically.
This can be carried out either by:
(a) Subsidiary moved up
(i) S transfers its investment in T to H as a dividend in specie. If this is done then S must have sufficient distributable profits to pay the dividend.
(ii) H purchases the investment in T from S for cash. In practice the purchase price often equals the fair value of the net assets acquired, so that no gain or loss arises on the transaction.
(b) Subsidiary moved down
(i) a shareforshare exchange (S issues shares to H in return for the shares in T)
chapter 7
KAPLAN PUBLISHING 247
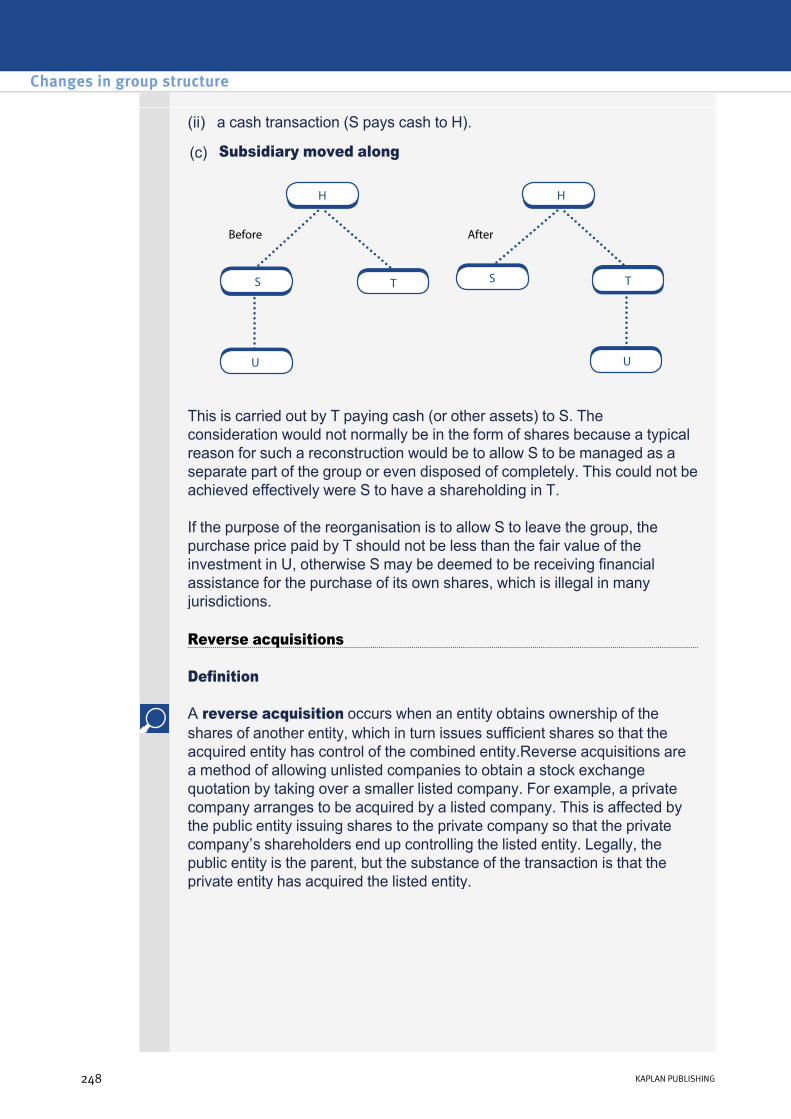
This is carried out by T paying cash (or other assets) to S. The consideration would not normally be in the form of shares because a typical reason for such a reconstruction would be to allow S to be managed as a separate part of the group or even disposed of completely. This could not be achieved effectively were S to have a shareholding in T.
If the purpose of the reorganisation is to allow S to leave the group, the purchase price paid by T should not be less than the fair value of the investment in U, otherwise S may be deemed to be receiving financial assistance for the purchase of its own shares, which is illegal in many jurisdictions.
(ii) a cash transaction (S pays cash to H).
(c) Subsidiary moved along
Reverse acquisitions
Definition
A reverse acquisition occurs when an entity obtains ownership of the shares of another entity, which in turn issues sufficient shares so that the acquired entity has control of the combined entity.Reverse acquisitions are a method of allowing unlisted companies to obtain a stock exchange quotation by taking over a smaller listed company. For example, a private company arranges to be acquired by a listed company. This is affected by the public entity issuing shares to the private company so that the private company’s shareholders end up controlling the listed entity. Legally, the public entity is the parent, but the substance of the transaction is that the private entity has acquired the listed entity.
Changes in group structure
248 KAPLAN PUBLISHING
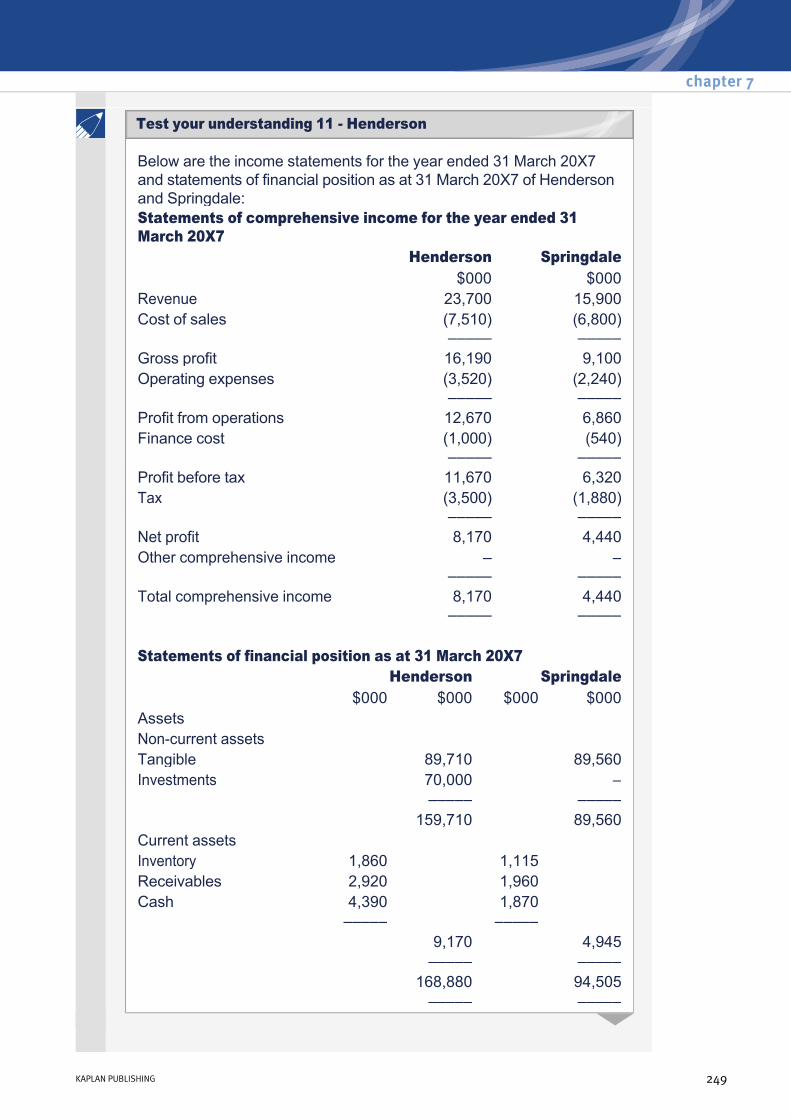
Below are the income statements for the year ended 31 March 20X7 and statements of financial position as at 31 March 20X7 of Henderson and Springdale:Statements of comprehensive income for the year ended 31 March 20X7 Henderson Springdale $000 $000Revenue 23,700 15,900Cost of sales (7,510)
––––– (6,800)
––––– Gross profit 16,190 9,100Operating expenses (3,520)
––––– (2,240)
––––– Profit from operations 12,670 6,860Finance cost (1,000)
––––– (540)
––––– Profit before tax 11,670 6,320Tax (3,500)
––––– (1,880)
––––– Net profit 8,170 4,440Other comprehensive income –
––––– –
––––– Total comprehensive income 8,170
––––– 4,440
–––––
Statements of financial position as at 31 March 20X7 Henderson Springdale
$000 $000 $000 $000Assets Noncurrent assets Tangible 89,710 89,560Investments 70,000 – ––––– ––––– 159,710 89,560Current assets Inventory 1,860 1,115 Receivables 2,920 1,960 Cash 4,390 1,870 ––––– ––––– 9,170 4,945 ––––– ––––– 168,880 94,505 ––––– –––––
chapter 7
KAPLAN PUBLISHING 249
Test your understanding 11 Henderson
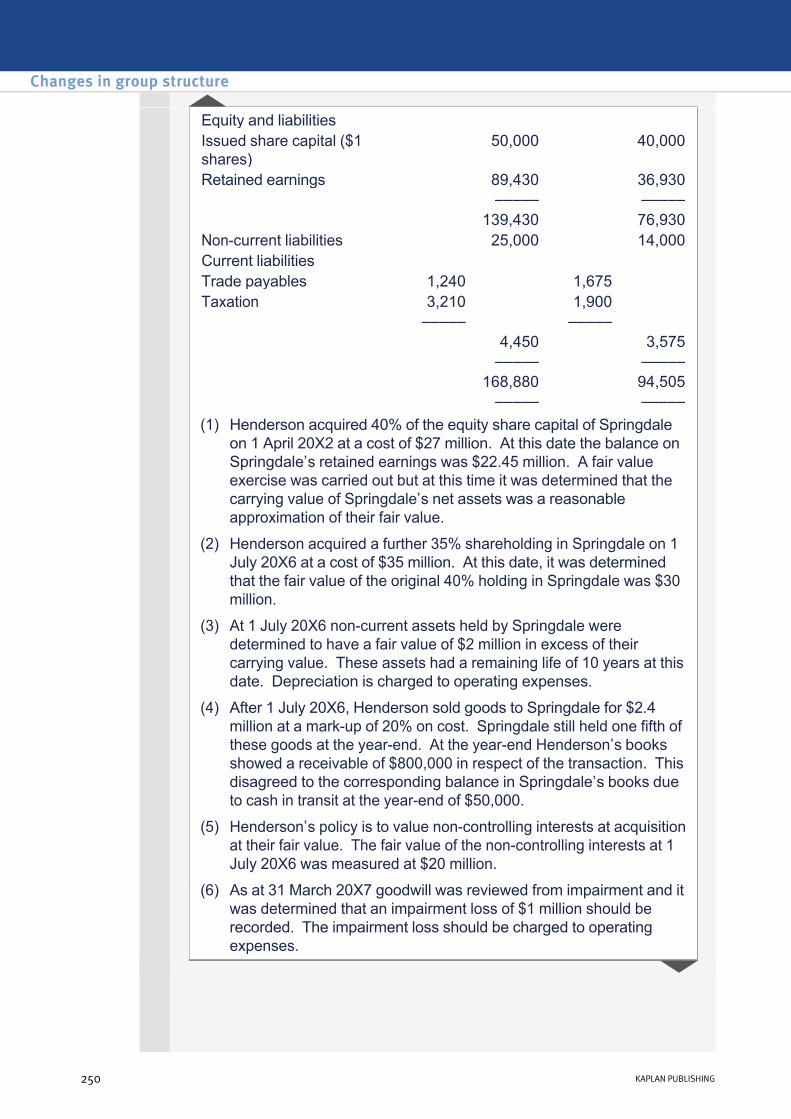
Equity and liabilities Issued share capital ($1 shares)
50,000 40,000
Retained earnings 89,430 36,930 ––––– ––––– 139,430 76,930Noncurrent liabilities 25,000 14,000Current liabilities Trade payables 1,240 1,675 Taxation 3,210 1,900 ––––– ––––– 4,450 3,575 ––––– ––––– 168,880 94,505 ––––– –––––(1) Henderson acquired 40% of the equity share capital of Springdale
on 1 April 20X2 at a cost of $27 million. At this date the balance on Springdale’s retained earnings was $22.45 million. A fair value exercise was carried out but at this time it was determined that the carrying value of Springdale’s net assets was a reasonable approximation of their fair value.
(2) Henderson acquired a further 35% shareholding in Springdale on 1 July 20X6 at a cost of $35 million. At this date, it was determined that the fair value of the original 40% holding in Springdale was $30 million.
(3) At 1 July 20X6 noncurrent assets held by Springdale were determined to have a fair value of $2 million in excess of their carrying value. These assets had a remaining life of 10 years at this date. Depreciation is charged to operating expenses.
(4) After 1 July 20X6, Henderson sold goods to Springdale for $2.4 million at a markup of 20% on cost. Springdale still held one fifth of these goods at the yearend. At the yearend Henderson’s books showed a receivable of $800,000 in respect of the transaction. This disagreed to the corresponding balance in Springdale’s books due to cash in transit at the yearend of $50,000.
(5) Henderson’s policy is to value noncontrolling interests at acquisition at their fair value. The fair value of the noncontrolling interests at 1 July 20X6 was measured at $20 million.
(6) As at 31 March 20X7 goodwill was reviewed from impairment and it was determined that an impairment loss of $1 million should be recorded. The impairment loss should be charged to operating expenses.
Changes in group structure
250 KAPLAN PUBLISHING
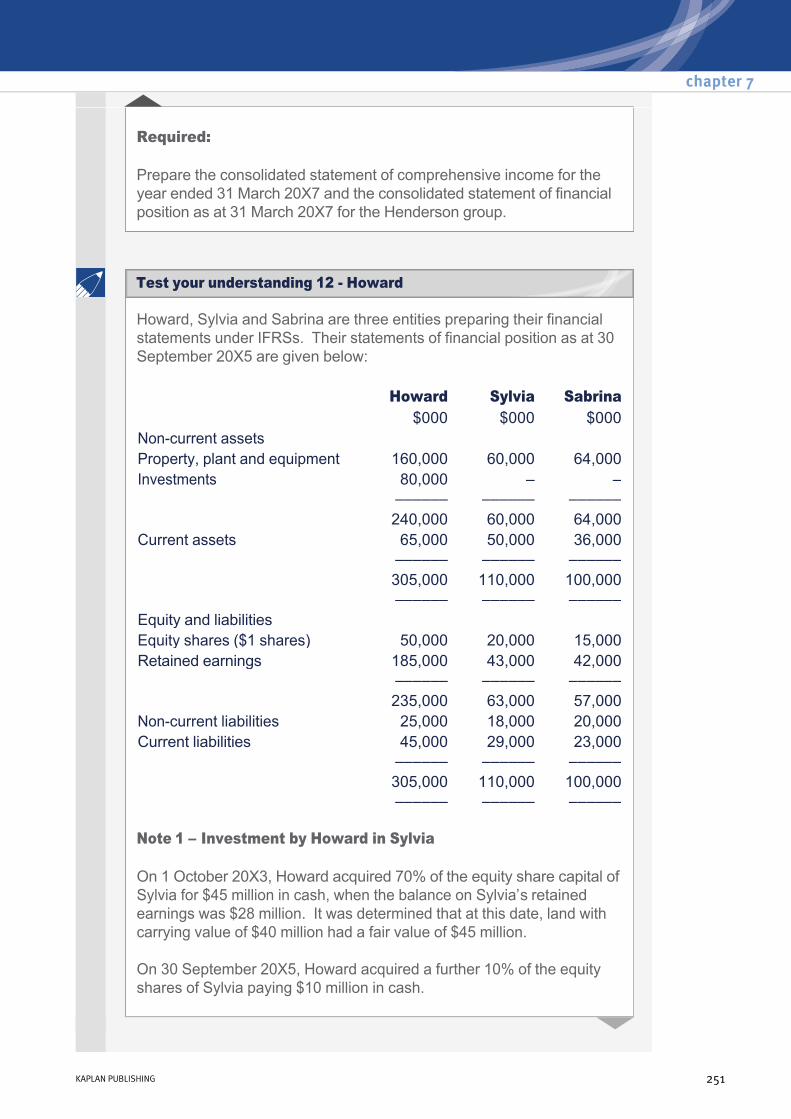
Required:
Prepare the consolidated statement of comprehensive income for the year ended 31 March 20X7 and the consolidated statement of financial position as at 31 March 20X7 for the Henderson group.
Howard, Sylvia and Sabrina are three entities preparing their financial statements under IFRSs. Their statements of financial position as at 30 September 20X5 are given below:
Note 1 – Investment by Howard in Sylvia
On 1 October 20X3, Howard acquired 70% of the equity share capital of Sylvia for $45 million in cash, when the balance on Sylvia’s retained earnings was $28 million. It was determined that at this date, land with carrying value of $40 million had a fair value of $45 million.
On 30 September 20X5, Howard acquired a further 10% of the equity shares of Sylvia paying $10 million in cash.
Howard Sylvia Sabrina $000 $000 $000Noncurrent assets Property, plant and equipment 160,000 60,000 64,000Investments 80,000 – – –––––– –––––– –––––– 240,000 60,000 64,000Current assets 65,000 50,000 36,000 –––––– –––––– –––––– 305,000 110,000 100,000 –––––– –––––– ––––––Equity and liabilities Equity shares ($1 shares) 50,000 20,000 15,000Retained earnings 185,000 43,000 42,000 –––––– –––––– –––––– 235,000 63,000 57,000Noncurrent liabilities 25,000 18,000 20,000Current liabilities 45,000 29,000 23,000 –––––– –––––– –––––– 305,000 110,000 100,000 –––––– –––––– ––––––
chapter 7
KAPLAN PUBLISHING 251
Test your understanding 12 Howard
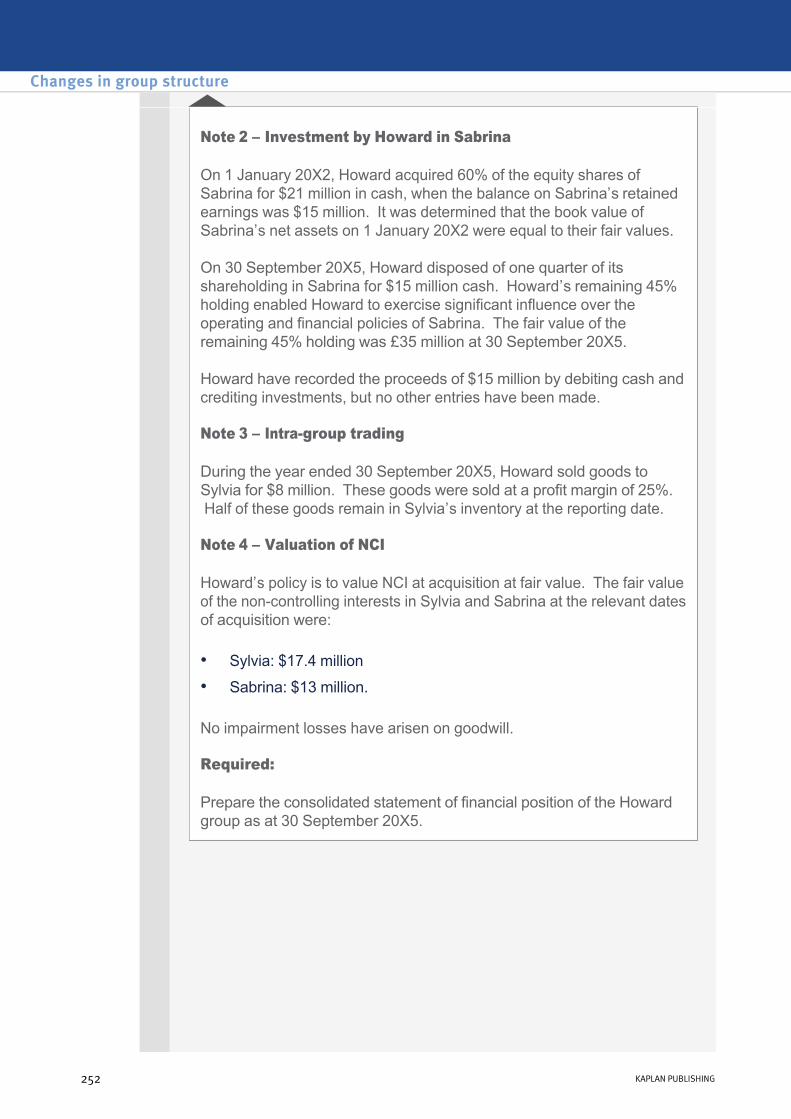
Note 2 – Investment by Howard in Sabrina
On 1 January 20X2, Howard acquired 60% of the equity shares of Sabrina for $21 million in cash, when the balance on Sabrina’s retained earnings was $15 million. It was determined that the book value of Sabrina’s net assets on 1 January 20X2 were equal to their fair values.
On 30 September 20X5, Howard disposed of one quarter of its shareholding in Sabrina for $15 million cash. Howard’s remaining 45% holding enabled Howard to exercise significant influence over the operating and financial policies of Sabrina. The fair value of the remaining 45% holding was £35 million at 30 September 20X5.
Howard have recorded the proceeds of $15 million by debiting cash and crediting investments, but no other entries have been made.
Note 3 – Intragroup trading
During the year ended 30 September 20X5, Howard sold goods to Sylvia for $8 million. These goods were sold at a profit margin of 25%. Half of these goods remain in Sylvia’s inventory at the reporting date.
Note 4 – Valuation of NCI
Howard’s policy is to value NCI at acquisition at fair value. The fair value of the noncontrolling interests in Sylvia and Sabrina at the relevant dates of acquisition were:
No impairment losses have arisen on goodwill.
Required:
Prepare the consolidated statement of financial position of the Howard group as at 30 September 20X5.
• Sylvia: $17.4 million
• Sabrina: $13 million.
Changes in group structure
252 KAPLAN PUBLISHING

14 Chapter summary
chapter 7
KAPLAN PUBLISHING 253
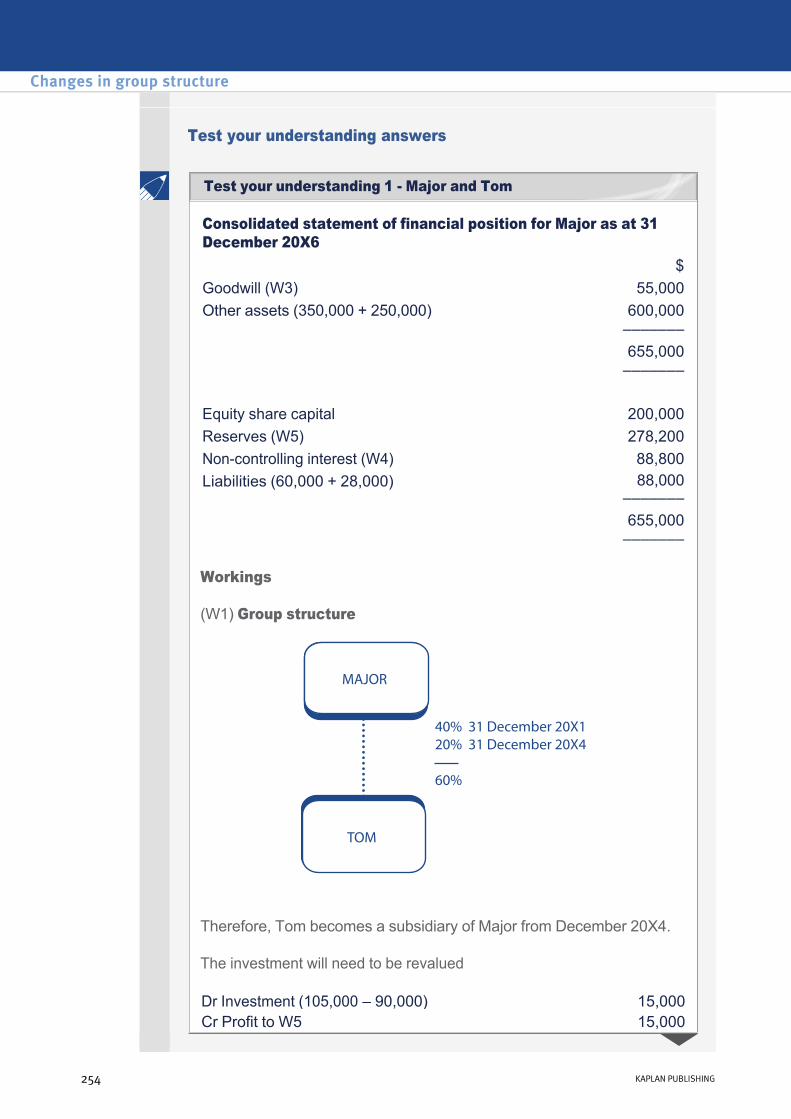
Test your understanding answers
Consolidated statement of financial position for Major as at 31 December 20X6 $Goodwill (W3) 55,000Other assets (350,000 + 250,000) 600,000
––––––– 655,000 –––––––
Workings
(W1) Group structure
Therefore, Tom becomes a subsidiary of Major from December 20X4.
The investment will need to be revalued
Equity share capital 200,000Reserves (W5) 278,200Noncontrolling interest (W4) 88,800Liabilities (60,000 + 28,000) 88,000
––––––– 655,000 –––––––
Dr Investment (105,000 – 90,000) 15,000Cr Profit to W5 15,000
Changes in group structure
254 KAPLAN PUBLISHING
Test your understanding 1 Major and Tom
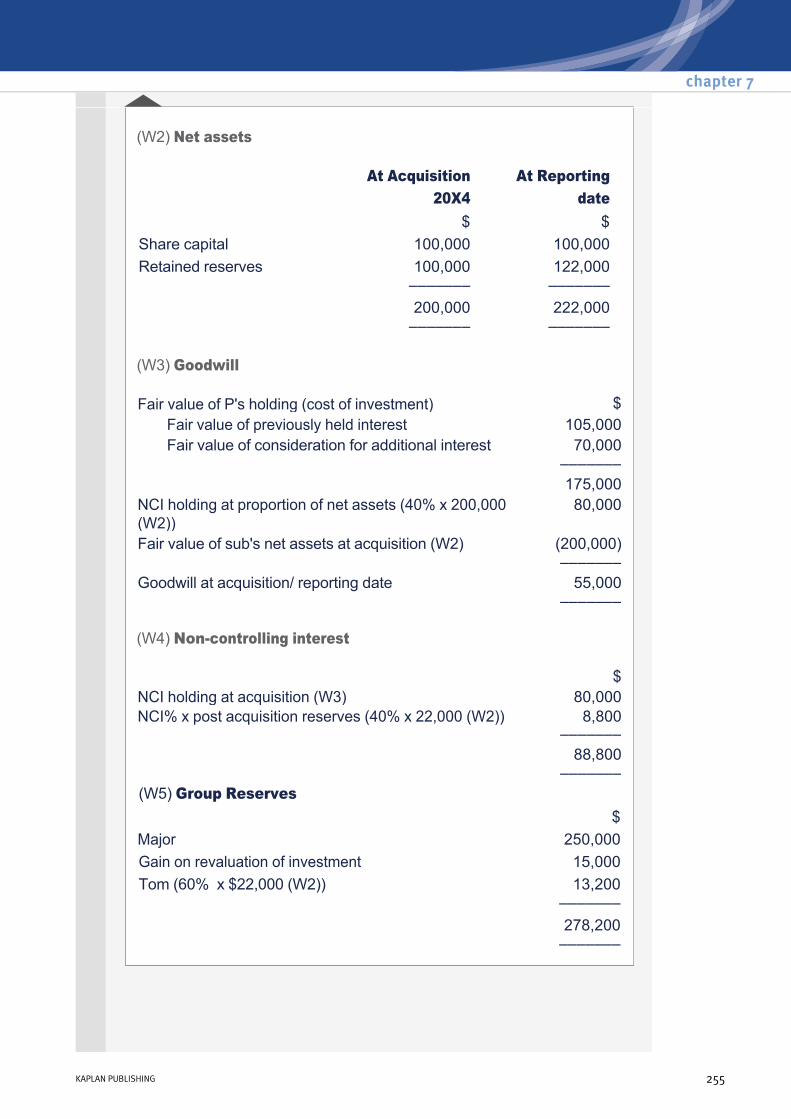
(W2) Net assets
(W3) Goodwill
(W4) Noncontrolling interest
At Acquisition At Reporting 20X4 date $ $
Share capital 100,000 100,000 Retained reserves 100,000
––––––– 122,000 –––––––
200,000 –––––––
222,000 –––––––
Fair value of P's holding (cost of investment) $Fair value of previously held interest 105,000Fair value of consideration for additional interest 70,000
––––––– 175,000
NCI holding at proportion of net assets (40% x 200,000 (W2))
80,000
Fair value of sub's net assets at acquisition (W2) (200,000) –––––––
Goodwill at acquisition/ reporting date 55,000 –––––––
$NCI holding at acquisition (W3) 80,000NCI% x post acquisition reserves (40% x 22,000 (W2)) 8,800
––––––– 88,800
––––––– (W5) Group Reserves $Major 250,000Gain on revaluation of investment 15,000Tom (60% x $22,000 (W2)) 13,200
––––––– 278,200 –––––––
chapter 7
KAPLAN PUBLISHING 255
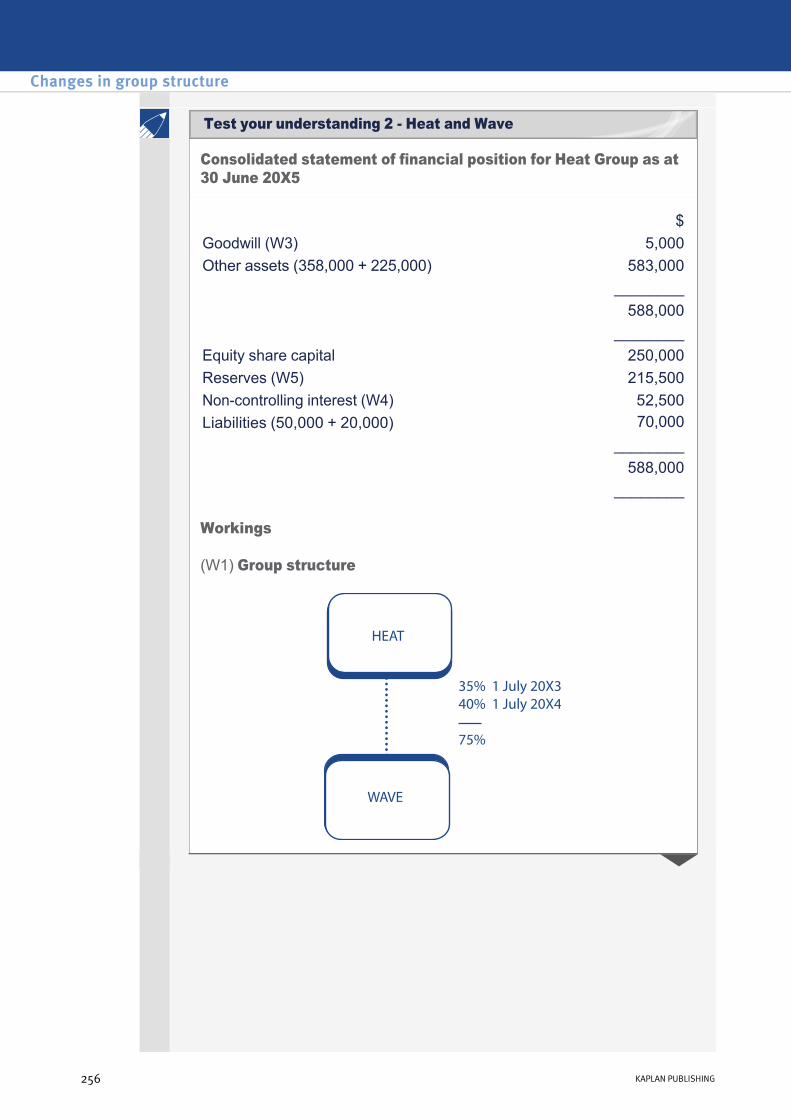
Consolidated statement of financial position for Heat Group as at 30 June 20X5
Workings
(W1) Group structure
$Goodwill (W3) 5,000Other assets (358,000 + 225,000) 583,000
________588,000
________Equity share capital 250,000Reserves (W5) 215,500Noncontrolling interest (W4) 52,500Liabilities (50,000 + 20,000) 70,000
________588,000
________
Changes in group structure
256 KAPLAN PUBLISHING
Test your understanding 2 Heat and Wave

Therefore, Wave becomes a subsidiary of Heat from 1 July 20X4.
The investment will need to be revalued:
(W2) Net assets
(W3) Goodwill
(W4) Noncontrolling interest
Dr Investment (70,000 – 62,000) 8,000 Cr Profit (to W5 as only SoFP being tested) 8,000
At Acquisition At Reporting 20X4 date $ $
Share capital 150,000 150,000 Retained earnings 45,000 55,000
________ ________195,000 205,000
________ ________
Fair value of P's holding (cost of investment) $Fair value of previously held interest 70,000Fair value of consideration for additional interest 80,000
––––––– 150,000
NCI holding at fair value 50,000Fair value of sub's net assets at acquisition (W2) (195,000) ––––––– Goodwill at acquisition/ reporting date 5,000 –––––––
$NCI holding at acquisition (W3) 50,000NCI% x post acquisition reserves (25% x 10,000 (W2)) 2,500 _______ 52,500 _______
chapter 7
KAPLAN PUBLISHING 257
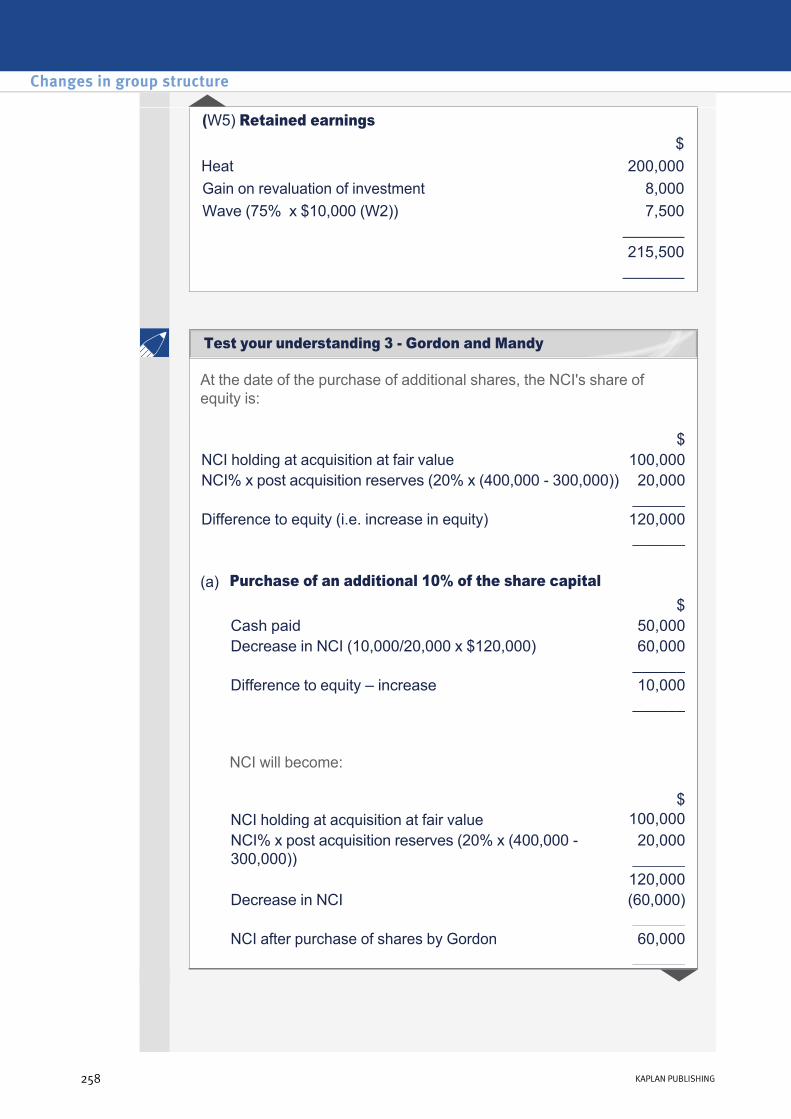
(W5) Retained earnings $Heat 200,000Gain on revaluation of investment 8,000Wave (75% x $10,000 (W2)) 7,500
_______215,500 _______
At the date of the purchase of additional shares, the NCI's share of equity is:
NCI will become:
$NCI holding at acquisition at fair value 100,000NCI% x post acquisition reserves (20% x (400,000 300,000)) 20,000
______Difference to equity (i.e. increase in equity) 120,000
______ (a) Purchase of an additional 10% of the share capital $
Cash paid 50,000Decrease in NCI (10,000/20,000 x $120,000) 60,000
______Difference to equity – increase 10,000
______
$NCI holding at acquisition at fair value 100,000NCI% x post acquisition reserves (20% x (400,000 300,000))
20,000 ______
120,000Decrease in NCI (60,000)
______NCI after purchase of shares by Gordon 60,000
______
Changes in group structure
258 KAPLAN PUBLISHING
Test your understanding 3 Gordon and Mandy
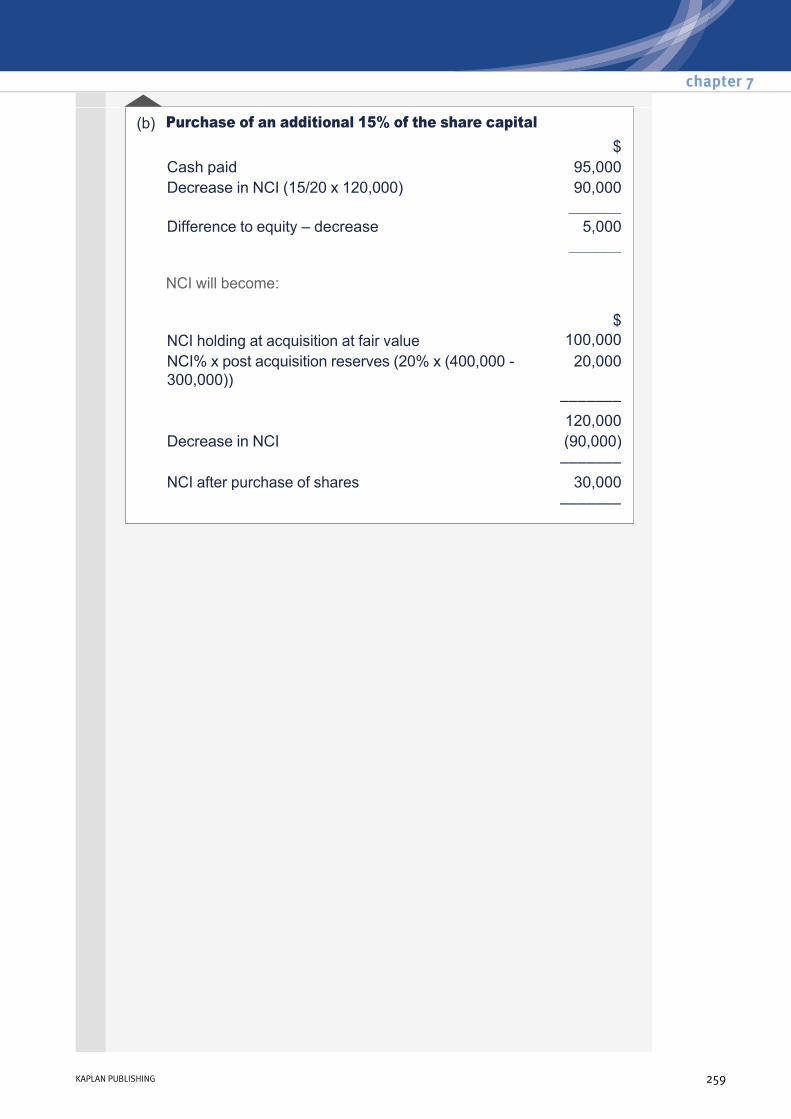
NCI will become:
(b) Purchase of an additional 15% of the share capital $
Cash paid 95,000Decrease in NCI (15/20 x 120,000) 90,000
______Difference to equity – decrease 5,000
______
$NCI holding at acquisition at fair value 100,000NCI% x post acquisition reserves (20% x (400,000 300,000))
20,000
––––––– 120,000
Decrease in NCI (90,000) –––––––
NCI after purchase of shares 30,000 –––––––
chapter 7
KAPLAN PUBLISHING 259

(a) Gain to Snooker
$000Sale proceeds 300Carrying value of investment disposed (cost) (100)
____Gain on disposal 200 Tax at 30% (30% x 200) 60
____
Workings
(W1) Goodwill
(b) Gain to group $000
Proceeds 300Fair value of retained interest
___300
Carrying value of investment disposedNet assets at disposal 110Goodwill at disposal (W1) 60NCI at disposal (W2) (32)
___(138)
Gain on disposal
___
162 ___Tax at 30% (per parent's individual FS) 60
___
$000Fair value of P's holding (cost of investment) 100NCI holding at fair value 22.5Fair value of sub's net assets at acquisition (62.5) –––– Goodwill at acquisition/ disposal 60 ––––
Changes in group structure
260 KAPLAN PUBLISHING
Test your understanding 4 Snooker
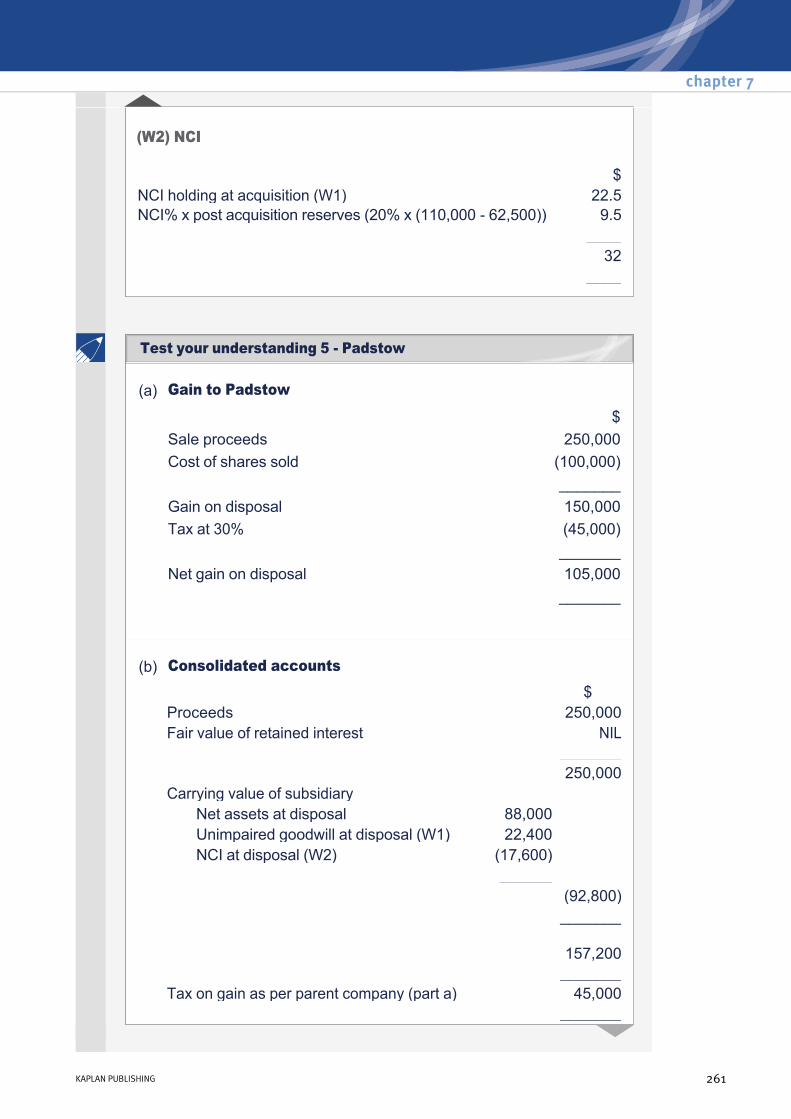
(W2) NCI
$NCI holding at acquisition (W1) 22.5NCI% x post acquisition reserves (20% x (110,000 62,500)) 9.5 ____ 32 ____
(a) Gain to Padstow
$Sale proceeds 250,000Cost of shares sold (100,000)
_______Gain on disposal 150,000Tax at 30% (45,000)
_______Net gain on disposal 105,000
_______
(b) Consolidated accounts $
Proceeds 250,000Fair value of retained interest NIL
_______250,000
Carrying value of subsidiaryNet assets at disposal 88,000Unimpaired goodwill at disposal (W1) 22,400NCI at disposal (W2) (17,600)
______(92,800)_______
157,200 _______
Tax on gain as per parent company (part a) 45,000 _______
chapter 7
KAPLAN PUBLISHING 261
Test your understanding 5 Padstow
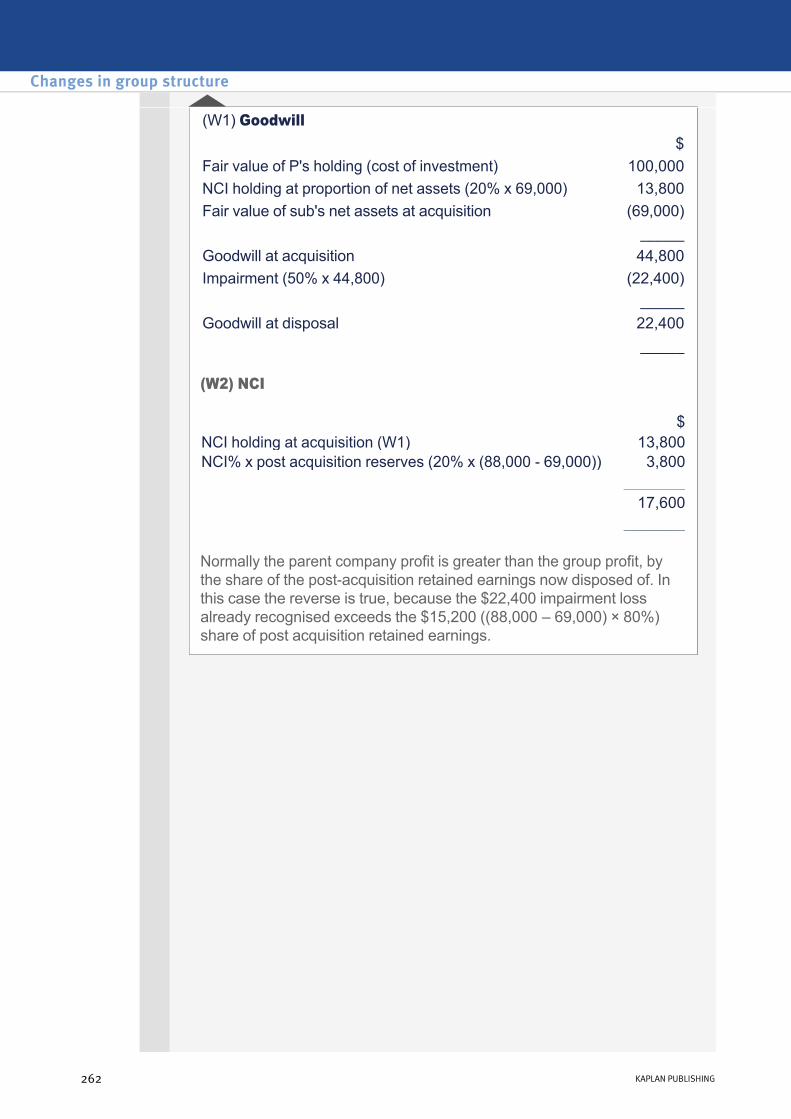
(W2) NCI
Normally the parent company profit is greater than the group profit, by the share of the postacquisition retained earnings now disposed of. In this case the reverse is true, because the $22,400 impairment loss already recognised exceeds the $15,200 ((88,000 – 69,000) × 80%) share of post acquisition retained earnings.
(W1) Goodwill $
Fair value of P's holding (cost of investment) 100,000NCI holding at proportion of net assets (20% x 69,000) 13,800Fair value of sub's net assets at acquisition (69,000)
_____Goodwill at acquisition 44,800Impairment (50% x 44,800) (22,400) _____Goodwill at disposal 22,400 _____
$NCI holding at acquisition (W1) 13,800NCI% x post acquisition reserves (20% x (88,000 69,000)) 3,800 _______ 17,600 _______
Changes in group structure
262 KAPLAN PUBLISHING

(a) (i) Gain in Hague's individual accounts
Sale proceeds
$
10,000Less cost of shares sold (6,000)
______Gain to parent 4,000Tax at 25% (1,000)
______Post tax gain 3,000
______
(a) (ii) Gain in Hague Group accounts $Sale proceeds 10,000Fair value of retained interest NIL Less carrying value of subsidiary disposed of:
Net assets of subsidiary at disposal date 3,000 Unimpaired goodwill at disposal date (W1) 2,500 Less: NCI at disposal (W2) (400)
_____ (5,100) _____Gain before tax 4,900Tax per part (a)(i) (1,000) _____Post tax gain to group 3,900 _____
chapter 7
KAPLAN PUBLISHING 263
Test your understanding 6 Hague
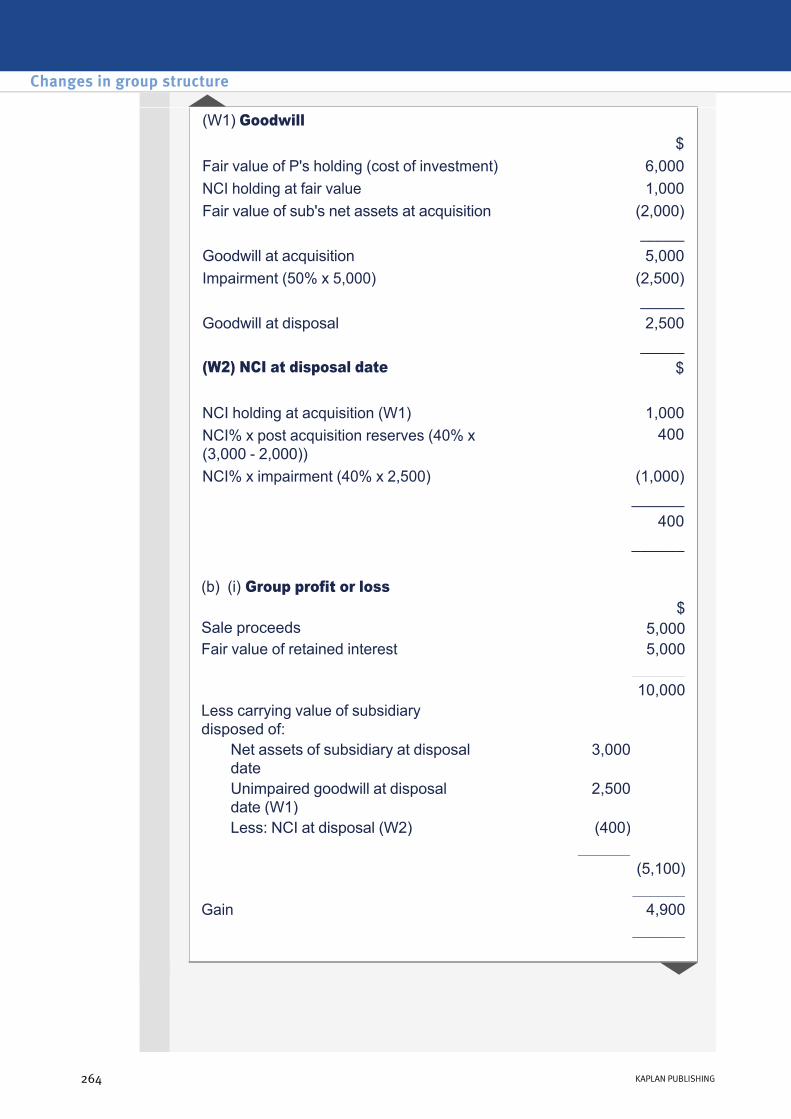
(W1) Goodwill $
Fair value of P's holding (cost of investment) 6,000NCI holding at fair value 1,000Fair value of sub's net assets at acquisition (2,000)
_____Goodwill at acquisition 5,000Impairment (50% x 5,000) (2,500) _____Goodwill at disposal 2,500 _____(W2) NCI at disposal date $
NCI holding at acquisition (W1) 1,000NCI% x post acquisition reserves (40% x (3,000 2,000))
400
NCI% x impairment (40% x 2,500) (1,000) ______
400 ______ (b) (i) Group profit or loss $Sale proceeds 5,000Fair value of retained interest 5,000
______10,000
Less carrying value of subsidiary disposed of:
Net assets of subsidiary at disposal date
3,000
Unimpaired goodwill at disposal date (W1)
2,500
Less: NCI at disposal (W2) (400) ______ (5,100)
______Gain 4,900 ______
Changes in group structure
264 KAPLAN PUBLISHING
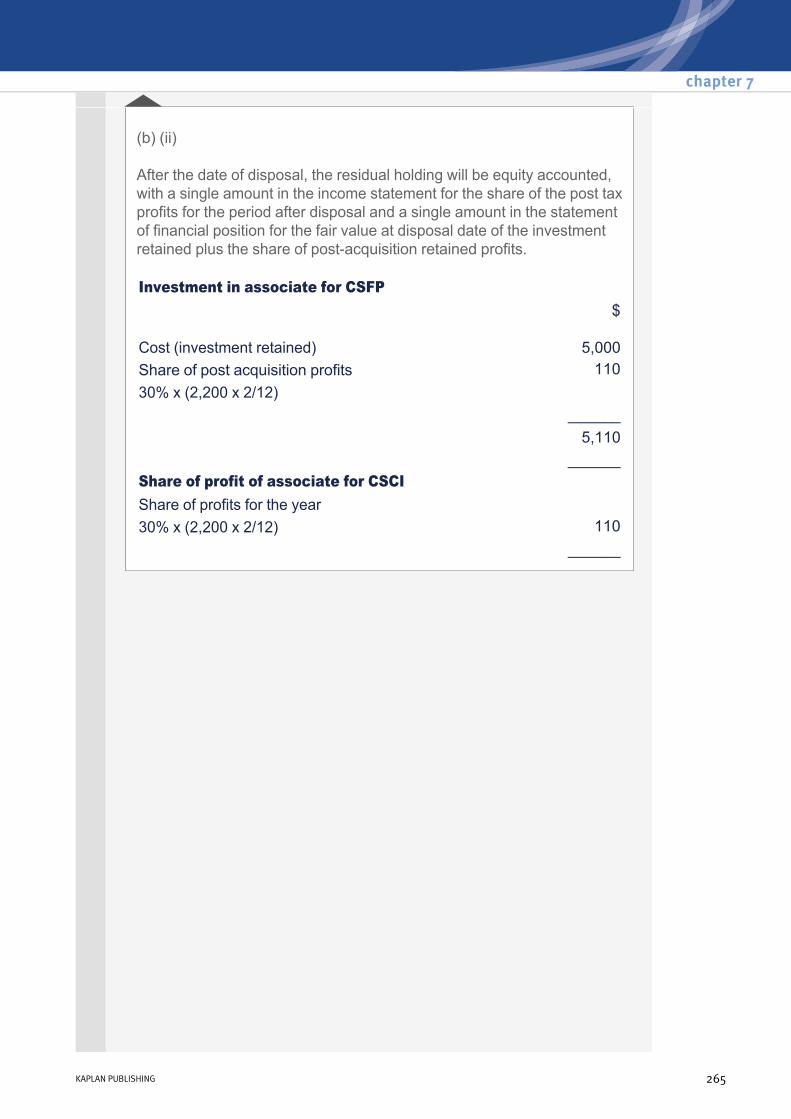
(b) (ii)
After the date of disposal, the residual holding will be equity accounted, with a single amount in the income statement for the share of the post tax profits for the period after disposal and a single amount in the statement of financial position for the fair value at disposal date of the investment retained plus the share of postacquisition retained profits.
Investment in associate for CSFP
Cost (investment retained)
$
5,000Share of post acquisition profits 11030% x (2,200 x 2/12)
______ 5,110
______Share of profit of associate for CSCI Share of profits for the year30% x (2,200 x 2/12) 110
______
chapter 7
KAPLAN PUBLISHING 265
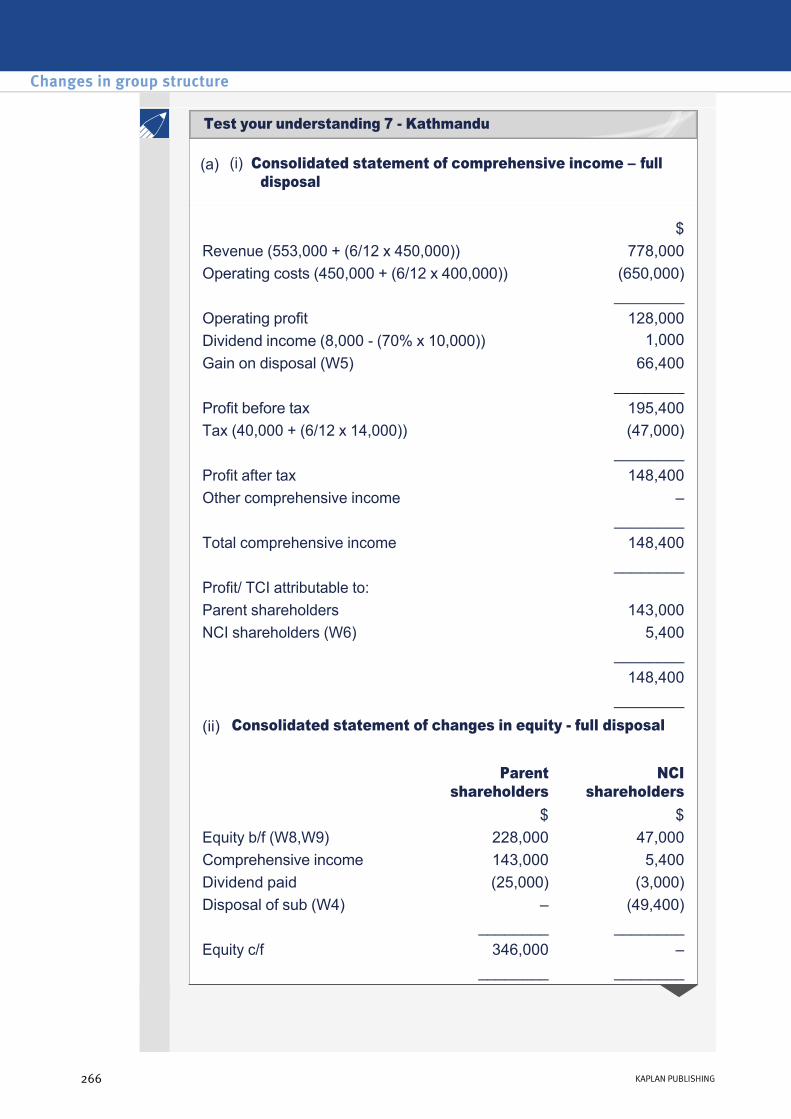
(a) (i) Consolidated statement of comprehensive income – full disposal
$Revenue (553,000 + (6/12 x 450,000)) 778,000Operating costs (450,000 + (6/12 x 400,000)) (650,000)
________Operating profit 128,000Dividend income (8,000 (70% x 10,000)) 1,000Gain on disposal (W5) 66,400
________Profit before tax 195,400Tax (40,000 + (6/12 x 14,000)) (47,000)
________Profit after tax 148,400Other comprehensive income – ________Total comprehensive income 148,400 ________Profit/ TCI attributable to: Parent shareholders 143,000NCI shareholders (W6) 5,400 ________ 148,400 ________
(ii) Consolidated statement of changes in equity full disposal
Parent shareholders
NCI shareholders
$ $Equity b/f (W8,W9) 228,000 47,000Comprehensive income 143,000 5,400Dividend paid (25,000) (3,000)Disposal of sub (W4) – (49,400) ________ ________Equity c/f 346,000 – ________ ________
Changes in group structure
266 KAPLAN PUBLISHING
Test your understanding 7 Kathmandu
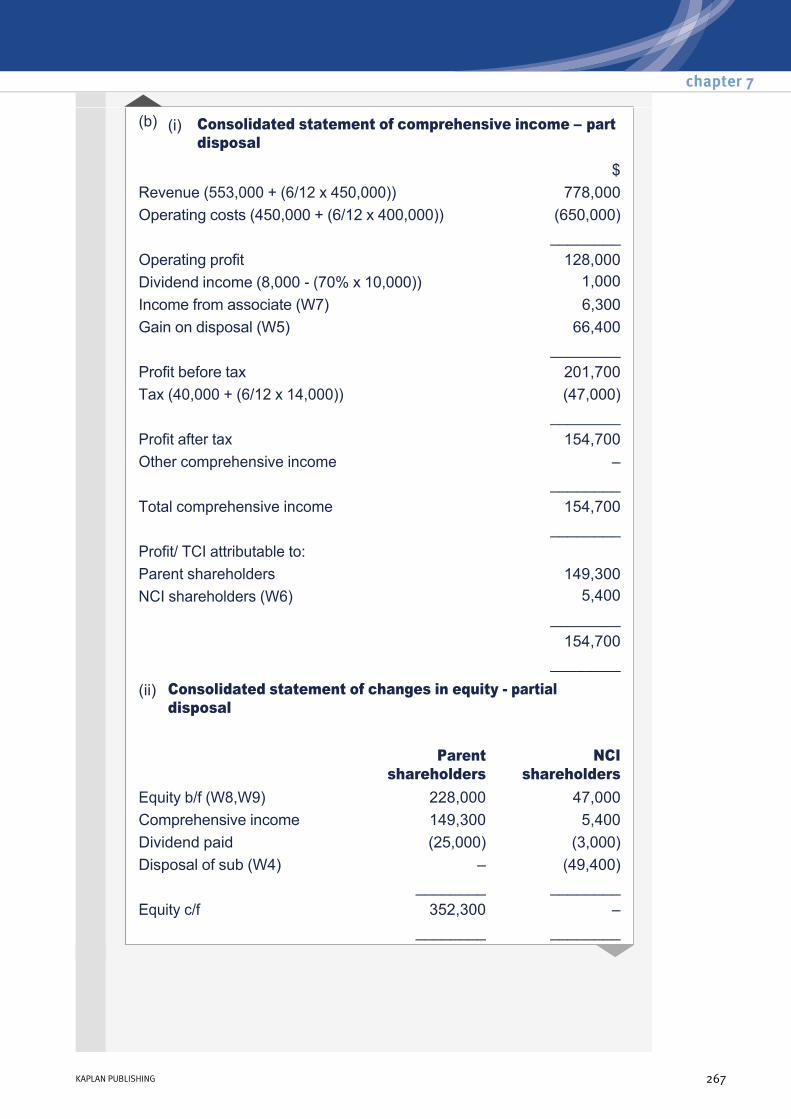
(b) (i) Consolidated statement of comprehensive income – part disposal
$Revenue (553,000 + (6/12 x 450,000)) 778,000Operating costs (450,000 + (6/12 x 400,000)) (650,000)
________Operating profit 128,000Dividend income (8,000 (70% x 10,000)) 1,000Income from associate (W7) 6,300Gain on disposal (W5) 66,400
________Profit before tax 201,700Tax (40,000 + (6/12 x 14,000)) (47,000)
________Profit after tax 154,700Other comprehensive income – ________Total comprehensive income 154,700 ________Profit/ TCI attributable to:Parent shareholders 149,300NCI shareholders (W6) 5,400
________154,700
________
(ii) Consolidated statement of changes in equity partial disposal
Parent
shareholders NCI
shareholders Equity b/f (W8,W9) 228,000 47,000Comprehensive income 149,300 5,400Dividend paid (25,000) (3,000)Disposal of sub (W4) – (49,400) ________ ________Equity c/f 352,300 – ________ ________
chapter 7
KAPLAN PUBLISHING 267
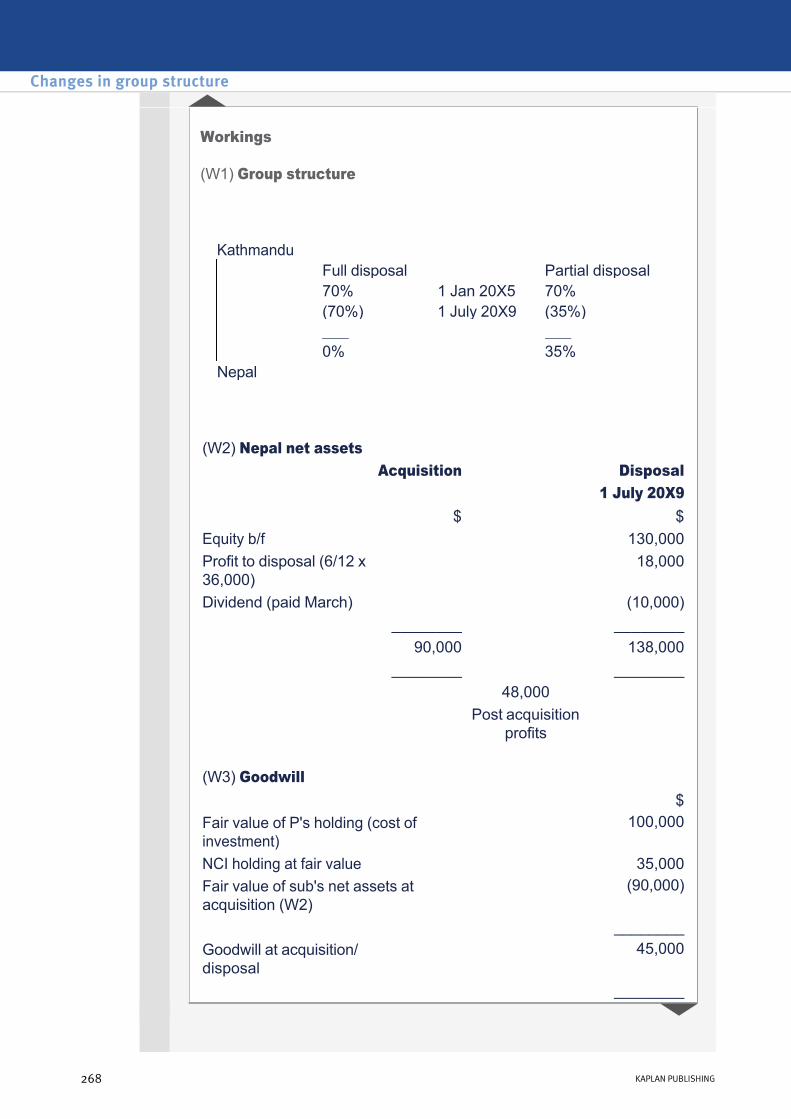
Workings
(W1) Group structure
Kathmandu Full disposal Partial disposal 70% 1 Jan 20X5 70% (70%) 1 July 20X9 (35%) ___ ___ 0% 35% Nepal
(W2) Nepal net assets Acquisition Disposal 1 July 20X9
$ $Equity b/f 130,000Profit to disposal (6/12 x 36,000)
18,000
Dividend (paid March) (10,000)________ ________
90,000 138,000________ ________
48,000 Post acquisition
profits
(W3) Goodwill $Fair value of P's holding (cost of investment)
100,000
NCI holding at fair value 35,000Fair value of sub's net assets at acquisition (W2)
(90,000)
________Goodwill at acquisition/ disposal
45,000
________
Changes in group structure
268 KAPLAN PUBLISHING
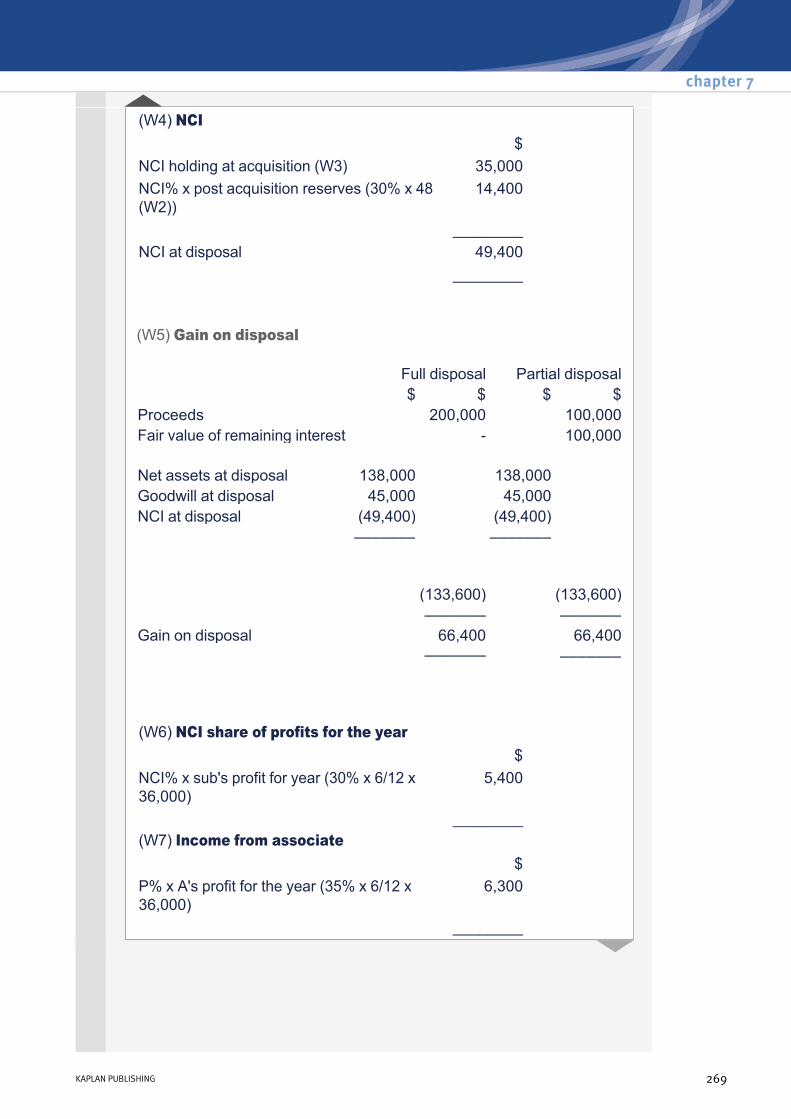
(W5) Gain on disposal
(W4) NCI $ NCI holding at acquisition (W3) 35,000NCI% x post acquisition reserves (30% x 48 (W2))
14,400
________NCI at disposal 49,400
________
Full disposal Partial disposal $ $ $ $Proceeds 200,000 100,000Fair value of remaining interest 100,000 Net assets at disposal 138,000 138,000 Goodwill at disposal 45,000 45,000 NCI at disposal (49,400) (49,400) –––––––
–––––––
(133,600) (133,600) ––––––– ––––––– Gain on disposal 66,400 66,400 ––––––– –––––––
(W6) NCI share of profits for the year $ NCI% x sub's profit for year (30% x 6/12 x 36,000)
5,400
________(W7) Income from associate $ P% x A's profit for the year (35% x 6/12 x 36,000)
6,300
________
chapter 7
KAPLAN PUBLISHING 269
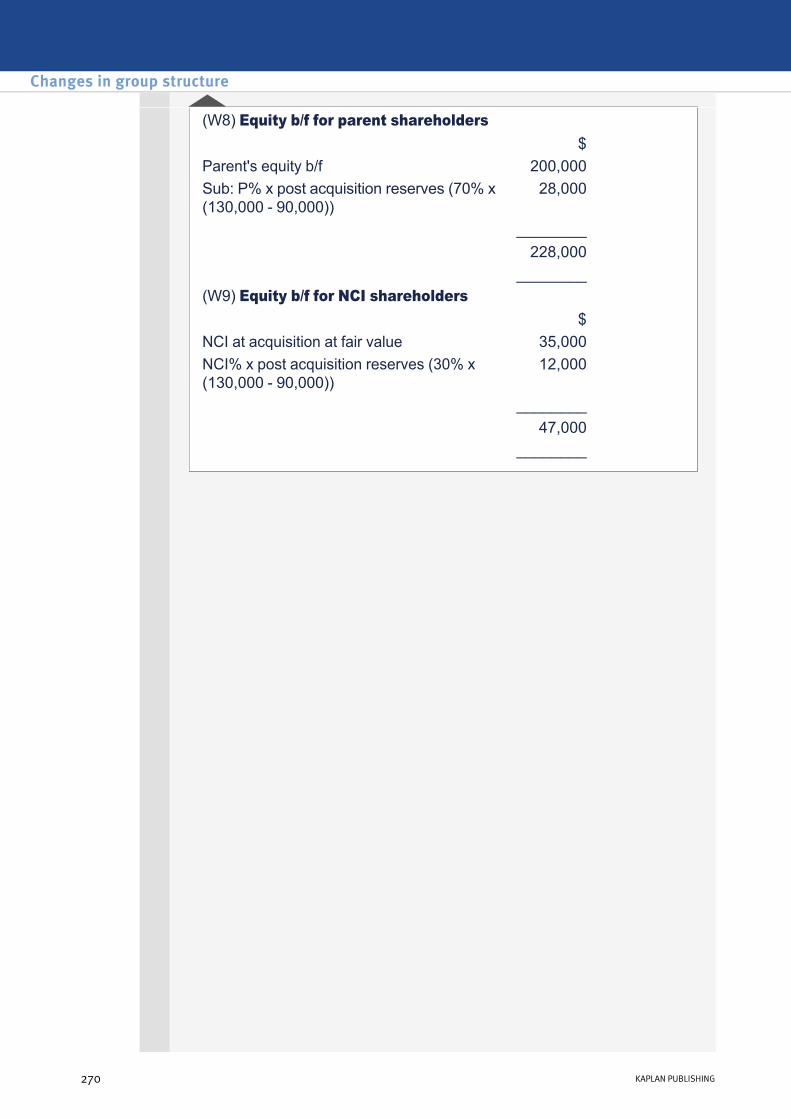
(W8) Equity b/f for parent shareholders $ Parent's equity b/f 200,000Sub: P% x post acquisition reserves (70% x (130,000 90,000))
28,000
________228,000
________(W9) Equity b/f for NCI shareholders $ NCI at acquisition at fair value 35,000NCI% x post acquisition reserves (30% x (130,000 90,000))
12,000
________47,000
________
Changes in group structure
270 KAPLAN PUBLISHING
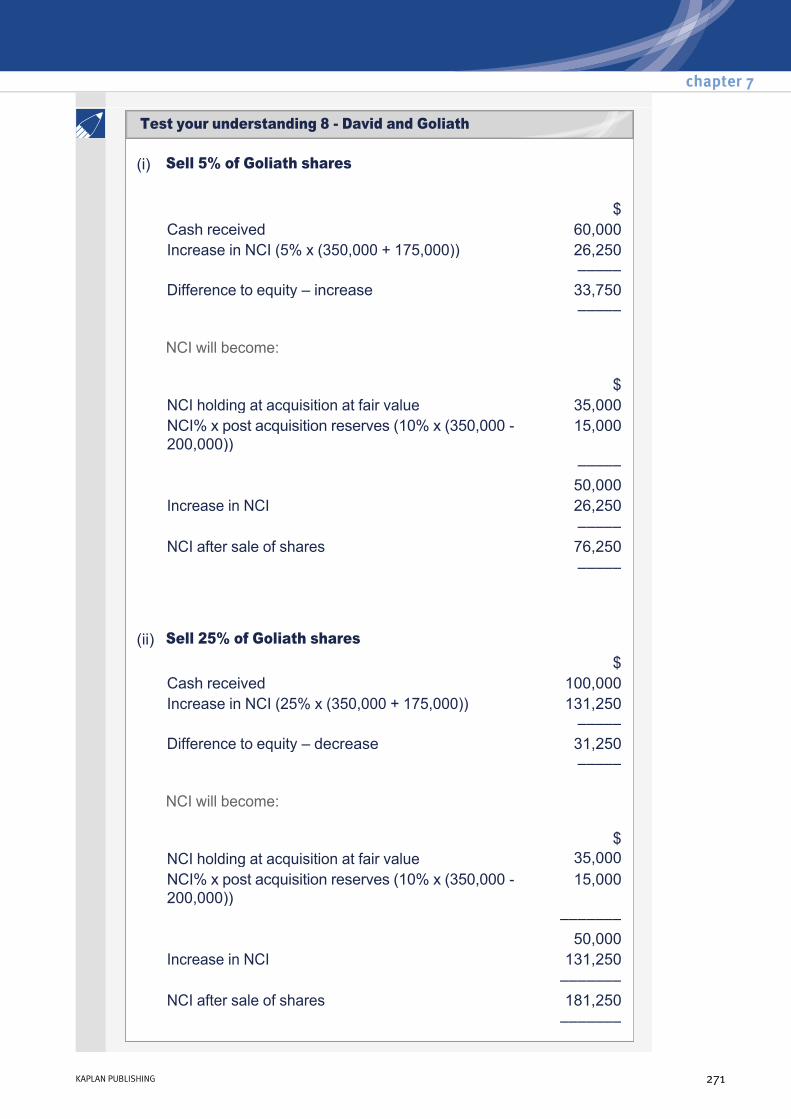
(i) Sell 5% of Goliath shares
NCI will become:
NCI will become:
$Cash received 60,000Increase in NCI (5% x (350,000 + 175,000)) 26,250
––––– Difference to equity – increase 33,750
–––––
$NCI holding at acquisition at fair value 35,000NCI% x post acquisition reserves (10% x (350,000 200,000))
15,000
––––– 50,000
Increase in NCI 26,250 –––––
NCI after sale of shares 76,250 –––––
(ii) Sell 25% of Goliath shares $
Cash received 100,000Increase in NCI (25% x (350,000 + 175,000)) 131,250
––––– Difference to equity – decrease 31,250
–––––
$NCI holding at acquisition at fair value 35,000NCI% x post acquisition reserves (10% x (350,000 200,000))
15,000
––––––– 50,000
Increase in NCI 131,250 –––––––
NCI after sale of shares 181,250 –––––––
chapter 7
KAPLAN PUBLISHING 271
Test your understanding 8 David and Goliath
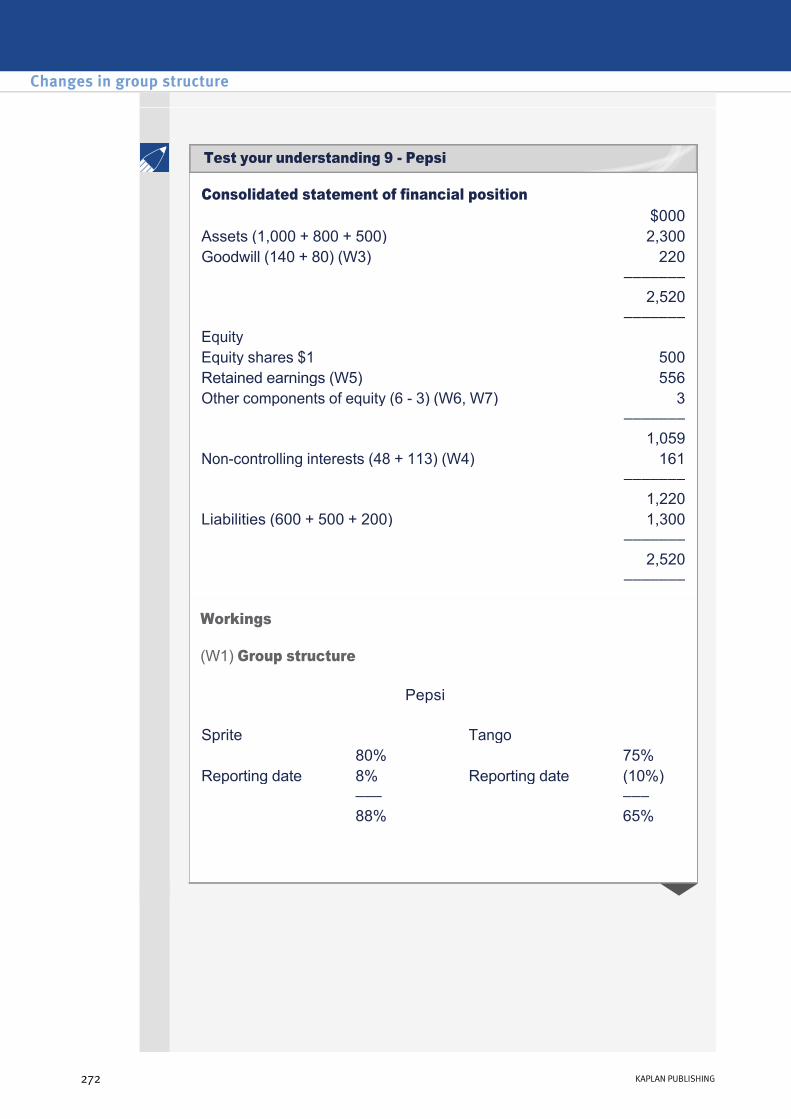
Consolidated statement of financial position $000Assets (1,000 + 800 + 500) 2,300Goodwill (140 + 80) (W3) 220 ––––––– 2,520 –––––––Equity Equity shares $1 500Retained earnings (W5) 556Other components of equity (6 3) (W6, W7) 3 ––––––– 1,059Noncontrolling interests (48 + 113) (W4) 161 ––––––– 1,220Liabilities (600 + 500 + 200) 1,300 ––––––– 2,520 –––––––
Workings
(W1) Group structure
Pepsi Sprite Tango 80% 75%Reporting date 8% Reporting date (10%) ––– ––– 88% 65%
Changes in group structure
272 KAPLAN PUBLISHING
Test your understanding 9 Pepsi
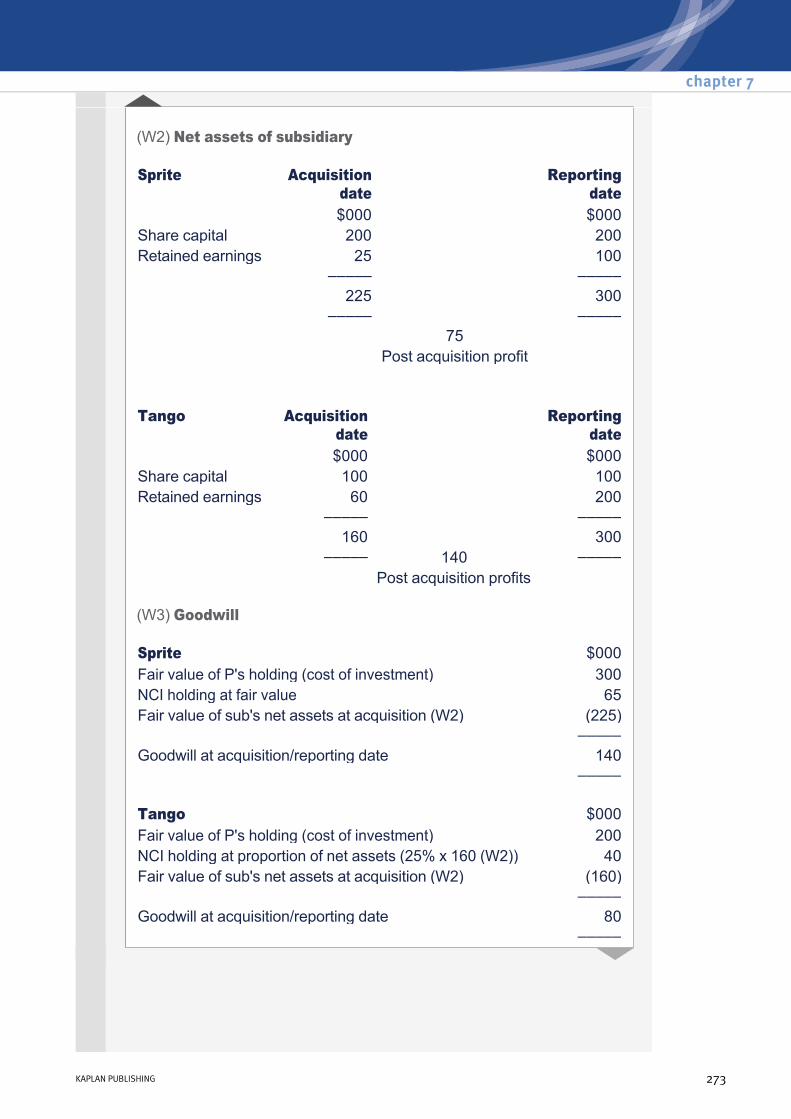
(W2) Net assets of subsidiary
(W3) Goodwill
Sprite Acquisition date
Reporting date
$000 $000Share capital 200 200Retained earnings 25 100 ––––– ––––– 225 300 ––––– ––––– 75 Post acquisition profit Tango Acquisition
date Reporting
date $000 $000Share capital 100 100Retained earnings 60 200 ––––– ––––– 160 300 ––––– 140 ––––– Post acquisition profits
Sprite $000Fair value of P's holding (cost of investment) 300NCI holding at fair value 65Fair value of sub's net assets at acquisition (W2) (225) –––––Goodwill at acquisition/reporting date 140 ––––– Tango $000Fair value of P's holding (cost of investment) 200NCI holding at proportion of net assets (25% x 160 (W2)) 40Fair value of sub's net assets at acquisition (W2) (160) –––––Goodwill at acquisition/reporting date 80 –––––
chapter 7
KAPLAN PUBLISHING 273
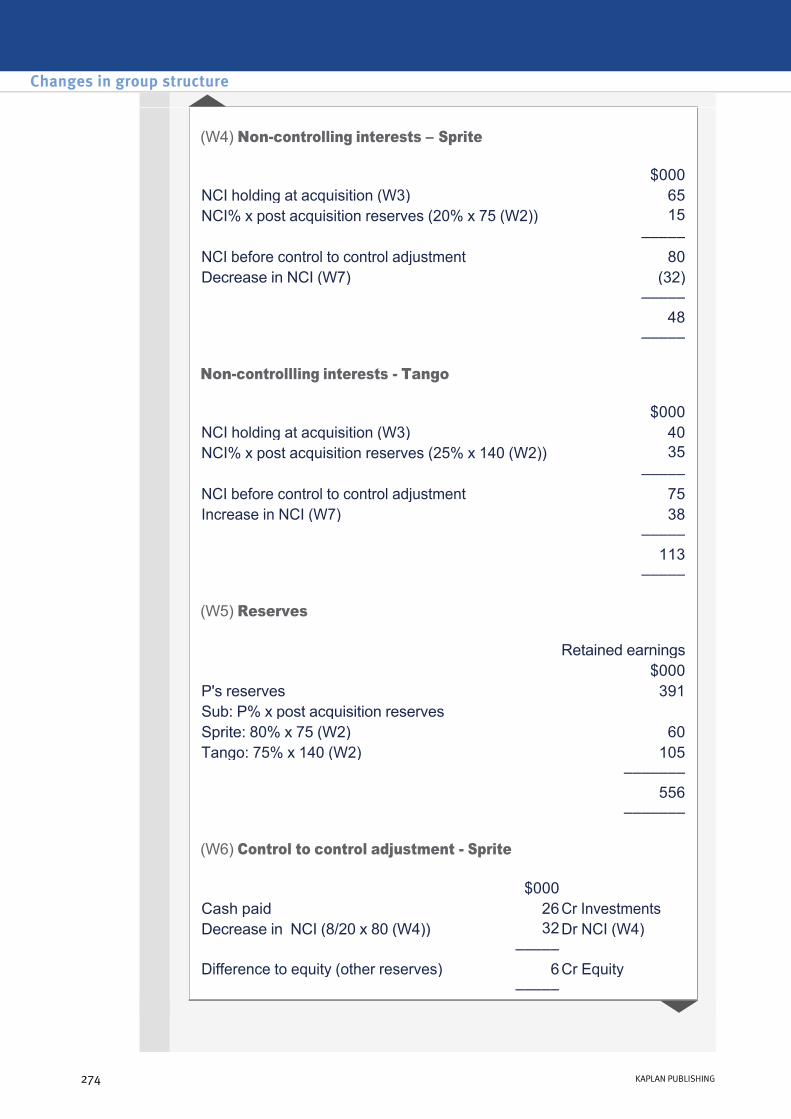
(W4) Noncontrolling interests – Sprite
Noncontrollling interests Tango
(W5) Reserves
(W6) Control to control adjustment Sprite
$000NCI holding at acquisition (W3) 65NCI% x post acquisition reserves (20% x 75 (W2)) 15 ––––– NCI before control to control adjustment 80Decrease in NCI (W7) (32) ––––– 48
–––––
$000NCI holding at acquisition (W3) 40NCI% x post acquisition reserves (25% x 140 (W2)) 35 ––––– NCI before control to control adjustment 75Increase in NCI (W7) 38 ––––– 113
–––––
Retained earnings$000
P's reserves 391Sub: P% x post acquisition reserves Sprite: 80% x 75 (W2) 60Tango: 75% x 140 (W2) 105 ––––––– 556 –––––––
$000 Cash paid 26Cr InvestmentsDecrease in NCI (8/20 x 80 (W4)) 32Dr NCI (W4) ––––– Difference to equity (other reserves) 6Cr Equity –––––
Changes in group structure
274 KAPLAN PUBLISHING
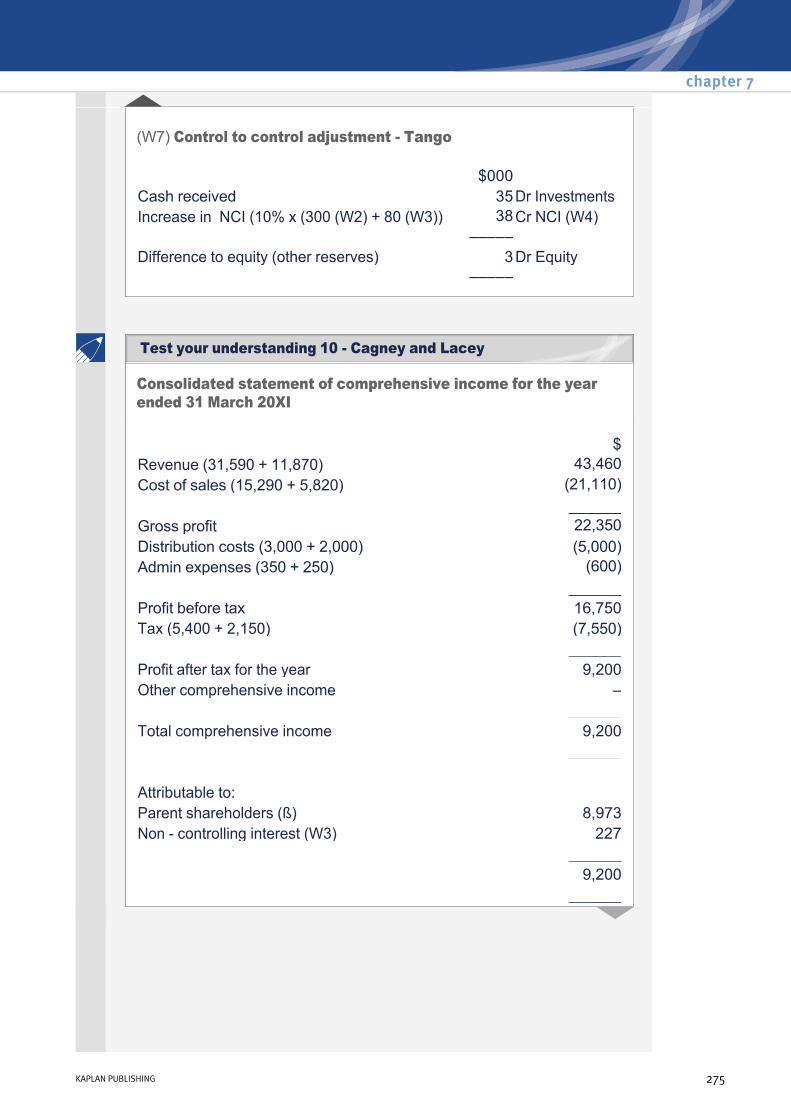
(W7) Control to control adjustment Tango
$000 Cash received 35Dr InvestmentsIncrease in NCI (10% x (300 (W2) + 80 (W3)) 38Cr NCI (W4) ––––– Difference to equity (other reserves) 3Dr Equity –––––
Consolidated statement of comprehensive income for the year ended 31 March 20XI
$Revenue (31,590 + 11,870) 43,460Cost of sales (15,290 + 5,820) (21,110) ______Gross profit 22,350Distribution costs (3,000 + 2,000) (5,000)Admin expenses (350 + 250) (600) ______Profit before tax 16,750Tax (5,400 + 2,150) (7,550) ______Profit after tax for the year 9,200Other comprehensive income – ______Total comprehensive income 9,200 ______ Attributable to: Parent shareholders (ß) 8,973Non controlling interest (W3) 227 ______ 9,200 ______
chapter 7
KAPLAN PUBLISHING 275
Test your understanding 10 Cagney and Lacey
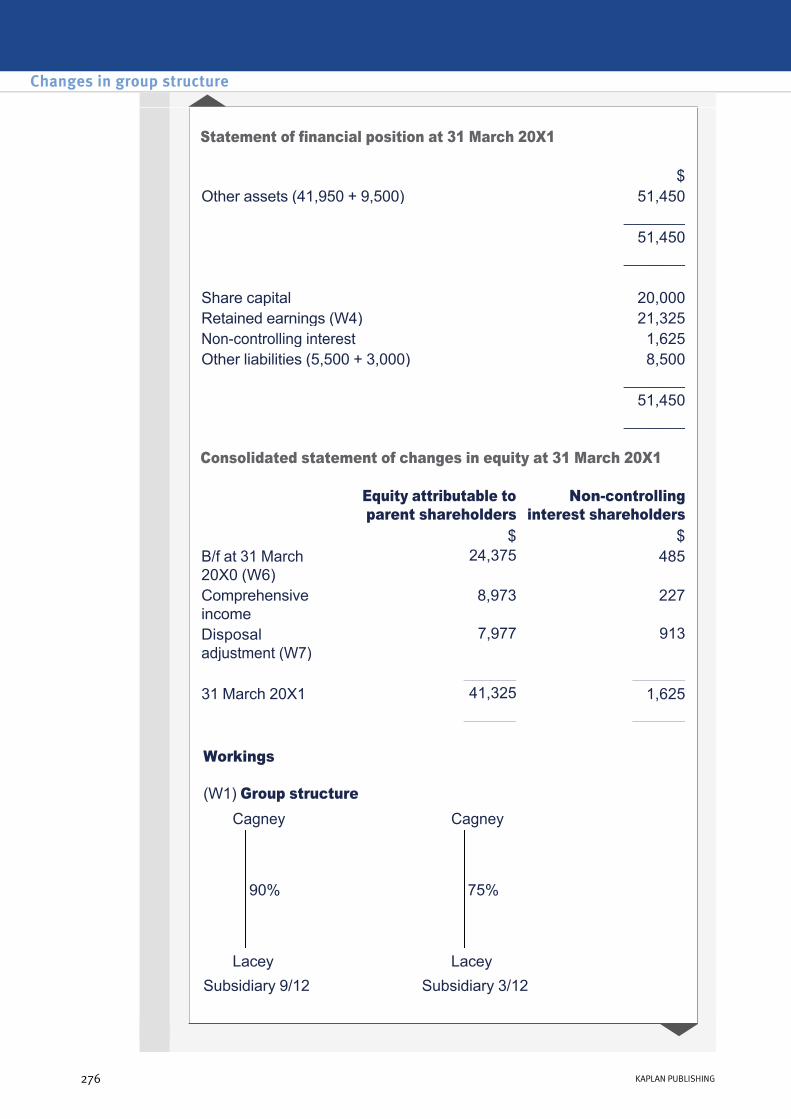
Statement of financial position at 31 March 20X1
Consolidated statement of changes in equity at 31 March 20X1
$Other assets (41,950 + 9,500) 51,450
_______ 51,450 _______ Share capital 20,000Retained earnings (W4) 21,325Noncontrolling interest 1,625Other liabilities (5,500 + 3,000) 8,500 _______ 51,450 _______
Equity attributable to parent shareholders
Noncontrolling interest shareholders
$ $B/f at 31 March 20X0 (W6)
24,375 485
Comprehensive income
8,973 227
Disposal adjustment (W7)
7,977 913
______ ______31 March 20X1 41,325 1,625 ______ ______ Workings
(W1) Group structure
Cagney Cagney 90% 75%
Lacey Lacey Subsidiary 9/12 Subsidiary 3/12
Changes in group structure
276 KAPLAN PUBLISHING
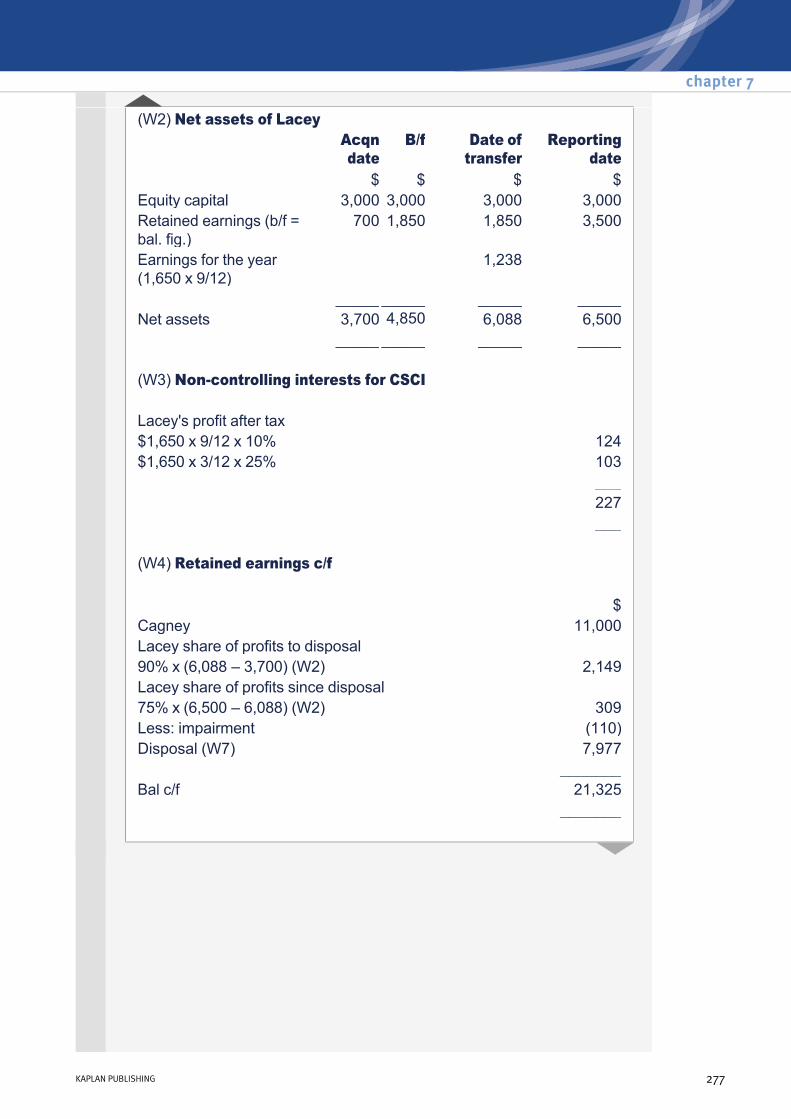
(W2) Net assets of Lacey Acqn
date B/f Date of
transfer Reporting
date $ $ $ $Equity capital 3,000 3,000 3,000 3,000Retained earnings (b/f = bal. fig.)
700 1,850 1,850 3,500
Earnings for the year (1,650 x 9/12)
1,238
__________ _____ _____Net assets 3,700 4,850 6,088 6,500 __________ _____ _____ (W3) Noncontrolling interests for CSCI Lacey's profit after tax $1,650 x 9/12 x 10% 124$1,650 x 3/12 x 25% 103 ___ 227 ___ (W4) Retained earnings c/f $Cagney 11,000Lacey share of profits to disposal90% x (6,088 – 3,700) (W2) 2,149Lacey share of profits since disposal75% x (6,500 – 6,088) (W2) 309Less: impairment (110)Disposal (W7) 7,977 _______Bal c/f 21,325 _______
chapter 7
KAPLAN PUBLISHING 277
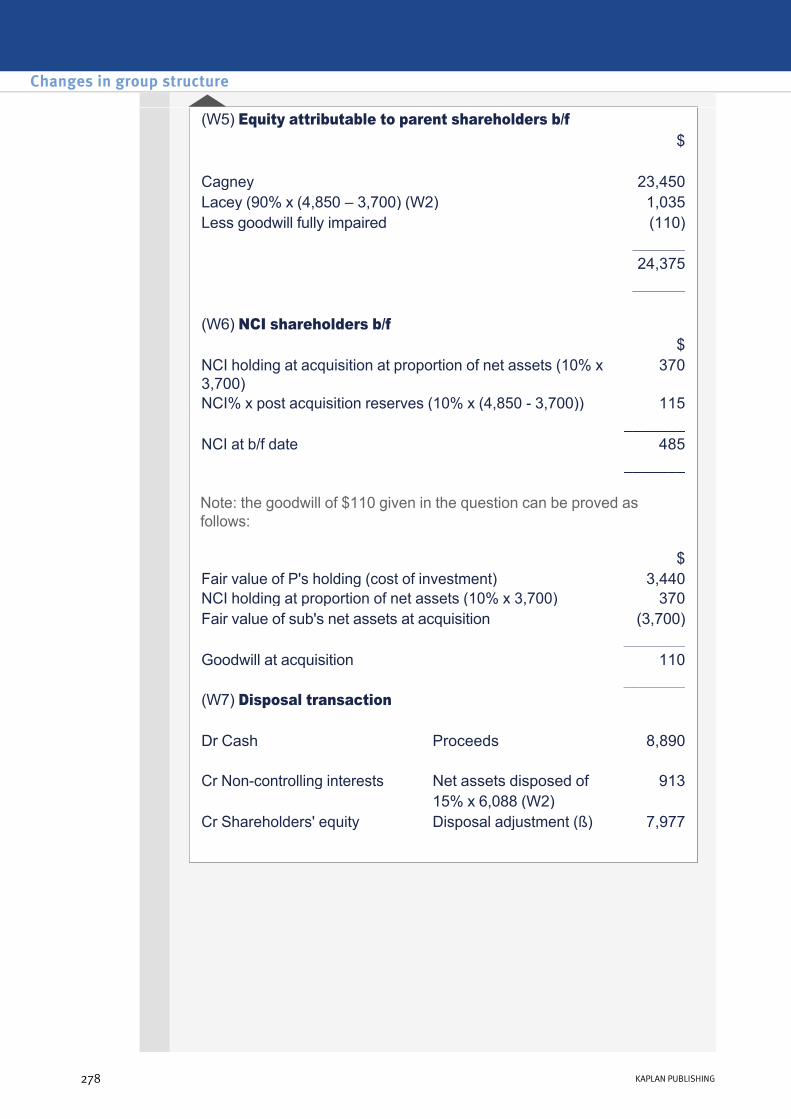
Note: the goodwill of $110 given in the question can be proved as follows:
(W5) Equity attributable to parent shareholders b/f $ Cagney 23,450Lacey (90% x (4,850 – 3,700) (W2) 1,035Less goodwill fully impaired (110) ______ 24,375 ______ (W6) NCI shareholders b/f
$NCI holding at acquisition at proportion of net assets (10% x 3,700)
370
NCI% x post acquisition reserves (10% x (4,850 3,700)) 115 _______NCI at b/f date 485 _______
$Fair value of P's holding (cost of investment) 3,440NCI holding at proportion of net assets (10% x 3,700) 370Fair value of sub's net assets at acquisition (3,700) _______Goodwill at acquisition 110 _______(W7) Disposal transaction Dr Cash Proceeds 8,890 Cr Noncontrolling interests Net assets disposed of 913 15% x 6,088 (W2) Cr Shareholders' equity Disposal adjustment (ß) 7,977
Changes in group structure
278 KAPLAN PUBLISHING

Consolidated statement of comprehensive income for the year ended 31 March 20X7 Henderson Spring
dale Adjustments
Consolidated
9/12 $000 $000 $000 $000Revenue 23,700 11,925 (2,400) 33,225 Cost of sales (7,510) (5,100) 2,400 (10,290)– PUP (80) –––––Gross profit 22,935Operating expenses (3,520) (1,680) (6,350)– Depreciation adjustment (150) – Impairment loss (1,000) –––––Profit from operations 16,585Finance cost (1,000) (405) (1,405)Income from associate 444(40% x 4,440 x 3/12) Loss on disposal (W7) (1,460) –––––Profit before tax 14,164Tax (3,500) (1,410) (4,910) ––––– –––––Net profit 2,180 9,254Other comprehensive income
– – –
––––– –––––Total comprehensive income
2,180 9,254
–––––Attributable to: Noncontrolling interests x 25% 545Parent shareholders 8,709 ––––– 9,254 –––––
chapter 7
KAPLAN PUBLISHING 279
Test your understanding 11 Henderson
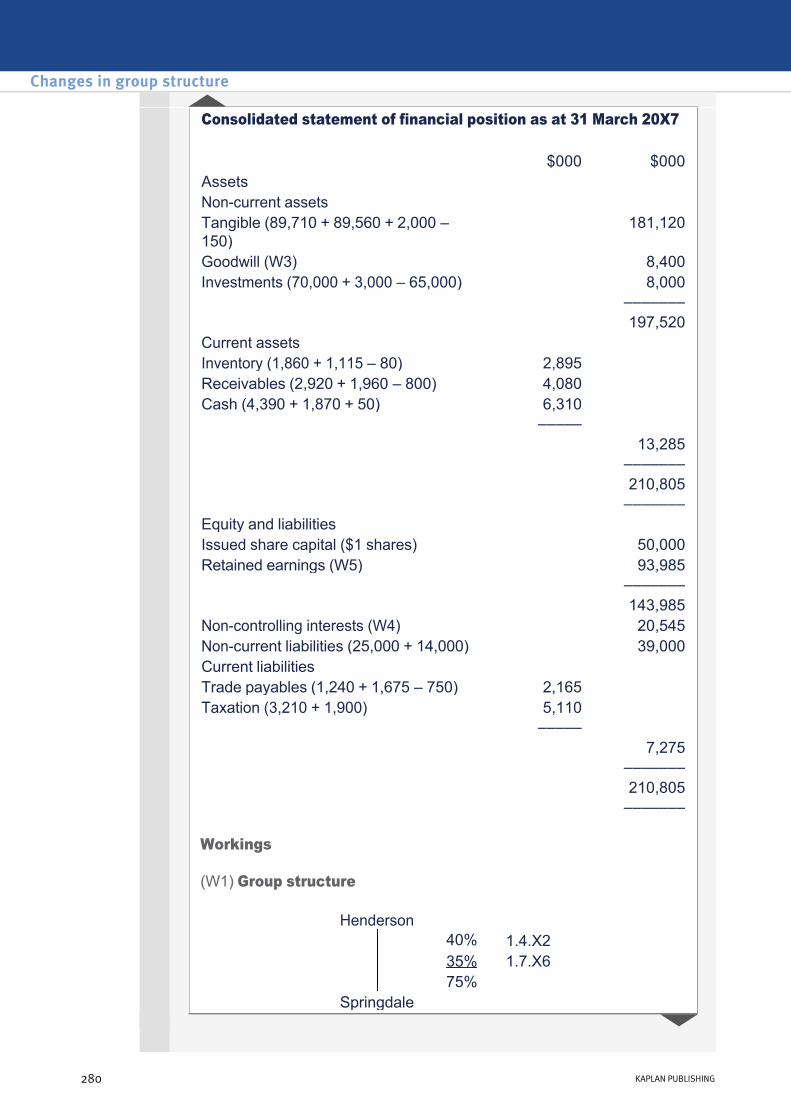
Workings
(W1) Group structure
Consolidated statement of financial position as at 31 March 20X7
$000 $000Assets Noncurrent assets Tangible (89,710 + 89,560 + 2,000 – 150)
181,120
Goodwill (W3) 8,400Investments (70,000 + 3,000 – 65,000) 8,000 ––––––– 197,520Current assets Inventory (1,860 + 1,115 – 80) 2,895 Receivables (2,920 + 1,960 – 800) 4,080 Cash (4,390 + 1,870 + 50) 6,310 ––––– 13,285 ––––––– 210,805 –––––––Equity and liabilities Issued share capital ($1 shares) 50,000Retained earnings (W5) 93,985 ––––––– 143,985Noncontrolling interests (W4) 20,545Noncurrent liabilities (25,000 + 14,000) 39,000Current liabilities Trade payables (1,240 + 1,675 – 750) 2,165 Taxation (3,210 + 1,900) 5,110 ––––– 7,275 ––––––– 210,805 –––––––
Henderson 40% 1.4.X2 35% 1.7.X6 75% Springdale
Changes in group structure
280 KAPLAN PUBLISHING

Springdale will be treated as a 40% associate in the consolidated income statement for 1 April 20X6 to 30 June 20X6 and as a 75% subsidiary for the period 1 July 20X6 to 31 March 20X7.
Springdale will be treated as a 75% subsidiary in the consolidated balance sheet as at 31 March 20X7.
This is a step acquisition where Henderson achieves control on 1 July X6. Therefore, the previously held interest in Springdale is remeasured to fair value with any gain or loss recognised in the Income statement:
The above double entry is recorded in the parent’s books.
From the group’s income statement point of view, the gain of $3 million should be recorded in two elements:
See tutorial note for further details.
(W2) Net assets of subsidiary
Dr Investments (30m – 27m) 3 million
CrGain in statement of comprehensive income
3 million
• Associate’s profits for period 1 April to 30 June
• Gain/loss on disposal of associate as at 30 June
Acquisition date
Reporting date
1.7.X6 31.3.X7Share capital 40,000 40,000Retained earnings (W) 33,600 36,930Fair value adjustment 2,000 2,000Depreciation on fair value adjustment – (150)(2,000 x 1/10 x 9/12) ––––– ––––– 75,600 78,780 ––––– –––––Retained earnings at 1.7.X6 (bal. fig.) 33,600Profit from 1.7.X6 to 31.3.X7 (9/12 x 4,440) 3,330 –––––Retained earnings at 31.3.X7 36,930 –––––
chapter 7
KAPLAN PUBLISHING 281
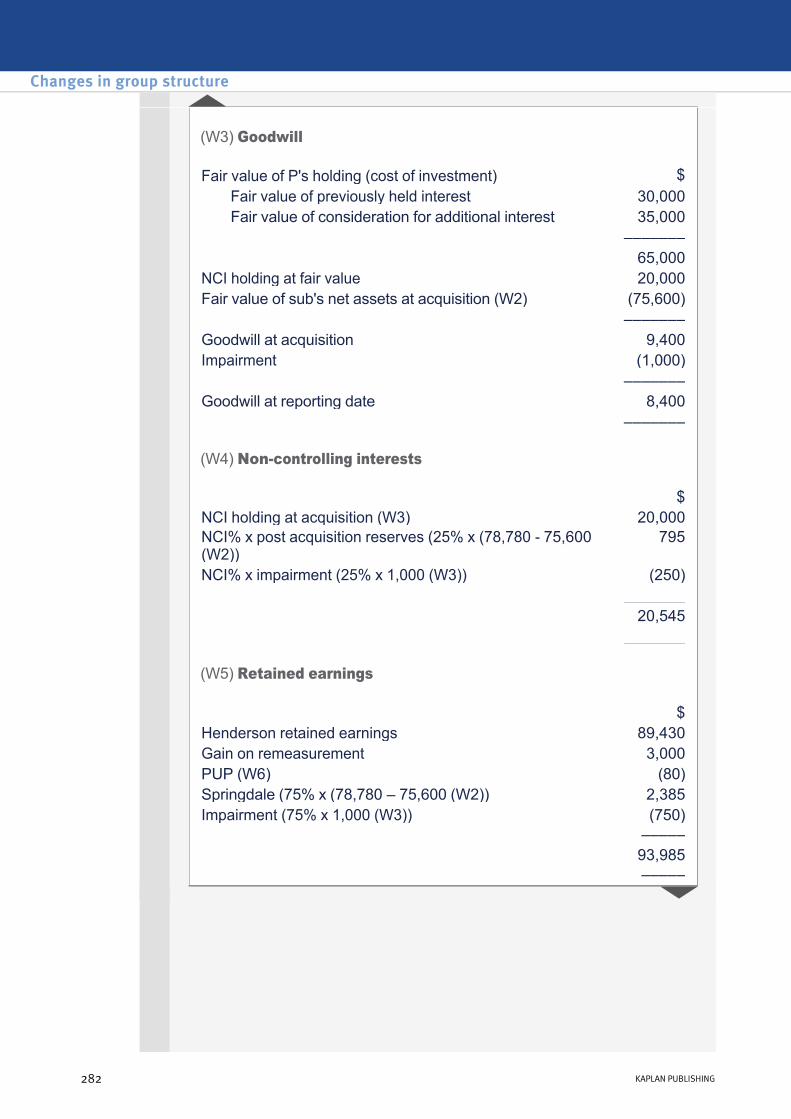
(W3) Goodwill
(W4) Noncontrolling interests
(W5) Retained earnings
Fair value of P's holding (cost of investment) $Fair value of previously held interest 30,000Fair value of consideration for additional interest 35,000
––––––– 65,000
NCI holding at fair value 20,000Fair value of sub's net assets at acquisition (W2) (75,600) ––––––– Goodwill at acquisition 9,400Impairment (1,000) ––––––– Goodwill at reporting date 8,400 –––––––
$NCI holding at acquisition (W3) 20,000NCI% x post acquisition reserves (25% x (78,780 75,600 (W2))
795
NCI% x impairment (25% x 1,000 (W3)) (250) _______ 20,545 _______
$Henderson retained earnings 89,430Gain on remeasurement 3,000PUP (W6) (80)Springdale (75% x (78,780 – 75,600 (W2)) 2,385Impairment (75% x 1,000 (W3)) (750) ––––– 93,985 –––––
Changes in group structure
282 KAPLAN PUBLISHING

(W6) PUP
Profit made on sale = 2,400 x 20/120 = 400
Profit in inventory = 400 x 1/5 = 80
(W7) Gain on disposal of associate
Tutorial note: CSOCE
(W8) Equity b/f
Fair value of 35% holding at 1.7.X6 30,000Less: carrying value of associateCost of investment 27,000Share of post acquisition profits40% x (33,600 (W2) – 22,450) 4,460
––––– (31,460) –––––Loss on disposal (1,460) –––––
Parent shareholders
NCI shareholders
$000 $000Equity b/f (W8) 135,276 – Comprehensive income 8,709 545Acquisition of subsidiary (W3) 20,000 ––––––– –––––– 143,985 20,545 ––––––– ––––––
Share capital 50,000 Retained earnings of Henderson b/f (89,430 – 8,170) 81,260
–––––– 131,260
Post acquisition profits of associate 40% x (32,490 – 22,450) 4,016 –––––– 135,276 ––––––
chapter 7
KAPLAN PUBLISHING 283
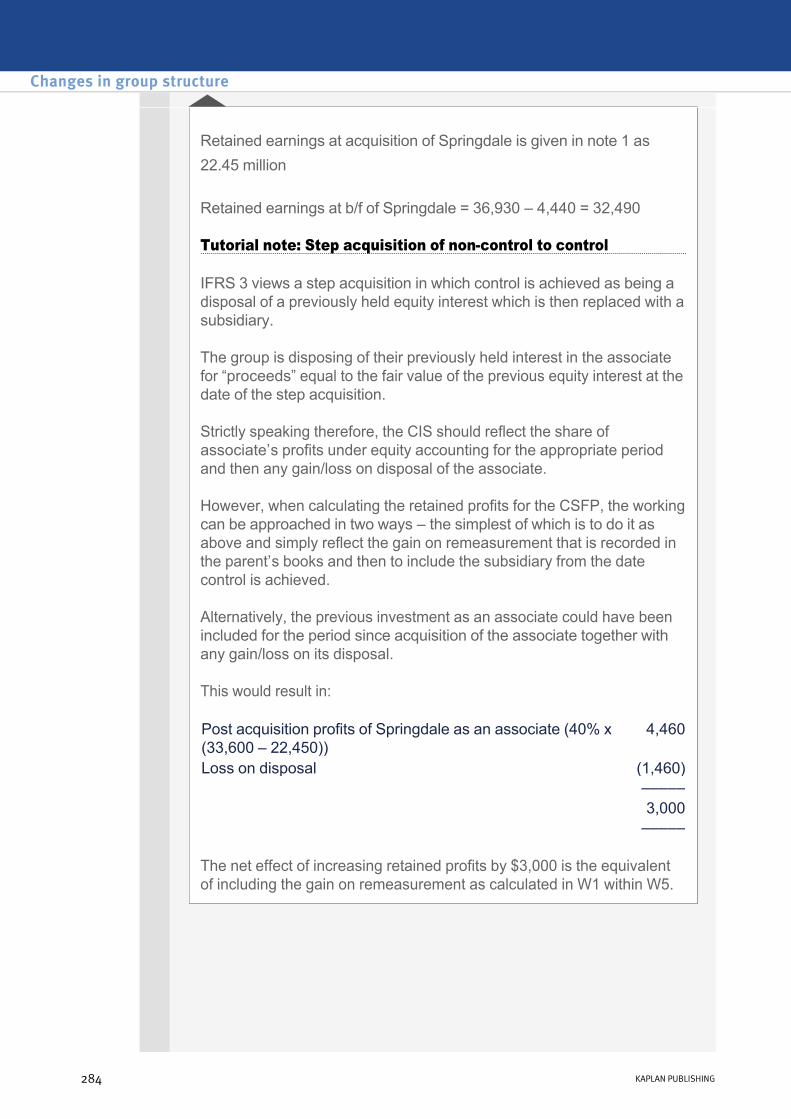
Retained earnings at acquisition of Springdale is given in note 1 as 22.45 million
Retained earnings at b/f of Springdale = 36,930 – 4,440 = 32,490
Tutorial note: Step acquisition of noncontrol to control
IFRS 3 views a step acquisition in which control is achieved as being a disposal of a previously held equity interest which is then replaced with a subsidiary.
The group is disposing of their previously held interest in the associate for “proceeds” equal to the fair value of the previous equity interest at the date of the step acquisition.
Strictly speaking therefore, the CIS should reflect the share of associate’s profits under equity accounting for the appropriate period and then any gain/loss on disposal of the associate.
However, when calculating the retained profits for the CSFP, the working can be approached in two ways – the simplest of which is to do it as above and simply reflect the gain on remeasurement that is recorded in the parent’s books and then to include the subsidiary from the date control is achieved.
Alternatively, the previous investment as an associate could have been included for the period since acquisition of the associate together with any gain/loss on its disposal.
This would result in:
The net effect of increasing retained profits by $3,000 is the equivalent of including the gain on remeasurement as calculated in W1 within W5.
Post acquisition profits of Springdale as an associate (40% x (33,600 – 22,450))
4,460
Loss on disposal (1,460) ––––– 3,000 –––––
Changes in group structure
284 KAPLAN PUBLISHING

Consolidated statement of financial position as at 30 September 20X5 $000Assets Property, plant and equipment (160,000 + 60,000 + 5,000)
225,000
Goodwill (W3) 9,400Investments (80,000 – 45,000 (W3) – 10,000 (W7) – 21,000 (W3) + 15,000 (W8))
19,000
Investment in associate 35,000 Current assets (65,000 + 50,000 + 1,000 (W6)) 114,000 ––––––– 402,400 –––––––Equity Equity shares 50,000Retained earnings (W5) 223,500Other components of equity (W7) (2,700) ––––––– 270,800Noncontrolling interests (W4) 14,600 ––––––– 285,400Noncurrent liabilities (25,000 + 18,000) 43,000Current liabilities (45,000 + 29,000) 74,000 ––––––– 402,400 –––––––
chapter 7
KAPLAN PUBLISHING 285
Test your understanding 12 Howard
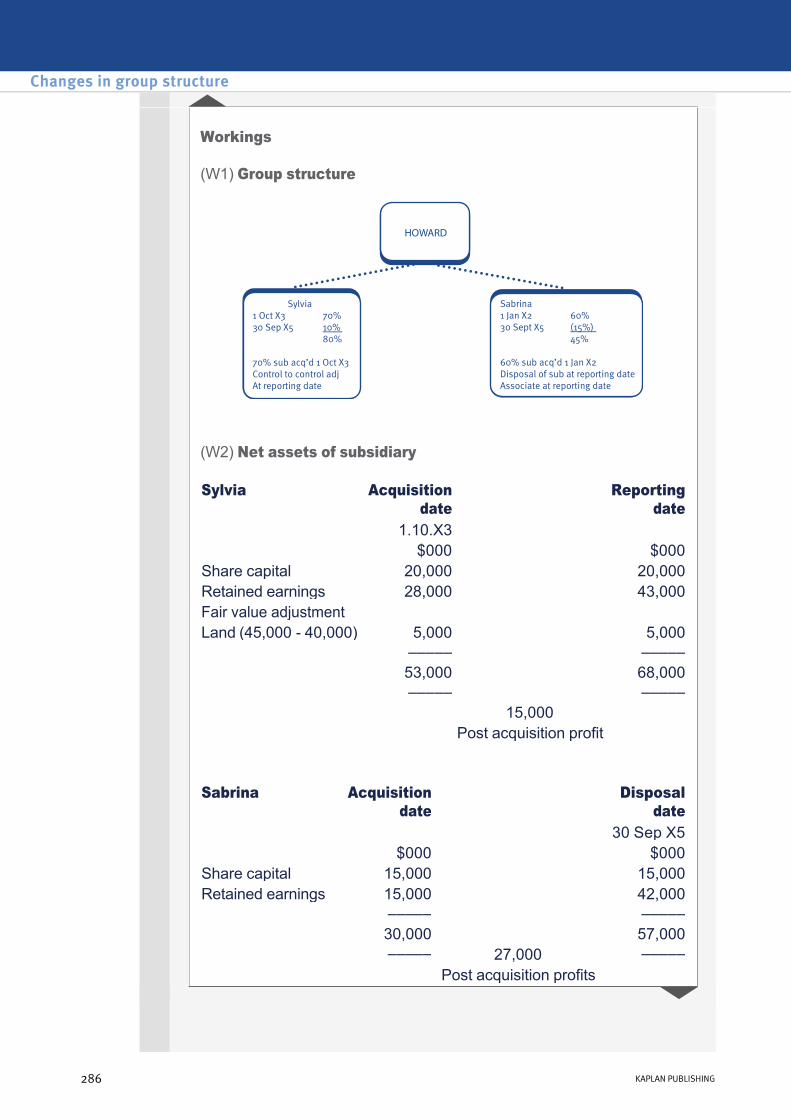
Workings
(W1) Group structure
(W2) Net assets of subsidiary
Sylvia Acquisition date
Reporting date
1.10.X3 $000 $000Share capital 20,000 20,000Retained earnings 28,000 43,000Fair value adjustment Land (45,000 40,000) 5,000 5,000 ––––– ––––– 53,000 68,000 ––––– ––––– 15,000 Post acquisition profit Sabrina Acquisition
date Disposal
date 30 Sep X5 $000 $000Share capital 15,000 15,000Retained earnings 15,000 42,000 ––––– ––––– 30,000 57,000 ––––– 27,000 ––––– Post acquisition profits
Changes in group structure
286 KAPLAN PUBLISHING

(W3) Goodwill
(W4) Noncontrolling interests – Sylvia
Noncontrollling interests Sabrina
Sylvia $000Fair value of P's holding (cost of investment) 45,000NCI holding at fair value 17,400Fair value of sub's net assets at acquisition (W2) (53,000) –––––Goodwill at acquisition/ reporting date 9,400 ––––– Sabrina $000Fair value of P's holding (cost of investment) 21,000NCI holding at fair value 13,000Fair value of sub's net assets at acquisition (W2) (30,000) –––––Goodwill at acquisition/ reporting date 4,000 –––––
$000NCI holding at acquisition (W3) 17,400NCI% x post acquisition reserves (30% x 15,000 (W2)) 4,500 ––––– NCI before control to control adjustment 21,900 Decrease in NCI (W7) (7,300) ––––– 14,600
–––––
$000NCI holding at acquisition (W3) 13,000NCI% x post acquisition reserves (40% x 27,000 (W2)) 10,800 –––––NCI at disposal 23,800
–––––
chapter 7
KAPLAN PUBLISHING 287
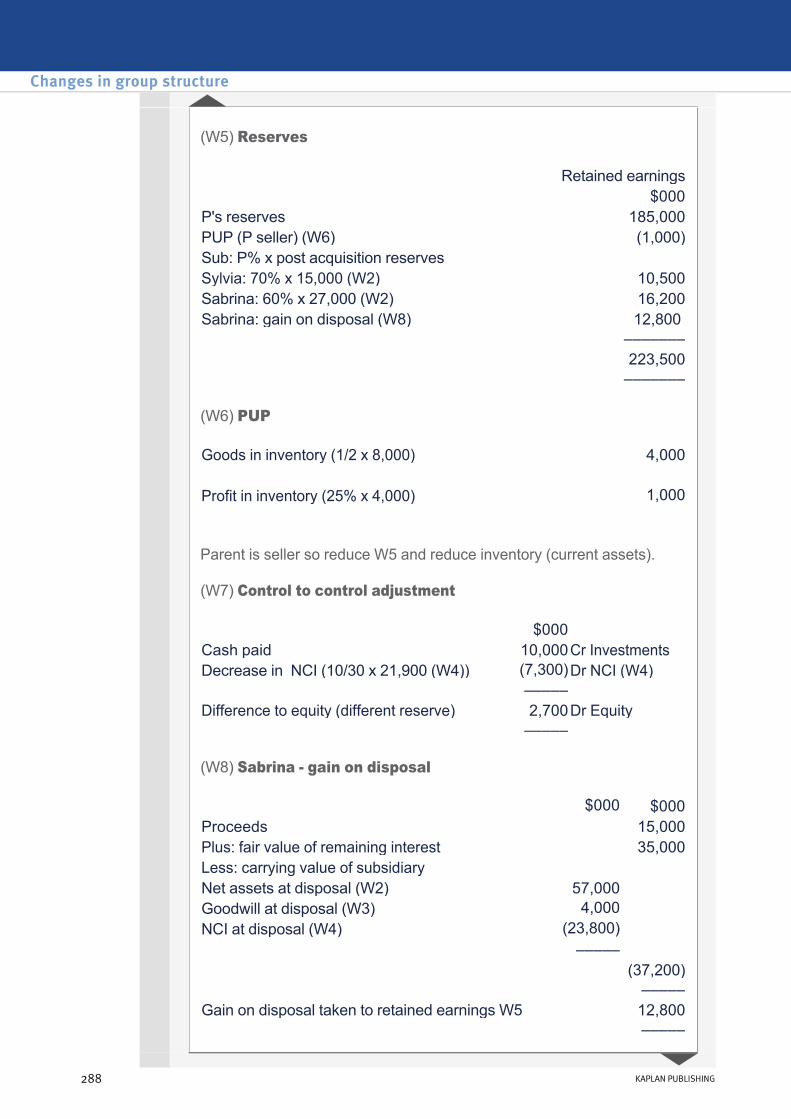
(W5) Reserves
(W6) PUP
Parent is seller so reduce W5 and reduce inventory (current assets).
(W7) Control to control adjustment
(W8) Sabrina gain on disposal
Retained earnings$000
P's reserves 185,000PUP (P seller) (W6) (1,000)Sub: P% x post acquisition reserves Sylvia: 70% x 15,000 (W2) 10,500Sabrina: 60% x 27,000 (W2) 16,200Sabrina: gain on disposal (W8) 12,800 ––––––– 223,500 –––––––
Goods in inventory (1/2 x 8,000) 4,000 Profit in inventory (25% x 4,000) 1,000
$000 Cash paid 10,000Cr InvestmentsDecrease in NCI (10/30 x 21,900 (W4)) (7,300)Dr NCI (W4) ––––– Difference to equity (different reserve) 2,700Dr Equity –––––
$000 $000Proceeds 15,000Plus: fair value of remaining interest 35,000Less: carrying value of subsidiaryNet assets at disposal (W2) 57,000Goodwill at disposal (W3) 4,000NCI at disposal (W4) (23,800)
––––– (37,200)
–––––Gain on disposal taken to retained earnings W5 12,800 –––––
Changes in group structure
288 KAPLAN PUBLISHING

At the reporting date, the investment in Sabrina becomes an investment in associate at a deemed cost of $35 million.
The disposal proceeds have been credited to investments, but should have been credited to the gain on disposal calculation. Therefore the $15 million should be debited to investments.
chapter 7
KAPLAN PUBLISHING 289

Changes in group structure
290 KAPLAN PUBLISHING

Complex groupsChapter learning objectives
On completion of their studies students should be able to:
• Prepare consolidated financial statements for a group of companies involving one or more subsidiaries, subsubsidiaries and associates;
• Explain the treatment in consolidated financial statements of piecemeal and midyear acquisitions to include subsubsidiaries and mixed groups.
291
chapter
8
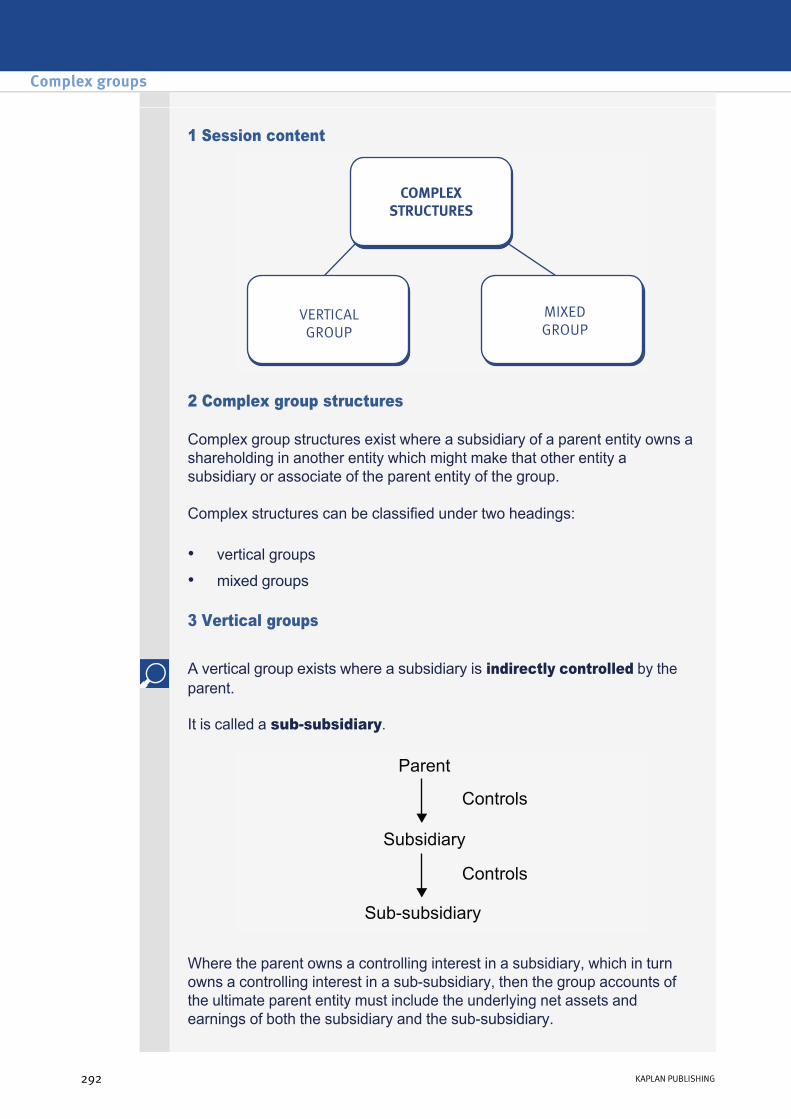
1 Session content
2 Complex group structures
Complex group structures exist where a subsidiary of a parent entity owns a shareholding in another entity which might make that other entity a subsidiary or associate of the parent entity of the group.
Complex structures can be classified under two headings:
• vertical groups
• mixed groups
3 Vertical groups
A vertical group exists where a subsidiary is indirectly controlled by the parent.
It is called a subsubsidiary.
Where the parent owns a controlling interest in a subsidiary, which in turn owns a controlling interest in a subsubsidiary, then the group accounts of the ultimate parent entity must include the underlying net assets and earnings of both the subsidiary and the subsubsidiary.
Complex groups
292 KAPLAN PUBLISHING292 KAPLAN PUBLISHING
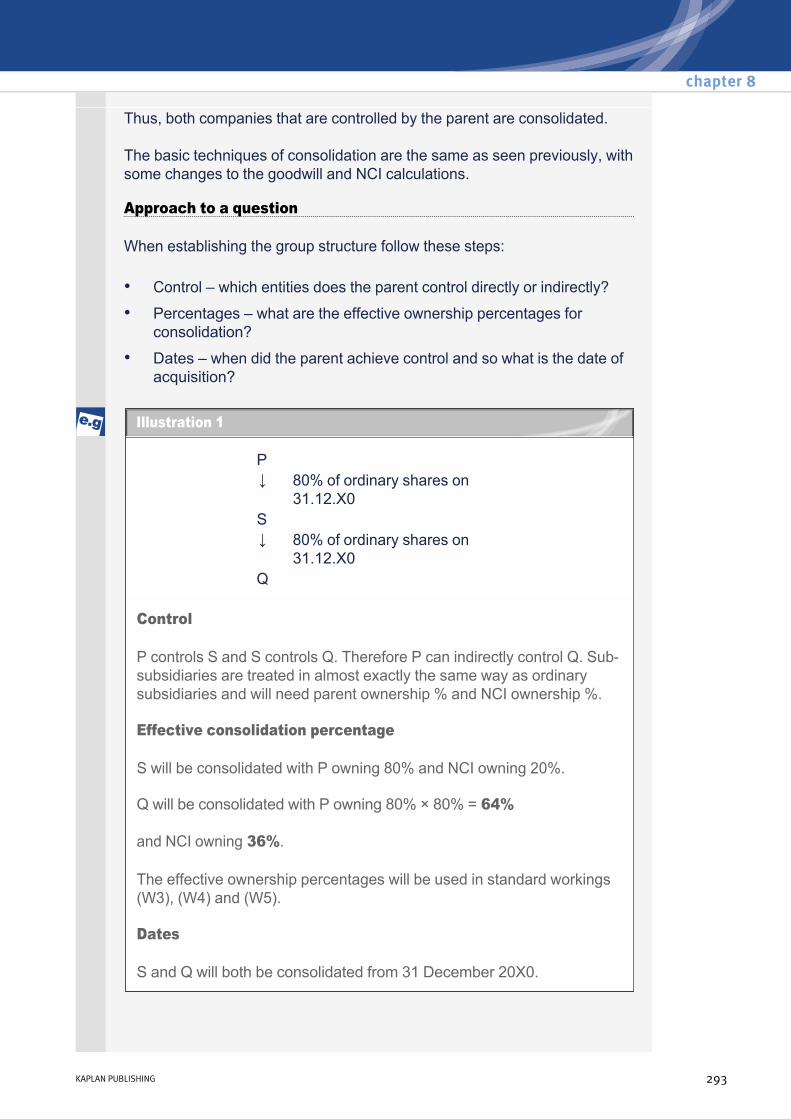
Thus, both companies that are controlled by the parent are consolidated.
The basic techniques of consolidation are the same as seen previously, with some changes to the goodwill and NCI calculations.
Approach to a question
When establishing the group structure follow these steps:
• Control – which entities does the parent control directly or indirectly?
• Percentages – what are the effective ownership percentages for consolidation?
• Dates – when did the parent achieve control and so what is the date of acquisition?
P ↓ 80% of ordinary shares on
31.12.X0S ↓ 80% of ordinary shares on
31.12.X0Q
Control
P controls S and S controls Q. Therefore P can indirectly control Q. Subsubsidiaries are treated in almost exactly the same way as ordinary subsidiaries and will need parent ownership % and NCI ownership %.
Effective consolidation percentage
S will be consolidated with P owning 80% and NCI owning 20%.
Q will be consolidated with P owning 80% × 80% = 64%
and NCI owning 36%.
The effective ownership percentages will be used in standard workings (W3), (W4) and (W5).
Dates
S and Q will both be consolidated from 31 December 20X0.
chapter 8
KAPLAN PUBLISHING 293
Illustration 1

P ↓ 60% of ordinary shares on
31.5.X2S ↓ 60% of ordinary shares on
31.5.X2Q
Control
P controls S and S controls Q. Therefore P can indirectly control Q.
Effective consolidation percentage
S will be consolidated with P owning 60% and NCI owning 40%.
Q will be consolidated with P owning 60% × 60% = 36%
and NCI owning 64%.
Dates
S and Q will both be consolidated from 31.5.X2.
P ↓ 80% of ordinary shares on
31.1.X2S ↓ 70% of ordinary shares on
30.4.X1Q
Control
P controls S and S controls Q. Therefore P can indirectly control Q.
Effective consolidation percentage
S will be consolidated with P owning 80% and NCI owning 20%.
Q will be consolidated with P owning 80% × 70% = 56%
and NCI owning 44%.
Complex groups
294 KAPLAN PUBLISHING
Illustration 3 Effective date of control
Illustration 2

Dates
Consolidation is based upon the principle of control and Q will be controlled by P when P acquires its holding in S on 31.1.X2 since by this date S already controls Q.
S is consolidated from 31.1.X2.
Q is consolidated from 31.1.X2.
P ↓ 60% of ordinary shares on
31.7.X2S ↓ 70% of ordinary shares on
30.9.X2Q
Control
P controls S and S controls Q. Therefore P can indirectly control Q.
Effective consolidation percentage
S will be consolidated with P owning 60% and NCI owning 40%.
Q will be consolidated with P owning 60% × 70% = 42%
and NCI owning 58%.
Dates
P controls S from 31.7.X2 but Q is not controlled by S until 30.9.X2. Therefore P cannot control Q until 30.9.X2.
S is consolidated from 31.7.X2.
Q is consolidated from 30.9.X2.
chapter 8
KAPLAN PUBLISHING 295
Illustration 4 Effective date of control

4 Accounting treatment of subsubsidiary
The main adjustment will be the indirect holding adjustment (IHA).
This will affect the calculation of the goodwill figure and the statement of financial position noncontrolling interest figure i.e. W3 and W4.
Consider this statement of financial position extract:
A owns 80% of B. B owns 75% of C.
The subsubsidiary is controlled by the parent and so is consolidated in the normal way i.e. from the date of acquisition:
However, since the subsubsidiary is indirectly owned, it will be necessary to record an indirect holding adjustment (IHA). The IHA only effects (W3) Goodwill and (W4) NCI for CSFP.
When calculating goodwill it consists of the goodwill that belongs to the parent shareholders (and also the NCI shareholders if using the full goodwill method). It is therefore calculated as the difference between the consideration paid by the parent and the parent’s share of the net assets acquired.
In a vertical group, the consideration to acquire the subsubsidiary is paid by the subsidiary and not the parent. The parent will only incur their share of this cost and the NCI in the subsidiary will incur the remainder.
Therefore in (W3) Goodwill, it is necessary to reduce the cost of the investment in the subsidiary’s books to the parent’s share. The amount of the reduction is the cost that is incurred by the NCI shareholders and so is charged to NCI by reducing (W4).
A B C $000 $000 $000
Investments In B 500 – – In C – 400 –
• consolidate income, expenses, assets and liabilities fully on a line by line basis
• recognise goodwill
• recognise noncontrolling interests
Complex groups
296 KAPLAN PUBLISHING
Illustration 5
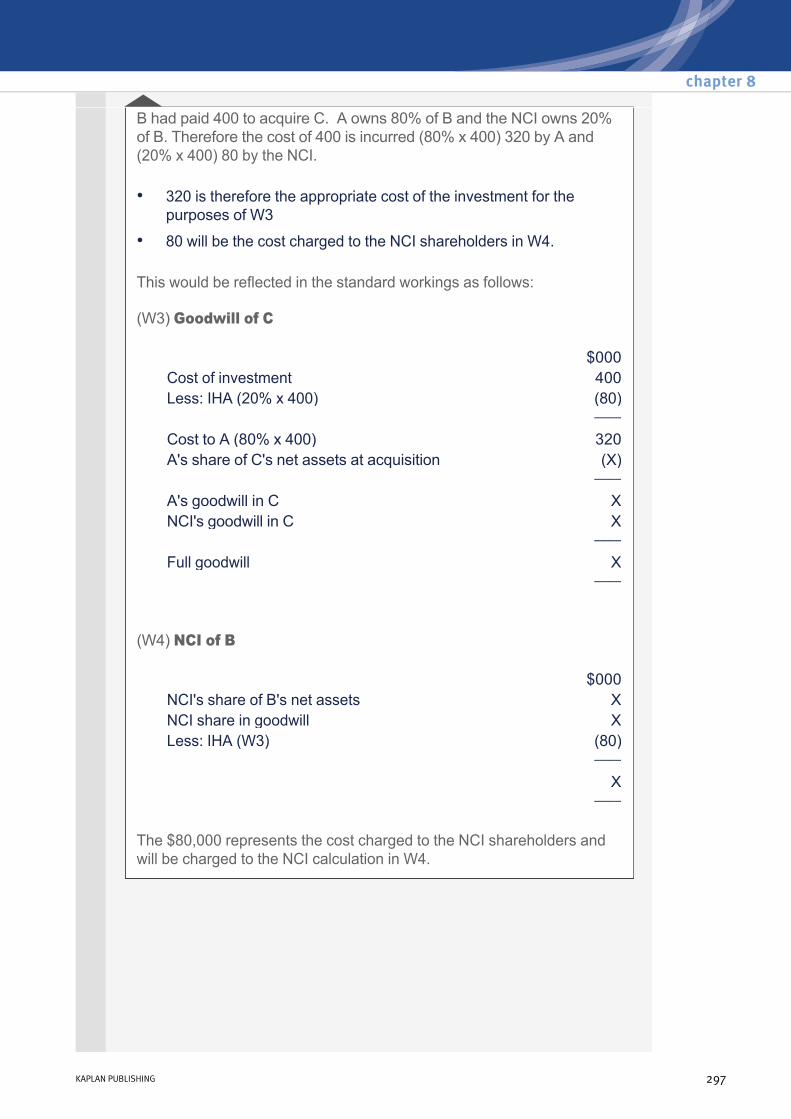
B had paid 400 to acquire C. A owns 80% of B and the NCI owns 20% of B. Therefore the cost of 400 is incurred (80% x 400) 320 by A and (20% x 400) 80 by the NCI.
This would be reflected in the standard workings as follows:
(W3) Goodwill of C
(W4) NCI of B
The $80,000 represents the cost charged to the NCI shareholders and will be charged to the NCI calculation in W4.
• 320 is therefore the appropriate cost of the investment for the purposes of W3
• 80 will be the cost charged to the NCI shareholders in W4.
$000Cost of investment 400Less: IHA (20% x 400) (80)
–––– Cost to A (80% x 400) 320A's share of C's net assets at acquisition (X)
–––– A's goodwill in C XNCI's goodwill in C X
–––– Full goodwill X
––––
$000NCI's share of B's net assets XNCI share in goodwill XLess: IHA (W3) (80)
–––– X
––––
chapter 8
KAPLAN PUBLISHING 297
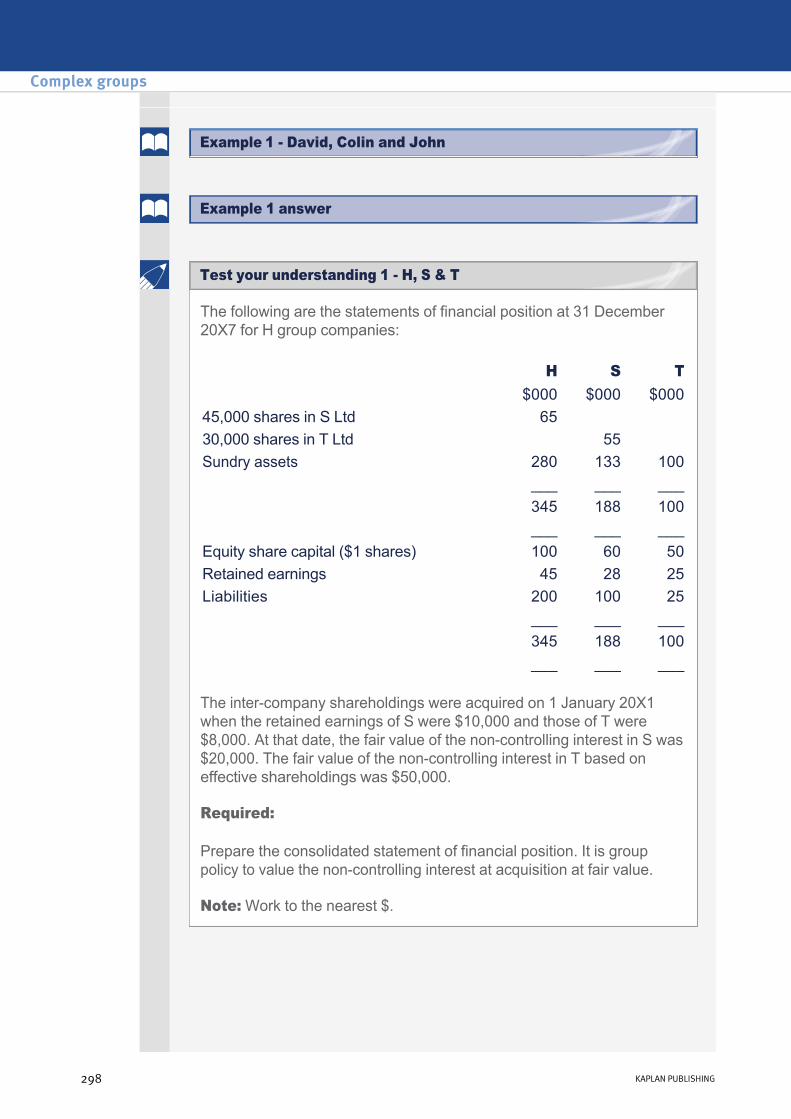
The following are the statements of financial position at 31 December 20X7 for H group companies:
The intercompany shareholdings were acquired on 1 January 20X1 when the retained earnings of S were $10,000 and those of T were $8,000. At that date, the fair value of the noncontrolling interest in S was $20,000. The fair value of the noncontrolling interest in T based on effective shareholdings was $50,000.
Required:
Prepare the consolidated statement of financial position. It is group policy to value the noncontrolling interest at acquisition at fair value.
Note: Work to the nearest $.
H S T $000 $000 $000
45,000 shares in S Ltd 6530,000 shares in T Ltd 55Sundry assets 280 133 100
___ ___ ___345 188 100___ ___ ___
Equity share capital ($1 shares) 100 60 50Retained earnings 45 28 25Liabilities 200 100 25
___ ___ ___345 188 100___ ___ ___
Complex groups
298 KAPLAN PUBLISHING
Example 1 answer
Test your understanding 1 H, S & T
Example 1 David, Colin and John
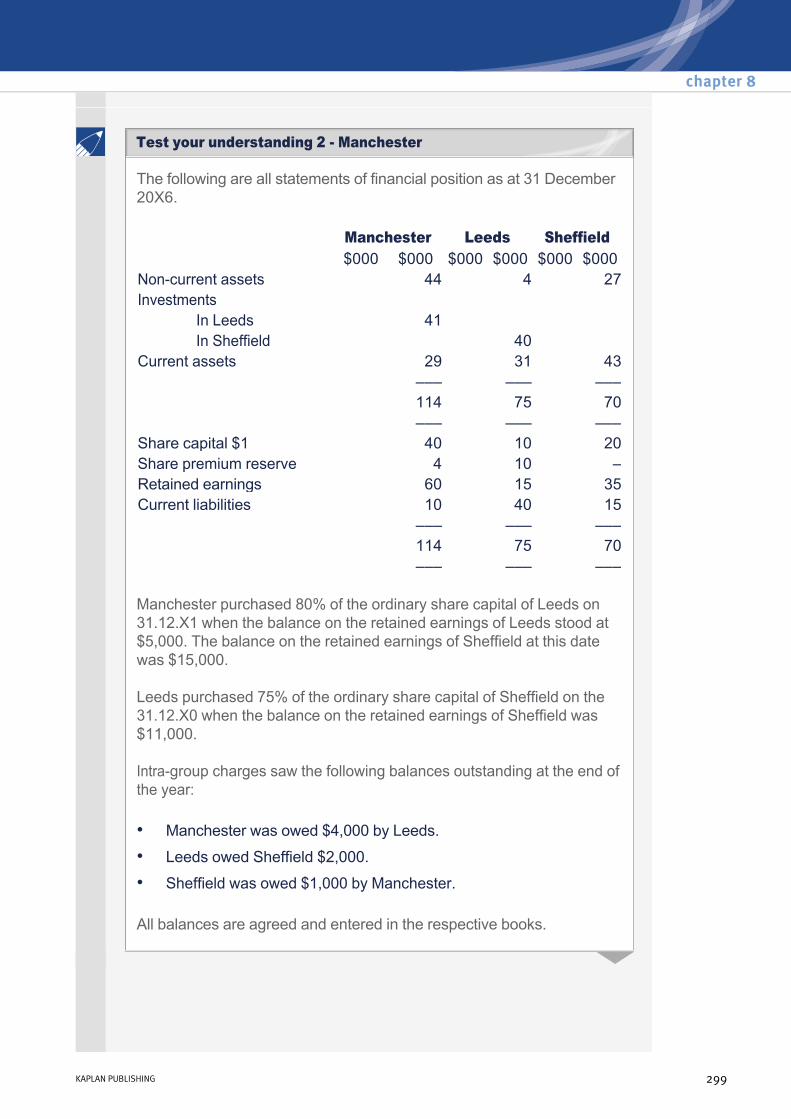
The following are all statements of financial position as at 31 December 20X6.
Manchester purchased 80% of the ordinary share capital of Leeds on 31.12.X1 when the balance on the retained earnings of Leeds stood at $5,000. The balance on the retained earnings of Sheffield at this date was $15,000.
Leeds purchased 75% of the ordinary share capital of Sheffield on the 31.12.X0 when the balance on the retained earnings of Sheffield was $11,000.
Intragroup charges saw the following balances outstanding at the end of the year:
All balances are agreed and entered in the respective books.
Manchester Leeds Sheffield $000 $000 $000 $000 $000 $000
Noncurrent assets 44 4 27Investments
In Leeds 41 In Sheffield 40
Current assets 29 31 43 ––– ––– ––– 114 75 70 ––– ––– ––– Share capital $1 40 10 20Share premium reserve 4 10 – Retained earnings 60 15 35Current liabilities 10 40 15
––– ––– ––– 114 75 70 ––– ––– –––
• Manchester was owed $4,000 by Leeds.
• Leeds owed Sheffield $2,000.
• Sheffield was owed $1,000 by Manchester.
chapter 8
KAPLAN PUBLISHING 299
Test your understanding 2 Manchester

Leeds supplies Manchester with a component on a regular basis. Leeds also supplies Sheffield with raw materials. Both items are supplied on a markup of 25% and at the end of the year, $15,000 remained in Manchester's inventory from $26,250 worth of sales during the year and $5,000 remained in Sheffield's inventory from $8,750 worth of sales during the year.
Required:
The consolidated statement of financial position for the Manchester group at 31 December 20X6. It is group policy to use the proportionate share of net assets method to value the noncontrolling interest.
5 Income statement preparation for vertical groups
Treat the subsubsidiary in exactly the same way as a directly owned subsidiary but remember to use the effective percentages when calculating noncontrolling interests' share of profit.
Alpha purchased 80% of Bravo’s equity share capital $250m on 1 January 20X0 when the balance on Bravo’s retained earnings was $20m. The fair value of the NCI’s holding at acquisition was $54.3m.
Bravo purchased 60% of Charlie’s equity share capital of $150m on 1 January 20X1 when Charlie’s retained earnings stood at $30m. The fair value of the NCI’s holding (both direct and indirect) at acquisition was $94.1m.
Goodwill in both Bravo and Charlie has been calculated measuring NCIs at fair value and both have remained unimpaired since acquisition.
Statements of changes in equity for the year ended 31 December 20X4:
Alpha Bravo Charlie $m $m $m
Equity b/f 400 300 200Net profit for year 134 121 111Dividends (30) (15) (5) –––– –––– –––– Equity c/f 504 406 306
–––– –––– ––––
Complex groups
300 KAPLAN PUBLISHING
Test your understanding 3 Alpha
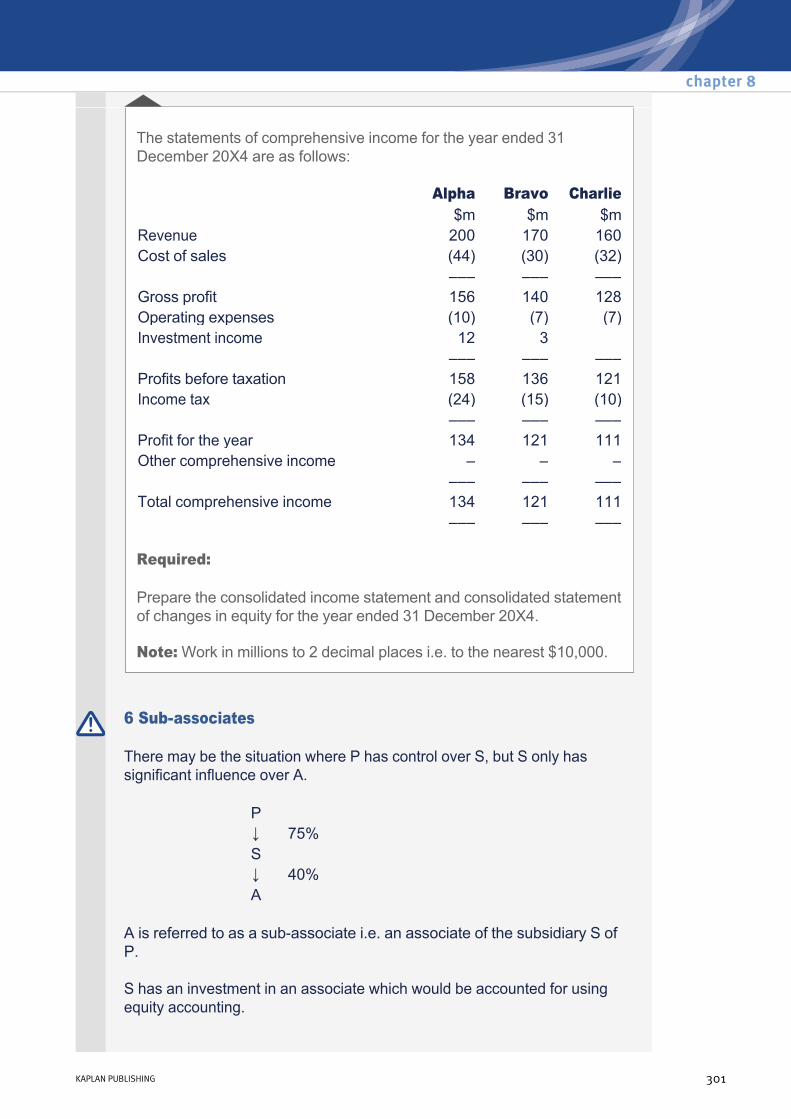
The statements of comprehensive income for the year ended 31 December 20X4 are as follows:
Required:
Prepare the consolidated income statement and consolidated statement of changes in equity for the year ended 31 December 20X4.
Note: Work in millions to 2 decimal places i.e. to the nearest $10,000.
Alpha Bravo Charlie $m $m $m
Revenue 200 170 160Cost of sales (44) (30) (32) ––– ––– ––– Gross profit 156 140 128Operating expenses (10) (7) (7)Investment income 12 3 ––– ––– ––– Profits before taxation 158 136 121Income tax (24) (15) (10) ––– ––– ––– Profit for the year 134 121 111Other comprehensive income – – – ––– ––– ––– Total comprehensive income 134 121 111
––– ––– –––
6 Subassociates
There may be the situation where P has control over S, but S only has significant influence over A.
A is referred to as a subassociate i.e. an associate of the subsidiary S of P.
S has an investment in an associate which would be accounted for using equity accounting.
P ↓ 75%S ↓ 40%A
chapter 8
KAPLAN PUBLISHING 301

The investment in associate would be made up of the cost of the investment and 40% of the post acquisition profits (being S’s share).
In the consolidated statement of financial position of the P group, this asset of S will be fully consolidated as it is under the control of P.
However, P only effectively owns 30% (75% x 40%) of S’s post acquisition profits with S’s NCI owning the remaining 10% (25% x 40%).
Therefore, the post acquisition profits of A will be split 30% : 10% within W4 : W5.
Similarly, in the consolidated statement of comprehensive income, income from the associate will be reported equal to 40% of A’s profits after tax with 30% being attributable to P shareholders and 10% attributable to the NCI shareholders.
7 Mixed groups
A mixed group exists where the parent company has a direct holding in the subsubsidiary as well as the indirect holding via the subsidiary.
Accounting for a mixed group is a combination of vertical groups and step acquisitions.
Approach to a question
Follow the same steps as with a vertical group when establishing group structure:
P → →% ↓ ↓ S %% ↓ ↓ Q ← ←
• Control
• Percentages of ownership
• Dates
Complex groups
302 KAPLAN PUBLISHING
Example 2
Example 2 answer

The IHA will need to be calculated on the indirect acquisition of the subsubsidiary.
P → → 1 April 20X2 70% ↓ ↓
S 30% 1 April 20X21 April 20X2 40% ↓ ↓
Q ← ←
Control
P controls S. Therefore S is a subsidiary.
P controls Q. P is able to direct 40% + 30% = 70% of the voting rights of Q. Therefore Q is a subsubsidiary.
Effective consolidation percentage
S will be consolidated with P owning 70% and the NCI owning 30%.
Q will be consolidated with P owning 58% and the NCI owning 42%.
Dates
The date of acquisition for S and Q is 1 April 20X2.
P's indirect ownership(70% × 40%) 28%P's direct ownership 30%
–––
58% –––
P → → 1 Jan 20X2 80% ↓ ↓
S 20% 1 Jan 20X31 Jan 20X2 40% ↓ ↓
Q ← ←
Control
P controls S. Therefore S is a subsidiary.
chapter 8
KAPLAN PUBLISHING 303
Illustration 7 Noncontrol to control
Illustration 6 Control to control
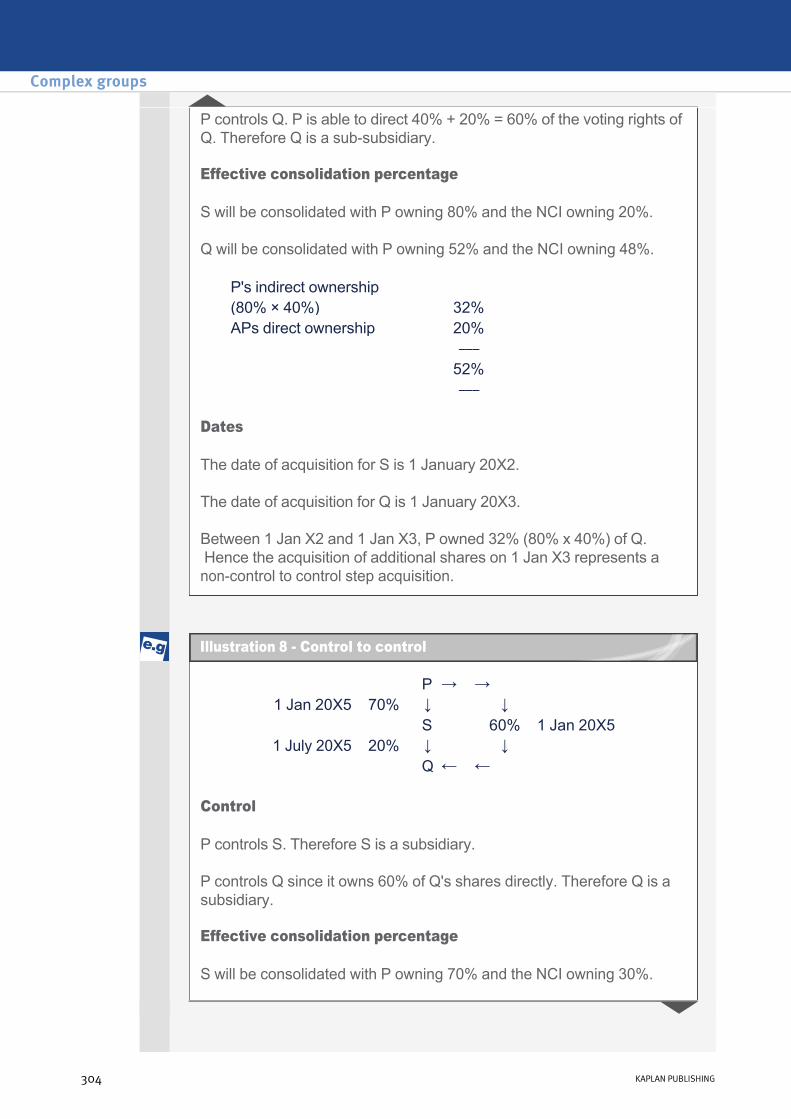
P controls Q. P is able to direct 40% + 20% = 60% of the voting rights of Q. Therefore Q is a subsubsidiary.
Effective consolidation percentage
S will be consolidated with P owning 80% and the NCI owning 20%.
Q will be consolidated with P owning 52% and the NCI owning 48%.
Dates
The date of acquisition for S is 1 January 20X2.
The date of acquisition for Q is 1 January 20X3.
Between 1 Jan X2 and 1 Jan X3, P owned 32% (80% x 40%) of Q. Hence the acquisition of additional shares on 1 Jan X3 represents a noncontrol to control step acquisition.
P's indirect ownership(80% × 40%) 32%APs direct ownership 20%
–––
52% –––
P → → 1 Jan 20X5 70% ↓ ↓
S 60% 1 Jan 20X51 July 20X5 20% ↓ ↓
Q ← ←
Control
P controls S. Therefore S is a subsidiary.
P controls Q since it owns 60% of Q's shares directly. Therefore Q is a subsidiary.
Effective consolidation percentage
S will be consolidated with P owning 70% and the NCI owning 30%.
Complex groups
304 KAPLAN PUBLISHING
Illustration 8 Control to control
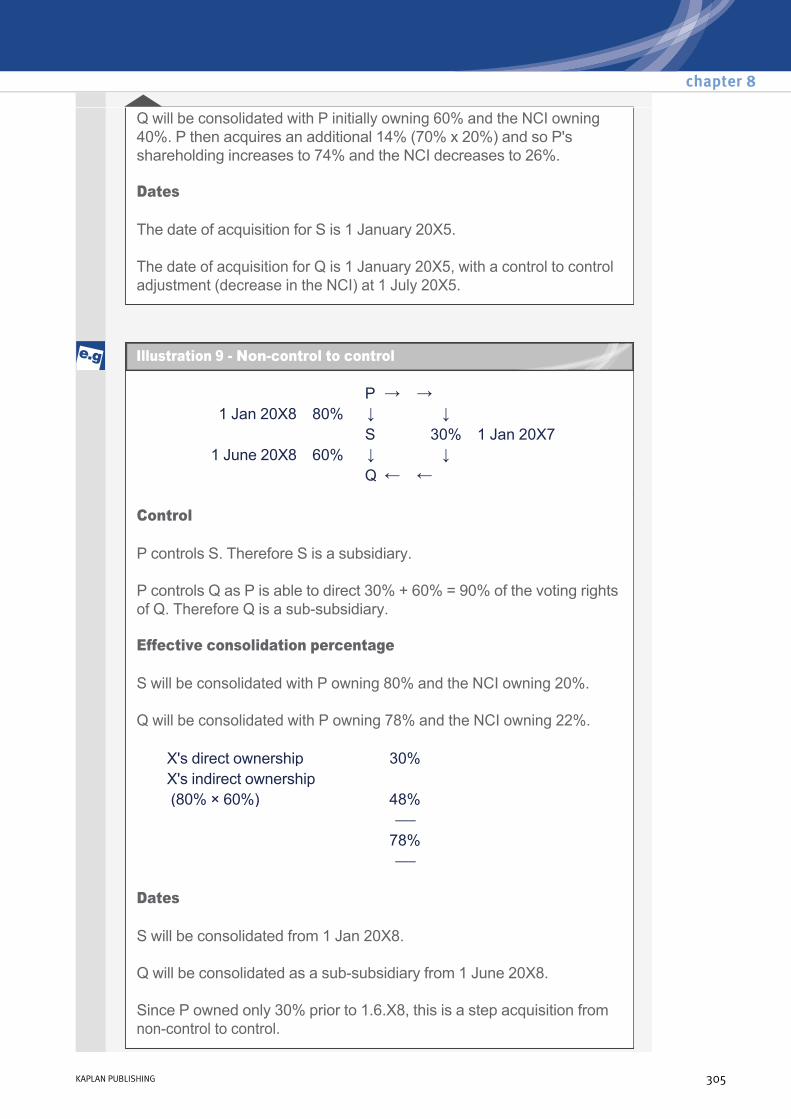
Q will be consolidated with P initially owning 60% and the NCI owning 40%. P then acquires an additional 14% (70% x 20%) and so P's shareholding increases to 74% and the NCI decreases to 26%.
Dates
The date of acquisition for S is 1 January 20X5.
The date of acquisition for Q is 1 January 20X5, with a control to control adjustment (decrease in the NCI) at 1 July 20X5.
P → → 1 Jan 20X8 80% ↓ ↓
S 30% 1 Jan 20X71 June 20X8 60% ↓ ↓
Q ← ←
Control
P controls S. Therefore S is a subsidiary.
P controls Q as P is able to direct 30% + 60% = 90% of the voting rights of Q. Therefore Q is a subsubsidiary.
Effective consolidation percentage
S will be consolidated with P owning 80% and the NCI owning 20%.
Q will be consolidated with P owning 78% and the NCI owning 22%.
Dates
S will be consolidated from 1 Jan 20X8.
Q will be consolidated as a subsubsidiary from 1 June 20X8.
Since P owned only 30% prior to 1.6.X8, this is a step acquisition from noncontrol to control.
X's direct ownership 30%X's indirect ownership (80% × 60%) 48%
–––
78% –––
chapter 8
KAPLAN PUBLISHING 305
Illustration 9 Noncontrol to control
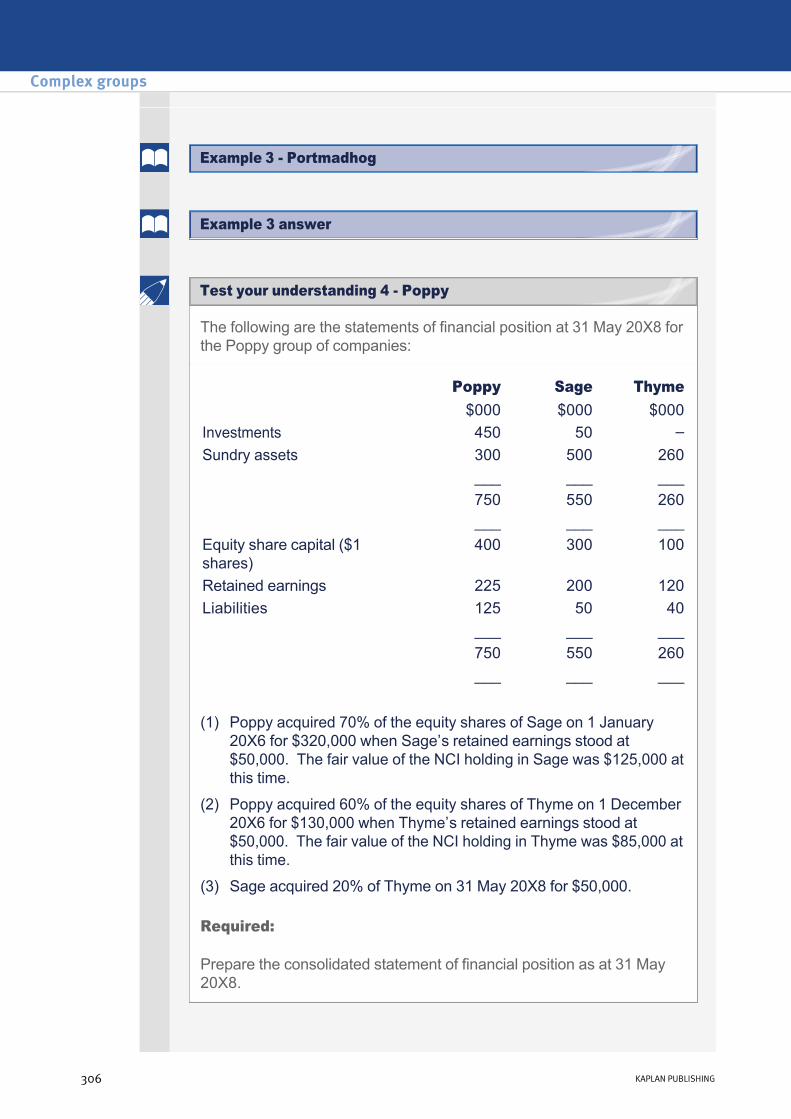
The following are the statements of financial position at 31 May 20X8 for the Poppy group of companies:
Required:
Prepare the consolidated statement of financial position as at 31 May 20X8.
Poppy Sage Thyme $000 $000 $000
Investments 450 50 – Sundry assets 300 500 260
___ ___ ___750 550 260___ ___ ___
Equity share capital ($1 shares)
400 300 100
Retained earnings 225 200 120Liabilities 125 50 40
___ ___ ___750 550 260___ ___ ___
(1) Poppy acquired 70% of the equity shares of Sage on 1 January
20X6 for $320,000 when Sage’s retained earnings stood at $50,000. The fair value of the NCI holding in Sage was $125,000 at this time.
(2) Poppy acquired 60% of the equity shares of Thyme on 1 December 20X6 for $130,000 when Thyme’s retained earnings stood at $50,000. The fair value of the NCI holding in Thyme was $85,000 at this time.
(3) Sage acquired 20% of Thyme on 31 May 20X8 for $50,000.
Complex groups
306 KAPLAN PUBLISHING
Example 3 Portmadhog
Test your understanding 4 Poppy
Example 3 answer
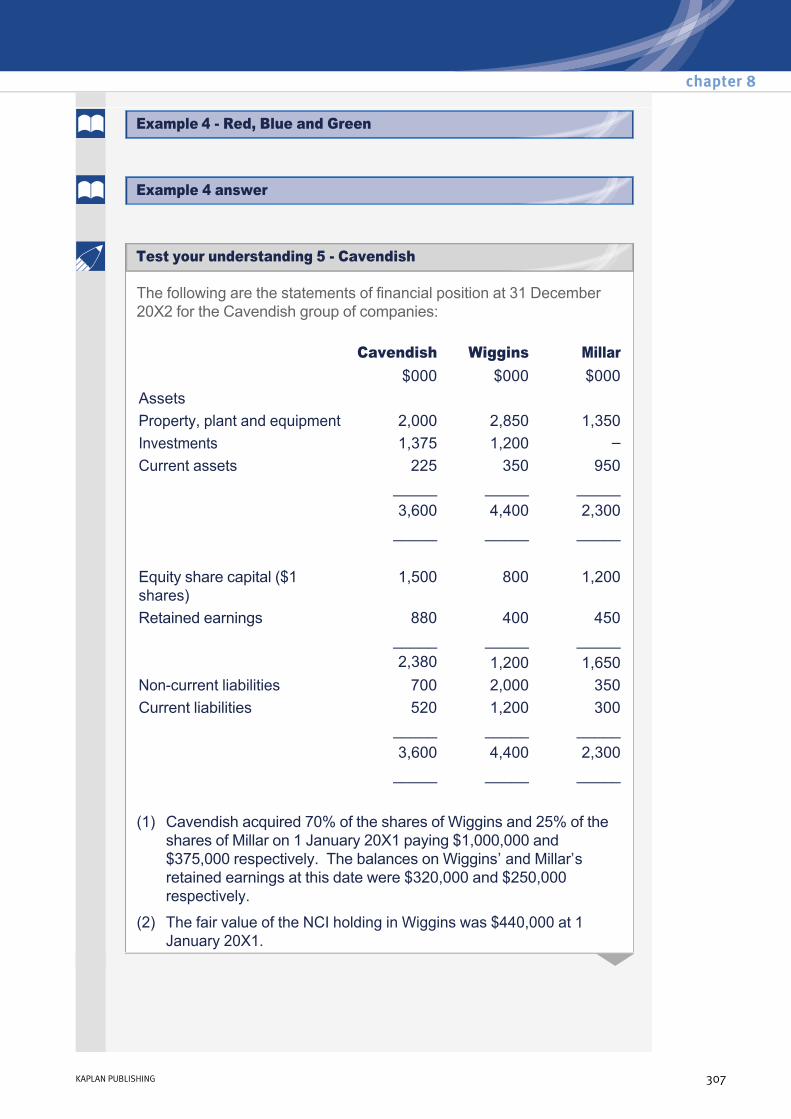
The following are the statements of financial position at 31 December 20X2 for the Cavendish group of companies:
Cavendish Wiggins Millar $000 $000 $000
Assets Property, plant and equipment 2,000 2,850 1,350Investments 1,375 1,200 – Current assets 225 350 950
_____ _____ _____3,600 4,400 2,300_____ _____ _____
Equity share capital ($1 shares)
1,500 800 1,200
Retained earnings 880 400 450 _____ _____ _____ 2,380 1,200 1,650Noncurrent liabilities 700 2,000 350Current liabilities 520 1,200 300
_____ _____ _____3,600 4,400 2,300_____ _____ _____
(1) Cavendish acquired 70% of the shares of Wiggins and 25% of the
shares of Millar on 1 January 20X1 paying $1,000,000 and $375,000 respectively. The balances on Wiggins’ and Millar’s retained earnings at this date were $320,000 and $250,000 respectively.
(2) The fair value of the NCI holding in Wiggins was $440,000 at 1 January 20X1.
chapter 8
KAPLAN PUBLISHING 307
Test your understanding 5 Cavendish
Example 4 Red, Blue and Green
Example 4 answer

Required:
Prepare the consolidated statement of financial position as at 31 December 20X2.
(3) On 1 January 20X2, Wiggins acquired 60% of the shares of Millar paying $1,200,000 when Millar’s retained earnings stood at $360,000. The fair value of Cavendish’s 25% holding in Millar was $400,000 at this time and the fair value of the NCI holding in Millar was $525,000 (based on effective shareholdings).
The summarised draft statements of financial position of three companies at 30 September 20X4 are:
Holdings Pepper Salt $000 $000 $000
Property, plant and equipment 1,000 700 225Investments In Pepper 350 In Salt 175 50 Current assets 370 300 75 –––– –––– –––– 1,895 1,050 300 –––– –––– –––– Share capital $1 500 300 100Retained earnings 1,145 550 150Current liabilities 250 200 50 –––– –––– ––––
1,895 1,050 300 –––– –––– ––––
(1) Holdings acquired 70% of the equity shares of Pepper on 1 October
20X1 when Pepper’s retained earnings were $100,000.
(3) Holdings acquired 60% of the equity shares of Salt on 1 October 20X1 when Salt’s retained earnings were $50,000.
(4) Pepper acquired 20% of the equity shares of Salt on 1 October 20X3 when Salt’s retained earnings were $125,000.
(5) It is group policy to measure NCIs using the proportion of net assets method.
Complex groups
308 KAPLAN PUBLISHING
Test your understanding 6 Holdings
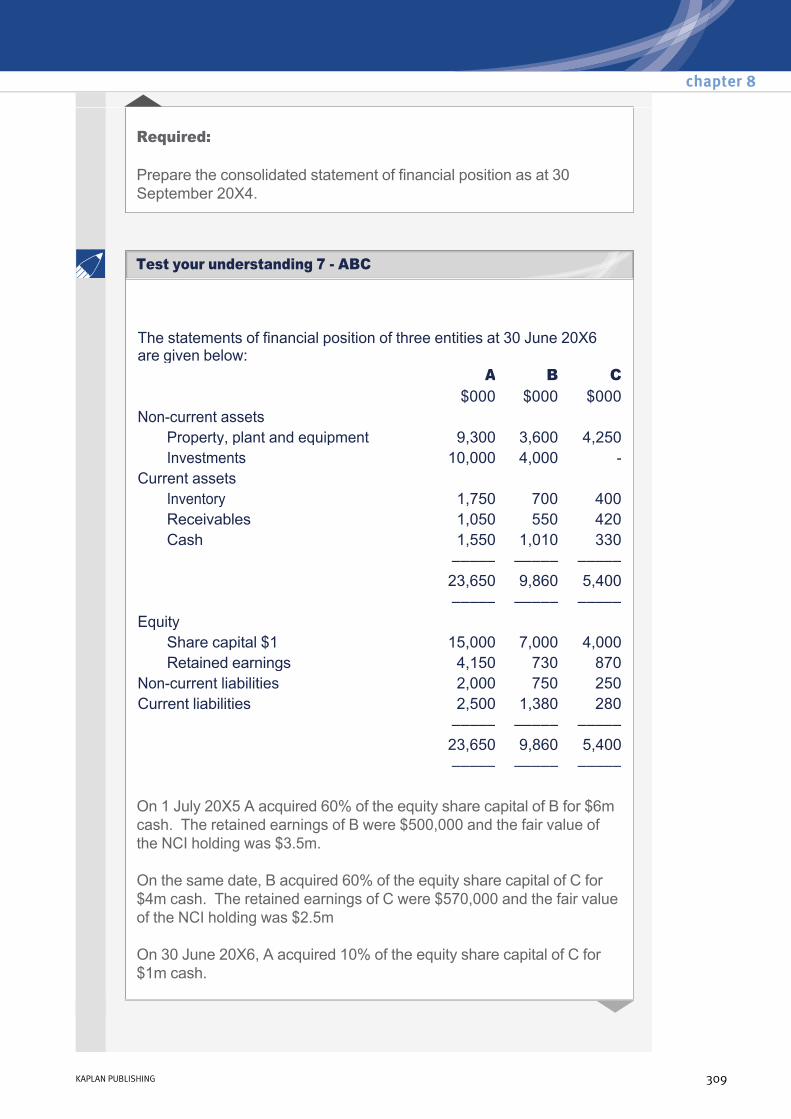
Required:
Prepare the consolidated statement of financial position as at 30 September 20X4.
The statements of financial position of three entities at 30 June 20X6 are given below: A B C
$000 $000 $000Noncurrent assets
Property, plant and equipment 9,300 3,600 4,250Investments 10,000 4,000
Current assets Inventory 1,750 700 400Receivables 1,050 550 420Cash 1,550 1,010 330
––––– ––––– ––––– 23,650 9,860 5,400 ––––– ––––– ––––– Equity
Share capital $1 15,000 7,000 4,000Retained earnings 4,150 730 870
Noncurrent liabilities 2,000 750 250Current liabilities 2,500 1,380 280 ––––– ––––– –––––
23,650 9,860 5,400 ––––– ––––– –––––
On 1 July 20X5 A acquired 60% of the equity share capital of B for $6m cash. The retained earnings of B were $500,000 and the fair value of the NCI holding was $3.5m.
On the same date, B acquired 60% of the equity share capital of C for $4m cash. The retained earnings of C were $570,000 and the fair value of the NCI holding was $2.5m
On 30 June 20X6, A acquired 10% of the equity share capital of C for $1m cash.
chapter 8
KAPLAN PUBLISHING 309
Test your understanding 7 ABC
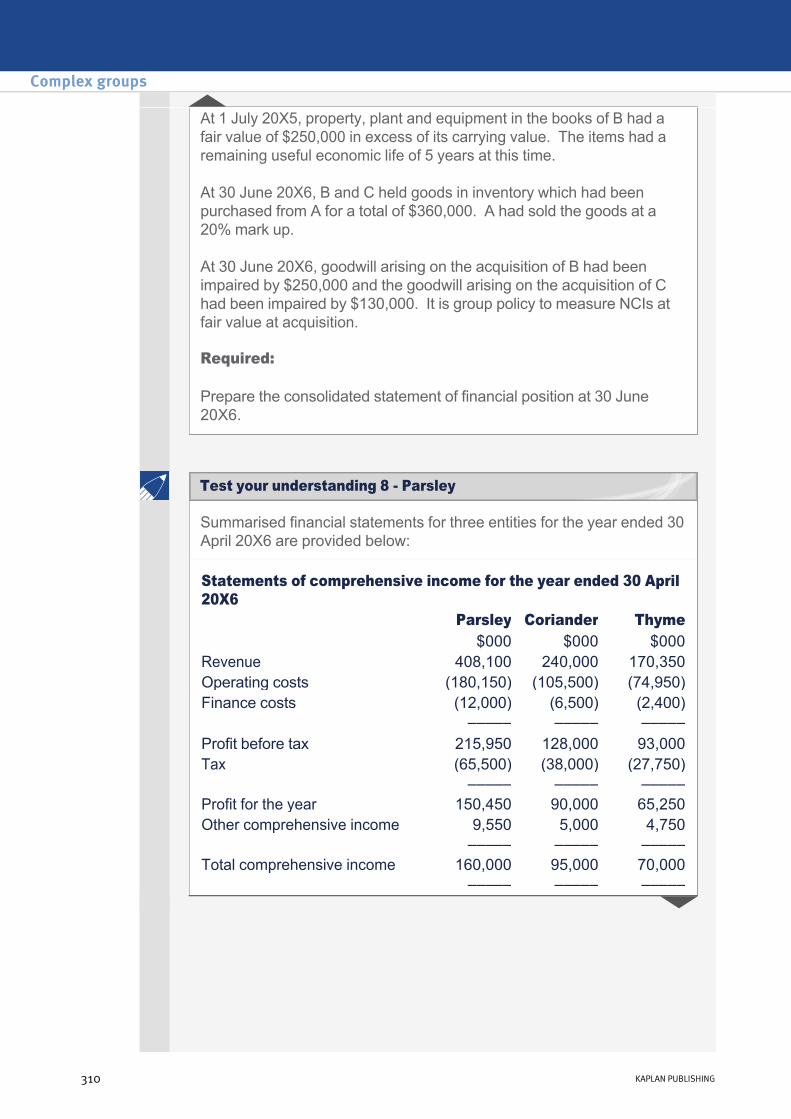
At 1 July 20X5, property, plant and equipment in the books of B had a fair value of $250,000 in excess of its carrying value. The items had a remaining useful economic life of 5 years at this time.
At 30 June 20X6, B and C held goods in inventory which had been purchased from A for a total of $360,000. A had sold the goods at a 20% mark up.
At 30 June 20X6, goodwill arising on the acquisition of B had been impaired by $250,000 and the goodwill arising on the acquisition of C had been impaired by $130,000. It is group policy to measure NCIs at fair value at acquisition.
Required:
Prepare the consolidated statement of financial position at 30 June 20X6.
Summarised financial statements for three entities for the year ended 30 April 20X6 are provided below:
Statements of comprehensive income for the year ended 30 April 20X6 Parsley Coriander Thyme $000 $000 $000Revenue 408,100 240,000 170,350Operating costs (180,150) (105,500) (74,950)Finance costs (12,000) (6,500) (2,400) ––––– ––––– –––––Profit before tax 215,950 128,000 93,000Tax (65,500) (38,000) (27,750) ––––– ––––– –––––Profit for the year 150,450 90,000 65,250Other comprehensive income 9,550 5,000 4,750 ––––– ––––– –––––Total comprehensive income 160,000 95,000 70,000 ––––– ––––– –––––
Complex groups
310 KAPLAN PUBLISHING
Test your understanding 8 Parsley
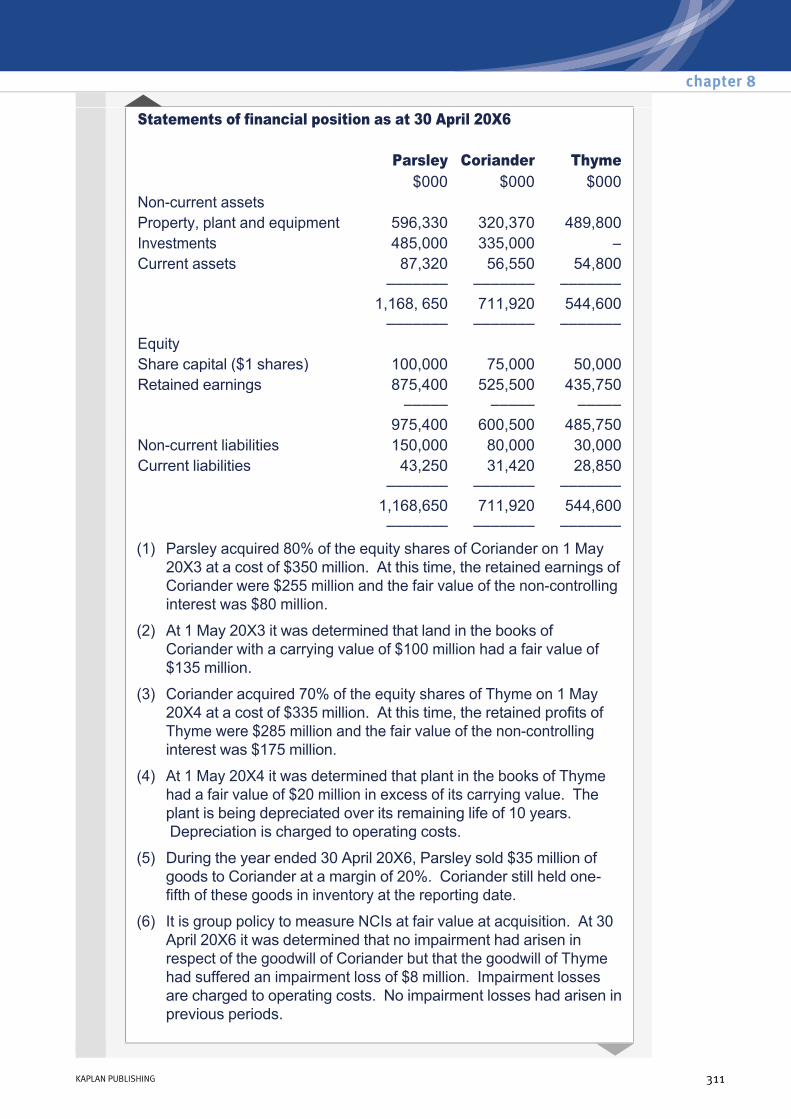
Statements of financial position as at 30 April 20X6
Parsley Coriander Thyme $000 $000 $000Noncurrent assets Property, plant and equipment 596,330 320,370 489,800Investments 485,000 335,000 – Current assets 87,320 56,550 54,800 ––––––– ––––––– ––––––– 1,168, 650 711,920 544,600 ––––––– ––––––– –––––––Equity Share capital ($1 shares) 100,000 75,000 50,000Retained earnings 875,400 525,500 435,750 ––––– ––––– ––––– 975,400 600,500 485,750Noncurrent liabilities 150,000 80,000 30,000Current liabilities 43,250 31,420 28,850 ––––––– ––––––– ––––––– 1,168,650 711,920 544,600 ––––––– ––––––– –––––––(1) Parsley acquired 80% of the equity shares of Coriander on 1 May
20X3 at a cost of $350 million. At this time, the retained earnings of Coriander were $255 million and the fair value of the noncontrolling interest was $80 million.
(2) At 1 May 20X3 it was determined that land in the books of Coriander with a carrying value of $100 million had a fair value of $135 million.
(3) Coriander acquired 70% of the equity shares of Thyme on 1 May 20X4 at a cost of $335 million. At this time, the retained profits of Thyme were $285 million and the fair value of the noncontrolling interest was $175 million.
(4) At 1 May 20X4 it was determined that plant in the books of Thyme had a fair value of $20 million in excess of its carrying value. The plant is being depreciated over its remaining life of 10 years. Depreciation is charged to operating costs.
(5) During the year ended 30 April 20X6, Parsley sold $35 million of goods to Coriander at a margin of 20%. Coriander still held onefifth of these goods in inventory at the reporting date.
(6) It is group policy to measure NCIs at fair value at acquisition. At 30 April 20X6 it was determined that no impairment had arisen in respect of the goodwill of Coriander but that the goodwill of Thyme had suffered an impairment loss of $8 million. Impairment losses are charged to operating costs. No impairment losses had arisen in previous periods.
chapter 8
KAPLAN PUBLISHING 311

Required:
Prepare the consolidated statement of comprehensive income for the year ended 30 April 20X6 and the consolidated statement of financial position as at that date.
Summarised financial statements for three entities for the year ended 30 April 20X3 are provided below:
Statements of comprehensive income for the year ended 30 April 20X3 Hitchcock Spencer Spooner $m $m $mRevenue 120 84 80Operating costs (83) (67) (55) ––––– ––––– –––––Profit before tax 37 17 25Tax (12) (7) (10) ––––– ––––– –––––Profit for the year 25 10 15Other comprehensive income 10 6 – ––––– ––––– –––––Total comprehensive income 35 16 15 ––––– ––––– –––––Statements of financial position as at 30 April 20X3
Hitchcock Spencer Spooner $m $m $mNoncurrent assets Property, plant and equipment 240 70 102Investments In Spencer 70 In Spooner 23 65 ––––– ––––– ––––– 333 135 102Current assets 117 40 58 ––––– ––––– ––––– 450 175 160 ––––– ––––– –––––
Complex groups
312 KAPLAN PUBLISHING
Test your understanding 9 Hitchcock

Required:
Prepare the consolidated statement of comprehensive income for the year ended 30 April 20X3 and the consolidated statement of financial position at that date.
Equity Share capital ($1 shares) 75 30 24Retained earnings 275 60 66 ––––– ––––– ––––– 350 90 90Liabilities 100 85 70 ––––– ––––– ––––– 450 175 160 ––––– ––––– –––––(1) Hitchcock acquired 80% of the equity shares of Spencer on 1 May
20X1 paying $70 million. The retained earnings of Spencer were $30 million at this time and the fair value of the NCI holding in Spencer was $15 million.
(2) Hitchcock acquired 25% of the equity shares of Spooner on 1 May 20X1 paying $23 million.
(3) On 1 May 20X2 Spencer acquired 60% of Spooner’s equity shares paying $65 million. At this date the retained earnings of Spooner were $51 million. The fair value of Hitchcock’s 25% holding in Spooner was $25 million and the fair value of the NCI holding (based on effective holdings) was $27 million.
(4) At 30 April 20X3 it was determined that the goodwill arising on the acquisition of Spencer had been impaired by $5 million. The goodwill arising on the acquisition of Spooner remained unimpaired.
chapter 8
KAPLAN PUBLISHING 313

8 Chapter summary
Complex groups
314 KAPLAN PUBLISHING

Test your understanding answers
Consolidated statement of financial position as at 31 December 20X7
$Goodwill (W3) 48,250Other net assets (280,000 + 133,000 + 100,000) 513,000
_______ 561,250 _______Capital and reserves Equity share capital 100,000Retained earnings (W5) 66,150NCI (W4) 70,100Liabilities (200,000 + 100,000 + 25,000) 325,000
_______561,250_______
Workings
(W1) Group structure
Effective consolidation percentages:
H ↓ 45/60 = 75% on 1.1.X1S ↓ 30/50 = 60% on 1.1.X1T
S T Group interest 75% 45%(75% × 60%)Non controlling interest 25% 55%
_____ _____100% 100%_____ _____
chapter 8
KAPLAN PUBLISHING 315
Test your understanding 1 H, S & T

(W2) Net assets
(W3) Goodwill
(W4) Noncontrolling interest
S T Acq'n
date Rep. date
Acq'n date
Rep. date
1.1.X1 31.12.X7 1.1.X1 31.12.X7 $ $ $ $
Share capital 60,000 60,000 50,000 50,000 Retained earnings
10,000 28,000 8,000 25,000
_______ _______ _______ _______70,000 88,000 58,000 75,000
_______ _______ _______ _______
S T $ $
Sub's cost of investment in subsub 55,000IHA (25% x 55,000) (13,750) –––––– Fair value of P's holding 65,000 41,250NCI holding at fair value 20,000 50,000Fair value of sub's net assets at acquisition (W2) (70,000) (58,000) –––––– –––––– Goodwill on acquisition 15,000 33,250 –––––– ––––––
$S: NCI holding at acquisition (W3) 20,000NCI% x post acquisition reserves (25% x 18,000 (W2)) 4,500IHA (W3) (13,750)T: NCI holding at acquisition (W3) 50,000NCI% x post acquisition reserves (55% x 17,000 (W2)) 9,350
______70,100
______
Complex groups
316 KAPLAN PUBLISHING
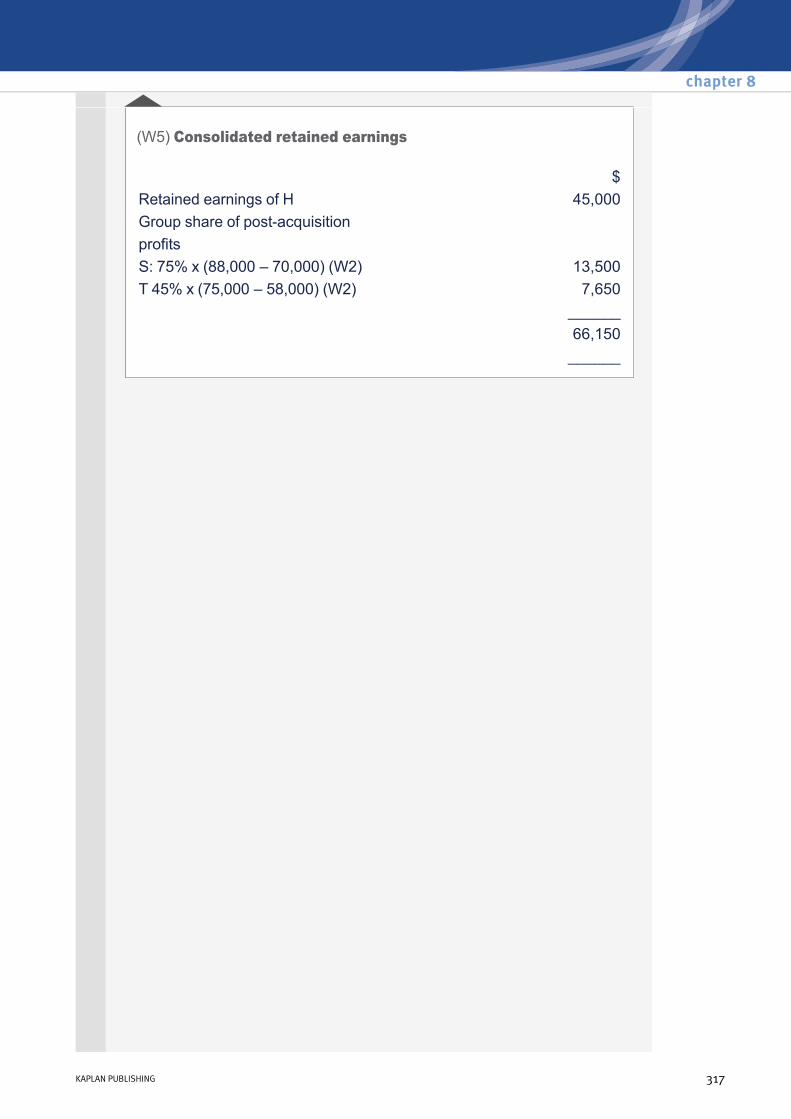
(W5) Consolidated retained earnings
$Retained earnings of H 45,000Group share of postacquisition profitsS: 75% x (88,000 – 70,000) (W2) 13,500T 45% x (75,000 – 58,000) (W2) 7,650
______66,150______
chapter 8
KAPLAN PUBLISHING 317
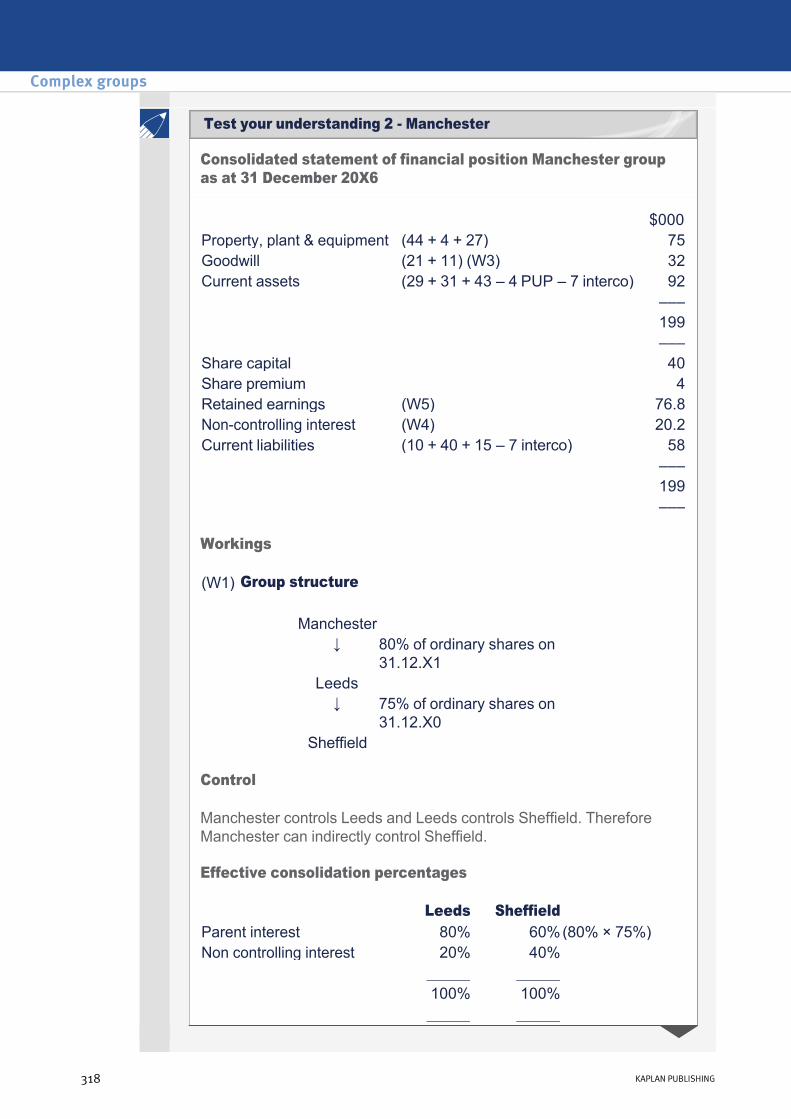
Consolidated statement of financial position Manchester group as at 31 December 20X6
Workings
Control
Manchester controls Leeds and Leeds controls Sheffield. Therefore Manchester can indirectly control Sheffield.
Effective consolidation percentages
$000Property, plant & equipment (44 + 4 + 27) 75Goodwill (21 + 11) (W3) 32Current assets (29 + 31 + 43 – 4 PUP – 7 interco) 92 ––– 199 ––– Share capital 40Share premium 4Retained earnings (W5) 76.8Noncontrolling interest (W4) 20.2Current liabilities (10 + 40 + 15 – 7 interco) 58 ––– 199 –––
(W1) Group structure
Manchester ↓ 80% of ordinary shares on
31.12.X1Leeds ↓ 75% of ordinary shares on
31.12.X0Sheffield
Leeds Sheffield Parent interest 80% 60%(80% × 75%)Non controlling interest 20% 40%
_____ _____100% 100%_____ _____
Complex groups
318 KAPLAN PUBLISHING
Test your understanding 2 Manchester
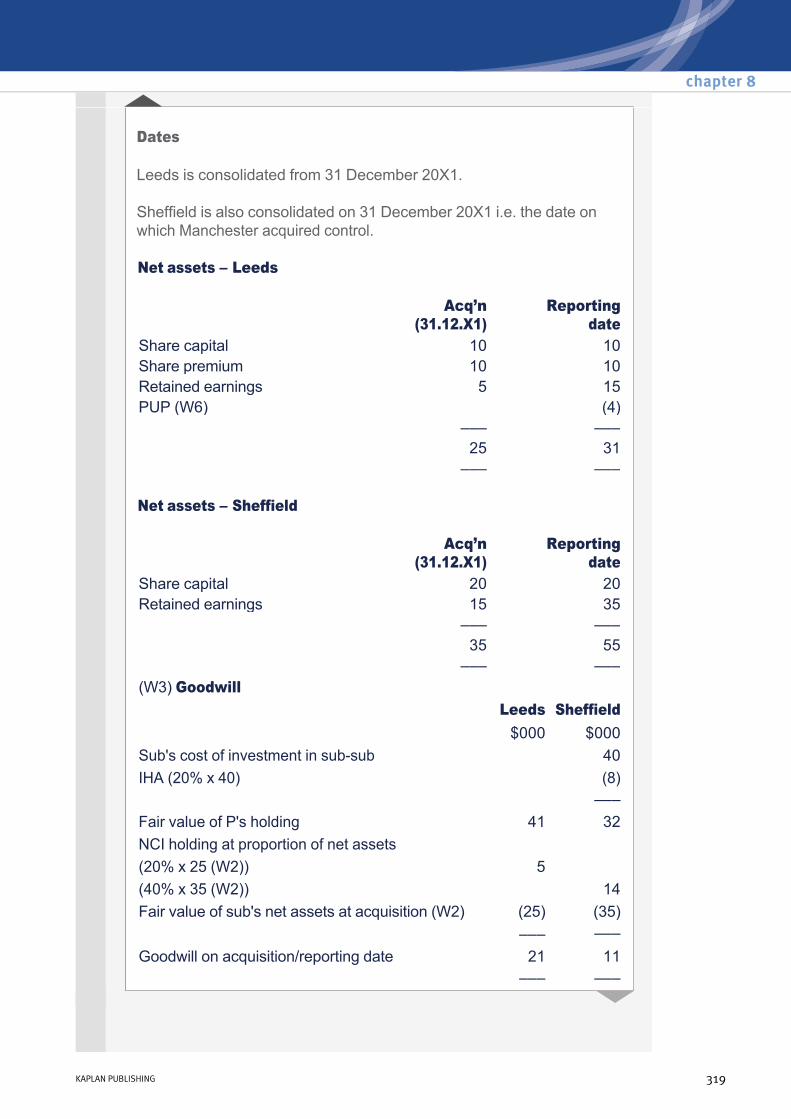
Dates
Leeds is consolidated from 31 December 20X1.
Sheffield is also consolidated on 31 December 20X1 i.e. the date on which Manchester acquired control.
Net assets – Leeds
Net assets – Sheffield
Acq’n (31.12.X1)
Reporting date
Share capital 10 10Share premium 10 10Retained earnings 5 15PUP (W6) (4) ––– ––– 25 31 ––– –––
Acq’n (31.12.X1)
Reporting date
Share capital 20 20Retained earnings 15 35 ––– ––– 35 55 ––– ––– (W3) Goodwill Leeds Sheffield
$000 $000Sub's cost of investment in subsub 40IHA (20% x 40) (8) –––Fair value of P's holding 41 32NCI holding at proportion of net assets (20% x 25 (W2)) 5 (40% x 35 (W2)) 14Fair value of sub's net assets at acquisition (W2) (25) (35) ––– –––Goodwill on acquisition/reporting date 21 11 ––– –––
chapter 8
KAPLAN PUBLISHING 319
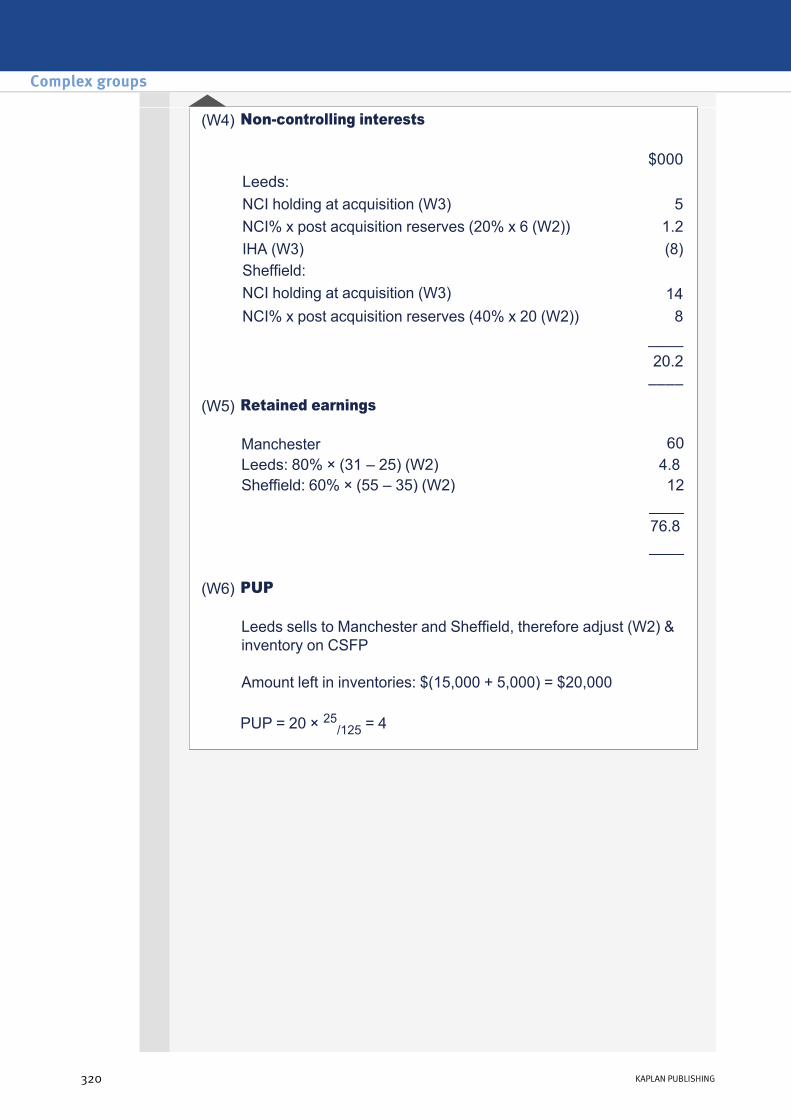
(W4) Noncontrolling interests
$000Leeds: NCI holding at acquisition (W3) 5NCI% x post acquisition reserves (20% x 6 (W2)) 1.2IHA (W3) (8)Sheffield: NCI holding at acquisition (W3) 14NCI% x post acquisition reserves (40% x 20 (W2)) 8
____20.2
–––– (W5) Retained earnings
Manchester 60Leeds: 80% × (31 – 25) (W2) 4.8 Sheffield: 60% × (55 – 35) (W2) 12 ____ 76.8 ____
(W6) PUP
PUP = 20 × 25/125 = 4
Leeds sells to Manchester and Sheffield, therefore adjust (W2) & inventory on CSFP
Amount left in inventories: $(15,000 + 5,000) = $20,000
Complex groups
320 KAPLAN PUBLISHING

Alpha consolidates 80% of Bravo from 1.1.X0
Charlie will be consolidated at 80% × 60% = 48% from 1.1.X1 with a noncontrolling interest of 52%.
Consolidated statement of comprehensive income
Consolidated statement of changes in equity
$mRevenue (200 + 170 + 160) 530Cost of sales (44 + 30 + 32) (106) –––––– Gross profit 424Operating expenses (10 + 7 + 7) (24)Investment income (12 + 3 12 3 (W2)) – –––––– Profit before tax 400Tax (24 + 15 + 10) (49) –––––– Profit for the year 351Other comprehensive income – –––––– Total comprehensive income 351 –––––– Profit/ TCI attributable to: Parent shareholders (balance) 269.68NCI shareholders (W3) 81.32
––––– 351
–––––
Parent shareholders
NCI shareholders
$m $mEquity b/f (W5, W6) 433.6 164.8Comprehensive income 269.68 81.32Dividends paid (30)
Bravo NCI (20% x 15) (3)Charlie NCI (40% x 5) (2)
––––– ––––– Equity c/f (W4) 673.28 241.12 ––––– –––––
chapter 8
KAPLAN PUBLISHING 321
Test your understanding 3 Alpha
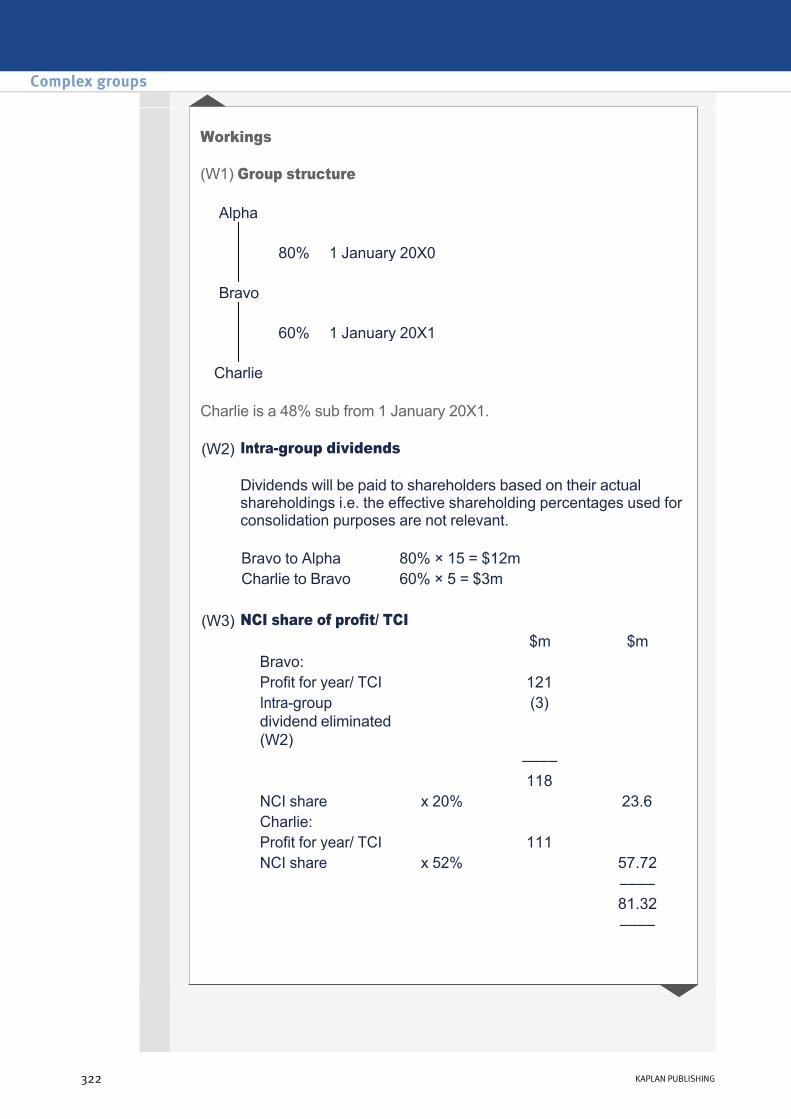
Workings
(W1) Group structure
Charlie is a 48% sub from 1 January 20X1.
Alpha 80% 1 January 20X0 Bravo
60% 1 January 20X1 Charlie
(W2) Intragroup dividends
Dividends will be paid to shareholders based on their actual shareholdings i.e. the effective shareholding percentages used for consolidation purposes are not relevant.
Bravo to Alpha 80% × 15 = $12mCharlie to Bravo 60% × 5 = $3m
(W3) NCI share of profit/ TCI $m $m
Bravo: Profit for year/ TCI 121 Intragroup dividend eliminated (W2)
(3)
–––– 118
NCI share x 20% 23.6Charlie: Profit for year/ TCI 111 NCI share x 52% 57.72
–––– 81.32 ––––
Complex groups
322 KAPLAN PUBLISHING
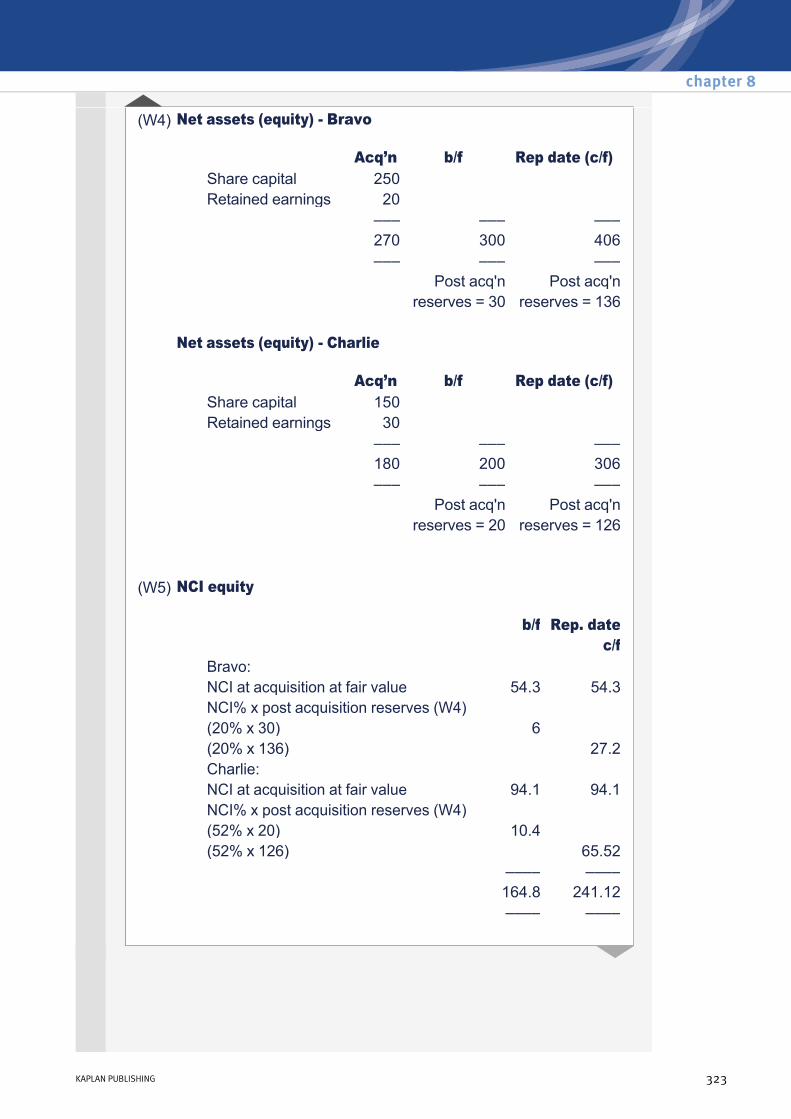
(W4) Net assets (equity) Bravo
Acq’n b/f Rep date (c/f) Share capital 250 Retained earnings 20
––– ––– ––– 270 300 406
––– ––– ––– Post acq'n Post acq'n reserves = 30 reserves = 136 Net assets (equity) Charlie
Acq’n b/f Rep date (c/f) Share capital 150 Retained earnings 30
––– ––– ––– 180 200 306
––– ––– ––– Post acq'n Post acq'n reserves = 20 reserves = 126
(W5) NCI equity
b/f Rep. date c/f
Bravo: NCI at acquisition at fair value 54.3 54.3NCI% x post acquisition reserves (W4) (20% x 30) 6 (20% x 136) 27.2Charlie: NCI at acquisition at fair value 94.1 94.1NCI% x post acquisition reserves (W4) (52% x 20) 10.4 (52% x 126) 65.52
–––– –––– 164.8 241.12
–––– ––––
chapter 8
KAPLAN PUBLISHING 323

(W6) Parent's equity
b/f Rep. date c/f
Alpha 400 504Sub: P% x post acquisition reserves (W4) Bravo: (80% x 30) 24 (80% x 136) 108.8Charlie: (48% x 20) 9.6 (48% x 126) 60.48
––––– ––––– 433.6 673.28
––––– –––––
Consolidated statement of financial position as at 31 May 20X8
$000Goodwill (95 + 65) (W3) 160Investments (450 + 50 320 (W3) 130 (W3) 50
(W6))
Sundry assets (300 + 500 + 260) 1,060 ––––– 1,220 ––––– Equity Share capital 400Retained earnings (W5) 372Other reserves (10) ––––– 762Noncontrolling interest
(W4) 243
––––– 1,005Liabilities (125 + 50 + 40) 215 ––––– 1,220 –––––
Complex groups
324 KAPLAN PUBLISHING
Test your understanding 4 Poppy

Workings
(W1)
Sage will be consolidated as a 70% sub (NCI owning 30%) from 1 January 20X6.
Thyme will be consolidated as a 60% sub (NCI owning 40%) from 1 December 20X6 and as a 74% sub (NCI owning 26%) from 31 May 20X8 (reporting date).
Since Thyme is owned 60% at 1 December 20X6 this is a step acquisition control to control.
Poppy → → 1 January 20X6 70% ↓ ↓
Sage 60% 1 December 20X631 May 20X8 20% ↓ ↓
Thyme ← ←
Direct 60% Indirect (70% × 20%) 14% –––
74%
(W2) Net assets – Sage
Acq’n Reporting date Share capital 300 300Retained earnings 50 200 ––– ––– 350 500 ––– ––– Post acq'n profits = 150
chapter 8
KAPLAN PUBLISHING 325
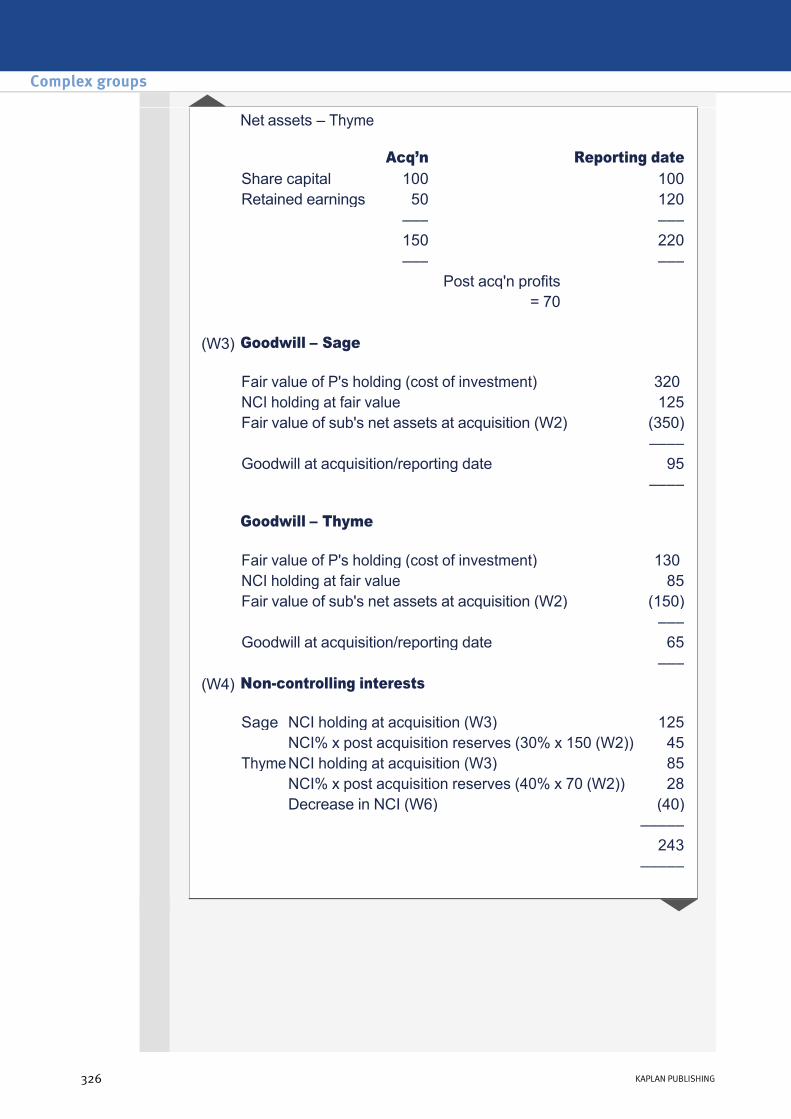
Net assets – Thyme
Acq’n Reporting date Share capital 100 100Retained earnings 50 120 ––– ––– 150 220 ––– ––– Post acq'n profits = 70
(W3) Goodwill – Sage
Goodwill – Thyme
Fair value of P's holding (cost of investment) 320 NCI holding at fair value 125Fair value of sub's net assets at acquisition (W2) (350) –––– Goodwill at acquisition/reporting date 95 ––––
Fair value of P's holding (cost of investment) 130 NCI holding at fair value 85Fair value of sub's net assets at acquisition (W2) (150) ––– Goodwill at acquisition/reporting date 65 –––
(W4) Noncontrolling interests
Sage NCI holding at acquisition (W3) 125 NCI% x post acquisition reserves (30% x 150 (W2)) 45ThymeNCI holding at acquisition (W3) 85
NCI% x post acquisition reserves (40% x 70 (W2)) 28 Decrease in NCI (W6) (40) ––––– 243 –––––
Complex groups
326 KAPLAN PUBLISHING
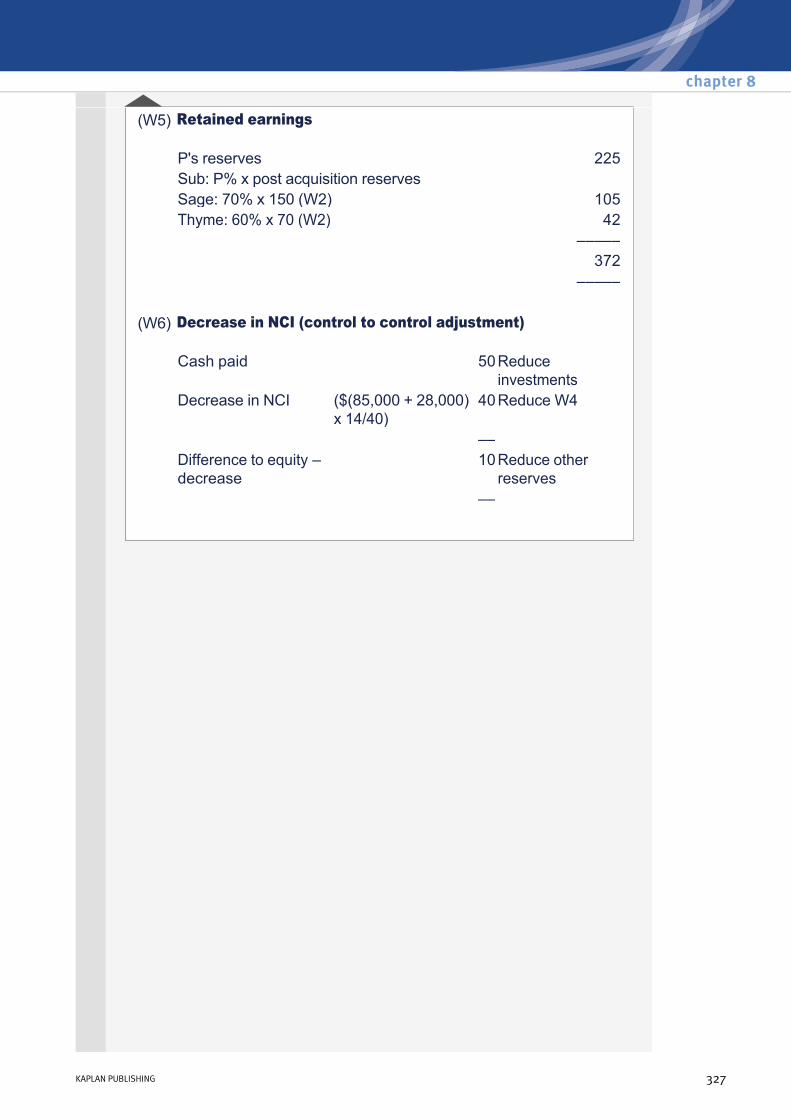
(W5) Retained earnings
P's reserves 225Sub: P% x post acquisition reserves Sage: 70% x 150 (W2) 105Thyme: 60% x 70 (W2) 42 ––––– 372 –––––
(W6) Decrease in NCI (control to control adjustment)
Cash paid 50Reduce investments
Decrease in NCI ($(85,000 + 28,000) x 14/40)
40Reduce W4
–– Difference to equity – decrease
10Reduce other reserves
––
chapter 8
KAPLAN PUBLISHING 327

Consolidated statement of financial position as at 31 December 20X2
Workings
(W1) Group structure
Wiggins will be consolidated as a 70% sub (NCI owning 30%) from 1 Jan 20X1.
Millar will be consolidated as a 67% sub (NCI owning 33%) from 1 Jan 20X2.
$000Goodwill (320 + 205) (W3) 525Property, plant and equipment
(2,000 + 2,850 + 1,350) 6,200
Investments (1,375 + 1,200 1,000 (W3) 1,200 (W3) 375 (W6))
Current assets (225 + 350 + 950) 1,525 –––––– 8,250 –––––– Equity Share capital 1,500Retained earnings (W5) 1,021.3 –––––– 2,521.3Noncontrolling interest (104 + 554.7) (W4) 658.7 –––––– 3,180Noncurrent liabilities (700 + 2,000 +350) 3,050Current liabilities (520 + 1,200 + 300) 2,020 –––––– 8,250 ––––––
Cavendish → → 1 Jan 20X1 70% ↓ ↓
Wiggins 25% 1 Jan 20X11 Jan 20X2 60% ↓ ↓
Millar ← ←
Complex groups
328 KAPLAN PUBLISHING
Test your understanding 5 Cavendish

Cavendish's direct ownership 1 Jan 20X1 25%Cavendish's indirect ownership 1 Jan 20X2 (70% × 60%) 42%
–––
67%Cavendish achieves control of Millar at the later date of 1 Jan 20X2 when Wiggins achieves control of Millar. Therefore this is a noncontrol to control step acquisition.
–––
(W2) Net assets – Wiggins
Net assets – Millar
Acq’n Reporting date $000 $000 Share capital 800 800Retained earnings 320 400 –––– –––– 1,120 1,200 –––– –––– Post acq'n profits = 80
Acq’n Reporting date $000 $000 Share capital 1,200 1,200Retained earnings 360 450 –––– –––– 1,560 1,650 –––– –––– Post acq'n profits = 90
(W3) Goodwill – Wiggins ($000)
Fair value of P's holding (cost of investment) 1,000NCI holding at fair value 440Fair value of sub's net assets at acquisition (W2) (1,120) –––– Goodwill at acquisition/ reporting date 320 ––––
chapter 8
KAPLAN PUBLISHING 329
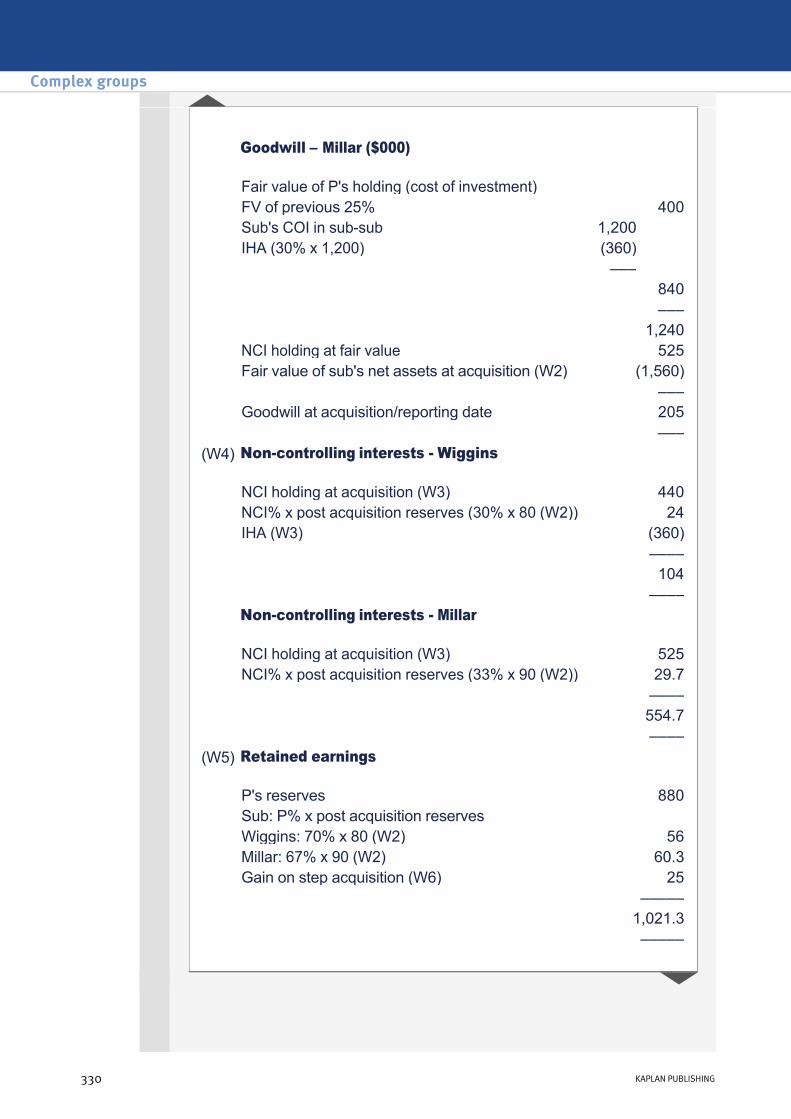
Goodwill – Millar ($000)
Fair value of P's holding (cost of investment) FV of previous 25% 400Sub's COI in subsub 1,200 IHA (30% x 1,200) (360) ––– 840 ––– 1,240NCI holding at fair value 525Fair value of sub's net assets at acquisition (W2) (1,560) ––– Goodwill at acquisition/reporting date 205 –––
(W4) Noncontrolling interests Wiggins
NCI holding at acquisition (W3) 440NCI% x post acquisition reserves (30% x 80 (W2)) 24IHA (W3) (360) ––––
104 ––––
Noncontrolling interests Millar
NCI holding at acquisition (W3) 525NCI% x post acquisition reserves (33% x 90 (W2)) 29.7 ––––
554.7 ––––
(W5) Retained earnings
P's reserves 880Sub: P% x post acquisition reserves Wiggins: 70% x 80 (W2) 56Millar: 67% x 90 (W2) 60.3Gain on step acquisition (W6) 25 ––––– 1,021.3 –––––
Complex groups
330 KAPLAN PUBLISHING

(W6) Step acquisition adjustment
Fair value of previous 25% 400 Increase goodwill W3Carrying value of previous 25% (cost) (375)Reduce investments –––– Gain to profit 25 Increase reserves W5 ––––
Consolidated statement of financial position as at 30 September 20X4
Workings
(W1) Group structure
$000Property, plant and equipment (1,000 + 700 + 225) 1,925Goodwill (70 + 85) (W3) 155Current assets (370 + 300 + 75) 745 –––––– 2,825 –––––– Equity Share capital 500Retained earnings (W5) 1,523.5Other reserves (18.5) –––––– 2,005Noncontrolling interest (255 + 65) (W4) 320 –––––– 2,325Liabilities (250 + 200 + 50) 500 –––––– 2,825 ––––––
Holdings → → 1 Oct 20X1 70% ↓ ↓
Pepper 60% 1 Oct 20X11 Oct 20X3 20% ↓ ↓
Salt ← ←
chapter 8
KAPLAN PUBLISHING 331
Test your understanding 6 Holdings
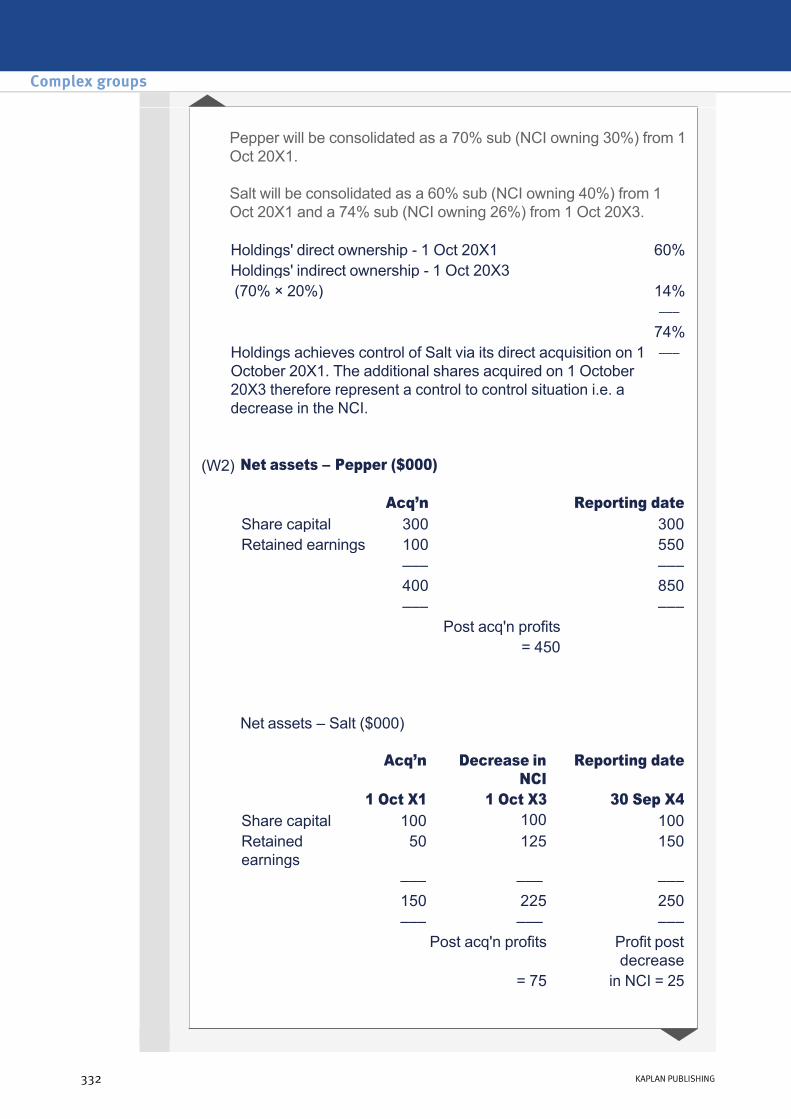
Pepper will be consolidated as a 70% sub (NCI owning 30%) from 1 Oct 20X1.
Salt will be consolidated as a 60% sub (NCI owning 40%) from 1 Oct 20X1 and a 74% sub (NCI owning 26%) from 1 Oct 20X3.
Holdings' direct ownership 1 Oct 20X1 60%Holdings' indirect ownership 1 Oct 20X3 (70% × 20%) 14%
–––
74%Holdings achieves control of Salt via its direct acquisition on 1 October 20X1. The additional shares acquired on 1 October 20X3 therefore represent a control to control situation i.e. a decrease in the NCI.
–––
(W2) Net assets – Pepper ($000)
Net assets – Salt ($000)
Acq’n Reporting date Share capital 300 300Retained earnings 100 550 ––– ––– 400 850 ––– ––– Post acq'n profits = 450
Acq’n Decrease in NCI
Reporting date
1 Oct X1 1 Oct X3 30 Sep X4 Share capital 100 100 100Retained earnings
50 125 150
––– ––– ––– 150 225 250 ––– ––– ––– Post acq'n profits Profit post
decrease = 75 in NCI = 25
Complex groups
332 KAPLAN PUBLISHING

(W3) Goodwill – Pepper ($000)
Goodwill – Salt ($000)
Fair value of P's holding (cost of investment) 350NCI holding at proportion of net assets (30% x 400 (W2)) 120Fair value of sub's net assets at acquisition (W2) (400) –––– Goodwill at acquisition/reporting date 70 ––––
Fair value of P's holding (cost of investment) 175NCI holding at proportion of net assets (40% x 150 (W2)) 60Fair value of sub's net assets at acquisition (W2) (150) ––– Goodwill at acquisition/reporting date 85 –––
(W4) Noncontrolling interests Pepper ($000)
NCI holding at acquisition (W3) 120NCI% x post acquisition reserves (30% x 450 (W2)) 135 ––––
255 ––––
Noncontrolling interests Salt ($000)
NCI holding at acquisition (W3) 60NCI% x post acquisition reserves (40% x 75 (W2)) 30 –––– NCI at 31 Oct 20X3 90Decrease in NCI (W6) (31.5)NCI% x post acquisition reserves (26% x 25 (W2)) 6.5 ––––
65 ––––
chapter 8
KAPLAN PUBLISHING 333

(W5) Retained earnings
P's reserves 1,145Sub: P% x post acquisition reserves Pepper: 70% x 450 (W2) 315Salt: 60% x 75 (W2) 45Salt: 74% x 25 (W2) 18.5 ––––– 1,523.5 –––––
(W6) Decrease in NCI (control to control adjustment)
Cash paid 50Reduce investmentsDecrease in NCI (14/40 x 90 (W4) (31.5)Reduce W4 –––– Difference to equity decrease 18.5Reduce other reserves ––––
Complex groups
334 KAPLAN PUBLISHING
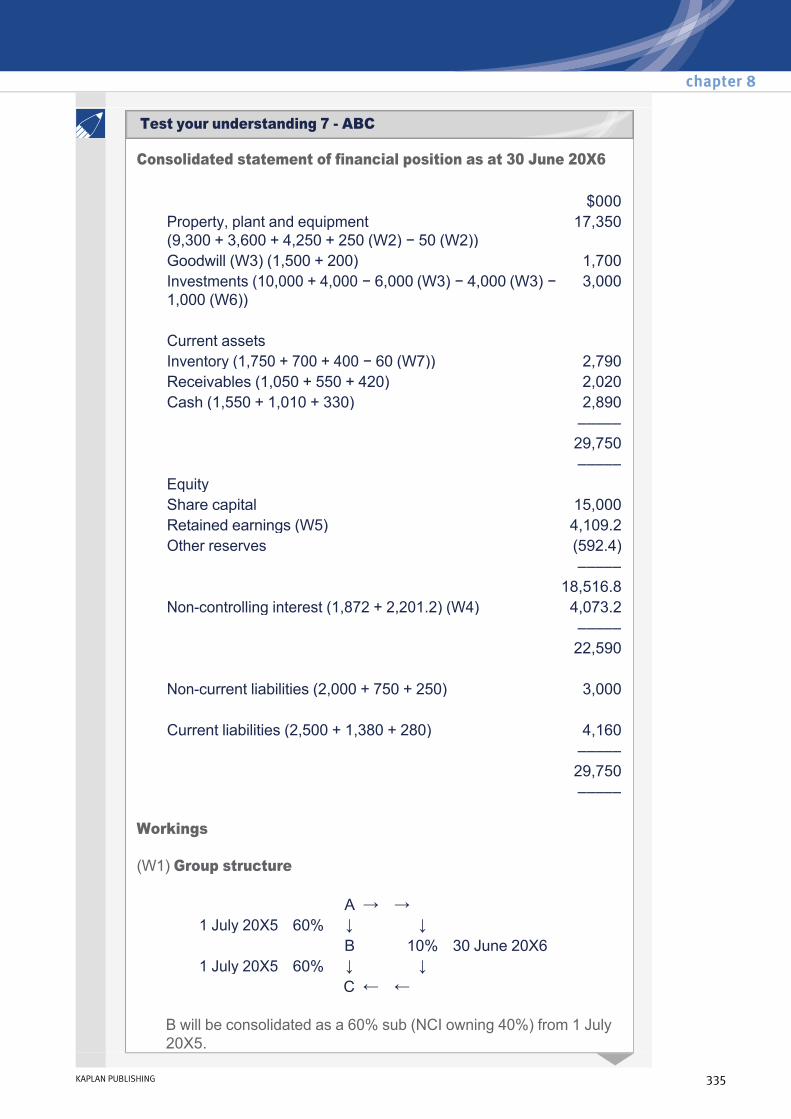
Consolidated statement of financial position as at 30 June 20X6
Workings
(W1) Group structure
B will be consolidated as a 60% sub (NCI owning 40%) from 1 July 20X5.
$000Property, plant and equipment (9,300 + 3,600 + 4,250 + 250 (W2) − 50 (W2))
17,350
Goodwill (W3) (1,500 + 200) 1,700Investments (10,000 + 4,000 − 6,000 (W3) − 4,000 (W3) − 1,000 (W6))
3,000
Current assets Inventory (1,750 + 700 + 400 − 60 (W7)) 2,790Receivables (1,050 + 550 + 420) 2,020Cash (1,550 + 1,010 + 330) 2,890
––––– 29,750 –––––
Equity Share capital 15,000Retained earnings (W5) 4,109.2Other reserves (592.4)
––––– 18,516.8
Noncontrolling interest (1,872 + 2,201.2) (W4) 4,073.2 ––––– 22,590
Noncurrent liabilities (2,000 + 750 + 250) 3,000
Current liabilities (2,500 + 1,380 + 280) 4,160 –––––
29,750 –––––
A → → 1 July 20X5 60% ↓ ↓
B 10% 30 June 20X61 July 20X5 60% ↓ ↓
C ← ←
chapter 8
KAPLAN PUBLISHING 335
Test your understanding 7 ABC
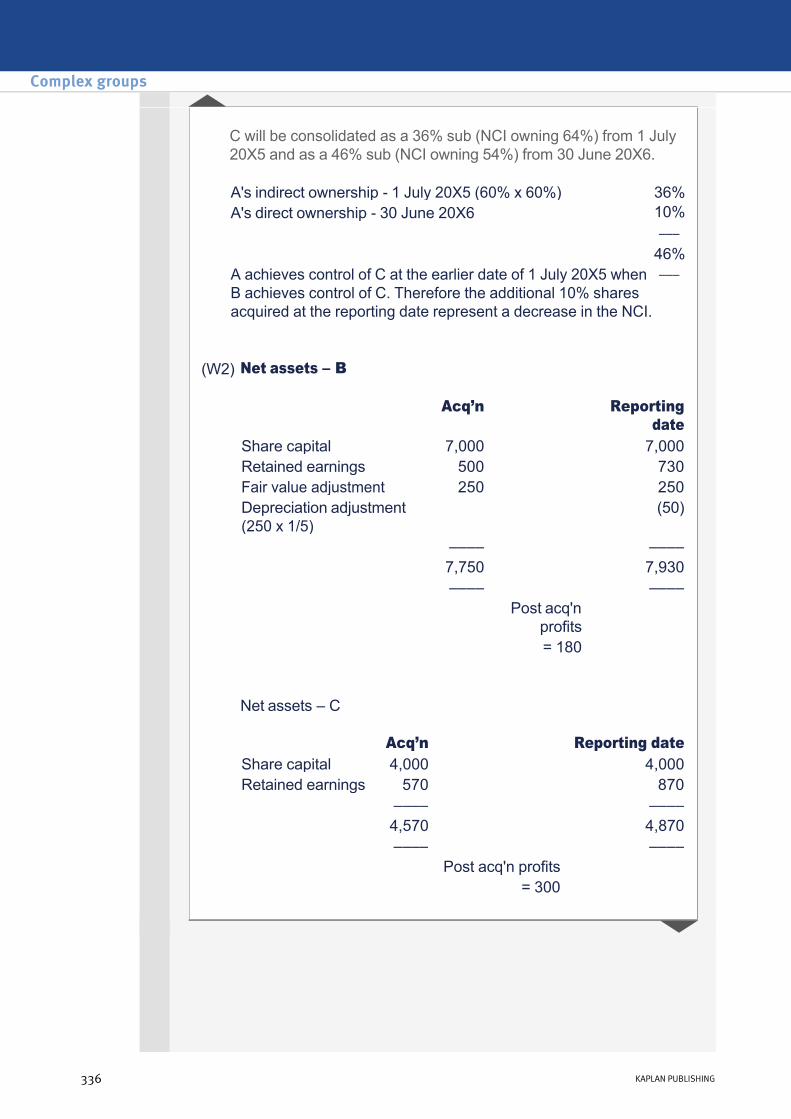
C will be consolidated as a 36% sub (NCI owning 64%) from 1 July 20X5 and as a 46% sub (NCI owning 54%) from 30 June 20X6.
A's indirect ownership 1 July 20X5 (60% x 60%) 36%A's direct ownership 30 June 20X6 10%
–––
46%A achieves control of C at the earlier date of 1 July 20X5 when B achieves control of C. Therefore the additional 10% shares acquired at the reporting date represent a decrease in the NCI.
–––
(W2) Net assets – B
Net assets – C
Acq’n Reporting date
Share capital 7,000 7,000Retained earnings 500 730Fair value adjustment 250 250Depreciation adjustment (250 x 1/5)
(50)
–––– –––– 7,750 7,930 –––– –––– Post acq'n
profits
= 180
Acq’n Reporting date Share capital 4,000 4,000Retained earnings 570 870 –––– –––– 4,570 4,870 –––– –––– Post acq'n profits = 300
Complex groups
336 KAPLAN PUBLISHING
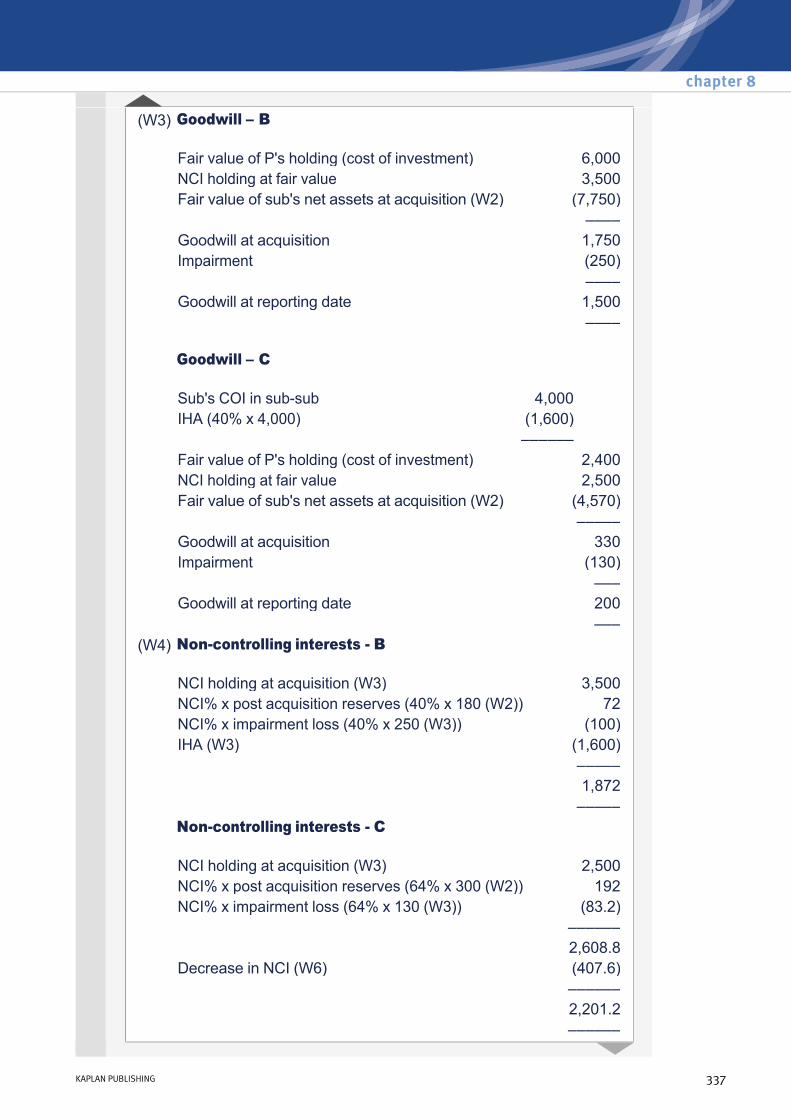
(W3) Goodwill – B
Goodwill – C
Fair value of P's holding (cost of investment) 6,000NCI holding at fair value 3,500Fair value of sub's net assets at acquisition (W2) (7,750) –––– Goodwill at acquisition 1,750Impairment (250) –––– Goodwill at reporting date 1,500 ––––
Sub's COI in subsub 4,000 IHA (40% x 4,000) (1,600) –––––– Fair value of P's holding (cost of investment) 2,400NCI holding at fair value 2,500Fair value of sub's net assets at acquisition (W2) (4,570) ––––– Goodwill at acquisition 330Impairment (130) ––– Goodwill at reporting date 200 –––
(W4) Noncontrolling interests B
NCI holding at acquisition (W3) 3,500NCI% x post acquisition reserves (40% x 180 (W2)) 72NCI% x impairment loss (40% x 250 (W3)) (100)IHA (W3) (1,600) –––––
1,872 –––––
Noncontrolling interests C
NCI holding at acquisition (W3) 2,500NCI% x post acquisition reserves (64% x 300 (W2)) 192NCI% x impairment loss (64% x 130 (W3)) (83.2) –––––– 2,608.8Decrease in NCI (W6) (407.6) ––––––
2,201.2 ––––––
chapter 8
KAPLAN PUBLISHING 337
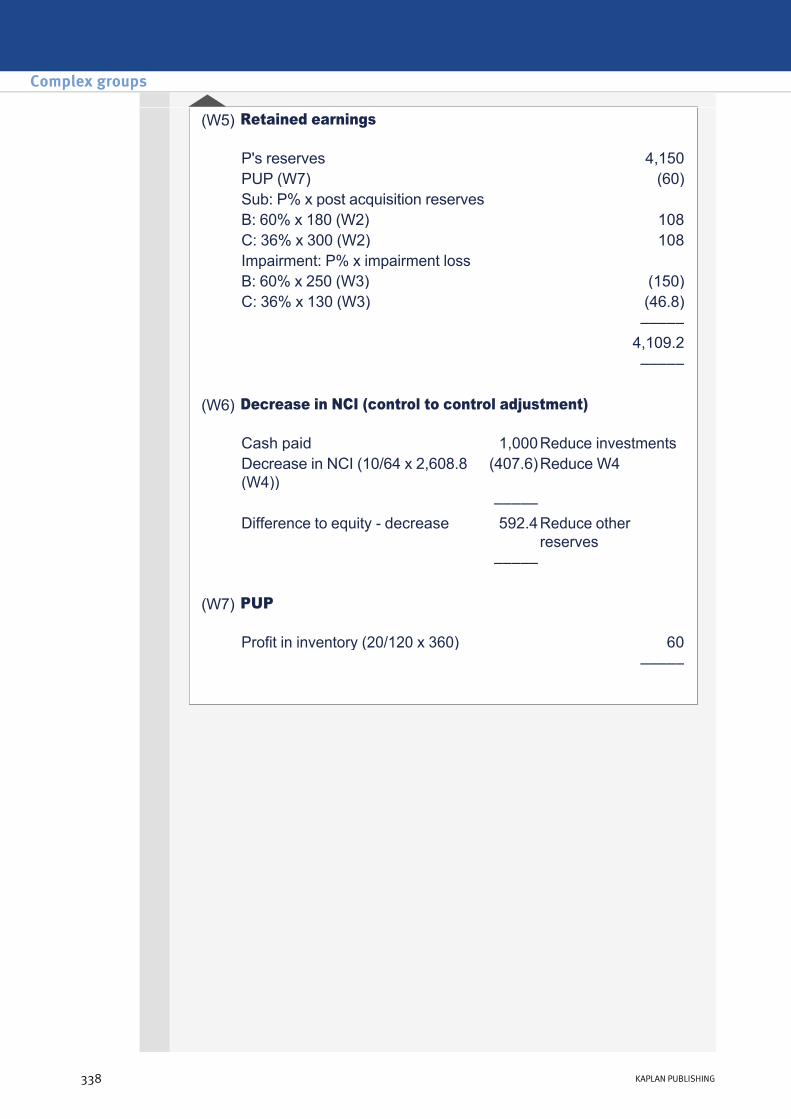
(W5) Retained earnings
P's reserves 4,150PUP (W7) (60)Sub: P% x post acquisition reserves B: 60% x 180 (W2) 108C: 36% x 300 (W2) 108Impairment: P% x impairment loss B: 60% x 250 (W3) (150)C: 36% x 130 (W3) (46.8) ––––– 4,109.2 –––––
(W6) Decrease in NCI (control to control adjustment)
Cash paid 1,000Reduce investmentsDecrease in NCI (10/64 x 2,608.8 (W4))
(407.6)Reduce W4
––––– Difference to equity decrease 592.4Reduce other
reserves –––––
(W7) PUP
Profit in inventory (20/120 x 360) 60 –––––
Complex groups
338 KAPLAN PUBLISHING

Consolidated statement of comprehensive income for the year ended 30 April 20X6
$000Revenue (408,100 + 240,000 + 170,350 35,000) 783,450Operating costs (180,150 + 105,500 + 74,950 35,000 + 2,000 depn + 8,000 impairment + 1,400 (W7))
(337,000)
Finance costs (12,000 + 6,500 + 2,400) (20,900) –––––––Profit before tax 425,550Tax (65,500 + 38,000 + 27,750) (131,250) –––––––Profit for the year 294,300Other comprehensive income (9,550 + 5,000 + 4,750) 19,300 –––––––Total comprehensive income 313,600 –––––––Profit attributable to: Parent shareholders 251,990NCI shareholders (W6) (18,000 + 24,310) 42,310 ––––––– 294,300
–––––––TCI attributable to: Parent shareholders 268,200NCI shareholders (W6) (19,000 + 26,400) 45,400 ––––––– 313,600 –––––––
chapter 8
KAPLAN PUBLISHING 339
Test your understanding 8 Parsley
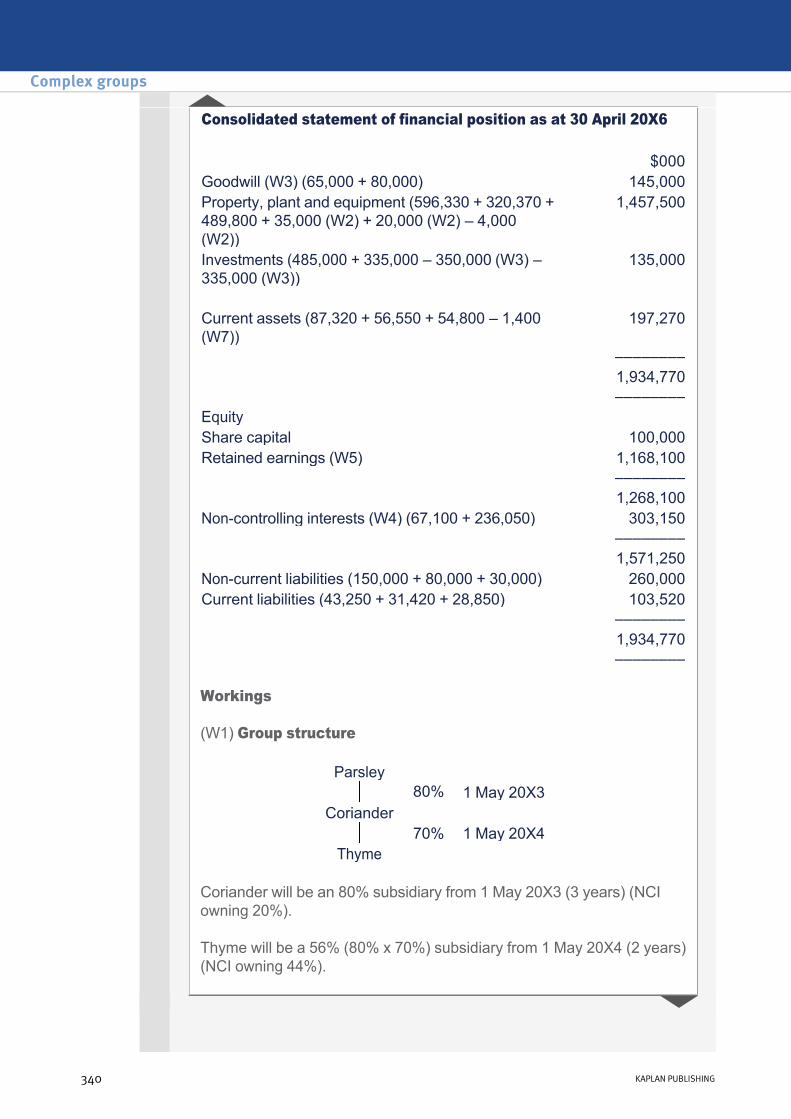
Workings
(W1) Group structure
Coriander will be an 80% subsidiary from 1 May 20X3 (3 years) (NCI owning 20%).
Thyme will be a 56% (80% x 70%) subsidiary from 1 May 20X4 (2 years) (NCI owning 44%).
Consolidated statement of financial position as at 30 April 20X6
$000Goodwill (W3) (65,000 + 80,000) 145,000Property, plant and equipment (596,330 + 320,370 + 489,800 + 35,000 (W2) + 20,000 (W2) – 4,000 (W2))
1,457,500
Investments (485,000 + 335,000 – 350,000 (W3) – 335,000 (W3))
135,000
Current assets (87,320 + 56,550 + 54,800 – 1,400 (W7))
197,270
–––––––– 1,934,770 ––––––––Equity Share capital 100,000Retained earnings (W5) 1,168,100 –––––––– 1,268,100Noncontrolling interests (W4) (67,100 + 236,050) 303,150 –––––––– 1,571,250Noncurrent liabilities (150,000 + 80,000 + 30,000) 260,000Current liabilities (43,250 + 31,420 + 28,850) 103,520 –––––––– 1,934,770 ––––––––
Parsley 80% 1 May 20X3 Coriander 70% 1 May 20X4 Thyme
Complex groups
340 KAPLAN PUBLISHING
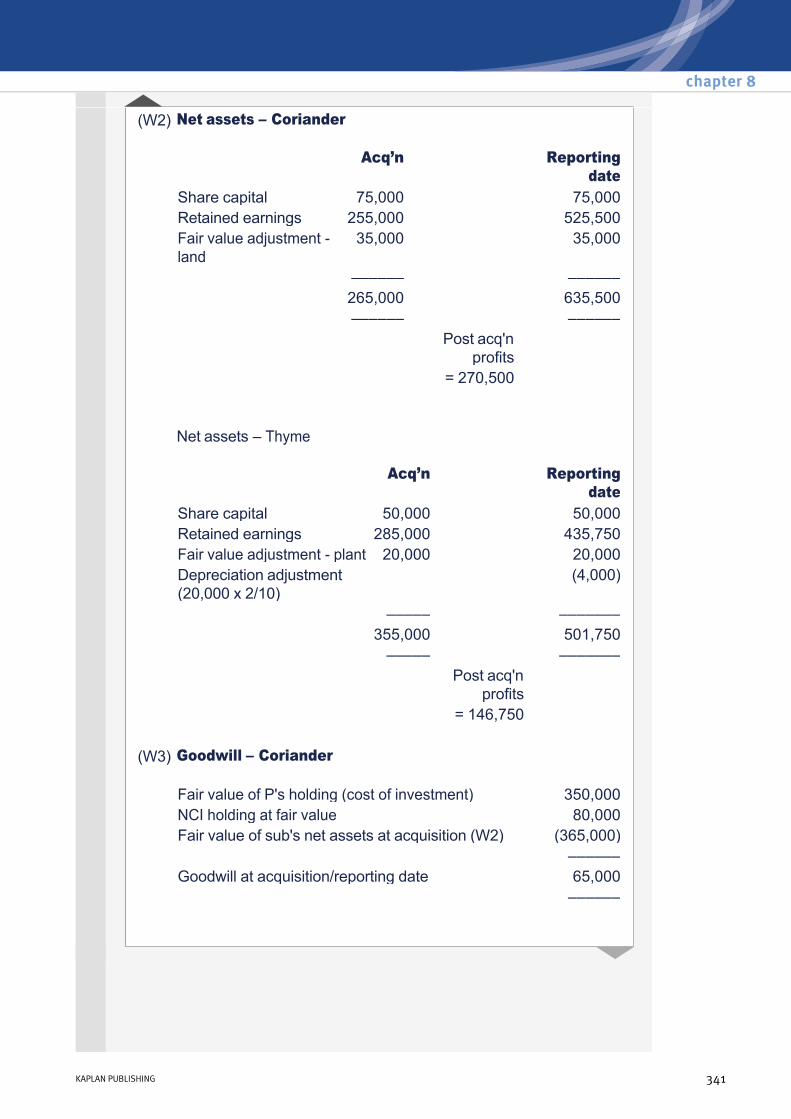
(W2) Net assets – Coriander
Net assets – Thyme
Acq’n Reporting date
Share capital 75,000 75,000Retained earnings 255,000 525,500Fair value adjustment land
35,000 35,000
–––––– –––––– 265,000 635,500 –––––– –––––– Post acq'n
profits
= 270,500
Acq’n Reporting date
Share capital 50,000 50,000Retained earnings 285,000 435,750Fair value adjustment plant 20,000 20,000Depreciation adjustment (20,000 x 2/10)
(4,000)
––––– ––––––– 355,000 501,750 ––––– ––––––– Post acq'n
profits
= 146,750
(W3) Goodwill – Coriander
Fair value of P's holding (cost of investment) 350,000NCI holding at fair value 80,000Fair value of sub's net assets at acquisition (W2) (365,000) –––––– Goodwill at acquisition/reporting date 65,000 ––––––
chapter 8
KAPLAN PUBLISHING 341

Goodwill – Thyme
Sub's COI in subsub 335,000 IHA (20% x 335,000) (67,000) ––––––– Fair value of P's holding (cost of investment) 268,000NCI holding at fair value 175,000Fair value of sub's net assets at acquisition (W2) (355,000) ––––– Goodwill at acquisition 88,000Impairment (8,000) ––––– Goodwill at reporting date 80,000 –––––
(W4) Noncontrolling interests Coriander
NCI holding at acquisition (W3) 80,000NCI% x post acquisition reserves (20% x 270,500 (W2)) 54,100IHA (W3) (67,000) ––––––
67,100 ––––––
Noncontrolling interests Thyme
NCI holding at acquisition (W3) 175,000NCI% x post acquisition reserves (44% x 146,750 (W2))
64,570
NCI% x impairment loss (44% x 8,000 (W3)) (3,520)
236,050 –––––––
–––––––
Complex groups
342 KAPLAN PUBLISHING
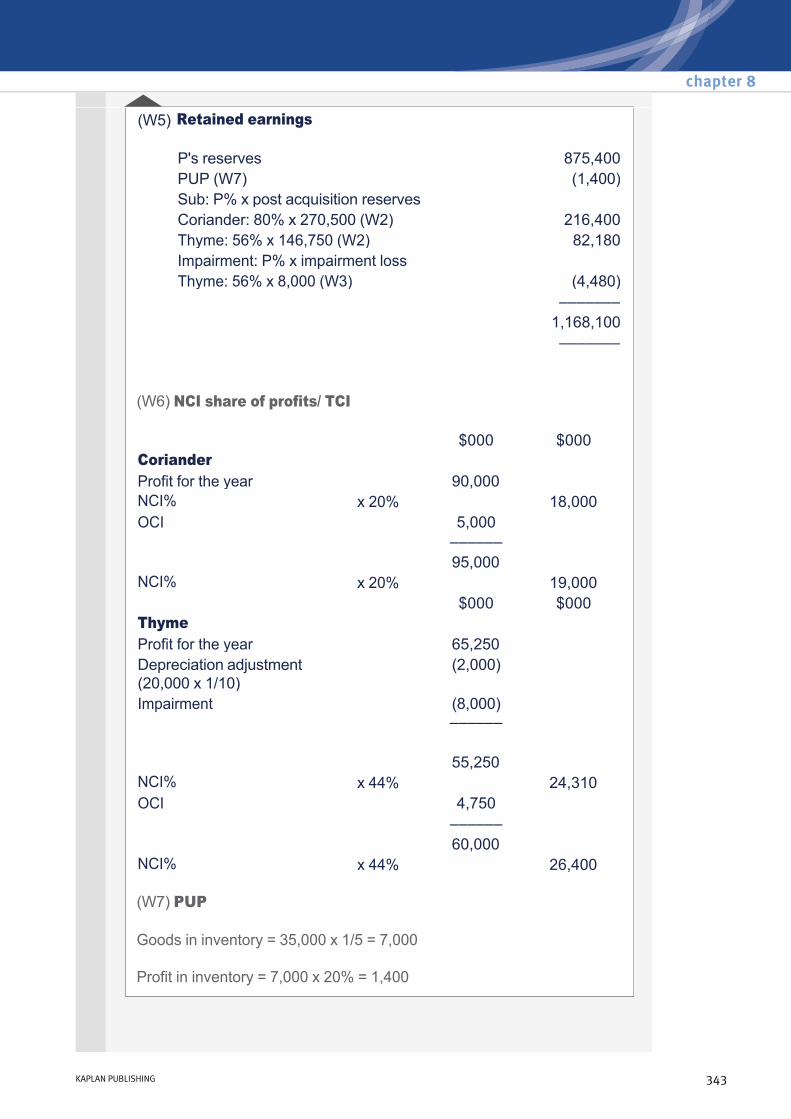
(W6) NCI share of profits/ TCI
(W7) PUP
Goods in inventory = 35,000 x 1/5 = 7,000
Profit in inventory = 7,000 x 20% = 1,400
(W5) Retained earnings
P's reserves 875,400PUP (W7) (1,400)Sub: P% x post acquisition reserves Coriander: 80% x 270,500 (W2) 216,400Thyme: 56% x 146,750 (W2) 82,180Impairment: P% x impairment loss Thyme: 56% x 8,000 (W3) (4,480) ––––––– 1,168,100 –––––––
$000 $000Coriander Profit for the year 90,000 NCI% x 20% 18,000OCI 5,000 –––––– 95,000 NCI% x 20% 19,000 $000 $000Thyme Profit for the year 65,250 Depreciation adjustment (20,000 x 1/10)
(2,000)
Impairment (8,000) ––––––
55,250 NCI% x 44% 24,310OCI 4,750 –––––– 60,000 NCI% x 44% 26,400
chapter 8
KAPLAN PUBLISHING 343

Consolidated statement of comprehensive income for the year ended 30 April 20X3
$mRevenue (120 + 84 + 80) 284Operating costs (83 + 67 + 55 + 5 (W3)) (210)Gain on step acquisition (W7) 2 ––––––Profit before tax 76Tax (12 + 7 + 10) (29) ––––––Profit for the year 47Other comprehensive income (10 + 6 + 0) 16 ––––––Total comprehensive income 63 ––––––Profit attributable to: Parent shareholders 41.95NCI shareholders (W6) (1 + 4.05) 5.05 –––––– 47
––––––Profit attributable to: Parent shareholders 56.75NCI shareholders (W6) (2.2 + 4.05) 6.25 –––––– 63 ––––––
Complex groups
344 KAPLAN PUBLISHING
Test your understanding 9 Hitchcock

Workings
(W1) Group structure
Spencer will be an 80% sub (NCI owning 20%) from 1 May 20X1.
Spooner will be a 73% sub (NCI owning 27%) from 1 May 20X2.
Hitchcock acquires control of Spooner on 1 May 20X2. This is therefore a step acquisition of noncontrol to control.
Consolidated statement of financial position as at 30 April 20X3
$mProperty, plant and equipment (240 + 70 + 102) 412Goodwill (W3) (20 + 29) 49 Current assets (117 + 40 + 58) 215 ––––––– 676 –––––––Equity Share capital 75Retained earnings (W5) 307.95 ––––––– 382.95Noncontrolling interests (W4) 38.05 ––––––– 421Liabilities (100 + 85 + 70) 255 ––––––– 676 –––––––
Hitchcock → → 1 May 20X1 80% ↓ ↓
Spencer 25% 1 May 20X1 1 May 20X2 60% ↓ ↓
Spooner ← ←
Hitchcock's direct ownership 1 May 20X1 25%Hitchcock's indirect ownership 1 May 20X2 (80% × 60%) 48%
–––
73% –––
chapter 8
KAPLAN PUBLISHING 345

(W2) Net assets – Spencer
Net assets – Spooner
Acq’n Reporting date Share capital 30 30Retained earnings 30 60 –––––– –––––– 60 90 –––––– –––––– Post acq'n profits = 30
Acq’n Reporting date Share capital 24 24Retained earnings 51 66 ––– ––– 75 90 ––– ––– Post acq'n profits = 15
(W3) Goodwill – Spencer
Fair value of P's holding (cost of investment) 70NCI holding at fair value 15Fair value of sub's net assets at acquisition (W2) (60) –––– Goodwill at acquisition 25 Impairment (5) –––– Goodwill at reporting date 20 ––––
Complex groups
346 KAPLAN PUBLISHING
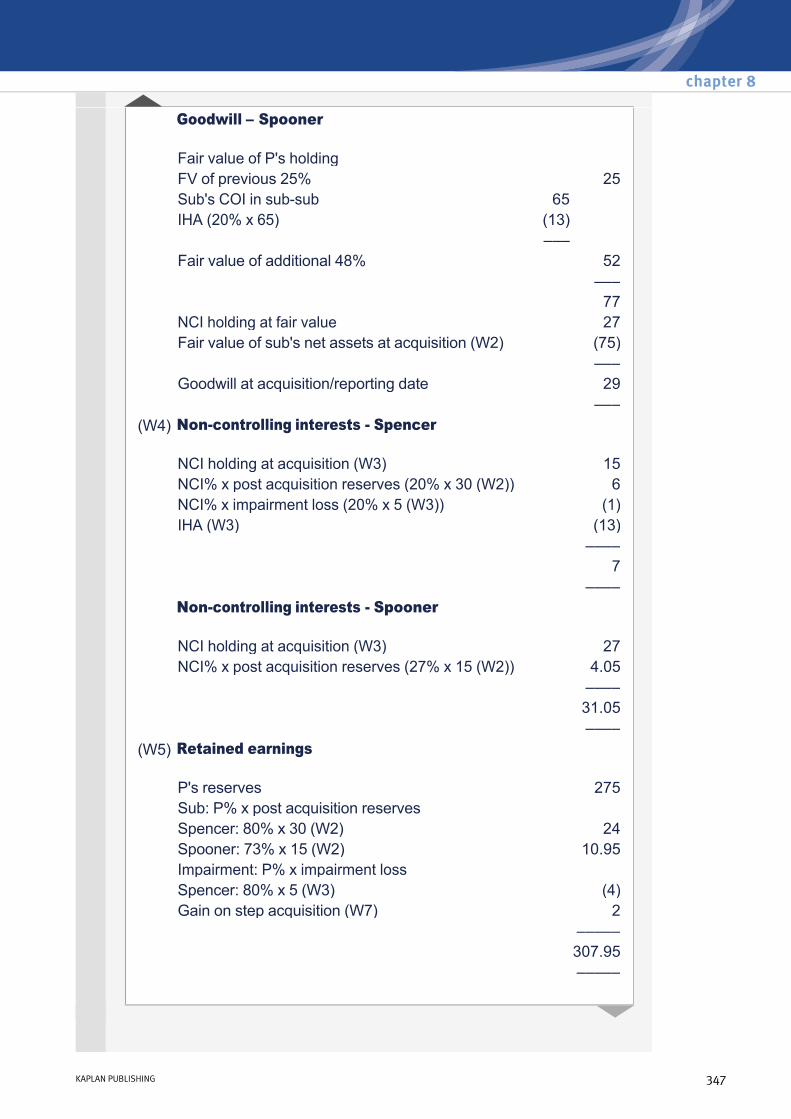
Goodwill – Spooner
Fair value of P's holding FV of previous 25% 25Sub's COI in subsub 65 IHA (20% x 65) (13) ––– Fair value of additional 48% 52 ––– 77NCI holding at fair value 27Fair value of sub's net assets at acquisition (W2) (75) ––– Goodwill at acquisition/reporting date 29 –––
(W4) Noncontrolling interests Spencer
NCI holding at acquisition (W3) 15NCI% x post acquisition reserves (20% x 30 (W2)) 6NCI% x impairment loss (20% x 5 (W3)) (1)IHA (W3) (13) ––––
7 ––––
Noncontrolling interests Spooner
NCI holding at acquisition (W3) 27NCI% x post acquisition reserves (27% x 15 (W2)) 4.05 ––––
31.05 ––––
(W5) Retained earnings
P's reserves 275Sub: P% x post acquisition reserves Spencer: 80% x 30 (W2) 24Spooner: 73% x 15 (W2) 10.95Impairment: P% x impairment loss Spencer: 80% x 5 (W3) (4)Gain on step acquisition (W7) 2 ––––– 307.95 –––––
chapter 8
KAPLAN PUBLISHING 347
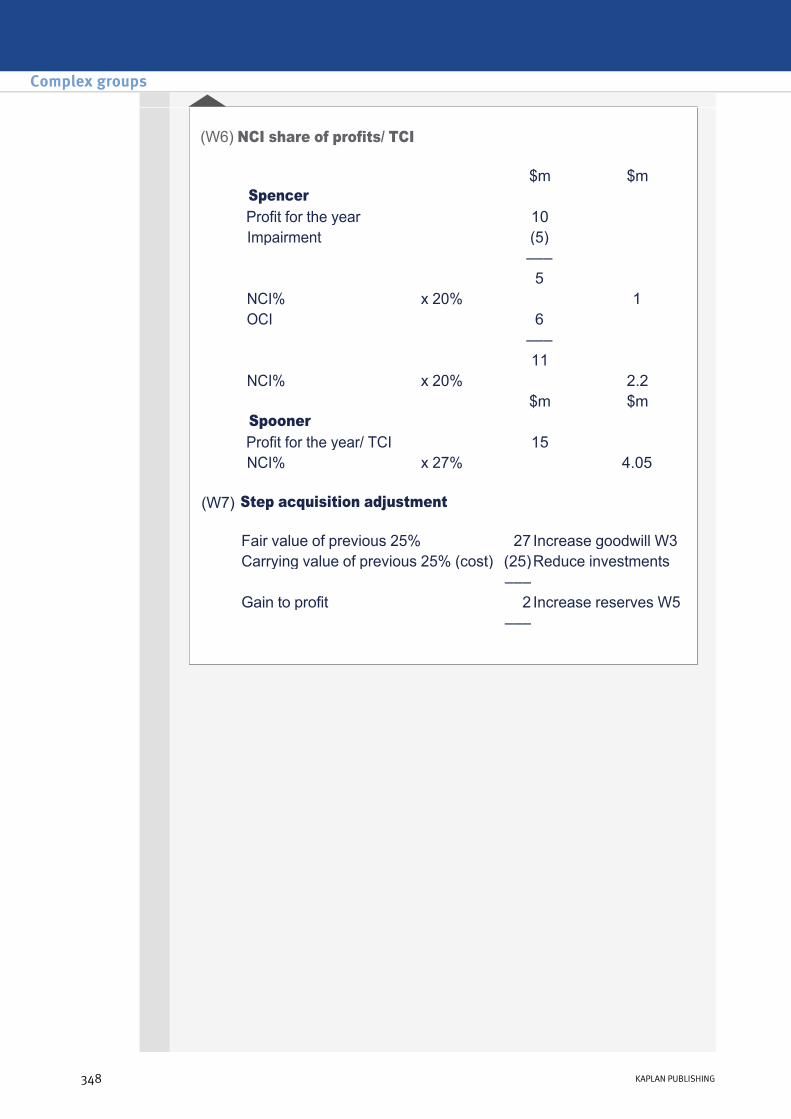
(W6) NCI share of profits/ TCI
$m $m Spencer Profit for the year 10 Impairment (5)
––– 5
NCI% x 20% 1 OCI 6
––– 11
NCI% x 20% 2.2 $m $m
Spooner Profit for the year/ TCI 15 NCI% x 27% 4.05
(W7) Step acquisition adjustment
Fair value of previous 25% 27 Increase goodwill W3Carrying value of previous 25% (cost) (25)Reduce investments ––– Gain to profit 2 Increase reserves W5 –––
Complex groups
348 KAPLAN PUBLISHING
Foreign currency translationChapter learning objectives
On completion of their studies students should be able to:
• Explain foreign currency translation principles, including the difference between the closing rate/net investment method and the historical rate method;
• Apply foreign currency translation to overseas transactions and investments in overseas subsidiaries.
349
chapter
9
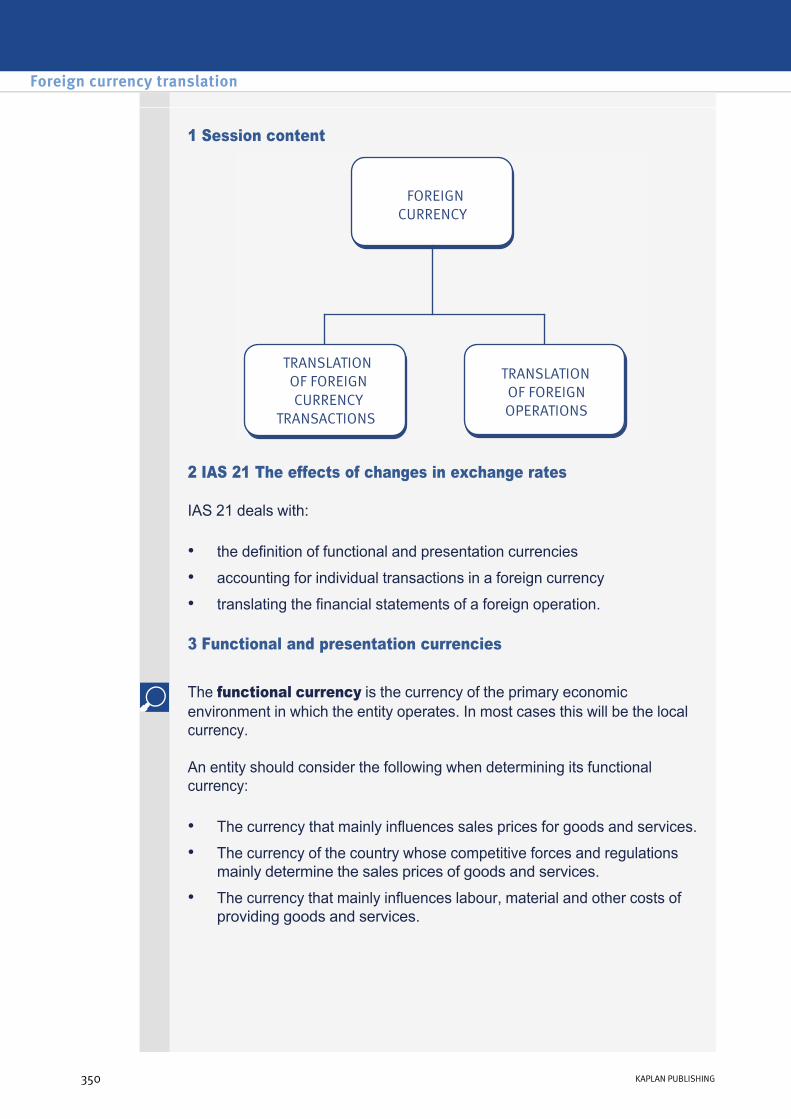
1 Session content
2 IAS 21 The effects of changes in exchange rates
IAS 21 deals with:
• the definition of functional and presentation currencies
• accounting for individual transactions in a foreign currency
• translating the financial statements of a foreign operation.
3 Functional and presentation currencies
The functional currency is the currency of the primary economic environment in which the entity operates. In most cases this will be the local currency.
An entity should consider the following when determining its functional currency:
• The currency that mainly influences sales prices for goods and services.
• The currency of the country whose competitive forces and regulations mainly determine the sales prices of goods and services.
• The currency that mainly influences labour, material and other costs of providing goods and services.
Foreign currency translation
350 KAPLAN PUBLISHING350 KAPLAN PUBLISHING
The following factors may also be considered:
The entity maintains its daytoday financial records in its functional currency.
• The currency in which funding from issuing debt and equity is generated.
• The currency in which receipts from operating activities are usually retained.
The presentation currency is the currency in which the entity presents its financial statements. This can be different from the functional currency, particularly if the entity in question is a foreign owned subsidiary. It may have to present its financial statements in the currency of its parent, even though that is different to its own functional currency.
4 Translation of foreign currency transactions
Where an entity enters into a transaction denominated in a currency other than its functional currency, that transaction must be translated into the functional currency before it is recorded.
Initial recognition
Subsequent measurement – settled transactions
When cash settlement occurs, for example payment by a receivable, the settled amount should be translated using the spot exchange rate on the settlement date.
If this amount differs from that used when the transaction occurred, there will be an exchange difference which is taken to the income statement in the period in which it arises.
• The transaction will initially be recorded by applying the spot exchange rate, i.e. the exchange rate at the date of the transaction.
chapter 9
KAPLAN PUBLISHING 351
Example 1 answer
Examples of foreign currency transactions
Example 1
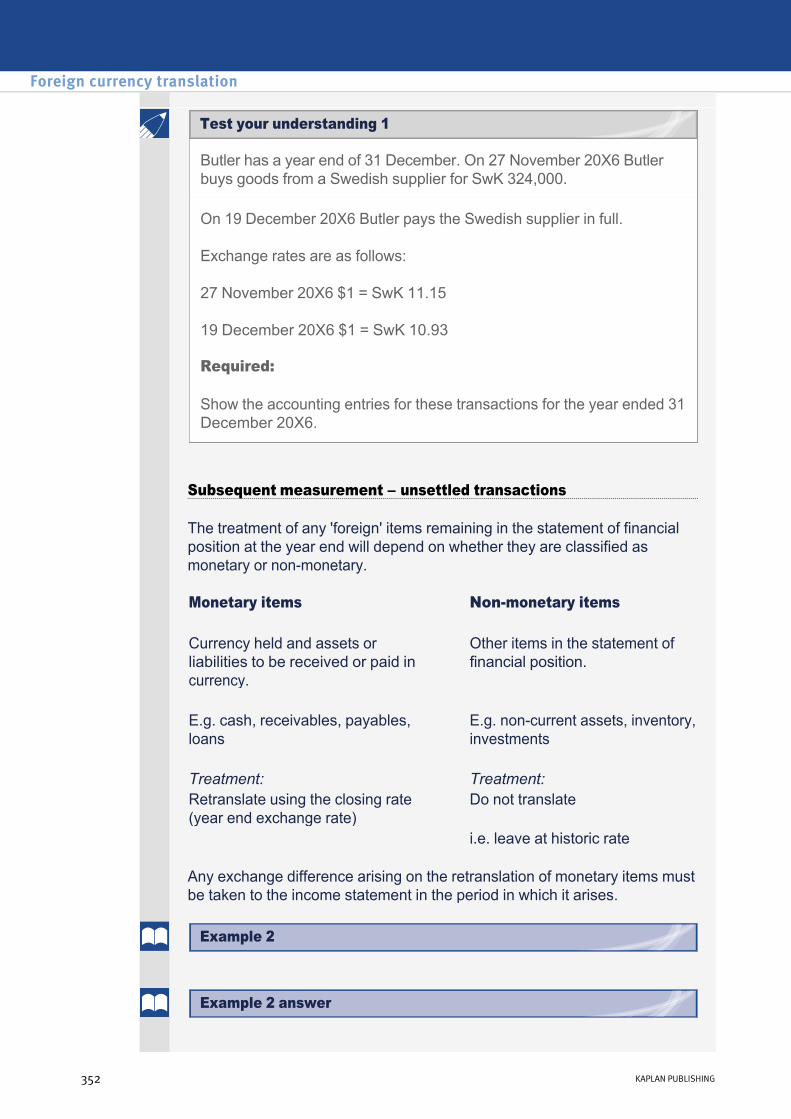
Butler has a year end of 31 December. On 27 November 20X6 Butler buys goods from a Swedish supplier for SwK 324,000.
On 19 December 20X6 Butler pays the Swedish supplier in full.
Exchange rates are as follows:
27 November 20X6 $1 = SwK 11.15
19 December 20X6 $1 = SwK 10.93
Required:
Show the accounting entries for these transactions for the year ended 31 December 20X6.
Subsequent measurement – unsettled transactions
The treatment of any 'foreign' items remaining in the statement of financial position at the year end will depend on whether they are classified as monetary or nonmonetary.
Any exchange difference arising on the retranslation of monetary items must be taken to the income statement in the period in which it arises.
Monetary items Nonmonetary items Currency held and assets or liabilities to be received or paid in currency.
Other items in the statement of financial position.
E.g. cash, receivables, payables, loans
E.g. noncurrent assets, inventory, investments
Treatment: Treatment: Retranslate using the closing rate (year end exchange rate)
Do not translate
i.e. leave at historic rate
Foreign currency translation
352 KAPLAN PUBLISHING
Example 2 answer
Test your understanding 1
Example 2
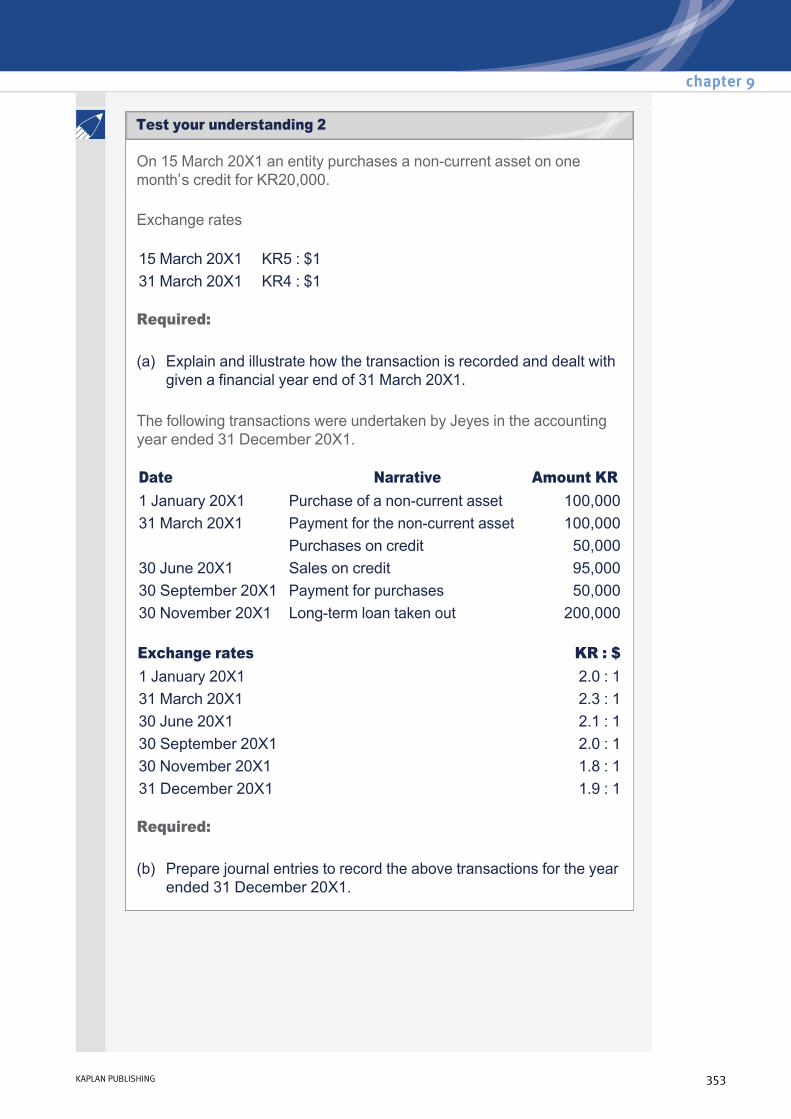
On 15 March 20X1 an entity purchases a noncurrent asset on one month’s credit for KR20,000.
Exchange rates
Required:
The following transactions were undertaken by Jeyes in the accounting year ended 31 December 20X1.
Required:
15 March 20X1 KR5 : $131 March 20X1 KR4 : $1
(a) Explain and illustrate how the transaction is recorded and dealt with given a financial year end of 31 March 20X1.
Date Narrative Amount KR 1 January 20X1 Purchase of a noncurrent asset 100,00031 March 20X1 Payment for the noncurrent asset 100,000
Purchases on credit 50,00030 June 20X1 Sales on credit 95,00030 September 20X1 Payment for purchases 50,00030 November 20X1 Longterm loan taken out 200,000 Exchange rates
KR : $
1 January 20X1 2.0 : 131 March 20X1 2.3 : 130 June 20X1 2.1 : 130 September 20X1 2.0 : 130 November 20X1 1.8 : 131 December 20X1 1.9 : 1
(b) Prepare journal entries to record the above transactions for the year ended 31 December 20X1.
chapter 9
KAPLAN PUBLISHING 353
Test your understanding 2
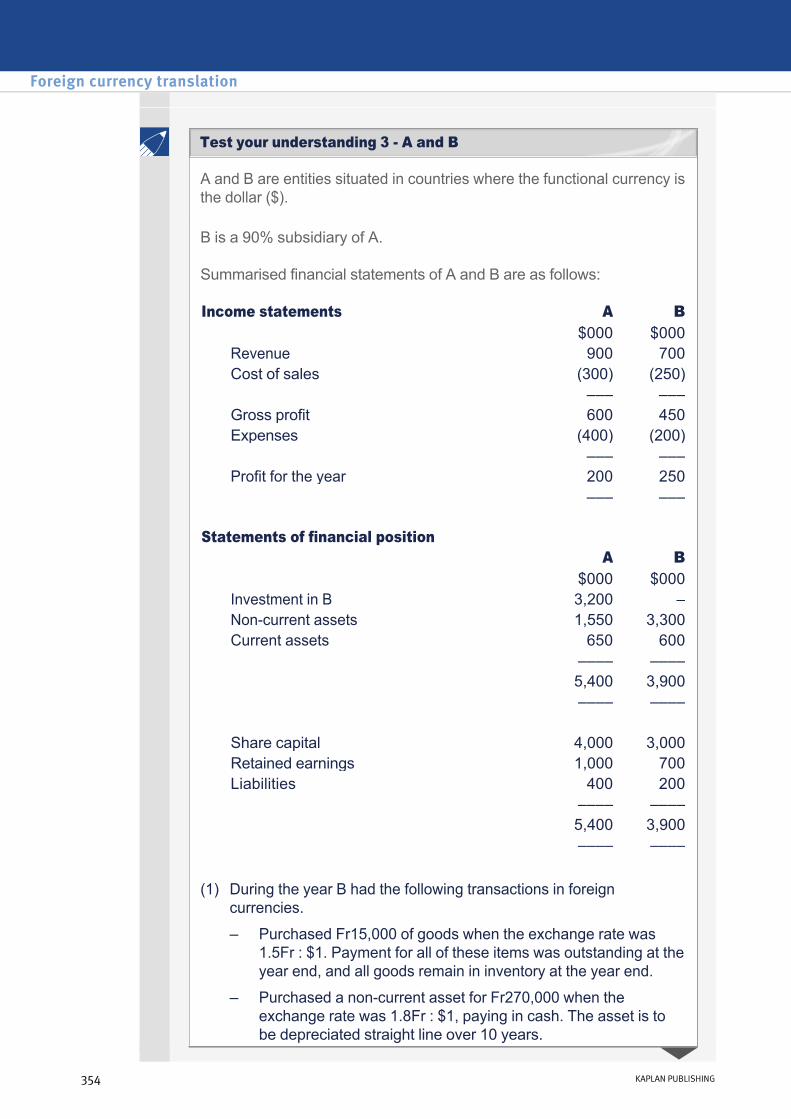
A and B are entities situated in countries where the functional currency is the dollar ($).
B is a 90% subsidiary of A.
Summarised financial statements of A and B are as follows:
Income statements A B $000 $000
Revenue 900 700Cost of sales (300) (250)
––– ––– Gross profit 600 450Expenses (400) (200)
––– ––– Profit for the year 200 250
––– ––– Statements of financial position
A B $000 $000
Investment in B 3,200 – Noncurrent assets 1,550 3,300Current assets 650 600
–––– –––– 5,400 3,900 –––– ––––
Share capital 4,000 3,000Retained earnings 1,000 700Liabilities 400 200
–––– –––– 5,400 3,900 –––– ––––
(1) During the year B had the following transactions in foreign
currencies.
– Purchased Fr15,000 of goods when the exchange rate was 1.5Fr : $1. Payment for all of these items was outstanding at the year end, and all goods remain in inventory at the year end.
– Purchased a noncurrent asset for Fr270,000 when the exchange rate was 1.8Fr : $1, paying in cash. The asset is to be depreciated straight line over 10 years.
Foreign currency translation
354 KAPLAN PUBLISHING
Test your understanding 3 A and B
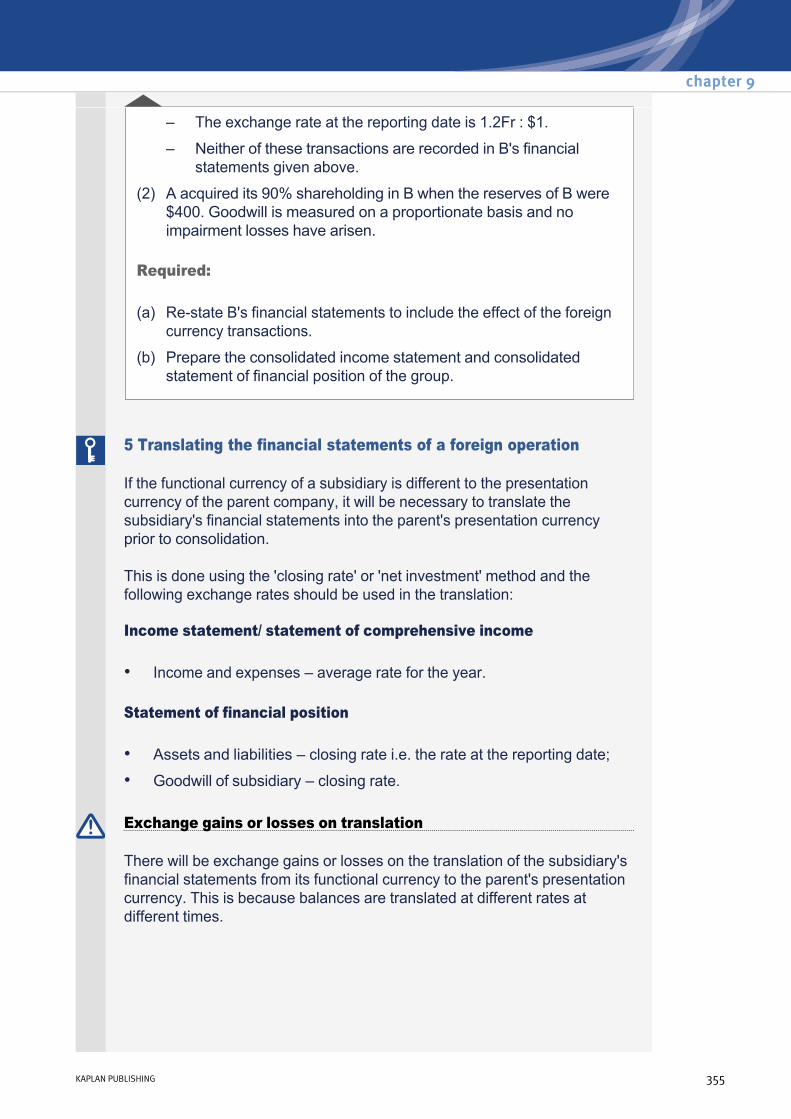
Required:
– The exchange rate at the reporting date is 1.2Fr : $1.
– Neither of these transactions are recorded in B's financial statements given above.
(2) A acquired its 90% shareholding in B when the reserves of B were $400. Goodwill is measured on a proportionate basis and no impairment losses have arisen.
(a) Restate B's financial statements to include the effect of the foreign currency transactions.
(b) Prepare the consolidated income statement and consolidated statement of financial position of the group.
5 Translating the financial statements of a foreign operation
If the functional currency of a subsidiary is different to the presentation currency of the parent company, it will be necessary to translate the subsidiary's financial statements into the parent's presentation currency prior to consolidation.
This is done using the 'closing rate' or 'net investment' method and the following exchange rates should be used in the translation:
Income statement/ statement of comprehensive income
Statement of financial position
• Income and expenses – average rate for the year.
• Assets and liabilities – closing rate i.e. the rate at the reporting date;
• Goodwill of subsidiary – closing rate.
Exchange gains or losses on translation
There will be exchange gains or losses on the translation of the subsidiary's financial statements from its functional currency to the parent's presentation currency. This is because balances are translated at different rates at different times.
chapter 9
KAPLAN PUBLISHING 355
For example, an asset such as land in last year’s statement of financial position was translated at last year's closing rate, i.e. this year's opening rate. However, the same asset in this year’s statement of financial position will be translated at this year’s closing rate. An exchange gain or loss therefore arises. This principle would continue to all of the subsidiary’s net assets in last year’s statement of financial position, i.e. this year’s opening net assets. Further discussion of the other exchange gains or losses arising is below.
The foreign exchange gains/losses arising are recorded in equity. They are unrealised gains/losses which will only become realised at the date that the subsidiary is disposed.
Most of the exchange gains/losses are captured automatically by following the standard workings and the approach outlined above. If preparing a consolidated statement of financial position however, it will be necessary to calculate the exchange gain/loss arising on the cost of the investment in W3 and carry this through to W5.
Exchange differences generated in the current year only will need reporting in the other comprehensive section of the consolidated statement of comprehensive income (CSCI). This is because they are gains/losses that have been recorded directly within equity. You will therefore need to be familiar with the full calculation of exchange gains/losses for the year for the purposes of a CSCI question or if you are asked to prepare a consolidated statement of changes in equity.
Foreign exchange gains/losses included within other comprehensive income
A question may require you to produce a consolidated statement of comprehensive income or consolidated statement of changes in equity and to therefore show the foreign exchange gain/ loss arising during the year.
The exchange gain/loss will be made up of:
In order to calculate the exchange differences for the year, calculate the following:
Opening net assets Opening rate v Closing rate
Profit for the year Average rate v. Closing rate
Opening goodwill Opening rate v Closing rate
Foreign currency translation
356 KAPLAN PUBLISHING
Exchange differences in reserves
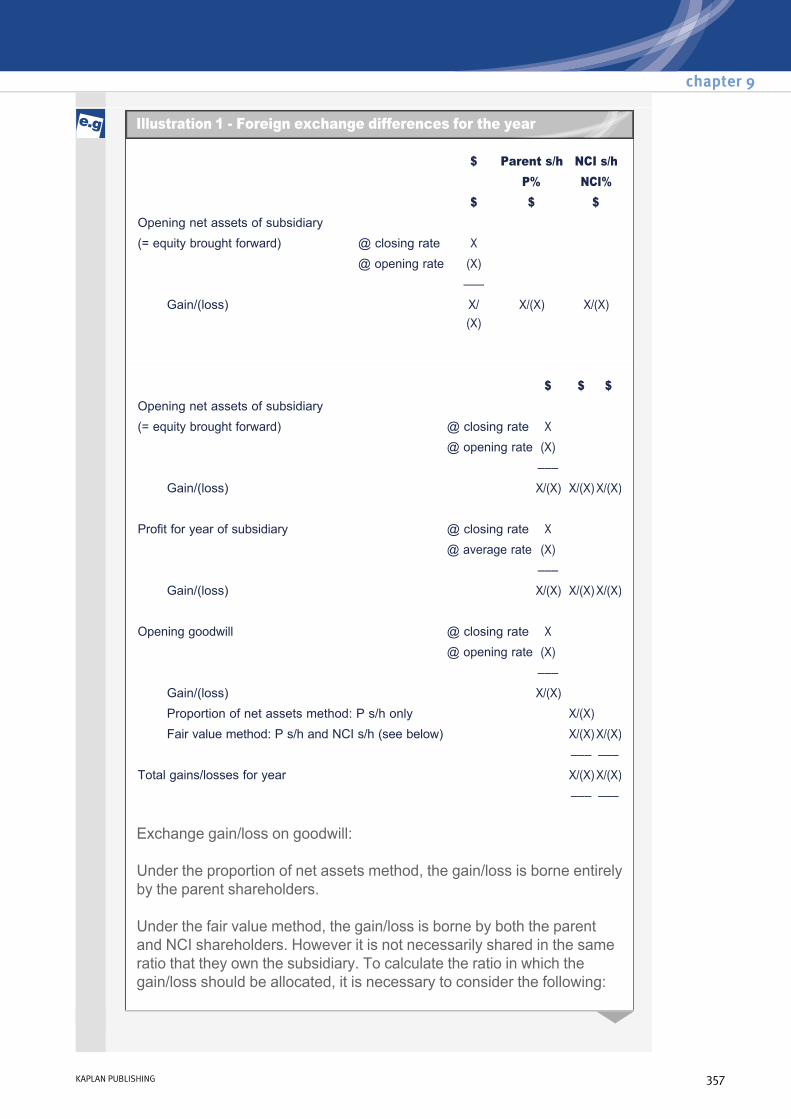
$ Parent s/h NCI s/h P% NCI% $ $ $ Opening net assets of subsidiary (= equity brought forward) @ closing rate X @ opening rate (X) –––
Gain/(loss) X/ (X)
X/(X) X/(X)
Exchange gain/loss on goodwill:
Under the proportion of net assets method, the gain/loss is borne entirely by the parent shareholders.
Under the fair value method, the gain/loss is borne by both the parent and NCI shareholders. However it is not necessarily shared in the same ratio that they own the subsidiary. To calculate the ratio in which the gain/loss should be allocated, it is necessary to consider the following:
$ $ $ Opening net assets of subsidiary (= equity brought forward) @ closing rate X @ opening rate (X) –––
Gain/(loss) X/(X) X/(X) X/(X)
Profit for year of subsidiary @ closing rate X @ average rate (X) –––
Gain/(loss) X/(X) X/(X) X/(X)
Opening goodwill @ closing rate X @ opening rate (X) –––
Gain/(loss) X/(X) Proportion of net assets method: P s/h only X/(X) Fair value method: P s/h and NCI s/h (see below) X/(X) X/(X)
––– ––– Total gains/losses for year X/(X) X/(X)
––– –––
chapter 9
KAPLAN PUBLISHING 357
Illustration 1 Foreign exchange differences for the year

Difference between FV method and proportionate method of goodwill:
NCI at acquisition at fair value XNCI at acquisition at proportion of net assets (X) –– NCI s/h element of goodwill XParent s/h element of goodwill (balance) X –– Total goodwill at acquisition X ––
6 Approach to a question
In a question it is recommended that you take the following approach:
Consolidated income statement (down to profit for the year)
Consolidated statement of financial position (CSFP)
(1) Translate the subsidiary's income and expenses at the average rate for the year.
(2) Record any adjustments translated at the average rate, e.g. impairments, PUPs, fair value adjustments.
(3) Add across the parent and subsidiary's figures in dollars to calculate the consolidated totals.
(4) Calculate profit for the year attributable to NCI in the same way as usual, i.e. NCI% multiplied by the subsidiary's translated and adjusted profit for the year.
(1) Prepare W1 Group structure.
(2) Translate the subsidiary's assets and liabilities on the face of the CSFP, e.g. Current assets (P + (S translated at closing rate) + (fair value adjustments at closing rate)).
(3) Add the parent's share capital only.
(4) Prepare W2 Net assets of the subsidiary in the subsidiary's functional currency, reflecting any fair value adjustments or PUPs is the subsidiary is the seller.
(5) Prepare W3 Goodwill in the functional currency and then translate to dollars using the closing rate. Also calculate the exchange gain or loss on the cost of investment as the difference between the cost of investment at the acquisition rate compared to the cost of investment at the closing rate. This exchange difference is taken to W5.
Foreign currency translation
358 KAPLAN PUBLISHING

Foreign exchange gains/losses (other comprehensive income)
Consolidated statement of changes in equity
(6) Prepare W4 Noncontrolling interests in the functional currency and then translate to dollars at the closing rate.
(7) Prepare W5 Retained earnings in the presentation currency (dollars) as follows:
$Parent retained earnings XShare of subsidiary's post acquisition profits (P's % x ((net assets at reporting date (W2) – net assets at acquisition (W2)) translated at closing rate))
X
Less: impairments (translated at closing rate) (X)Exchange gain/loss on cost of investment (W3) X/(X)
––– X –––
(1) Use the proforma above to calculate the exchange gains/losses for the year and split them between parent and NCI shareholders accordingly.
(2) The total exchange gain/loss arising will be reported in “other comprehensive income”.
(3) Total comprehensive income is then split as being attributable to parent shareholders and NCI shareholders. The amount attributable to NCI shareholders will be the profit for the year attributable to the NCI (already calculated) plus/minus the NCI share of the total exchange gain/loss. Total comprehensive income attributable to parent shareholders can be calculated as a balancing figure.
(1) Add the comprehensive income from the statement of comprehensive income split between parent and NCI shareholders.
(2) Deduct any dividends paid by the parent and the NCI share of any subsidiary dividends.
(3) Prepare a working in the subsidiary's functional currency for its net assets at the brought forward date, i.e. similar to CSFP W2 but at the prior reporting date.
(4) Calculate NCI brought forward in a similar way to CSFP W4, i.e. in the functional currency and then translating at the opening rate.
(5) Calculate equity attributable to parent shareholders brought forward in a similar way to CSFP W5 adding the parent's share capital. Remember to translate the subsidiary's post acquisition profits (up to the brought forward date) at the opening rate. You will need to recalculate the foreign exchange gain/loss on the cost of investment by comparing it at the acquisition rate to the opening rate.
chapter 9
KAPLAN PUBLISHING 359
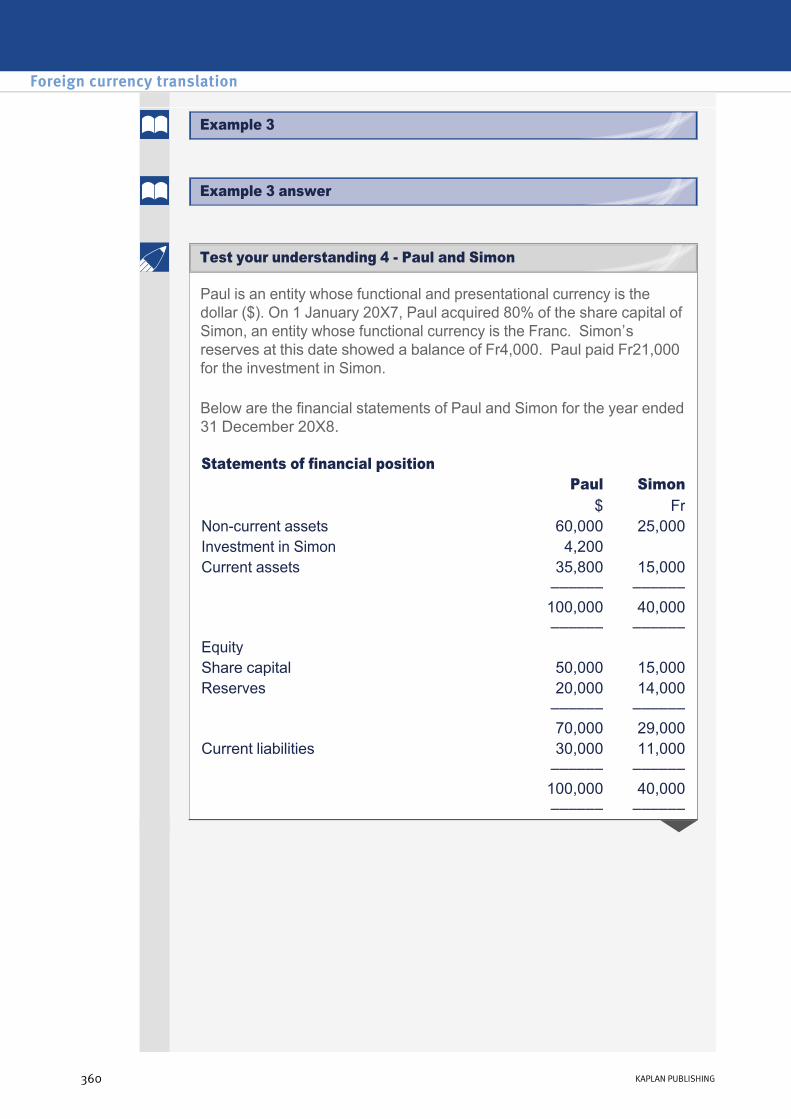
Paul is an entity whose functional and presentational currency is the dollar ($). On 1 January 20X7, Paul acquired 80% of the share capital of Simon, an entity whose functional currency is the Franc. Simon’s reserves at this date showed a balance of Fr4,000. Paul paid Fr21,000 for the investment in Simon.
Below are the financial statements of Paul and Simon for the year ended 31 December 20X8.
Statements of financial position Paul Simon $ FrNoncurrent assets 60,000 25,000Investment in Simon 4,200 Current assets 35,800 15,000 –––––– –––––– 100,000 40,000 –––––– ––––––Equity Share capital 50,000 15,000Reserves 20,000 14,000 –––––– –––––– 70,000 29,000Current liabilities 30,000 11,000 –––––– –––––– 100,000 40,000 –––––– ––––––
Foreign currency translation
360 KAPLAN PUBLISHING
Example 3 answer
Example 3
Test your understanding 4 Paul and Simon

It is Paul’s policy to apply the gross goodwill method. As at 1 January 20X7, the fair value of the noncontrolling interest in Simon was deemed to be Fr4,500. Goodwill had been reviewed for impairment as at 31 December 20X7 but none had arisen. As at 31 December 20X8, it was determined that goodwill should be impaired by Fr1,000.
Statements of comprehensive income Paul Simon $ FrRevenue 25,000 10,000Operating expenses (10,000) (4,000) –––––– ––––––Operating profit 15,000 6,000Finance costs (5,000) (1,500) –––––– ––––––Profit before tax 10,000 4,500Tax (3,000) (1,000) –––––– ––––––Profit for the year 7,000 3,500Other comprehensive income – – –––––– –––––– Total comprehensive income 7,000 3,500 –––––– –––––– Statements of changes in equity Paul Simon $ FrEquity brought forward 64,000 25,500Comprehensive income 7,000 3,500Dividends paid (1,000) – –––––– ––––––Equity carried forward 70,000 29,000 –––––– –––––– Exchanges rates have been as follows: Fr: $11 January 20X7 531 December 20X7 331 December 20X8 2Average for the year ended 31 December 20X8 2.5
chapter 9
KAPLAN PUBLISHING 361

Required:
Prepare the consolidated statement of financial position, consolidated statement of comprehensive income and consolidated statement of changes in equity for the year ended 31 December 20X8.
North is an entity incorporated in Asia. North has a subsidiary, South, that is located in Africa and prepares its financial statements under local accounting standards. South prepares its financial statements in African Francs (Afr). Financial information relating to the two entities for the financial year ended 30 September 20X4 is given below:
Statements of financial position at 30 September 20X4
North South $m $m Afrm Afrm
Noncurrent assets Property, plant and equipment 107 164
Investments (Note 1) 60 −
––– ––– 167 164Current assets
Inventories (Note 2) 70 50 Receivables 65 60 Cash and bank balances 25 12
––– ––– 160 122 ––– ––– 327 286 ––– ––– Equity
Share capital ($1/Afr1 shares) 100 60 Retained earnings 127 89
––– ––– 227 149Noncurrent liabilities 65 72Current liabilities 35 65 –––– –––– 327 286 –––– –––
Foreign currency translation
362 KAPLAN PUBLISHING
Test your understanding 5 North

Statements of changes in equity for the year ended 30 September 20X4
Notes to the financial statements
Statements of comprehensive income for the year ended 30 September 20X4 North South
$m AfrmRevenue 200 240Cost of sales (120) (145) ––– ––– Gross profit 80 95Other operating expenses (35) (40) ––– ––– Profit from operations 45 55Intragroup investment income 4.5 −Finance cost (7.5) (10) ––– ––– Profit before tax 42 45Income tax expense (10) (15) ––– ––– Profit for the year 32 30Other comprehensive income – – ––– ––– Total comprehensive income 32 30 ––– –––
North South $m Afrm
Balance at 1 October 20X3 211 134Comprehensive income 32 30Dividends paid (16) (15) ––– ––– Balance at 30 September 20X4 227 149
––– –––
Note 1 On 1 October 20X1, when the retained earnings of South showed a credit balance of Afr38 million, North purchased 45 million shares in South for Afr4.00 each. At this date a noncurrent asset in the books of South with a carrying value of Afr50 million was deemed to have a fair value of Afr80 million. This asset had a remaining life of 10 years at this time and depreciation is charged to cost of sales. North uses the proportionate goodwill method.
chapter 9
KAPLAN PUBLISHING 363
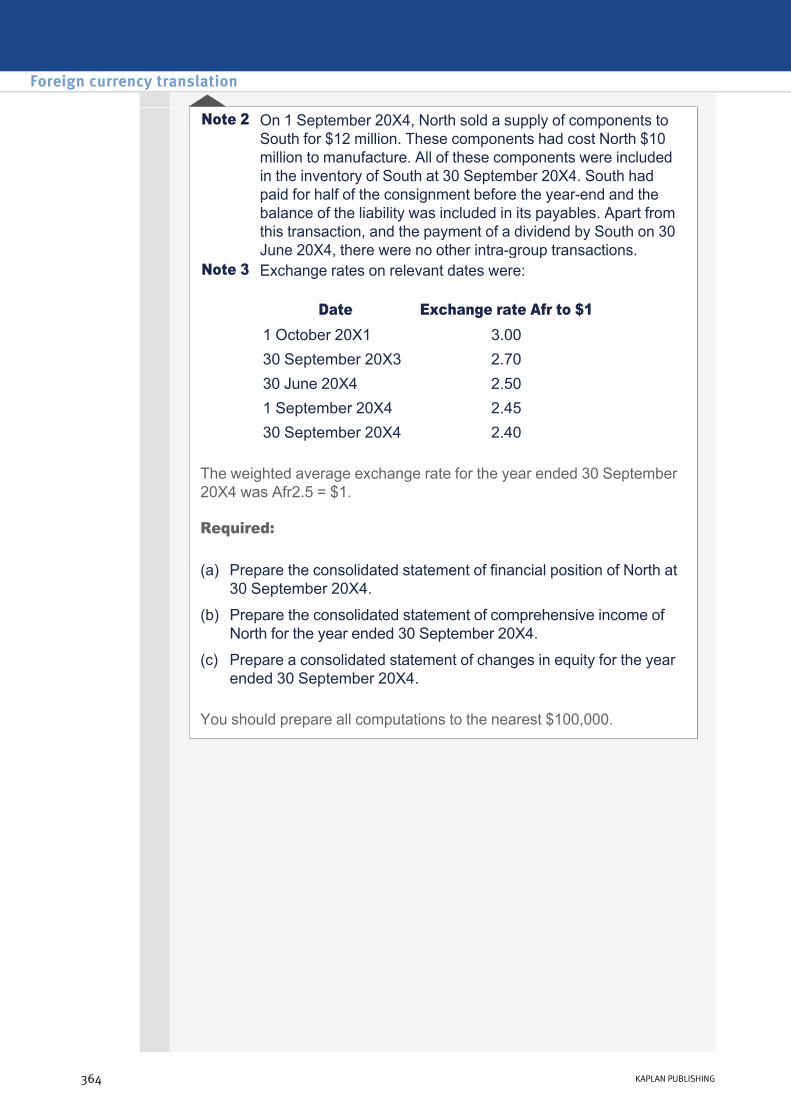
The weighted average exchange rate for the year ended 30 September 20X4 was Afr2.5 = $1.
Required:
You should prepare all computations to the nearest $100,000.
Note 2 On 1 September 20X4, North sold a supply of components to South for $12 million. These components had cost North $10 million to manufacture. All of these components were included in the inventory of South at 30 September 20X4. South had paid for half of the consignment before the yearend and the balance of the liability was included in its payables. Apart from this transaction, and the payment of a dividend by South on 30 June 20X4, there were no other intragroup transactions.
Note 3 Exchange rates on relevant dates were:
Date Exchange rate Afr to $1 1 October 20X1 3.0030 September 20X3 2.7030 June 20X4 2.501 September 20X4 2.4530 September 20X4 2.40
(a) Prepare the consolidated statement of financial position of North at 30 September 20X4.
(b) Prepare the consolidated statement of comprehensive income of North for the year ended 30 September 20X4.
(c) Prepare a consolidated statement of changes in equity for the year ended 30 September 20X4.
Foreign currency translation
364 KAPLAN PUBLISHING
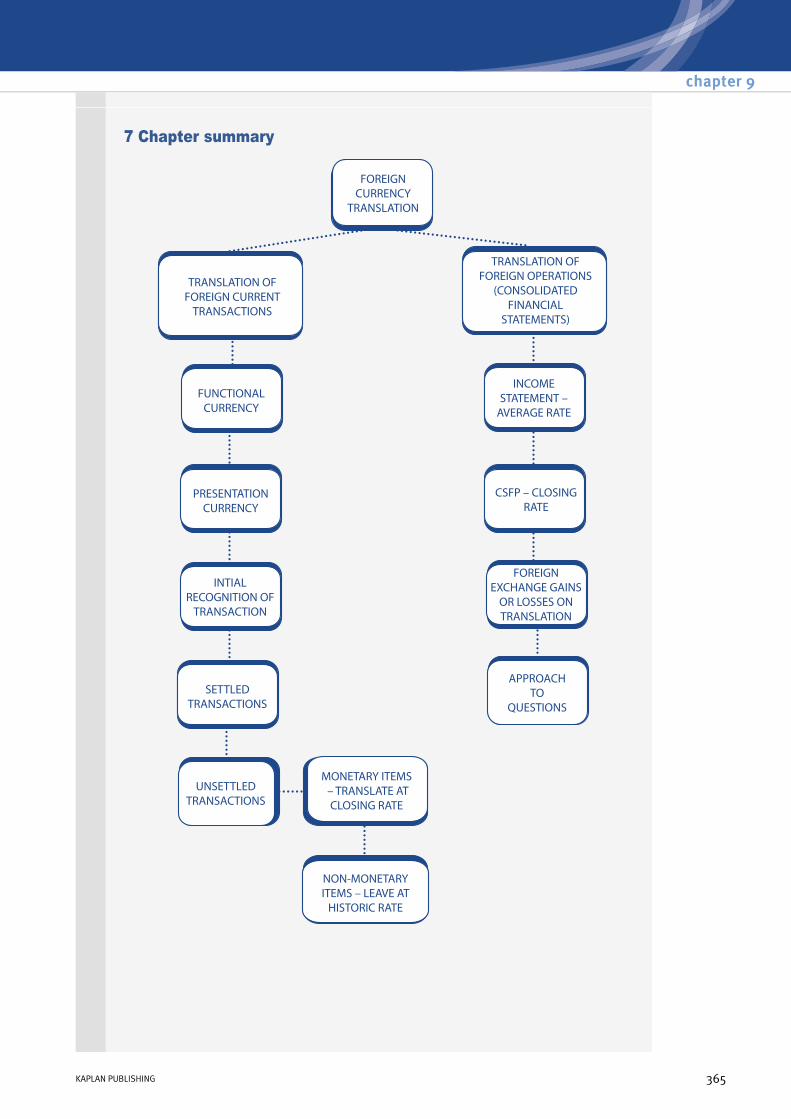
7 Chapter summary
chapter 9
KAPLAN PUBLISHING 365
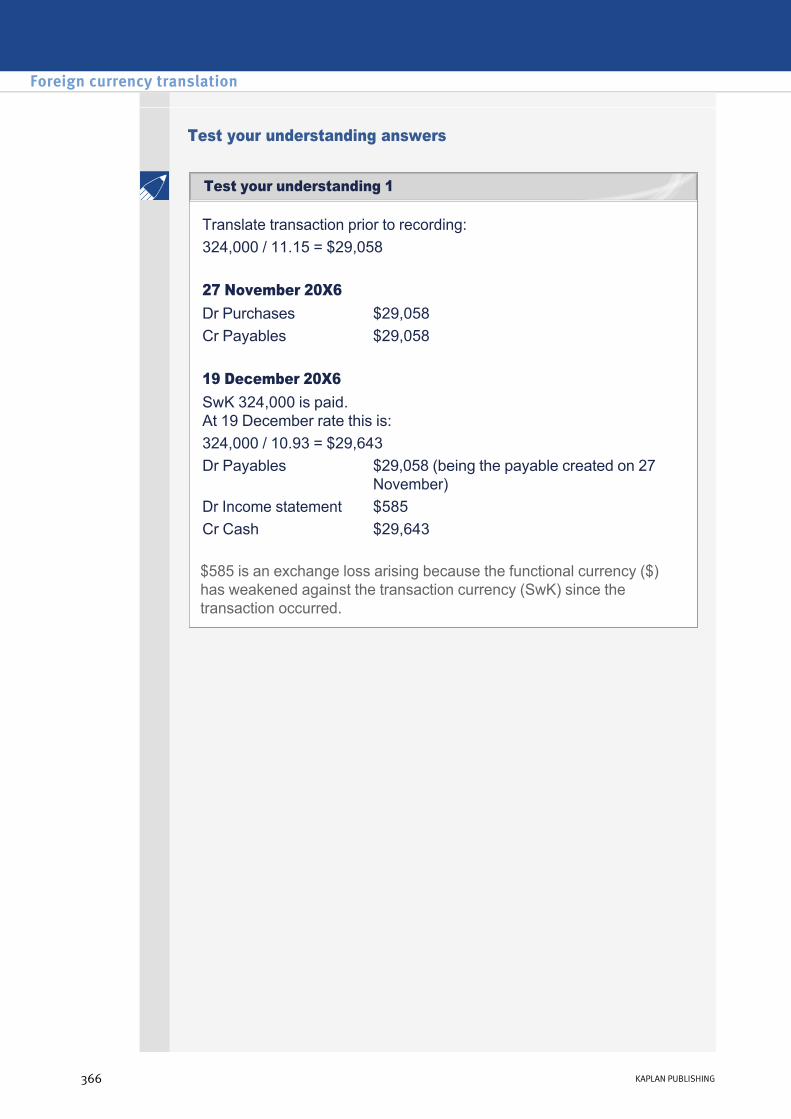
Test your understanding answers
Translate transaction prior to recording: 324,000 / 11.15 = $29,058 27 November 20X6 Dr Purchases $29,058Cr Payables $29,058 19 December 20X6 SwK 324,000 is paid. At 19 December rate this is:
324,000 / 10.93 = $29,643 Dr Payables $29,058 (being the payable created on 27
November)Dr Income statement $585Cr Cash $29,643
$585 is an exchange loss arising because the functional currency ($) has weakened against the transaction currency (SwK) since the transaction occurred.
Foreign currency translation
366 KAPLAN PUBLISHING
Test your understanding 1

Part (a)
On 15 March the purchase is recorded using the exchange rate on that date.
Part (b)
Dr Noncurrent asset (KR20,000/5) $4,000Cr Payable $4,000 • At the year end the noncurrent asset, being a nonmonetary item, is
not retranslated but remains measured at $4,000.
• The payable remains outstanding at the yearend. This is a monetary item and must be retranslated using the closing rate: KR20,000 / 4 = $5,000
• The payable must be increased by $1,000, giving rise to an unrealised exchange loss:
Dr Income statement (exchange loss) $1,000Cr Payable $1,000
1 Jan KR100,000 / 2.0 = $50,000 Dr Noncurrent assets $50,00020X1 Cr Payable $50,000 31 Mar KR100,000 / 2.3 = $43,478 Dr Payable $50,00020X1 Cr Cash $43,478
Cr Income statement $6,522
KR 50,000 / 2.3 = $21,739 Dr Purchases $21,739Cr Payables $21,739
30 Jun KR 95,000 / 2.1 = $45,238 Dr Receivables $45,23820X1 Cr Sales revenue $45,238
chapter 9
KAPLAN PUBLISHING 367
Test your understanding 2
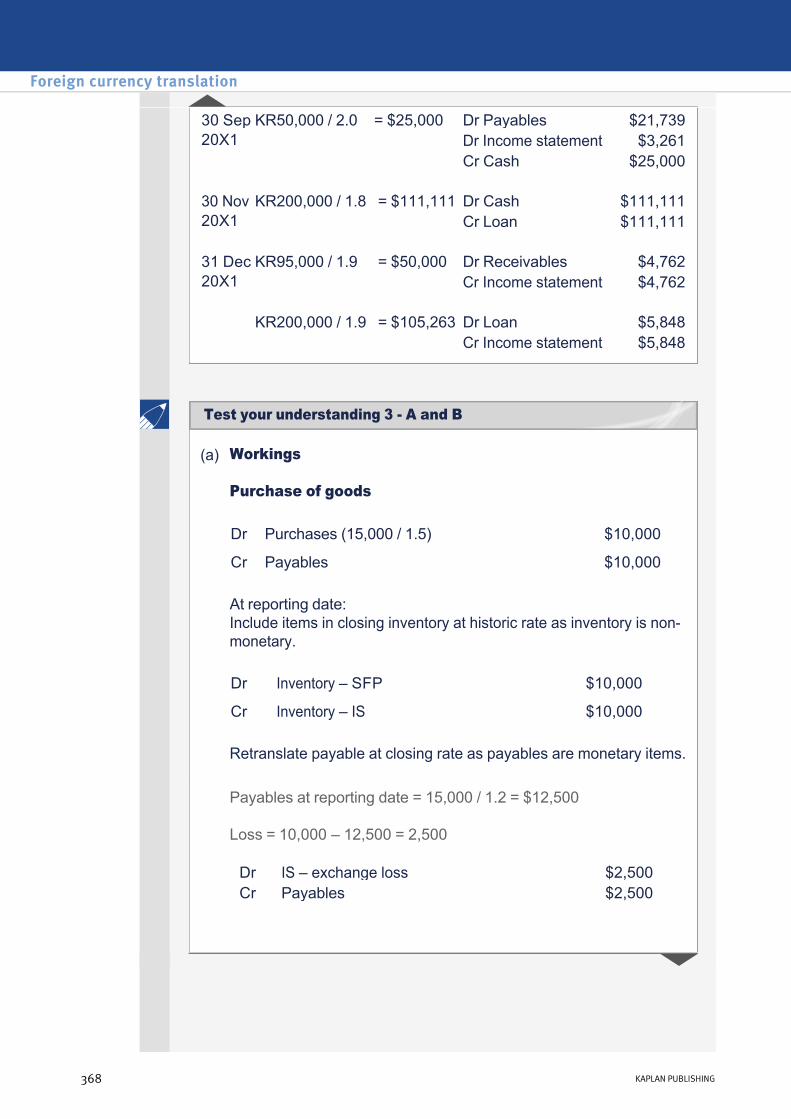
30 Sep KR50,000 / 2.0 = $25,000 Dr Payables $21,73920X1 Dr Income statement $3,261
Cr Cash $25,000 30 Nov KR200,000 / 1.8 = $111,111 Dr Cash $111,11120X1 Cr Loan $111,111
31 Dec KR95,000 / 1.9 = $50,000 Dr Receivables $4,76220X1 Cr Income statement $4,762
KR200,000 / 1.9 = $105,263 Dr Loan $5,848 Cr Income statement $5,848
(a) Workings
Purchase of goods
At reporting date: Include items in closing inventory at historic rate as inventory is nonmonetary.
Retranslate payable at closing rate as payables are monetary items.
Dr Purchases (15,000 / 1.5) $10,000
Cr Payables $10,000
Dr Inventory – SFP $10,000
Cr Inventory – IS $10,000
Payables at reporting date = 15,000 / 1.2 = $12,500
Loss = 10,000 – 12,500 = 2,500
Dr IS – exchange loss $2,500Cr Payables $2,500
Foreign currency translation
368 KAPLAN PUBLISHING
Test your understanding 3 A and B
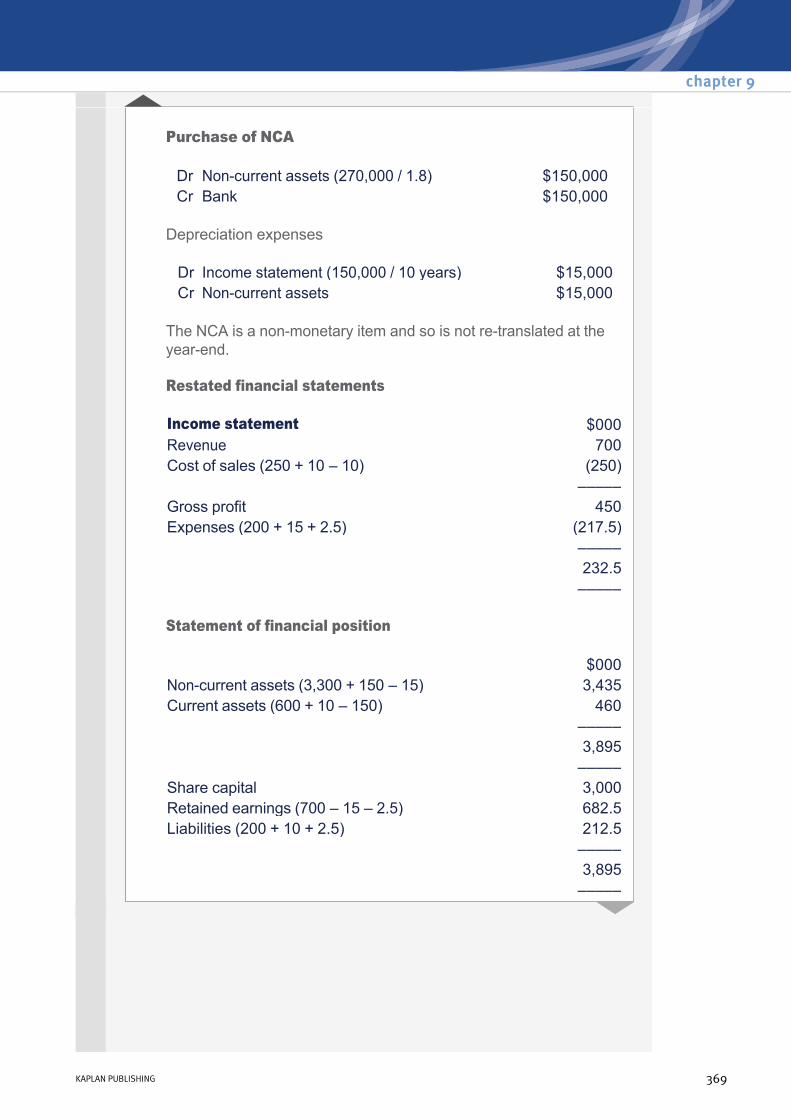
Purchase of NCA
Depreciation expenses
The NCA is a nonmonetary item and so is not retranslated at the yearend. Restated financial statements
Statement of financial position
Dr Noncurrent assets (270,000 / 1.8) $150,000Cr Bank $150,000
Dr Income statement (150,000 / 10 years) $15,000Cr Noncurrent assets $15,000
Income statement $000Revenue 700Cost of sales (250 + 10 – 10) (250)
––––– Gross profit 450Expenses (200 + 15 + 2.5) (217.5)
––––– 232.5 –––––
$000Noncurrent assets (3,300 + 150 – 15) 3,435Current assets (600 + 10 – 150) 460
––––– 3,895 –––––
Share capital 3,000Retained earnings (700 – 15 – 2.5) 682.5Liabilities (200 + 10 + 2.5) 212.5
––––– 3,895 –––––
chapter 9
KAPLAN PUBLISHING 369

(b) Consolidated income statement
Consolidated statement of financial position
$000
Revenue (900 + 700) 1,600
Cost of sales (300 + 250) (550)
–––––
Gross profit 1,050
Expenses (400 + 217.5) (617.5)
–––––
Net profit 432.5
–––––
Attributable to:
Noncontrolling shareholders (10% × 232.5) 23.25
Parent shareholders 409.25
–––––
432.50
–––––
$000
Goodwill (W3) 140
Noncurrent assets (1,550 + 3,435) 4,985
Current assets (650 + 460) 1,110
–––––
6,235
–––––
Share capital 4,000
Retained earnings (W5) 1,254.25
Noncontrolling interests (W4) 368.25
Liabilities (400 + 212.5) 612.5
–––––
6,235
–––––
Foreign currency translation
370 KAPLAN PUBLISHING
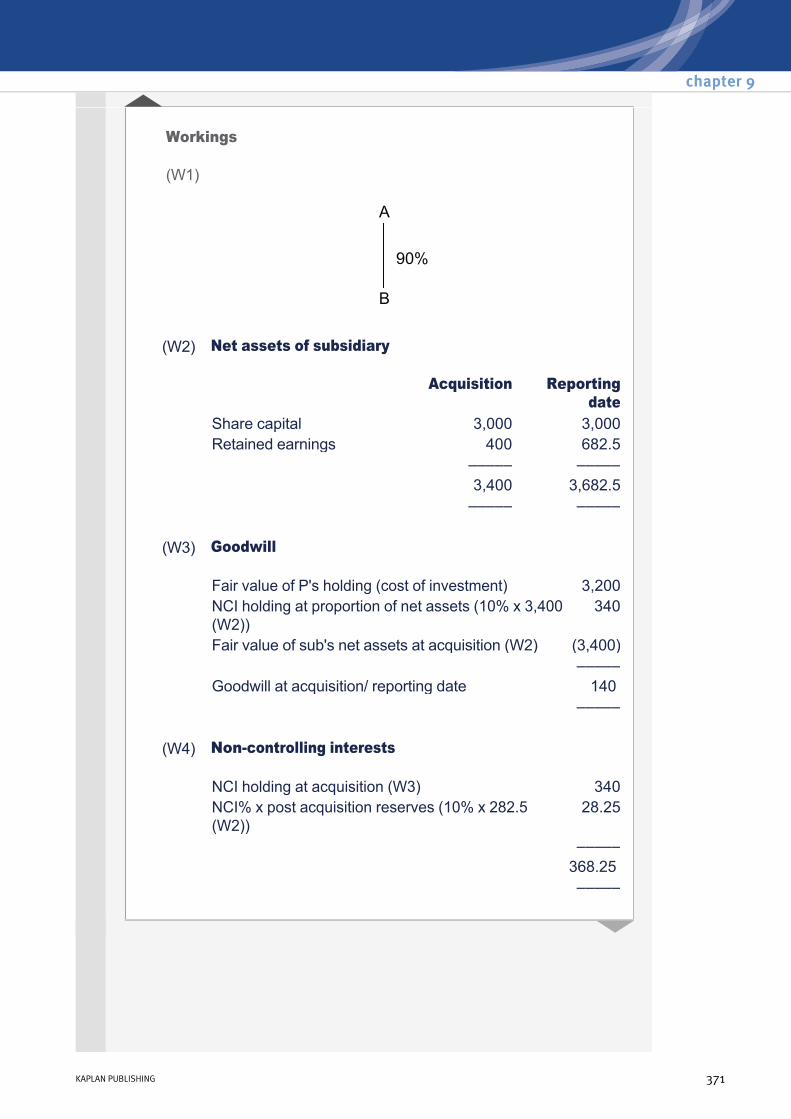
Workings
(W1)
(W2) Net assets of subsidiary
Acquisition Reporting date
Share capital 3,000 3,000Retained earnings 400 682.5 ––––– ––––– 3,400 3,682.5 ––––– –––––
(W3) Goodwill
Fair value of P's holding (cost of investment) 3,200NCI holding at proportion of net assets (10% x 3,400 (W2))
340
Fair value of sub's net assets at acquisition (W2) (3,400) ––––– Goodwill at acquisition/ reporting date 140 –––––
(W4) Noncontrolling interests
NCI holding at acquisition (W3) 340NCI% x post acquisition reserves (10% x 282.5 (W2))
28.25
––––– 368.25
–––––
chapter 9
KAPLAN PUBLISHING 371
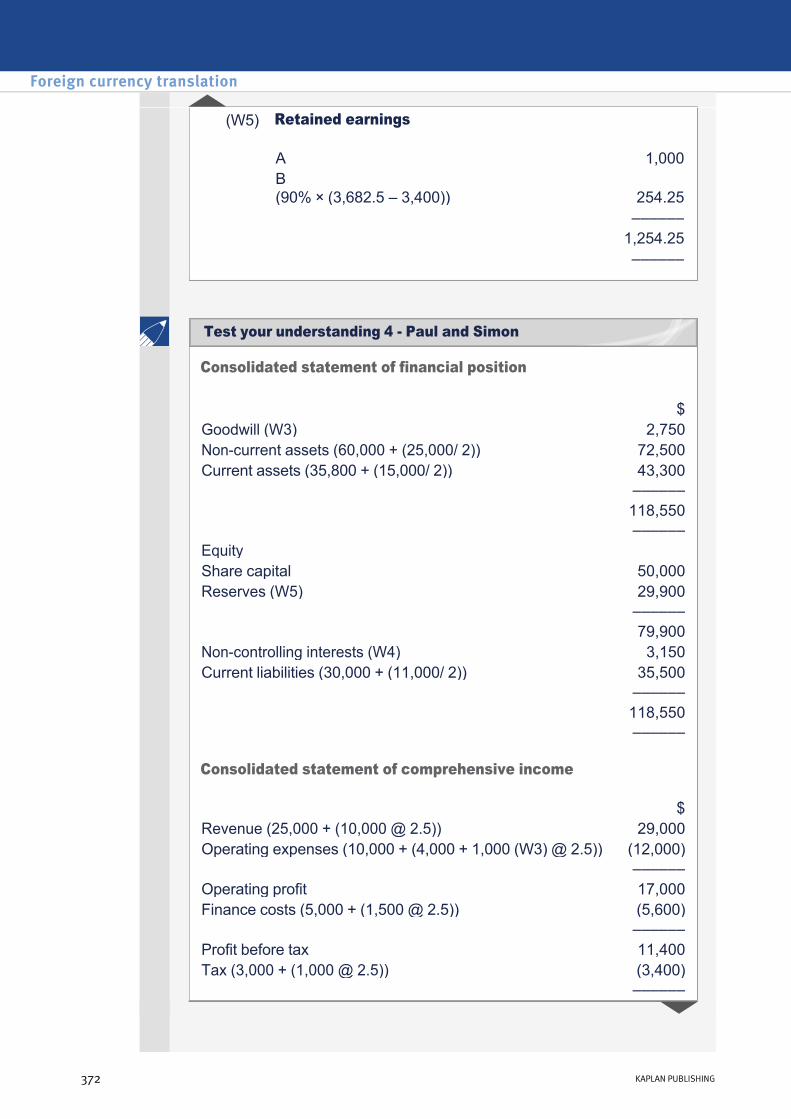
(W5) Retained earnings
A 1,000B (90% × (3,682.5 – 3,400))
254.25
–––––– 1,254.25
––––––
Consolidated statement of financial position
Consolidated statement of comprehensive income
$Goodwill (W3) 2,750Noncurrent assets (60,000 + (25,000/ 2)) 72,500Current assets (35,800 + (15,000/ 2)) 43,300 –––––– 118,550 ––––––Equity Share capital 50,000Reserves (W5) 29,900 –––––– 79,900Noncontrolling interests (W4) 3,150Current liabilities (30,000 + (11,000/ 2)) 35,500 –––––– 118,550 ––––––
$Revenue (25,000 + (10,000 @ 2.5)) 29,000Operating expenses (10,000 + (4,000 + 1,000 (W3) @ 2.5)) (12,000) ––––––Operating profit 17,000Finance costs (5,000 + (1,500 @ 2.5)) (5,600) ––––––Profit before tax 11,400Tax (3,000 + (1,000 @ 2.5)) (3,400) ––––––
Foreign currency translation
372 KAPLAN PUBLISHING
Test your understanding 4 Paul and Simon
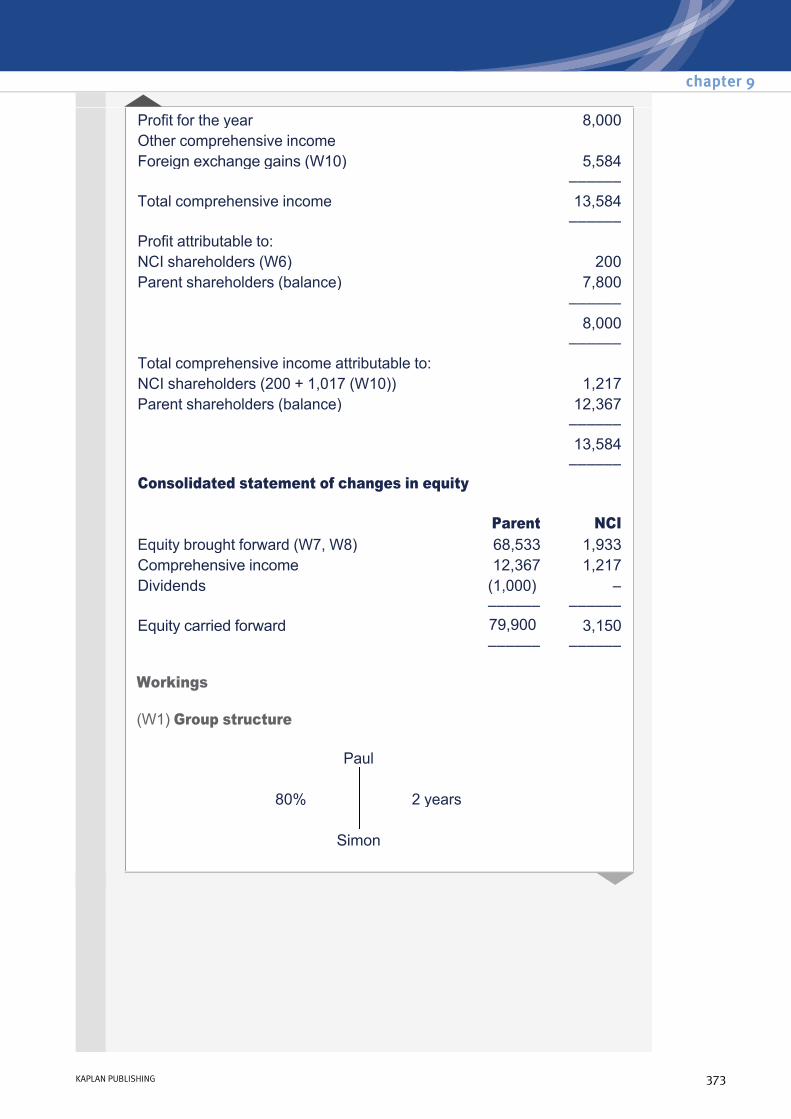
Workings
(W1) Group structure
Profit for the year 8,000Other comprehensive income Foreign exchange gains (W10) 5,584 –––––– Total comprehensive income 13,584 ––––––Profit attributable to: NCI shareholders (W6) 200Parent shareholders (balance) 7,800 –––––– 8,000 –––––– Total comprehensive income attributable to: NCI shareholders (200 + 1,017 (W10)) 1,217Parent shareholders (balance) 12,367 –––––– 13,584 ––––––Consolidated statement of changes in equity Parent NCI Equity brought forward (W7, W8) 68,533 1,933Comprehensive income 12,367 1,217Dividends (1,000) – –––––– ––––––Equity carried forward 79,900 3,150 –––––– ––––––
Paul
80% 2 years Simon
chapter 9
KAPLAN PUBLISHING 373
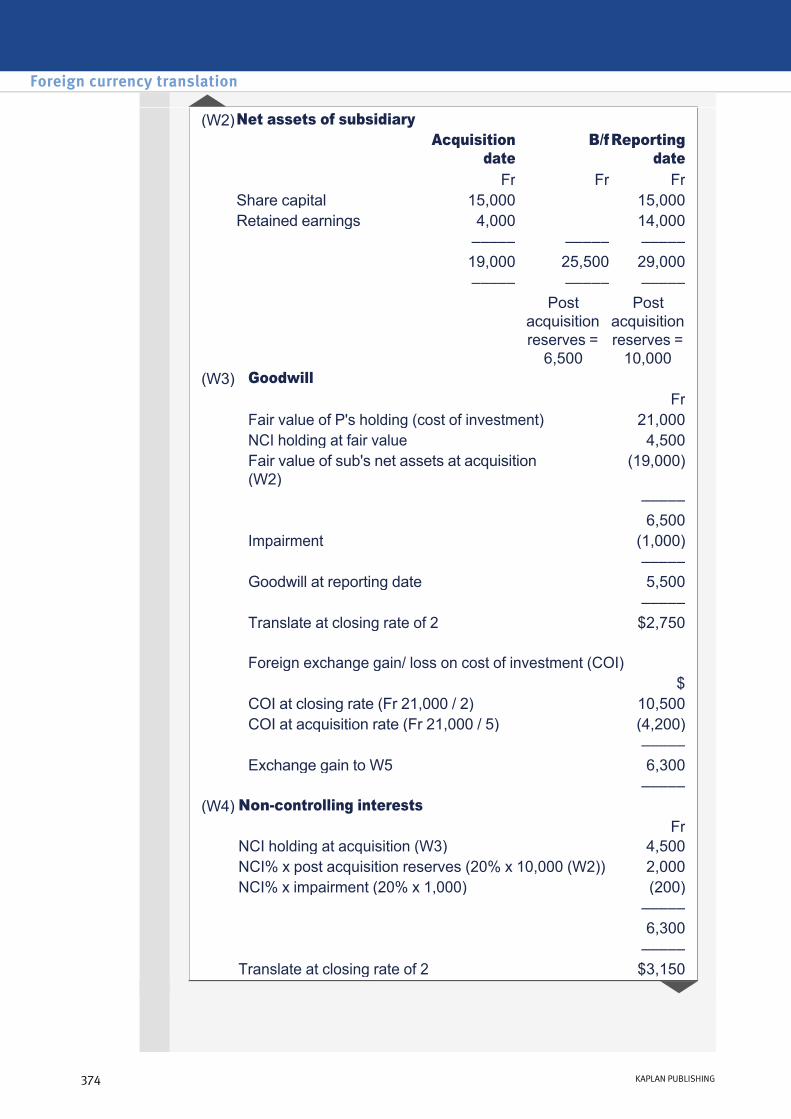
(W2)Net assets of subsidiary Acquisition
date B/f Reporting
date Fr Fr Fr Share capital 15,000 15,000 Retained earnings 4,000 14,000 ––––– ––––– ––––– 19,000 25,500 29,000 ––––– ––––– ––––– Post
acquisition reserves = 6,500
Post acquisition reserves = 10,000
(W3) Goodwill Fr Fair value of P's holding (cost of investment) 21,000 NCI holding at fair value 4,500 Fair value of sub's net assets at acquisition
(W2)(19,000)
––––– 6,500 Impairment (1,000) ––––– Goodwill at reporting date 5,500 ––––– Translate at closing rate of 2 $2,750 Foreign exchange gain/ loss on cost of investment (COI) $ COI at closing rate (Fr 21,000 / 2) 10,500 COI at acquisition rate (Fr 21,000 / 5) (4,200) ––––– Exchange gain to W5 6,300 ––––– (W4) Noncontrolling interests Fr NCI holding at acquisition (W3) 4,500 NCI% x post acquisition reserves (20% x 10,000 (W2)) 2,000 NCI% x impairment (20% x 1,000) (200) ––––– 6,300 ––––– Translate at closing rate of 2 $3,150
Foreign currency translation
374 KAPLAN PUBLISHING

(W5) Retained earnings $ Paul 20,000 Simon: (80% x (29,000 – 19,000 (W2) / 2) 4,000 Impairment (80% x (1,000 / 2)) (400) Gain on COI (W3) 6,300 ––––– 29,900 ––––– (W6) NCI share of profits Fr S's profit for the year 3,500 Impairment (fair value method) (1,000) ––––– Equity b/f per individual SOCE 2,500 ––––– x 20% 500 Translated at average rate (500 @ 2.5) $200 (W7) NCI equity b/f Fr NCI holding at acquisition (W3) 4,500 NCI% x post acquisition profits (20% x 6,500 (W2)) 1,300 NCI% x impairment – ––––– 5,800 ––––– Translate at opening rate of 3 $1,933(W8) Parent shareholders equity b/f $ Paul 64,000 Simon: (80% x (25,500 (W6) –19,000) (W2) / 3) 1,733 Impairment b/f – Gain on COI to b/f date (W9) 2,800 ––––– 68,533 ––––– (W9) Foreign exchange gain/ loss on COI brought forward $ COI @ b/f rate (Fr 21,000 / 3) 7,000 COI @ acq rate (Fr 21,000 / 5) 4,200 ––––– Gain for W8 2,800 –––––
chapter 9
KAPLAN PUBLISHING 375
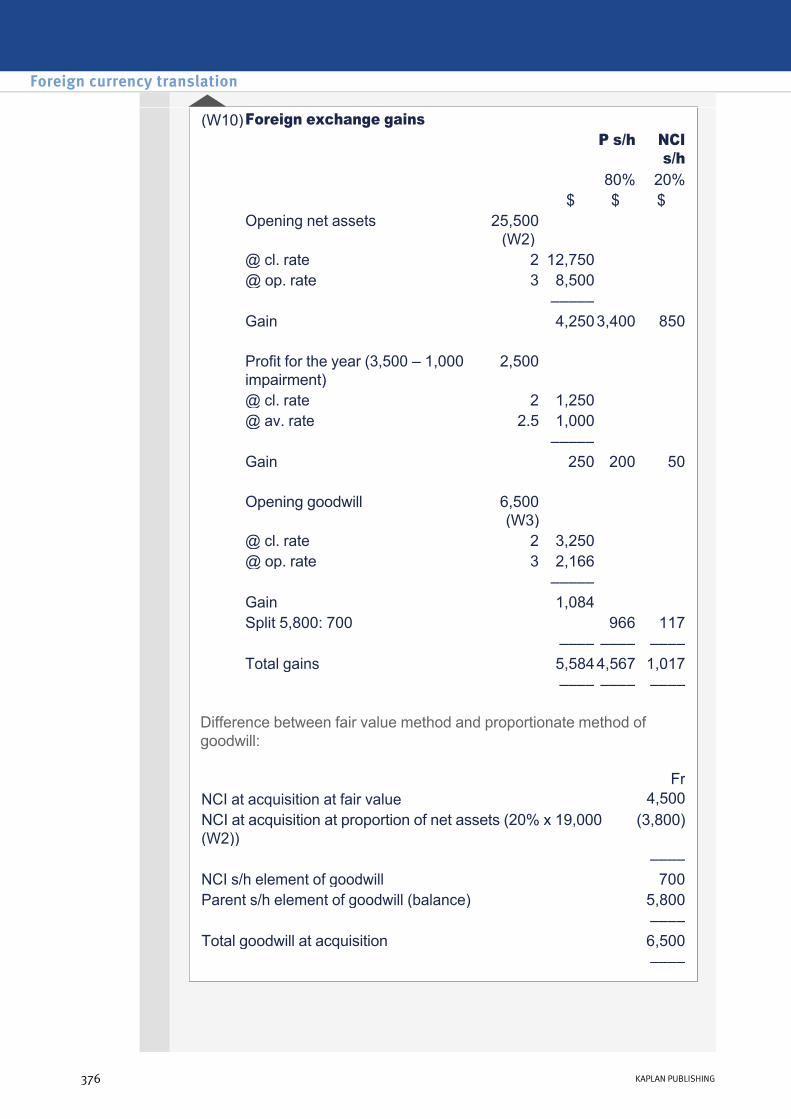
Difference between fair value method and proportionate method of goodwill:
(W10)Foreign exchange gains P s/h NCI
s/h 80% 20% $ $ $ Opening net assets 25,500
(W2)
@ cl. rate 2 12,750 @ op. rate 3 8,500 ––––– Gain 4,2503,400 850 Profit for the year (3,500 – 1,000
impairment)2,500
@ cl. rate 2 1,250 @ av. rate 2.5 1,000 ––––– Gain 250 200 50 Opening goodwill 6,500
(W3)
@ cl. rate 2 3,250 @ op. rate 3 2,166 ––––– Gain 1,084 Split 5,800: 700 966 117 –––– –––– –––– Total gains 5,5844,567 1,017 –––– –––– ––––
FrNCI at acquisition at fair value 4,500NCI at acquisition at proportion of net assets (20% x 19,000 (W2))
(3,800)
–––– NCI s/h element of goodwill 700Parent s/h element of goodwill (balance) 5,800 –––– Total goodwill at acquisition 6,500 ––––
Foreign currency translation
376 KAPLAN PUBLISHING
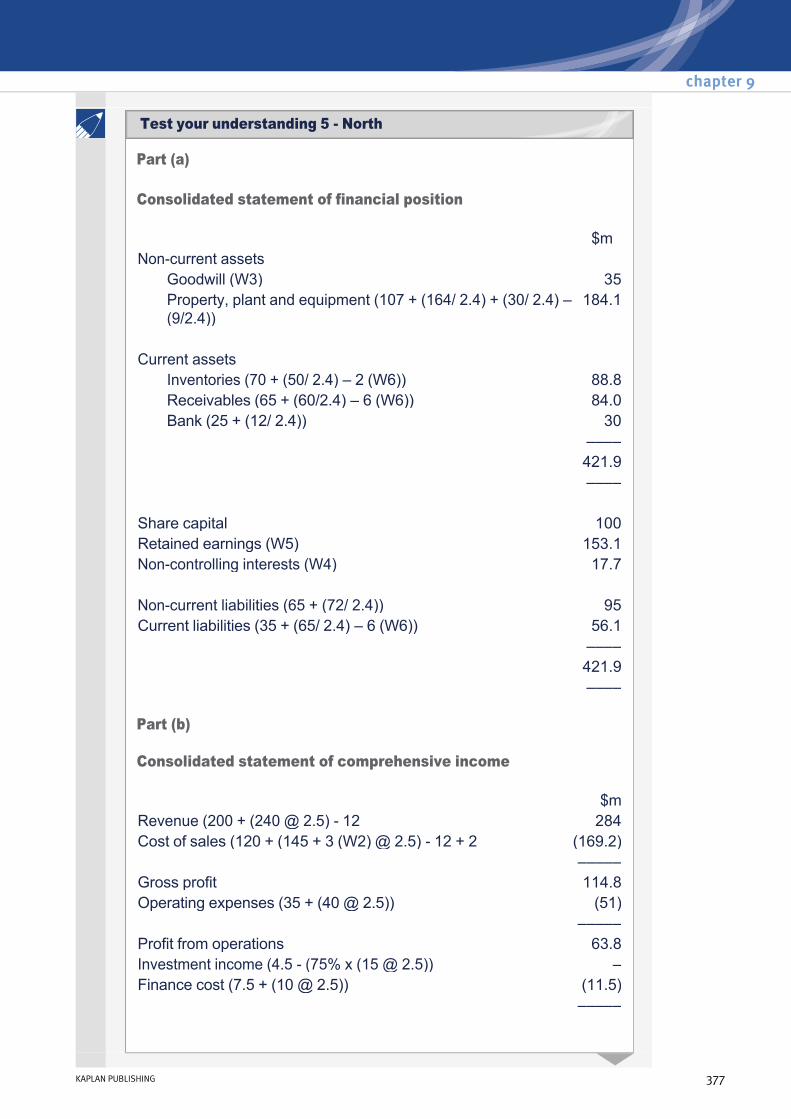
Part (a)
Consolidated statement of financial position
Part (b)
Consolidated statement of comprehensive income
$mNoncurrent assets
Goodwill (W3) 35Property, plant and equipment (107 + (164/ 2.4) + (30/ 2.4) – (9/2.4))
184.1
Current assets
Inventories (70 + (50/ 2.4) – 2 (W6)) 88.8Receivables (65 + (60/2.4) – 6 (W6)) 84.0Bank (25 + (12/ 2.4)) 30
–––– 421.9 –––– Share capital 100Retained earnings (W5) 153.1Noncontrolling interests (W4) 17.7 Noncurrent liabilities (65 + (72/ 2.4)) 95Current liabilities (35 + (65/ 2.4) – 6 (W6)) 56.1 –––– 421.9 ––––
$mRevenue (200 + (240 @ 2.5) 12 284Cost of sales (120 + (145 + 3 (W2) @ 2.5) 12 + 2 (169.2) ––––– Gross profit 114.8Operating expenses (35 + (40 @ 2.5)) (51) ––––– Profit from operations 63.8Investment income (4.5 (75% x (15 @ 2.5)) – Finance cost (7.5 + (10 @ 2.5)) (11.5) –––––
chapter 9
KAPLAN PUBLISHING 377
Test your understanding 5 North
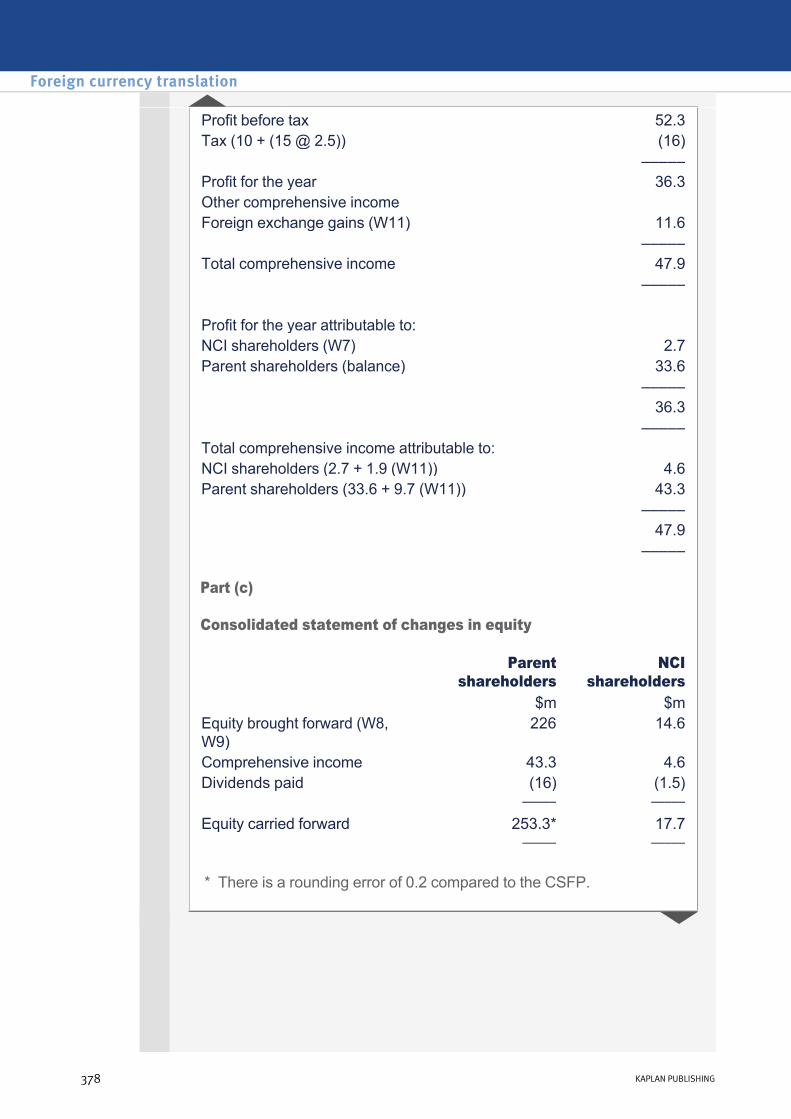
Part (c)
Consolidated statement of changes in equity
* There is a rounding error of 0.2 compared to the CSFP.
Profit before tax 52.3Tax (10 + (15 @ 2.5)) (16) ––––– Profit for the year 36.3Other comprehensive income Foreign exchange gains (W11) 11.6 ––––– Total comprehensive income 47.9 ––––– Profit for the year attributable to: NCI shareholders (W7) 2.7Parent shareholders (balance) 33.6
––––– 36.3
––––– Total comprehensive income attributable to: NCI shareholders (2.7 + 1.9 (W11)) 4.6Parent shareholders (33.6 + 9.7 (W11)) 43.3 ––––– 47.9
–––––
Parent shareholders
NCI shareholders
$m $mEquity brought forward (W8, W9)
226 14.6
Comprehensive income 43.3 4.6Dividends paid (16) (1.5) ––––– ––––– Equity carried forward 253.3* 17.7
––––– –––––
Foreign currency translation
378 KAPLAN PUBLISHING

Workings
(W1)
(W2) Net assets of South
Acquisition date
B/f date Reporting date
AFrm AFrm AFrmShare capital 60 60Retained earnings 38 89 ––––– ––––– ––––– 98 134 149Fair Value Adj (80 – 50)
30 30 30
Depreciation adjustment (30 x 1/10 per annum)
– (6) (9)
––––– ––––– ––––– 128 158 170 ––––– ––––– ––––– Post
acquisition reserves = 30
Post acquisition
reserves = 42
(W3) Goodwill
AFrmFair value of P's holding (cost of investment) (45m × Afr 4) 180NCI holding at proportion of net assets (25% x 128 (W2)) 32Fair value of sub's net assets at acquisition (W2) (128) –––– Goodwill at acquisition/ reporting date 84 ––––
chapter 9
KAPLAN PUBLISHING 379
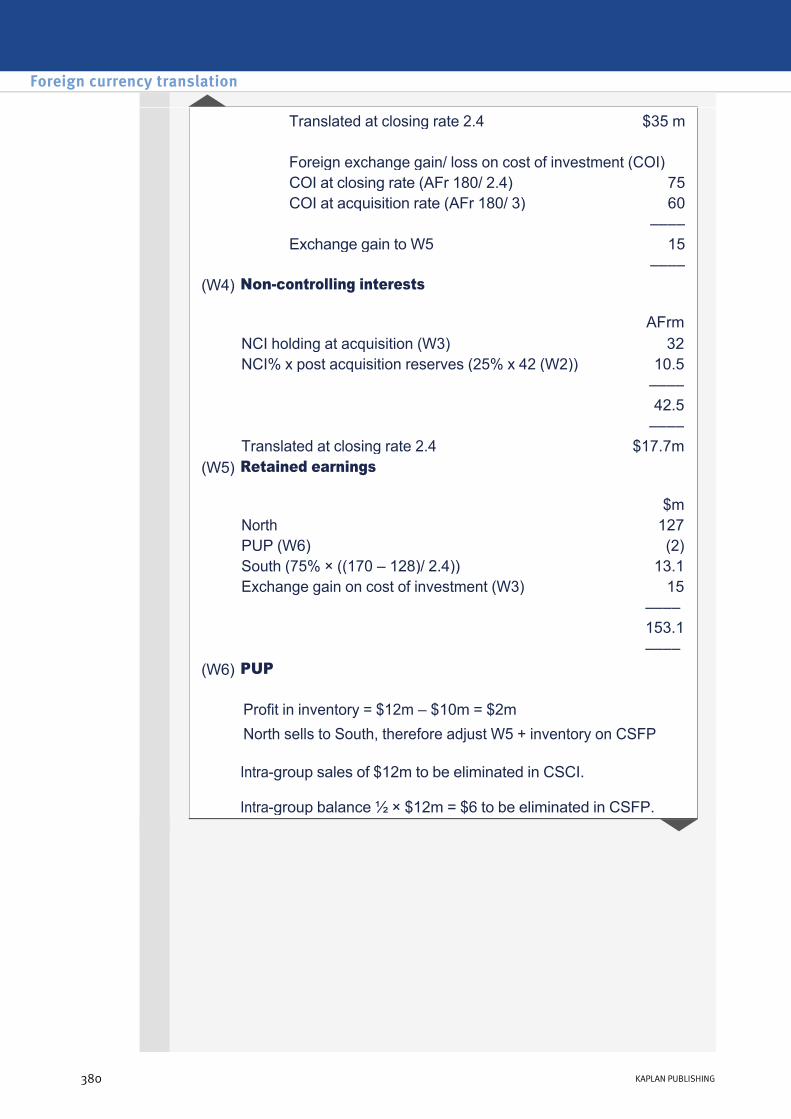
Translated at closing rate 2.4 $35 m
Foreign exchange gain/ loss on cost of investment (COI)COI at closing rate (AFr 180/ 2.4) 75COI at acquisition rate (AFr 180/ 3) 60
–––– Exchange gain to W5 15
–––– (W4) Noncontrolling interests
AFrmNCI holding at acquisition (W3) 32NCI% x post acquisition reserves (25% x 42 (W2)) 10.5 –––– 42.5 –––– Translated at closing rate 2.4 $17.7m
(W5) Retained earnings
$mNorth 127PUP (W6) (2)South (75% × ((170 – 128)/ 2.4)) 13.1Exchange gain on cost of investment (W3) 15 –––– 153.1 ––––
(W6) PUP
Intragroup sales of $12m to be eliminated in CSCI.
Intragroup balance ½ × $12m = $6 to be eliminated in CSFP.
Profit in inventory = $12m – $10m = $2m North sells to South, therefore adjust W5 + inventory on CSFP
Foreign currency translation
380 KAPLAN PUBLISHING
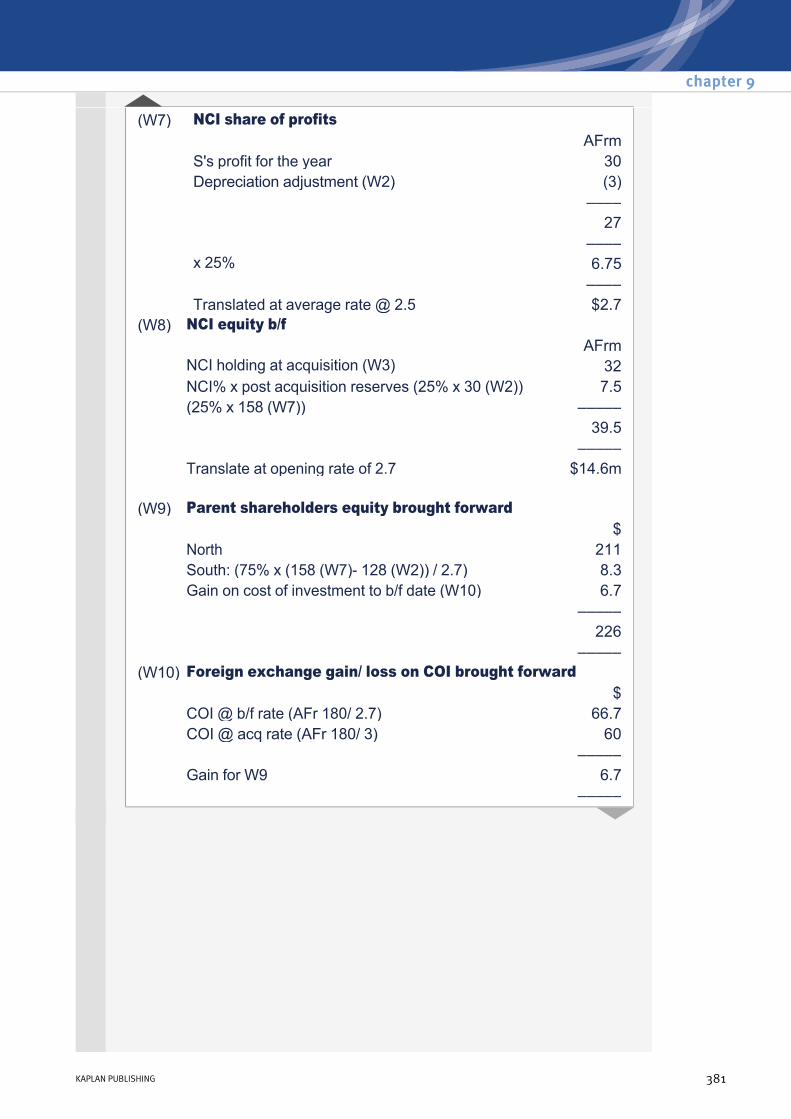
(W7) NCI share of profits AFrm S's profit for the year 30 Depreciation adjustment (W2) (3) –––– 27 –––– x 25% 6.75 –––– Translated at average rate @ 2.5 $2.7(W8) NCI equity b/f AFrm NCI holding at acquisition (W3) 32 NCI% x post acquisition reserves (25% x 30 (W2)) 7.5 (25% x 158 (W7)) ––––– 39.5 ––––– Translate at opening rate of 2.7 $14.6m (W9) Parent shareholders equity brought forward $ North 211 South: (75% x (158 (W7) 128 (W2)) / 2.7) 8.3 Gain on cost of investment to b/f date (W10) 6.7 ––––– 226 ––––– (W10) Foreign exchange gain/ loss on COI brought forward $ COI @ b/f rate (AFr 180/ 2.7) 66.7 COI @ acq rate (AFr 180/ 3) 60 ––––– Gain for W9 6.7 –––––
chapter 9
KAPLAN PUBLISHING 381
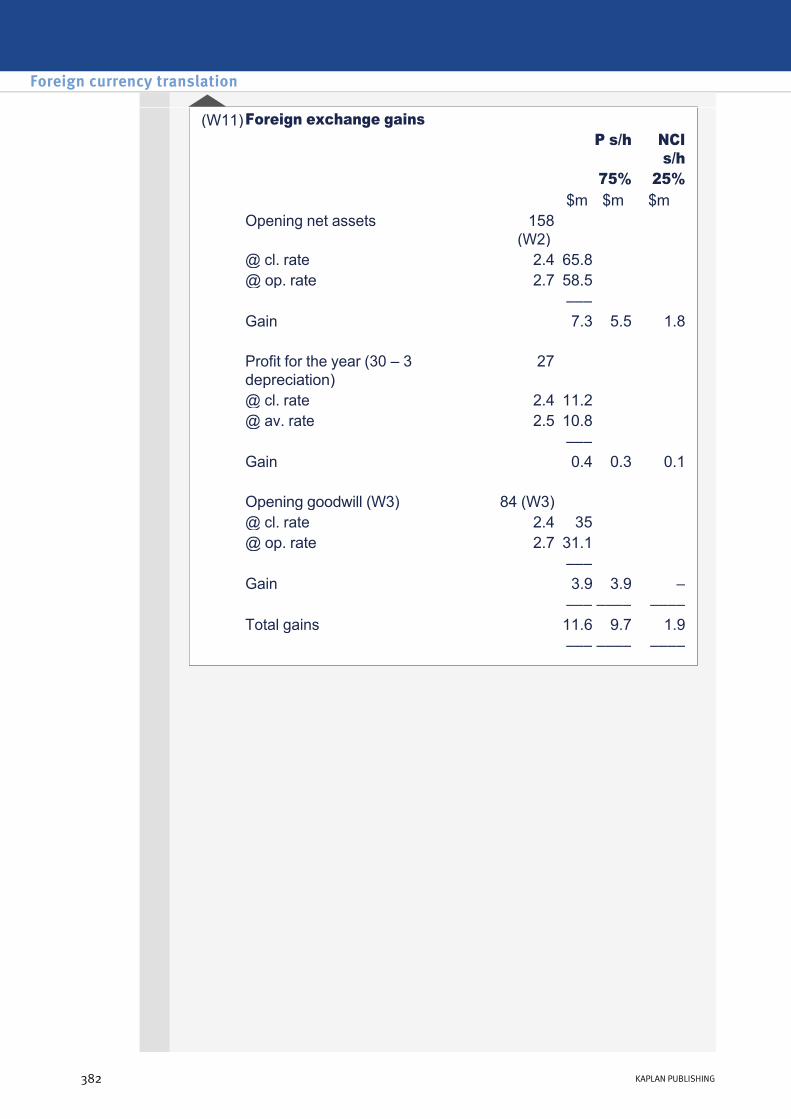
(W11)Foreign exchange gains P s/h NCI
s/h 75% 25% $m $m $m Opening net assets 158
(W2)
@ cl. rate 2.4 65.8 @ op. rate 2.7 58.5 ––– Gain 7.3 5.5 1.8 Profit for the year (30 – 3
depreciation)27
@ cl. rate 2.4 11.2 @ av. rate 2.5 10.8 ––– Gain 0.4 0.3 0.1 Opening goodwill (W3) 84 (W3) @ cl. rate 2.4 35 @ op. rate 2.7 31.1 ––– Gain 3.9 3.9 – ––– –––– –––– Total gains 11.6 9.7 1.9 ––– –––– ––––
Foreign currency translation
382 KAPLAN PUBLISHING
Group statement of cash flows Chapter learning objectives
On completion of their studies students should be able to:
• Prepare consolidated financial statements (including the group cash flow statement) for a group of companies.
383
chapter
10

1 Session content
2 Objective of statements of cash flows
• IAS 7 Statement of cash flows provides guidance on the preparation of a statement of cash flow.
• The objective of a statement of cash flows is to provide information on an entity’s changes in cash and cash equivalents during the period.
• The statement of financial position and income statement or statement of comprehensive income (SCI) are prepared on an accruals basis and do not show how the business has generated and used cash in the accounting period.
• The income statement (SCI) may show profits on an accruals basis even if the company is suffering severe cash flow problems.
• Statements of cash flows enable users of the financial statements to assess the liquidity, solvency and financial adaptability of a business.
Definitions:
• Cash consists of cash in hand and deposits repayable upon demand, less overdrafts. This includes cash held in a foreign currency.
• Cash equivalents are shortterm, highly liquid investments that are readily convertible to known amounts of cash and are subject to an insignificant risk of changes in value.
• Cash flows are inflows and outflows of cash and cash equivalents.
Group statement of cash flows
384 KAPLAN PUBLISHING384 KAPLAN PUBLISHING

3 Classification of cash flows
IAS 7 does not prescribe a specific format for the statement of cash flows, although it requires that cash flows are classified under three headings:
• cash flows from operating activities, defined as the entity’s principal revenue earning activities and other activities that do not fall under the next two headings
• cash flows from investing activities, defined as the acquisition and disposal of longterm assets and other investments (excluding cash equivalents)
• cash flows from financing activities, defined as activities that change the size and composition of the entity’s equity and borrowings.
4 Proforma statement of cash flowsGroup statement of cash flows
Cash flows from operating activities $ $Group profit before tax X Finance cost X Investment income (X) Share of associate's profit (X) Depreciation X Amortisation X Impairments X Profit/loss on sale of property, plant and equipment (X)/X
––– X
Change in inventory (X)/X Change in receivables (X)/X Change in payables X/(X)
––– Cash generated from operations X
Interest paid (X) Tax paid (X)
––– Net cash from operating activities X –––
chapter 10
KAPLAN PUBLISHING 385
Classification of cash flows

Cash flows from investing activities Sale proceeds on disposal of property, plant and equipment X Purchases of property, plant and equipment (X) Investment income received X Dividends received from associate X Acquisition/ sale of subsidiary, net of cash balances (X)/X
––– Net cash used in investing activities XCash flows from financing activities
Loans – issue/repayment X/(X) Share issues X Dividends paid to NCI (X) Dividends paid to parent shareholders (X)
––– X ––– Increase decrease in cash and cash equivalents X/(X)Opening cash and cash equivalents X ––– Closing cash and cash equivalents X –––
5 Approach for a single company statement of cash flows
(1) Calculate cash and cash equivalents carried forward and brought forward, taking into account any overdraft. These figures can go directly to the bottom of the statement of cash flows.
(2) Reconcile accounting profit before tax back to cash from operations using the proforma provided in the statement of cash flows. Remember an increase in inventory or receivables means a deduction in the reconciliation.
(3) Complete the cash flows from operating activities section by calculating tax paid and interest paid.
(4) Within the cash flows from investing activities, it may be necessary to prepare a T account or similar working for property, plant and equipment (PPE) to calculate missing figures e.g. additions, depreciation or the book value of disposals to then calculate sale proceeds or profit/ loss on disposal.
(5) Cash flows from financing activities reflects movements in share capital, loans and dividends paid. Remember to look at share capital and share premium together to ascertain cash received from a share issue.
(6) Ensure that any foreign exchange gains/losses are eliminated from the calculations as they are not cash movements.
Group statement of cash flows
386 KAPLAN PUBLISHING
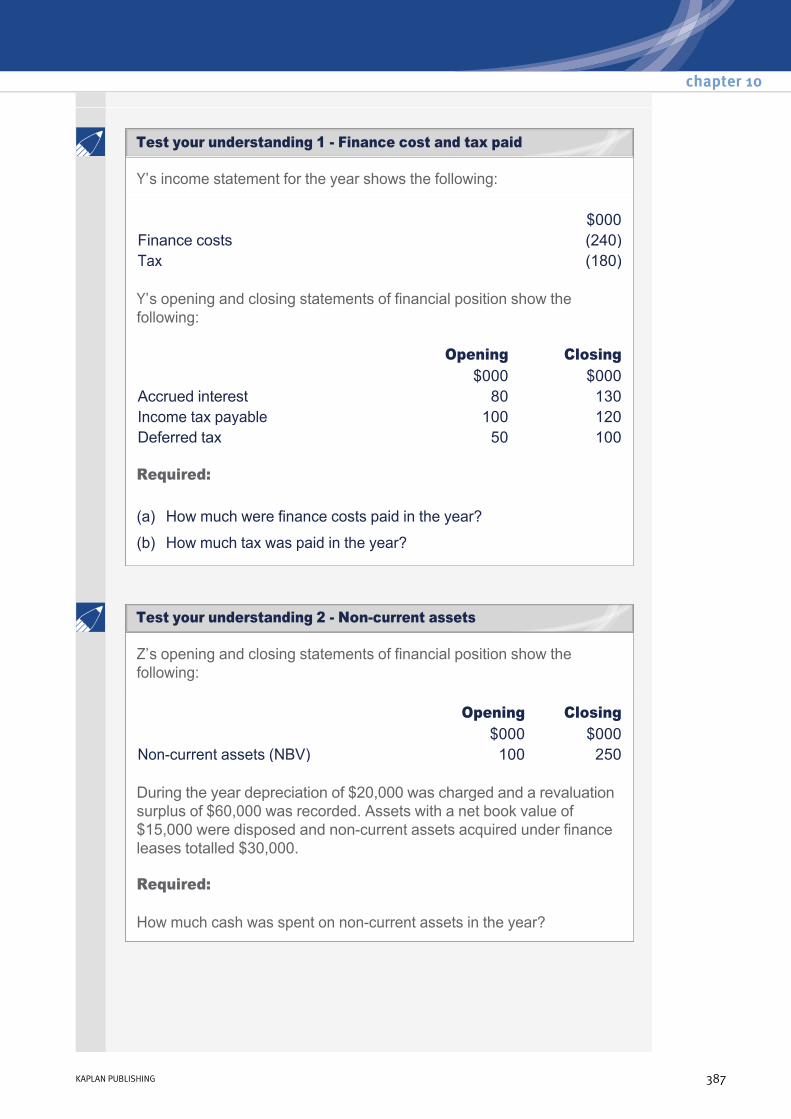
Y’s income statement for the year shows the following:
Y’s opening and closing statements of financial position show the following:
Required:
$000Finance costs (240)Tax (180)
Opening Closing $000 $000
Accrued interest 80 130Income tax payable 100 120Deferred tax 50 100
(a) How much were finance costs paid in the year?
(b) How much tax was paid in the year?
Z’s opening and closing statements of financial position show the following:
During the year depreciation of $20,000 was charged and a revaluation surplus of $60,000 was recorded. Assets with a net book value of $15,000 were disposed and noncurrent assets acquired under finance leases totalled $30,000.
Required:
How much cash was spent on noncurrent assets in the year?
Opening Closing $000 $000
Noncurrent assets (NBV) 100 250
chapter 10
KAPLAN PUBLISHING 387
Test your understanding 2 Noncurrent assets
Test your understanding 1 Finance cost and tax paid
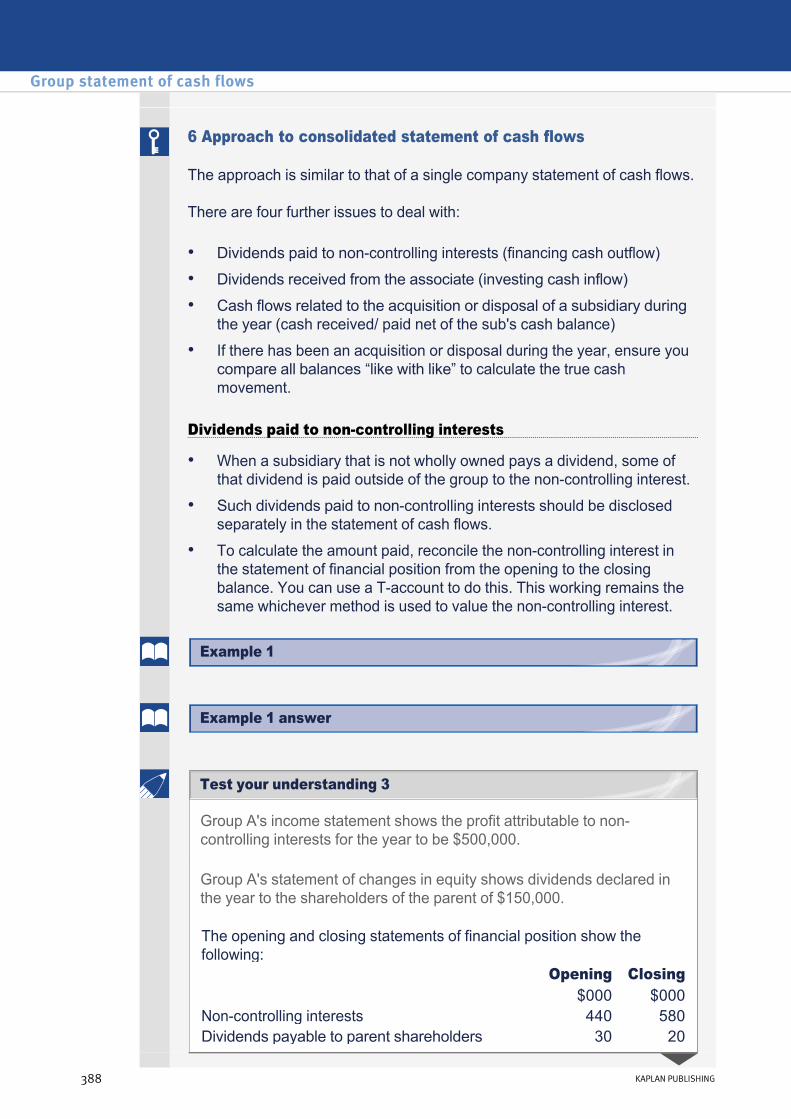
6 Approach to consolidated statement of cash flows
The approach is similar to that of a single company statement of cash flows.
There are four further issues to deal with:
• Dividends paid to noncontrolling interests (financing cash outflow)
• Dividends received from the associate (investing cash inflow)
• Cash flows related to the acquisition or disposal of a subsidiary during the year (cash received/ paid net of the sub's cash balance)
• If there has been an acquisition or disposal during the year, ensure you compare all balances “like with like” to calculate the true cash movement.
Dividends paid to noncontrolling interests
• When a subsidiary that is not wholly owned pays a dividend, some of that dividend is paid outside of the group to the noncontrolling interest.
• Such dividends paid to noncontrolling interests should be disclosed separately in the statement of cash flows.
• To calculate the amount paid, reconcile the noncontrolling interest in the statement of financial position from the opening to the closing balance. You can use a Taccount to do this. This working remains the same whichever method is used to value the noncontrolling interest.
Group A's income statement shows the profit attributable to noncontrolling interests for the year to be $500,000.
Group A's statement of changes in equity shows dividends declared in the year to the shareholders of the parent of $150,000.
The opening and closing statements of financial position show the following: Opening Closing
$000 $000Noncontrolling interests 440 580Dividends payable to parent shareholders 30 20
Group statement of cash flows
388 KAPLAN PUBLISHING
Example 1
Example 1 answer
Test your understanding 3

Required:
(a) Calculate the dividends paid to noncontrolling interests.
(b) Calculate the dividends paid to shareholders of the parent.
Dividends received from associates
• Associates generate cash flows into the group to the extent that dividends are received out of the profits of the associate.
• Such dividends received from associates should be disclosed separately in the statement of cash flows.
• To calculate the amount received, reconcile the investment in associate in the statement of financial position from the opening to the closing balance. You can use a Taccount to do this.
Group B’s income statement reports ‘Share of associate’s profits’ of $750,000. The opening and closing statements of financial position show: Opening Closing
$000 $000Investment in associate 200 500
Required:
How much cash was received by the group from the associates in the year?
chapter 10
KAPLAN PUBLISHING 389
Example 2
Example 2 answer
Test your understanding 4
Acquisition and disposal of subsidiaries Standard accounting practice
Acquisitions
Disposals
• If a subsidiary joins or leaves a group during a financial year, the cash flows of the group should include the cash flows of that subsidiary for the same period that the results of the subsidiary are included in the income statement/SCI.
• Cash payments to acquire subsidiaries and receipts from disposals of subsidiaries must be reported separately in the statement of cash flows under investing activities.
• In the statement of cash flows we must record the actual cash flow for the purchase, not the net assets acquired. The cash outflow is net of any cash balances purchased with the subsidiary.
• The assets and liabilities purchased will not be shown with the cash outflow in the statement of cash flows.
• All assets and liabilities acquired must be included in any workings to calculate the cash movement for an item during the year. If they are not included in deriving the balancing figure, the incorrect cash flow figure will be calculated. This applies to all assets and liabilities acquired and also to the NCI reconciliation (to calculated dividends paid to NCI).
• The statement of cash flows will show the cash received from the sale of the subsidiary, net of any cash balances that were transferred out with the sale.
• The assets and liabilities disposed of are not shown in the cash flow. When calculating the movement between the opening and closing balance of an item, the assets and liabilities that have been disposed of must be taken into account in order to calculate the correct cash figure. As with acquisitions, this applies to all assets and liability reconciliations and also to the NCI reconciliation (to calculated dividends paid to NCI).
Group statement of cash flows
390 KAPLAN PUBLISHING
Example 3
Example 3 answer
Example 4
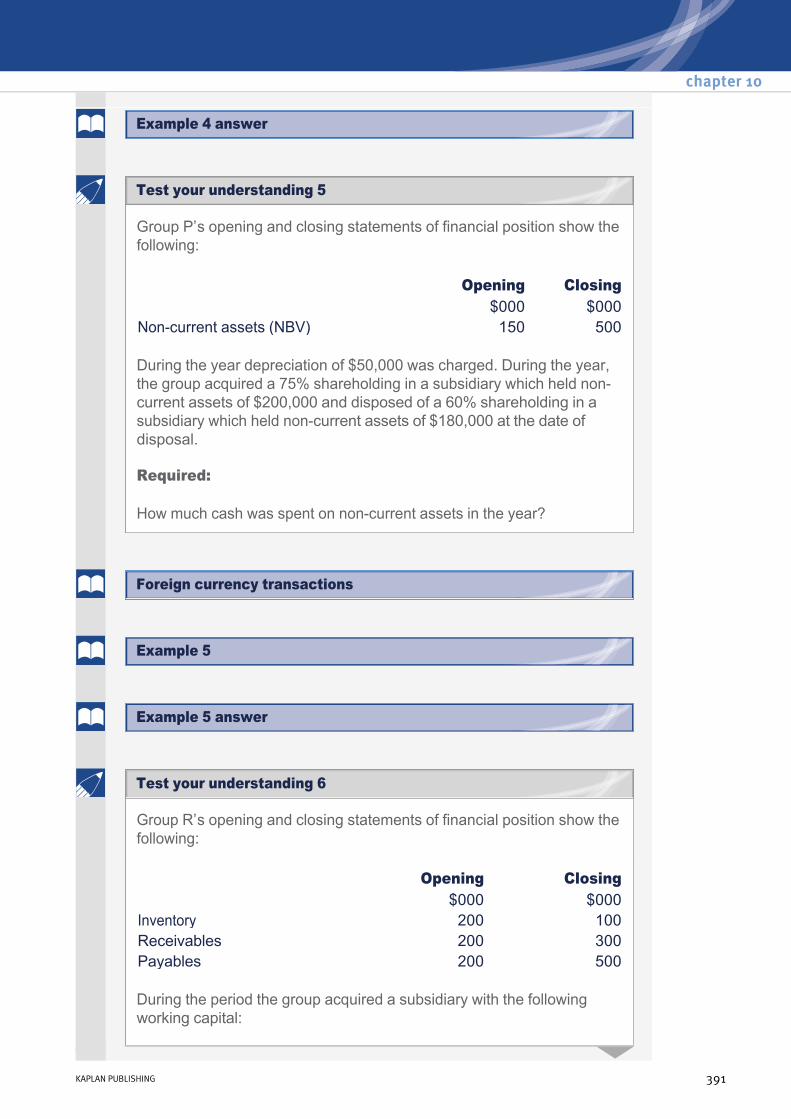
Group P’s opening and closing statements of financial position show the following:
During the year depreciation of $50,000 was charged. During the year, the group acquired a 75% shareholding in a subsidiary which held noncurrent assets of $200,000 and disposed of a 60% shareholding in a subsidiary which held noncurrent assets of $180,000 at the date of disposal.
Required:
How much cash was spent on noncurrent assets in the year?
Opening Closing $000 $000
Noncurrent assets (NBV) 150 500
Group R’s opening and closing statements of financial position show the following:
During the period the group acquired a subsidiary with the following working capital:
Opening Closing $000 $000
Inventory 200 100Receivables 200 300Payables 200 500
chapter 10
KAPLAN PUBLISHING 391
Test your understanding 5
Example 5
Foreign currency transactions
Example 4 answer
Example 5 answer
Test your understanding 6

During the period the group disposed of a subsidiary with the following working capital:
During the period the group experienced the following exchange rate gains/losses:
Required:
What are the cash flows for working capital?
$000Inventory 50Receivables 200Payables 40
$000Inventory 25Receivables 45Payables 20
$000 Inventory 11 GainReceivables 21 GainPayables 31 Loss
Group statement of cash flows
392 KAPLAN PUBLISHING
Example 6
Example 6 answer

The group financial statements of Linford are given below:
Consolidated income statement for the year ended
30 September 20X9
30 September 20X8
$m $mRevenue 600 500Cost of sales (300) (240) –––– –––– Gross profit 300 260Operating expenses (note 1) (150) (130) –––– –––– Group operating profit 150 130Investment income 6 15Finance costs (50) (45)Share of associate profit 17 17 –––– –––– Profit before tax 123 117Taxation (35) (25) –––– –––– Profit after tax 88 92Attributable to: Noncontrolling interests 10 6Parent shareholders 78 86
–––– –––– 88 92 –––– ––––
chapter 10
KAPLAN PUBLISHING 393
Test your understanding 7 Linford

Consolidated statements of financial position as at
30 Sept 20X9 30 Sept 20X8 $m $m $m $mNoncurrent assets Intangible assets (note 2) 25 19 Tangible assets (note 3) 240 280 Investments in associates 80 345 70 369 –––– –––– Current assets Inventory 105 90 Receivables 120 100 Investments 20 70 Cash in hand 10 5 –––– –––– 255 265 –––– –––– 600 634 –––– –––– Share capital 100 100 Retained earnings 194 142Non controlling interest 70 40
–––– –––– 364 282
Noncurrent liabilities Obligations under finance leases 80 7012% loan stock – 90Deferred taxation 30 24 –––– –––– 474 466Current liabilities Payables (note 4) 65 55 Taxation 10 8 Obligations under finance leases 25 20 Overdraft 26 85
––– ––– 126 168 –––– –––– 600 634 –––– ––––
Group statement of cash flows
394 KAPLAN PUBLISHING
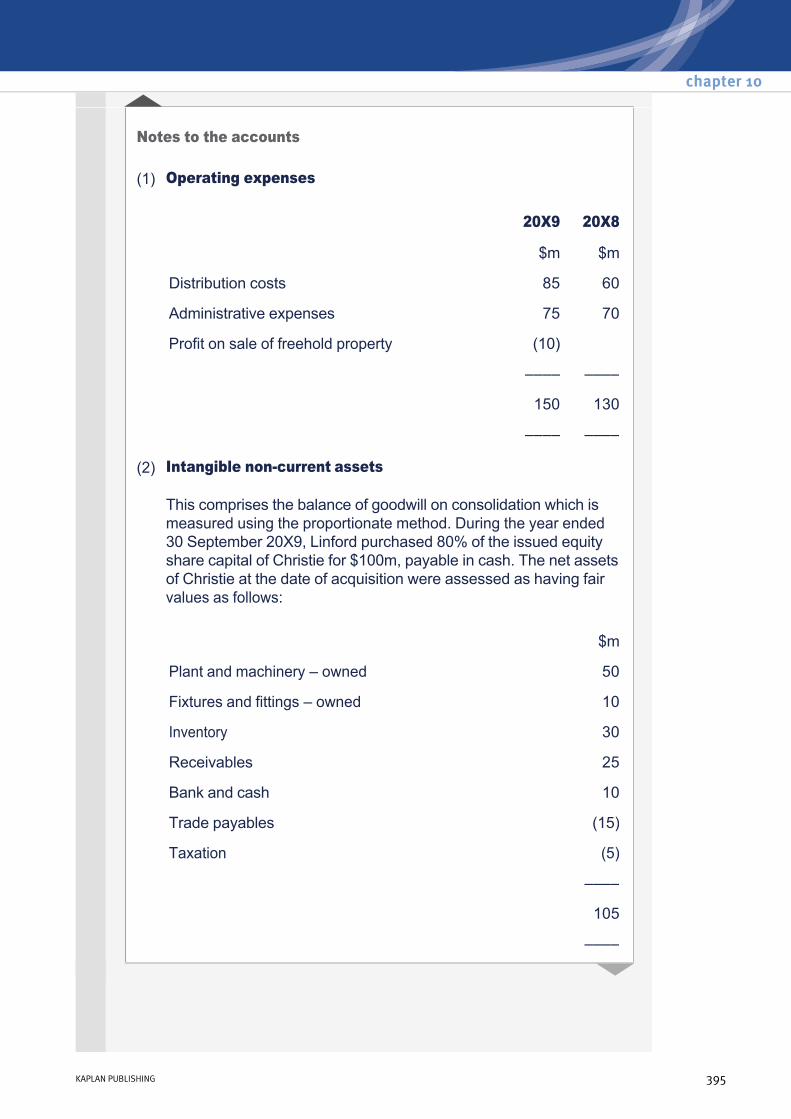
Notes to the accounts
(1) Operating expenses
20X9 20X8
$m $m
Distribution costs 85 60
Administrative expenses 75 70
Profit on sale of freehold property (10)
–––– ––––
150 130
–––– ––––
(2) Intangible noncurrent assets
This comprises the balance of goodwill on consolidation which is measured using the proportionate method. During the year ended 30 September 20X9, Linford purchased 80% of the issued equity share capital of Christie for $100m, payable in cash. The net assets of Christie at the date of acquisition were assessed as having fair values as follows:
$m
Plant and machinery – owned 50
Fixtures and fittings – owned 10
Inventory 30
Receivables 25
Bank and cash 10
Trade payables (15)
Taxation (5)
––––
105
––––
chapter 10
KAPLAN PUBLISHING 395

Required:
You are required to prepare the consolidated statement of cash flows for Linford for the year ended 30 September 20X9.
(3) Noncurrent tangible assets
During the year the group entered into new finance leases in respect of some items of plant and machinery. The amounts debited to noncurrent assets in respect of such agreements during the year totalled $40m. No disposals of plant and machinery (owned or leased) or fixtures and fittings took place during the year. Depreciation of tangible noncurrent assets for the year totalled $58m.
30 Sept 20X9
30 Sept 20X8
$m $m
Freehold land and buildings − 90
Plant and machinery – owned 130 100
Plant and machinery – leased 90 70
Fixtures and fittings – owned 20 20
–––– ––––
240 280
–––– ––––
(4) Payables
Payables at 30 September 20X9 and the 30 September 20X8 do not include any accrued interest.
(5) Dividends
Dividends paid to shareholders of Linford in the current year totalled $26m.
Group statement of cash flows
396 KAPLAN PUBLISHING
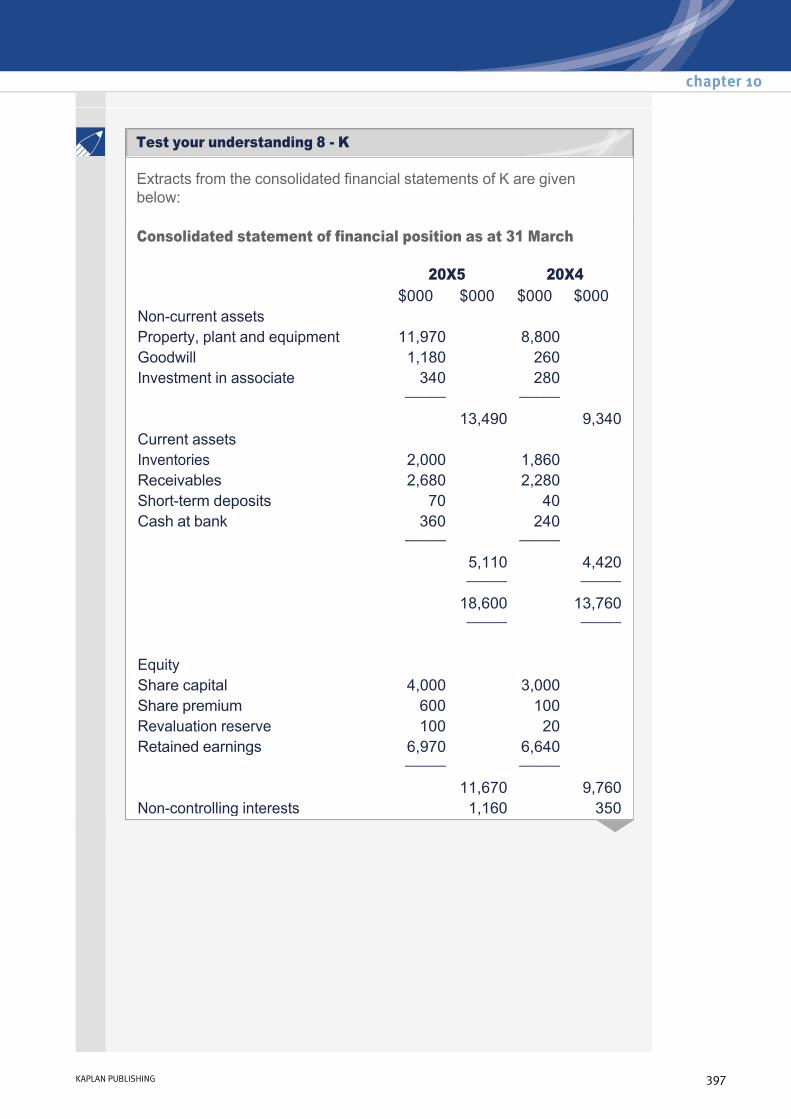
Extracts from the consolidated financial statements of K are given below:
Consolidated statement of financial position as at 31 March
20X5 20X4 $000 $000 $000 $000
Noncurrent assets Property, plant and equipment 11,970 8,800 Goodwill 1,180 260 Investment in associate 340 280 –––––– –––––– 13,490 9,340Current assets Inventories 2,000 1,860 Receivables 2,680 2,280 Shortterm deposits 70 40 Cash at bank 360 240 –––––– –––––– 5,110 4,420 –––––– –––––– 18,600 13,760 –––––– –––––– Equity Share capital 4,000 3,000 Share premium 600 100 Revaluation reserve 100 20 Retained earnings 6,970 6,640 –––––– –––––– 11,670 9,760Noncontrolling interests 1,160 350
chapter 10
KAPLAN PUBLISHING 397
Test your understanding 8 K
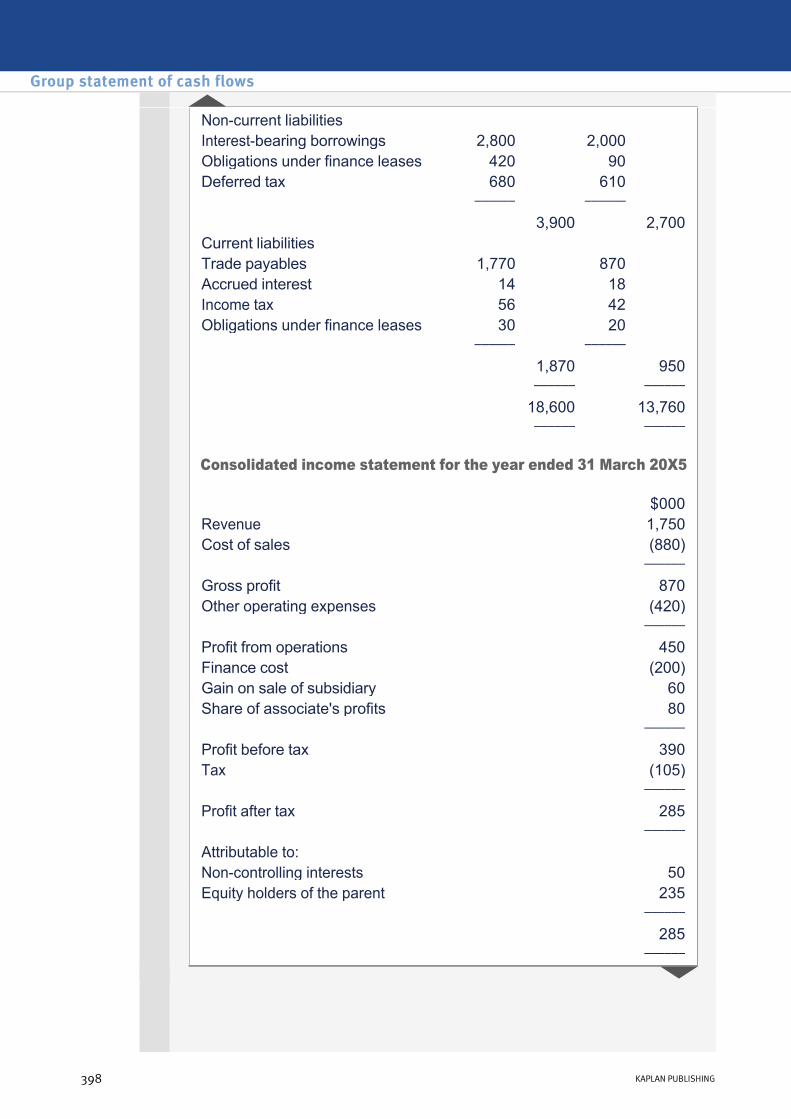
Consolidated income statement for the year ended 31 March 20X5
Noncurrent liabilities Interestbearing borrowings 2,800 2,000 Obligations under finance leases 420 90 Deferred tax 680 610 –––––– –––––– 3,900 2,700Current liabilities Trade payables 1,770 870 Accrued interest 14 18 Income tax 56 42 Obligations under finance leases 30 20 –––––– –––––– 1,870 950 –––––– –––––– 18,600 13,760
–––––– ––––––
$000Revenue 1,750Cost of sales (880) –––––– Gross profit 870Other operating expenses (420) –––––– Profit from operations 450Finance cost (200)Gain on sale of subsidiary 60Share of associate's profits 80 –––––– Profit before tax 390Tax (105) –––––– Profit after tax 285
–––––– Attributable to: Noncontrolling interests 50Equity holders of the parent 235 –––––– 285 ––––––
Group statement of cash flows
398 KAPLAN PUBLISHING

Notes:
Property, plant and equipment
The following transactions took place during the year:
Acquisition of subsidiary
On 1 September 20X4, K acquired 60% of the share capital of S for $3.5 million, payable in cash. The NCI holding was measured at its fair value of $2 million at acquisition. The net assets of S at the date of acquisition had fair values as follows:
Gain on sale of subsidiary
On 1 January 20X5, K disposed of an 80% owned subsidiary for $780,000 in cash.
• Land was revalued upwards by $80,000 on 1 April 20X4. None of this revaluation gain was attributable to minority interest shareholders.
• During the year depreciation of $160,000 was charged in the income statement.
• Additions includes $600,000 acquired under finance leases.
• A property was disposed of during the year for $500,000 cash. It had a carrying value of $590,000 at the date of disposal. The loss on disposal has been included within cost of sales.
$000Tangible noncurrent assets 3,700Inventory 450Receivables 370Cash and cash equivalents 60Trade payables (315)Taxation (40) –––––– 4,225 ––––––
chapter 10
KAPLAN PUBLISHING 399

The subsidiary had the following net assets at the date of disposal:
This subsidiary had been acquired on 1 January 20X1 for a cash payment of $440,000 when its net assets had a fair value of $450,000. Goodwill relating to this subsidiary is measured on a proportionate basis and had not been impaired since acquisition.
Foreign exchange
K holds a 75% shareholding in a foreign subsidiary, resulting in a foreign exchange gain of $170,000 being recorded in group retained earnings in the year. This was made up as follows:
$000Property, Plant and Equipment 1,270Inventory 40Receivables 90Cash 70Payables (260)Income tax (10)Interestbearing borrowings (400) –––––– 800 ––––––
Parent share
holders
NCI share
holders
Total
$000 $000 $000Opening net assets Property, plant and equipment 90 30 120Inventory 18 6 24Receivables 12 4 16Payables (15) (5) (20)Profit for the year 42 14 56Goodwill 23 – 23
––––– –––– –––– 170 49 219 ––––– –––– ––––
Group statement of cash flows
400 KAPLAN PUBLISHING
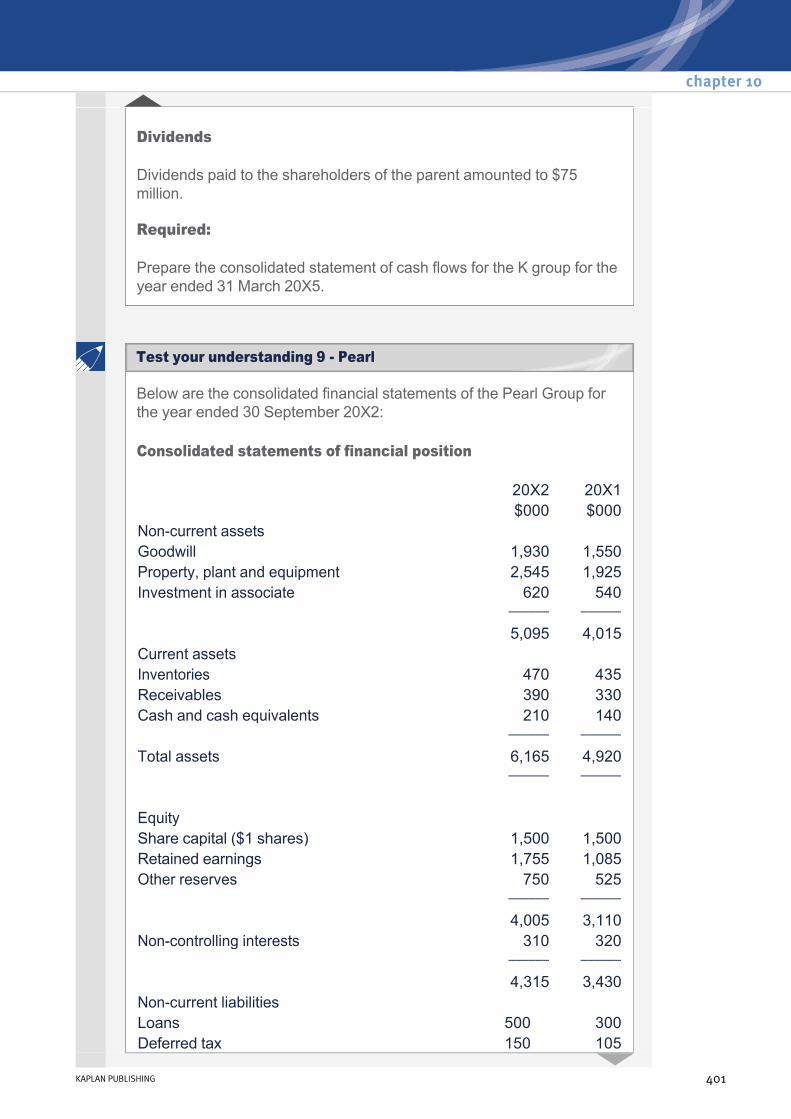
Dividends
Dividends paid to the shareholders of the parent amounted to $75 million.
Required:
Prepare the consolidated statement of cash flows for the K group for the year ended 31 March 20X5.
Below are the consolidated financial statements of the Pearl Group for the year ended 30 September 20X2:
Consolidated statements of financial position
20X2 20X1 $000 $000
Noncurrent assets Goodwill 1,930 1,550Property, plant and equipment 2,545 1,925Investment in associate 620 540 –––––– –––––– 5,095 4,015Current assets Inventories 470 435Receivables 390 330Cash and cash equivalents 210 140 –––––– –––––– Total assets 6,165 4,920 –––––– –––––– Equity Share capital ($1 shares) 1,500 1,500Retained earnings 1,755 1,085Other reserves 750 525 –––––– –––––– 4,005 3,110Noncontrolling interests 310 320 –––––– –––––– 4,315 3,430Noncurrent liabilities Loans 500 300Deferred tax 150 105
chapter 10
KAPLAN PUBLISHING 401
Test your understanding 9 Pearl
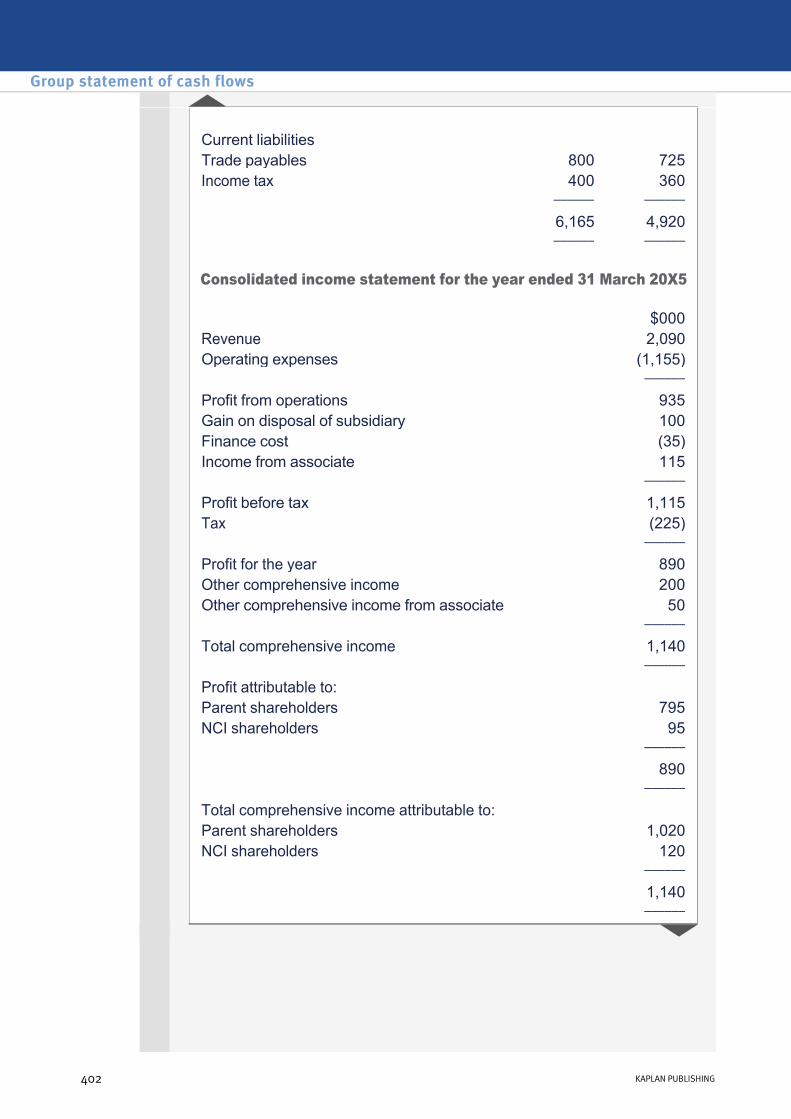
Consolidated income statement for the year ended 31 March 20X5
Current liabilities Trade payables 800 725Income tax 400 360 –––––– –––––– 6,165 4,920
–––––– ––––––
$000Revenue 2,090Operating expenses (1,155) –––––– Profit from operations 935Gain on disposal of subsidiary 100Finance cost (35)Income from associate 115 –––––– Profit before tax 1,115Tax (225) –––––– Profit for the year 890Other comprehensive income 200Other comprehensive income from associate 50 –––––– Total comprehensive income 1,140
–––––– Profit attributable to: Parent shareholders 795NCI shareholders 95 –––––– 890 –––––– Total comprehensive income attributable to: Parent shareholders 1,020NCI shareholders 120 –––––– 1,140 ––––––
Group statement of cash flows
402 KAPLAN PUBLISHING
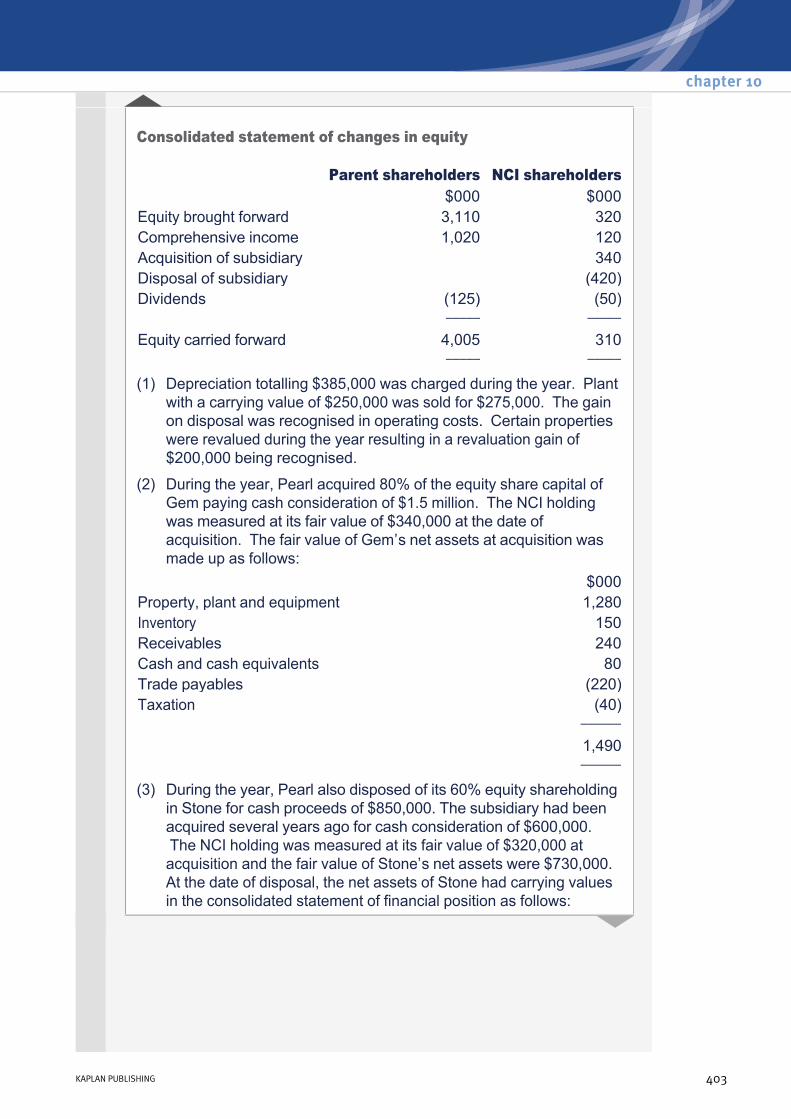
Consolidated statement of changes in equity
Parent shareholders NCI shareholders $000 $000
Equity brought forward 3,110 320Comprehensive income 1,020 120Acquisition of subsidiary 340Disposal of subsidiary (420)Dividends (125) (50) ––––– ––––– Equity carried forward 4,005 310
––––– ––––– (1) Depreciation totalling $385,000 was charged during the year. Plant
with a carrying value of $250,000 was sold for $275,000. The gain on disposal was recognised in operating costs. Certain properties were revalued during the year resulting in a revaluation gain of $200,000 being recognised.
(2) During the year, Pearl acquired 80% of the equity share capital of Gem paying cash consideration of $1.5 million. The NCI holding was measured at its fair value of $340,000 at the date of acquisition. The fair value of Gem’s net assets at acquisition was made up as follows:
$000Property, plant and equipment 1,280Inventory 150Receivables 240Cash and cash equivalents 80Trade payables (220)Taxation (40) –––––– 1,490 –––––– (3) During the year, Pearl also disposed of its 60% equity shareholding
in Stone for cash proceeds of $850,000. The subsidiary had been acquired several years ago for cash consideration of $600,000. The NCI holding was measured at its fair value of $320,000 at acquisition and the fair value of Stone’s net assets were $730,000. At the date of disposal, the net assets of Stone had carrying values in the consolidated statement of financial position as follows:
chapter 10
KAPLAN PUBLISHING 403

Required:
Prepare the consolidated statement of cash flows for the Pearl group for the year ended 30 September 20X2.
$000Property, Plant and Equipment 725Inventory 165Receivables 120Cash and cash equivalents 50Trade payables (80) –––––– 980 ––––––
Group statement of cash flows
404 KAPLAN PUBLISHING
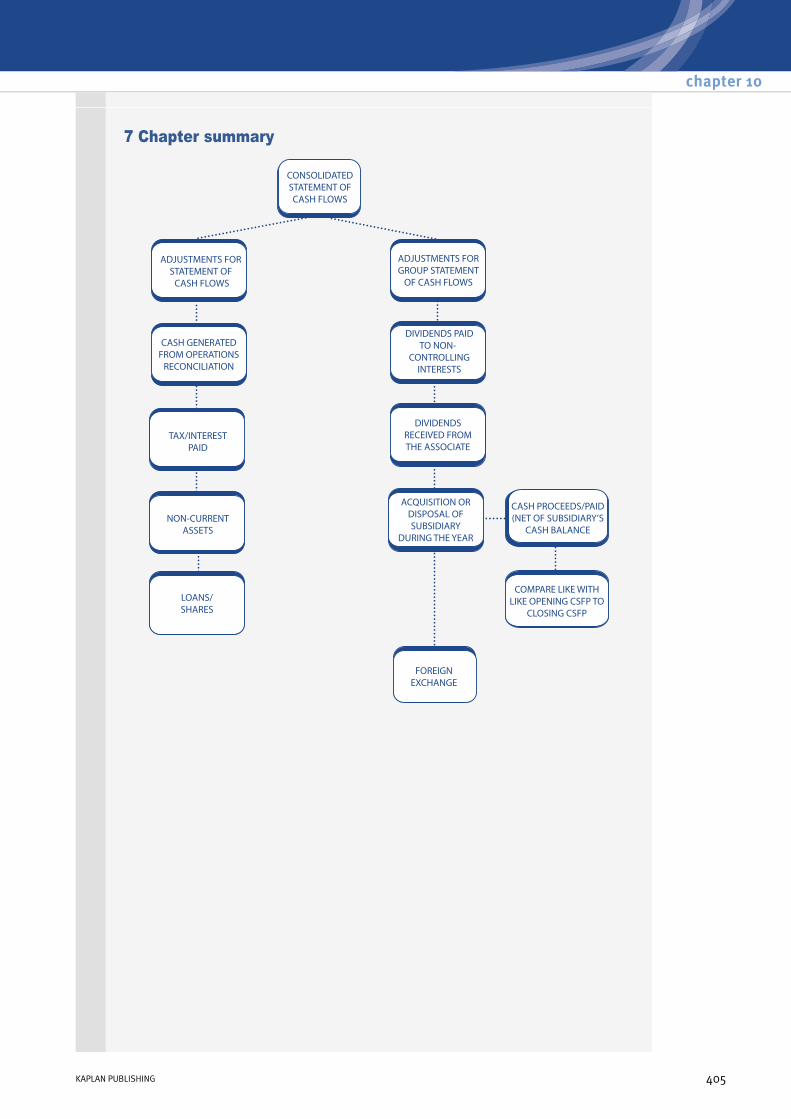
7 Chapter summary
chapter 10
KAPLAN PUBLISHING 405
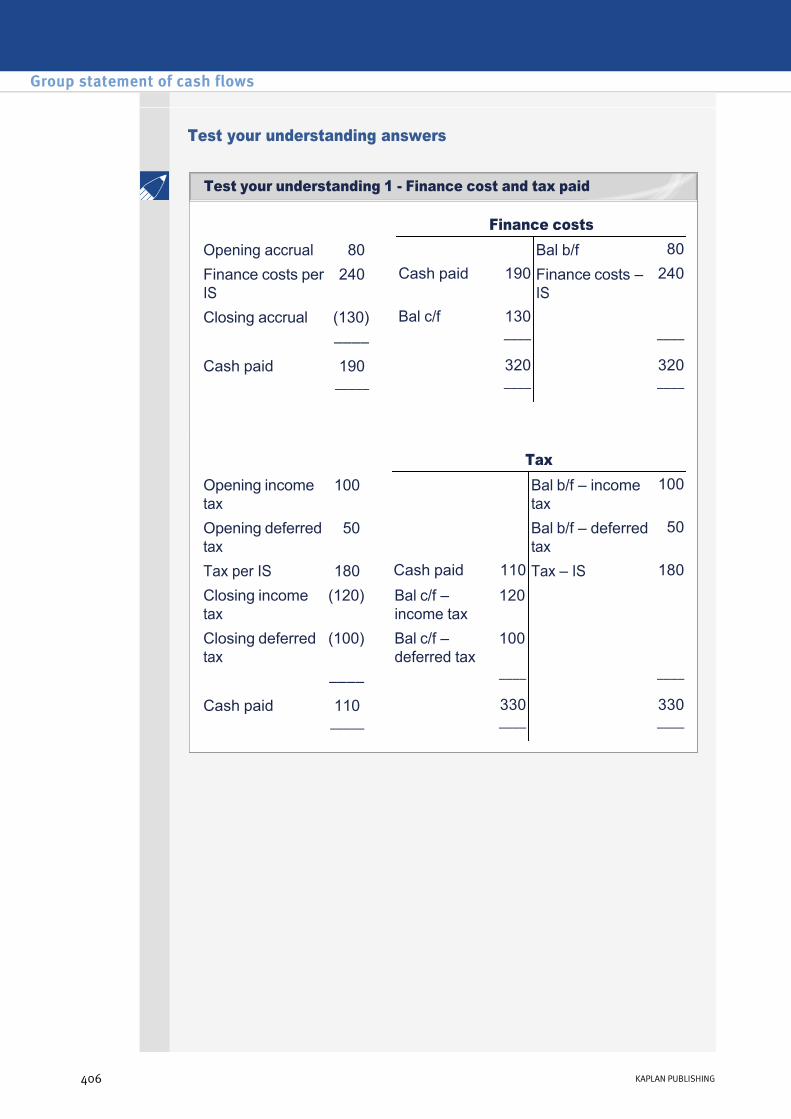
Test your understanding answers
Finance costs Opening accrual 80 Bal b/f 80Finance costs per IS
240 Cash paid 190 Finance costs – IS
240
Closing accrual (130) Bal c/f 130 –––– –––– ––––
Cash paid 190 320 320 ––––– –––– ––––
Tax Opening income tax
100 Bal b/f – income tax
100
Opening deferred tax
50 Bal b/f – deferred tax
50
Tax per IS 180 Cash paid 110 Tax – IS 180Closing income tax
(120) Bal c/f – income tax
120
Closing deferred tax
(100) Bal c/f – deferred tax
100
–––– –––– ––––
Cash paid 110 330 330 ––––– –––– ––––
Group statement of cash flows
406 KAPLAN PUBLISHING
Test your understanding 1 Finance cost and tax paid
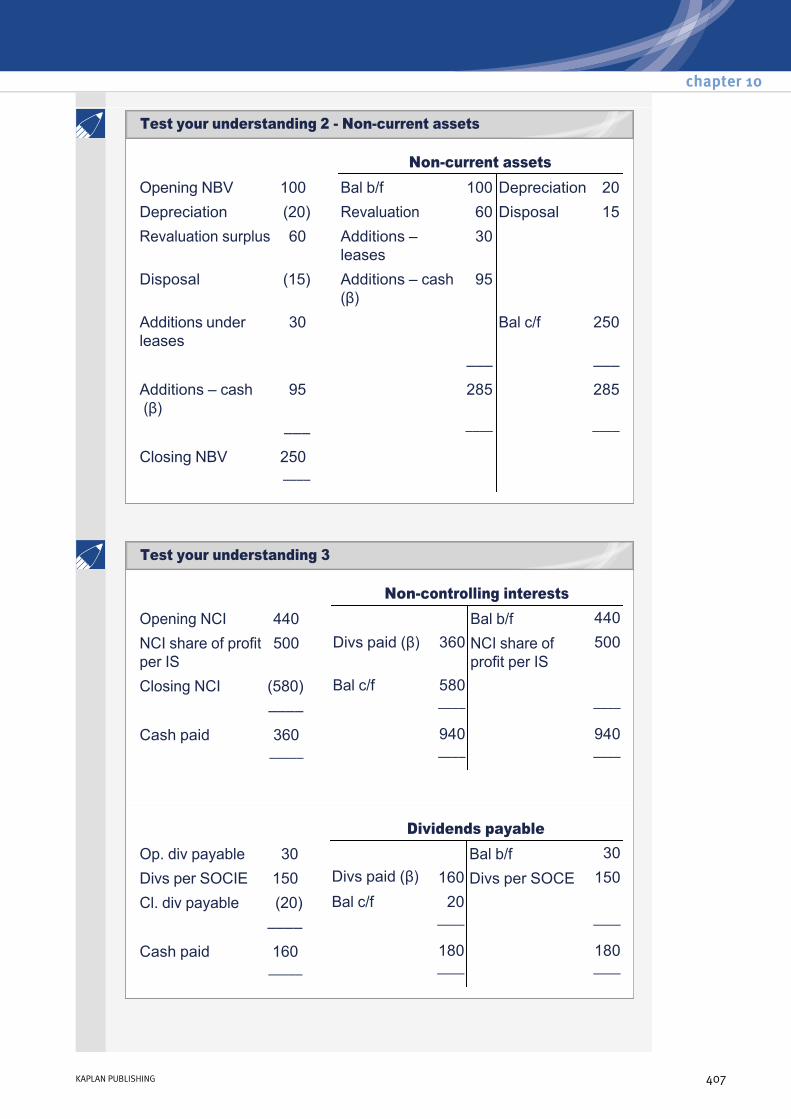
Noncurrent assets Opening NBV 100 Bal b/f 100 Depreciation 20Depreciation (20) Revaluation 60 Disposal 15Revaluation surplus 60 Additions –
leases30
Disposal (15) Additions – cash (β)
95
Additions under leases
30 Bal c/f 250
––– ––– Additions – cash (β)
95 285 285
––– –––– ––––
Closing NBV 250 ––––
Noncontrolling interests Opening NCI 440 Bal b/f 440NCI share of profit per IS
500 Divs paid (β) 360 NCI share of profit per IS
500
Closing NCI (580) Bal c/f 580 –––– –––– ––––
Cash paid 360 940 940 ––––– –––– ––––
Dividends payable Op. div payable 30 Bal b/f 30Divs per SOCIE 150 Divs paid (β) 160 Divs per SOCE 150Cl. div payable (20) Bal c/f 20 –––– –––– ––––
Cash paid 160 180 180 ––––– –––– ––––
chapter 10
KAPLAN PUBLISHING 407
Test your understanding 2 Noncurrent assets
Test your understanding 3
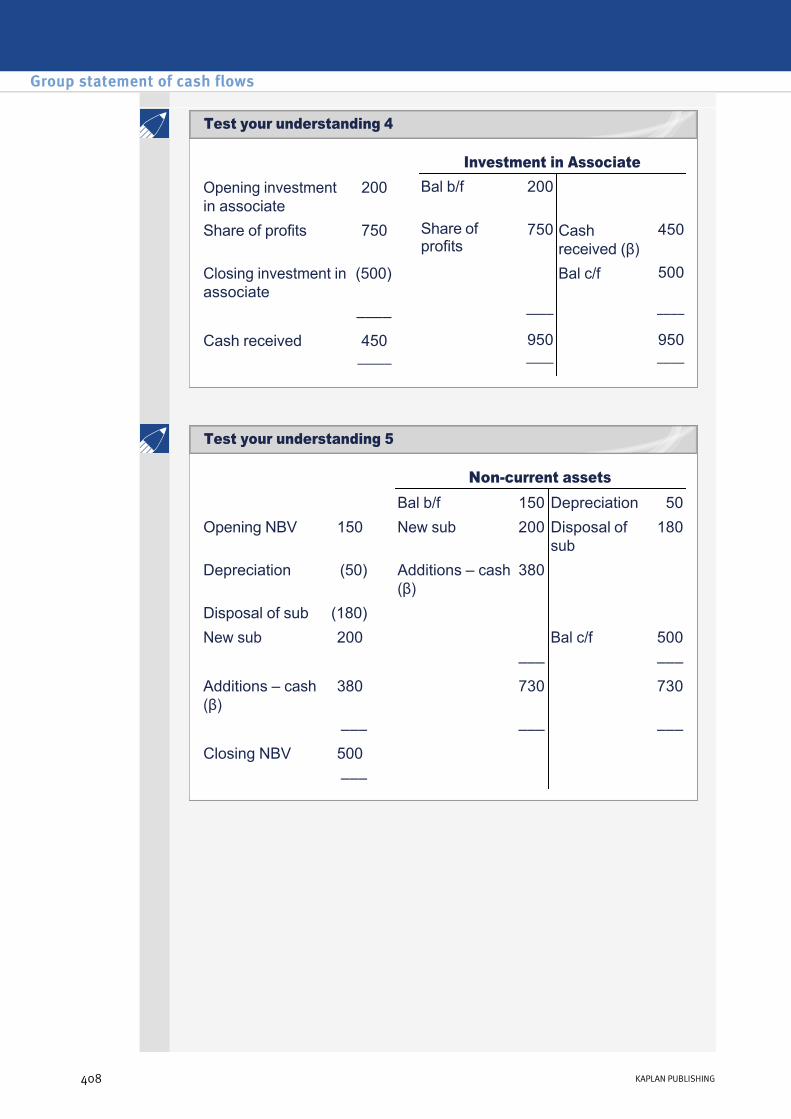
Investment in Associate Opening investment in associate
200 Bal b/f 200
Share of profits 750 Share of profits
750 Cash received (β)
450
Closing investment in associate
(500) Bal c/f 500
–––– –––– ––––
Cash received 450 950 950 ––––– –––– ––––
Noncurrent assets Bal b/f 150 Depreciation 50
Opening NBV 150 New sub 200 Disposal of sub
180
Depreciation (50) Additions – cash (β)
380
Disposal of sub (180) New sub 200 Bal c/f 500 ––– ––– Additions – cash (β)
380 730 730
––– ––– ––– Closing NBV 500 –––
Group statement of cash flows
408 KAPLAN PUBLISHING
Test your understanding 5
Test your understanding 4
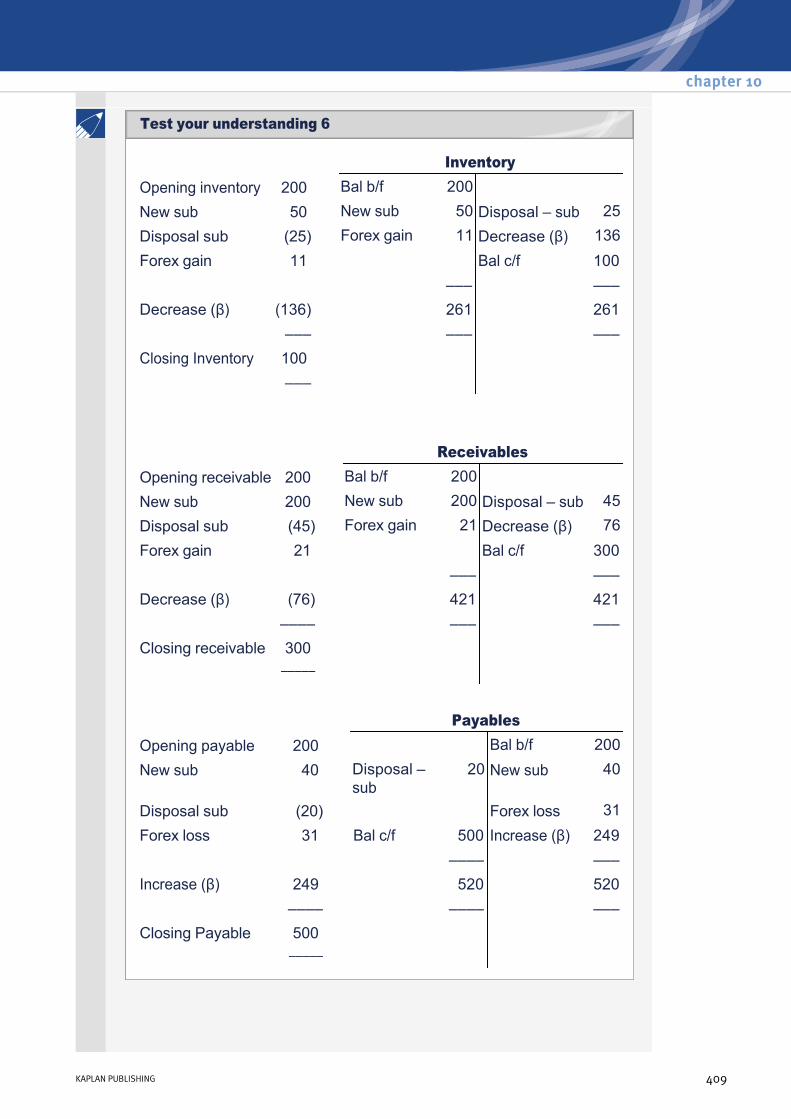
Inventory Opening inventory 200 Bal b/f 200 New sub 50 New sub 50 Disposal – sub 25Disposal sub (25) Forex gain 11 Decrease (β) 136Forex gain 11 Bal c/f 100 ––– ––– Decrease (β) (136) 261 261 ––– ––– ––– Closing Inventory 100 –––
Receivables Opening receivable 200 Bal b/f 200 New sub 200 New sub 200 Disposal – sub 45Disposal sub (45) Forex gain 21 Decrease (β) 76Forex gain 21 Bal c/f 300 ––– ––– Decrease (β) (76) 421 421 –––– ––– ––– Closing receivable 300 –––––
Payables Opening payable 200 Bal b/f 200New sub 40 Disposal –
sub20 New sub 40
Disposal sub (20) Forex loss 31Forex loss 31 Bal c/f 500 Increase (β) 249 –––– ––– Increase (β) 249 520 520 –––– –––– ––– Closing Payable 500 –––––
chapter 10
KAPLAN PUBLISHING 409
Test your understanding 6
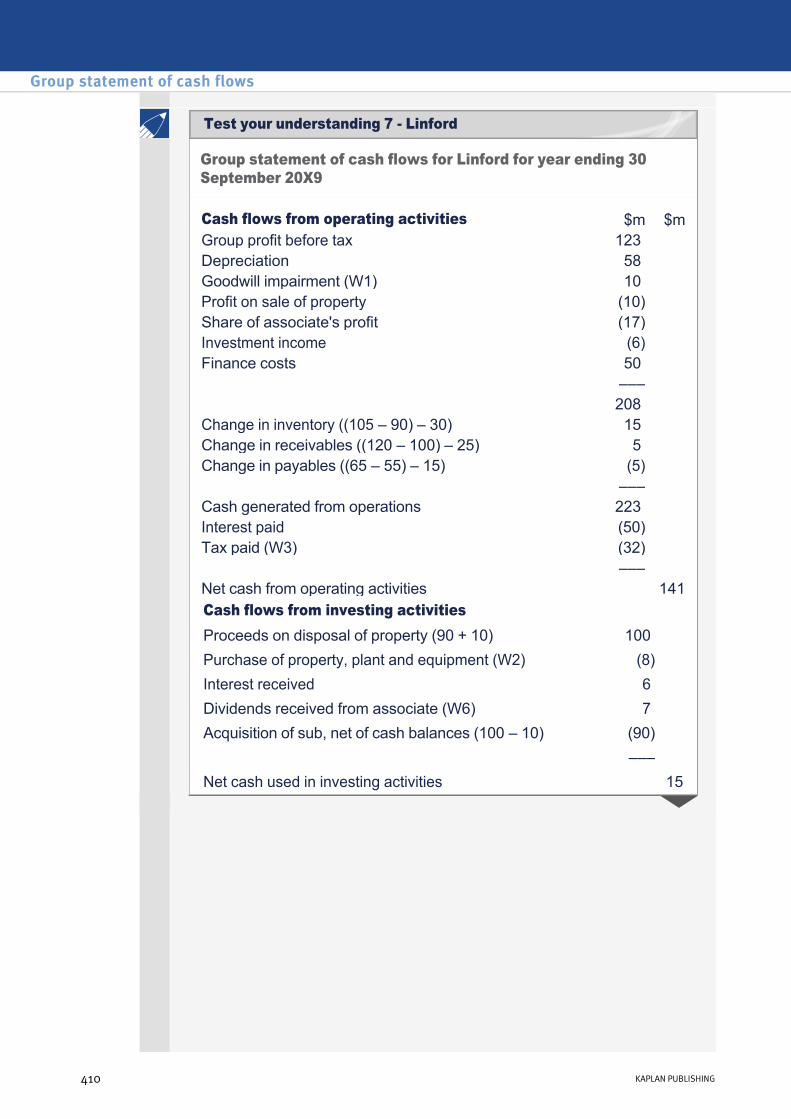
Group statement of cash flows for Linford for year ending 30 September 20X9
Cash flows from operating activities $m $mGroup profit before tax 123 Depreciation 58 Goodwill impairment (W1) 10 Profit on sale of property (10) Share of associate's profit (17) Investment income (6) Finance costs 50 ––– 208 Change in inventory ((105 – 90) – 30) 15 Change in receivables ((120 – 100) – 25) 5 Change in payables ((65 – 55) – 15) (5) ––– Cash generated from operations 223 Interest paid (50) Tax paid (W3) (32) ––– Net cash from operating activities 141Cash flows from investing activities Proceeds on disposal of property (90 + 10) 100 Purchase of property, plant and equipment (W2) (8) Interest received 6 Dividends received from associate (W6) 7 Acquisition of sub, net of cash balances (100 – 10) (90) ––– Net cash used in investing activities 15
Group statement of cash flows
410 KAPLAN PUBLISHING
Test your understanding 7 Linford

Workings
Goodwill of acquired sub:
Cash flows from financing activities Repayment of loan – 12% loan stock (90) Repayment of capital element of finance leases (W4) (25) Dividends paid to NCI (W5) (1) Dividends paid to parent shareholders (26) (142) ––– –––– Increase in cash and cash equivalents 14 Brought forward cash and cash equivalents (70 + 5 – 85) (10) ––– Carried forward cash and cash equivalents (20 + 10 – 26) 4 –––
(W1) Goodwill B/f 19 Impairment (balance) 10 Acquisition of
subsidiary16 C/f 25
––– ––– 35 35 ––– –––
$mFair value of P's holding (cost of investment) 100NCI holding at proportion of net assets (20% x 105)
21
Fair value of sub's net assets at acquisition (105) _____Goodwill at acquisition 16 _____
chapter 10
KAPLAN PUBLISHING 411
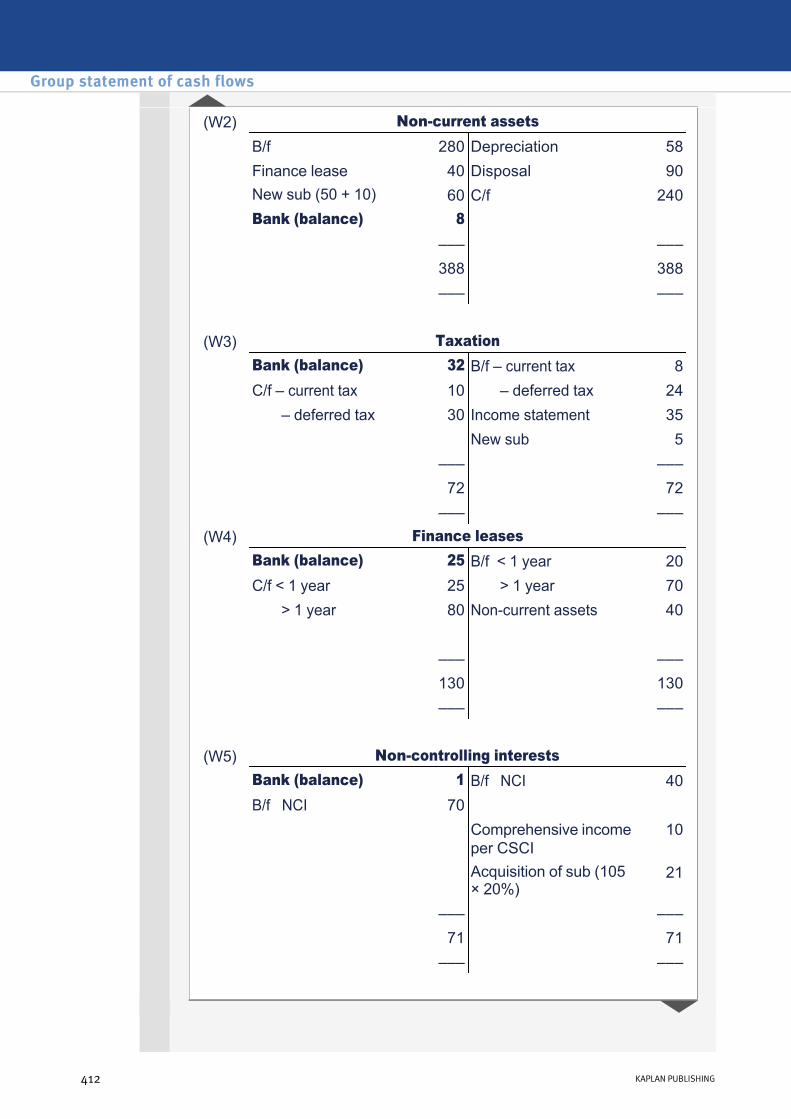
(W2) Noncurrent assets B/f 280 Depreciation 58 Finance lease 40 Disposal 90 New sub (50 + 10) 60 C/f 240 Bank (balance) 8 ––– ––– 388 388 ––– ––– (W3) Taxation Bank (balance) 32 B/f – current tax 8 C/f – current tax 10 – deferred tax 24 – deferred tax 30 Income statement 35 New sub 5 ––– ––– 72 72 ––– ––– (W4) Finance leases Bank (balance) 25 B/f < 1 year 20 C/f < 1 year 25 > 1 year 70 > 1 year 80 Noncurrent assets 40 ––– ––– 130 130 ––– ––– (W5) Noncontrolling interests Bank (balance) 1 B/f NCI 40 B/f NCI 70 Comprehensive income
per CSCI10
Acquisition of sub (105 × 20%)
21
––– ––– 71 71 ––– –––
Group statement of cash flows
412 KAPLAN PUBLISHING
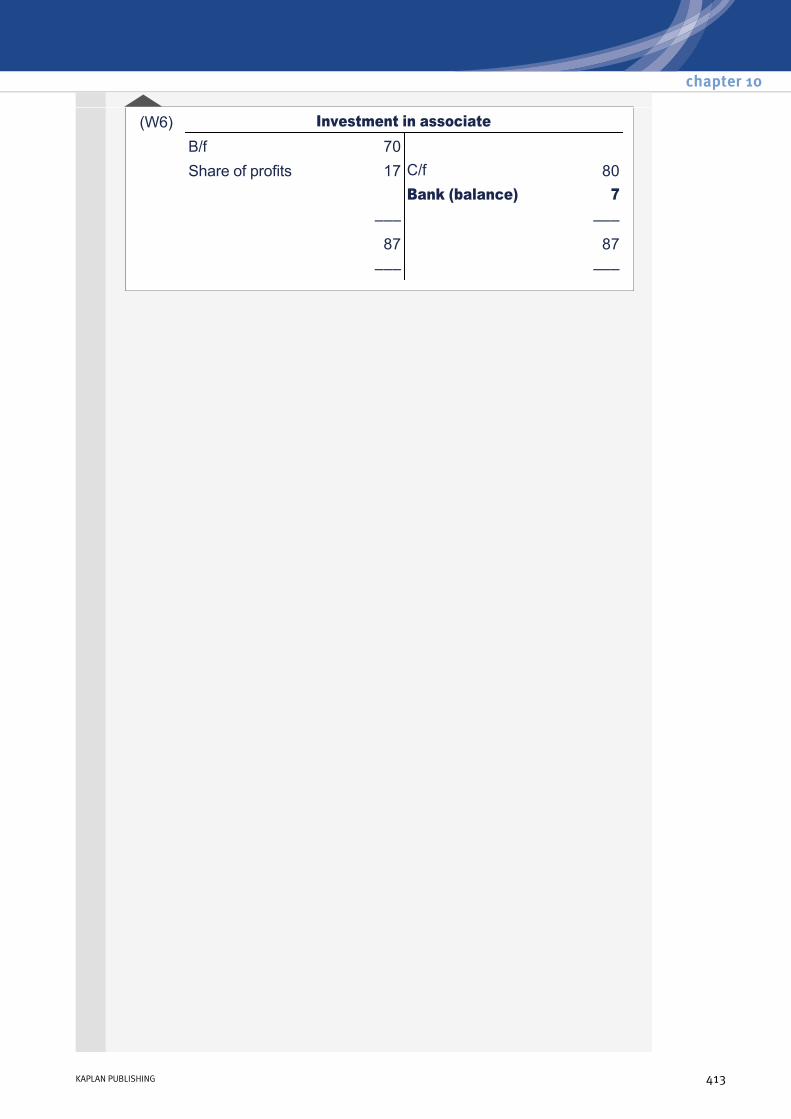
(W6) Investment in associate B/f 70 Share of profits 17 C/f 80 Bank (balance) 7 ––– ––– 87 87 ––– –––
chapter 10
KAPLAN PUBLISHING 413
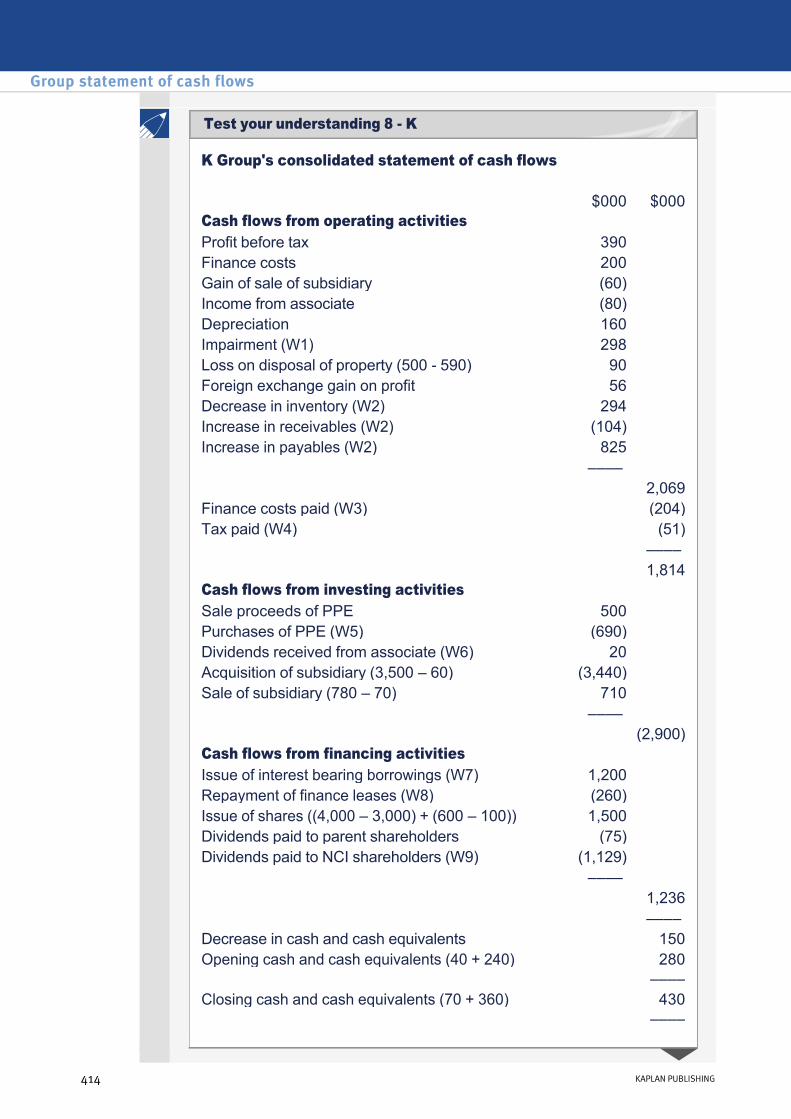
K Group's consolidated statement of cash flows $000 $000Cash flows from operating activities Profit before tax 390 Finance costs 200 Gain of sale of subsidiary (60) Income from associate (80) Depreciation 160 Impairment (W1) 298 Loss on disposal of property (500 590) 90 Foreign exchange gain on profit 56 Decrease in inventory (W2) 294 Increase in receivables (W2) (104) Increase in payables (W2) 825 –––– 2,069Finance costs paid (W3) (204)Tax paid (W4) (51) –––– 1,814Cash flows from investing activities Sale proceeds of PPE 500 Purchases of PPE (W5) (690) Dividends received from associate (W6) 20 Acquisition of subsidiary (3,500 – 60) (3,440) Sale of subsidiary (780 – 70) 710 –––– (2,900)Cash flows from financing activities Issue of interest bearing borrowings (W7) 1,200 Repayment of finance leases (W8) (260) Issue of shares ((4,000 – 3,000) + (600 – 100)) 1,500 Dividends paid to parent shareholders (75) Dividends paid to NCI shareholders (W9) (1,129) –––– 1,236 –––– Decrease in cash and cash equivalents 150Opening cash and cash equivalents (40 + 240) 280 ––––Closing cash and cash equivalents (70 + 360) 430 ––––
Group statement of cash flows
414 KAPLAN PUBLISHING
Test your understanding 8 K

Workings
Goodwill of acquired sub:
(W1) Goodwill
Or
$000Bal b/f 260 Acquisition of sub (W) 1,275 Disposal of sub (W) (80)Foreign exchange gain 23 ––––– 1,478 Impairment (balance) (298) ––––– Bal c/f 1,180 –––––
Goodwill Bal b/f 260 Acq’n of sub (W) 1,275 Disposal of sub (W) 80Foreign exchange 23 Impairment – balance 298
Bal c/f 1,180 –––– –––– 1,558 1,558 –––– ––––
$000Fair value of P's holding (cost of investment) 3,500NCI holding at fair value 2,000Fair value of sub's net assets at acquisition (4,225) _____Goodwill at acquisition/ disposal 1,275 _____
chapter 10
KAPLAN PUBLISHING 415

Goodwill of disposed sub:
$000Fair value of P's holding (cost of investment) 440NCI holding at proportion of net assets (20% x 450)
90
Fair value of sub's net assets at acquisition (450) _____Goodwill at acquisition/ disposal 80 _____
(W2) Working capital
Inventory Receivables Payables $000 $000 $000
Bal b/f 1,860 2,280 870 Acquisition of subsidiary 450 370 315 Disposal of subsidiary (40) (90) (260)Foreign exchange 24 16 20 –––––– –––––– –––––– 2,294 2,576 945 Increase/(Decrease) (294) 104 825 –––––– –––––– –––––– Bal c/f 2,000 2,680 1,770
–––––– –––––– ––––––
(W3) Finance costs
Or
$000Bal b/f 18Income statement 200 –––––– 218Cash (balance) (204) –––––– Bal c/f 14 ––––––
Group statement of cash flows
416 KAPLAN PUBLISHING
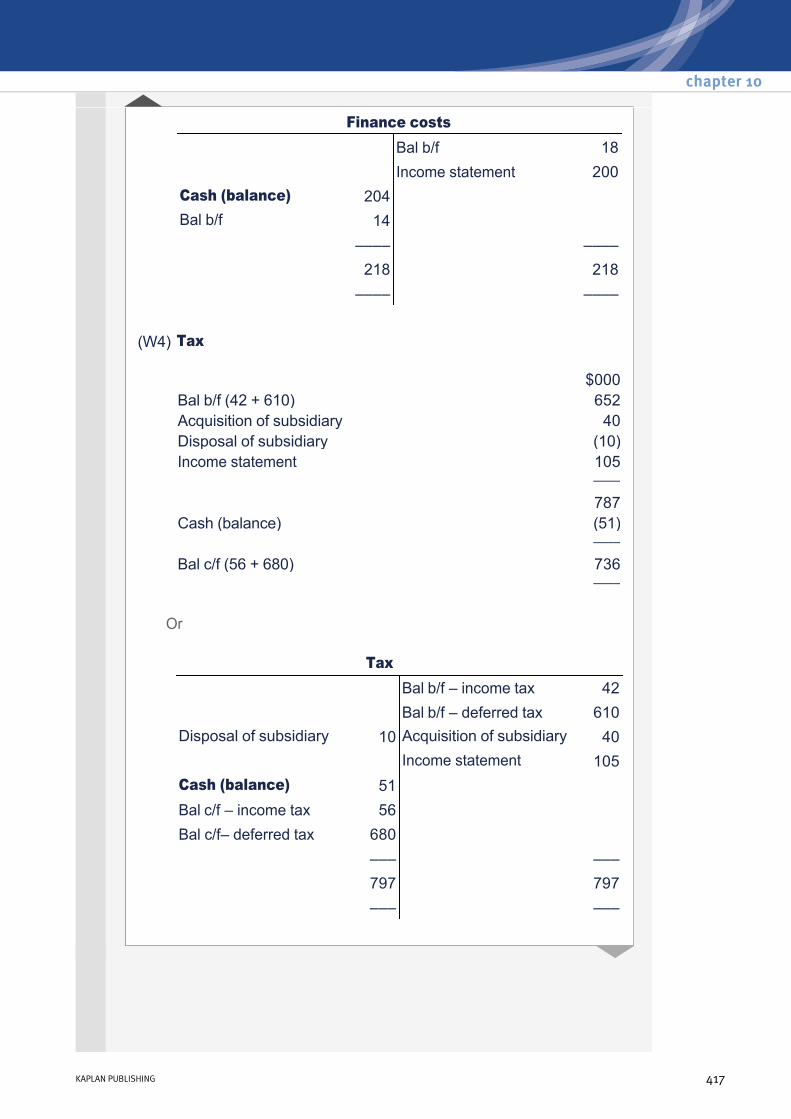
Or
Finance costs Bal b/f 18 Income statement 200
Cash (balance) 204 Bal b/f 14 –––– –––– 218 218 –––– ––––
(W4) Tax
$000Bal b/f (42 + 610) 652Acquisition of subsidiary 40Disposal of subsidiary (10)Income statement 105 –––– 787Cash (balance) (51) –––– Bal c/f (56 + 680) 736 ––––
Tax Bal b/f – income tax 42
Bal b/f – deferred tax 610Disposal of subsidiary 10 Acquisition of subsidiary 40 Income statement 105Cash (balance) 51 Bal c/f – income tax 56 Bal c/f– deferred tax 680
––– ––– 797 797 ––– –––
chapter 10
KAPLAN PUBLISHING 417
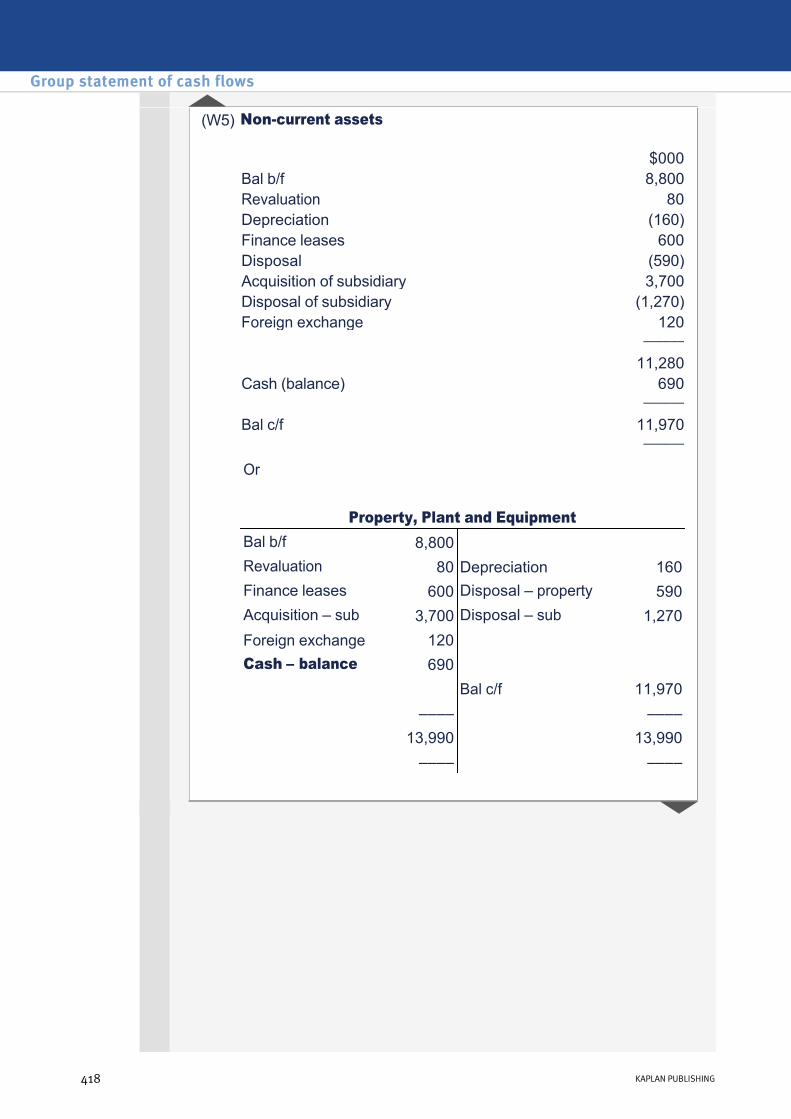
(W5) Noncurrent assets
$000Bal b/f 8,800Revaluation 80Depreciation (160)Finance leases 600Disposal (590)Acquisition of subsidiary 3,700Disposal of subsidiary (1,270)Foreign exchange 120 –––––– 11,280Cash (balance) 690 –––––– Bal c/f 11,970 –––––– Or
Property, Plant and Equipment Bal b/f 8,800 Revaluation 80 Depreciation 160Finance leases 600 Disposal – property 590Acquisition – sub 3,700 Disposal – sub 1,270Foreign exchange 120 Cash – balance 690
Bal c/f 11,970 –––– –––– 13,990 13,990 –––– ––––
Group statement of cash flows
418 KAPLAN PUBLISHING
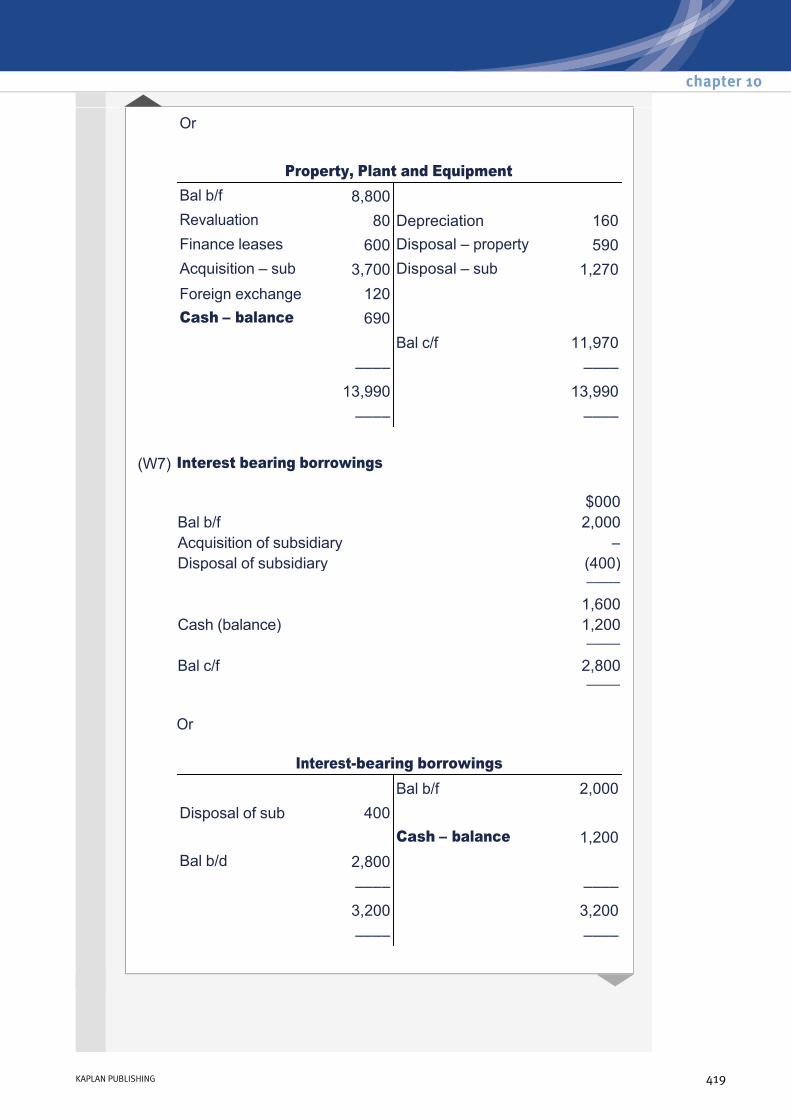
Or
Property, Plant and Equipment Bal b/f 8,800 Revaluation 80 Depreciation 160Finance leases 600 Disposal – property 590Acquisition – sub 3,700 Disposal – sub 1,270Foreign exchange 120 Cash – balance 690
Bal c/f 11,970 –––– –––– 13,990 13,990 –––– ––––
(W7) Interest bearing borrowings
Or
$000Bal b/f 2,000Acquisition of subsidiary – Disposal of subsidiary (400) ––––– 1,600Cash (balance) 1,200 ––––– Bal c/f 2,800
–––––
Interestbearing borrowings Bal b/f 2,000
Disposal of sub 400 Cash – balance 1,200
Bal b/d 2,800 –––– –––– 3,200 3,200 –––– ––––
chapter 10
KAPLAN PUBLISHING 419
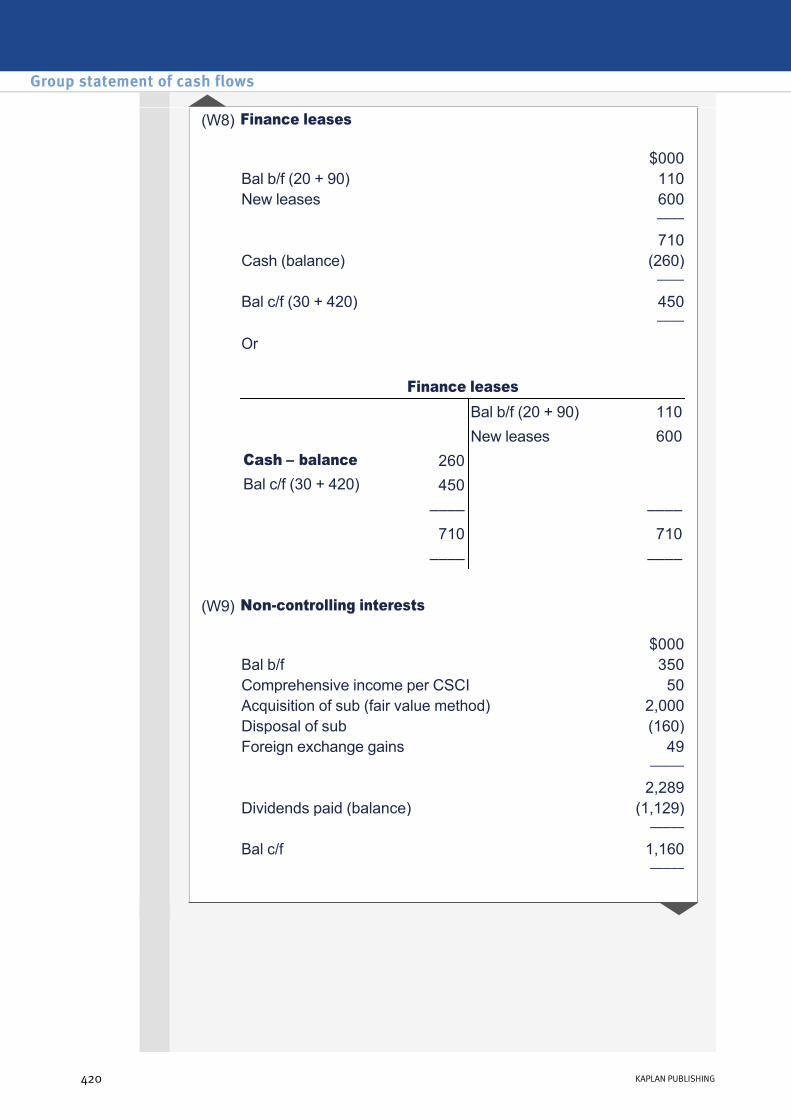
(W8) Finance leases
$000Bal b/f (20 + 90) 110New leases 600 –––– 710Cash (balance) (260) –––– Bal c/f (30 + 420) 450
–––– Or
Finance leases
Bal b/f (20 + 90) 110 New leases 600
Cash – balance 260 Bal c/f (30 + 420) 450 –––– –––– 710 710 –––– ––––
(W9) Noncontrolling interests
$000Bal b/f 350Comprehensive income per CSCI 50Acquisition of sub (fair value method) 2,000Disposal of sub (160)Foreign exchange gains 49 ––––– 2,289Dividends paid (balance) (1,129) ––––– Bal c/f 1,160
–––––
Group statement of cash flows
420 KAPLAN PUBLISHING
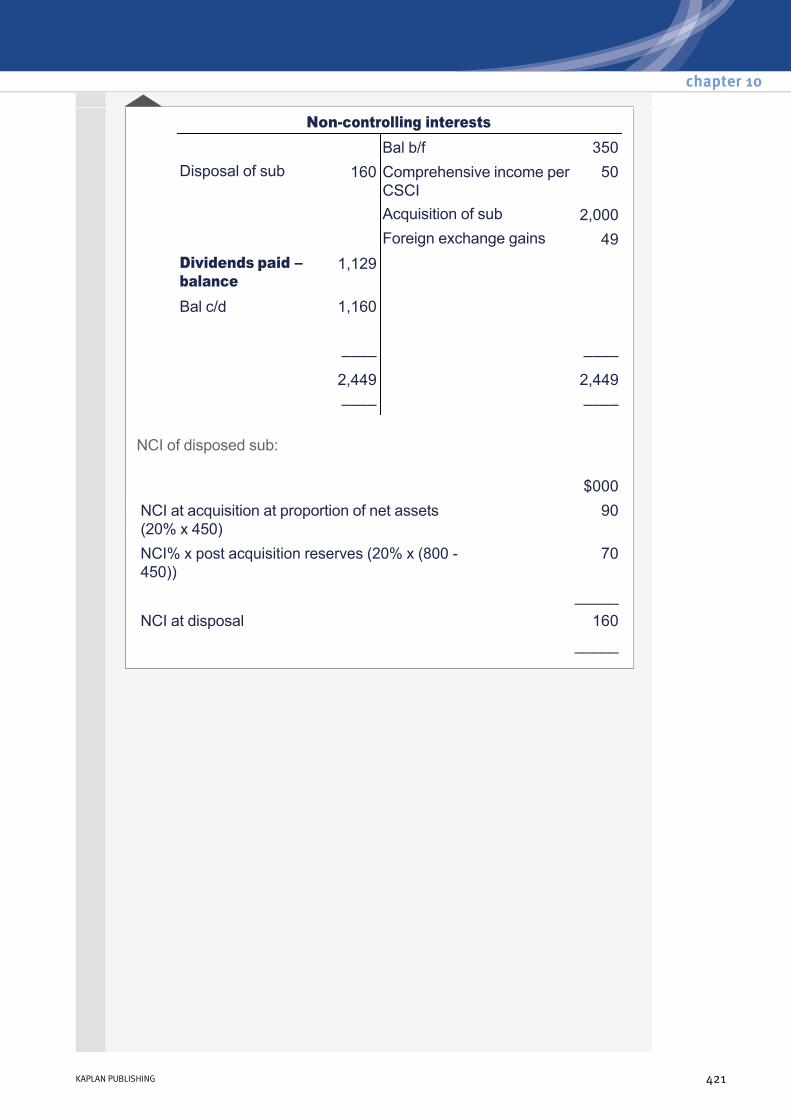
NCI of disposed sub:
Noncontrolling interests Bal b/f 350
Disposal of sub 160 Comprehensive income per CSCI
50
Acquisition of sub 2,000 Foreign exchange gains 49
Dividends paid – balance
1,129
Bal c/d 1,160
–––– –––– 2,449 2,449 –––– ––––
$000NCI at acquisition at proportion of net assets (20% x 450)
90
NCI% x post acquisition reserves (20% x (800 450))
70
_____NCI at disposal 160 _____
chapter 10
KAPLAN PUBLISHING 421

Consolidated statement of cash flows $000 $000Cash flows from operating activities Profit before tax 1,115 Finance costs 35 Gain of sale of subsidiary (100) Income from associate (115) Depreciation 385 Impairment (W1) 80 Gain on disposal of PPE (275 250) (25) Increase in inventory (W2) (50) Decrease in receivables (W2) 60 Decrease in payables (W2) (65) –––– 1,320Finance costs paid (35)Tax paid (W3) (180) –––– 1,105Cash flows from investing activities Sale proceeds of PPE 275 Purchases of PPE (W4) (800) Dividends received from associate (W5) 85 Acquisition of subsidiary (1,500 – 80) (1,420) Sale of subsidiary (850 – 50) 800 –––– (1,060)Cash flows from financing activities Increase in loans (500 300) 200 Dividends paid to parent shareholders (per CSOCE) (125) Dividends paid to NCI shareholders (per CSOCE) (50) –––– 25 –––– Increase in cash and cash equivalents 70Opening cash and cash equivalents 140 ––––Closing cash and cash equivalents 210 ––––
Group statement of cash flows
422 KAPLAN PUBLISHING
Test your understanding 9 Pearl

Workings
Goodwill of acquired sub:
(W1) Goodwill
Or
$000Bal b/f 1,850Acquisition of sub (W) 350Disposal of sub (W) (190) ––––– 2,010 Impairment (balance) (80) ––––– Bal c/f 1,930 –––––
Goodwill Bal b/f 1,850 Acq’n of sub (W) 350 Disposal of sub (W) 190
Impairment – balance 80 Bal c/f 1,930
–––– –––– 2,200 2,200 –––– ––––
$000Fair value of P's holding (cost of investment) 1,500NCI holding at fair value 340Fair value of sub's net assets at acquisition (1,490) _____Goodwill at acquisition/ disposal 350 _____
chapter 10
KAPLAN PUBLISHING 423

Goodwill of disposed sub:
$000Fair value of P's holding (cost of investment) 600NCI holding at fair value 320Fair value of sub's net assets at acquisition (730) _____Goodwill at acquisition/ disposal 190 _____
(W2) Working capital
Inventory Receivables Payables $000 $000 $000
Bal b/f 435 330 725Acquisition of subsidiary 150 240 220Disposal of subsidiary (165) (120) (80) –––––– –––––– –––––– 420 450 865Increase/ (decrease) (balance) 50 (60) (65) –––––– –––––– –––––– Bal c/f 470 390 800
–––––– –––––– ––––––
(W3) Tax
$000Bal b/f (360 + 105)) 465Acquisition of subsidiary 40Disposal of subsidiary ()Income statement 225 –––– 730Tax paid (balance) (180) –––– Bal c/f (400 + 150) 550 ––––
Group statement of cash flows
424 KAPLAN PUBLISHING
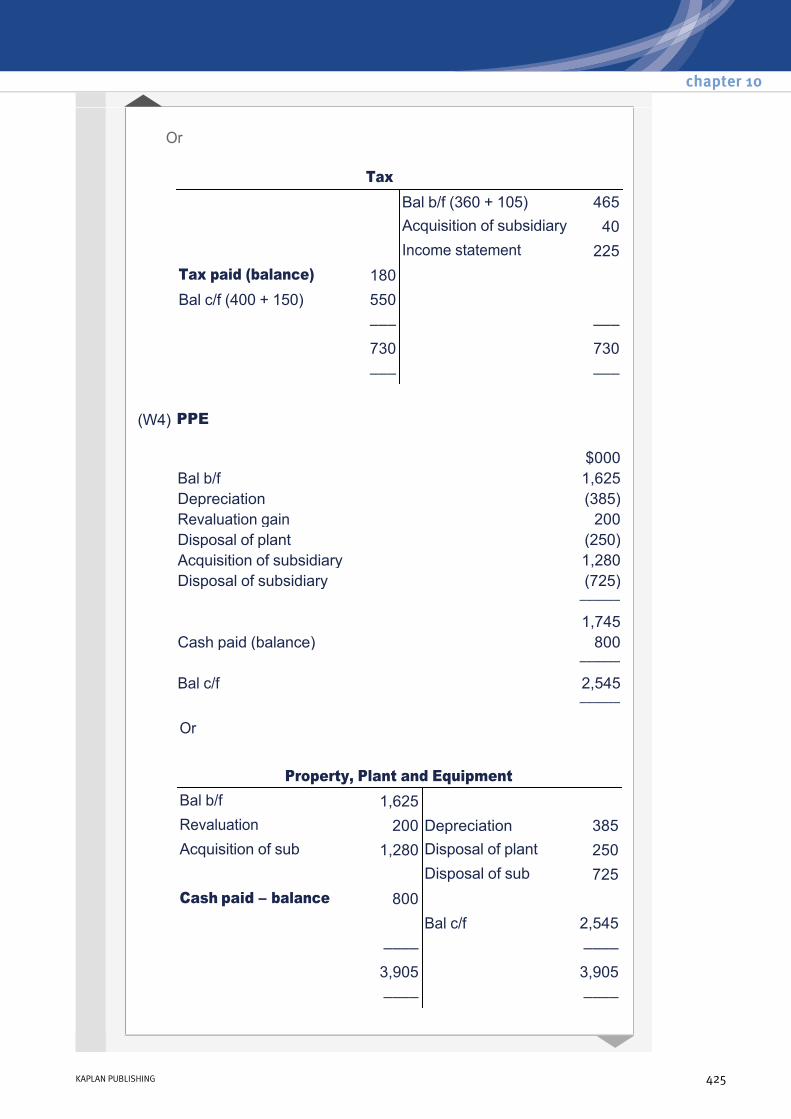
Or
Tax Bal b/f (360 + 105) 465
Acquisition of subsidiary 40 Income statement 225Tax paid (balance) 180 Bal c/f (400 + 150) 550
––– ––– 730 730 ––– ––– (W4) PPE
$000Bal b/f 1,625Depreciation (385)Revaluation gain 200Disposal of plant (250)Acquisition of subsidiary 1,280Disposal of subsidiary (725) –––––– 1,745Cash paid (balance) 800 –––––– Bal c/f 2,545 –––––– Or
Property, Plant and Equipment Bal b/f 1,625 Revaluation 200 Depreciation 385Acquisition of sub 1,280 Disposal of plant 250
Disposal of sub 725Cash paid – balance 800
Bal c/f 2,545 –––– –––– 3,905 3,905 –––– ––––
chapter 10
KAPLAN PUBLISHING 425
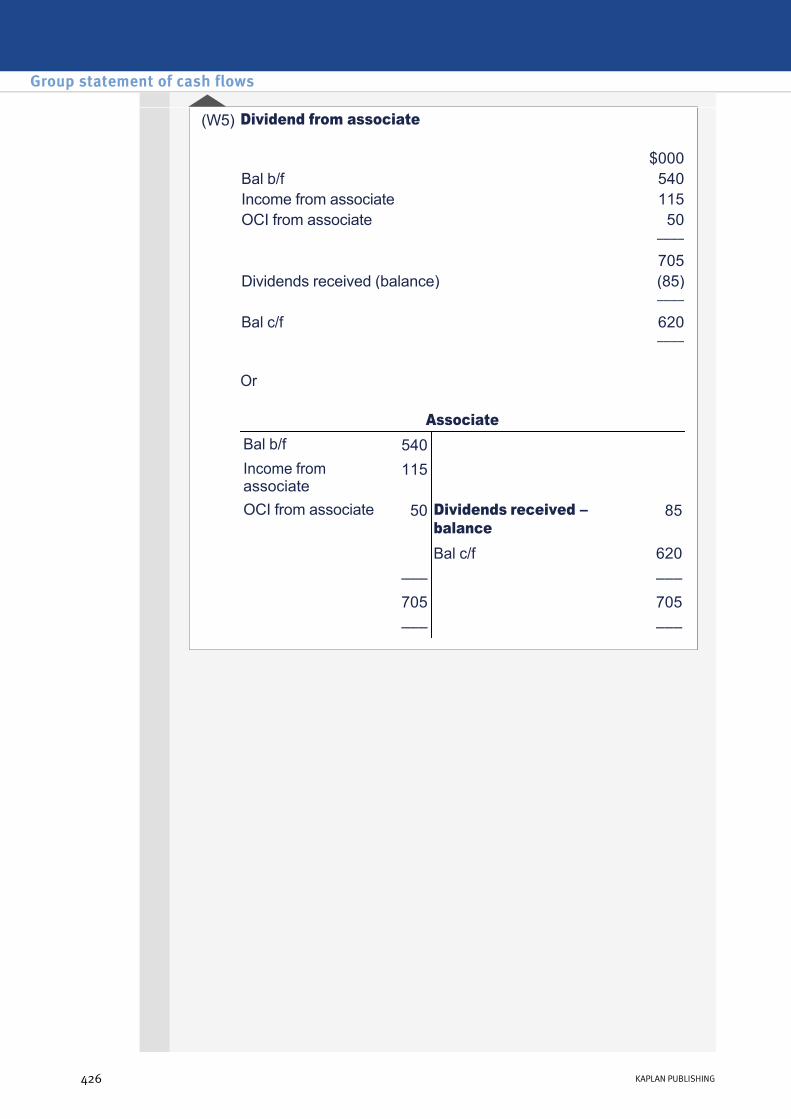
(W5) Dividend from associate
Or
$000Bal b/f 540Income from associate 115OCI from associate 50 –––– 705Dividends received (balance) (85) –––– Bal c/f 620 ––––
Associate Bal b/f 540 Income from associate
115
OCI from associate 50 Dividends received – balance
85
Bal c/f 620 ––– ––– 705 705 ––– –––
Group statement of cash flows
426 KAPLAN PUBLISHING
Developments in external reportingChapter learning objectives
On completion of their studies students should be able to:
• Discuss pressures for extending the scope and quality of external reports to include prospective and nonfinancial matters, and narrative reporting generally;
• Explain how information concerning the interaction of a business with the society and the natural environment can be communicated in the published accounts;
• Identify and discuss social and environmental issues which are likely to be most important to the stakeholders in an organisation;
• Explain the process of measuring, recording and disclosing the effect of exchanges between a business and society human resource accounting;
• Identify and discuss major differences between IFRS and US GAAP, and the measures designed to contribute towards their convergence.
427
chapter
11
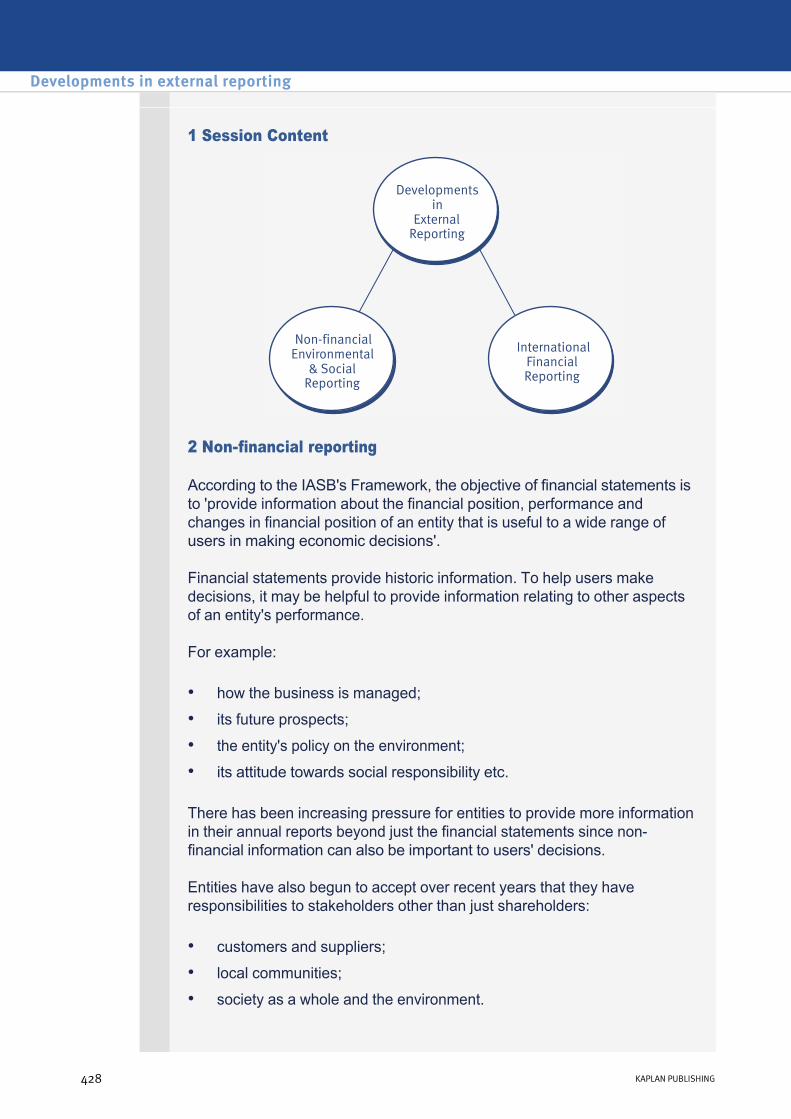
1 Session Content
2 Nonfinancial reporting
According to the IASB's Framework, the objective of financial statements is to 'provide information about the financial position, performance and changes in financial position of an entity that is useful to a wide range of users in making economic decisions'.
Financial statements provide historic information. To help users make decisions, it may be helpful to provide information relating to other aspects of an entity's performance.
For example:
There has been increasing pressure for entities to provide more information in their annual reports beyond just the financial statements since nonfinancial information can also be important to users' decisions.
Entities have also begun to accept over recent years that they have responsibilities to stakeholders other than just shareholders:
• how the business is managed;
• its future prospects;
• the entity's policy on the environment;
• its attitude towards social responsibility etc.
• customers and suppliers;
• local communities;
• society as a whole and the environment.
Developments in external reporting
428 KAPLAN PUBLISHING428 KAPLAN PUBLISHING

This additional nonfinancial reporting can be reported in a number of ways:
• An operating and financial review will assess the results of the period and discuss future prospects of the business.
• An environmental report will discuss responsibilities towards the environment and a social report will discuss responsibilities towards society. Both these issues could be combined in a report on sustainability which will also encompass economic issues.
3 Operating and financial review (OFR)
The UK's Accounting Standards Board (ASB) provided guidelines to companies in 1993 (updated in 2003) on including an 'Operating and Financial Review' (OFR) within their annual reports. An OFR is intended to set out the directors’ analysis of the business, so as to provide both an historical and a prospective analysis of the business as seen by senior management. At this time providing an OFR was voluntary.
In May 2005, the ASB issued a reporting standard (RS1) requiring quoted companies within the UK to prepare an OFR by law. This requirement was withdrawn at the beginning of 2006 and again companies are encouraged to produce an OFR as best practice. The ASB has kept the statement as a source of best practice guidance.
Many listed companies in the UK choose to disclose the OFR information on a voluntary basis, notwithstanding the withdrawal of the change to the law.
The Business Review
The Companies Act 2006 introduced additional requirements in the Business Review that were brought into force for financial years beginning on or after 1 October 2007. The Business Review has a statutory purpose, which is to inform the shareholders and help them assess how the directors have performed their duties to promote the success of the company.
The Act also requires quoted companies to provide additional disclosures in their Business Review to the extent necessary for an understanding of the development, performance and position of the business. The additional disclosures include:
• The main trends and factors likely to affect future developments and activities;
• Information about employees, environmental matters and social and community issues;
• Information about contractual arrangements that are central to the company’s activities.
chapter 11
KAPLAN PUBLISHING 429
All of these provisions were originally introduced in the OFR.
OFR best practice
The OFR should reflect the directors' view of the business and have a 'forwardlooking orientation'. While the OFR should focus on matters that are relevant to shareholders, the information will also be useful to other users.
The standard sets out a framework for an OFR:
• the nature, objectives and strategies of the business;
• the development and performance of the business, both in the period under review and in the future;
• the resources, risks and uncertainties and relationships that may affect the entity's longterm value; and
• the position of the business including a description of the capital structure, treasury policies and objectives and liquidity of the entity, both in the period under review and in the future.
Advantages of preparing an OFR may include:
Disadvantages of preparing an OFR may include:
• It helps companies appear transparent and willing to communicate.
• It may enhance a company's reputation to produce such documents voluntarily.
• It can be used to explain the background behind certain numbers in the financial statements, especially if they may otherwise be perceived in a negative light.
• It can compare the actual results against expected results and explain the reasons why performance differed.
• It is a useful summary of information found in a more complex form elsewhere in the financial statements.
• It may provide genuinely useful statements of management’s intended business strategy, and sufficient information to be able to assess the relative success of business strategies to date.
• It may be more likely to be read and absorbed than some other parts of the annual report.
• Costly and timeconsuming since it is likely to require significant time of senior management.
Developments in external reporting
430 KAPLAN PUBLISHING
OFR: The ASB's statement of best practice
• Lack of requirements in terms of content will reduce the comparability of reports across entities.
• Companies may be selective and biased in the information they choose to discuss which will reduce its reliability for users.
• Users may rely too heavily on the OFR, and may read it in preference to a thorough examination of the detailed figures.
• OFRs currently (both in the UK and elsewhere) have the status of voluntary disclosures and so they suffer from all the general drawbacks of voluntary disclosure (e.g. they may not be prepared on an entirely consistent basis, bad news may be underplayed and so on).
4 Sustainability
Definition
Sustainability is the process of conducting business in such a way that it enables an entity to meet its present needs without compromising the ability of future generations to meet their needs.
Introduction
In a corporate context, sustainability means that a business entity must attempt to reduce its environmental impact through more efficient use of natural resources and improving environmental practices.
More and more business entities are reporting their approach to sustainability in addition to the financial information reported in the annual report. There are increased public expectations for business entities and industries to take responsibility for the impact their activities have on the environment and society.
chapter 11
KAPLAN PUBLISHING 431
IFRS Practice Statement Management Commentary
Reporting sustainability
• Currently, sustainability reporting is voluntary, although its use is increasing.
• Reports include highlights of nonfinancial performance such as environmental, social and economic reports during the accounting period.
• The report may be included in the annual report or published as a stand alone document, possibly on the entity’s website.
• The increase in popularity of such reports highlights the growing trend that business entities are taking sustainability seriously and are attempting to be open about the impact of their activities.
• Reporting sustainability is sometimes called reporting the ‘triple bottom line’ covering environmental, social and economic reporting.
Framework for sustainability reporting
• There is no framework for sustainability reporting in IFRS, so this reporting is voluntary.
• This lack of regulation leads to several potential problems: – Because disclosure is largely voluntary, not all businesses disclose
information. Those that do tend to do so either because they are under particular pressure to prove their ‘green’ credentials (for example, large public utility companies whose operations directly affect the environment), or because they have deliberately built their reputation on environmental friendliness or social responsibility.
– The information disclosed may not be complete or reliable. Many businesses see environmental reporting largely as a public relations exercise and therefore only provide information that shows them in a positive light.
– The information may not be disclosed consistently from year to year.
– Some businesses, particularly small and medium sized entities, may believe that the costs of preparing and circulating additional information outweigh the benefits of doing so.
Developments in external reporting
432 KAPLAN PUBLISHING
Global reporting initiative
The GRI suggests that entities report performance indicators so that users can monitor their performance from economic, environmental and social perspectives. Examples of such performance indicators may be:
E.g. proportion of spending with local suppliers; proportion of local workforce employed by the entity and their wages, pensions and other benefits; levels of taxes paid and subsidies received.
E.g. percentage of recycled material used in production, levels of gas emissions, levels of organic ingredients used in products.
E.g. human rights, breakdown of workforce by ethnic background, policies in respect of working hours and labour practices, benefits provided to employees such as healthcare, gym membership.
• The most accepted framework for reporting sustainability is the Global Reporting Initiative’s (GRI's) Sustainability Reporting Guidelines, the latest of which 'G3' – the third version of the guidelines – was issued in October 2006.
• The G3 Guidelines provide universal guidance for reporting on sustainability performance. They are applicable to all entities including SMEs and notforprofit entities worldwide.
• The G3 consist of principles and disclosure items.The principles help to define report content, quality of the report, and give guidance on how to set the report boundary. Disclosure items include disclosures on management of issues, as well as performance indicators themselves.
• Applying these guidelines is voluntary.
• Economic
• Environmental
• Social
The best way to understand sustainability is to look at some examples of sustainability reports in financial statements.
You can also look at the Global Reporting Initiative website: www.globalreporting.org
The financial statements of companies that have applied the GRI guidelines are listed with a link to their reports.
chapter 11
KAPLAN PUBLISHING 433
The Global Reporting Initiative

5 Environmental reporting
Definition
Environmental reporting is the disclosure of information in the published annual report or elsewhere, of the effect that the operations of the business have on the natural environment.
As detailed in the section above, the sustainability report combines environmental, social and economic reporting in one report. Environmental reports were the first step in reporting an entity’s impact on its environment.
This section details the contents of an environment report together with any accounting issues.
Environmental reporting in practice
There are two main vehicles that companies use to publish information about the ways in which they interact with the natural environment:
The IASB encourages the presentation of environmental reports if management believe that they will assist users in making economic decisions, but they are not mandatory.
IAS 1 points out that any statement or report presented outside financial statements is outside the scope of IFRSs, so there are no mandatory IFRS requirements on separate environmental reports.
• The published annual report (which includes the financial statements)
• A separate environment report (either as a paper document or simply posted on the company website.
Accounting for environment costs
Definitions
Environmental costs
include environmental measures and environmental losses.
Environmental measures
are the costs of preventing, reducing or repairing damage to the environment and the costs of conserving resources.
Environmental losses
are costs that bring no benefit to the business.
Developments in external reporting
434 KAPLAN PUBLISHING
Separate environmental reports
Environmental measures can include:
Environmental losses can include:
• capital expenditure;
• closure or decommissioning costs;
• cleanup costs;
• development expenditure;
• costs of recycling or conserving energy.
• fines, penalties and compensation;
• impairment or disposal losses relating to assets that have to be scrapped or abandoned because they damage the environment.
Provisions for environmental liabilities
IAS 37 Provisions, contingent liabilities and contingent assets states that three conditions must be met before a provision may be recognised:
IAS 37 is covered in detail in F1, but some points are particularly relevant to provisions for environmental costs:
• the entity has a present obligation as a result of a past event;
• it is probable that a transfer of economic benefits will be required to settle the obligation;
• a reliable estimate can be made of the amount of the obligation.
• The fact that the entity’s activities have caused environmental contamination does not in itself give rise to an obligation to rectify the damage. However, even if there is no legal obligation, there may be a constructive obligation. An entity almost certainly has a constructive obligation to rectify environmental damage if it has a policy of acting in an environmentally responsible way and this policy is well publicised.
• The obligation must arise from a past event. This means that a provision can only be set up to rectify environmental damage that has already happened. If an entity needs to incur expenditure to reduce pollution in the future, it should not set up a provision. This is because in theory it can avoid the expenditure by its future actions, for example by discontinuing the particular activity that causes the pollution.
chapter 11
KAPLAN PUBLISHING 435
Accounting treatment
Capitalisation of environmental expenditure
If environmental expenditure provides access to future economic benefits, it meets the IASB’s definition of an asset. It would normally be capitalised and depreciated over the useful life of the asset.
An asset may also arise as the result of recognising a provision. In principle, when a provision or change in a provision is recognised, an asset should also be recognised when, and only when, the incurring of the present obligation gives access to future economic benefits. Otherwise the setting up of the provision should be charged immediately to the income statement or statement of comprehensive income.
Redco has just purchased a licence that will allow it to drill for oil in an area of Alaska. The purchase cost of this licence is $20m.
In addition Redco has agreed to pay $6.5m to restore the landscape once it has finished. This payment will be made at the end of year 5 when the licence expires.
The pretax discount rate that reflects current market risks is 8%.
Required:
Show how this should be accounted for in the financial statements for years 1–5.
Note: Work to the nearest $000.
You are the chief accountant of Redstart and you are currently finalising the financial statements for the year ended 31 December 20X1. Your assistant (who has prepared the draft accounts) is unsure about the treatment of two transactions that have taken place during the year. She has written you a memorandum that explains the key principles of each transaction and also the treatment adopted in the draft accounts.
Developments in external reporting
436 KAPLAN PUBLISHING
Test your understanding 1 Redco
Test your understanding 2
Transaction one
One of the corporate objectives of the enterprise is to ensure that its activities are conducted in such a way as to minimise any damage to the natural environment. It is committed in principle to spending extra money in pursuit of this objective but has not yet made any firm proposals. The directors believe that this objective will prove very popular with customers and are anxious to emphasise their environmentally friendly policies in the annual report.
Your assistant suggests that a sum should be set aside from profits each year to create a provision in the financial statements against the possible future costs of environmental protection. Accordingly, she has charged the income statement for the year ended 31 December 20X1 with a sum of $100,000 and proposes to disclose this fact in a note to the accounts.
Transaction two
A new law has recently been enacted that will require Redstart to change one of its production processes in order to reduce the amount of carbon dioxide that is emitted. This will involve purchasing and installing some new plant that is more efficient than the equipment currently in use. To comply with the law, the new plant must be operational by 31 December 20X2. The new plant has not yet been purchased.
In the draft financial statements for the year ended 31 December 20X1, your assistant has recognised a provision for $5 million (the cost of the new plant). This has been disclosed as a separate item in the notes to the income statement.
The memorandum from your assistant also expresses concern about the fact that there was no reference to environmental matters anywhere in the published financial statements for the year ended 31 December 20X0. As a result, she believes that the financial statements did not comply with the requirements of International Financial Reporting Standards and therefore must have been wrong.
Required:
Draft a reply to your assistant that:
(a) reviews the treatment suggested by your assistant and recommends changes where relevant. In each case your reply should refer to relevant International Accounting Standards
(b) replies to her suggestion that the financial statements for the year ended 31 December 20X0 were wrong because they made no reference to environmental matters.
chapter 11
KAPLAN PUBLISHING 437
Company B owns a chemical plant, producing paint.
The plant uses a great deal of energy and releases emissions into the environment. Its byproduct is harmful and is treated before being safely disposed of. The company has been fined for damaging the environment following a spillage of the toxic waste product. Due to stricter monitoring routines set up by the company, the fines have reduced and in the current year they have not been in breach of any local environment laws.
The company is aware that emissions are high and has been steadily reducing them. They purchase electricity from renewable sources and in the current year have employed a temporary consultant to calculate their carbon footprint so they can take steps to reduce it.
Required:
(a) Explain why companies may wish to make social and environmental disclosures in their annual report. Discuss how this content should be determined.
(b) Discuss the information that could be included in Company B’s environmental report.
6 Social reporting
Definition
Corporate social reporting is the process of communicating the social and environmental effects of organisations’ economic actions to particular interest groups within society and to society at large.
It involves extending the accountability of organisations (particularly companies) beyond the traditional role of providing a financial account to the owners of capital. Social and ethical reporting would seem to be at variance with the prevailing business. However, there are a number of reasons why entities publish social reports:
• They may have deliberately built their reputation on social responsibility (e.g. Body Shop, Traidcraft) in order to attract a particular customer base.
Developments in external reporting
438 KAPLAN PUBLISHING
Test your understanding 3
Background to environmental reporting
• They may perceive themselves as being under particular pressure to prove that their activities do not exploit society as a whole or certain sections of it (e.g. Shell International and large utility companies).
• They may be genuinely convinced that it is in their longterm interests to balance the needs of the various stakeholder groups.
• They may fear that the government will eventually require them to publish socially oriented information if they do not do so voluntarily.
Social responsibility
A business interacts with society in several different ways as follows:
If a business interacts with society in a responsible manner, the needs of other stakeholders should be taken into account and performance may encompass:
• It employs human resources in the form of management and other employees.
• Its activities affect society as a whole, for example, it may: – be the reason for a particular community’s existence;
– produce goods that are helpful or harmful to particular members of society;
– damage the environment in ways that harm society as a whole;
– undertake charitable works in the community or promote particular values.
• providing fair remuneration and an acceptable working environment;
• paying suppliers promptly;
• minimising the damage to the environment caused by the entity’s activities;
• contributing to the community by providing employment or by other means.
Social reporting in practice
Social reporting in the financial statements
• Disclosures of social reporting matters in financial statements tend to be required by national legislation and by the stock exchange on which an entity is quoted. There is little mention of social matters in international accounting standards.
chapter 11
KAPLAN PUBLISHING 439
• IAS 1 requires disclosure of the total cost of employee benefits for the period. If the ‘nature of expense’ method is chosen for the income statement/statement of comprehensive income, then the total charge for employee costs will be shown on the face of the income statement/statement of comprehensive income. If the ‘function of expense’ method is chosen, then IAS 1 requires disclosure of the total employee costs in a note to the financial statements.
• IAS 24 Related party disclosures requires the benefits paid to key management personnel to be disclosed in total and analysed into the categories of benefits.
• Other possible disclosures (e.g. details of directors and corporate governance matters, employee policies, supplier payment policies, charitable contributions, etc.) are normally dealt with by local legislation and would only be required by IFRSs when such disclosure is necessary to present fairly the entity’s financial performance.
7 Human resource accounting
Definition
Human resource accounting is the process of measuring and disclosing the value of an entity’s human resources: its employees. It is one aspect of social accounting.
One of the criticisms of conventional accounting is that the statement of financial position does not represent the true value of a business because it fails to recognise its intellectual capital i.e. skills, knowledge and experience of employees.
Traditional businesses normally have a capital base largely made up of tangible assets such as property, plant and equipment and inventories. However, an increasing number of businesses develop information technology or provide services. These businesses generate revenue by means of their intellectual capital.
Businesses that rely on intellectual capital often have relatively few ‘traditional’ assets. As a result, there is often a large gap between the market capitalisation of businesses and the carrying value of their net assets. The existence of this ‘gap’ suggests that the market recognises that intellectual capital is an asset.
This can distort interpretation of their results since a ratio such as return on capital employed (ROCE) will be high due to the low level of capital employed on the statement of financial position.
Developments in external reporting
440 KAPLAN PUBLISHING
Separate social reports

Some argue that it would be logical to recognise this asset and that the fact that it is ‘missing’ from the statement of financial position undermines the credibility of the financial statements. Users of the financial statements do not have sufficient information about the full extent of the resources available to the business.
Advantages of recognising human resources as assets
By recording the asset on the statement of financial position, management of an entity are perhaps more likely to consider their value to the business and therefore take more responsibility for looking after their wellbeing.
Limitations to capitalising human resources
An asset is a resource controlled by an entity as a result of past events from which future economic benefits are expected to flow to the entity (IASB Framework).
One of the main arguments against capitalising intellectual capital is that it does not meet the definition of an asset per the IASB Framework. This is because the entity cannot "control" human resources.
It will also be very difficult to reliably measure the value of intellectual capital. The problems associated with this area may result in manipulation of financial statements and also lack of comparability between the financial statements of different entities.
8 Impact of nonfinancial reporting
The sections above have highlighted the developments in nonfinancial reporting. Due to the voluntary nature of these disclosures their impact and effectiveness will depend on various factors:
• Relevance: how much weight do/will investors, employees and consumers give to these factors, compared with that given to financial factors (so return on investment, employee benefits and price, respectively)?
• Reliability: how much can the performance measured in these areas be relied on? How sure can users of this information be that it is a faithful representation of what has occurred, as opposed to a selective view focusing on the successes? Are there external assurance processes that can validate the information, perhaps using the GRI guidelines?
chapter 11
KAPLAN PUBLISHING 441
Capitalising human resources

Even if the information is reliable and comparable, is it useful, i.e. will it change the behaviour of investors, employees and consumers?
The answers to these questions will determine whether entities take such reporting seriously or merely treat it as part of their promotional activities. The answers in ten years’ time will almost certainly be different from those of today.
• Comparability: is the information produced by different entities pulled together on a comparable basis, using similar measurement policies, so that the users can make informed choices between entities? If not, all that can be measured is an entity’s performance compared with its own performance in previous periods.
9 International financial reporting
As more and more companies operate globally, there has been an increasing need for accounting practices to become more harmonised. Businesses operate on a global scale and investors make investment decisions on a worldwide basis. There is therefore a need for financial information to be presented on a consistent basis.
The EU issue directives which member states are required to adopt within their national legislation.
One of these directives requires EU listed entities to prepare consolidated financial statements in accordance with International Accounting Standards from 1 January 2005.
The UK's ASB are also in the process of harmonising UK accounting standards with International Standards.
Advantages Disadvantages
• Increased efficiency and decreased costs for global companies
• Costs for nonglobal companies
• Increase comparability • Changing attitudes and traditions
• Increased competition in world markets
• Easier access to international finance.
10 Convergence project between IASB & FASB 2002 Norwalk Agreement
In September 2002, the IASB and US Financial Accounting Standards Board (FASB) signed the Norwalk agreement to start the convergence project.
Developments in external reporting
442 KAPLAN PUBLISHING
Both Boards committed to the development of high quality, compatible accounting standards that are suitable for both domestic and cross border financial reporting.
Objectives set in agreement:
February 2006 Roadmap
In February 2006, the IASB and FASB released a Memorandum of Understanding, also called the Roadmap, identifying shortterm and longterm convergence projects.
November 2008 Roadmap
In November 2008, the IASB and FASB released a Roadmap detailing a timeline for US issuers to produce financial statements in accordance with IFRS. A small group of companies will begin to prepare their financial statements using IFRS with effect from years starting 15 December 2009 onwards.
It is planned that other large companies will begin to use IFRS from 2014.
In January 2009 the head of the Securities and Exchange Commission (SEC) in the US changed and so it is unclear whether the November 2008 roadmap will be carried through.
Recent changes
Consolidated accounts
In January 2008, the IASB issued amendments to IAS 27 and IFRS 3. The new standards change the calculation of goodwill and also the treatment of piecemeal acquisitions. These amendments bring the accounting standards more in line with US GAAP, although some differences still exist, such as the definition of control.
Presentation of financial statements
In September 2007, IAS 1 was revised with the Balance Sheet now being called the Statement of Financial Position. The Income Statement has been changed to a Statement of Comprehensive Income and so includes items of income and expense that are not recognised in profit or loss but were directly recognised in equity, e.g. revaluation gains.
• Make existing accounting standards compatible as soon as practicable;
• Once compatibility is achieved, to work together in the future to ensure compatibility is maintained.
chapter 11
KAPLAN PUBLISHING 443
Borrowing costs
IAS 23 permitted borrowing costs on the construction of an asset to be either capitalised or written off. US GAAP required such costs to be capitalised.
IAS 23 was amended in March 2007 and is now in line with US GAAP and from 1 January 2009, entities will be required to capitalise borrowing costs.
Other standards
SEC reconciliations
Until recently, entities that prepare financial statements under International GAAP but who are listed on the US markets had to prepare a reconciliation of their financial statements to US GAAP. In November 2007, the SEC released companies from this requirement. This is seen as the most significant step towards full convergence.
Differences remaining between IASs and US GAAP
• IFRS 8 Operating segments;
• IFRS 5 Noncurrent assets held for sale and discontinued operations.
Topic IAS/ IFRS US GAAP General approach
Broadly principles based Broadly rule based
Inventory valuation
LIFO not allowed as a method of measuring cost
LIFO allowed
Development costs
Capitalise when criteria are met Expense
Noncurrent assets
Historic cost or valuation Historic cost
Extraordinary items
Prohibited Permitted although rare
Joint ventures Equity or proportional consolidation Equity method required
Developments in external reporting
444 KAPLAN PUBLISHING
Further developments

11 Chapter summary
chapter 11
KAPLAN PUBLISHING 445

Test your understanding answers
Statement of financial position extracts
Income statement extracts
There is an obligation to pay the $6.5m to restore the landscape at the end of the five years and so the present value of the obligation should be capitalised to the cost of the noncurrent asset and subsequently depreciated. The corresponding provision will need to be increased every year to represent the unwinding of the discount and this is charged to the income statement.
The present value of $6.5m discounted at 8% over 5 years is:
$6.5m x 0.681 = $4.427m.
This amount will be recorded as follows at the start of year 1:
The noncurrent asset of ($20m + $4.427m) $24.427 is depreciated over 5 years and the depreciation of ($24.427 / 5 years) $4.885m is charged to the income statement.
Year Cost Depreciation NBV Provision $000 $000 $000 $000
1 24,427 4,885 19,542 4,7812 24,427 9,770 14,657 5,1633 24,427 14,655 9,772 5,5764 24,427 19,540 4,887 6,0225 24,427 24,427 − 6,500
Year Depreciation Finance cost (W1) Total charge $000 $000 $0001 4,885 354 5,2392 4,885 382 5,2673 4,885 413 5,2984 4,885 446 5,3315 4,887 478 5,365
–––––– –––––– –––––– 24,427 2,073 26,500 –––––– –––––– ––––––
Dr Noncurrent assets Cr Provision
Developments in external reporting
446 KAPLAN PUBLISHING
Test your understanding 1 Redco
The provision is 'unwound' at 8% each year and charged to the income statement as a finance cost.
(W1) Unwinding of the discount Year Brought forward Unwinding at 8% Carried forward $000 $000 $0001 4,427 354 4,7812 4,781 382 5,1633 5,163 413 5,5764 5,576 446 6,0225 6,022 478 6,500
MEMORANDUM
To: Assistant Accountant
From: Chief Accountant
Subject: Accounting treatment of two transactions and disclosure of environmental matters in the financial statements
Date: 25 March 20X2
Transaction one
IAS 37 Provisions, contingent liabilities and contingent assets states that provisions should only be recognised in the financial statements if:
In this case, there is no obligation to incur expenditure. There may be a constructive obligation to do so in future, if the board creates a valid expectation that it will protect the environment, but a board decision alone does not create an obligation.
(a) Accounting treatment of two transactions
• there is a present obligation as a result of a past event
• it is probable that a transfer of economic benefits will be required to settle the obligation
• a reliable estimate can be made of the amount of the obligation.
chapter 11
KAPLAN PUBLISHING 447
Test your understanding 2
There is also some doubt as to whether the expenditure can be reliably quantified. The sum of $100,000 could be appropriated from retained earnings and transferred to an environmental protection reserve within other components of equity, subject to formal approval by the board. A note to the financial statements should explain the transfer.
Transaction two
Again, IAS 37 states that a provision cannot be recognised if there is no obligation to incur expenditure. At first sight it appears that there is an obligation to purchase the new equipment, because the new law has been enacted. However, the obligation must arise as the result of a past event. At 31 December 20X1, no such event had occurred as the new plant had not yet been purchased and the new law had not yet come into effect. In theory, the company does not have to purchase the new plant. It could completely discontinue the activities that cause pollution or it could continue to operate the old equipment and risk prosecution under the new law. Therefore no provision can be recognised for the cost of new equipment.
It is likely that another effect of the new law is that the company will have to dispose of the old plant before it would normally have expected to do so. IAS 36 Impairment of assets requires that the old plant must be reviewed for impairment. If its carrying value is greater than its recoverable amount, it must be written down and an impairment loss must be charged against profits. This should be disclosed separately in the notes to the income statement/statement of comprehensive income if it is material.
At present, companies are not obliged to make any reference to environmental matters within their financial statements. Current international financial reporting practice is more designed to meet the needs of investors and potential investors, rather than the general public. Some companies choose to disclose information about the ways in which they attempt to safeguard the environment, something that is often carried out as a public relations exercise. Disclosures are often framed in very general terms and appear outside the financial statements proper. This means that they do not have to be audited.
Several companies publish fairly detailed ‘environmental reports’. It could be argued that as Redstart’s operations affect the wider community, it has a moral responsibility to disclose details of its activities and its environmental policies. However, at present it is not required to do so by IFRSs.
(b) Reference to environmental matters in the financial statements
Developments in external reporting
448 KAPLAN PUBLISHING

If a company has, or may have, an obligation to make good any environmental damage that it has caused, it is obliged to disclose information about this commitment in its financial statements (unless the likelihood of this is remote).
If it is probable (more likely than not) that the company will have to incur expenditure to meet its obligation, then it is also required to set up a provision in the financial statements.
In practice, these requirements are unlikely to apply unless a company is actually obliged by law to rectify environmental damage or unless it has made a firm commitment to the public to do so (for example, by promoting itself as an organisation that cares for the environment, as the directors propose that Redstart should do in future).
(a) The way in which companies manage their social and environmental responsibilities is a high level strategic issue for management. Companies that actively manage these responsibilities can help create longterm sustainable performance in an increasingly competitive business environment.
Reports that disclose transparent information will benefit organisations and their stakeholders. These stakeholders will have an interest in knowing that the company is attempting to adopt best practice in the area. Institutional investors will see value in the ‘responsible ownership’ principle adopted by the company.
Although there is no universal ‘best practice’, there seems to be growing consensus that high performance is linked with high quality practice in such areas as recruitment, organisational culture, training and reduction of environmental risks and impact. Companies that actively reduce environmental risks and promote social disclosures could be considered to be potentially more sustainable, profitable, valuable and competitive. Many companies build their reputation on the basis of social and environmental responsibility and go to substantial lengths to prove that their activities do not exploit their workforce or any other section of society.
chapter 11
KAPLAN PUBLISHING 449
Test your understanding 3
Governments are encouraging disclosure by passing legislation, for example in the area of antidiscrimination and by their own example in terms of the depth and breadth of reporting (also by requiring companies who provide services to the government to disclose such information). External awards and endorsements, such as environmental league tables and employer awards, encourage companies to adopt a more strategic approach to these issues. Finally, local cultural and social pressures are causing greater demands for transparency of reporting.
There is no IFRS that determines the content of an environmental and social report. While companies are allowed to include the information they wish to disclose, there is a lack of comparability and the potential that only the positive actions will be shown.
A common framework that provided guidelines on sustainability reporting would be useful for both companies and stakeholders.
The Global Reporting Initiative (GRI) provides guidelines on the content of a sustainability report, but these are not mandatory. However, a number of companies prepare their reports in accordance with the guidelines and the GRI is becoming the unofficial best practice guide in this area.
(b) Company B’s environmental report should include the following information. (i) A statement of the environmental policy covering all aspects of
business activity. This can include their aim of using renewable electricity and reducing their carbon footprint – the amount of carbon dioxide released into the environment as a result of their activities.
(ii) The management systems that reduce and minimise environmental risks.
(iii) Details of environmental training and expertise.
(iv) A report on their environmental performance including verified emissions to air/land and water, and how they are seeking to reduce these and other environmental impacts. Operating site reports for local communities for businesses with high environmental impacts. Company B’s activities have a significant impact so it is important to show how this is dealt with. The emissions data could be graphed to show it is reducing. If they have the data, they could compare their carbon dioxide emissions or their electricity usage over previous periods. Presenting this information graphically helps stakeholders see how the business is performing in the areas it is targeting.
Developments in external reporting
450 KAPLAN PUBLISHING

(v) Details of any environmental offence that resulted in enforcement action, fine, etc. and any serious pollution incident. They can disclose how fines have been reducing and state that there have not been any pollution incidents in the current period.
(vi) A report on historical trends for key indicators and a comparison with the corporate targets.
chapter 11
KAPLAN PUBLISHING 451

Developments in external reporting
452 KAPLAN PUBLISHING
Changing price levelsChapter learning objectives
On completion of their studies students should be able to:
• Discuss the problems of profit measurement and alternative approaches to asset valuations;
• Discuss measures to reduce distortion in financial statements when price levels change.
453
chapter
12

1 Session content
The F2 syllabus does not include applying knowledge of accounting for changing price levels to a numerical examination question.
However, it is an important area of accounting and students are required to describe or explain the different methods of accounting that can be applied in this area.
2 Historical cost accounting
Definition
Historic cost accounting is the accounting method in which transactions are recorded at their monetary amount at the date of the transaction with no further amendment.
This is the system of accounting used traditionally in the preparation of financial statements.
Advantages of historic cost accounting
• Objective, i.e. financial statements are based on verifiable fact rather than subjective opinions;
• Easy (and therefore relatively cheap) to apply;
• Easy to understand
Changing price levels
454 KAPLAN PUBLISHING454 KAPLAN PUBLISHING

Disadvantages of historic cost accounting
Due to the limitations of historic cost accounting in times of changing prices, alternative systems may be adopted. These alternatives include:
To understand the effects of these alternative systems we will first look at the different methods of ascertaining capital maintenance.
• The failure to take inflation into account, leading to unreliable information being provided in financial statements;
• Income at current value matched against costs recorded in an earlier period leading to a distortion in profit;
• Carrying value of assets bearing little relationship to current values;
• Ratio and performance analysis are distorted as a result of above, particularly when comparing performance over a number of accounting periods. This is due to overstating profits and understating assets.
• replacement cost accounting;
• net realisable value accounting;
• current cost accounting;
• current purchasing power accounting; and
• 'real terms' system of accounting.
3 Capital maintenance
Capital represents the amount of money invested and retained in the business by its owners.
Under historic cost accounting, an entity would be required to break even in order to maintain the level of capital.
However, if price levels are rising, break even would not be enough to maintain the level of capital, a profit would need to be generated.
chapter 12
KAPLAN PUBLISHING 455
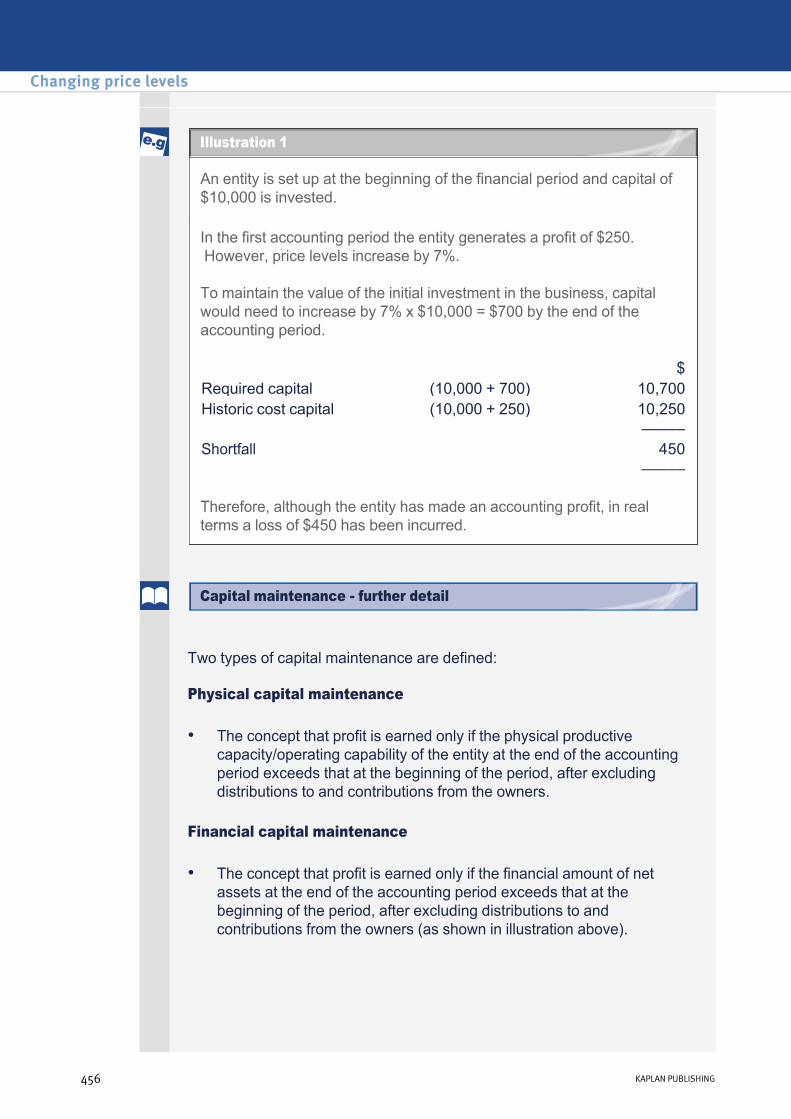
An entity is set up at the beginning of the financial period and capital of $10,000 is invested.
In the first accounting period the entity generates a profit of $250. However, price levels increase by 7%.
To maintain the value of the initial investment in the business, capital would need to increase by 7% x $10,000 = $700 by the end of the accounting period.
Therefore, although the entity has made an accounting profit, in real terms a loss of $450 has been incurred.
$Required capital (10,000 + 700) 10,700Historic cost capital (10,000 + 250) 10,250 –––––Shortfall 450 –––––
Two types of capital maintenance are defined:
Physical capital maintenance
Financial capital maintenance
• The concept that profit is earned only if the physical productive capacity/operating capability of the entity at the end of the accounting period exceeds that at the beginning of the period, after excluding distributions to and contributions from the owners.
• The concept that profit is earned only if the financial amount of net assets at the end of the accounting period exceeds that at the beginning of the period, after excluding distributions to and contributions from the owners (as shown in illustration above).
Changing price levels
456 KAPLAN PUBLISHING
Capital maintenance further detail
Illustration 1

4 Replacement cost accounting
Definition
Replacement cost is the price at which identical goods or capital equipment could be purchased at the date of valuation.
Accounting
Note: Operating profit will be lower than under historic cost accounting.
Advantages
Disadvantages
• Record assets at replacement cost (therefore, increasing statement of financial position values).
• For noncurrent assets, adjust current replacement cost to reflect proportion of useful economic life consumed, i.e. depreciate it.
• Changes in values incorporated into the profit or loss for the period, disclosed separately as ‘holding gains/losses’.
• Application of physical capital maintenance.
• Statement of financial position aims to reflect true value of assets.
• Asset valuation is subjective.
• Replacement cost information may not be available.
• Higher cost of accounts preparation.
• Does not reflect financial capital maintenance.
chapter 12
KAPLAN PUBLISHING 457
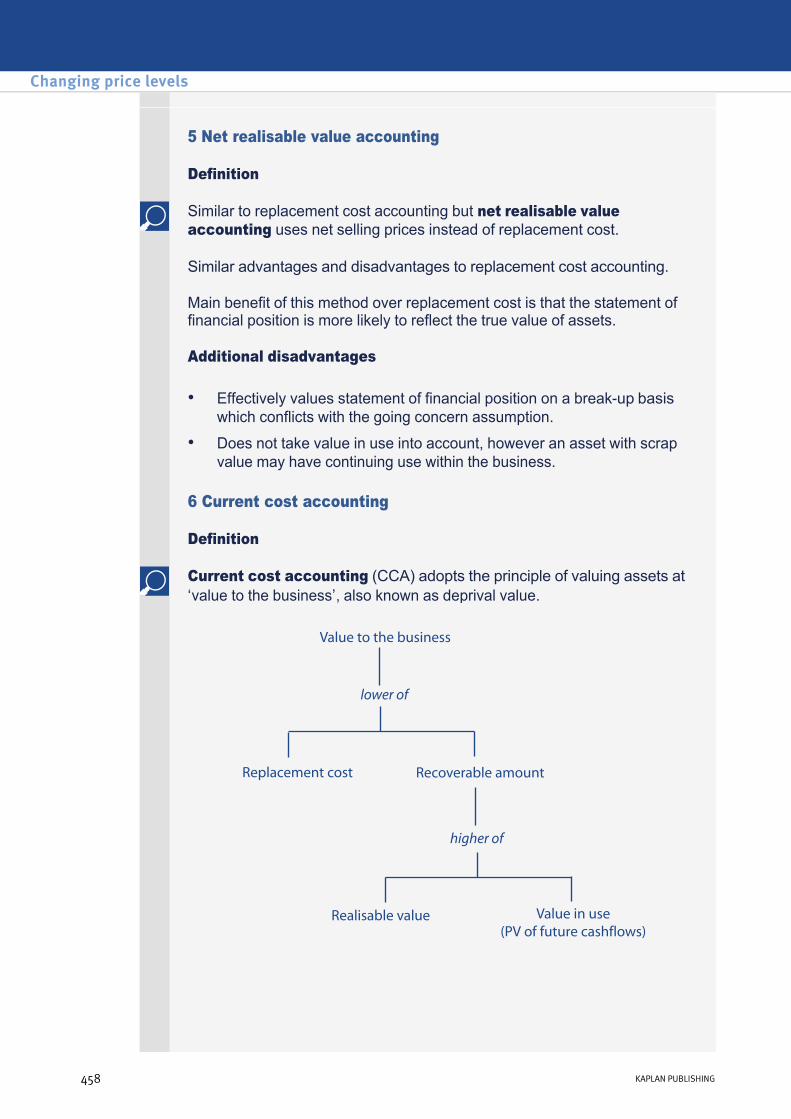
5 Net realisable value accounting
Definition
Similar to replacement cost accounting but net realisable value accounting uses net selling prices instead of replacement cost.
Similar advantages and disadvantages to replacement cost accounting.
Main benefit of this method over replacement cost is that the statement of financial position is more likely to reflect the true value of assets.
Additional disadvantages
• Effectively values statement of financial position on a breakup basis which conflicts with the going concern assumption.
• Does not take value in use into account, however an asset with scrap value may have continuing use within the business.
6 Current cost accounting
Definition
Current cost accounting (CCA) adopts the principle of valuing assets at ‘value to the business’, also known as deprival value.
Changing price levels
458 KAPLAN PUBLISHING
Requirements of CCA system
shows value to business of inventories consumed during the year by updating cost of sales
shows value to business of noncurrent assets consumed in the year
= difference between CCA charge and historic cost charge
takes account of additional investment required to maintain monetary working capital of the business – taking into account concept of financial capital maintenance
apportions total of COSA, depreciation adjustment and MWCA between equity holders and lenders in proportion to their holdings
Advantages of CCA
Disadvantages of CCA
• Identify each individual asset and calculate value to business.
• In income statement, need to disclose historic cost profit plus: – Cost of sales adjustment (COSA)
– Depreciation adjustment
– Monetary working capital adjustment (MWCA)
– Gearing adjustment
• Valuable information for users to make informed economic decisions.
• Application of physical capital maintenance concept.
• Calculations based on price indices which are readily available.
• Provides prudent estimate of profit in times of rising prices.
• Unpopular with preparers.
• Timeconsuming and costly.
• Difficult to assess whether benefits outweigh costs.
• Inappropriate for service industry entities.
• Subjectivity involved.
• Difficult to understand, therefore may not be as useful.
chapter 12
KAPLAN PUBLISHING 459
7 Current purchasing power accounting
Definition
Current purchasing power (CPP) is a method of accounting for inflation in which the values of the nonmonetary items in the accounts are adjusted using a general price index (RPI) to show the change in the general purchasing power of money.
Advantages of CPP
Disadvantages of CPP
• Easier to prepare than CCA with mechanistic calculations. Therefore less time consuming and costly than CCA.
• RPI easily obtainable and objective.
• Easier to understand than CCA.
• Reflects concept of real/financial capital maintenance.
• RPI based on general inflation, may not reflect actual inflation in specific industry.
• Measures value of money rather than true value of assets.
8 'Real terms' system of accounting
The 'real terms' accounting system is a hybrid system that combines the best features of current cost accounting and current purchasing power accounting.
It retains current cost accounting valuation for assets.
This system requires calculation and disclosure of shareholders funds using the current purchasing power method.
9 IAS 29: Financial reporting in hyperinflationary economies
The characteristics of an economic environment of a country that would indicate hyperinflation are:
• Inhabitants keep their wealth in nonmonetary assets or in a relatively stable foreign currency;
• Amounts of local currency are immediately invested to maintain purchasing power;
• Prices are quoted in a relatively stable foreign currency rather than in local currency;
Changing price levels
460 KAPLAN PUBLISHING
Requirement of accounting standard
For entities reporting in currency of hyperinflationary economy:
• Transactions on credit take place at prices that compensate for the expected loss in purchasing power during the credit period, even if period is short;
• Interest rates, wages and prices are linked to a price index;
• Cumulative inflation rate over 3 years approaches, or exceeds, 100%.
• Restate accounts in current terms at reporting date.
• Restate comparatives so all figures are expressed in common terms.
• Requires application of general price index to nonmonetary items (very similar to CPP).
(i) Explain, in a maximum of 50 words, what is meant by current (constant) purchasing power accounting (CPP).
(ii) Current cost accounting adopts the principle of value to the business.
State what the missing words are in the following sentences.
Value to the business is the ___________ of replacement cost and recoverable amount.
Recoverable amount is the ___________ of realisable value and value in use.
chapter 12
KAPLAN PUBLISHING 461
Test your understanding 1
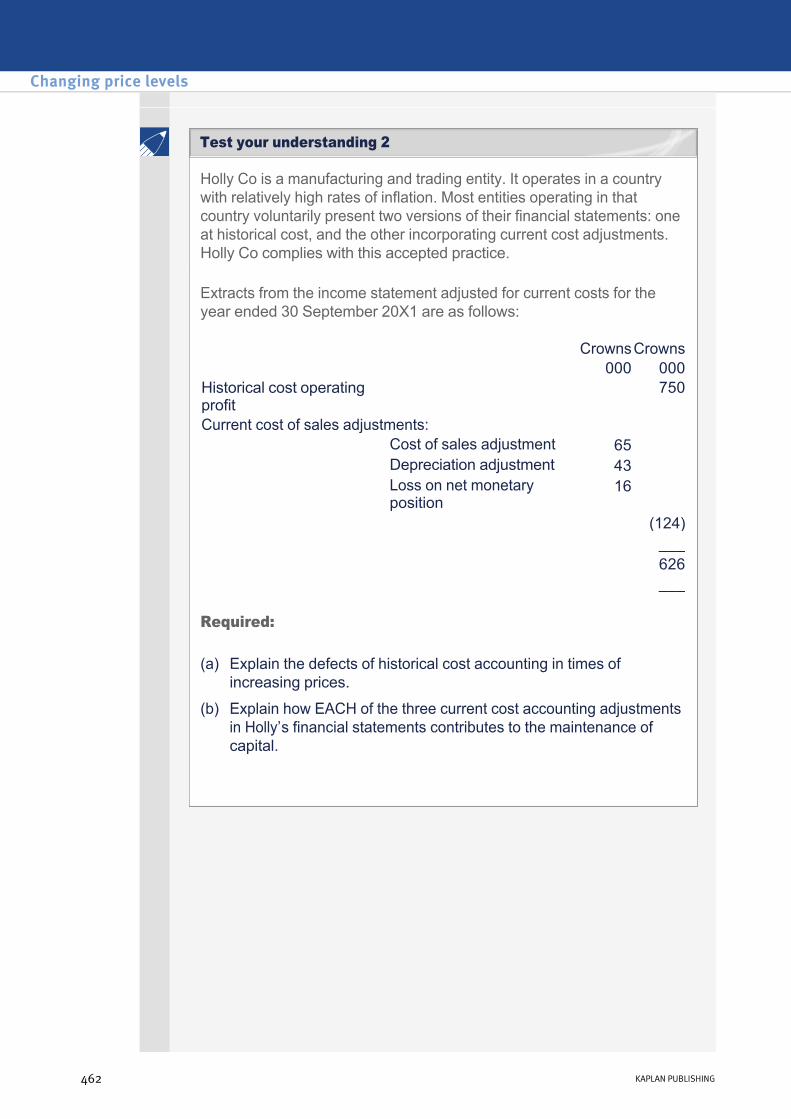
Holly Co is a manufacturing and trading entity. It operates in a country with relatively high rates of inflation. Most entities operating in that country voluntarily present two versions of their financial statements: one at historical cost, and the other incorporating current cost adjustments. Holly Co complies with this accepted practice.
Extracts from the income statement adjusted for current costs for the year ended 30 September 20X1 are as follows:
Required:
Crowns Crowns 000 000 Historical cost operating profit
750
Current cost of sales adjustments: Cost of sales adjustment 65 Depreciation adjustment 43 Loss on net monetary
position16
(124) ___ 626
___
(a) Explain the defects of historical cost accounting in times of increasing prices.
(b) Explain how EACH of the three current cost accounting adjustments in Holly’s financial statements contributes to the maintenance of capital.
Changing price levels
462 KAPLAN PUBLISHING
Test your understanding 2
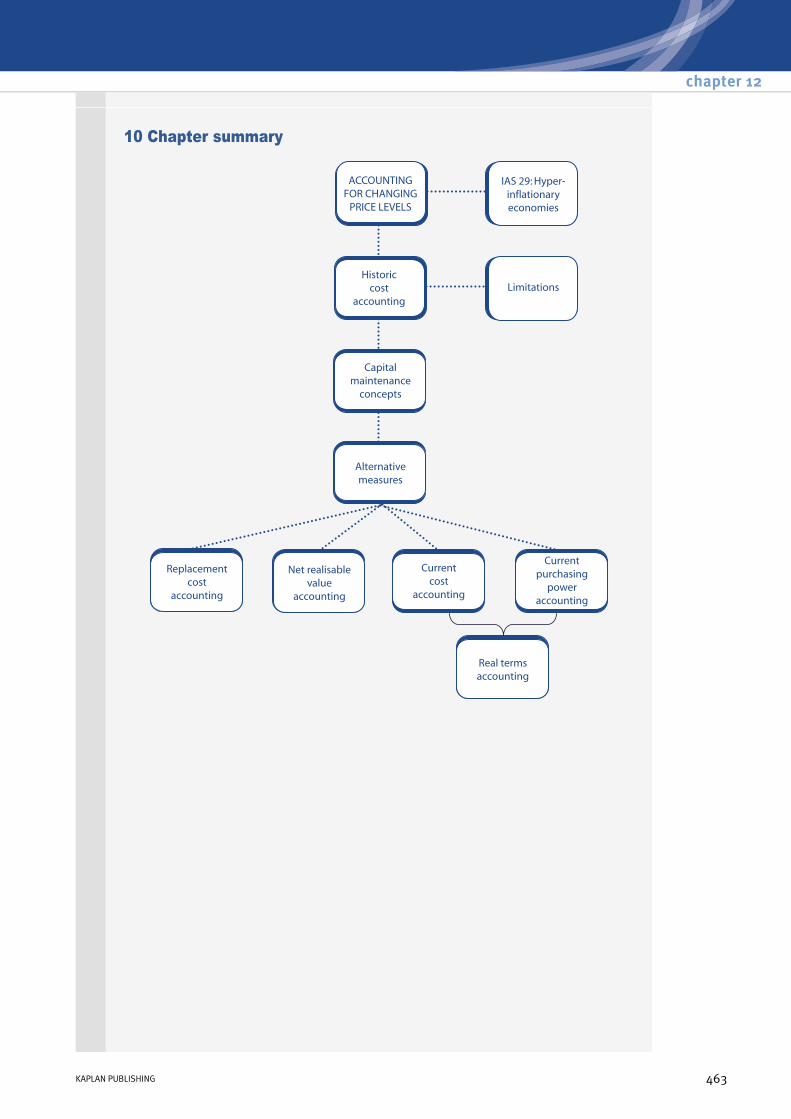
10 Chapter summary
chapter 12
KAPLAN PUBLISHING 463
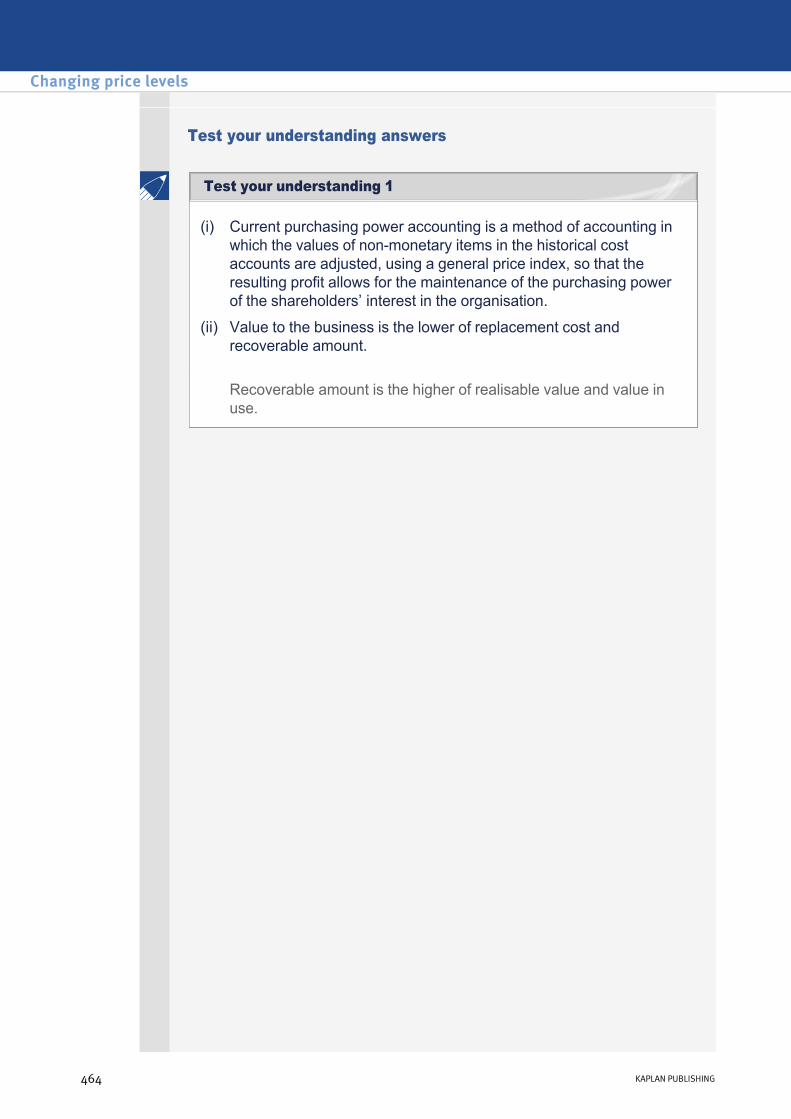
Test your understanding answers
(i) Current purchasing power accounting is a method of accounting in which the values of nonmonetary items in the historical cost accounts are adjusted, using a general price index, so that the resulting profit allows for the maintenance of the purchasing power of the shareholders’ interest in the organisation.
(ii) Value to the business is the lower of replacement cost and recoverable amount.
Recoverable amount is the higher of realisable value and value in use.
Changing price levels
464 KAPLAN PUBLISHING
Test your understanding 1
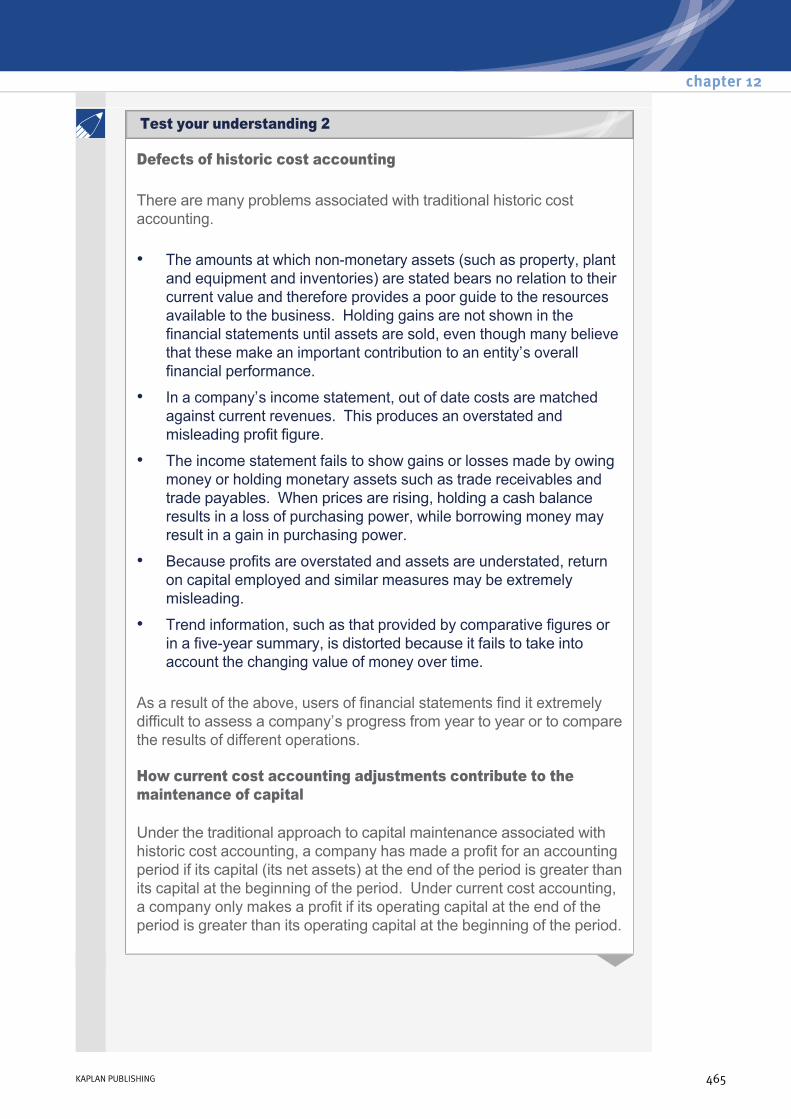
Defects of historic cost accounting
There are many problems associated with traditional historic cost accounting.
As a result of the above, users of financial statements find it extremely difficult to assess a company’s progress from year to year or to compare the results of different operations.
How current cost accounting adjustments contribute to the maintenance of capital
Under the traditional approach to capital maintenance associated with historic cost accounting, a company has made a profit for an accounting period if its capital (its net assets) at the end of the period is greater than its capital at the beginning of the period. Under current cost accounting, a company only makes a profit if its operating capital at the end of the period is greater than its operating capital at the beginning of the period.
• The amounts at which nonmonetary assets (such as property, plant and equipment and inventories) are stated bears no relation to their current value and therefore provides a poor guide to the resources available to the business. Holding gains are not shown in the financial statements until assets are sold, even though many believe that these make an important contribution to an entity’s overall financial performance.
• In a company’s income statement, out of date costs are matched against current revenues. This produces an overstated and misleading profit figure.
• The income statement fails to show gains or losses made by owing money or holding monetary assets such as trade receivables and trade payables. When prices are rising, holding a cash balance results in a loss of purchasing power, while borrowing money may result in a gain in purchasing power.
• Because profits are overstated and assets are understated, return on capital employed and similar measures may be extremely misleading.
• Trend information, such as that provided by comparative figures or in a fiveyear summary, is distorted because it fails to take into account the changing value of money over time.
chapter 12
KAPLAN PUBLISHING 465
Test your understanding 2
A company’s operating capital is its ability to produce a certain volume of goods and services.
• The cost of sales adjustment is the difference between the current cost of sales and the historic cost of sales. It uplifts the cost of the inventories sold to their current value to the business rather than their cost. In this way the company only records a profit if they generate sufficient revenue to replace that quantity of inventory at current prices and retain some of the earnings in the business. This is not achieved in historic account, where profits are recorded if the business generates more revenue than the historic cost of inventory sold. This may not be sufficient to purchase replacement inventories in times of rising prices.
• The depreciation adjustment is the difference between depreciation based on the historic cost of property, plant and equipment and depreciation based on current cost (value to the business or deprival value). The company only makes a profit if revenues are sufficient to cover depreciation at current cost levels. This ensures that sufficient earnings are made to replace all its operating assets and to continue production at the same level as before. (Imagine depreciating some plant with a value of $100,000 over ten years. As long as the business generates profits before depreciation of $10,001 a year it wil generate a net profit. However, if it costs the business $150,000 to replace the asset it will not have generated sufficient revenue internally to be able to afford the replacement without additional finance.)
• The loss on net monetary position (sometimes called the monetary working capital adjustment) is the increase in the real value of monetary working capital (trade receivables and trade payables) that has occurred during the year. When trade receivables are realised in cash the company makes a loss because the cash is based on the historic amount of the debt rather than the current amount. (Imagine if the business had received the cash instantly; they could place it in a bank and earn interest. By offering 60 days credit they lose earnings!). The adjustment recognises this loss in the income statement and ensures that enough earnings are retained in the business to maintain the current level of monetary working capital.
Changing price levels
466 KAPLAN PUBLISHING
Financial instrumentsChapter learning objectives
On completion of their studies students should be able to:
• Discuss the principle of substance over form applied to the treatment of financial instruments;
• Discuss the possible treatments of financial instruments in the issuer's accounts (i.e. liabilities versus equity, and the implications for finance costs);
• Identify and discuss circumstances in which amortised cost, fair value and hedge accounting are appropriate for financial instruments, explain the principles of these accounting methods and discuss considerations in the determination of fair value;
• Explain the correct treatment for foreign loans financing foreign equity investments.
467
chapter
13
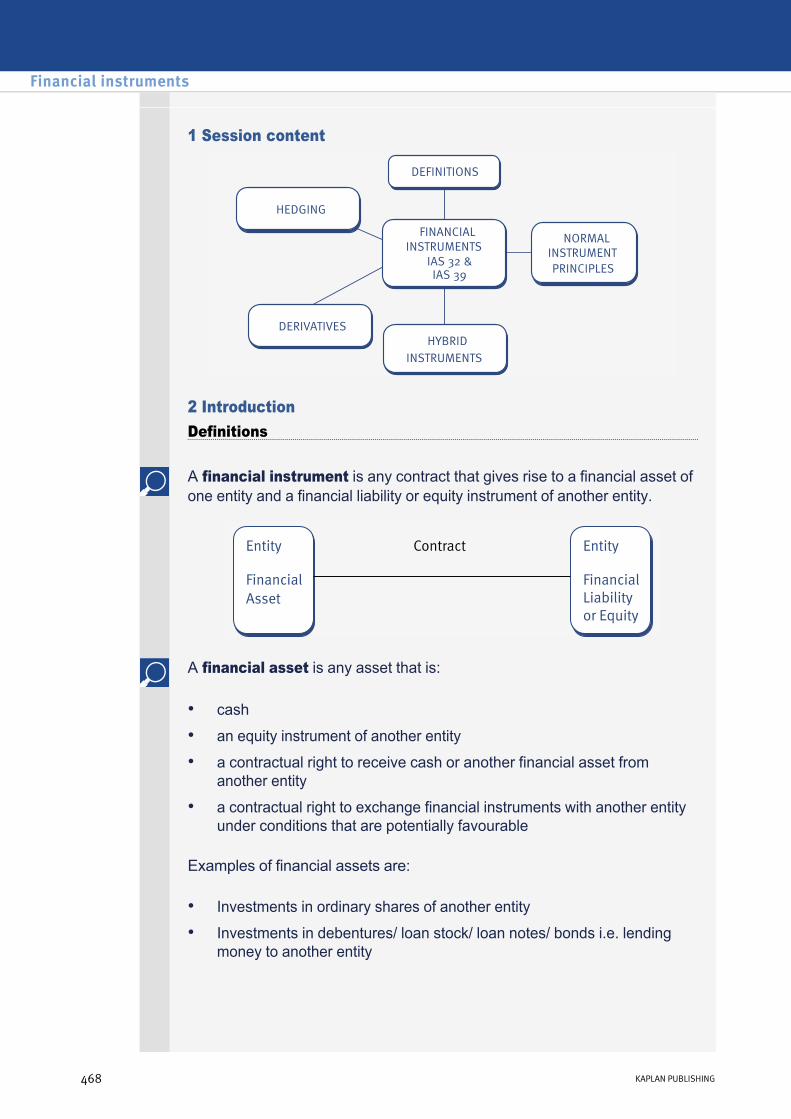
1 Session content
2 IntroductionDefinitions
A financial instrument is any contract that gives rise to a financial asset of one entity and a financial liability or equity instrument of another entity.
A financial asset is any asset that is:
Examples of financial assets are:
• cash
• an equity instrument of another entity
• a contractual right to receive cash or another financial asset from another entity
• a contractual right to exchange financial instruments with another entity under conditions that are potentially favourable
• Investments in ordinary shares of another entity
• Investments in debentures/ loan stock/ loan notes/ bonds i.e. lending money to another entity
Financial instruments
468 KAPLAN PUBLISHING468 KAPLAN PUBLISHING
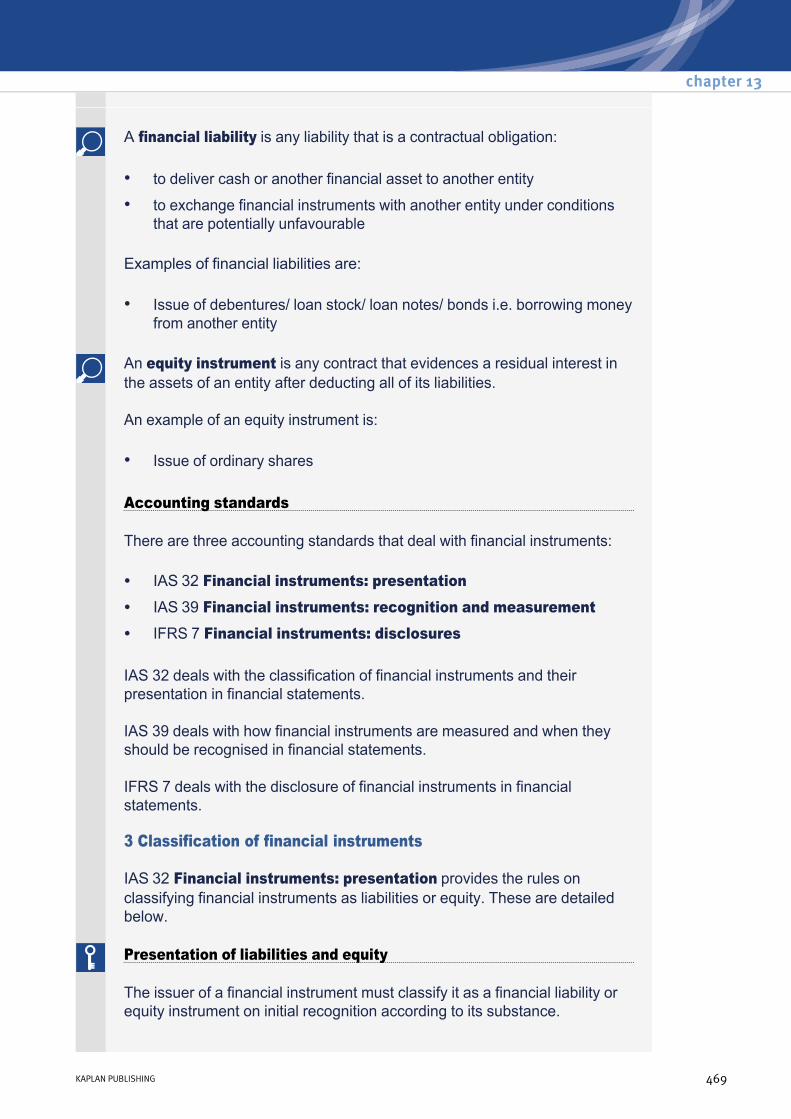
A financial liability is any liability that is a contractual obligation:
Examples of financial liabilities are:
• to deliver cash or another financial asset to another entity
• to exchange financial instruments with another entity under conditions that are potentially unfavourable
• Issue of debentures/ loan stock/ loan notes/ bonds i.e. borrowing money from another entity
An equity instrument is any contract that evidences a residual interest in the assets of an entity after deducting all of its liabilities.
An example of an equity instrument is:
• Issue of ordinary shares
Accounting standards
There are three accounting standards that deal with financial instruments:
IAS 32 deals with the classification of financial instruments and their presentation in financial statements.
IAS 39 deals with how financial instruments are measured and when they should be recognised in financial statements.
IFRS 7 deals with the disclosure of financial instruments in financial statements.
• IAS 32 Financial instruments: presentation
• IAS 39 Financial instruments: recognition and measurement
• IFRS 7 Financial instruments: disclosures
3 Classification of financial instruments
IAS 32 Financial instruments: presentation provides the rules on classifying financial instruments as liabilities or equity. These are detailed below.
Presentation of liabilities and equity
The issuer of a financial instrument must classify it as a financial liability or equity instrument on initial recognition according to its substance.
chapter 13
KAPLAN PUBLISHING 469

Financial liabilities
The instrument will be classified as a liability if the issuer has a contractual obligation:
A redeemable preference share will be classified as a liability, because the issuer has the contractual obligation to deliver cash to the holders on the redemption date.
Equity instruments
A financial instrument is only an equity instrument if there is no such contractual obligation.
• to deliver cash (or another financial asset) to the holder
• to exchange financial instruments on potentially unfavourable terms.
Interest, dividends, losses and gains
• The accounting treatment of interest, dividends, losses and gains relating to a financial instrument follows the treatment of the instrument itself.
• For example, dividends paid in respect of preference shares classified as a liability will be charged as a finance expense through profit or loss.
• Dividends paid on shares classified as equity will be reported in the statement of changes in equity.
Offsetting a financial asset and a financial liability
IAS 32 states that a financial asset and a financial liability may only be offset in very limited circumstances. The net amount may only be reported when the entity:
• has a legally enforceable right to set off the amounts
• intends either to settle on a net basis, or to realise the asset and settle the liability simultaneously.
4 Recognition and measurement of financial instruments
IAS 39 Financial instruments: recognition and measurement provides guidance as to when financial instruments should be recognised in the financial statements and how they should be measured.
Initial recognition of financial instruments
An entity should recognise a financial asset or a financial liability in its statement of financial position when, and only when, it becomes a party to the contractual provisions of the instrument.
Financial instruments
470 KAPLAN PUBLISHING

Initial measurement of financial instruments
A financial asset or liability should be initially recognised at its fair value. Except in the case of assets or liabilities at fair value through profit or loss (see next section), directly attributable transaction costs are added to an asset and deducted from a liability.
Determining fair value
IAS 39 provides the following guidelines for determining fair value, in order of preference:
(1) Quoted market prices
(2) If there is no active market, use a valuation technique referring to, where possible, market conditions e.g. recent transactions at arm's length, discounted cash flow techniques, market value of similar instruments, option pricing models.
(3) Where there is no active market and no reliable estimate of fair value can be made, measure the financial instrument at cost less any impairment.
Subsequent measurement of financial instruments
Subsequent measurement of financial instruments depends on how that particular financial instrument is classified.
IAS 39 deals separately with four types of financial asset and two types of financial liability.
chapter 13
KAPLAN PUBLISHING 471
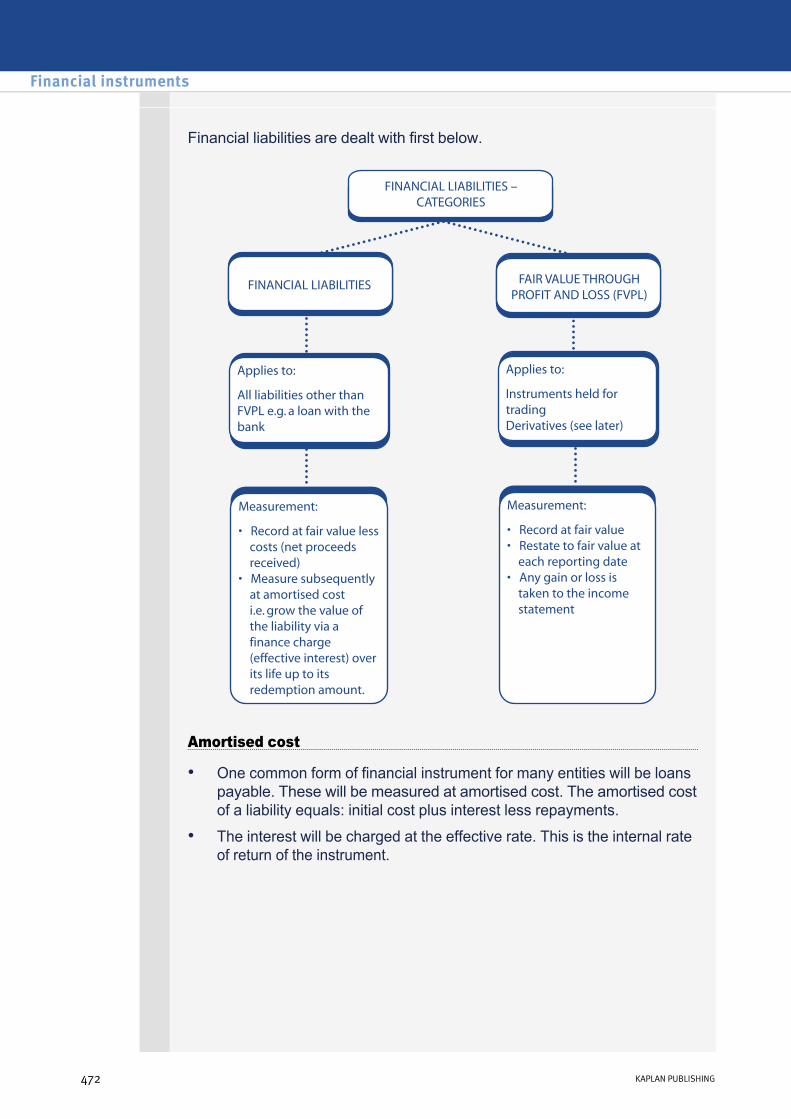
Financial liabilities are dealt with first below.
Amortised cost
• One common form of financial instrument for many entities will be loans payable. These will be measured at amortised cost. The amortised cost of a liability equals: initial cost plus interest less repayments.
• The interest will be charged at the effective rate. This is the internal rate of return of the instrument.
Financial instruments
472 KAPLAN PUBLISHING

The simplest way to prepare a working for amortised cost is to use the following table.
The opening balance in year 1 is the net proceeds:
Effective interest is charged to the income statement (IS):
The coupon paid is the coupon percentage multiplied by the face value of the debt:
The closing balance is the figure for the statement of financial position (SFP) at the reporting date.
Year Opening balance
Effective interest % (IS)
Coupon paid %
Closing balance (SFP)
$ $ $ $1 X X (X) X2 X X (X) X3 X X (X) X
• Dr Cash
• Cr Liability
• Dr Finance costs (IS)
• Cr Liability
• Dr Liability
• Cr Cash
chapter 13
KAPLAN PUBLISHING 473
Example 1 answer
Example 1
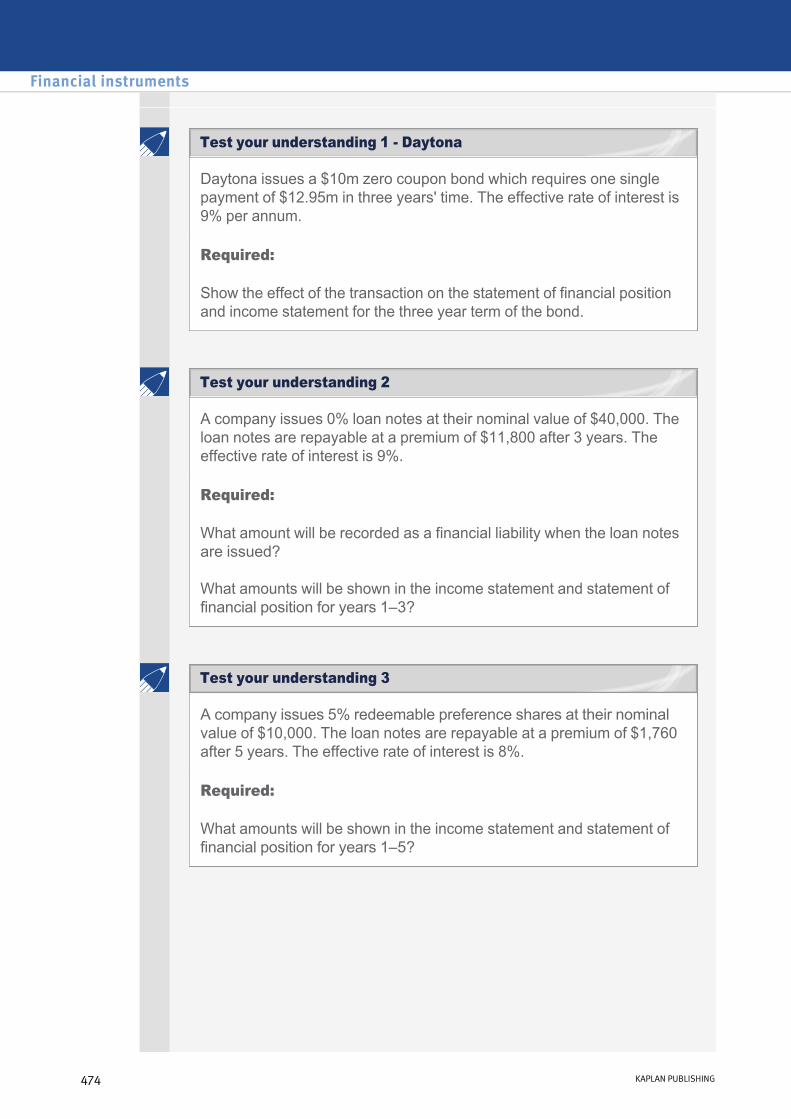
Daytona issues a $10m zero coupon bond which requires one single payment of $12.95m in three years' time. The effective rate of interest is 9% per annum.
Required:
Show the effect of the transaction on the statement of financial position and income statement for the three year term of the bond.
A company issues 0% loan notes at their nominal value of $40,000. The loan notes are repayable at a premium of $11,800 after 3 years. The effective rate of interest is 9%.
Required:
What amount will be recorded as a financial liability when the loan notes are issued?
What amounts will be shown in the income statement and statement of financial position for years 1–3?
A company issues 5% redeemable preference shares at their nominal value of $10,000. The loan notes are repayable at a premium of $1,760 after 5 years. The effective rate of interest is 8%.
Required:
What amounts will be shown in the income statement and statement of financial position for years 1–5?
Financial instruments
474 KAPLAN PUBLISHING
Test your understanding 1 Daytona
Test your understanding 2
Test your understanding 3
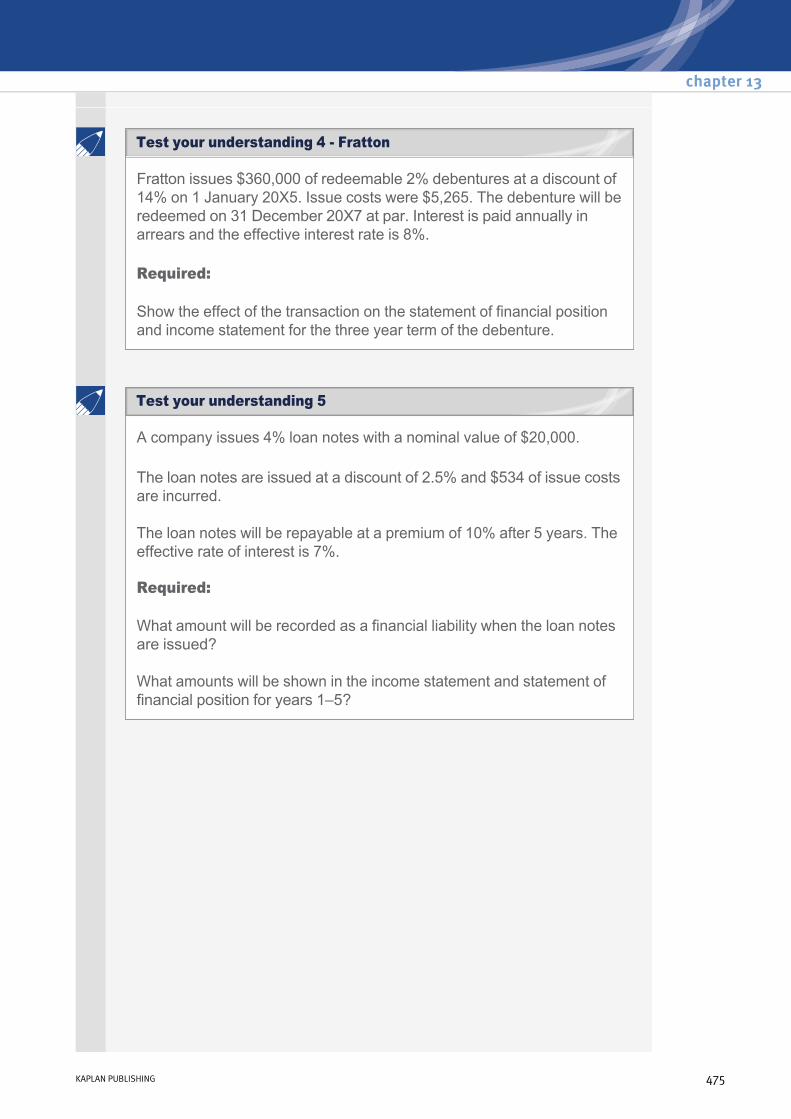
Fratton issues $360,000 of redeemable 2% debentures at a discount of 14% on 1 January 20X5. Issue costs were $5,265. The debenture will be redeemed on 31 December 20X7 at par. Interest is paid annually in arrears and the effective interest rate is 8%.
Required:
Show the effect of the transaction on the statement of financial position and income statement for the three year term of the debenture.
A company issues 4% loan notes with a nominal value of $20,000.
The loan notes are issued at a discount of 2.5% and $534 of issue costs are incurred.
The loan notes will be repayable at a premium of 10% after 5 years. The effective rate of interest is 7%.
Required:
What amount will be recorded as a financial liability when the loan notes are issued?
What amounts will be shown in the income statement and statement of financial position for years 1–5?
chapter 13
KAPLAN PUBLISHING 475
Test your understanding 4 Fratton
Test your understanding 5
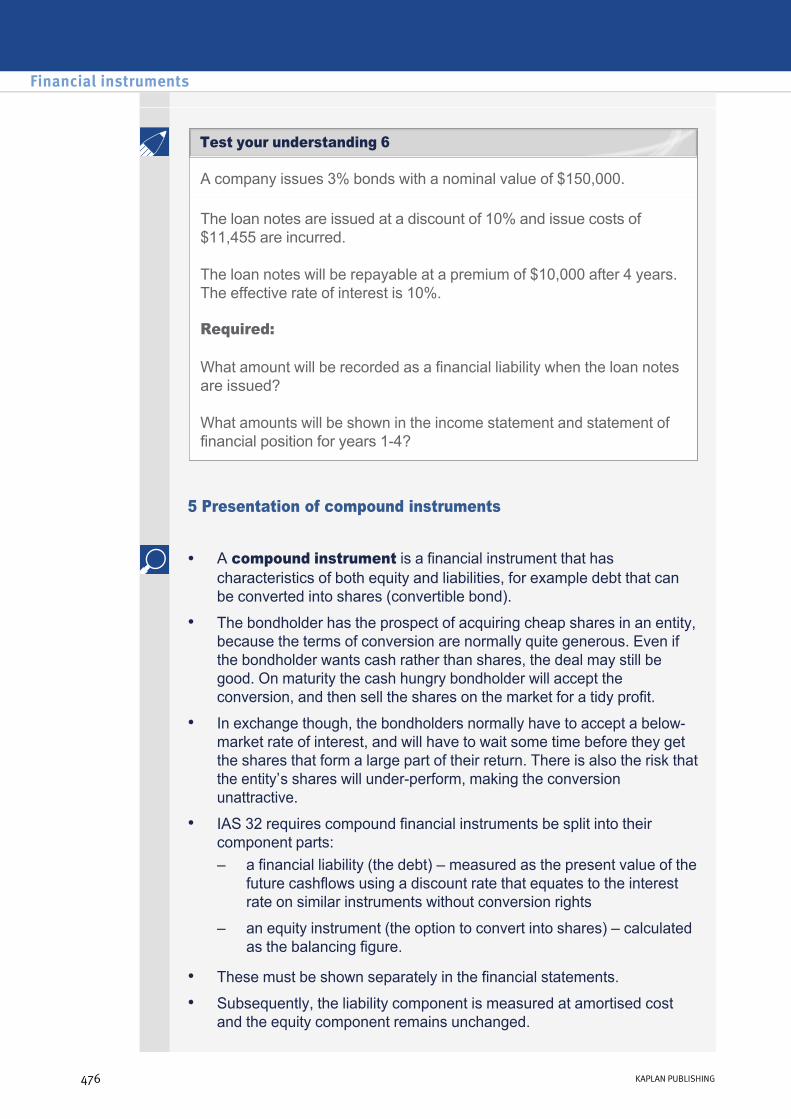
A company issues 3% bonds with a nominal value of $150,000.
The loan notes are issued at a discount of 10% and issue costs of $11,455 are incurred.
The loan notes will be repayable at a premium of $10,000 after 4 years. The effective rate of interest is 10%.
Required:
What amount will be recorded as a financial liability when the loan notes are issued?
What amounts will be shown in the income statement and statement of financial position for years 14?
5 Presentation of compound instruments
• A compound instrument is a financial instrument that has characteristics of both equity and liabilities, for example debt that can be converted into shares (convertible bond).
• The bondholder has the prospect of acquiring cheap shares in an entity, because the terms of conversion are normally quite generous. Even if the bondholder wants cash rather than shares, the deal may still be good. On maturity the cash hungry bondholder will accept the conversion, and then sell the shares on the market for a tidy profit.
• In exchange though, the bondholders normally have to accept a belowmarket rate of interest, and will have to wait some time before they get the shares that form a large part of their return. There is also the risk that the entity’s shares will underperform, making the conversion unattractive.
• IAS 32 requires compound financial instruments be split into their component parts: – a financial liability (the debt) – measured as the present value of the
future cashflows using a discount rate that equates to the interest rate on similar instruments without conversion rights
– an equity instrument (the option to convert into shares) – calculated as the balancing figure.
• These must be shown separately in the financial statements.
• Subsequently, the liability component is measured at amortised cost and the equity component remains unchanged.
Financial instruments
476 KAPLAN PUBLISHING
Test your understanding 6
An entity issues 3,000 convertible bonds at the start of year 1 at par. They have a three year term and a face value of $1,000 per bond. Interest is payable annually in arrears at 7% per annum. Each bond is convertible at any time up to maturity into 250 common shares. When the bonds are issued, the prevailing market interest rate for similar debt without conversion options is 9%.
Required:
How is this initially recorded?
What will be shown in the statement of financial position and income statement for year 1?
A company issues 2% convertible bonds at their nominal value of $36,000.
The bonds are convertible at any time up to maturity into 120 ordinary shares for each $100 of bond. Alternatively the bonds will be redeemed at par after 3 years.
Similar nonconvertible bonds would carry an interest rate of 9%.
Required:
What amounts will be shown as a financial liability and as equity when the convertible bonds are issued?
What amounts will be shown in the income statement and statement of financial position for year 1?
chapter 13
KAPLAN PUBLISHING 477
Test your understanding 7 Hybrid
Test your understanding 8
Example 2 answer
Example 2
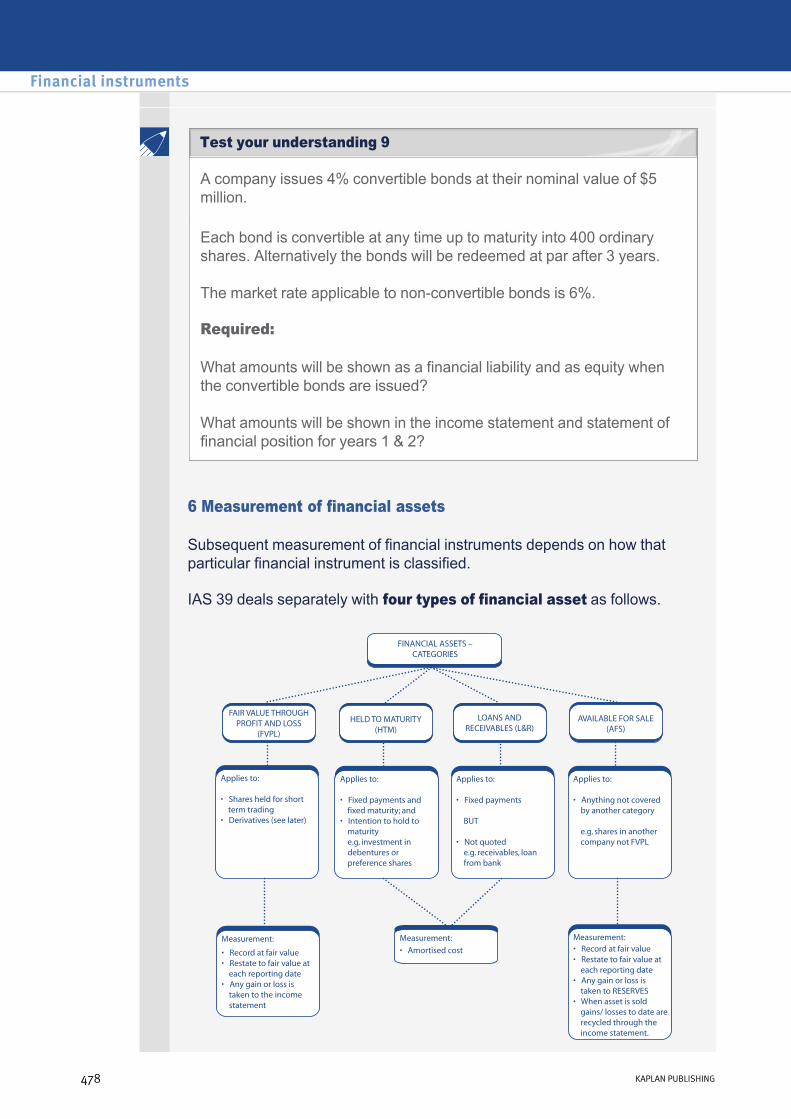
A company issues 4% convertible bonds at their nominal value of $5 million.
Each bond is convertible at any time up to maturity into 400 ordinary shares. Alternatively the bonds will be redeemed at par after 3 years.
The market rate applicable to nonconvertible bonds is 6%.
Required:
What amounts will be shown as a financial liability and as equity when the convertible bonds are issued?
What amounts will be shown in the income statement and statement of financial position for years 1 & 2?
6 Measurement of financial assets
Subsequent measurement of financial instruments depends on how that particular financial instrument is classified.
IAS 39 deals separately with four types of financial asset as follows.
Financial instruments
478 KAPLAN PUBLISHING
Test your understanding 9
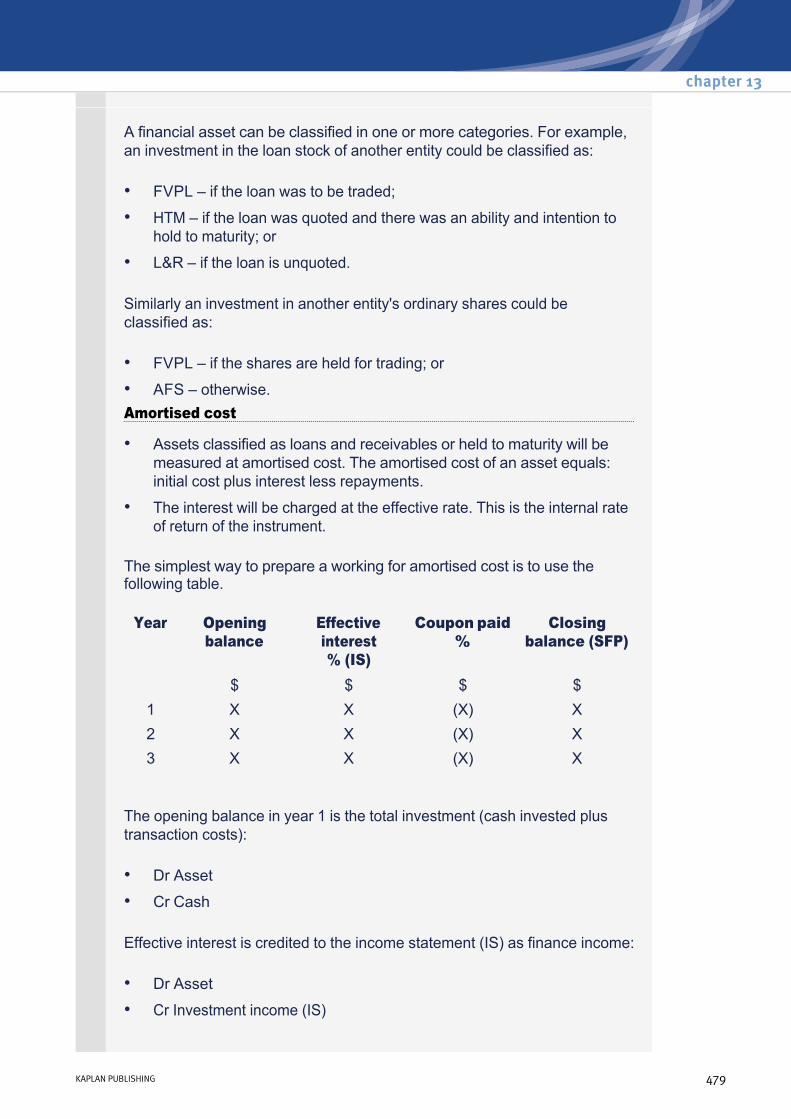
A financial asset can be classified in one or more categories. For example, an investment in the loan stock of another entity could be classified as:
Similarly an investment in another entity's ordinary shares could be classified as:
Amortised cost
The simplest way to prepare a working for amortised cost is to use the following table.
The opening balance in year 1 is the total investment (cash invested plus transaction costs):
Effective interest is credited to the income statement (IS) as finance income:
• FVPL – if the loan was to be traded;
• HTM – if the loan was quoted and there was an ability and intention to hold to maturity; or
• L&R – if the loan is unquoted.
• FVPL – if the shares are held for trading; or
• AFS – otherwise.
• Assets classified as loans and receivables or held to maturity will be measured at amortised cost. The amortised cost of an asset equals: initial cost plus interest less repayments.
• The interest will be charged at the effective rate. This is the internal rate of return of the instrument.
Year Opening balance
Effective interest % (IS)
Coupon paid %
Closing balance (SFP)
$ $ $ $1 X X (X) X2 X X (X) X3 X X (X) X
• Dr Asset
• Cr Cash
• Dr Asset
• Cr Investment income (IS)
chapter 13
KAPLAN PUBLISHING 479
The coupon received is the coupon percentage multiplied by the face value of the loan:
The closing balance is the figure for the statement of financial position (SFP) at the reporting date.
• Dr Cash
• Cr Asset
Ashes has the following financial assets:
Required:
How should Ashes classify its financial assets?
(1) Investments held for trading purposes.
(2) Interestbearing debt instruments that will be redeemed in five years; Ashes fully intends to hold them until redemption.
(3) A trade receivable.
(4) Derivatives held for speculation purposes.
(5) Equity shares that Ashes has no intention of selling.
A company invests $5,000 in 10% debentures. The debentures are repayable at a premium after 3 years and A intends to hold the debentures until this time. The effective rate of interest is 12%.
Required:
What amounts will be shown in the income statement and statement of financial position for years 13?
A company invested in 10,000 shares of a listed company in November 20X7 at a cost of $4.20 per share. At 31 December 20X7 the shares have a market value of $4.90. The company are planning on selling these shares in April 20X8.
Financial instruments
480 KAPLAN PUBLISHING
Test your understanding 10
Test your understanding 11
Test your understanding 12

Required:
Prepare extracts from the income statement for the year ended 31 December 20X7 and a statement of financial position as at that date.
7 Impairment of financial assets
Impairments apply only to assets categorised as held to maturity or loans and receivables i.e. those that are measured at amortised cost.
Financial assets held for trading or available for sale are measured at fair value and therefore incorporate any fall in value automatically.
Impairment rules per ISA 39 are as follows:
• Assess at each reporting date whether there is any evidence of impairment.
• If there is evidence, a detailed impairment review must be undertaken.
• The impairment loss (if not given in the question) is the difference between the carrying amount and the present value of the cash flows estimated to arise from the asset, discounted at the asset's original effective interest rate.
• Impairment losses are recognised through the income statement.
8 Derivative financial instruments
Definition of derivatives
A derivative is a financial instrument that derives its value from the value of an underlying asset, price, rate or index.
• Underlying items include equities, bonds, commodities, interest rates, exchange rates and stock market and other indices.
• Derivative financial instruments include futures, options, forward contracts, interest rate and currency swaps.
Characteristics of a derivative
A derivative has all of the following characteristics:
• Its value changes in response to changes in the underlying item.
• It requires little or no initial investment.
• It is settled at a future date.
chapter 13
KAPLAN PUBLISHING 481
Recognition and measurement
All derivatives are categorised as fair value through the profit and loss (FVPL).
On initial recognition they are recorded at fair value which is usually zero as the derivative gains value as the underlying item's price moves.
At each reporting date, the derivative is restated to fair value and recorded as a financial asset or financial liability on the statement of financial position. Any gains/losses are taken to the income statement.
There is an exception to this rule if the derivative is being used as a hedging instrument (see later notes).
Types of derivative
• Forward – the obligation to buy or sell a defined amount of a specific underlying asset, at a specified price at a specified future date.
• Forward rate agreements – a contract to fix the interest charge on a floating rate loan.
• Futures contracts – the obligation to buy or sell a standard quantity of a specific underlying item at a specified future date.
• Swaps – an agreement to exchange periodic payments at specified intervals over a specified time period.
• Options – the right, but not the obligation, to buy or sell a specific underlying asset on or before a specified future date.
Financial instruments
482 KAPLAN PUBLISHING
The risks associated with derivatives
Types of derivatives further detail
Example 3
Example 3 answer
B entered into a forward contract on 30 November 20X1 to buy platinum for $435m on 31 March 20X2. The contract was entered into on 30 November 20X1 at nil cost.
B does not plan to take delivery of the platinum but to settle the contract net in cash, i.e. B hopes to generate a profit from short term price fluctuations.
The year end is 31 December 20X1 and the price of platinum has moved so that making the equivalent purchase on 31 December 20X1 would require B to spend $455m.
On 31 March 20X2, the value of the underlying item has changed such that the equivalent purchase of platinum would now cost $442m.
Required:
Prepare journal entries to record the above transaction.
On 1 March 20X1, ABC decided to enter into a forward foreign exchange contract to buy 5 million florins on 31 January 20X3. ABC's reporting date is 30 June.
Relevant exchange rates were as follows:
Required:
Prepare relevant extracts from ABC's statement of comprehensive income and statement of financial position to reflect the forward foreign exchange contract at 30 June 20X2, with comparatives.
1 March 20X1 $1 = 5 florins 30 June 20X1 $1 = 4.7 florins30 June 20X2 $1 = 4.2 florins
chapter 13
KAPLAN PUBLISHING 483
Test your understanding 14
Test your understanding 13
9 Hedge accounting
Definitions
Hedging is a method of managing risk by designating one or more hedging instruments so that their change in fair value is offset, in whole or in part, to the change in fair value or cash flows of a hedged item.
A hedged item is an asset or liability that exposes the entity to risks of changes in fair value or future cash flows (and is designated as being hedged).
A hedging instrument is a designated derivative whose fair value or cash flows are expected to offset changes in fair value or future cash flows of the hedged item.
Special hedge accounting rules apply to reflect the substance of the arrangement, i.e. to ensure that the gains and losses are offset.
Conditions for hedge accounting
Hedge accounting may only be used if certain conditions are met:
Types of hedge
There are three types of hedging arrangement:
• Arrangement must be designated as a hedge at the inception. There must be formal documentation which identifies: – hedged item;
– hedge instrument;
– nature of risk that is to be hedged;
– how the entity will assess the hedging instrument's effectiveness.
• Hedge is expected to be highly effective (80% 125%).
• Effectiveness is capable of reliable measurement.
• Assessment of effectiveness takes place on an ongoing basis.
• fair value hedge;
• cashflow hedge;
• net investment in a foreign operation.
Fair value hedge
The risk being hedged is the change in the fair value of an asset or liability, which is already recognised in the financial statements.
Financial instruments
484 KAPLAN PUBLISHING
Hedge accounting requires both the hedged item and the hedging instrument to be measured at fair value at each year end.
The changes in fair value of both the hedged item and hedging instrument are recognised in the income statement and will offset each other.
An entity owns inventories of 10,000 tons of steel which cost $100,000 on 1 December 20X5.
If the price of steel falls, the entity will suffer a loss when they sell the steel. To minimise this risk, it enters into a futures contract to sell 10,000 tons of steel for $120,000 on 1 February 20X6 i.e. at a price of $12 per ton.
At the year end of 31 December 20X5, the market value of the steel is $9 per ton and the futures price for delivery on 1 February 20X6 is $11 per ton.
Required:
What is the impact of the fair value hedge on the financial statements of the entity at 31 December 20X5?
Solution
The hedged item is the steel. The hedging instrument is the futures contract (a derivative).
At the year end both the hedged item and hedging instrument will be measured at fair value and gains or losses recorded in the income statement.
The overall effect on the income statement is nil (gain of $10,000 on derivative less loss of $10,000 on inventory).
Hedged item (steel) 10,000 tons x £9 per ton $90,000Cr Inventory $10,000Dr Income statement (loss) $10,000 Hedging instrument (futures contract) 10,000 x (12–11) $10,000Dr Derivative (financial asset) $10,000Cr Income statement (gain) $10,000
chapter 13
KAPLAN PUBLISHING 485
Illustration 1

Cashflow hedge
The risk being hedged is the change in future cash flows.
The future cash flows will not impact on profits until they occur in the future. Therefore the gain or loss on the hedging instrument should not impact on profits until the future.
Instead the gain or loss on the hedging instrument is recorded in reserves and then transferred back to the income statement when the hedged item affects the income statement.
An entity based in the US expects sales of €300m in September 20X2. There is a risk that the euro dollar exchange rate will rise, reducing the dollar value of the sales.
Before the yearend on 30 June 20X2, the entity takes out a forward contract to sell €300m on 30 September 20X2 at an agreed exchange rate of €2:$1.
At 30 June 20X2, the exchange rate is €2.5 = $1.
At 30 September 20X2, the exchange rate is €3 = $1.
Required:
What is the impact of the cash flow hedge on the financial statements of the entity at 30 June 20X2 and 30 June 20X3?
Solution
Year ended 30 June 20X2
At 30 June 20X2, the hedging instrument i.e. the forward contract will be measured at fair value with the gain or loss being recognised in equity i.e. reserves:
Year ended 30 June 20X3
Gain on the forward contract at 30 September 20X2:
(€300m ÷ 2) – (€300m ÷ 3) = £50m gain in total
Dr Forward contract $30mCr Equity – gain $30m
(€300m ÷ 2) – (€300m ÷ 2.5)
Financial instruments
486 KAPLAN PUBLISHING
Illustration 2
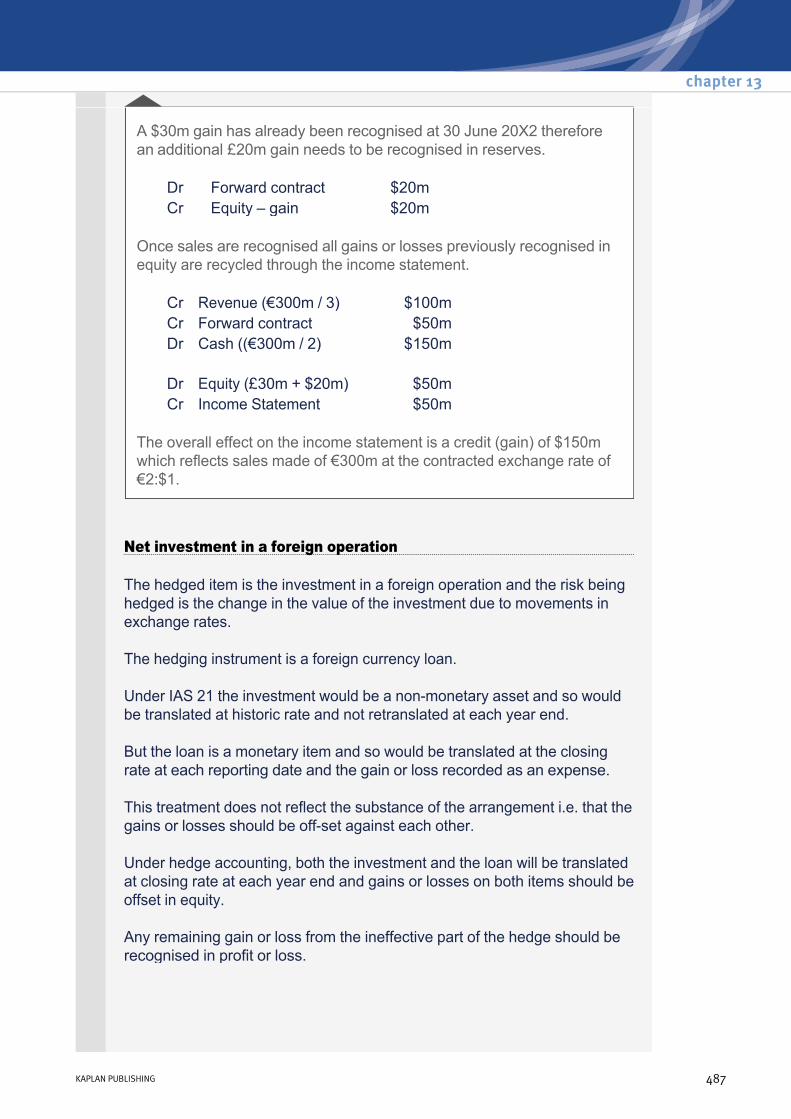
A $30m gain has already been recognised at 30 June 20X2 therefore an additional £20m gain needs to be recognised in reserves.
Once sales are recognised all gains or losses previously recognised in equity are recycled through the income statement.
The overall effect on the income statement is a credit (gain) of $150m which reflects sales made of €300m at the contracted exchange rate of €2:$1.
Dr Forward contract $20mCr Equity – gain $20m
Cr Revenue (€300m / 3) $100mCr Forward contract $50mDr Cash ((€300m / 2) $150m Dr Equity (£30m + $20m) $50mCr Income Statement $50m
Net investment in a foreign operation
The hedged item is the investment in a foreign operation and the risk being hedged is the change in the value of the investment due to movements in exchange rates.
The hedging instrument is a foreign currency loan.
Under IAS 21 the investment would be a nonmonetary asset and so would be translated at historic rate and not retranslated at each year end.
But the loan is a monetary item and so would be translated at the closing rate at each reporting date and the gain or loss recorded as an expense.
This treatment does not reflect the substance of the arrangement i.e. that the gains or losses should be offset against each other.
Under hedge accounting, both the investment and the loan will be translated at closing rate at each year end and gains or losses on both items should be offset in equity.
Any remaining gain or loss from the ineffective part of the hedge should be recognised in profit or loss.
chapter 13
KAPLAN PUBLISHING 487

Perry had partly financed an investment of DM750m in a foreign company via the use of a loan of DM600m taken out on the 1 January 20X1.
Exchange rates were as follows:
The above hedging arrangement satisfies the requirements for offset per IAS 39.
Required:
What is the impact of the net investment hedge on the financial statements of the entity at 31 December 20X1?
Solution
Both the investment and the loan will initially be translated at historic rate and retranslated at closing rate at the year end:
The gain and loss is offset against each other in equity. The remaining $10m gain is recognised in profit and loss as it represents the ineffective part of the hedge.
DM to $
01.01.X1 3.0
31.12.X1 2.5
Investment Loan
Historic rate
DM 750 / 3 $250 Historic rate
DM 600 / 3 $200
Closing rate
DM 750 / 2.5
$300 Closing rate
DM 600 / 2.5
$240
Gain $50 Loss $40
Financial instruments
488 KAPLAN PUBLISHING
Illustration 3
10 Disclosure of financial instruments
IFRS 7 Financial instruments: disclosures provides the disclosure requirements for financial instruments. A summary of the requirements is detailed below.
The two main categories of disclosures required are:
The disclosures should be made by each class of financial instrument.
(1) Information about the significance of financial instruments.
(2) Information about the nature and extent of risks arising from financial instruments.
chapter 13
KAPLAN PUBLISHING 489
IFRS 7 Disclosures

11 Chapter summary
Financial instruments
490 KAPLAN PUBLISHING
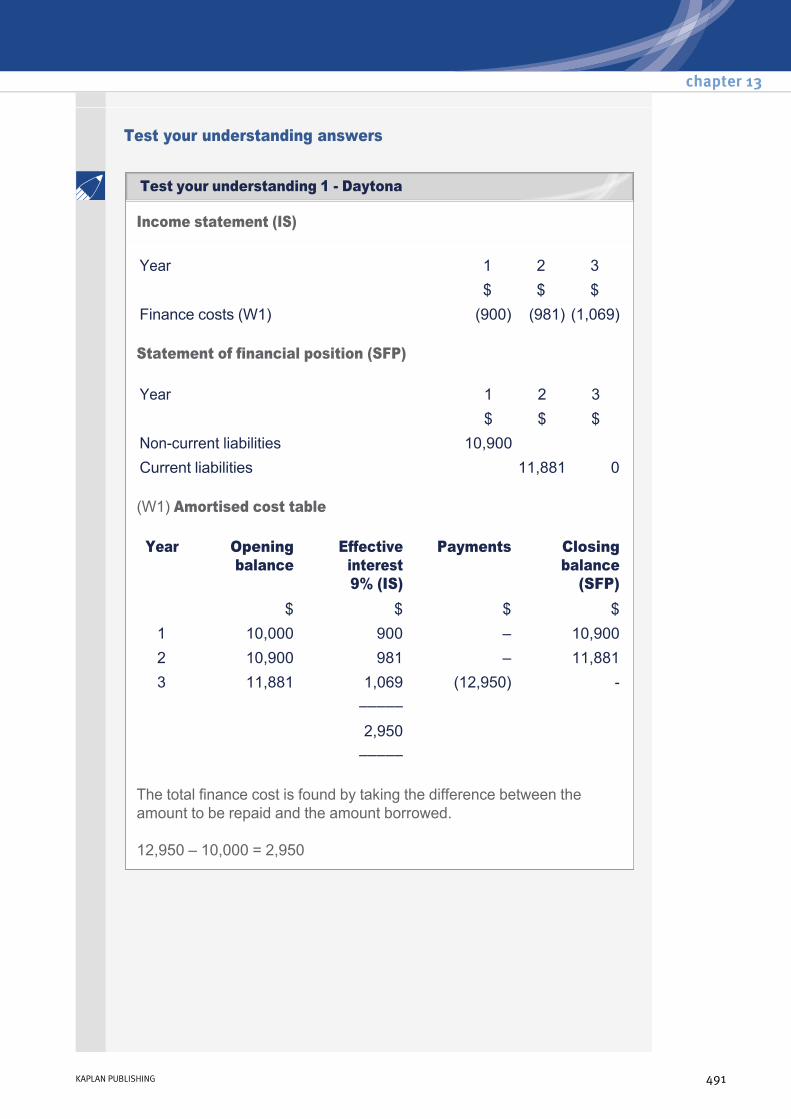
Test your understanding answers
Income statement (IS)
Statement of financial position (SFP)
(W1) Amortised cost table
The total finance cost is found by taking the difference between the amount to be repaid and the amount borrowed.
12,950 – 10,000 = 2,950
Year 1 2 3 $ $ $Finance costs (W1) (900) (981) (1,069)
Year 1 2 3 $ $ $Noncurrent liabilities 10,900 Current liabilities 11,881 0
Year Opening balance
Effective interest 9% (IS)
Payments Closing balance
(SFP) $ $ $ $1 10,000 900 – 10,9002 10,900 981 – 11,8813 11,881 1,069 (12,950) –––––
2,950 –––––
chapter 13
KAPLAN PUBLISHING 491
Test your understanding 1 Daytona
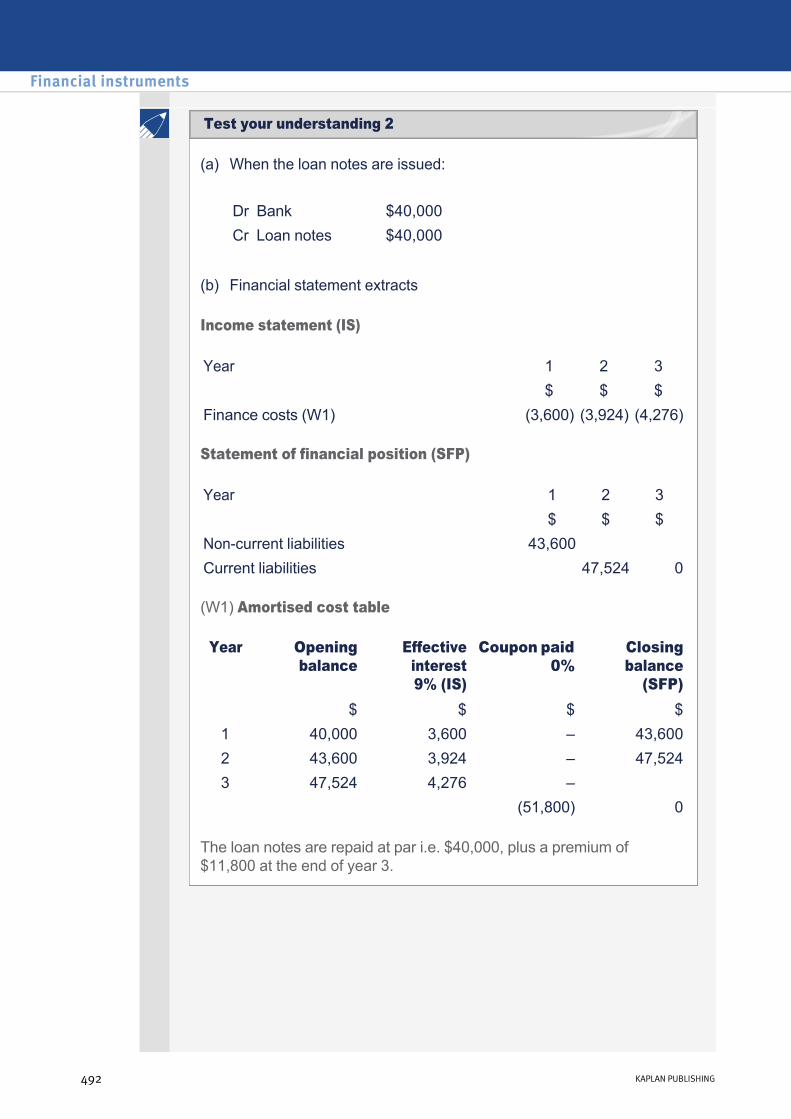
(a) When the loan notes are issued:
Income statement (IS)
Statement of financial position (SFP)
(W1) Amortised cost table
The loan notes are repaid at par i.e. $40,000, plus a premium of $11,800 at the end of year 3.
Dr Bank $40,000Cr Loan notes $40,000
(b) Financial statement extracts
Year 1 2 3 $ $ $Finance costs (W1) (3,600) (3,924) (4,276)
Year 1 2 3 $ $ $Noncurrent liabilities 43,600 Current liabilities 47,524 0
Year Opening balance
Effective interest 9% (IS)
Coupon paid 0%
Closing balance
(SFP) $ $ $ $1 40,000 3,600 – 43,6002 43,600 3,924 – 47,5243 47,524 4,276 – (51,800) 0
Financial instruments
492 KAPLAN PUBLISHING
Test your understanding 2

Income statement (IS)
Statement of financial position (SFP)
(W1) Amortised cost table
Note: Effective interest rate is multiplied by opening balance.
Note: Coupon rate is multiplied by face value of debt i.e. $10,000.
Year 1 2 3 4 5 $ $ $ $ $Finance costs (W1) (800) (824) (850) (878) (908)
Year 1 2 3 4 5 $ $ $ $ $Noncurrent liabilities 10,300 10,624 10,974 Current liabilities 11,352 0
Year Opening balance
Effective interest 8% (IS)
Coupon paid 5%
Closing balance
(SFP) $ $ $ $1 10,000 800 (500) 10,3002 10,300 824 (500) 10,6243 10,624 850 (500) 10,9744 10,974 878 (500) 11,3525 11,352 908 (500)
(11,760) 0
chapter 13
KAPLAN PUBLISHING 493
Test your understanding 3

Amortised cost table
Note: Effective interest rate is multiplied by opening balance.
Note: Coupon rate is multiplied by face value of debt.
Tutorial note
The total finance cost will be as follows:
The total finance cost will be allocated at a constant rate based upon carrying value over the life of the instrument. This is performed by applying the 8% effective interest rate.
(W1) Net proceeds
Year Opening balance
Effective interest 8% (IS)
Coupon paid 2%
Closing balance (SFP)
$ $ $ $1 304,335 24,346 (7,200) 321,4812 321,481 25,719 (7,200) 340,0003 340,000 27,200 (7,200) –––––– (360,000) 0
77,265 ––––––
$Redemption value At par 360,000Payments 2% × 360,000 x 3 years 21,600 –––––– 381,600Net proceeds (W1) 304,335 –––––– Total finance cost 77,265 ––––––
$Nominal value 360,000 Discount 14% (50,400)Issue costs (5,265)
–––––– 304,335 ––––––
Financial instruments
494 KAPLAN PUBLISHING
Test your understanding 4 Fratton

When the loan notes are issued:
Working
Income statement (IS)
Statement of financial position (SFP)
(W1) Amortised cost table
Note: Effective interest rate is multiplied by opening balance.
Note: Coupon rate is multiplied by face value of debt.
Dr Bank $18,966Cr Loan notes $18,966
$ Nominal value 20,000Discount 2.5% (500)Issue costs (534)
–––––– 18,966 ––––––
Year 1 2 3 4 5 $ $ $ $ $Finance costs (W1) (1,328) (1,365) (1,404) (1,446) (1,491)
Year 1 2 3 4 5 $ $ $ $ $Noncurrent liabilities 19,494 20,059 20,663 Current liabilities 21,309 0
Year Opening balance
Effective interest 7% (IS)
Coupon paid 4%
Closing balance (SFP)
1 18,966 1,328 (800) 19,4942 19,494 1,365 (800) 20,0593 20,059 1,404 (800) 20,6634 20,663 1,446 (800) 21,3095 21,309 1,491 (800)
(22,000) 0
chapter 13
KAPLAN PUBLISHING 495
Test your understanding 5
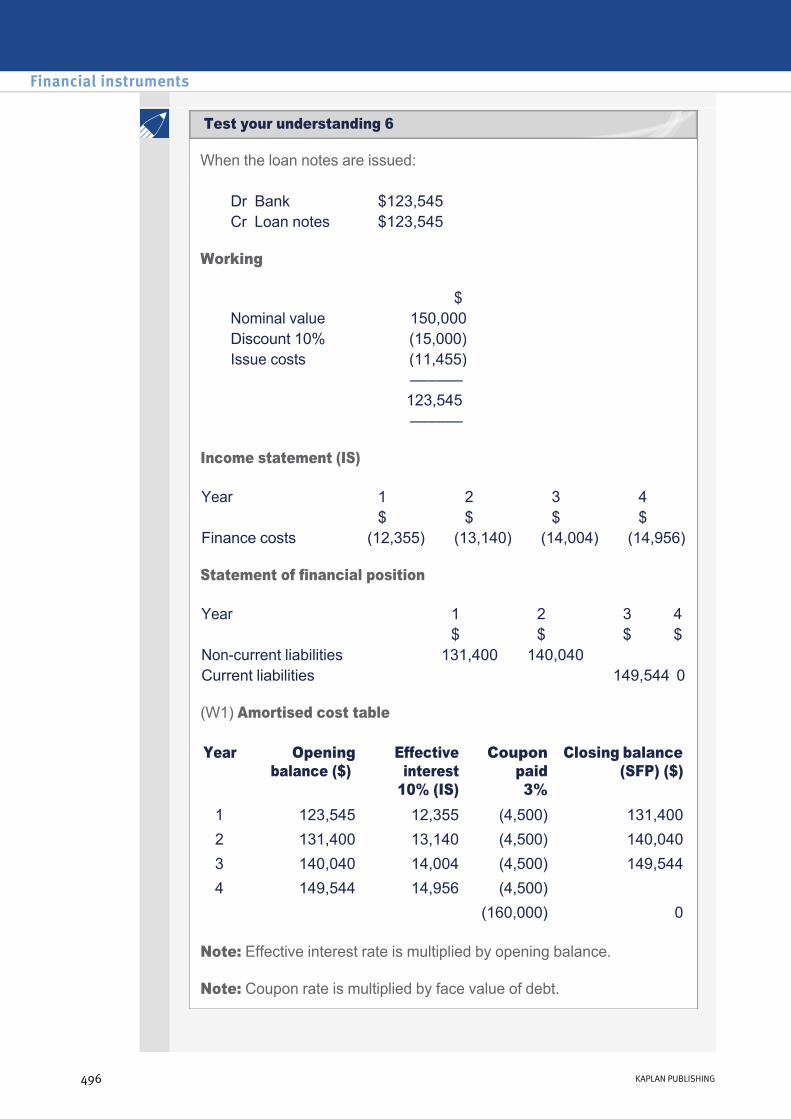
When the loan notes are issued:
Working
Income statement (IS)
Statement of financial position
(W1) Amortised cost table
Note: Effective interest rate is multiplied by opening balance.
Note: Coupon rate is multiplied by face value of debt.
Dr Bank $123,545Cr Loan notes $123,545
$ Nominal value 150,000Discount 10% (15,000)Issue costs (11,455)
–––––– 123,545 ––––––
Year 1 2 3 4 $ $ $ $Finance costs (12,355) (13,140) (14,004) (14,956)
Year 1 2 3 4 $ $ $ $Noncurrent liabilities 131,400 140,040 Current liabilities 149,544 0
Year Opening balance ($)
Effective interest
10% (IS)
Coupon paid 3%
Closing balance (SFP) ($)
1 123,545 12,355 (4,500) 131,4002 131,400 13,140 (4,500) 140,0403 140,040 14,004 (4,500) 149,5444 149,544 14,956 (4,500) (160,000) 0
Financial instruments
496 KAPLAN PUBLISHING
Test your understanding 6

The cash proceeds are 3,000 × $1,000 = $3m
The present value of future cash flows i.e. the liability component will be calculated as:
Thus:
The equity will remain unchanged at $152,490 at subsequent reporting dates.
The debt will change according to the amortised cost table.
Income statement
Statement of financial position
Year Cash flow Discount factors @ 9%
Present value ($)
1 7% × $3m = $210,000 0.917 192,5702 $210,000 0.842 176,8203 $3,210,000 0.772 2,478,120
–––––––– 2,847,510 ––––––––
• The debt will be recorded at $2,847,510.
• The equity will be recorded at (3,000,000 – 2,847,510) $152,490
Year 1Finance costs (W1) (256,276)
Year 1Equity Equity option 152,490 Noncurrent liabilities (W1) 2,893,786
chapter 13
KAPLAN PUBLISHING 497
Test your understanding 7 Hybrid

(W1) Amortised cost table
Note: Effective interest rate is multiplied by opening balance.
Note: Coupon rate is multiplied by face value of debt.
Year Opening balance ($)
Effective interest 9% (IS)
Coupon paid 7%
Closing balance (SFP) ($)
1 2,847,510 256,276 (210,000) 2,893,786
When the convertible bonds are issued:
(W) Cash flow = 2% × 36,000 = $720
Income statement
Dr Bank $36,000Cr Financial Liability $29,614Cr Equity $6,386
Year Cash
flow (W) ($) Discount
factor 9%
Present value ($)
1 720 0.917 6602 720 0.842 6063 36,720 0.772 28,348
–––––––––
29,614 –––––––––
1Finance costs (2,665)
Financial instruments
498 KAPLAN PUBLISHING
Test your understanding 8
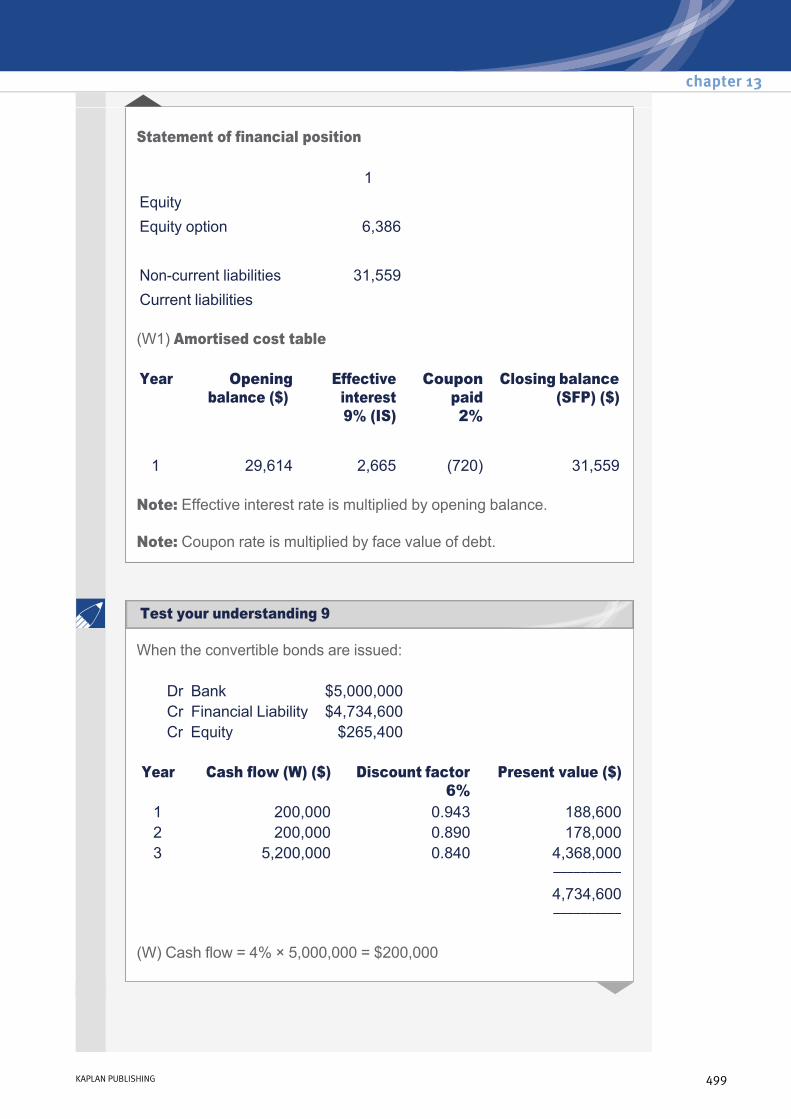
Statement of financial position
(W1) Amortised cost table
Note: Effective interest rate is multiplied by opening balance.
Note: Coupon rate is multiplied by face value of debt.
1Equity Equity option 6,386 Noncurrent liabilities 31,559Current liabilities
Year Opening balance ($)
Effective interest 9% (IS)
Coupon paid 2%
Closing balance (SFP) ($)
1 29,614 2,665 (720) 31,559
When the convertible bonds are issued:
(W) Cash flow = 4% × 5,000,000 = $200,000
Dr Bank $5,000,000Cr Financial Liability $4,734,600Cr Equity $265,400
Year Cash flow (W) ($) Discount factor
6% Present value ($)
1 200,000 0.943 188,6002 200,000 0.890 178,0003 5,200,000 0.840 4,368,000
–––––––––– 4,734,600 ––––––––––
chapter 13
KAPLAN PUBLISHING 499
Test your understanding 9

Income statement
Statement of financial position
(W1) Amortised cost table
Note: Effective interest rate is multiplied by opening balance.
Note: Coupon rate is multiplied by face value of debt.
1 2Finance costs (284,076) (289,121)
1 2Equity Equity option 265,400 265,400 Noncurrent liabilities 4,818,676 Current liabilities 4,907,797
Year Opening balance ($)
Effective interest 6% (IS)
Coupon paid 4%
Closing balance (SFP) ($)
1 4,734,600 284,076 (200,000) 4,818,6762 4,818,676 289,121 (200,000) 4,907,797
Financial asset Classification 1. Investments held for trading purposes
Financial assets at fair value through profit or loss
2. Interestbearing debt instruments that will be redeemed in five years and held to redemption
Heldtomaturity investments
3. A trade receivable Loans and receivables4. Derivatives held for speculation purposes
Financial assets at fair value through profit or loss
5. Equity shares that Ashes has no intention of selling
Availableforsale financial assets (because they do not fit under any other heading)
Financial instruments
500 KAPLAN PUBLISHING
Test your understanding 10

Income statement (IS)
Statement of financial position (SFP)
(W1) Amortised cost table
Note: Effective interest rate is multiplied by opening balance.
Note: Coupon rate is multiplied by face value of debt.
Year 1 2 3 $ $ $Investment income 600 612 625
Year 1 2 3 $ $ $Noncurrent assets Investments 5,100 5,212 0
Year Opening balance ($)
Effective interest
12% (IS)
Coupon received
10%
Closing balance (SFP) ($)
1 5,000 600 (500) 5,1002 5,100 612 (500) 5,2123 5,212 625 (500)
(5,337) 0
chapter 13
KAPLAN PUBLISHING 501
Test your understanding 11
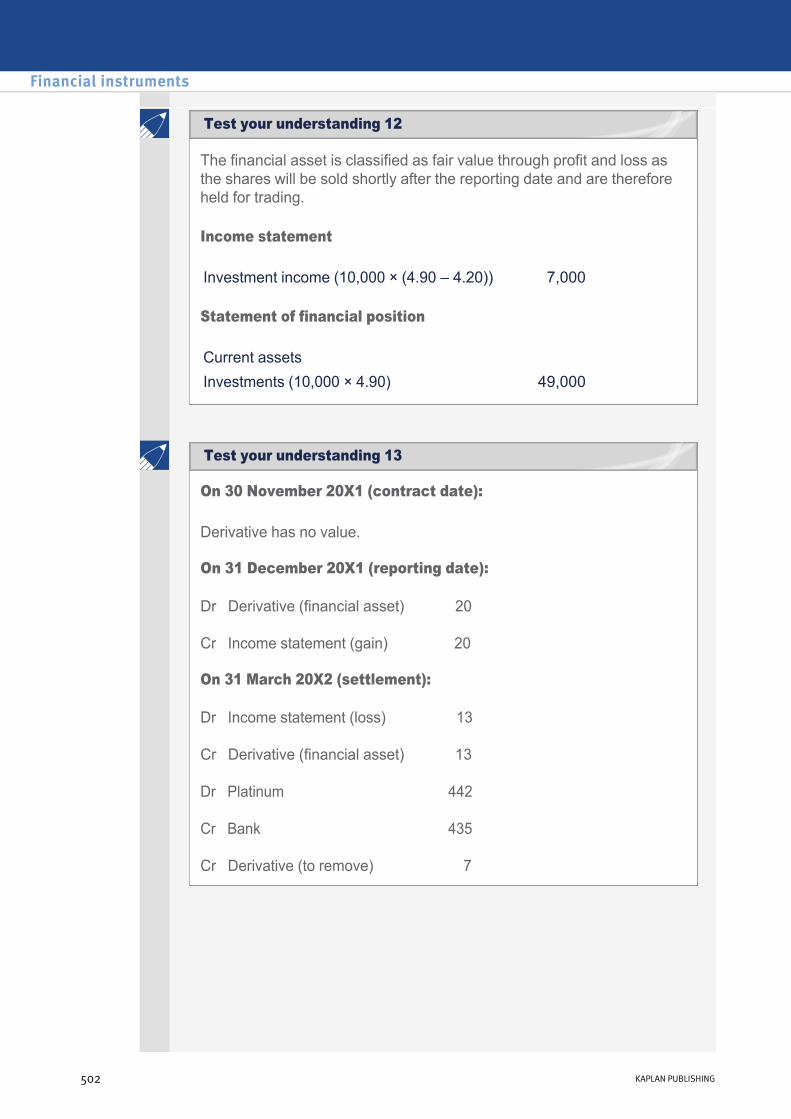
The financial asset is classified as fair value through profit and loss as the shares will be sold shortly after the reporting date and are therefore held for trading.
Income statement
Statement of financial position
Investment income (10,000 × (4.90 – 4.20)) 7,000
Current assets Investments (10,000 × 4.90) 49,000
On 30 November 20X1 (contract date):
Derivative has no value.
On 31 December 20X1 (reporting date):
Dr Derivative (financial asset) 20
Cr Income statement (gain) 20
On 31 March 20X2 (settlement):
Dr Income statement (loss) 13
Cr Derivative (financial asset) 13
Dr Platinum 442
Cr Bank 435
Cr Derivative (to remove) 7
Financial instruments
502 KAPLAN PUBLISHING
Test your understanding 12
Test your understanding 13
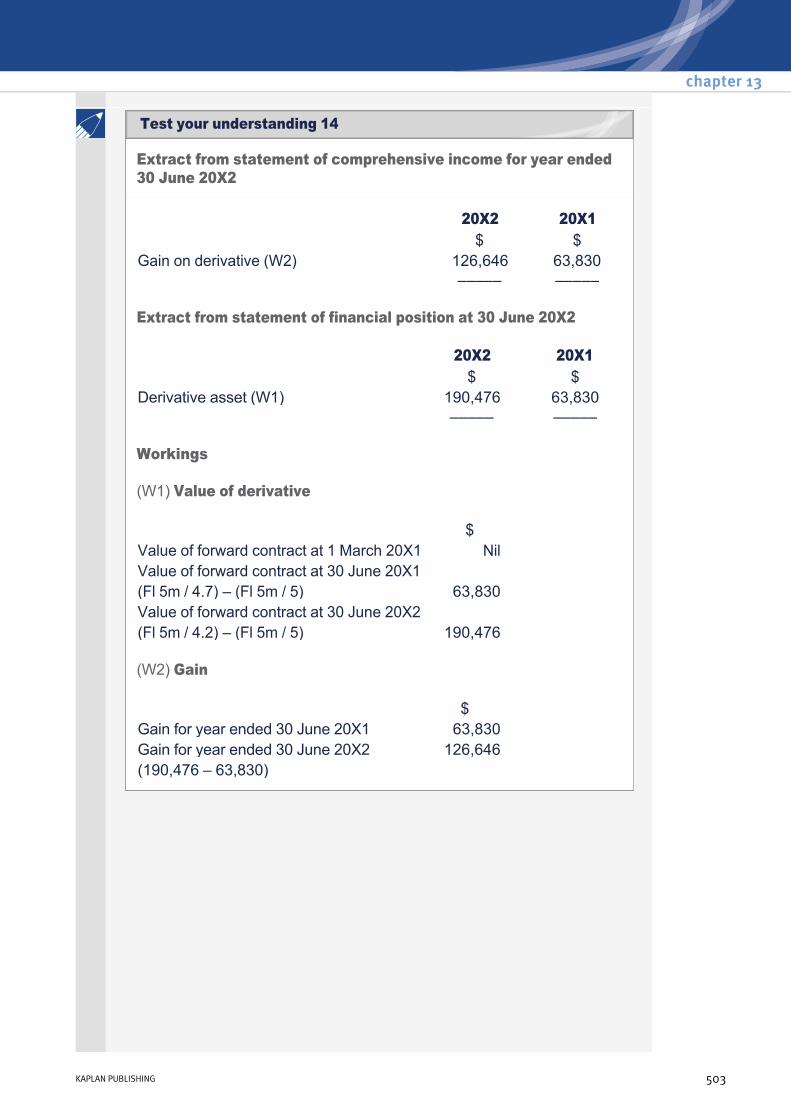
Extract from statement of comprehensive income for year ended 30 June 20X2
Extract from statement of financial position at 30 June 20X2
Workings
(W1) Value of derivative
(W2) Gain
20X2 20X1 $ $Gain on derivative (W2) 126,646 63,830 ––––– –––––
20X2 20X1 $ $Derivative asset (W1) 190,476 63,830 ––––– –––––
$Value of forward contract at 1 March 20X1 NilValue of forward contract at 30 June 20X1 (Fl 5m / 4.7) – (Fl 5m / 5) 63,830Value of forward contract at 30 June 20X2 (Fl 5m / 4.2) – (Fl 5m / 5) 190,476
$Gain for year ended 30 June 20X1 63,830Gain for year ended 30 June 20X2 126,646(190,476 – 63,830)
chapter 13
KAPLAN PUBLISHING 503
Test your understanding 14

Financial instruments
504 KAPLAN PUBLISHING

Sharebased payments Chapter learning objectives
On completion of their studies students should be able to:
• Discuss the recognition and valuation issues concerned with sharebased payments.
505
chapter
14
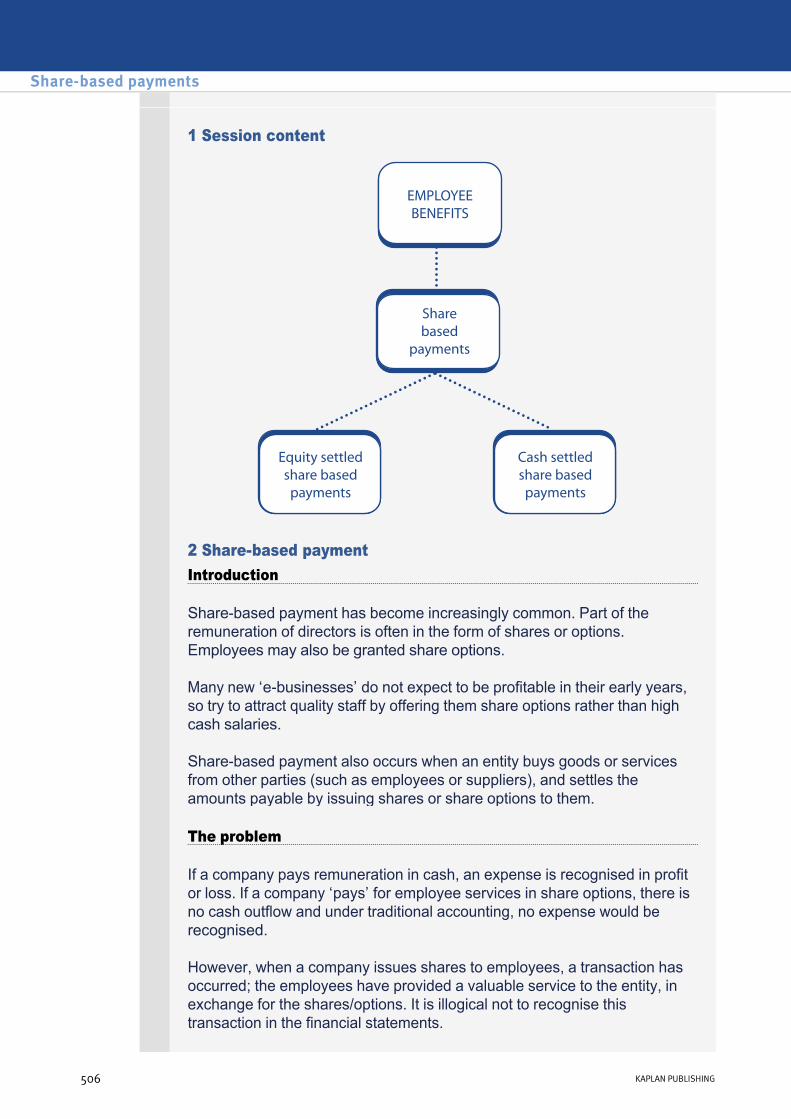
1 Session content
2 Sharebased payment Introduction
Sharebased payment has become increasingly common. Part of the remuneration of directors is often in the form of shares or options. Employees may also be granted share options.
Many new ‘ebusinesses’ do not expect to be profitable in their early years, so try to attract quality staff by offering them share options rather than high cash salaries.
Sharebased payment also occurs when an entity buys goods or services from other parties (such as employees or suppliers), and settles the amounts payable by issuing shares or share options to them.
The problem
If a company pays remuneration in cash, an expense is recognised in profit or loss. If a company ‘pays’ for employee services in share options, there is no cash outflow and under traditional accounting, no expense would be recognised.
However, when a company issues shares to employees, a transaction has occurred; the employees have provided a valuable service to the entity, in exchange for the shares/options. It is illogical not to recognise this transaction in the financial statements.
Share-based payments
506 KAPLAN PUBLISHING506 KAPLAN PUBLISHING
IFRS 2 Sharebased payment was issued to deal with this accounting anomaly. IFRS 2 requires that all sharebased payment transactions must be recognised in the financial statements.
Types of transaction
IFRS 2 applies to all types of sharebased payment transaction. There are two main types:
The most common type of sharebased payment transaction is where share options are granted to employees or directors as part of their remuneration.
• in an equitysettled sharebased payment transaction, the entity rewards staff with equity instruments (e.g. shares or share options)
• in a cashsettled sharebased payment transaction, the entity rewards staff with amounts of cash measured by reference to the entity’s share price.
The basic principles
When an entity receives employee services or goods as a result of a sharebased payment transaction, it recognises either an expense or an asset.
• If the goods or services are received in exchange for equity (e.g. for share options), the entity recognises an increase in equity. – The double entry is:
– Dr Expense/Asset
– Cr Equity (normally a special reserve).
• If the goods or services are received or acquired in a cashsettled sharebased payment transaction, the entity recognises a liability. – The double entry is:
– Dr Expense/Asset
– Cr Liability.
All sharebased payment transactions are measured at fair value.
chapter 14
KAPLAN PUBLISHING 507

3 Equitysettled sharebased payments
FV = fair value
Measurement
The basic principle is that all transactions are measured at fair value at the grant date i.e. the date at which the entity and another party agree to the arrangement.
For equitysettled transactions the fair value is likely to be the share price at the grant date (rather than the fair value of the goods or services received).
If the options vest immediately i.e. employees are entitled to the shares immediately, it is presumed that the entity has received the benefit of the services and the full amount is recognised on the grant date.
If the options do not vest immediately, as is usually the case, the company should spread the cost of the options over the vesting period, the period during which the specific vesting conditions are satisfied e.g. length of service with the company.
Share-based payments
508 KAPLAN PUBLISHING
Illustration 1 How options work
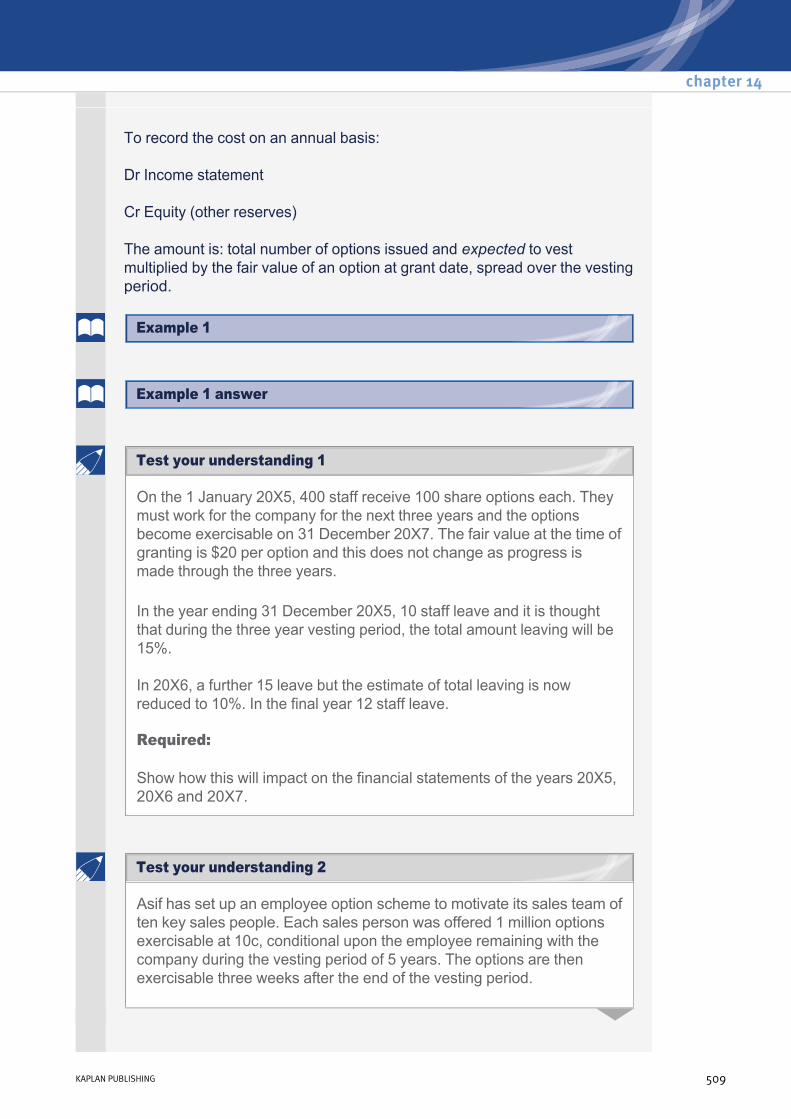
To record the cost on an annual basis:
Dr Income statement
Cr Equity (other reserves)
The amount is: total number of options issued and expected to vest multiplied by the fair value of an option at grant date, spread over the vesting period.
On the 1 January 20X5, 400 staff receive 100 share options each. They must work for the company for the next three years and the options become exercisable on 31 December 20X7. The fair value at the time of granting is $20 per option and this does not change as progress is made through the three years.
In the year ending 31 December 20X5, 10 staff leave and it is thought that during the three year vesting period, the total amount leaving will be 15%.
In 20X6, a further 15 leave but the estimate of total leaving is now reduced to 10%. In the final year 12 staff leave.
Required:
Show how this will impact on the financial statements of the years 20X5, 20X6 and 20X7.
Asif has set up an employee option scheme to motivate its sales team of ten key sales people. Each sales person was offered 1 million options exercisable at 10c, conditional upon the employee remaining with the company during the vesting period of 5 years. The options are then exercisable three weeks after the end of the vesting period.
chapter 14
KAPLAN PUBLISHING 509
Test your understanding 2
Test your understanding 1
Example 1
Example 1 answer

This is year two of the scheme. At the start of the year, two sales people suggested that they would be leaving the company during the second year. However, although one did leave, the other recommitted to the company and the scheme. The other employees have always been committed to the scheme and stated their intention to stay with the company during the 5 years. Relevant market values are as follows:
The option price is the market price of an equivalent marketable option on the relevant date.
Required:
Show the effect of the scheme on the financial statements of Asif for Year Two.
Date Share price Option price Grant date 10c 20cEnd of Year One 24c 38cEnd of Year Two 21c 33c
4 Cashsettled sharebased payments
An example of a cashsettled sharebased payment transaction is the payment of a bonus to an employee based on the entity's share price.
The basic principle is that the entity measures the goods or services acquired and the liability incurred at the fair value of the liability.
• Until the liability is settled, the entity remeasures the fair value of the liability at each reporting date until the liability is settled and at the date of settlement. (Notice that this is different from accounting for equity sharebased payments, where the fair value is fixed at the grant date.)
• Changes in fair value are recognised in profit or loss for the period.
• Where services are received, these are recognised over the period that the employees render the services. (This is the same principle as for equitysettled transactions).
• The expense recognised in each accounting period has a double entry to a provision/liability account.
– Dr Income statement
– Cr Liability/ provision
• On the vesting date, the amount of the provision/liability should equal the cash paid.
Share-based payments
510 KAPLAN PUBLISHING
Example 2
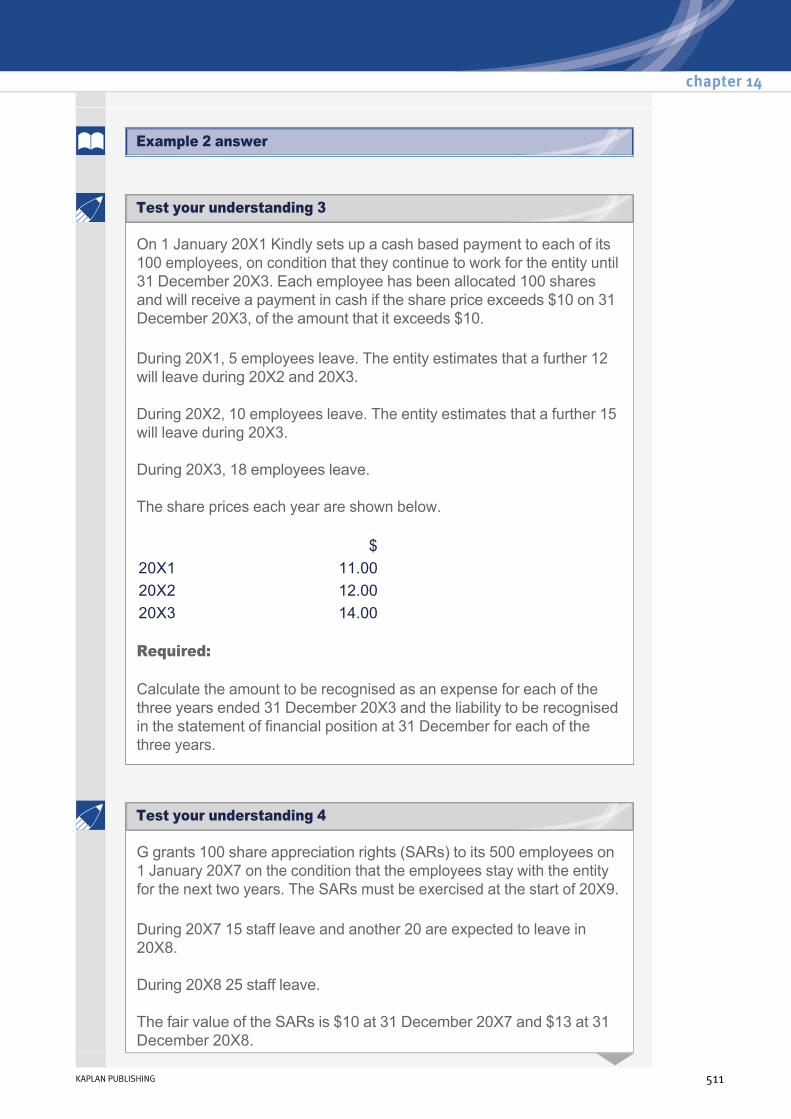
On 1 January 20X1 Kindly sets up a cash based payment to each of its 100 employees, on condition that they continue to work for the entity until 31 December 20X3. Each employee has been allocated 100 shares and will receive a payment in cash if the share price exceeds $10 on 31 December 20X3, of the amount that it exceeds $10.
During 20X1, 5 employees leave. The entity estimates that a further 12 will leave during 20X2 and 20X3.
During 20X2, 10 employees leave. The entity estimates that a further 15 will leave during 20X3.
During 20X3, 18 employees leave.
The share prices each year are shown below.
Required:
Calculate the amount to be recognised as an expense for each of the three years ended 31 December 20X3 and the liability to be recognised in the statement of financial position at 31 December for each of the three years.
$20X1 11.0020X2 12.0020X3 14.00
G grants 100 share appreciation rights (SARs) to its 500 employees on 1 January 20X7 on the condition that the employees stay with the entity for the next two years. The SARs must be exercised at the start of 20X9.
During 20X7 15 staff leave and another 20 are expected to leave in 20X8.
During 20X8 25 staff leave.
The fair value of the SARs is $10 at 31 December 20X7 and $13 at 31 December 20X8.
chapter 14
KAPLAN PUBLISHING 511
Example 2 answer
Test your understanding 3
Test your understanding 4

Required:
Calculate the amount to be recognised as an expense for the two years ended 31 December 20X7 and 20X8 and the liability to be recognised in the statement of financial position at 31 December for both years.
The following information relates to two sharebased transactions that LM entered into in 20X6.
During 20X6 20 employees left and another 45 were expected to leave over the next two years.
During 20X7 15 employees left and another 20 were expected to leave in 20X8.
During 20X8 10 employees left.
Required:
Briefly describe the accounting treatment to be adopted for these transactions, in accordance with IFRS 2 Sharebased payments and calculate the amount to be recorded in the income statement for staff costs in respect of each of the three years.
(1) LM granted share options to its 200 employees on 1 January 20X6. Each employee will receive 500 share options if they continue to work for LM for the next three years. The fair value of the options at the grant date was $2.00 each.
(2) LM operates an incentive scheme for its employees which it set up during 20X6. Under the terms of the scheme the workforce will be offered 80% of the share price increase on 10,000 of the entity’s shares. Payment will be made on 31 March 20X9. Again the scheme is only open to those who remain employed with LM for the three year period. The fair value of the SARs at the end of each of the three years is:
– 20X6 – $1.60
– 20X7 – $1.80
– 20X8 – $2.10
Share-based payments
512 KAPLAN PUBLISHING
Test your understanding 5
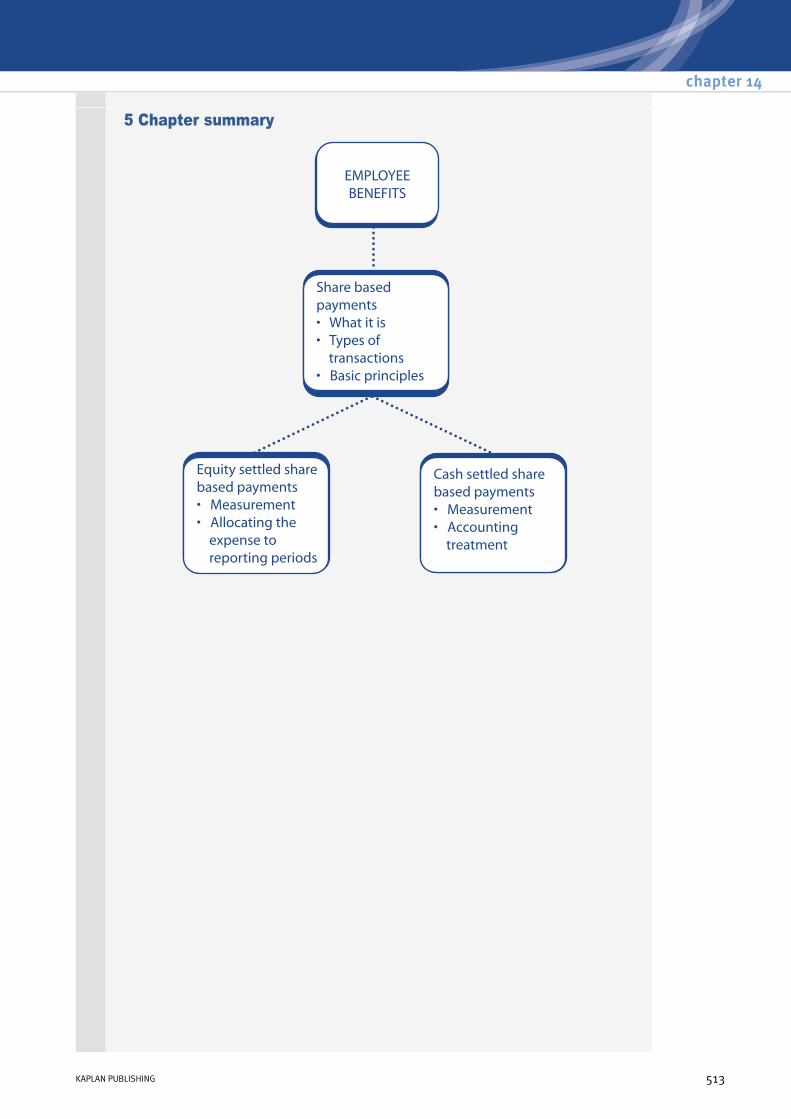
5 Chapter summary
chapter 14
KAPLAN PUBLISHING 513

Test your understanding answers
20X5 20X6 20X7 Share options 40,000 40,000 40,000Expected to vest 85% 90% (3,700)* ––––––– ––––––– –––––––
34,000 36,000 36,300Fair value at grant date $20 $20 $20 ––––––– ––––––– –––––––
Total cost $680,000 $720,000 $726,000Proportion of vesting period passed 1/3 2/3 3/3 ––––––– ––––––– –––––––
Equity $226,667 $480,000 $726,000 Cost charged to income statement $226,667 $253,333 $246,000
* of the 400 staff 37 have left by the end of the 3 year period. Each staff member had the right to exercise 100 share options, which would have amounted to 3,700 in total. This leaves 36,300 remaining legitimate options.
The expense is measured using the fair value of the option at the grant date, i.e. 20c.
At the end of year two the amount recognised in equity should be $720,000 (1m × (10 – 1) × 20c × 2/5).
At the beginning of year two the amount recognised in equity would have been $320,000 (1m × 8 × 20c × 1/5).
The charge to profit for Year Two is the difference between the two: $400,000 (720 – 320).
Share-based payments
514 KAPLAN PUBLISHING
Test your understanding 1
Test your understanding 2
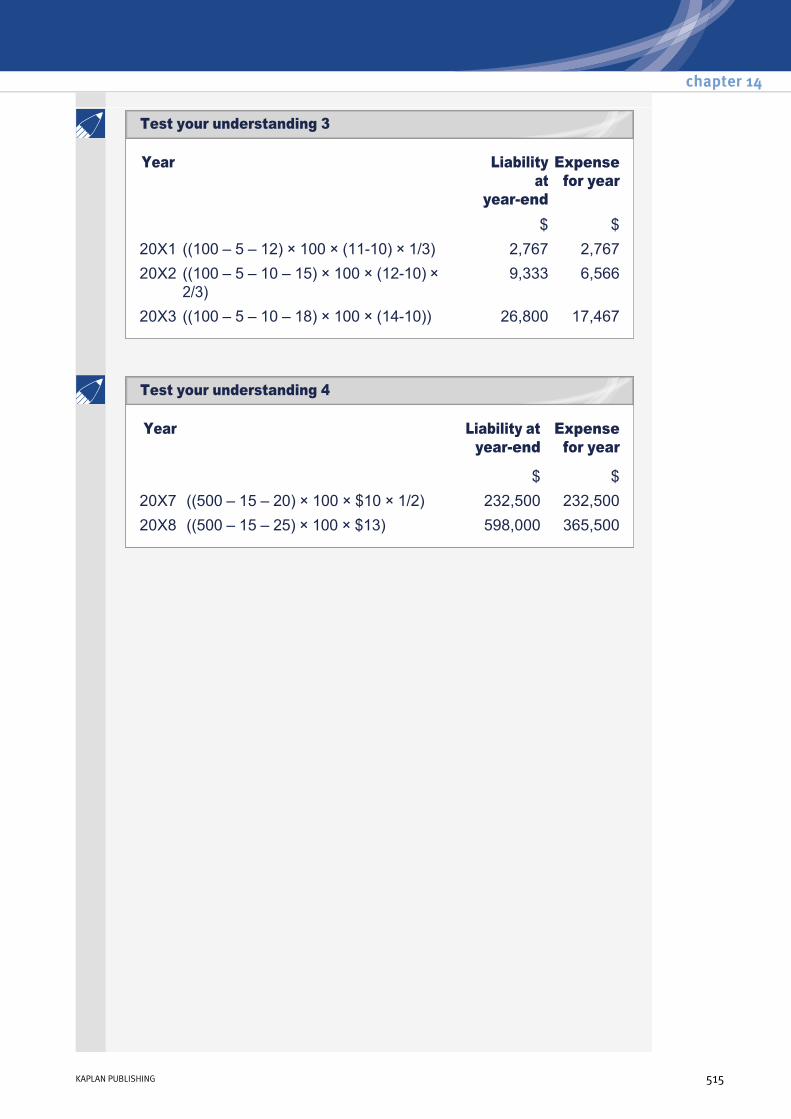
Year Liability at
yearend
Expense for year
$ $20X1 ((100 – 5 – 12) × 100 × (1110) × 1/3) 2,767 2,76720X2 ((100 – 5 – 10 – 15) × 100 × (1210) ×
2/3) 9,333 6,566
20X3 ((100 – 5 – 10 – 18) × 100 × (1410)) 26,800 17,467
Year Liability at yearend
Expense for year
$ $20X7 ((500 – 15 – 20) × 100 × $10 × 1/2) 232,500 232,50020X8 ((500 – 15 – 25) × 100 × $13) 598,000 365,500
chapter 14
KAPLAN PUBLISHING 515
Test your understanding 3
Test your understanding 4
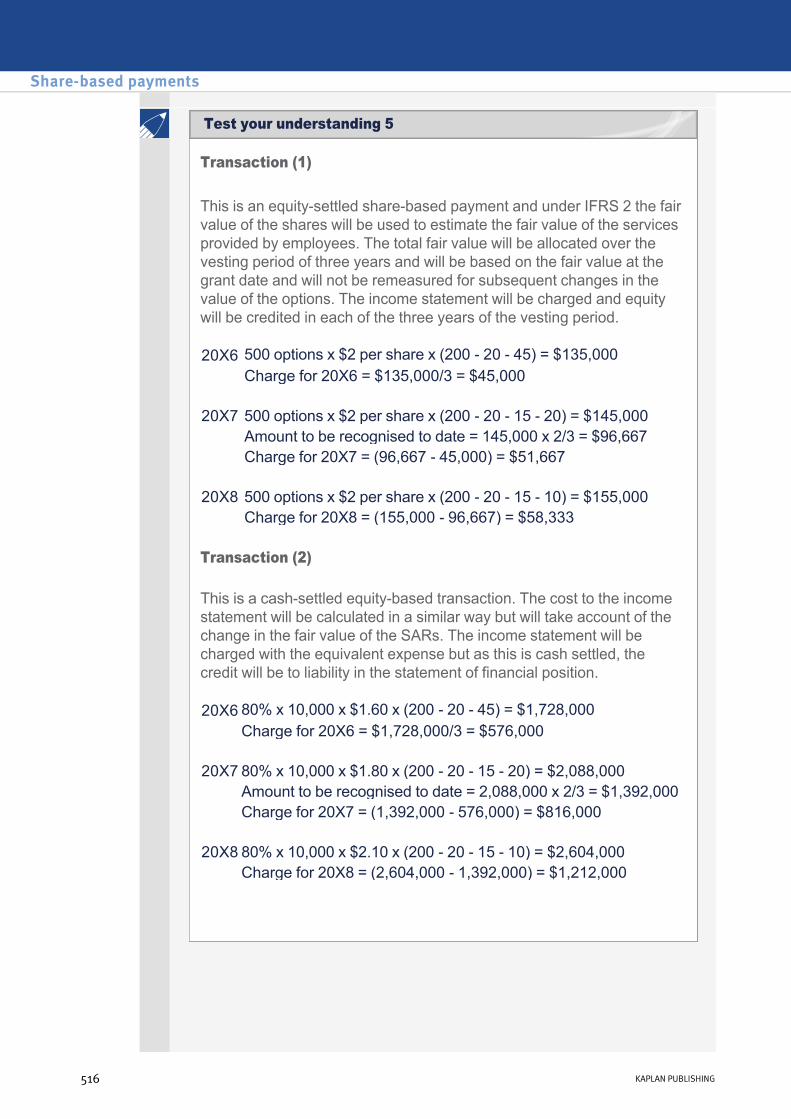
Transaction (1)
This is an equitysettled sharebased payment and under IFRS 2 the fair value of the shares will be used to estimate the fair value of the services provided by employees. The total fair value will be allocated over the vesting period of three years and will be based on the fair value at the grant date and will not be remeasured for subsequent changes in the value of the options. The income statement will be charged and equity will be credited in each of the three years of the vesting period.
Transaction (2)
This is a cashsettled equitybased transaction. The cost to the income statement will be calculated in a similar way but will take account of the change in the fair value of the SARs. The income statement will be charged with the equivalent expense but as this is cash settled, the credit will be to liability in the statement of financial position.
20X6 500 options x $2 per share x (200 20 45) = $135,000 Charge for 20X6 = $135,000/3 = $45,000 20X7 500 options x $2 per share x (200 20 15 20) = $145,000 Amount to be recognised to date = 145,000 x 2/3 = $96,667 Charge for 20X7 = (96,667 45,000) = $51,667 20X8 500 options x $2 per share x (200 20 15 10) = $155,000 Charge for 20X8 = (155,000 96,667) = $58,333
20X6 80% x 10,000 x $1.60 x (200 20 45) = $1,728,000 Charge for 20X6 = $1,728,000/3 = $576,000 20X7 80% x 10,000 x $1.80 x (200 20 15 20) = $2,088,000 Amount to be recognised to date = 2,088,000 x 2/3 = $1,392,000 Charge for 20X7 = (1,392,000 576,000) = $816,000 20X8 80% x 10,000 x $2.10 x (200 20 15 10) = $2,604,000 Charge for 20X8 = (2,604,000 1,392,000) = $1,212,000
Share-based payments
516 KAPLAN PUBLISHING
Test your understanding 5
Pension benefitsChapter learning objectives
On completion of their studies students should be able to:
• Discuss the recognition and valuation issues concerned with pension schemes and the treatment of actuarial deficits and surpluses.
517
chapter
15
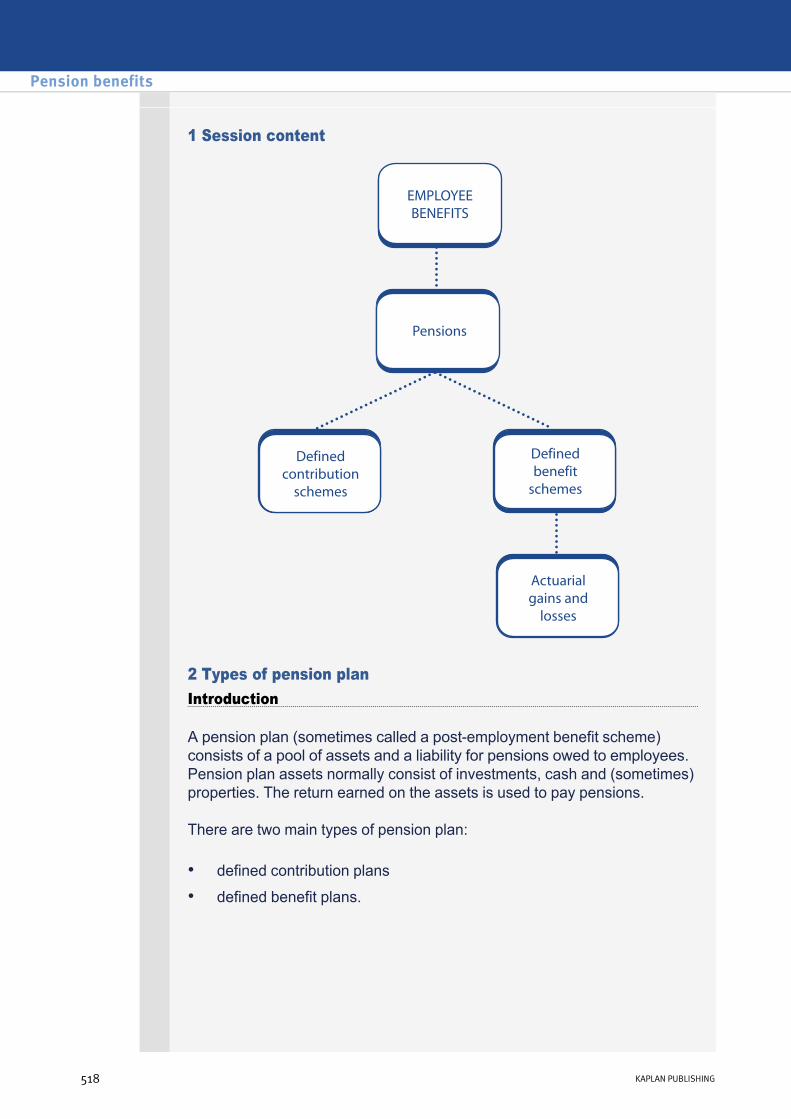
1 Session content
2 Types of pension planIntroduction
A pension plan (sometimes called a postemployment benefit scheme) consists of a pool of assets and a liability for pensions owed to employees. Pension plan assets normally consist of investments, cash and (sometimes) properties. The return earned on the assets is used to pay pensions.
There are two main types of pension plan:
• defined contribution plans
• defined benefit plans.
Pension benefits
518 KAPLAN PUBLISHING518 KAPLAN PUBLISHING
Defined contribution plans
The pension payable on retirement depends on the contributions paid into the plan by the employee and the employer.
• The employer’s contribution is usually a fixed percentage of the employee’s salary. The employer has no further obligation after this amount is paid.
• Therefore, the annual cost to the employer is reasonably predictable.
• Defined contribution plans present few accounting problems.
Defined benefit plans
The pension payable on retirement normally depends on either the final salary or the average salary of the employee during their career.
2/3 × final salary × (years of service / 40 years)
• The employer undertakes to finance a pension income of a certain amount, e.g.
• The employer has an ongoing obligation to make sufficient contributions to the plan to fund the pensions.
• An actuary calculates the amount that must be paid into the plan each year in order to provide the promised pension. The calculation is based on various estimates and assumptions including: – life expectancy
– expected length of service to retirement
– investment returns
– wage inflation.
• Therefore, the cost of providing pensions is not certain and varies from year to year.
The actual contribution paid in a period does not usually represent the true cost to the employer of providing pensions in that period. The financial statements must reflect the true cost of providing pensions.
chapter 15
KAPLAN PUBLISHING 519

3 Accounting for pension plans (IAS 19)Defined contribution plans
The expense of providing pensions in the period is normally the same as the amount of contributions paid.
• The entity should charge the agreed pension contribution to profit or loss as an employment expense in each period.
• An asset (prepayment) or liability (accrual) for pensions only arises if the cash paid does not equal the amount of contributions due.
• IAS 19 requires disclosure of the amount recognised as an expense in the period.
J operates a defined contribution scheme on which it pays 6% of employees gross salaries per annum. At the end of last year, J had accrued $10,000 for pension contributions due. Gross salaries for the current year amounted to $650,000 and J had paid contributions totalling $35,000 into the pension fund during the year.
Required:
What amounts will be recorded in the financial statements for the current year?
Defined benefit plans: the basic principle
The entity recognises the net figure of the scheme assets less the liability for future pension payments.
• If the liability exceeds the assets, there is a deficit (the usual situation) and a liability is reported in the statement of financial position.
Pension benefits
520 KAPLAN PUBLISHING
Example 1 answer
Example 1
Test your understanding 1
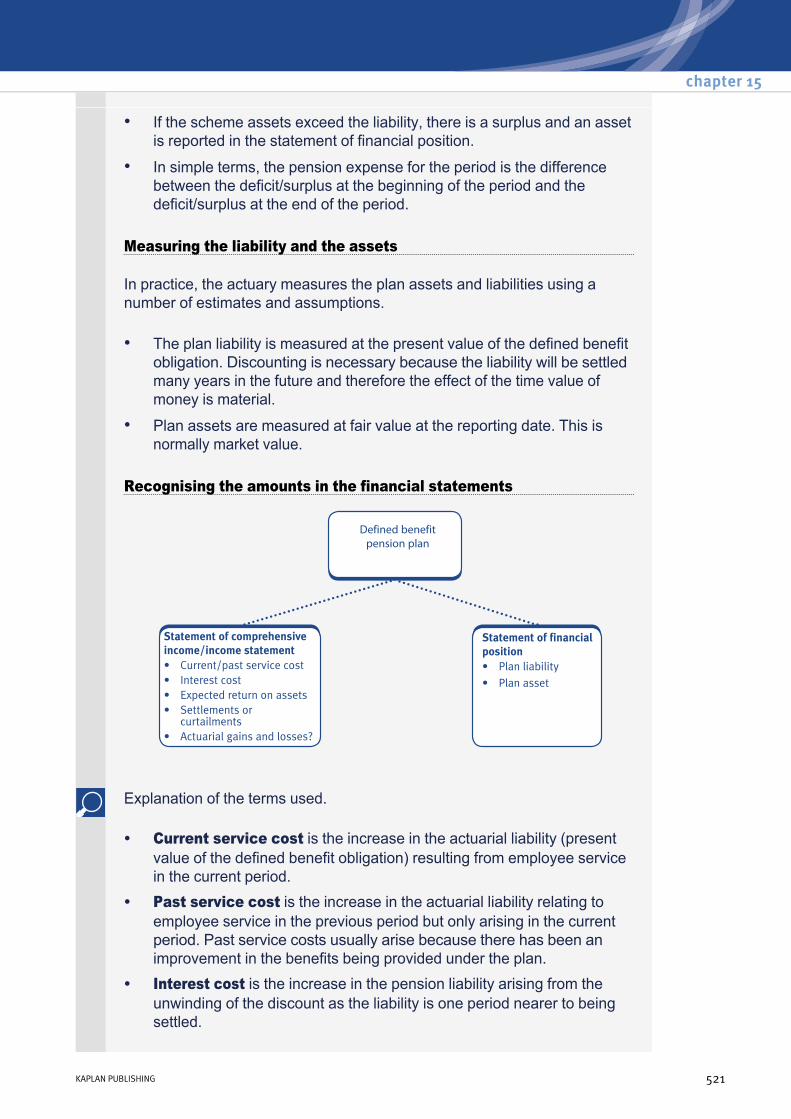
• If the scheme assets exceed the liability, there is a surplus and an asset is reported in the statement of financial position.
• In simple terms, the pension expense for the period is the difference between the deficit/surplus at the beginning of the period and the deficit/surplus at the end of the period.
Measuring the liability and the assets
In practice, the actuary measures the plan assets and liabilities using a number of estimates and assumptions.
• The plan liability is measured at the present value of the defined benefit obligation. Discounting is necessary because the liability will be settled many years in the future and therefore the effect of the time value of money is material.
• Plan assets are measured at fair value at the reporting date. This is normally market value.
Recognising the amounts in the financial statements
Explanation of the terms used.
• Current service cost is the increase in the actuarial liability (present value of the defined benefit obligation) resulting from employee service in the current period.
• Past service cost is the increase in the actuarial liability relating to employee service in the previous period but only arising in the current period. Past service costs usually arise because there has been an improvement in the benefits being provided under the plan.
• Interest cost is the increase in the pension liability arising from the unwinding of the discount as the liability is one period nearer to being settled.
chapter 15
KAPLAN PUBLISHING 521
• Expected return on assets is the expected return earned from the pension scheme assets.
• In IAS 19, curtailments and settlements are the gains and losses arising when major reductions are made to the number of employees in the plan or the benefits promised to them.
• Actuarial gains and losses are increases and decreases in the pension asset or liability that occur either because the actuarial assumptions have changed or because of differences between the previous actuarial assumptions and what has actually happened (experience adjustments). For example, the investment income from the assets may have been greater than expected.
Effect on profit or loss for the period
The changes in the defined benefit asset/liability in the period are treated as follows:
Actuarial gains and losses may also be reported in profit or loss (this is covered in detail later in the chapter).
Current service cost Dr Income statement Cr Pension liability
Interest cost Dr Income statement (finance cost) Cr Pension liability
Expected return on assets Dr Pension asset Cr Income statement (investment income)
Past service costs (if any) Dr Income statement Cr Pension liability
Curtailments and settlements (if any)
Dr or Cr Income statement Cr or Dr Pension liability
Pension benefits
522 KAPLAN PUBLISHING
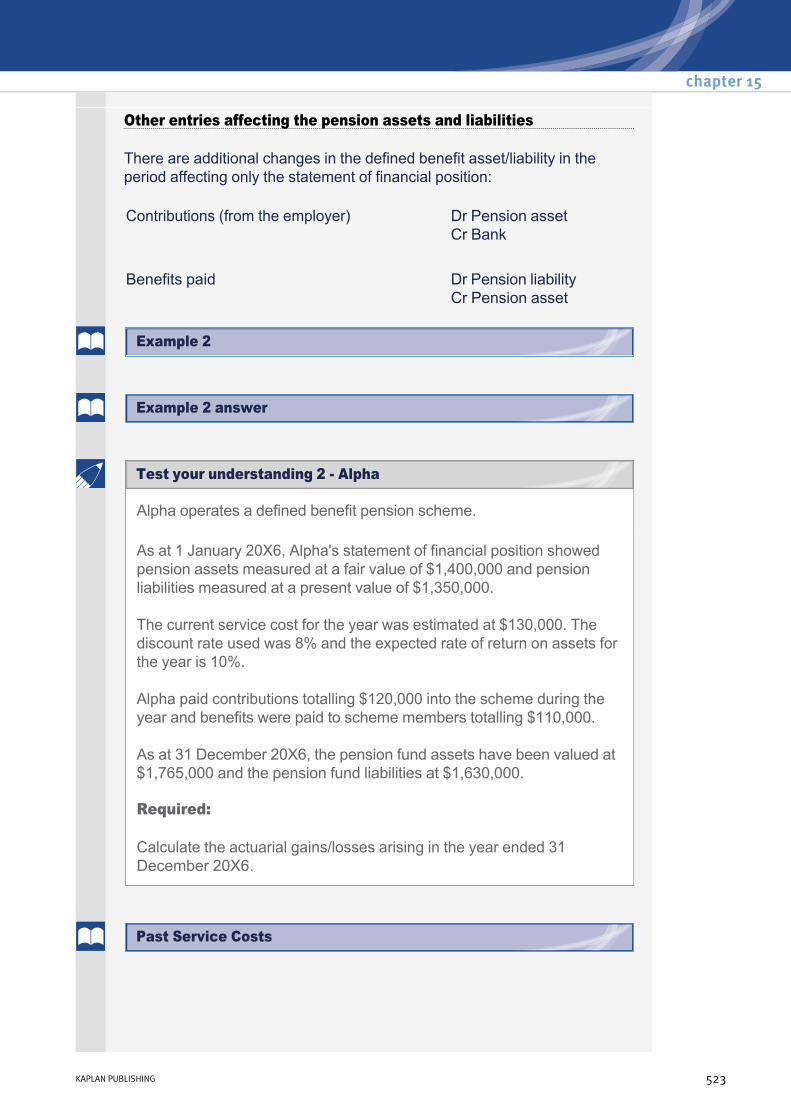
Other entries affecting the pension assets and liabilities
There are additional changes in the defined benefit asset/liability in the period affecting only the statement of financial position:
Contributions (from the employer) Dr Pension asset Cr Bank
Benefits paid Dr Pension liability Cr Pension asset
Alpha operates a defined benefit pension scheme.
As at 1 January 20X6, Alpha's statement of financial position showed pension assets measured at a fair value of $1,400,000 and pension liabilities measured at a present value of $1,350,000.
The current service cost for the year was estimated at $130,000. The discount rate used was 8% and the expected rate of return on assets for the year is 10%.
Alpha paid contributions totalling $120,000 into the scheme during the year and benefits were paid to scheme members totalling $110,000.
As at 31 December 20X6, the pension fund assets have been valued at $1,765,000 and the pension fund liabilities at $1,630,000.
Required:
Calculate the actuarial gains/losses arising in the year ended 31 December 20X6.
chapter 15
KAPLAN PUBLISHING 523
Test your understanding 2 Alpha
Example 2
Example 2 answer
Past Service Costs

4 Recognition of actuarial gains/losses
IAS 19 permits several methods of dealing with actuarial gains or losses:
• They may be recognised immediately in profit or loss.
• They may be recognised immediately as other comprehensive income and recorded in equity.
• If they fall within certain size limits, they may be carried forward on the statement of financial position to be spread over future periods the 10% corridor approach.
The ‘10% corridor’
Where actuarial gains and losses are carried forward in the statement of financial position (not recognised in income or equity), IAS 19 states that if the net cumulative unrecognised actuarial gains and losses at the end of the previous period exceed the greater of:
the excess must be recognised in profit or loss.
The whole of the gain or loss need not be recognised immediately, it may be spread over the expected average remaining working lives of the employees.
• 10% of the present value of the opening plan obligation; or
• 10% of the fair value of opening plan assets
As at 1 January 20X6, actuarial gains totalling $200,000 had arisen in previous accounting periods.
Required:
Using the above information from TYU 2, prepare extracts from the income statement, statement of comprehensive income and statement of financial position for the year ended 31 December 20X6, using each of the following options for the recognition of actuarial gains/losses:
Pension benefits
524 KAPLAN PUBLISHING
Example 3
Example 3 answer
Test your understanding 3 Alpha continued
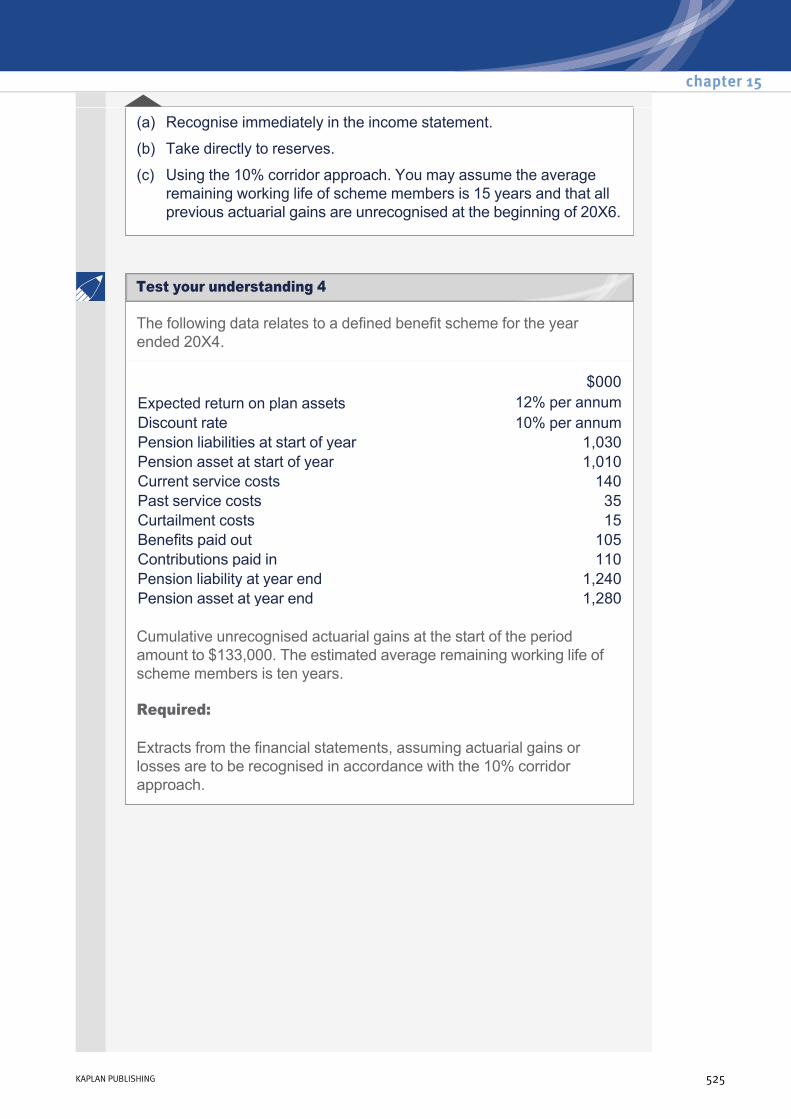
(a) Recognise immediately in the income statement.
(b) Take directly to reserves.
(c) Using the 10% corridor approach. You may assume the average remaining working life of scheme members is 15 years and that all previous actuarial gains are unrecognised at the beginning of 20X6.
The following data relates to a defined benefit scheme for the year ended 20X4.
Cumulative unrecognised actuarial gains at the start of the period amount to $133,000. The estimated average remaining working life of scheme members is ten years.
Required:
Extracts from the financial statements, assuming actuarial gains or losses are to be recognised in accordance with the 10% corridor approach.
$000Expected return on plan assets 12% per annumDiscount rate 10% per annumPension liabilities at start of year 1,030Pension asset at start of year 1,010Current service costs 140Past service costs 35Curtailment costs 15Benefits paid out 105Contributions paid in 110Pension liability at year end 1,240Pension asset at year end 1,280
chapter 15
KAPLAN PUBLISHING 525
Test your understanding 4

The following data relates to a defined benefit scheme for the next year ended 20X5:
Cumulative unrecognised actuarial gains at the start of the period amount to $252,000. The estimated average remaining working life of scheme members is still ten years.
Required:
Extracts from the financial statements, assuming actuarial gains or losses are to be recognised in accordance with the 10% corridor approach.
$000Expected return on assets 10% per annumDiscount rate 6.6% per annumPension liabilities at start of year 1,240Pension asset at start of year 1,280Current service costs 150Benefits paid out 100Contributions paid in 130Pension liability at year end 1,610Pension asset at year end 1,500
Thomas Co. is a listed entity that operates a defined benefit pension scheme on behalf of its employees. The following information is relevant.
At 31 December 20X2:
During 20X3:
• The fair value of the plan assets is $10,000m.
• The present value of the defined benefit obligation is $9,000m.
• There are cumulative unrecognised actuarial gains of $1,500m.
• The average remaining working lives of employees in the plan is five years.
• The fair value of the plan assets increases to $11,000m
• The present value of the defined benefit obligation rises to $9,500m
Pension benefits
526 KAPLAN PUBLISHING
Test your understanding 6
Test your understanding 5

The entity’s directors are aware of the relevant Accounting Standard, IAS 19 Employee Benefits, but do not have sufficient knowledge to apply it. They have asked you, the financial controller, to write a short briefing paper, setting out an outline of the options for accounting for the actuarial loss in accordance with the Standard and their impacts on the financial statements.
Required
Prepare a memorandum for the directors of Thomas Co which explains the alternative treatments permitted when accounting for actuarial gains and losses, applying the information in the question as far as practicable.
• The net actuarial gain for the year is $200m
• The average remaining working lives of employees remains at five years.
The following information is given about a defined benefit plan. To keep the computations simple, all transactions are assumed to occur at the yearend. The present value of the obligation and the market value of the plan assets were both $1mn at 1 January 20X1.
Actuarial gains and losses are recognised in other comprehensive income.
Required
Show how the defined benefit scheme would be presented in the financial statements for each of the three years ended 31 December 20X1, 20X2 and 20X3.
20X1 20X2 20X3 Discount rate at 1 January 10% 9% 8%Expected rate of return on plan assets at start of year 12% 11% 10% Current service cost ($000) 130 140 150Benefits paid ($000) 150 180 190Contributions paid ($000) 90 100 110Present vaue of obligations at 31 December ($000) 1,100 1,380 1,408Market value of plan assets at 31 December ($000) 1,190 1,372 1,188
chapter 15
KAPLAN PUBLISHING 527
Test your understanding 7

5 Chapter summary
Pension benefits
528 KAPLAN PUBLISHING

Test your understanding answers
Statement of financial position
Current liabilities
Accrued pension contributions (10,000 + 39,000 – 35,000) $14,000
Income statement
Pension contributions (6% × 650,000) $39,000
Assets Liabilities Net $000 $000 $000
Brought forward 1,400 1,350 50 Return on assets (10% × 1,400) 140 140 Current service cost 130 (130)Interest cost (8% × 1,350) 108 (108)Contributions 120 120 Benefits (110) (110) – ––––– ––––– ––––– 1,550 1,478 72 Actuarial gain/loss – balance Gain 215 Loss 152 Gain 63 ––––– ––––– ––––– Carried forward 1,765 1,630 135 ––––– ––––– –––––
chapter 15
KAPLAN PUBLISHING 529
Test your understanding 2 Alpha
Test your understanding 1

Income statement (extracts) for the year ended 31 December 20X6
Statement of comprehensive income for the year ended 31 December 20X6
Statement of financial position (extracts) as at 31 December 20X6
(a) (b) (c) $000 $000 $000
Current service cost (130) (130) (130)Interest cost (108) (108) (108)Return on assets 140 140 140 Recognised actuarial gains 63 – 4 –––– –––– –––– Total cost (35) (98) (94)
(a) (b) (c) $000 $000 $000
Profit for the year (35) (98) (94)Other comprehensive incomeActuarial gains on defined benefit pension 63 –––– –––– –––– Total comprehensive income for the year (35) (35) (94)
(a) (b) (c) $000 $000 $000
Pension fund assets 1,765 1,765 1,765Pension fund liabilities (1,630) (1,630) (1,630) ––––– ––––– ––––– Net pension asset 135 135 135Unrecognised gains (W1) – – (259) ––––– Net pension liability (124) ––––– Equity Pension reserve – – 259
Pension benefits
530 KAPLAN PUBLISHING
Test your understanding 3 Alpha continued

Workings
10% corridor = higher of:
10% of opening fund assets 10% × 1,400 = 140 10% of opening fund liabilities 10% × 1,350 = 135 10% corridor 140 Opening gains 200 ––– Excess 60 Recognise in IS over 15 years (60/15 yrs) 4 Unrecognised gains carried forward in statement of financial position
Opening actuarial gains 200 Transferred to income statement (4)Gains in year 63 ––– Closing actuarial gains 259
Statement of financial position (extracts) as at 31 December 20X4
$000Fair value of plan assets 1,280 Present value of obligation (1,240) ––––––– Net pension asset 40 Unrecognised actuarial gains (133 – 3 (W2) + 122 (W1)) (252) ––––––– Net pension liability (212) –––––––
chapter 15
KAPLAN PUBLISHING 531
Test your understanding 4
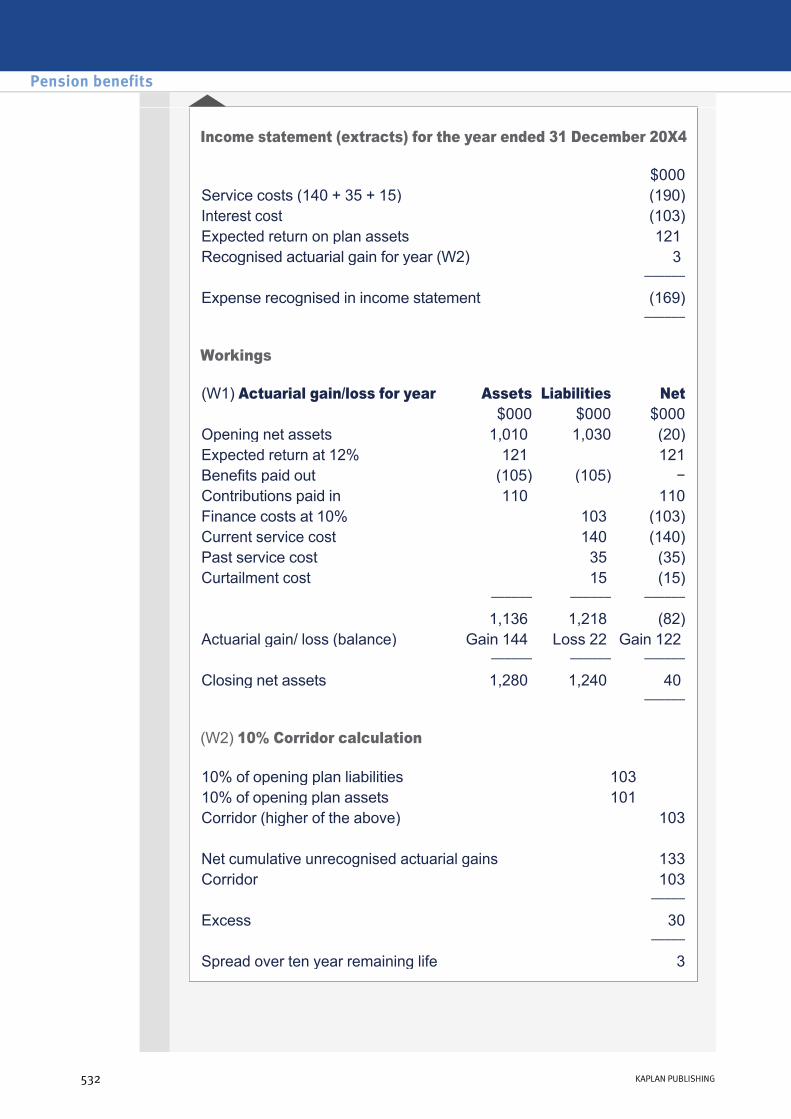
Income statement (extracts) for the year ended 31 December 20X4
Workings
(W2) 10% Corridor calculation
$000Service costs (140 + 35 + 15) (190)Interest cost (103)Expected return on plan assets 121 Recognised actuarial gain for year (W2) 3 –––––– Expense recognised in income statement (169) ––––––
(W1) Actuarial gain/loss for year Assets Liabilities Net $000 $000 $000Opening net assets 1,010 1,030 (20)Expected return at 12% 121 121Benefits paid out (105) (105) −Contributions paid in 110 110Finance costs at 10% 103 (103)Current service cost 140 (140)Past service cost 35 (35)Curtailment cost 15 (15) –––––– –––––– –––––– 1,136 1,218 (82)Actuarial gain/ loss (balance) Gain 144 Loss 22 Gain 122 –––––– –––––– –––––– Closing net assets 1,280 1,240 40
––––––
10% of opening plan liabilities 103 10% of opening plan assets 101 Corridor (higher of the above) 103 Net cumulative unrecognised actuarial gains 133Corridor 103 ––––– Excess 30 ––––– Spread over ten year remaining life 3
Pension benefits
532 KAPLAN PUBLISHING

Statement of financial position (extracts) as at 31 December 20X5
Income statement (extracts) for the year ended 31 December 20X5
Workings
$000Fair value of plan assets 1,500 Present value of obligations (1,610) ––––– Net pension liability (110)Unrecognised actuarial gains (252 – 12 (W2) – 176 (W1)) (64) ––––– Net pension liability (174) –––––
$000Service costs (150)Interest cost (82)Expected return on plan assets 128 Recognised actuarial gain for year (W2) 12 –––– Expense recognised in income statement (92) ––––
(W1) Actuarial gain/loss for year Assets Liabilities Net $000 $000 $000Opening net assets 1,280 1,240 40 Expected return at 10% 128 128 Benefits paid out (100) (100) −Contributions paid in 130 130 Finance costs at 6.6% 82 (82)Current service cost 150 (150) ––––– ––––– ––––– 1,438 1,372 66 Actuarial gain/ loss (balance) Gain 62 Loss 238 Loss (176) ––––– ––––– ––––– Closing net assets 1,500 1,610 (110) –––––
chapter 15
KAPLAN PUBLISHING 533
Test your understanding 5
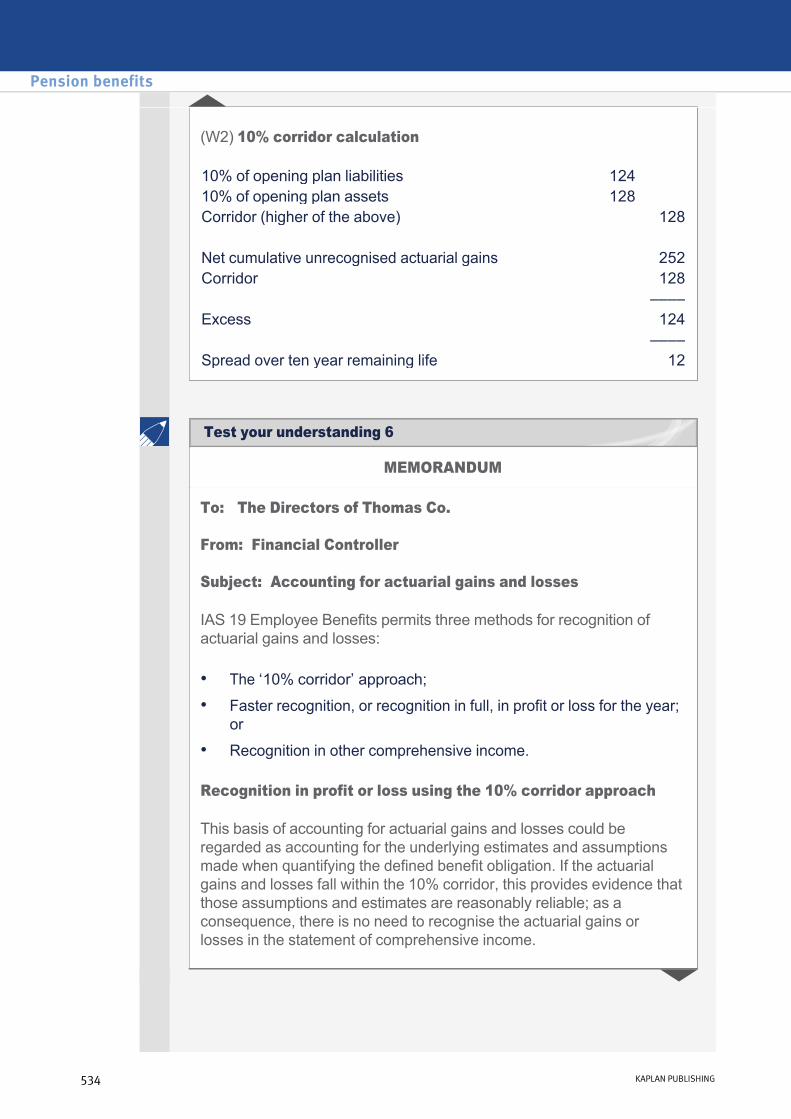
(W2) 10% corridor calculation
10% of opening plan liabilities 124 10% of opening plan assets 128 Corridor (higher of the above) 128 Net cumulative unrecognised actuarial gains 252Corridor 128 –––– Excess 124 –––– Spread over ten year remaining life 12
MEMORANDUM
To: The Directors of Thomas Co.
From: Financial Controller
Subject: Accounting for actuarial gains and losses
IAS 19 Employee Benefits permits three methods for recognition of actuarial gains and losses:
Recognition in profit or loss using the 10% corridor approach
This basis of accounting for actuarial gains and losses could be regarded as accounting for the underlying estimates and assumptions made when quantifying the defined benefit obligation. If the actuarial gains and losses fall within the 10% corridor, this provides evidence that those assumptions and estimates are reasonably reliable; as a consequence, there is no need to recognise the actuarial gains or losses in the statement of comprehensive income.
• The ‘10% corridor’ approach;
• Faster recognition, or recognition in full, in profit or loss for the year; or
• Recognition in other comprehensive income.
Pension benefits
534 KAPLAN PUBLISHING
Test your understanding 6
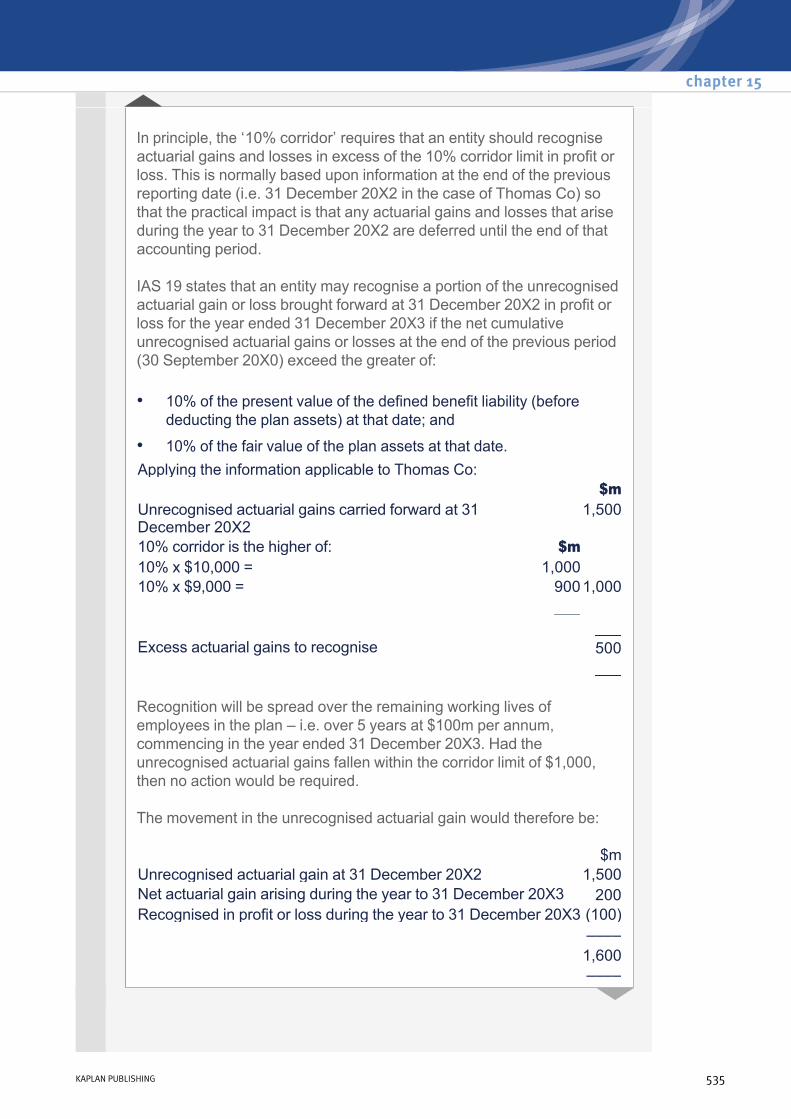
In principle, the ‘10% corridor’ requires that an entity should recognise actuarial gains and losses in excess of the 10% corridor limit in profit or loss. This is normally based upon information at the end of the previous reporting date (i.e. 31 December 20X2 in the case of Thomas Co) so that the practical impact is that any actuarial gains and losses that arise during the year to 31 December 20X2 are deferred until the end of that accounting period.
IAS 19 states that an entity may recognise a portion of the unrecognised actuarial gain or loss brought forward at 31 December 20X2 in profit or loss for the year ended 31 December 20X3 if the net cumulative unrecognised actuarial gains or losses at the end of the previous period (30 September 20X0) exceed the greater of:
Recognition will be spread over the remaining working lives of employees in the plan – i.e. over 5 years at $100m per annum, commencing in the year ended 31 December 20X3. Had the unrecognised actuarial gains fallen within the corridor limit of $1,000, then no action would be required.
The movement in the unrecognised actuarial gain would therefore be:
• 10% of the present value of the defined benefit liability (before deducting the plan assets) at that date; and
• 10% of the fair value of the plan assets at that date.Applying the information applicable to Thomas Co: $m Unrecognised actuarial gains carried forward at 31 December 20X2
1,500
10% corridor is the higher of: $m 10% x $10,000 = 1,00010% x $9,000 = 9001,000 ___
___Excess actuarial gains to recognise 500 ___
$mUnrecognised actuarial gain at 31 December 20X2 1,500Net actuarial gain arising during the year to 31 December 20X3 200Recognised in profit or loss during the year to 31 December 20X3 (100) –––– 1,600 ––––
chapter 15
KAPLAN PUBLISHING 535
Although this method does offer a consistent approach to treatment of actuarial gains or losses that may be regarded as excessive, the basis of computation has little technical or conceptual merit.
Faster recognition or recognition in full in profit or loss for the year
It is possible to recognise actuarial gains or losses immediately in profit or loss provided that:
In the situation of Thomas & Co. the net actuarial gain arising during the year to 31 December 20X3 of $200m would be charged in profit or loss for that year.
This accounting treatment is quite simple to apply, but may lead to volatility in reported results, which may not be beneficial as such gains and losses are generally regarded as being outside of the direct control of the directors.
Recognition in other comprehensive income
IAS 19 also states that actuarial gains and losses may be recognised outside of profit or loss in other comprehensive income in the period in which they occur. In common with immediate recognition in full in profit or loss for the year, if this policy is adopted, it must be applied consistently from period to period; for all an entity’s defined benefit plans; and for all actuarial gains and losses.
Note that actuarial gains and losses recognised in other comprehensive income should be added to, or deducted from, retained earnings, rather than presented in a separate equity reserve. The end result is that it will then be consistent with the alternative treatments of actuarial gains and losses which have flowed through profit or loss for the year.
In the case of Thomas Co., the net actuarial gain for the year to 31 December 20X3 will be recognised in other comprehensive income for that year. Note that any actuarial gains and losses recognised in other comprehensive income should not be recognised in profit or loss in a subsequent period.
This accounting treatment has the advantages that it is easy to apply and, whilst actuarial gains and losses are reported, they do not directly impact upon the profit or loss for the period.
• the method adopted is systematic;
• the same method is adopted for both gains and losses; and
• the method is applied consistently from period to period.
Pension benefits
536 KAPLAN PUBLISHING

Step 1 Calculate teh actuarial gains and losses
Obligations:
Assets:
Step 2 The statement of financial position
20X1 20X2 20X3 $000 $000 $000 Obligation at start of year 1,000 1.100 1,380Interest 100 99 110Current serivce costs 130 140 150Benefits paud (150) (180) (190)Actuarial (gain) loss Bal. fig. 20 221 (42) ––––– ––––– ––––– Obligation at end of year 1,110 1,380 1,408 ––––– ––––– –––––
20X1 20X2 20X3 $000 $000 $000 Market value at start of year 1,000 1,190 1,372Expected return on assets 120 131 137Contribution into scheme 90 100 110Benefits paid (150) (180) (190)Actuarial (gain) loss bal, fig. 130 131 (241) ––––– ––––– ––––– Market value at end of year 1.190 1,372 1,188 ––––– ––––– –––––
20X1 20X2 20X3 $000 $000 $000 Pension assets 1,190 1.372 1,188Pension obligations (1.100) (1,380) (1,408) ––––– ––––– ––––– Pension asset (obligation) 90 (8) (220) ––––– ––––– –––––
chapter 15
KAPLAN PUBLISHING 537
Test your understanding 7
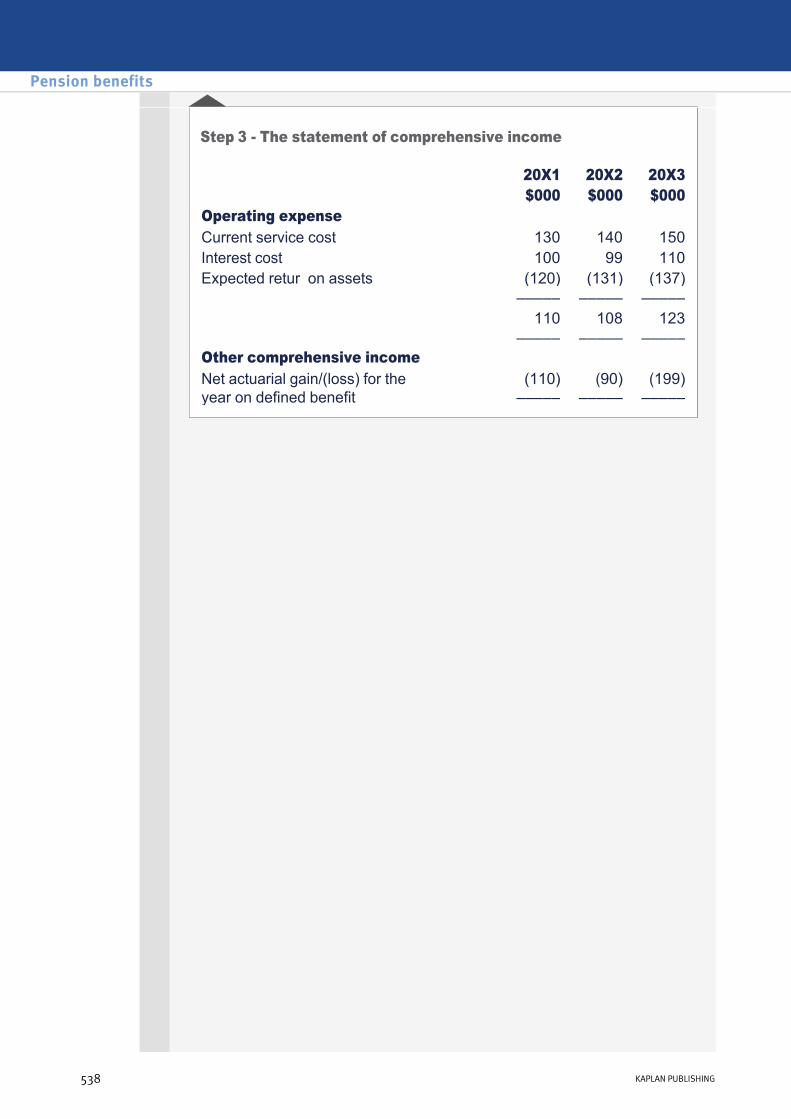
Step 3 The statement of comprehensive income
20X1 20X2 20X3 $000 $000 $000 Operating expense Current service cost 130 140 150Interest cost 100 99 110Expected retur on assets (120) (131) (137) ––––– ––––– ––––– 110 108 123 ––––– ––––– ––––– Other comprehensive income Net actuarial gain/(loss) for the year on defined benefit
(110) –––––
(90) –––––
(199) –––––
Pension benefits
538 KAPLAN PUBLISHING

Substance over formChapter learning objectives
On completion of their studies students should be able to:
• Discuss the principle of substance over form applied to a range of transactions.
539
chapter
16
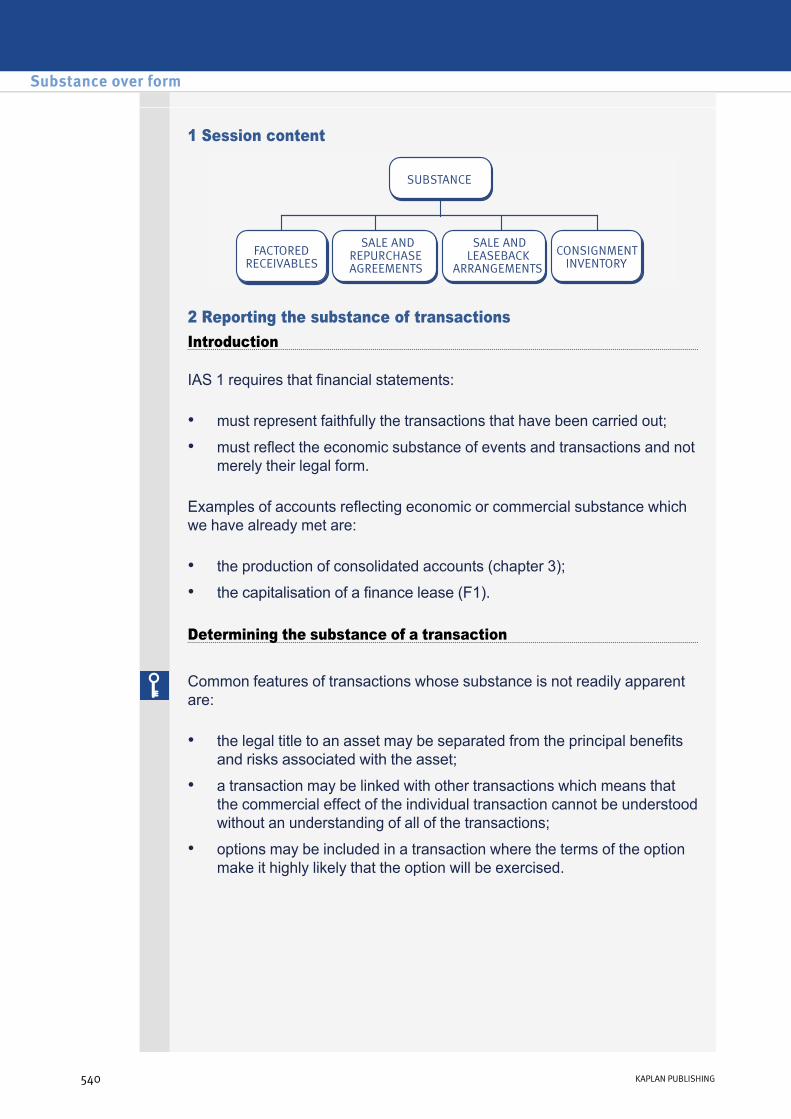
1 Session content
2 Reporting the substance of transactionsIntroduction
IAS 1 requires that financial statements:
Examples of accounts reflecting economic or commercial substance which we have already met are:
• must represent faithfully the transactions that have been carried out;
• must reflect the economic substance of events and transactions and not merely their legal form.
• the production of consolidated accounts (chapter 3);
• the capitalisation of a finance lease (F1).
Determining the substance of a transaction
Common features of transactions whose substance is not readily apparent are:
• the legal title to an asset may be separated from the principal benefits and risks associated with the asset;
• a transaction may be linked with other transactions which means that the commercial effect of the individual transaction cannot be understood without an understanding of all of the transactions;
• options may be included in a transaction where the terms of the option make it highly likely that the option will be exercised.
Substance over form
540 KAPLAN PUBLISHING540 KAPLAN PUBLISHING

Identifying assets and liabilities
Key to determining the substance of a transaction is to identify whether assets and liabilities arise subsequent to that transaction by considering:
• who enjoys the benefits of any asset
• who is exposed to the principal risks of any asset.
Assets are defined in the IASB Framework as resources controlled by the entity as a result of past events and from which future economic benefits are expected to flow to the entity.
Liabilities are defined in the IASB Framework as present obligations of the entity arising from past events, the settlement of which is expected to result in an outflow of resources from the entity.
3 IAS 18 Revenue
IAS 18 states that revenue from the sale of goods should be recognised when the entity has transferred to the buyer the significant risks and rewards of ownership.
Therefore when the entity transfers the risks and rewards the asset should be derecognised i.e. removed from the books and revenue from the sale should be recorded.
4 Examples where substance and form may differ
Examples of areas where substance and form may differ include:
• factoring of receivables;
• sale and repurchase agreements;
• sale and leaseback agreements;
• consignment inventory and goods on saleorreturn.
chapter 16
KAPLAN PUBLISHING 541
Off balance sheet financing
Securitised assets and loan transfers
Recognition and derecognition of assets/liabilities

5 Factored receivables
Factoring of receivables is where a company transfers its receivables balances to another organisation (a factor) for management and collection and receives an advance on the value of those receivables in return.
The receivables are legally "sold" to the factor.
The factor advances the company cash, e.g. 90% of receivables.
The factor collects receivables balance from the customer and may advance further sums to the company.
Factors to consider:
• Has the company transferred the risks and benefits of the receivable to the factor?
• Will the company have to pay back the cash to the factor if the customer does not pay?
• If the company only has to pay back a fixed amount, are they still facing the majority of the risk of the bad debt?
• who bears the risk (of slow payment and irrecoverable debts)?
Substance over form
542 KAPLAN PUBLISHING
Example 1 answer
Special purpose entities
Example 1
An entity has an outstanding receivables balance with a major customer amounting to $12 million and this was factored to FinanceCo on 1 September 20X7. The terms of the factoring were:
FinanceCo will pay 80% of the gross receivable outstanding account to the entity immediately.
Required:
How should this arrangement be accounted for in the financial statements for the year ended 30 September 20X7?
• The balance will be paid (less the charges below) when the debt is collected in full. Any amount of the debt outstanding after four months will be transferred back to the entity at its full book value.
• FinanceCo will charge 1.0% per month of the net amount owing from the entity at the beginning of each month. FinanceCo had not collected any of the factored receivable amounts by the yearend.
• the entity debited the cash from FinanceCo to its bank account and removed the receivable from its accounts. It has prudently charged the difference as an administration cost.
6 Sale and repurchase transactions
Sale and repurchase agreements are situations where an asset is sold by one party to another. The terms of the sale provide for the seller to repurchase the asset in certain circumstances at some point in the future.
Sale and repurchase agreements are common in property developments and in maturing whisky stocks.
The asset has been ‘legally’ sold, but there is either a commitment or an option to repurchase the asset at a later date.
chapter 16
KAPLAN PUBLISHING 543
Test your understanding 1
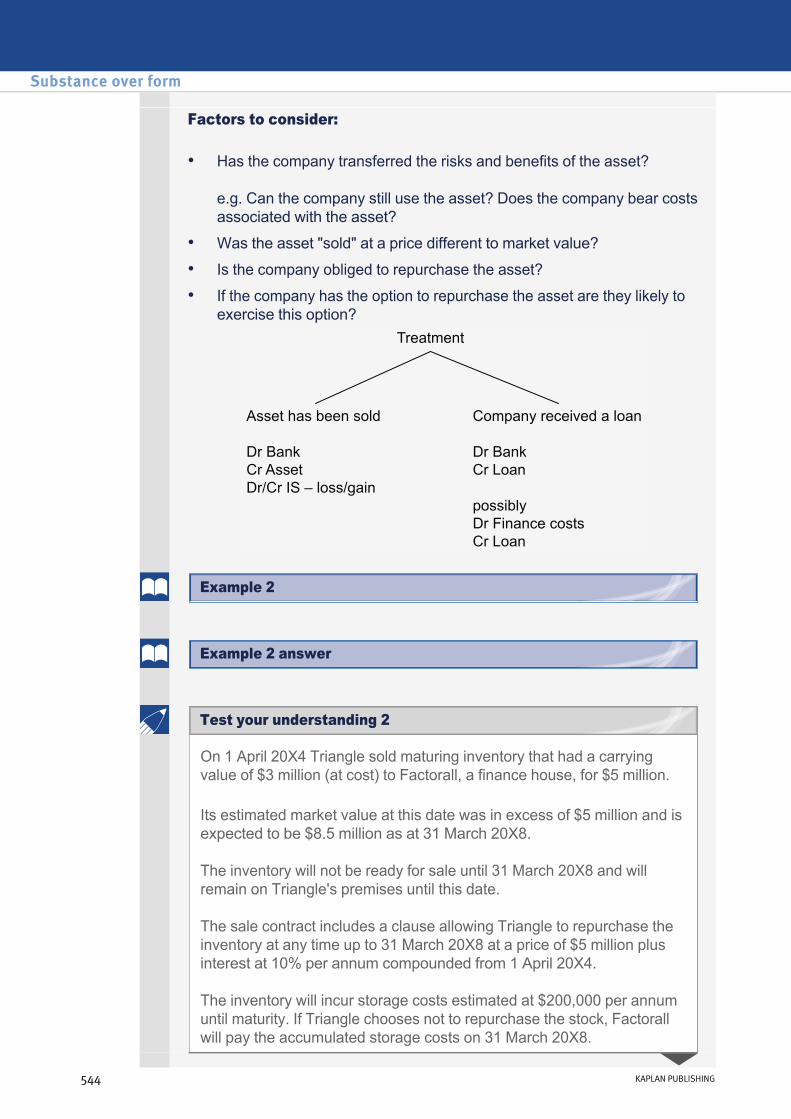
Factors to consider:
• Has the company transferred the risks and benefits of the asset?
e.g. Can the company still use the asset? Does the company bear costs associated with the asset?
• Was the asset "sold" at a price different to market value?
• Is the company obliged to repurchase the asset?
• If the company has the option to repurchase the asset are they likely to exercise this option?
On 1 April 20X4 Triangle sold maturing inventory that had a carrying value of $3 million (at cost) to Factorall, a finance house, for $5 million.
Its estimated market value at this date was in excess of $5 million and is expected to be $8.5 million as at 31 March 20X8.
The inventory will not be ready for sale until 31 March 20X8 and will remain on Triangle's premises until this date.
The sale contract includes a clause allowing Triangle to repurchase the inventory at any time up to 31 March 20X8 at a price of $5 million plus interest at 10% per annum compounded from 1 April 20X4.
The inventory will incur storage costs estimated at $200,000 per annum until maturity. If Triangle chooses not to repurchase the stock, Factorall will pay the accumulated storage costs on 31 March 20X8.
Substance over form
544 KAPLAN PUBLISHING
Example 2 answer
Test your understanding 2
Example 2
The proceeds of the sale have been debited to the bank and the sale has been included in Triangle's turnover.
Required:
Explain how the above should be treated in Triangle's financial statements for the year to 31 March 20X5.
7 Sale and leaseback transactions
A sale and repurchase agreement can be in the form of a sale and leaseback.
Terminology:
Factors to consider:
Under an operating lease record the operating lease rentals through the income statement on a straight line basis.
• Under a sale and leaseback transaction, an entity sells one of its own assets and immediately leases the asset back.
• This is a common way of raising finance whilst retaining the use of the related assets. The buyer / lessor is normally a bank.
• The leaseback is classified as finance or operating in accordance with the usual IAS 17 criteria.
A sells noncurrent asset to B (Seller) (Buyer) Then A leases the noncurrent asset back from B (Lessee) (Lessor)
• What type of lease is the asset being leased back under?
• Under an operating lease, the risks and benefits lie with the lessor, i.e. the buyer. Therefore the entity has transferred the risks and benefits to the buyer and the asset should be derecognised.
• Under a finance lease, the risks and benefits lie with the lessee, i.e. the seller. Therefore the entity has not transferred the risks and benefits. In this case IAS 17 says to record the sale but to bring the asset back in under a finance lease.
• If the asset is leased back under an operating lease but the "sale proceeds" are greater or less than the market value of the asset, the excess profit or loss may need to be deferred.
chapter 16
KAPLAN PUBLISHING 545
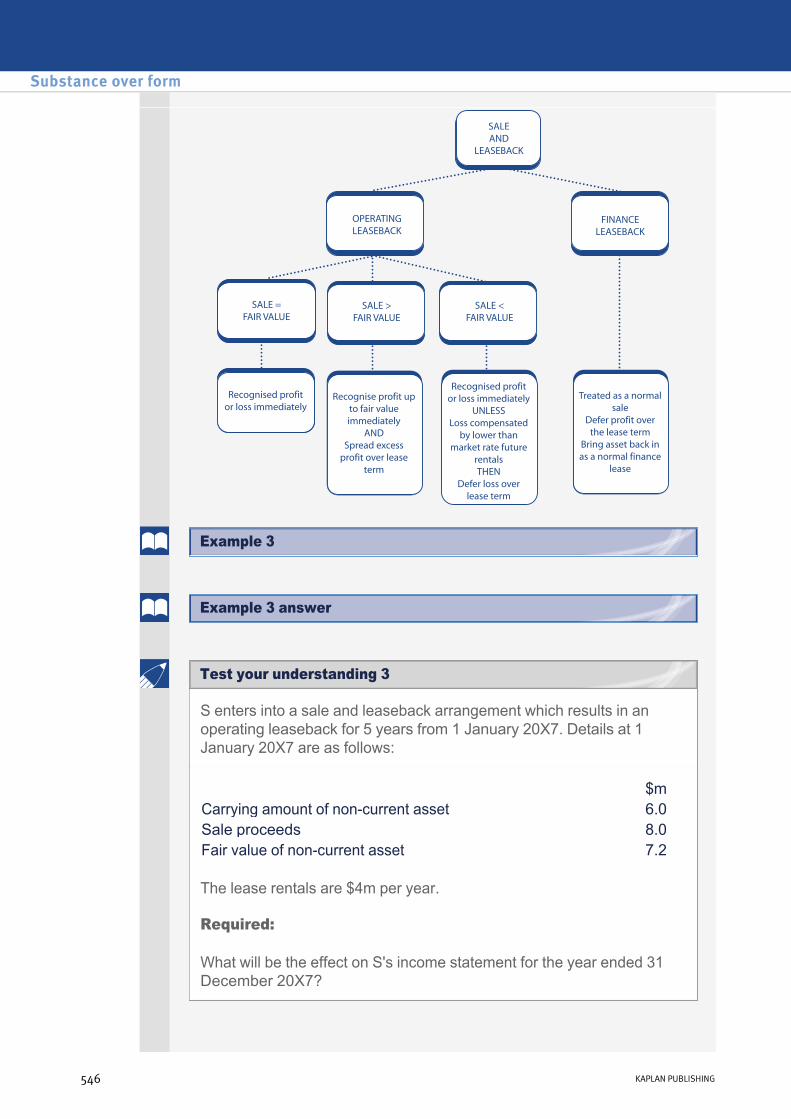
S enters into a sale and leaseback arrangement which results in an operating leaseback for 5 years from 1 January 20X7. Details at 1 January 20X7 are as follows:
The lease rentals are $4m per year.
Required:
What will be the effect on S's income statement for the year ended 31 December 20X7?
$mCarrying amount of noncurrent asset 6.0Sale proceeds 8.0Fair value of noncurrent asset 7.2
Substance over form
546 KAPLAN PUBLISHING
Example 3 answer
Example 3
Test your understanding 3
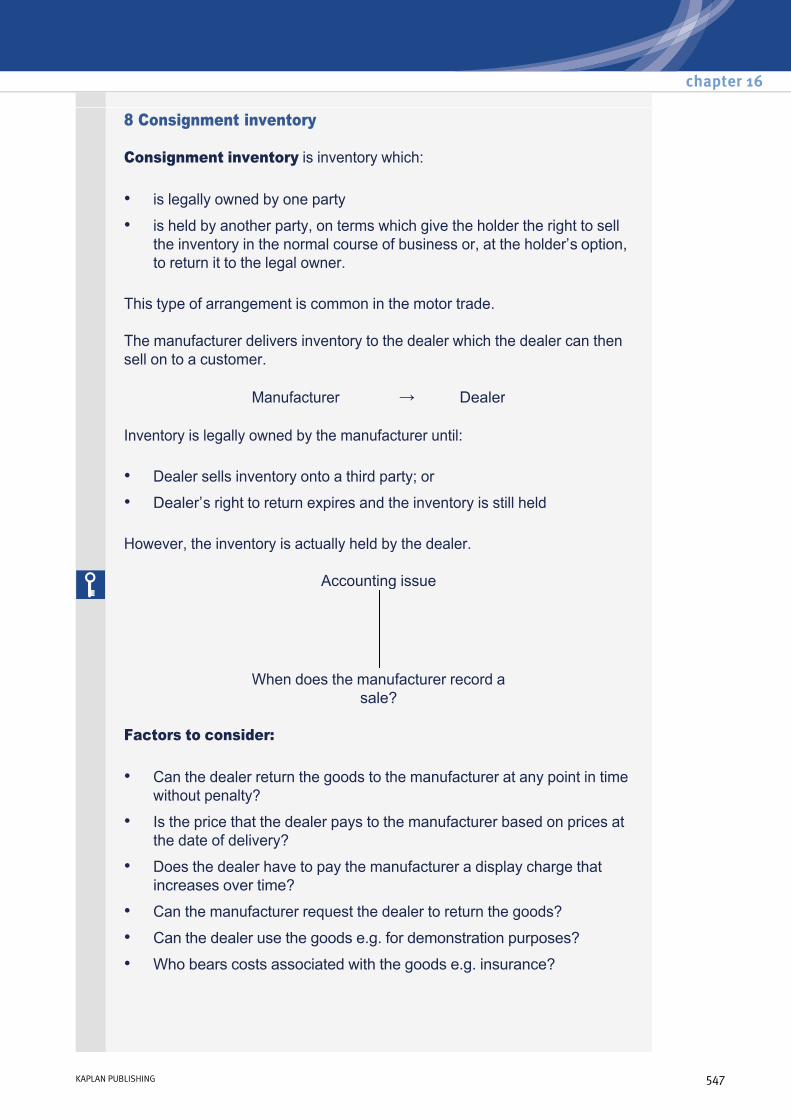
8 Consignment inventory
Consignment inventory is inventory which:
This type of arrangement is common in the motor trade.
The manufacturer delivers inventory to the dealer which the dealer can then sell on to a customer.
Inventory is legally owned by the manufacturer until:
However, the inventory is actually held by the dealer.
• is legally owned by one party
• is held by another party, on terms which give the holder the right to sell the inventory in the normal course of business or, at the holder’s option, to return it to the legal owner.
Manufacturer → Dealer
• Dealer sells inventory onto a third party; or
• Dealer’s right to return expires and the inventory is still held
Accounting issue When does the manufacturer record a
sale?
Factors to consider:
• Can the dealer return the goods to the manufacturer at any point in time without penalty?
• Is the price that the dealer pays to the manufacturer based on prices at the date of delivery?
• Does the dealer have to pay the manufacturer a display charge that increases over time?
• Can the manufacturer request the dealer to return the goods?
• Can the dealer use the goods e.g. for demonstration purposes?
• Who bears costs associated with the goods e.g. insurance?
chapter 16
KAPLAN PUBLISHING 547
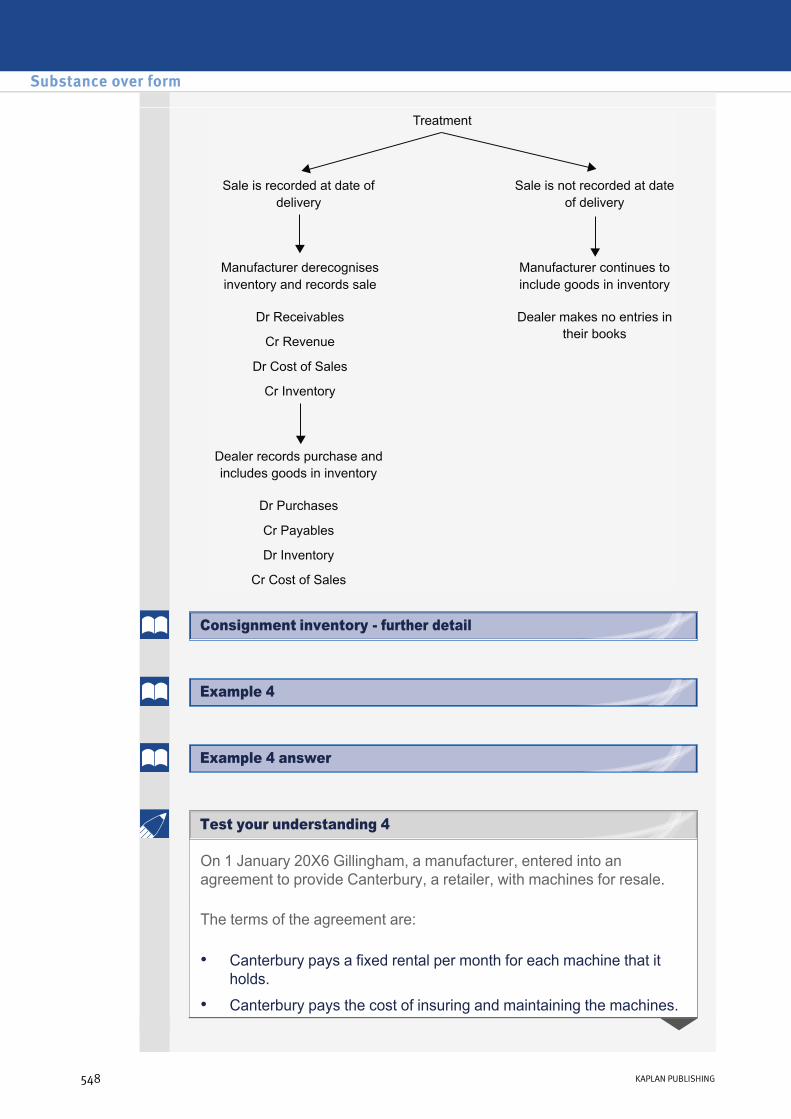
On 1 January 20X6 Gillingham, a manufacturer, entered into an agreement to provide Canterbury, a retailer, with machines for resale.
The terms of the agreement are:
• Canterbury pays a fixed rental per month for each machine that it holds.
• Canterbury pays the cost of insuring and maintaining the machines.
Substance over form
548 KAPLAN PUBLISHING
Test your understanding 4
Consignment inventory further detail
Example 4 answer
Example 4
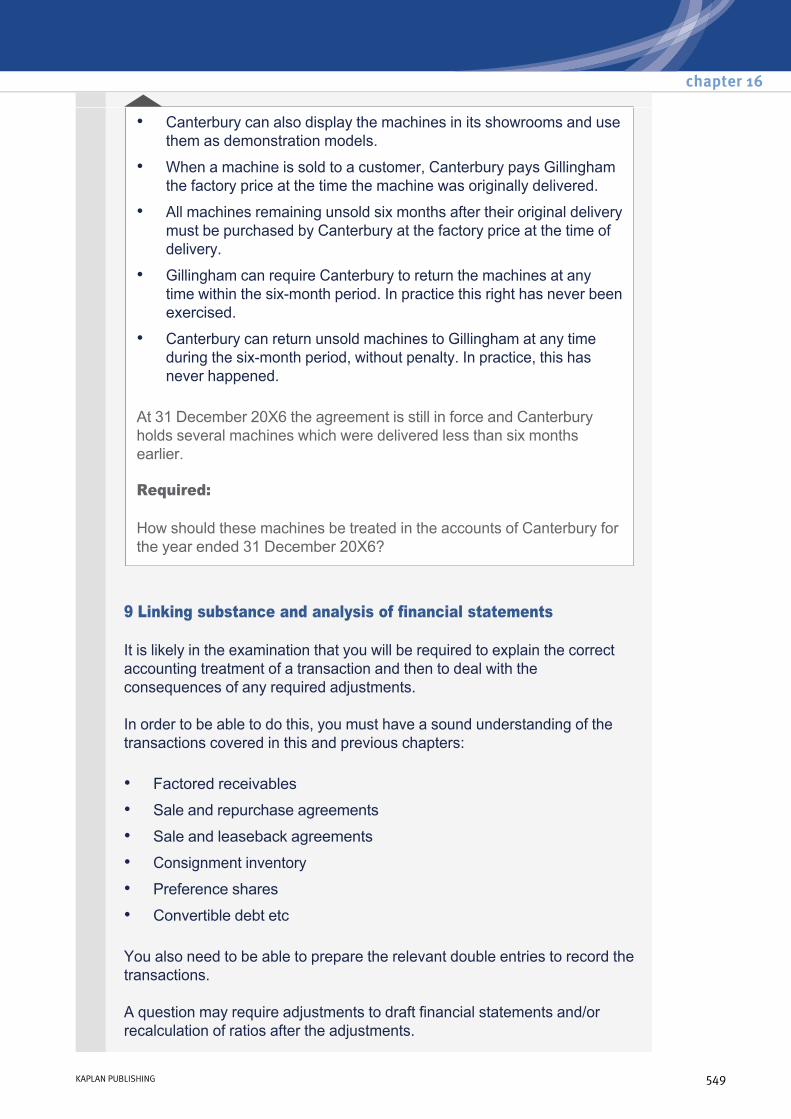
At 31 December 20X6 the agreement is still in force and Canterbury holds several machines which were delivered less than six months earlier.
Required:
How should these machines be treated in the accounts of Canterbury for the year ended 31 December 20X6?
• Canterbury can also display the machines in its showrooms and use them as demonstration models.
• When a machine is sold to a customer, Canterbury pays Gillingham the factory price at the time the machine was originally delivered.
• All machines remaining unsold six months after their original delivery must be purchased by Canterbury at the factory price at the time of delivery.
• Gillingham can require Canterbury to return the machines at any time within the sixmonth period. In practice this right has never been exercised.
• Canterbury can return unsold machines to Gillingham at any time during the sixmonth period, without penalty. In practice, this has never happened.
9 Linking substance and analysis of financial statements
It is likely in the examination that you will be required to explain the correct accounting treatment of a transaction and then to deal with the consequences of any required adjustments.
In order to be able to do this, you must have a sound understanding of the transactions covered in this and previous chapters:
You also need to be able to prepare the relevant double entries to record the transactions.
A question may require adjustments to draft financial statements and/or recalculation of ratios after the adjustments.
• Factored receivables
• Sale and repurchase agreements
• Sale and leaseback agreements
• Consignment inventory
• Preference shares
• Convertible debt etc
chapter 16
KAPLAN PUBLISHING 549

The following TYU is a good example of this type of question and further examples can be found in the Exam Practice Kit.
You are the management accountant of Expand – a large group that seeks to grow by acquisition. The directors of Expand have identified two potential target entities (A and B) and obtained copies of their financial statements. Extracts from these financial statements, together with notes providing additional information, are given below:
Statements of comprehensive income for the year ended 31 December 20X1
Statements of changes in equity for the year ended 31 December 20X1
A B $000 $000
Revenue 68,000 66,000Cost of sales (42,000) (45,950) –––––– –––––– Gross profit 26,000 20,050Other operating expenses (18,000) (14,000) –––––– –––––– Profit from operations 8,000 6,050Finance cost (3,000) (4,000) –––––– –––––– Profit before tax 5,000 2,050Income tax expense (1,500) (1,000) ––––– ––––– Net profit for the period 3,500 1,050Other comprehensive income Surplus on revaluation of properties – 6,000 ––––– ––––– Total comprehensive income 3,500 7,050
––––– –––––
A B $000 $000
Balance at 1 January 20X1 22,000 16,000Comprehensive income 3,500 7,050Dividends paid (2,000) (1,000) –––––– –––––– Balance at 31 December 20X1 23,500 22,050
–––––– ––––––
Substance over form
550 KAPLAN PUBLISHING
Test your understanding 5 Expand again

Statements of financial position at 31 December 20X1
Notes to the financial statements
A B $000 $000 $000 $000
Noncurrent assets Property, plant and equipment 32,000 35,050
–––––– –––––– 32,000 35,050
Current assets Inventories 6,000 7,000 Trade receivables 12,000 10,000
–––––– –––––– 18,000 17,000 –––––– –––––– 50,000 52,050 –––––– ––––––
Equity Share capital ($1 shares) 16,000 12,000Revaluation reserve Nil 5,000Retained earnings 7,500 5,050 –––––– –––––– 23,500 22,050Noncurrent liabilities Longterm borrowings 16,000 18,000Current liabilities Trade payables 5,000 5,000 Income tax 1,500 1,000 Shortterm borrowings 4,000 6,000
–––––– –––––– 10,500 12,000 –––––– –––––– 50,000 52,050 –––––– ––––––
(1) Sale by A to X
On 31 December 20X1, A supplied goods, at the normal selling price of $2.4 million, to another company, X. A's normal selling price is at a mark up of 60% on cost. X paid for the goods in cash on the same day. The terms of the selling agreement were that A repurchase these goods on 30 June 20X2 for $2.5 million. A has accounted for the transaction as a sale.
chapter 16
KAPLAN PUBLISHING 551

Expand uses ratio analysis to appraise potential investment opportunities. It is normal practice to base the appraisal on four key ratios:
For the purposes of the ratio analysis, Expand compute
Your assistant has computed the four key ratios for the two enterprises from the financial statements provided and the results are summarised below:
Your assistant has informed you that, on the basis of the ratios calculated, the performance of A is superior to that of B in all respects. Therefore, Expand should carry out a more detailed review of A with a view to making a bid to acquire it. However, you are unsure whether this is necessarily the correct conclusion given the information provided in Notes 1 and 2.
(2) Revaluation of noncurrent assets by B
B revalued its noncurrent assets for the first time on 1 January 20X1. The noncurrent assets of A are very similar in age and type to the noncurrent assets of B. However, A has a policy of maintaining all its noncurrent assets at depreciated historical cost. Both companies charge depreciation of noncurrent assets to cost of sales. B has transferred the excess depreciation for the year of $1 million on the revalued assets from the revaluation reserve to retained earnings.
• return on capital employed
• gross profit margin
• asset utilisation
• gearing (debt / debt + equity)
• capital employed as capital and reserves plus borrowings;
• borrowings as longterm borrowings plus shortterm borrowings.
Ratio A B Return on capital employed 18.4% 13.1%Gross profit margin 38.2% 30.4%Asset utilisation 1.6 1.4Gearing 46.0% 52.1%
Substance over form
552 KAPLAN PUBLISHING
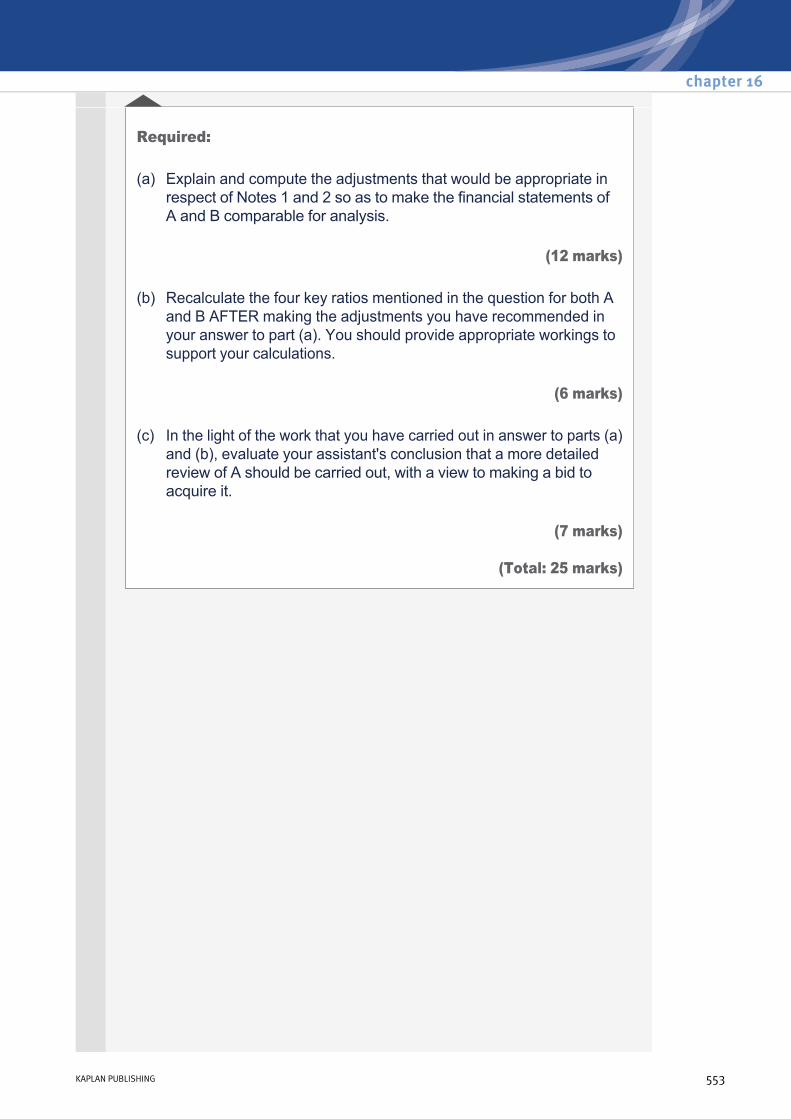
Required:
(12 marks)
(6 marks)
(7 marks)
(Total: 25 marks)
(a) Explain and compute the adjustments that would be appropriate in respect of Notes 1 and 2 so as to make the financial statements of A and B comparable for analysis.
(b) Recalculate the four key ratios mentioned in the question for both A and B AFTER making the adjustments you have recommended in your answer to part (a). You should provide appropriate workings to support your calculations.
(c) In the light of the work that you have carried out in answer to parts (a) and (b), evaluate your assistant's conclusion that a more detailed review of A should be carried out, with a view to making a bid to acquire it.
chapter 16
KAPLAN PUBLISHING 553
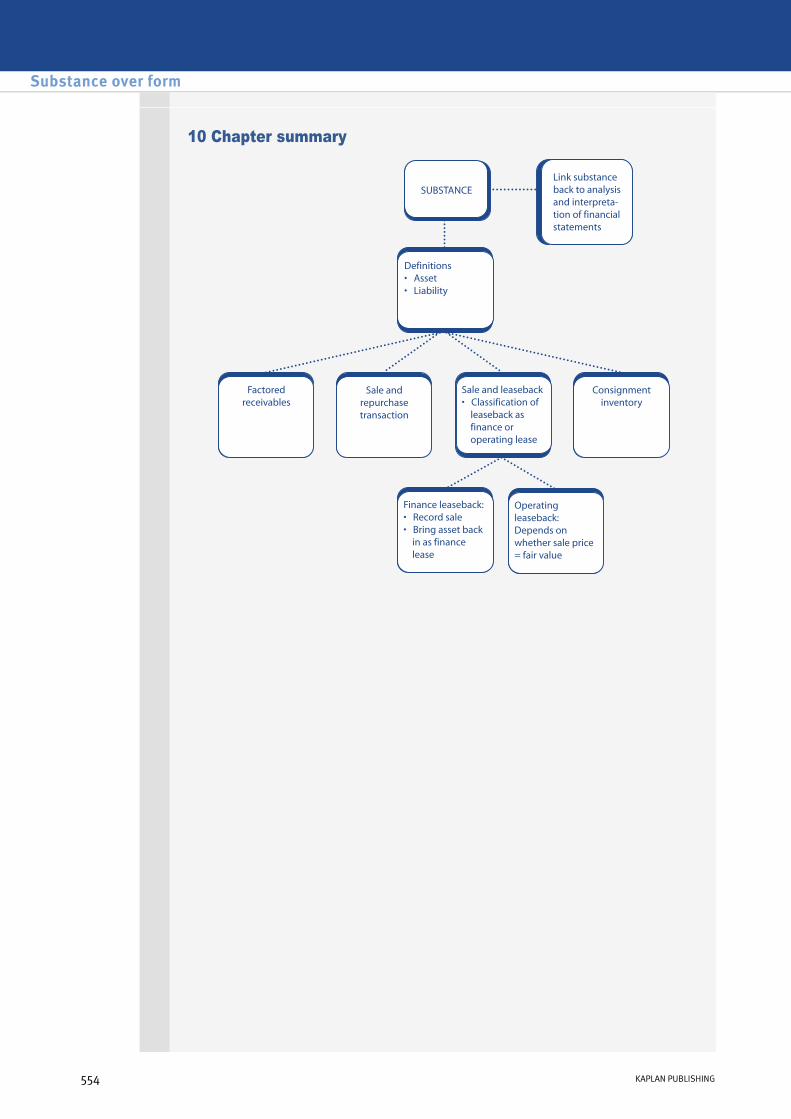
10 Chapter summary
Substance over form
554 KAPLAN PUBLISHING
Test your understanding answers
As the entity still bears the risk of slow payment and irrecoverable debts, the substance of the factoring is that of a loan on which finance charges will be made. The receivable should not have been derecognised nor should all of the difference between the gross receivable and the amount received from the factor have been treated as an administration cost. The required adjustments can be summarised as follows:
Dr Cr $000 $000
Receivables 12,000Loan from factor (80% x 12,000) 9,600Administration (12,000 – 9,600) 2,400Finance costs: accrued interest (9,600 x 1%) 96Accruals 96
–––––– –––––– 12,096 12,096–––––– ––––––
• There is a clause allowing Triangle to repurchase the inventory, indicating a sale and repurchase agreement.
Triangle can repurchase the inventory at $8,120,500 at 31 March 20X8, i.e.$5 million × 1.14 = $7,302,500 plus $800,000 storage costs. Since the market value is expected to be $8.5 million at this time it is likely that Triangle will repurchase the stock.
The above factors indicate therefore that Triangle has not sold the inventory but has simply taken out a loan of $5 million with interest at 10% per annum that is secured on the inventory.
• Triangle have received proceeds of $5 million when the current market value is in excess of this amount. This would indicate that a sale has not taken place in reality.
• Furthermore, since the goods remain on Triangle's premises during the 4 years it does not appear that any reward has been transferred to Factorall.
chapter 16
KAPLAN PUBLISHING 555
Test your understanding 2
Test your understanding 1
Therefore, Triangle should not have recorded a sale, but instead should have recorded a loan of $5 million with a finance cost of 10% per annum. The goods should remain in inventory at their cost of $3 million.
To correct the entries Triangle recorded in error:
Reinstate the closing inventory:
Record the interest for the year at 10% x $5m = $0.5m:
$mDr Revenue (to reverse the sale) 5Cr Liability 5
$mDr Closing inventory (SFP) 3Cr Closing inventory (IS) 3
$mDr Finance cost 0.5Cr Liability 0.5
As the sale proceeds exceed the fair value of the noncurrent asset, the excess profit must be deferred over the lease term.
Profit now: 7.2 – 6.0 = $1.2m
Profit to be deferred over 5 years:
8.0 – 7.2 = $0.8m
$0.8m /5 years = $0.16m p.a.
Income statement for year ended 31 December 20X7
$mOperating lease rentals (4.00)Profit up to fair value recognised immediately
1.20
Release of deferred profit 0.16 –––– 2.64
Substance over form
556 KAPLAN PUBLISHING
Test your understanding 3
The key issue is whether Canterbury has purchased the machines from Gillingham or whether they are merely on loan.
It is necessary to determine whether Canterbury has the benefits of holding the machines and is exposed to the risks inherent in those benefits.
Gillingham can demand the return of the machines and Canterbury is able to return them without penalty. This suggests that Canterbury does not have the automatic right to retain or to use them.
Canterbury pays a rental charge for the machines, despite the fact that it may eventually purchase them outright. This suggests a financing arrangement as the rental could be seen as loan interest on the purchase price. Canterbury also incurs the costs normally associated with holding inventories.
The purchase price is the price at the date the machines were first delivered. This suggests that the sale actually takes place at the delivery date. Canterbury has to purchase any inventory still held six months after delivery. Therefore the company is exposed to slow payment and obsolescence risks. Because Canterbury can return the inventory before that time, this exposure is limited.
It appears that both parties experience the risks and benefits. However, although the agreement provides for the return of the machines, in practice this has never happened.
Conclusion: the machines are assets of Canterbury and should be included in their statement of financial position.
chapter 16
KAPLAN PUBLISHING 557
Test your understanding 4
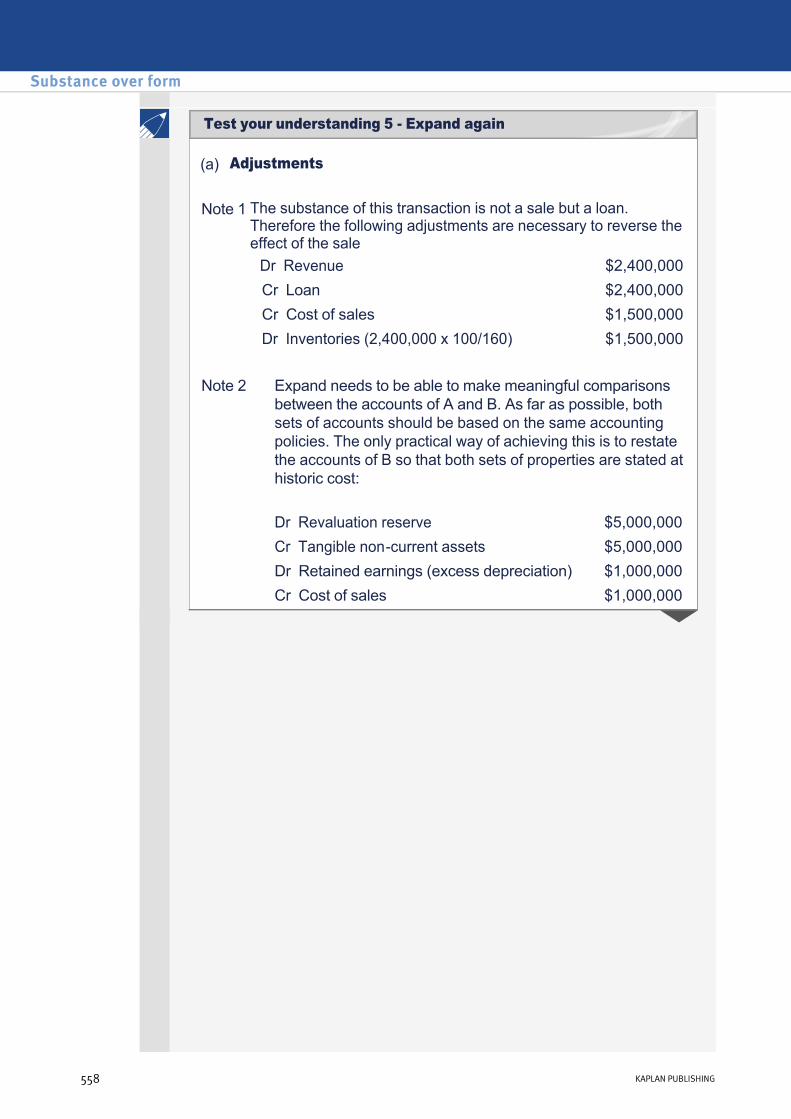
(a) Adjustments
Note 1 The substance of this transaction is not a sale but a loan. Therefore the following adjustments are necessary to reverse the effect of the saleDr Revenue $2,400,000Cr Loan $2,400,000Cr Cost of sales $1,500,000Dr Inventories (2,400,000 x 100/160) $1,500,000
Note 2 Expand needs to be able to make meaningful comparisons
between the accounts of A and B. As far as possible, both sets of accounts should be based on the same accounting policies. The only practical way of achieving this is to restate the accounts of B so that both sets of properties are stated at historic cost:
Dr Revaluation reserve $5,000,000 Cr Tangible noncurrent assets $5,000,000 Dr Retained earnings (excess depreciation) $1,000,000 Cr Cost of sales $1,000,000
Substance over form
558 KAPLAN PUBLISHING
Test your understanding 5 Expand again

These adjustments affect the accounts as follows:
Before Adjustment After $000 $000 $000
Company A Revenue 68,000 (2,400) 65,600 Cost of sales (42,000) 1,500 (40,500)
–––––––– –––––––– Gross profit 26,000 (900) 25,100
–––––––– –––––––– Profit from operations 8,000 (900) 7,100
–––––––– –––––––– Borrowings (4,000 + 16,000) 20,000 2,400 22,400 Capital and reserves 23,500 (900) 22,600
–––––––– –––––––– Capital employed 43,500 45,000
–––––––– –––––––– Company B Revenue 66,000 66,000 Cost of sales (45,950) 1,000 (44,950)
–––––––– –––––––– Gross profit 20,050 1,000 21,050
–––––––– –––––––– Profit from operations 6,050 1,000 7,050
–––––––– –––––––– Borrowings (6,000 + 18,000) 24,000 24,000 Capital and reserves 22,050 (5,000) 17,050
–––––––– –––––––– Capital employed 46,050 41,050
–––––––– ––––––––
chapter 16
KAPLAN PUBLISHING 559
For these reasons B may be the better company to acquire, particularly if the operating expenses of A cannot be reduced. B has significantly higher leverage (gearing) than A, but this may not be a critical factor if Expand can change the capital structure or provide the company with additional finance.
(b) Ratios A B
Return on capital employed
Profit from operations –––––––––––––––– Capital Employed
7,100 –––––– = 15.8% 45,000
7,050 –––––– = 17.2% 41,050
Gross profit margin
Gross profit –––––––– Revenue
25,100 –––––– = 38.3% 65,600
21,050 –––––– = 31.9% 66,000
Turnover of capital employed
Revenue ––––––––––––– Capital Employed
65,600 –––––– = 1.5 45,000
66,000 –––––– = 1.6 41,050
Leverage (gearing)
Total borrowings ––––––––––––– Capital Employed
22,400 –––––– = 49.8% 45,000
24,000 –––––– = 58.5% 41,050
(c) Evaluation
The ratios based on the adjusted accounts show that A is not necessarily the better acquisition.
The adjustments have had the effect of reducing the profits of A and slightly improving the profits of B. Although A still clearly has the better gross profit margin, B now has the better return on capital employed. There appear to be two reasons for this: – the turnover of capital employed ratio shows that B is slightly
better at generating sales revenue from its capital base than A; and
– A has operating expenses of $4 million more than B, although both companies have similar levels of revenue.
Substance over form
560 KAPLAN PUBLISHING


