15
CIMA SALARY SURVEY 2013 United Kingdom

CIMA SALARY SURVEY 2013
United Kingdom

1
ForewordCIMA’s members and students are looking forward to rapid career progression and salary rises well above the national average - despite the continuing economic uncertainty. This optimistic outlook reflects the growing demand for professionally qualified management accountants who are focused on helping organisations – in both the public and private sectors - to develop strategies that are successful and sustainable in the long term.
Five years after the onset of the credit crunch, our annual salary survey of the CIMA community highlights a brightening optimism that the UK’s economy is finally rallying. Results show an ongoing trend towards greater employment stability with fewer concerns about falls in business profits, budget cuts or recruitment and salary freezes.
Overall, our members and students told us that they are heading for a dynamic future with promotion and attractive earnings packages on the horizon. Their confidence may well have been boosted by CIMA’s joint venture with the American Institute of Certified Public Accountants. The result of this alliance is a new global designation, the Chartered Global Management Accountant (CGMA). The CGMA designation is rapidly gaining globally acceptance as a mark of unparalleled excellence in business and financial management.
On average, CIMA members are earning just under £67,000 per annum while CIMA fellows are commanding significantly more at around £117,000. Those who have reached the top of the ladder as CEOs and MDs are taking home average salaries nearer £143,000. Moreover, our students’ earnings in the UK are a healthy 36% above the national average.
The 2013 survey figures for average basic salaries represent a 13% increase compared with last year’s figures for qualified members. There was also a 9% increase for students. This is far above the increase in the average national salary of just 0.2% reported by the Office for National Statistics - and greatly exceeds expectations expressed in the 2012 survey.
However there is still a considerable gender gap among members where, on average, women earn £17,450 less than their male counterparts. This is a slight drop from last year’s figure and CIMA is working hard to address this issue. There are signs that the younger generation is beginning to close the imbalance: the gap between male and female students is significantly lower at just under £3,000.
Ambition is a key driver for both members and students. In all, 40% said they want to develop their leadership skills. Almost all of our members and students (97%) expect to be in a different role in three years’ time. Over half (53%) expect to be in a senior, finance-related role. The growing diversity of CIMA members as business partners is reflected by members, 17% of whom anticipate being in a very senior, non-finance role such as CEO or leading a non-finance division.
However, our survey also revealed a preference for a more flexible approach to career progression. Key workplace motivators were divided fairly equally between a desire for flexibility/work-life balance (49%), a good working environment (47%) financial reward (43%), and a challenging workload (39%). Combined, these responses give a clear indicator to employers of what they should be offering if they want to attract the very best in management accounting expertise.
Charles Tilley Chief Executive CIMA
2
Salary survey results
UK average salary figures
In 2013, qualified CIMA members in the UK1 are earning on average £60,655 in basic salary plus £6,055 in bonus payments, totalling £66,710 per annum. Part qualified students in the UK are earning on average £34,309 in basic salary plus £1,836 in bonus payments, totalling £36,146. This compares with a current average national UK salary figure of £26,664.2
Total salaries for CIMA members have
increased well above the national average
The 2013 figures for average basic salaries represent a 13% increase on equivalent 2012 figures for qualified members and a 9% increase for part qualified students.3 These are far above the increase in average national salary of just 0.2% reported by the Office for National Statistics.4
Robust salary satisfaction
Overall, 69% of all CIMA members are satisfied with their current salary and the figure is greater among the higher-earning Fellows at 81%. Among part qualified students, 62% are satisfied with their current salary. There is also considerable optimism about future salaries,
particularly among part qualified students.
Above-inflation salary increases anticipated
for 2014
In contrast to the continued dampening of national average wage rises, CIMA members and students are optimistic about their personal salary rises over the next 12 months. An average rise of 3.4% is anticipated by the 87% of qualified members, who are expecting a salary increase; which in real terms will be above inflation forecasts of 2.7% to 2.8%.5
Among the 89% of part qualified students who are anticipating higher salaries, the average expected pay rise tends to increase with CIMA level attained, from 4.7% among those at operational level to 6.4% among those at T4 professional competence level.
CIMA boosts salary deals
The optimism of part qualified and newly qualified students about pay increases is boosted by the CIMA qualification: over two-thirds (70%) of them agree that it strengthens their position in salary negotiations.
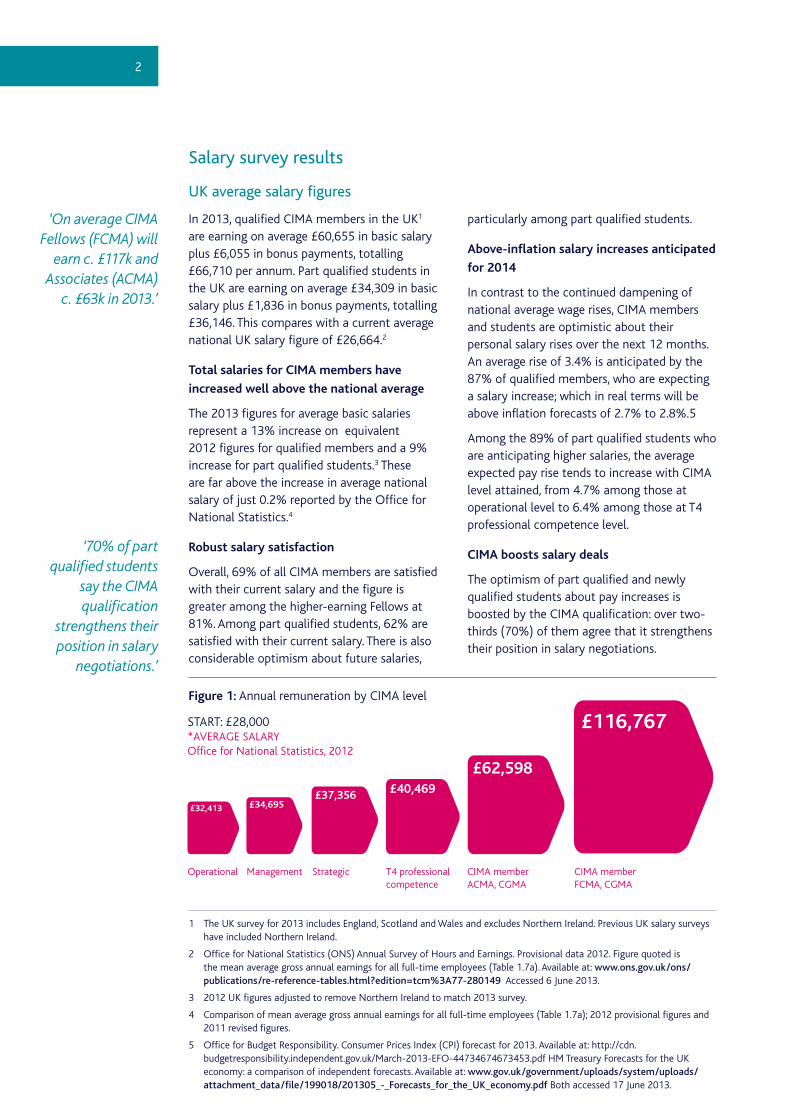
Figure 1: Annual remuneration by CIMA level
‘On average CIMA Fellows (FCMA) will
earn c. £117k and Associates (ACMA)
c. £63k in 2013.’
‘70% of part qualified students
say the CIMA qualification
strengthens their position in salary
negotiations.’
£116,767
£62,598
£37,356£34,695£32,413
£40,469
CIMA memberFCMA, CGMA
CIMA memberACMA, CGMA
Strategic T4 professionalcompetence
Management
START: £28,000*AVERAGE SALARYOffice for National Statistics, 2012
Operational
1 The UK survey for 2013 includes England, Scotland and Wales and excludes Northern Ireland. Previous UK salary surveys have included Northern Ireland.
2 Office for National Statistics (ONS) Annual Survey of Hours and Earnings. Provisional data 2012. Figure quoted is the mean average gross annual earnings for all full-time employees (Table 1.7a). Available at: www.ons.gov.uk/ons/publications/re-reference-tables.html?edition=tcm%3A77-280149 Accessed 6 June 2013.
3 2012 UK figures adjusted to remove Northern Ireland to match 2013 survey.
4 Comparison of mean average gross annual earnings for all full-time employees (Table 1.7a); 2012 provisional figures and 2011 revised figures.
5 Office for Budget Responsibility. Consumer Prices Index (CPI) forecast for 2013. Available at: http://cdn.budgetresponsibility.independent.gov.uk/March-2013-EFO-44734674673453.pdf HM Treasury Forecasts for the UK economy: a comparison of independent forecasts. Available at: www.gov.uk/government/uploads/system/uploads/attachment_data/file/199018/201305_-_Forecasts_for_the_UK_economy.pdf Both accessed 17 June 2013.
3
Salary patterns
Annual remuneration varies by job role but
increases substantially with experience
Among part qualified students, those in assisting roles, such as assistant management accountant, are typically earning between £25,000 and £27,000 per annum in total salary.
Management accountants typically earn £35,000 and financial analysts/business analysts £39,000 per annum on average, including bonus. However, many are already in managerial roles (both finance and non-finance related), and earn in the region of £40,000 to £55,000 per year.
One-fifth of qualified CIMA members are in very senior roles, earning in the region of £100,000 to £150,000 and upwards per annum. Among them, 80–90% are satisfied with their salary.
Finance managers, project accountants and financial controllers earn on average £58,000 to £65,000 in total annual salary, while accountants typically earn £41,000 to £44,000.
More generally, over one-half (56%) of all qualified members are earning a mid-tier basic salary of £40,000 to £70,000 per year, while one-quarter are earning a higher-tier basic salary of £70,000 or more.
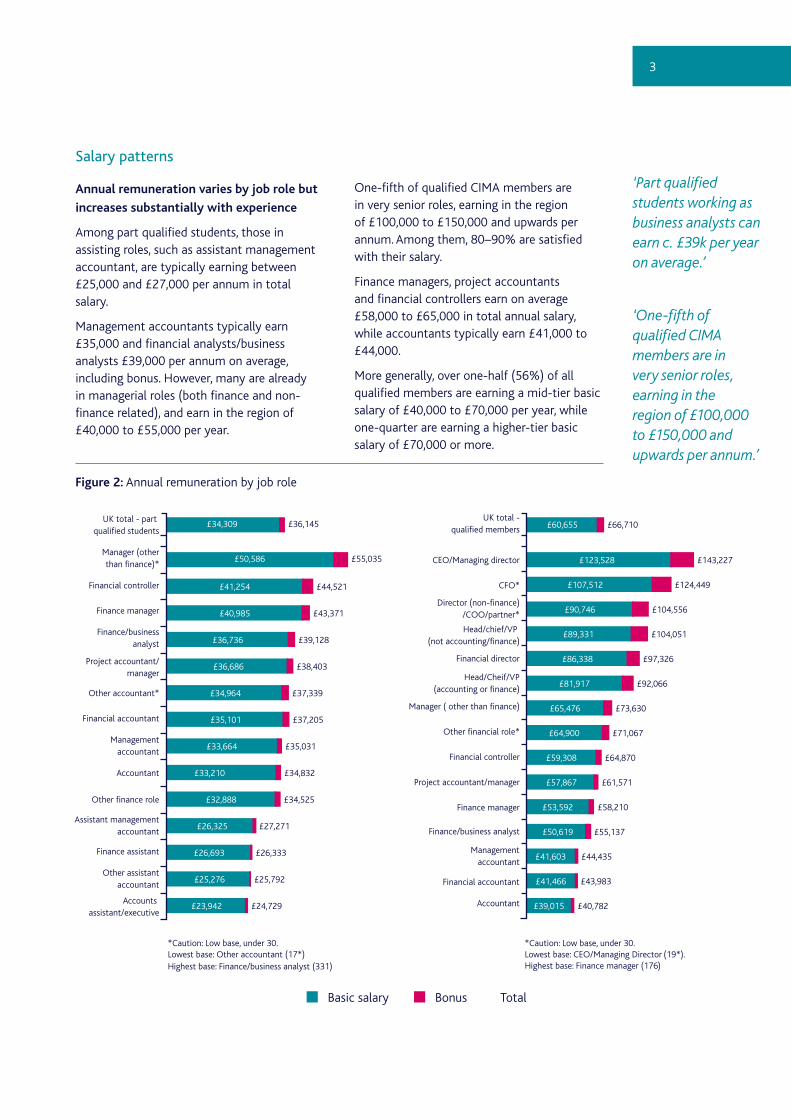
Figure 2: Annual remuneration by job role
‘Part qualified students working as business analysts can earn c. £39k per year on average.’
‘One-fifth of qualified CIMA members are in very senior roles, earning in the region of £100,000 to £150,000 and upwards per annum.’
£44,521£41,254
£43,371£40,985
£39,128£36,736
£38,403£36,686
£37,339£34,964
£37,205£35,101
£35,031£33,664
£34,832£33,210
£34,525£32,888
£27,271£26,325
£26,333£26,693
£25,792£25,276
£24,729£23,942
£55,035£50,586
£36,145£34,309UK total - part
qualified students
Manager (otherthan finance)*
Financial controller
Finance manager
Finance/businessanalyst
Project accountant/manager
Other accountant*
Financial accountant
Managementaccountant
Accountant
Other finance role
Assistant managementaccountant
Finance assistant
Other assistantaccountant
Accounts assistant/executive
*Caution: Low base, under 30.Lowest base: Other accountant (17*)Highest base: Finance/business analyst (331)
£104,556£90,746
£143,227£123,528
£124,449£107,512
£104,051£89,331
£97,326£86,338
£92,066£81,917
£73,630£65,476
£71,067£64,900
£64,870£59,308
£61,571£57,867
£58,210£53,592
£55,137£50,619
£44,435£41,603
£43,983£41,466
£40,782£39,015
£66,710£60,655UK total -
qualified members
CEO/Managing director
CFO*
Director (non-finance)/COO/partner*
Head/chief/VP (not accounting/finance)
Financial director
Head/Cheif/VP(accounting or finance)
Manager ( other than finance)
Other financial role*
Financial controller
Project accountant/manager
Finance manager
Finance/business analyst
Managementaccountant
Financial accountant
Accountant
Basic salary Bonus Total
*Caution: Low base, under 30.Lowest base: CEO/Managing Director (19*). Highest base: Finance manager (176)

4
‘Part qualified students working in London are earning £40,000 in average
total salary.’
Annual remuneration by region
Regions with strong bases in finance, banking and HQ presence report higher average total annual salaries: London, the South East and Scotland (where the oil, gas and alternative energy sector is also key) are more likely than average to report higher-tier basic salaries and bonus payments. On average, members in southern regions anticipate 9% in bonus payments, compared to 7% among those in northern regions.
Part qualified students working in London earn £40,000 in average total salary, including
bonus, which is typically 6% on top of basic salary.
Mid to northern regions, by contrast, have strong manufacturing, transport and distribution sectors, and account for 30% of qualified members and part qualified students. These sectors tend to attract salaries in line with the overall national average.
In 2013, a higher average salary is reported for members working in the East of England compared to previous years, but over half (56%) continue to earn a mid-tier basic salary of £40,000 to £70,000 per annum.
Figure 3: Annual remuneration by region
ScotlandPart qualified: £33,133Qualified: £64,287
North WestPart qualified: £29,744Qualified: £57,343
East and WestMidlandsPart qualified: £30,835Qualified: £57,237
East of EnglandPart qualified: £31,663Qualified: £84,114
South WestPart qualified: £31,495Qualified: £62,640
LondonPart qualified: £40,185Qualified: £79,078
South EastPart qualified: £34,843Qualified: £69,967
North East andYorkshire/HumbersidePart qualified: £29,067Qualified: £49,619

5
Annual remuneration by sector
The sectors that tend to pay higher than average total annual salaries across the CIMA membership are:
• banking,
• business services (typically consultancy and legal professional services),
• financial services and
• oil, gas and alternative energy.
Compared to the average pay package among qualified members (£66,710), those working in banking earn 23% more and those working in business services earn 22% more.
In 2013, part qualified students working in the banking sector earn 27% more and those in
oil, gas and alternative energy earn 16% more than the UK total salary package of £36,146.
Qualified members in accountancy practices are more likely to own the practice in which they work and therefore command high-tier salaries. Conversely, part qualified students working in the accountancy sector report an average total salary package 11% below the UK average. Those working in the education sector report an average total annual salary 16% below the UK average.
For qualified members, three sectors are reporting salary packages lower than the national average: education (23% lower), public sector (25%) and not-for-profit/charity (30%).
Figure 4: Annual remuneration by sector
The banking, business services, financial and oil, gas and alternative energy sectors tend to pay higher than average total annual salaries across the CIMA membership.’
£46,057£42,067
£41,984£38,620
£39,975£38,148
£39,569£36,138
£38,782£36,552
£37,690£36,442
£35,226£34,774
£34,191£32,625
£33,896£31,877
£33,842£32,109
£33,545£31,320
£33,174£31,789
£32,870£31,578
£32,631£31,420
£32,267£31,360
£32,253£31,879
£32,055£30,857
£30,535£30,376
£36,146£34,309UK total - part
qualified members
Banking
Oil, gas andalternative energy
Business services
Financial services
ICT, technologyand telecoms
Media, marketing,advertising and PR
Public sector
Transport, distributionand storage
Retail andconsumer goods
Travel, leisureand tourism
Natural resources, energy/fuel and utilities
Sales, purchasing andsupply chain*
Manufacturing and engineering
Constructionand property
Healthcare andpharmaceutical
Not-for-profit/charity
Accountancy
Education*
£84,032£77,671
£82,377£72,336
£81,294£72,031
£76,917£67,308
£72,867£65,431
£71,718£64,654
£68,679£62,928
£68,514£60,774
£66,381£59,971
£65,851£58,757
£65,124£60,524
£64,579£58,425
£64,397£58,734
£56,437£51,296
£51,583£51,090
£49,746£49,421
£46,991£46,303
£66,710£60,655UK total -
qualified members
Accounting*
Banking
Business services
Financial services
Oil, gas andalternative energy
Healthcare andpharmaceutical
Media, marketing,advertising and PR
Transport, distributionand storage
ICT, technologyand telecoms
Retail andconsumer goods
Constructionand property
Manufacturing and engineering
Travel, leisureand tourism*
Natural resources,energy/fuel and utilities*
Education*
Public sector
Not-for-profit/charity
*Caution: Low base, under 30.Lowest base: Sales, purchasing and supply chain (21*)Highest base: Retail and consumer goods (174)
*Caution: Low base, under 30.Lowest base: Accountancy (18*)Highest base: Manufacturing and engineering (145)
Basic salary Bonus Total
6
Annual remuneration by business size
The number and size of bonuses awarded tend to increase with business size. Businesses with 250 or more employees are largely clustered around London and the South East, where salaries are generally higher. They also include very large businesses (with 10,000 or more employees), which covers the high-paying banking sector.
Among qualified members and part qualified students working in very large organisations, 70% are expecting to receive a bonus, at an average of 12% of annual salary. Those working in micro/small businesses with up to 10 employees are the least likely to receive an annual bonus (55% do not expect to receive one), but among those that do, the average is a 10% bonus. This compares well to the 11% bonus for those expecting one in medium and large businesses.
Business and the economy
Expectations for future pay and conditions
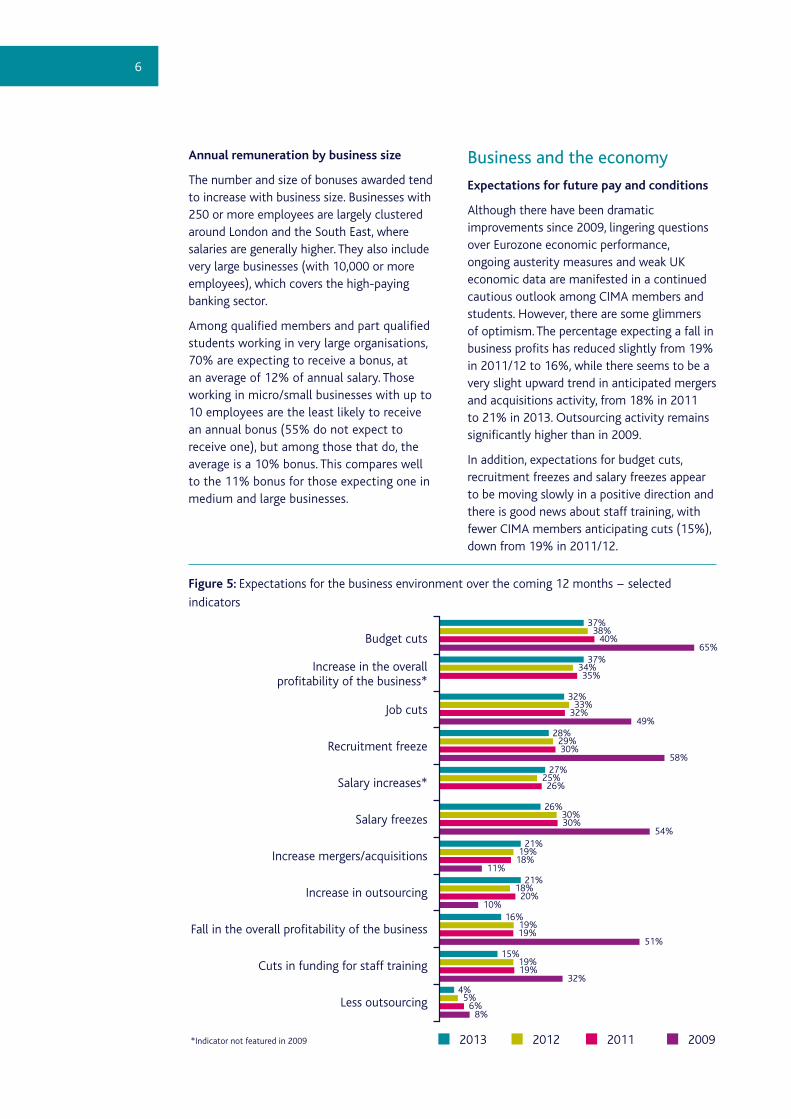
Although there have been dramatic improvements since 2009, lingering questions over Eurozone economic performance, ongoing austerity measures and weak UK economic data are manifested in a continued cautious outlook among CIMA members and students. However, there are some glimmers of optimism. The percentage expecting a fall in business profits has reduced slightly from 19% in 2011/12 to 16%, while there seems to be a very slight upward trend in anticipated mergers and acquisitions activity, from 18% in 2011 to 21% in 2013. Outsourcing activity remains significantly higher than in 2009.
In addition, expectations for budget cuts, recruitment freezes and salary freezes appear to be moving slowly in a positive direction and there is good news about staff training, with fewer CIMA members anticipating cuts (15%), down from 19% in 2011/12.
Figure 5: Expectations for the business environment over the coming 12 months − selected
indicators
37%38%
40%65%
32%33%
32%49%
27%25%26%
28%29%30%
58%
26%30%30%
54%21%
19%18%
11%21%
18%20%
10%
4%5%
6%8%
15%19%19%
32%
16%19%19%
51%
37%34%35%
Budget cuts
Increase in the overallprofitability of the business*
Job cuts
Recruitment freeze
Salary increases*
Salary freezes
Increase mergers/acquisitions
Increase in outsourcing
Fall in the overall profitability of the business
Cuts in funding for staff training
Less outsourcing
201120122013*Indicator not featured in 2009 2009
7
Working conditions
Working hours
On average, UK members and students work 43 hours per week, although 43% work less than the average.
Longer hours are linked to seniority: 44% of part qualified students are working more than 40 hours per week, compared to 61% of qualified Associates and 79% of Fellows. Very large organisations (with 10,000 or more employees) tend to demand longer working hours, with 63% working more than 40 hours per week, compared to 57% in medium and 52% in micro/small businesses.
Two-fifths (38%) of members and students expect their working hours to increase over the coming 12 months, while over one-half (59%) expect no change. The primary
reason for increasing working hours is related to career progression – taking on more responsibility is cited by 65% of members and students. A secondary factor, mentioned by 54%, is understaffing/lack of resource. This is especially evident in large businesses, where understaffing (55%) and company culture (38%) are cited by significant proportions. However, in small and medium businesses, company growth (40%, 38%) and the current financial climate (37%, 30%) seem to be requiring more input from staff.
Motivators at work
The key motivators at work for both members and students are flexibility/work-life balance (49%), a good working environment (47%), financial reward (43%) and a challenging workload (39%).
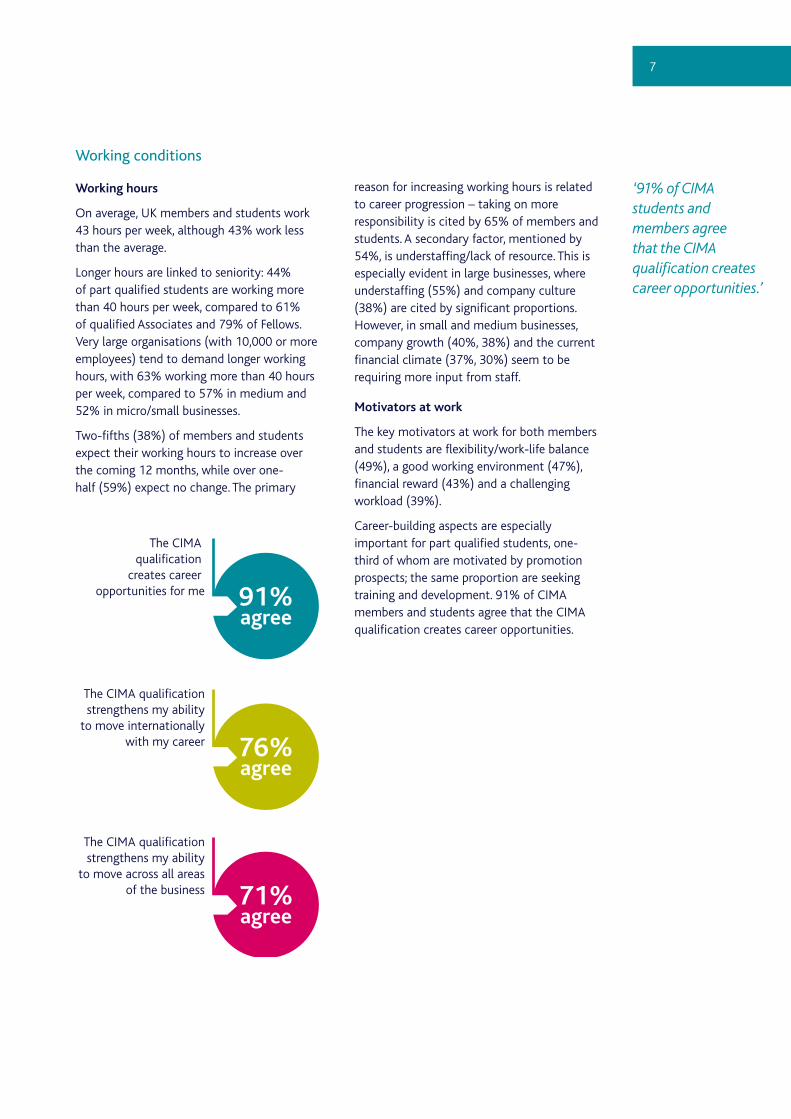
Career-building aspects are especially important for part qualified students, one-third of whom are motivated by promotion prospects; the same proportion are seeking training and development. 91% of CIMA members and students agree that the CIMA qualification creates career opportunities.
‘91% of CIMA students and members agree that the CIMA qualification creates career opportunities.’
The CIMA qualification
creates career opportunities for me 91%
agree
The CIMA qualificationstrengthens my ability
to move internationallywith my career 76%
agree
The CIMA qualificationstrengthens my ability
to move across all areasof the business 71%
agree
8
Career plans
Seeking new opportunities
Only 7% of qualified members and part qualified students see themselves in the same role in three years’ time, further suggesting the presence of a high degree of mobility and promotion prospects.
Among all members and students, 23% plan to find another job over the next six months and a total of 57% expect to move job within the next two years. Of those, 89% plan to stay within the UK.
Students at the T4 professional competence level are the most likely to be seeking new employment (73%), presumably as they plan to embark on their careers as qualified chartered management accountants.
While one-half (53%) of members and students anticipate a senior finance-related role such as finance manager, financial director, financial controller, CFO, head of accounting or self-employed practitioner, 17% of qualified members anticipate a very senior non-finance role such as CEO/MD, head, or director or manager of a non-finance division 57% anticipate a senior finance role. Among members and students already working as management accountants, 48% expect
to progress to finance manager, financial controller or director.
Among part qualified students currently working as an assistant management accountant, one-half (52%) expect to progress to a management account role in the next three years. Among those working as an accounts assistant/executive, 39% expect to progress to management accountant and a further 37% to another other accountancy role, such as accountant or financial accountant.
A global career
Among members and students who plan to seek employment abroad, Australia remains the most frequently named destination (43%), followed by the USA (33%). Other popular destinations for planned relocations are the UAE (15%), New Zealand (14%), South Africa (13%), Singapore (13%) and Canada (13%).
In 2013, a key reason for relocation is the opportunity to experience a different culture (mentioned by 63%). An improved quality of life (57%), new career opportunity (46%) and improved salary (40%) are other important
factors.
‘93% anticipate being in a new role within the
next three years.’
57% are looking to move job within the next two years, of which…
89% plan to stay in the UK
11% plan to move abroad
9
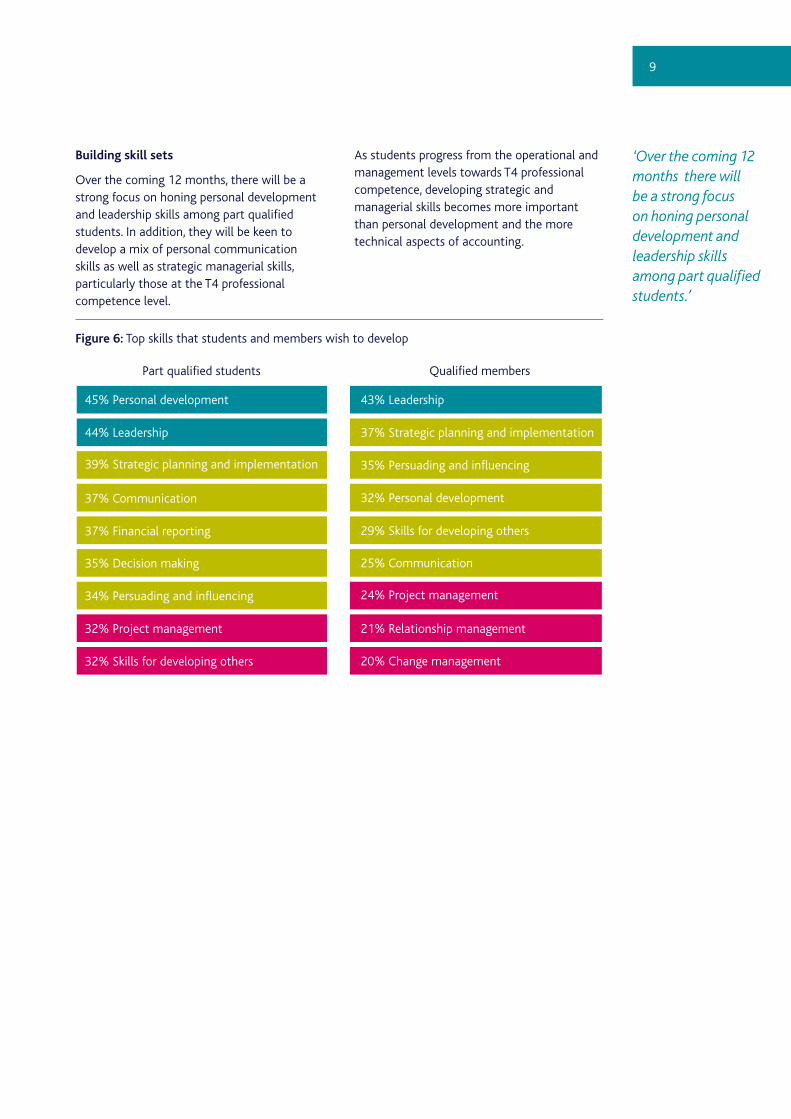
Building skill sets
Over the coming 12 months, there will be a strong focus on honing personal development and leadership skills among part qualified students. In addition, they will be keen to develop a mix of personal communication skills as well as strategic managerial skills, particularly those at the T4 professional competence level.
As students progress from the operational and management levels towards T4 professional competence, developing strategic and managerial skills becomes more important than personal development and the more technical aspects of accounting.
Figure 6: Top skills that students and members wish to develop
‘Over the coming 12 months there will be a strong focus on honing personal development and leadership skills among part qualified students.’
Part qualified students Qualified members
45% Personal development 43% Leadership
44% Leadership 37% Strategic planning and implementation
37% Communication
35% Persuading and influencing
37% Financial reporting
39% Strategic planning and implementation
25% Communication35% Decision making
29% Skills for developing others
34% Persuading and influencing
32% Project management 21% Relationship management
20% Change management
24% Project management
32% Skills for developing others
32% Personal development
10
Appendix
Part qualified students Qualified members
UK Base Basic salary (£ per
annum)
Bonus (£ per
annum)
Total package (£ per
annum)**
Base Basic salary (£ per
annum)
Bonus (£ per
annum)
Total package (£ per
annum)**
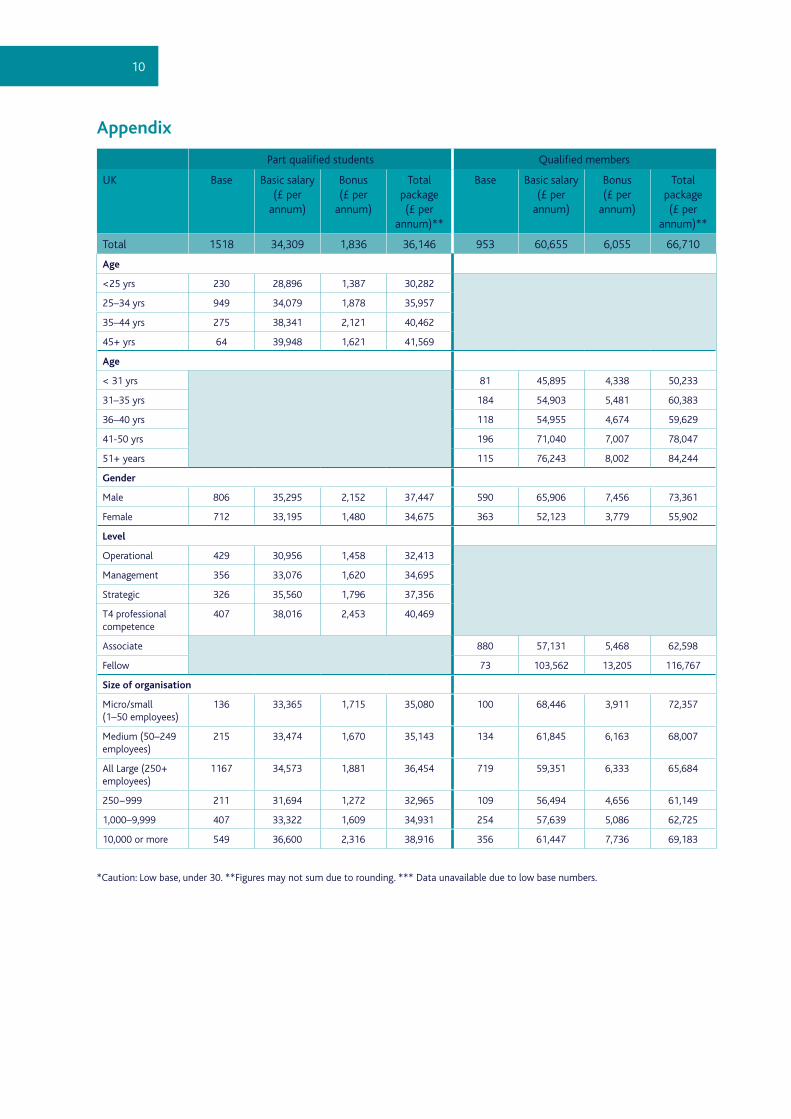
Total 1518 34,309 1,836 36,146 953 60,655 6,055 66,710
Age
<25 yrs 230 28,896 1,387 30,282
25–34 yrs 949 34,079 1,878 35,957
35–44 yrs 275 38,341 2,121 40,462
45+ yrs 64 39,948 1,621 41,569
Age
< 31 yrs 81 45,895 4,338 50,233
31–35 yrs 184 54,903 5,481 60,383
36–40 yrs 118 54,955 4,674 59,629
41-50 yrs 196 71,040 7,007 78,047
51+ years 115 76,243 8,002 84,244
Gender
Male 806 35,295 2,152 37,447 590 65,906 7,456 73,361
Female 712 33,195 1,480 34,675 363 52,123 3,779 55,902
Level
Operational 429 30,956 1,458 32,413
Management 356 33,076 1,620 34,695
Strategic 326 35,560 1,796 37,356
T4 professional competence
407 38,016 2,453 40,469
Associate 880 57,131 5,468 62,598
Fellow 73 103,562 13,205 116,767
Size of organisation
Micro/small (1–50 employees)
136 33,365 1,715 35,080 100 68,446 3,911 72,357
Medium (50–249 employees)
215 33,474 1,670 35,143 134 61,845 6,163 68,007
All Large (250+ employees)
1167 34,573 1,881 36,454 719 59,351 6,333 65,684
250−999 211 31,694 1,272 32,965 109 56,494 4,656 61,149
1,000–9,999 407 33,322 1,609 34,931 254 57,639 5,086 62,725
10,000 or more 549 36,600 2,316 38,916 356 61,447 7,736 69,183
*Caution: Low base, under 30. **Figures may not sum due to rounding. *** Data unavailable due to low base numbers.
11
Part qualified students Qualified members
UK Base Basic salary (£ per
annum)
Bonus (£ per
annum)
Total package (£ per
annum)**
Base Basic salary (£ per
annum)
Bonus (£ per
annum)
Total package (£ per
annum)**
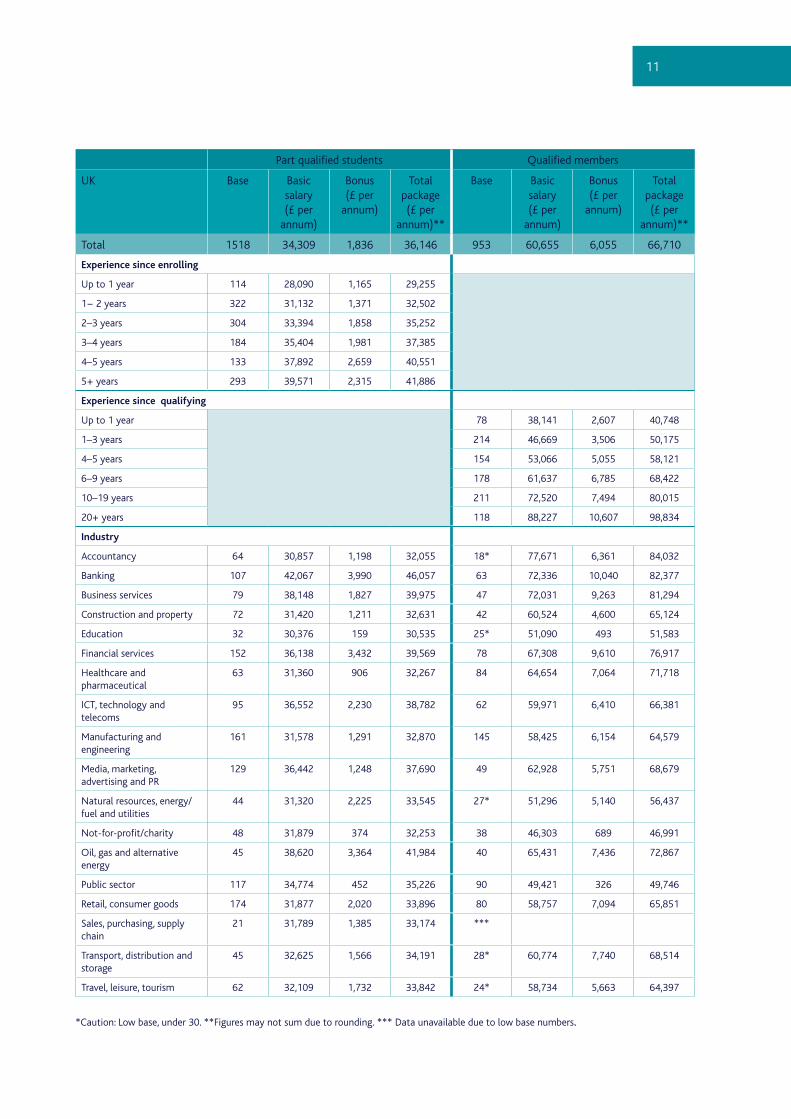
Total 1518 34,309 1,836 36,146 953 60,655 6,055 66,710
Experience since enrolling
Up to 1 year 114 28,090 1,165 29,255
1− 2 years 322 31,132 1,371 32,502
2–3 years 304 33,394 1,858 35,252
3–4 years 184 35,404 1,981 37,385
4–5 years 133 37,892 2,659 40,551
5+ years 293 39,571 2,315 41,886
Experience since qualifying
Up to 1 year 78 38,141 2,607 40,748
1–3 years 214 46,669 3,506 50,175
4–5 years 154 53,066 5,055 58,121
6–9 years 178 61,637 6,785 68,422
10–19 years 211 72,520 7,494 80,015
20+ years 118 88,227 10,607 98,834
Industry
Accountancy 64 30,857 1,198 32,055 18* 77,671 6,361 84,032
Banking 107 42,067 3,990 46,057 63 72,336 10,040 82,377
Business services 79 38,148 1,827 39,975 47 72,031 9,263 81,294
Construction and property 72 31,420 1,211 32,631 42 60,524 4,600 65,124
Education 32 30,376 159 30,535 25* 51,090 493 51,583
Financial services 152 36,138 3,432 39,569 78 67,308 9,610 76,917
Healthcare and pharmaceutical
63 31,360 906 32,267 84 64,654 7,064 71,718
ICT, technology and telecoms
95 36,552 2,230 38,782 62 59,971 6,410 66,381
Manufacturing and engineering
161 31,578 1,291 32,870 145 58,425 6,154 64,579
Media, marketing, advertising and PR
129 36,442 1,248 37,690 49 62,928 5,751 68,679
Natural resources, energy/fuel and utilities
44 31,320 2,225 33,545 27* 51,296 5,140 56,437
Not-for-profit/charity 48 31,879 374 32,253 38 46,303 689 46,991
Oil, gas and alternative energy
45 38,620 3,364 41,984 40 65,431 7,436 72,867
Public sector 117 34,774 452 35,226 90 49,421 326 49,746
Retail, consumer goods 174 31,877 2,020 33,896 80 58,757 7,094 65,851
Sales, purchasing, supply chain
21 31,789 1,385 33,174 ***
Transport, distribution and storage
45 32,625 1,566 34,191 28* 60,774 7,740 68,514
Travel, leisure, tourism 62 32,109 1,732 33,842 24* 58,734 5,663 64,397
*Caution: Low base, under 30. **Figures may not sum due to rounding. *** Data unavailable due to low base numbers.

12
Part qualified students Qualified members
UK Base Basic salary (£ per
annum)
Bonus (£ per
annum)
Total package (£ per
annum)**
Base Basic salary (£ per
annum)
Bonus (£ per
annum)
Total package (£ per
annum)**
Total 1518 34,309 1,836 36,146 953 60,655 6,055 66,710
Region
East of England 50 30,840 823 31,663 48 75,257 8,857 84,114
East Midlands 59 29,437 1,135 30,572 71 54,216 4,803 59,019
London 780 37,883 2,302 40,185 250 71,227 7,851 79,078
North East 25* 26,500 549 27,049 28* 40,893 2,413 43,305
North West 101 28,484 1,260 29,744 107 52,991 4,352 57,343
Scotland 41 31,205 1,928 33,133 57 59,274 5,013 64,287
South East 218 33,355 1,488 34,843 181 63,302 6,664 69,967
South West 77 30,215 1,280 31,495 70 56,489 6,151 62,640
Wales 16* 28,508 1,150 29,657 16* 45,000 2,070 47,070
West Midlands 87 29,711 1,300 31,012 67 50,727 4,622 55,350
Yorkshire/Humberside 64 28,141 1,721 29,862 58 48,479 4,190 52,669
London + South East 998 36,888 2,123 39,011 431 67,900 7,353 75,252
East + West Midlands 146 29,601 1,234 30,835 138 52,522 4,715 57,237
North East+Y/H 89 27,677 1,390 29,067 86 46,008 3,611 49,619
Job role
Accountant 103 33,210 1,621 34,832 33 39,015 1,767 40,782
Accounts assistant/accounts executive
92 23,942 787 24,729 ***
Assistant management accountant
142 26,325 946 27,271 ***
CEO/MD *** 19* 123,528 19,698 143,227
CFO *** 21* 107,512 16,938 124,449
Director (other than of finance)/COO/ partner
*** 20* 90,746 13,811 104,556
Finance assistant 47 25,693 641 26,333 ***
Finance manager 141 40,985 2,386 43,371 176 53,592 4,619 58,210
Financial accountant 45 35,101 2,104 37,205 29* 41,466 2,517 43,983
Financial analyst/business analyst
331 36,736 2,392 39,128 109 50,619 4,517 55,137
Financial controller 60 41,254 3,267 44,521 120 59,308 5,562 64,870
Financial director *** 82 86,338 10,988 97,326
Head/chief/VP (of accounting or finance)
*** 31 81,917 10,150 92,066
Head/chief/VP (not of accounting or finance)
*** 15* 89,331 14,720 104,051
Management accountant 283 33,664 1,367 35,031 123 41,603 2,832 44,435
Manager (non-finance) 18* 50,586 4,450 55,035 36 65,476 8,154 73,630
Other accountant 17* 34,964 2,375 37,339 ***
Other assistant accountant 45 25,276 516 25,792 ***
Other finance role 65 32,888 1,637 34,525 25* 64,900 6,167 71,067
Project accountant/manager
44 36,686 1,717 38,403 54 57,867 3,705 61,571
*Caution: Low base, under 30. **Figures may not sum due to rounding. *** Data unavailable due to low base numbers.

13
Technical information
Survey responses were collected by CIMA among active qualified members and part qualified students between 25 April and 19 May 2013, via an online survey. The data was analysed and reported by an independent specialist consultancy.
Approximately 25,000 qualified members and just over 21,000 part qualified students were selected and invited to participate in the international study, which covers 23 markets in total. Within the study period 6,039 responded globally, including 2,471 from the UK.
The response data presented in this report has been weighted to reflect the profile of CIMA qualified members and part qualified students by market and level of study. All base numbers quoted in figures report the lowest unweighted base; i.e. the number of responses.
Further information
For further information on technical matters relating to this survey, contact [email protected]
For further country specific analysis and reports, visit CIMA MY JOBS at http://myjobs.cimaglobal.com
Acknowledgements
This research was conducted by CIMA in conjunction with Spotlight Market Research & Editing. The Chartered Institute of Management Accountants is a Market Research Society Company Partner. Both CIMA and Spotlight abide by the Market Research Society’s Code of Conduct and the Data Protection Act.

Chartered Institute ofManagement Accountants26 Chapter StreetLondon SW1P 4NPUnited KingdomT. +44 (0)20 7663 5441F. +44 (0)20 7663 5442E. [email protected]
© September 2013, Chartered Institute of Management Accountants


