CIMSS TC Intensity Satellite CIMSS TC Intensity Satellite Consensus (SATCON) Consensus (SATCON) Derrick Herndon and Derrick Herndon and Chris Velden Chris Velden Meteorological Satellite (METSAT) Conference Meteorological Satellite (METSAT) Conference Ford Island Conference Center Ford Island Conference Center Pearl Harbor, HI Pearl Harbor, HI 27-28 April 2009 27-28 April 2009 Research supported by the ONR Marine Meteorology and Atmospheric Effects Program University of Wisconsin - University of Wisconsin - Madison Madison Cooperative Institute for Cooperative Institute for Meteorological Satellite Meteorological Satellite Studies Studies
Derrick Herndon and Chris VeldenDerrick Herndon and Chris Velden
Meteorological Satellite (METSAT) ConferenceMeteorological Satellite (METSAT) ConferenceFord Island Conference CenterFord Island Conference Center
Pearl Harbor, HIPearl Harbor, HI27-28 April 200927-28 April 2009
Research supported by the ONR Marine Meteorology and Atmospheric Effects Program
University of Wisconsin - MadisonUniversity of Wisconsin - Madison
Cooperative Institute for Cooperative Institute for Meteorological Satellite StudiesMeteorological Satellite Studies
MotivationMotivation• Importance of getting current TC intensity right
- Intensification trends- Predictor for statistical forecast models- Climatology (Basin Best Tracks)- Initial conditions for numerical models
• Estimates of TC intensity can vary by more than 40 knots
• Several objective TC intensity methods exist
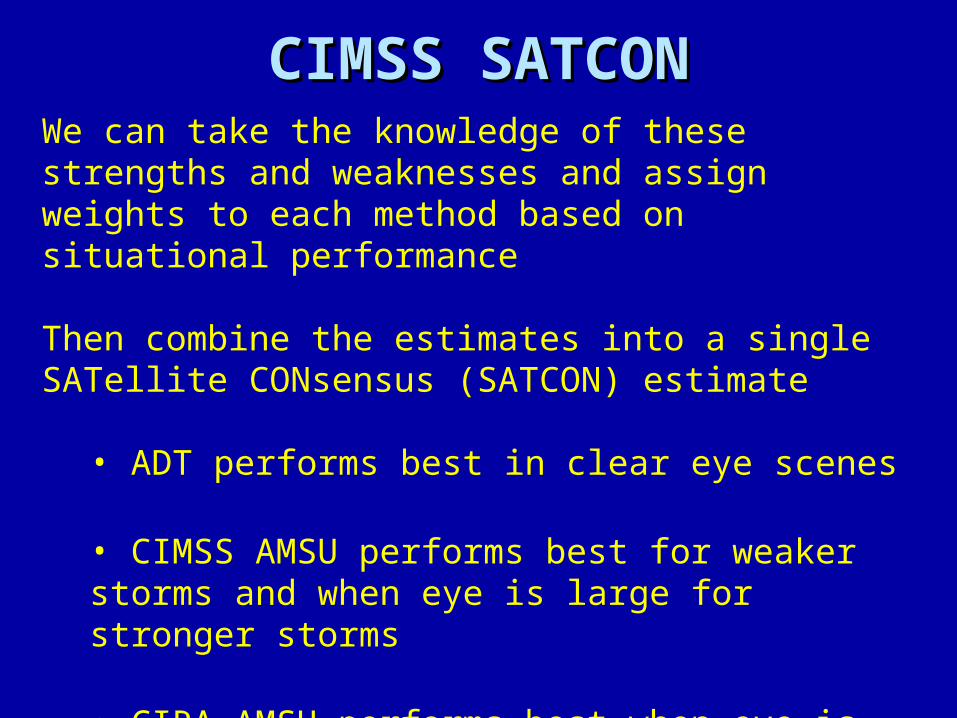
• Goal is to assist forecasters in assessing current intensity by combining the best aspects of individual objective estimates into a single estimate
MembersMembers
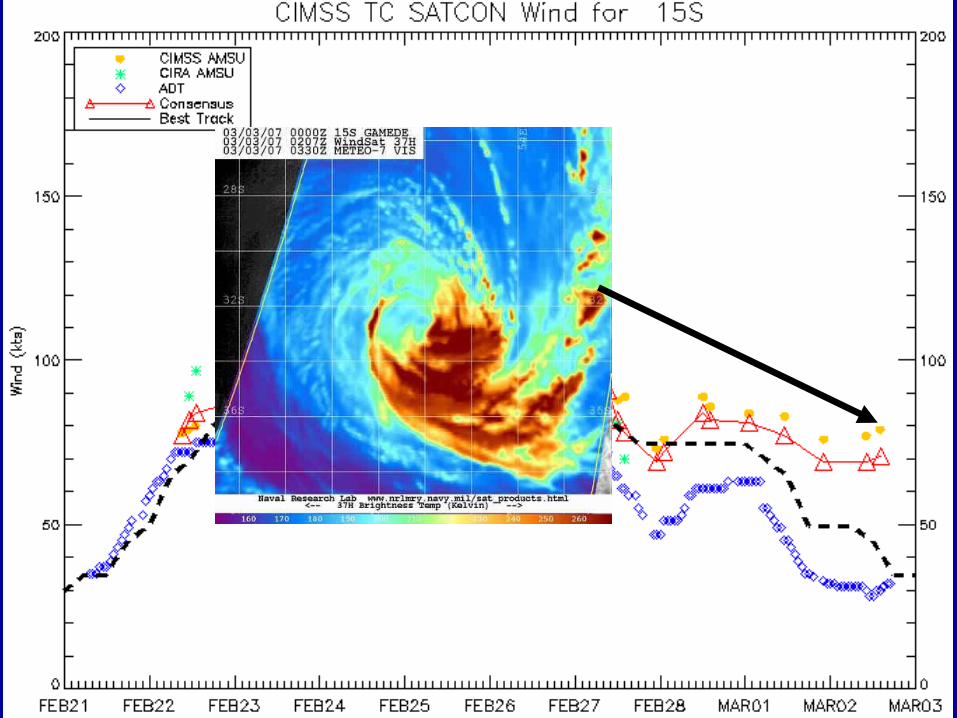
IR image from NRL TC Page
ADTUses IR imagery to assess eye temperature, curvature and cloud region temperature.
Clear Eye Pinhole Eye Large Eye
ShearCurved Band Uniform
Members: ADTMembers: ADT
IR image from NRL TC Page
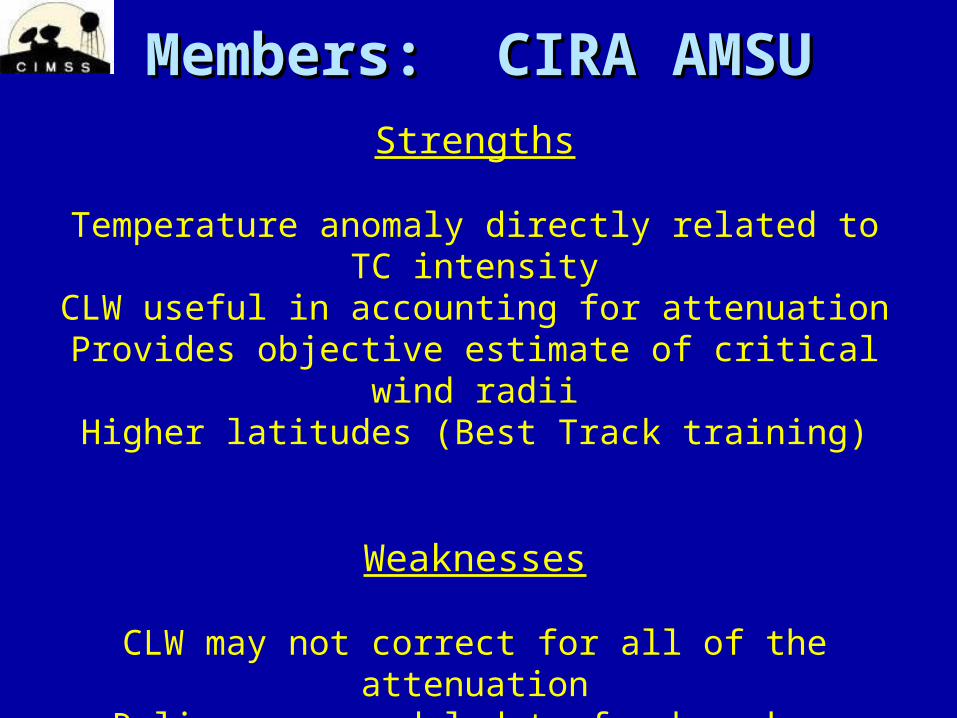
Strengths
Time-averaging results in consistencyTemporal frequency - every 1/2 hour
Method based on the reliable Dvorak TechniqueGlobal coverage with few gaps (eclipses)
Familiarity
Weaknesses
Sensitive to scene type identificationIR signature not strongly related to intensity
Time-averaging can miss rapid intensity changes
Members: CIMSS AMSUMembers: CIMSS AMSU
IR image from NRL TC Page
Microwave sounder which includes channels for measuring brightness temperatures (Tb) in the 550-150 mb layer.
AMSU-A (temperature) and AMSU-B (moisture) 1998-presentResolution ~ 50 km at nadir to 100 km at the limb
Multiple regression scheme using Tb anomaly magnitude from 3 AMSU-A channels (6-8) and 1 AMSU-B channel (16)
Corrections applied to account for sub-sampling, hydrometeor scattering and scan geometry.
Trained versus recon MSLP (delta-P) and TC-relative MSW
Members: CIMSS AMSUMembers: CIMSS AMSU
0
20
40
60
80
100
120
-1 0 1 2 3 4 5 6 7 8
Channel 6
Channel 7
Channel 8
350 mb
250 mb
150 mb
AMSU Tb Anomaly vertical cross section for Katrina 2005
70 Knots
125 knots
55 Knots
AMSU Channel 8 Tb Anomaly Magnitude
TC
Pre
ssur
e A
nom
aly
Mag
nitu
de
Members: CIMSS AMSUMembers: CIMSS AMSU
IR image from NRL TC Page
Strengths
Tb Anomaly magnitude directly related to intensityNo dependence on previous estimate
TC-relative MSW training allows for motion component
Weaknesses
Resolution requires sub-sampling correctionsDependence on ancillary data (RMW, P_env)
Polar orbiter pass coverage
Members: CIRA AMSUMembers: CIRA AMSU
IR image from NRL TC Page
AMSU-A Tb are used to produce a statistical temperature retrieval at 23 pressure levels. Estimate of CLW is used to correct for attenuation due to hydrometers
Members: CIRA AMSUMembers: CIRA AMSU
IR image from NRL TC Page
Strengths
Temperature anomaly directly related to TC intensityCLW useful in accounting for attenuation
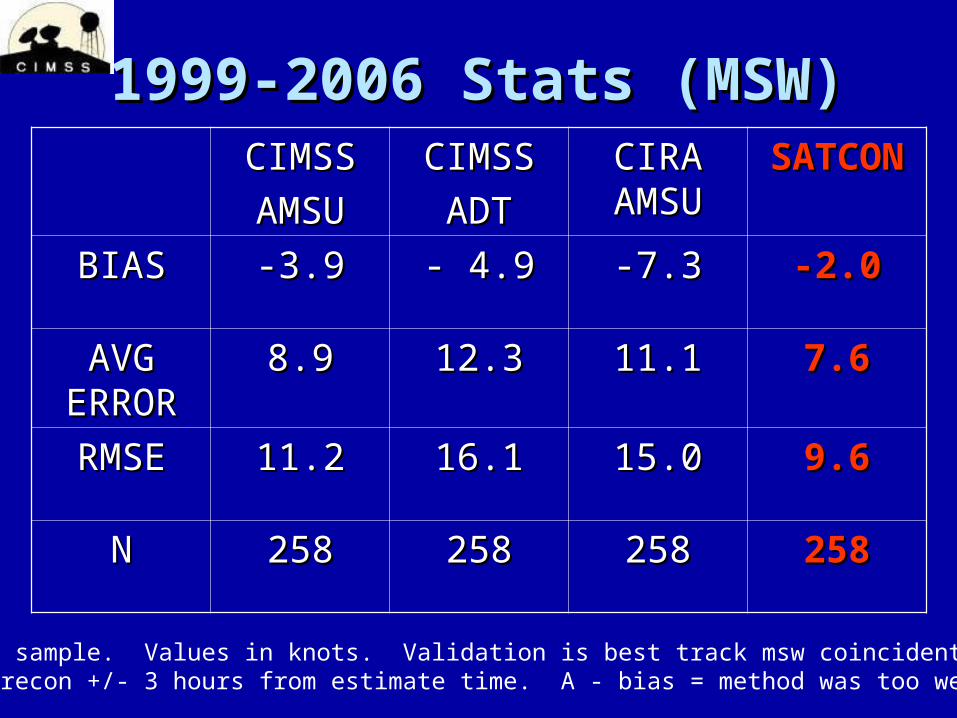
Dependent sample. Values in knots. Validation is best track msw coincident with aircraft recon +/- 3 hours from estimate time. A - bias = method was too weak.
1999-2006 Stats Compare to Simple1999-2006 Stats Compare to SimpleSATCONSATCON
MSLPMSLP
SIMPLESIMPLE
MSLPMSLP
SATCON SATCON MSWMSW
SIMPLESIMPLE
MSWMSW
BIASBIAS 0.00.0 -2.2-2.2 -2.0-2.0 - 4.7- 4.7
AVG AVG ERRORERROR
4.74.7 5.25.2 7.67.6 8.78.7
RMSERMSE 6.76.7 7.87.8 9.69.6 11.111.1
NN 258258 258258 258258 258258
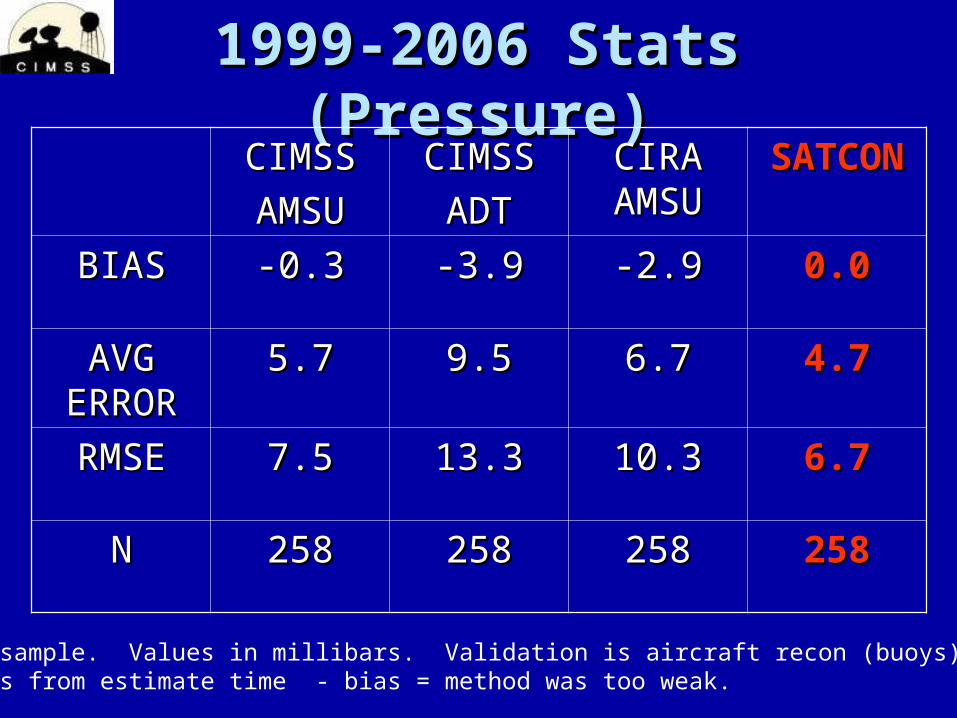
Dependent sample. MSW validation in knots. MSLP validation in millibars. - bias = method was too weak. SIMPLE is simple average of the 3 members
1999-2006 Compare to Dvorak1999-2006 Compare to DvorakSATCONSATCON
MSLPMSLP
DvorakDvorak
MSLPMSLP
SATCON SATCON MSWMSW
DvorakDvorak
MSWMSW
BIASBIAS 0.40.4 -2.6-2.6 0.80.8 -1.6-1.6
AVG AVG ERRORERROR
4.94.9 7.57.5 7.37.3 7.97.9
RMSERMSE 7.07.0 10.110.1 9.39.3 10.310.3
NN 270270 270270 270270 270270
MSW validation in knots vs. Best Track. MSLP validation in millibars vs. recon. Neg. bias = method was too weak. Dvorak is average of TAFB and SAB estimates
Independent sample. Values in knots. Validation is best track msw coincident with aircraft recon +/- 3 hours from estimate time. - bias = method was too weak.
2007-2008 Compare to Dvorak2007-2008 Compare to Dvorak
SATCONSATCON
MSLPMSLP
DvorakDvorak
MSLPMSLP
SATCON SATCON MSWMSW
DvorakDvorak
MSWMSW
BIASBIAS -0.3-0.3 -1.8-1.8 -3.3-3.3 - 3.1- 3.1
AVG AVG ERRORERROR
4.84.8 6.26.2 8.28.2 7.37.3
RMSERMSE 6.36.3 8.48.4 10.110.1 9.49.4
NN 144144 144144 144144 144144
Independent validation. MSW validation in knots. MSLP validation in millibars. - bias = method was too weak. Dvorak is average of SAB and TAFB
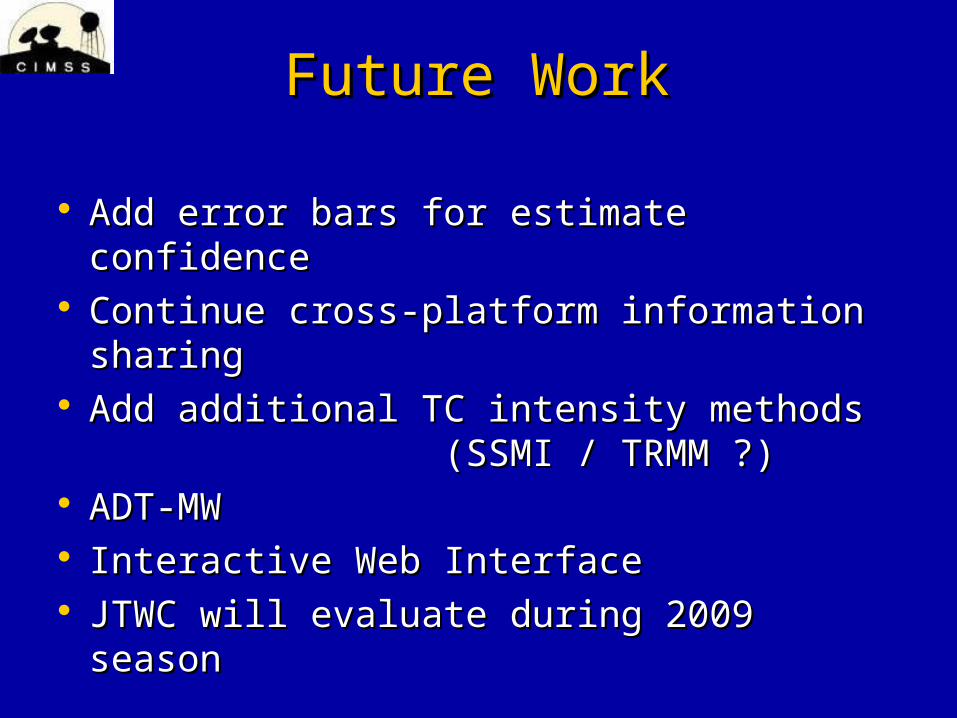
Future WorkFuture Work
Add error bars for estimate confidenceAdd error bars for estimate confidence Continue cross-platform information sharingContinue cross-platform information sharing Add additional TC intensity methods Add additional TC intensity methods
(SSMI / TRMM ?) (SSMI / TRMM ?) ADT-MWADT-MW Interactive Web InterfaceInteractive Web Interface JTWC will evaluate during 2009 seasonJTWC will evaluate during 2009 season
Brueske K. and C. Velden 2003: Satellite-Based Tropical Cyclone Intensity Estimation Using the NOAA-KLM Series Advanced Microwave Sounding Unit (AMSU). Monthly Weather Review Volume 131, Issue 4 (April 2003) pp. 687–697
Demuth J. and M. Demaria, 2004: Evaluation of Advanced Microwave Sounding Unit Tropical-Cyclone Intensity and Size Estimation Algorithms. Journal of Applied Meteorology Volume 43, Issue 2 (February 2004) pp. 282–296
Herndon D. nd C. Velden, 2004: Upgrades to the UW-CIMSS AMSU-based TC intensity algorithm.Preprints, 26th Conference on Hurricanes and Tropical Meteorology, Miami, FL, Amer. Meteor. Soc., 118-119.
Kossin J. 2007: Estimating Hurricane Wind Structure in the Absence of Aircraft ReconnaissanceWeather and Forecasting Volume 22, Issue 1 (February 2007) pp. 89–101
Olander T. 2007: The Advanced Dvorak Technique: Continued Development of an Objective Scheme to Estimate Tropical Cyclone Intensity Using Geostationary Infrared Satellite Imagery. Wea. and Forecasting Volume 22, Issue 2 (April 2007) pp. 287–298
Velden C. 2006: The Dvorak Tropical Cyclone Intensity Estimation Technique: A Satellite-Based Methodthat Has Endured for over 30 Years. Bulletin of the American Meteorological Society Volume 87, Issue 9(September 2006) pp. 1195–1210
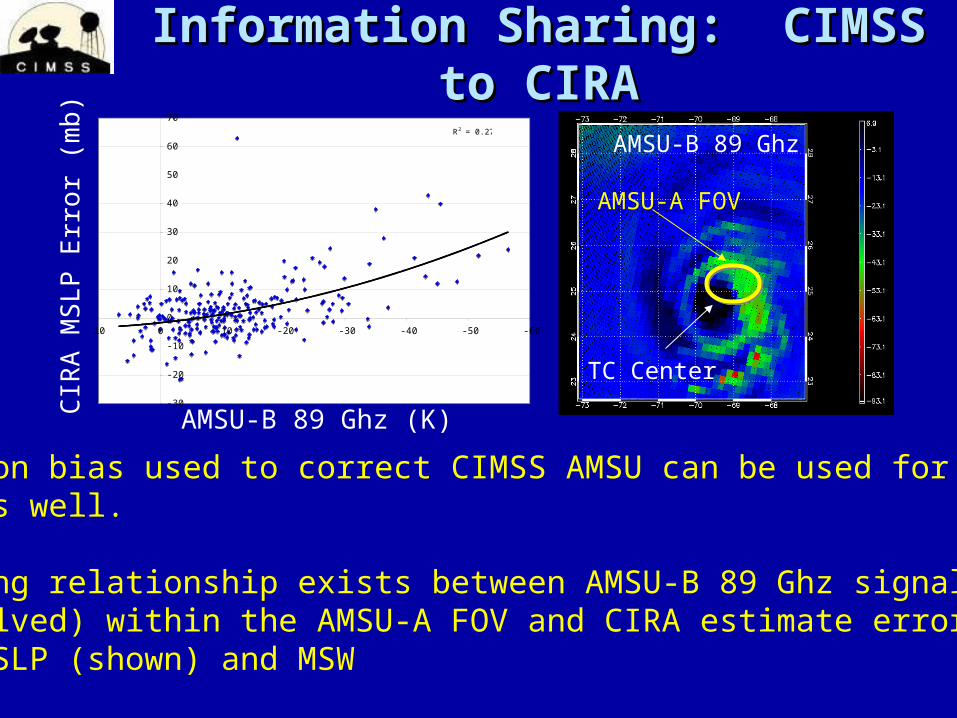
Portion of TC eyewall is within the AMSU-A FOV indicating the AMSU-A pixel location is offset from true TC center. Find AMSU-B center-weighted (convolved) Tb. Used as regression Term.
Compare to AMSU-A FOV resolution
Members: CIRA AMSUMembers: CIRA AMSU
IR image from NRL TC Page
CIRA AMSU TC intensity predictors
MSW
Tangential wind at height of 5 kmMaximum temperature anomaly
Average CLW within 100 km radiusPercent of CLW > 0.5 mm within 300 km
RMW at height of 3 kmAMSU-A FOV resolution
MSLP
Pressure anomaly estimated from 600 km radius to center