The conformations of synthetic peptides Lys-Phe-Phe-Phe-lle-Ile-Gly-Leu-lle-ile-Giy-Leu-Phe-OCH3 and Lys(e.paimitoyl)-Phe-Phe-Phe-Ile-Ile-Gly-Leu-Iie-Ile-Gly-Leu-Phe-OCH3, which constitute a part of the membrane-spanning region of the vesicular stomatitis virus G protein, have been studied by circular dichroism (CD) spectroscopy. Secondary structural features are observed for both peptides in trifluoro- ethanol, methanol, aqueous mixtures of trifluoroethanol and methanol and in a micellar environment. In trifluoroethanol, the CD spectra indicate the presence of a helical conformation, whereas in aqueous mixtures of organic solvents, both helical and l-conformations are observed. While fatty acid acylation does not directly modulate peptide conformation, it promotes self-association of the acylated peptide and association with micelles. In a micellar environment, the acylated peptide adopts an a-helical conformation.
Introduction
The lipid-bilayer-spanning regions of almost all membrane-associated proteins [1] with the excep- tion of the Escherichia coli outer membrane pro- tein, the ompF gene product [2], are comprised of a continuous stretch of apolar amino acid re- sidues. The number of amino acids that constitute a transmembrane segment is around 20-25 [1]. Thermodynamics favour an a-helical conforma- tion for these transmembrane portions in the lipid bilayer [3-5]. An a-helix formed from 20 amino acid residues would be about 30 ,~ long, which is the length needed to span the hydrophobic inter- ior of a membrane. However, recent studies using recombinant DNA techniques have indicated that as few as 13 apolar residues are sufficient for
Correspondence: R. Nagaraj, Centre for Cellular and Molecu- lar Biology, Uppal Road, Hyderabad 500007, India
membrane association [6,7]. This would require ordered helical conformations for shorter mem- brane-spanning regions for thermodynamically stable association with the membrane.
Although the presence of a stretch of apolar amino acid residues would be sufficient to anchor proteins to a membrane surface, there is increas- ing evidence that many membrane-associated pro- teins have fatty acids covalently attached near the membrane-spanning region [8,9]. The fatty acid is invariably palmitic acid [8,9]. While it is specu- lated that this post-translational modification helps in membrane-association, the precise role is yet to be fully understood.
In an effort to determine whether 13-residue apolar regions of membrane-associated proteins adopt regular structures and how fatty acid acyla- tion modulates peptide structure, we have carried out circular dichroism (CD) studies on Lys-Phe- Phe-Phe-Ile-Ile-Gly-Leu-Ile-Ile-Gly-Leu-Phe-OMe,
1, residues 2-13 of which span the hydrophobic region of vesicular stomatitis virus G protein [10], and its acylated derivative Lys(e-palmitoyl)-Phe- Phe-Phe-Ile-Ile-Gly-Leu-Ile-Ile-gly-Leu-Phe-OMe, 1P, in polar and hydrophobic environments.
Materials and Methods
Amino acids, dicyclohexylcarbodiimide, 1-hy- droxybenzotrazole, N-hydroxysuccinimide, pal- mitic acid and trifluoroethanol were purchased from Sigma Chemical Co. (St. Louis, MO, U.S.A.).
Peptide synthesis, t-Butyloxycarbonyl (Boc) amino acids used in the synthesis of peptide 1 were prepared by Schnabel's procedure [11]. Amino acid methyl ester hydrochlorides were pre- pared by the thionyl chloride method [12] and free base esters were obtained from the hydrochlorides by neutralization with aqueous NahCO 3 and extraction with dichloromethane [13].
Peptide 1 was synthesized by solution-phase
methods using stepwise and fragment con- densation approaches. The scheme employed in the synthesis is outlined in Fig. 1. The dipeptides and the fragments Boc-Gly-Leu-Ile-Ile-OMe, Boc- Gly-Leu-Phe-OMe, Boc-Phe-Phe-Phe-OMe, Boc- Phe-Phe-Phe-Ile-OMe and Boc-Phe-Phe-Phe-Ile- Ile-OMe were obtained in pure form after routine work-up. Boc-Lys(e-benzyloxycarbonyl)-Phe-Phe- Phe-Ile-Ile-OMe and the final product (protected peptide 1) were purified by column chromatogra- phy on silica gel (60-120 mesh, BDH, India). The desired peptides were eluted with varying propor- tions of chloroform/methanol (CHCI3/MeOH) mixtures. All the peptide fragments were checked for homogeneity by TLC on silica gel. Peptides were visualized by iodine vapour, ninhydrin and starch/K1. Peptide 1 (protected at Lys) was treated with palladium black and formic acid [14] (5% in methanol) to remove the benzyloxycarbonyl (Z) protecting group, neutralized, and treated with palmitic acid succinimide ester to yield the crude
L y s Phe Phe Phe Ile I l e Leu Ile lle Leu Phe
DoG
Boc
Boc
Boc
Boc
Boc
Boc -7-OH H Z DCC/HOBT
Boc
Boc -
B o c
H +_ HCO0-
- - le '
DCC/HOBT
O M e O H -
O H -
HCI/THF~ Et3N
O H
• OH ~- - --OMe DCC/HOBT
O M e
DCC
. • - O M e 8 o c - OH-
Boc . . . . OH H--I--OMe DCC/HOBT
B o c I OM~ O H -
OH H - -OMeBoc
DCC/HOBIoMe Boc
OMe Boc
OMeBoc
B o c - - - O H H-- - -Oh .= D C C
B o c O~,~ OH-
' OH "1--'OMeBo¢ DCC/HOB7
i OIVle Boc OH-
OH H DCC/HOBT
HCI /THF, E t 3 N '
OH H DCC/HOBT
, I
HCI/THF, Et3N
OH H ,OMe DCC/HOI
O M e
O M e
OMe
O M e
O M e
Fig. 1. Scheme for the synthesis of peptide 1. Dipeptides were coupled in dichloromethane and longer peptides in dimethylfor- mamide. Abbreviations used: OMe, methyl ester; Et3N, triethylamine; THF, tetrahydrofuran; Z, benzyloxycarbonyl.
acylated peptide 1P. Pure peptide was obtained after column chromatography on silica gel (the desired peptide was eluted with 3% M e O H / CHCI3).
The purity of the peptides was further determined by quantitative amino acid analyses on an LKB 4151 alpha-plus amino acid analyzer after hydrolysis in vacuo with trifluoroacetic a c i d /HC l (1 : 1) [15]. The amino acid analyses of the peptides are summarized below. Theoretical values are indicated in parenthesis. Boc-Gly-Leu-Ile-Ile-OMe: Gly 1.0 (1), Leu 1.12
(1), Ile 1.80 (2) Boc-Gly-Leu-Ile-Ile-Gly-Leu-Phe-OMe: Gly 2.07
(2), Leu 1.86 (2), Ile 1.80 (2), Phe 0.86 (1) Boc-Lys (e-Z)-Phe3-Ile2-OMe: Lys 1.0 (1), Phe
lie 4.09 (4), Leu 2.05 (2) The presence of the palmitoyl group in 1P was
confirmed by analysis on a Hewlett Packard 5840 A gas-liquid chromatograph.
Peptides 1 and 1P and their fragments were hydrolyzed with trifluoroacetic acid/HC1 (1:1) for 48 h. After removing trifluoroacetic acid and HC1, the hydrolysates were reconstituted in 0.1 M NaHCO 3 and labelled with 5-dimethylamino- aaphthalene-l-sulfonyl(dansyl)chloride. Analysis of the dansylated amino acids by high-pressure liquid chromatography (Hewlett Packard 1090 instrument) on a Waters /~-bondapak (3.9 × 30) C xs column with a mobile phase of 20% acetonitrile in an aqueous solution containing 5 mM Lproline and ammonium acetate and 2.5 • 10 -3 M CuSO4 • 5 H 2 0 (pH 7.0) [16] at a flow rate of 1 m l / m i n did not reveal the presence of any D-isomers of Phe, Ile, Lys or Leu, Hence this rules out racemi- zation during the course of the synthesis of peptides 1 and 1P.
Circular dichroism (CD) measurements. Spectra were recorded on a Jobin Yvon Dichrograph V spectropolarimeter in 1 mm cells, at 25°C. The instrument was calibrated with (+)-10-camphor- sulphonic acid using [0]M at 290 nm = 7600 [17]. Molar ellipticites were calculated using the rela- tion
A × 3300 [O]M I.c
233
where A = observed dichroic absorbances, 1 = path length in cm; c = molar concentration of peptide.
Peptides were weighed (approx. 5 mg) to an accuracy of 0.01 mg and 2 mM stock solutions were prepared in the appropriate solvent. An aliquot of this solution was subjected to quantita- tive amino acid analysis. The concentrations of peptides used for CD measurements were ob- tained by dilution of the stock solutions.
R e s u l t s
Peptide 1 The CD spectrum of peptide 1 in trifluoro-
ethanol at a concentration of 0.7 mM is shown in Fig. 2(a). Two negative bands at approx. 204 nm and 227 nm are discernible. Spectra with similar [O]M values and peak extrema were observed be- low this concentration, While there is very little change in the position and [0]M value of the 227 nm peak above 0.7 mM, the shorter-wavelength band could not be recorded due to an increase in absorbance of the sample.
The CD spectra in mixtures of trifluoroethanol and H 2 0 are shown in Fig. 2(b). While two nega- tive bands are discernible at different proportions of H 2 0 in trifluoroethanol, the intensities of the peaks vary with the amount of H20. With increas- ing proportions of H20, there is a decrease in the intensity of the 207 nm band and an increase in the intensity of the 227 nm band. The shorter- wavelength bands are also red-shifted in trifluoro- e thanol / H 20 mixtures compared to the position in neat trifluoroethanol.
In methanol, and aqueous methanol mixtures, at peptide concentrations below 0.7 mM, two negative bands at approx. 212 and 230 nm are observed (not shown). The ellipticity values at the peak extrema in different solvents are summarized in Table I.
Peptide 1P The CD spectrum of peptide 1P in trifluoro-
ethanol is shown in Fig. 3(a). As in the case of peptide 1, two negative bands are discernible at 205 nm and 227.5 nm.
In t r i f luoroethanol /H20 mixtures (Fig. 3(b)) the CD spectra are different from those of peptide 1. In 4 : 1 and 3 : 1 t r i f luoroethanol /H20 negative
234
2 7_
o E o
~E -2 u ~T,-4
?o -6 X - 8
~ - I O L-I
I 0 I I I I I
- 1 2
- 1 4
(1 - 1 6 I I I I
,95 2os 2t5 225 2a5 245 255 (nm)
8
|
4 - I
T - I
~ ' £ - 2 I u
I1~ - 4 "o
? o - 6 X
'1~' _ i 0
- 1 2
- 1 4
- 1 6
• ? ~ Ii i/Ai 1, iV V,. ,¢/
J V'"t" I I iJ v
Liv I"d
195 205 2i5 225 2 : 5 5 245
3,(nta)
Fig. 2. CD spectra of peptide 1 in trifluoroethanol and aqueous mixtures of trifluoroethanol. Concentration = 0.7 mM: (a) trifluoroethanol; (b) 5:1 tr if luoroethanol/H20 ( - - - ) , 2.5:1 tr if luoroethanol/H20 ( . . . . . ), 1:2 tr if luoroethanol/H20 ( ).
bands at 230 nm and 207 nm of comparab le
intensity are observed. However , at 1 • 1 trifluoro-
e t h a n o l / H 2 0 a single intense band centred at 214
nm is observed.
The CD spectra in MeOH and mixtures of MeOH and H 2 0 are shown in Fig. 4(a). In MeOH a weak negative band at approx. 237 nm and an intense positive band at approx. 220 nm are
I
2
~E - 2 1 - Ii /
" o I /
i / ' , j × ~ t - I ;
: E - I I
\/ 195 205 215 225 235 245 255
~.(nm)
6[ 2
T._ ¢o-2
~E -6 u
"1~ - I 0
,% X - 1 4
t-, --18
- 2 2
- 2 6 200
I I I I I
, , , ' 7 / X 4 r
b I I I I I
210 2 2 0 2 3 0 2 4 0 2 5 0
X ( n m )
Fig. 3. CD spectra of peptide 1P in trifluoroethanol and aqueous mixtures of trifluoroethanol. Concentration = 0.4 mM: (a) trifluoroethanol; (b) 3:1 tr if luoroethanol/H20 ( - - -) , 1:1 tr if luoroethanol/H20 ( ).
235
TABLE I
C I R C U L A R D I C H R O I S M D A T A F O R PEPTIDES 1 A N D 1P
TFE, trifluoroethanol.
Peptide Solvent C D spectral extrema
2, (nm) [O]M ( × 1 0 3)
1 (c ~ 0.7 mM) TFE 204 - 15.0 227 - 6.5
1 ( c = 0.7 mM) T F E / H 2 0 (5 : 1 ) 206 - 1 5 . 0 229 - 6 . 8
T F E / H 2 0 (2.5 : 1) 206 - 12.3 228.5 - 9 . 1 5
T F E / H 2 0 (1 : 2) 208.5 - 7.4 228.5 - 9 . 1 5
1 ( c = 0.7 raM) M e O H and 212 - 5 . 0 M e O H / H 2 0 (2.5 : 1) 230 - 6.4
1P (c = 0.4 raM) T F E 205 - 12.5 227.5 - 6 . 1
1P (c = 0.4 mM) T F E / H 2 0 (3:1 ) 207 - 8 . 6 230 - 6 . 7
T F E / H 2 0 (1 : 1) 214 - 22.0 1P (c = 0.4 mM) M e O H 221 +25.4
237.5 - 2 . 8 M e O H / H 2 O ( 2 : 1 ) 220.5 +13.8
233.5 - 6 . 2 M e O H / H 2 0 (1 : 1) 215 - 13.0
233.5 - 9 . 8 1P ( c = 0.4 mM) micelles of SDS 205 - 13.0
220 - 6.5
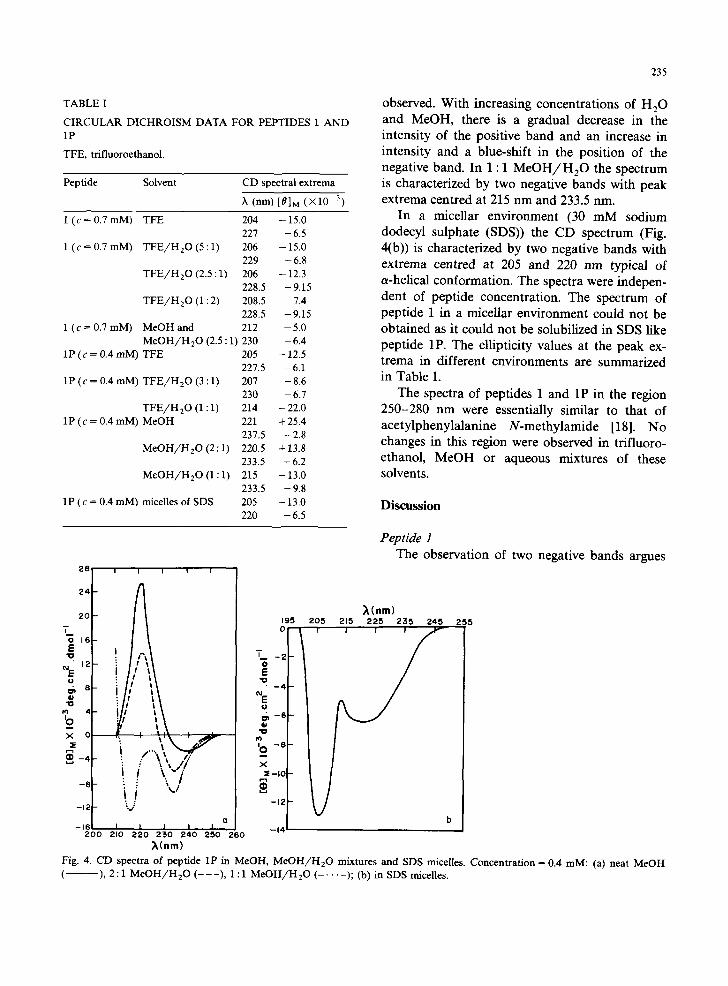
observed. With increasing concentrations of H20 and MeOH, there is a gradual decrease in the intensity of the positive band and an increase in intensity and a blue-shift in the position of the negative band. In 1 : 1 MeOH/H20 the spectrum is characterized by two negative bands with peak extrema centred at 215 nm and 233.5 nm.
In a micellar environment (30 mM sodium dodecyl sulphate (SDS)) the CD spectrum (Fig. 4(b)) is characterized by two negative bands with extrema centred at 205 and 220 nm typical of a-helical conformation. The spectra were indepen- dent of peptide concentration. The spectrum of peptide 1 in a micellar environment could not be obtained as it could not be solubilized in SDS like peptide 1P. The ellipticity values at the peak ex- trema in different environments are summarized in Table I.
The spectra of peptides 1 and 1P in the region 250-280 nm were essentially similar to that of acetylphenylalanine N-methylamide [18]. No changes in this region were observed in trifluoro- ethanol, MeOH or aqueous mixtures of these solvents.
Discussion
Peptide 1 The observation of two negative bands argues
~ 8 | I I I I I
24
~Cnm) O A
7
- I ° '.~ -2
? / "i- ] 7
-12
Q b
~(nm) Fig. 4. CD spectra of pepfide 1P in MeOH, M e O H / H 2 0 mixtures and SOS n~celles. Concentration = 0.4 raM: (a) neat MeOH ( - ), 2 : 1 M e O H / H 2 0 ( - - - ) , 1 : 1 M e O H / H 2 0 ( . . . . . ); (b) in SDS micelles.
236
for a helical conformation for peptide 1 in trifluo- roethanol. The position of the long-wavelength band corresponding to the ~'-~r* transition of the amide chromophore (227 nm as compared to 220 nm for peptides in a-helical conformation) may conceivably arise due to distortions of an a-helical conformation. Secondary structure parameters were not evaluated as the reference spectra used for computation [19,20] are from proteins and polypeptides which are much larger than peptide 1. However, the relative intensities of the bands at 204 and 227 nm suggest a random conformation of 70%.
In trifluoroethanol/H20 mixtures, with in- creasing concentrations of H20, there is a marked decrease in the intensity of the 206 nm band and a slight increase in the intensity of the 230 nm band. We attribute these spectral changes to the pres- ence of B and helical conformations in trifluoro- e thanol /H20 mixtures. The presence of increas- ing amounts of H20 in trifluoroethanol would favour self-association of the peptide, which in turn would favour a B-conformation, particularly as both phenylalanine and isoleucine residues have a high probability of occurring in B-conformation [21-23]. In methanol and aqueous mixtures of methanol too, the spectra suggest the presence of both fl and helical conformations.
Peptide 1P The CD spectrum in trifluoroethanol of the
acylated peptide is similar to that of peptide 1, indicating that acylation does not have any effect on the conformation of the peptide. In trifluoro- e thano l /H20 mixtures at low concentrations of H20 there is a considerable decrease in the inten- sity of the short-wavelength band, indicating the presence of B and helical conformations. In 1 : 1 trifluoroethanol/H20 the spectrum is characteris- tic of B-conformation. For peptide 1 even at 1 : 2 trifluoroethanol/H2OI two negative bands are observed, indicating the presence of both helical and B-conformations. Hence fatty acid acylation clearly favours strong self-association of peptide 1P, which in turn favours formation of B-struc- ture.
In neat methanol, the spectrum is qualitatively similar to positively charged peptides such as clupeine [24] and oligoarginine [25] for which ran-
dom conformation has been assigned. However, for peptide 1P with increasing concentrations of H20 in meOH, there is a decrease in the intensity of the positive band with a concomitant increase and a blue-shift in the intensity of the negative band, finally giving rise to two negative bands in 1:1 M e O H / H 2 0 . It is unlikely that there is a transition from totally unordered to ordered con- formation on going from neat MeOH to M e O H / H20. It is likely that in MeOH the peptide adopts a conformation which favours interaction of the aromatic ring with the peptide backbone. Such interactions are known to result in positive CD bands at 220 nm [26]. The appearance of the positive peak has been correlated with the rotamer population of the phenylalanine side-chain [25], which is sensitive to solvent polarity [27]. hence when the solvent polarity is changed (i.e. from MeOH to M e O H / H 2 0 mixtures), the contribu- tion from the aromatic rings to the CD spectrum diminishes. In 1:1 M e O H / H 2 0 , the spectrum suggests the presence of both /3 and helical con- formations. The positive band in methanol is un- likely to stem from the presence of a B-turn conformation, as Phe, Leu and lie have a low propensity to occur in B-turn conformations [28].
While helical and B-conformations are present depending on the polarity of the solvent, in a micellar environment the spectrum is characteris- tic of an a-helical conformation. It is likely that peptide 1 would also adopt an a-helical conforma- tion in a micellar environment, because in peptide 1P the fatty acid moiety, apart from facilitating incorporation into micelles, is unlikely to mod- ulate the conformation of the peptide in any way.
Conclusions
We have observed an ordered conformation for the 13-residue peptide Lys-Phe-Phe-Phe-Ile-Ile- Gly-Leu-Ile-Ile-Gly-Leu-Phe-OMe and its fatty acid analogue, which constitute part of the mem- brane-spanning region of the vesicular stomatitis virus G protein, in different environments. In trifluoroethanol both peptides adopt helical con- formations, whereas in tr if luoroethanol/H20 and M e O H / H 2 0 mixtures, both B and helical confor- mations are discernible. In a membrane-like en- vironment an a-helical conformation is observed.
Whi l e fa t ty ac id acy la t ion does n o t d i rec t ly
m o d u l a t e pep t i de c o n f o r m a t i o n , it p r o m o t e s self- a s soc ia t ion of the acy la ted pep t ide a n d also facili-
ta tes assoc ia t ion wi th micelles.
Acknowledgement
W e t h a n k Professor D. B a l a s u b r a m a n i a n for
he lp fu l d iscuss ions .
References
1 Von Heijne, G. (1985) in Current Topics in Membranes and Transport (Bonner, F., ed.), Vol. 24, pp. 151-179, Academic Press, New York
2 Schindler, H. and Rosenbusch, J.P. (1981) Proc. Natl. Acad. Sci. USA 78, 2302-2306
3 Tanford, C. (1978) Science 200, 1012-1018 4 Von Heijne, G. and Blomberg, C. (1979) Eur. J. Biochem.
97, 175-181 5 Engelman, D.M. and Steitz, T.A. (1981) Cell 23, 411-422 6 Davis, N.G., Boeke, J.D. and Model, P. (1985) J. Mol. Biol.
181,111-121 7 Adams, G.A. and Rose, J.K. (1985) Cell 41, 1007-1015 8 Schmidt, M.F.G. (1982) Trends. Biochem. Sci. 7, 322-324 9 Magee, A.I. and Schlesinger, M.J. (1982) Biochim. Biophys.
istry 13, 3350-3359 21 Goodman, M., Naider, F. and Toniolo, C. (1971) Biopoly-
mers 10, 1719-1730 22 Toniolo, C., Bonara, G.M. and Fontana, A. (1974) Int. J.
Peptide Protein Res. 6, 371-380 23 Bonora, G.M. and Toniolo, C. (1974) Biopolymers 13,
2179-2190 24 Bonora, G.M., Bertanzon, F. and Toniolo, C. (1981) Int. J.
Peptide Protein Res. 13, 181-188 25 Gamier, A. and Tosi, L. (1975) Biopolymers 14, 2247-2262 26 Woody, R.W. (1978) Biopolymers 17, 1451-1467 27 Kobayashi, J. and Nagai, U. (1977) Tetrahedron Lett. 21,