Circular Dichroism Techniques: Biomolecular and Nanostructural Analyses- A Review Bijan Ranjbar 1,2, * and Pooria Gill 2 1 Department of Biophysics, Faculty of Biological Sciences, Tarbiat Modares University, Tehran, Iran 2 Department of Nanobiotechnology, Faculty of Biological Sciences, Tarbiat Modares University, Tehran, Iran *Corresponding author: Bijan Ranjbar, [email protected]This paper reviews the best known techniques using circular dichroism spectroscopy such as conventional circular dichroism (i.e. electronic cir- cular dichroism), magnetic circular dichroisms (magnetic vibrational circular dichroism, x-ray magnetic circular dichroism), fluorescence detected circular dichroism, near-infrared circular dichroism, vibrational circular dichroism, Fourier transform infrared circular dichroism, high pres- sure liquid chromatography circular dichroism, stopped-flow circular dichroism, and synchrotron radiation circular dichroism. Also, we have described here the most important applications of circular dichroism spectroscopy in structural bio- chemistry and nanoscience. Key words: biomolecular analysis, chirality, circular dichroism, FDCD, FTIR-VCD, HPLC-CD, MCD, MVCD, nanostructural analysis, NIR- CD, SRCD, stopped-flow CD, VCD, XMCD Abbreviations: A, adenosine; AC, absolute configuration; AIDS, acquired immunodeficiency syndrome; ApA, adenylyl-3¢-5¢-adenosine; BAA, Bacillus amyloliquefaciens a-amylase; BSA, bovine serum albumin; CD, circular dichroism; CPP, cell penetrating peptide; Den, dendro- some; DFT, density functional theory; DMPC, dimyristoylphosphatidylcho- line; DNA, deoxyribonucleic acid; DPC, dodecylphosphocholine; DPPC, dipalmitoylphosphatidylcholine; DTT, dithiothreitol; ECD, electronic circu- lar dichroism; EDTA, ethylene diamino tetra acetic acid; FDCD, fluores- cence detected circular dichroism; FE, Faraday effect; FNG, fibrinogen; FTIR, Fourier transform infrared; Hb, haemoglobin; HPLC, high pressure liquid chromatography; IR, infrared; LCP, left circularly polarized light; LUV, large unilamellar vesicles; M, mutant; MCD, magnetic circular dichroism; MVCD, magnetic vibrational; N, native; NIR, near-infrared; NP, nanoparticle; PBzE dendrimer, poly(benzyl ether) dendrimer; PC lipo- somes, phosphatidylcholine liposomes; PDT, photodynamic therapy; PEHA, poly(2-ethylhexylacrylate); PEM, photo elastic modulator; PHEMA, poly(2-hydroxyethyl methacrylate); PMEA, poly (2-methoxyethylacrylate); PNA, peptide nucleic acids; PPII, polyproline II; Pro, proline; RCP, right circularly polarized; rLuc, recombinant luciferase; RNA, ribonucleic acid; SAP, sweet arrow peptide; SDS, micelles, sodium dodecyl sulphate micelles; SRCD, synchrotron radiation circular dichroism; UV, ultraviolet; VCD, vibrational circular dichroism; vis, visible; VUV, vacuum-ultraviolet; XMCD, x-ray magnetic circular dichroism; ZE, Zeeman effect; h, dihedral angle. Received 25 January 2009, revised 4 May 2009 and accepted for publi- cation 16 May 2009 Some biomolecules possess molecular asymmetry, that is, their mirror images are not identical. Such molecules are named to be chiral (1). One of the most well-known examples is a carbon atom that is tetrahedrally bonded to four different atoms or groups of atoms. Biomacromolecules also show chirality. For example, the a-helix, the most common helix in proteins, is wound in a right-- hand sense. Although most polynucleotides are wound in a right- hand sense, helices that wind in a left hand sense also exist (2). The interaction of a chiral molecule with polarized light (Figure 1) is very specific and has proved to be an important method for charac- terizing both small molecule and macromolecular structures (3). Essentially, one type of measurements commonly made to deter- mine the effects of polarized light on asymmetric molecules is circu- lar dichroism (CD) (1), which is defined as the difference in absorption of left-hand and right-hand circularly polarized light with optically active compounds. These effects are relatively small but can be measured readily with modern instrumentation. Hence, measurement of circular dichroism gives detailed structural and enantiomeric information on proteins, carbohydrates, nucleic acids, pharmaceuticals, liquid crystals, etc. (3). For example, the conversion of simple peptides into the destruc- tive fibrils in some disorders such as Alzheimer disease can be fol- lowed using CD (4,5). In last decades, there have been encountered various developments in CD-based techniques to improve the molecular measurements of biological structures (6). The best known of them are conventional CD ⁄ electronic circular dichroism (ECD), magnetic CDs (MCD, mag- netic vibrational circular dichroism (MVCD), XMCD), fluorescence detected CD (FDCD), near-infrared CD (NIR-CD), vibrational CDs (VCD, FTIR-VCD), HPLC-CD, stopped-flow CD, and synchrotron radia- tion CD (SRCD). In this review, various kinds of CD-spectroscopy techniques and their applications in biological studies and nano- structural analyses have been discussed. Circular Dichroism Description Dichroism is often expressed as the property possessed by some materials of absorbing light to different extents dependent upon 101 Chem Biol Drug Des 2009; 74: 101–120 Review Article ª 2009 John Wiley & Sons A/S doi: 10.1111/j.1747-0285.2009.00847.x
Transcript
Circular Dichroism Techniques: Biomolecular andNanostructural Analyses- A Review
Bijan Ranjbar1,2,* and Pooria Gill2
1Department of Biophysics, Faculty of Biological Sciences, TarbiatModares University, Tehran, Iran2Department of Nanobiotechnology, Faculty of Biological Sciences,Tarbiat Modares University, Tehran, Iran*Corresponding author: Bijan Ranjbar, [email protected]
This paper reviews the best known techniquesusing circular dichroism spectroscopy such asconventional circular dichroism (i.e. electronic cir-cular dichroism), magnetic circular dichroisms(magnetic vibrational circular dichroism, x-raymagnetic circular dichroism), fluorescencedetected circular dichroism, near-infrared circulardichroism, vibrational circular dichroism, Fouriertransform infrared circular dichroism, high pres-sure liquid chromatography circular dichroism,stopped-flow circular dichroism, and synchrotronradiation circular dichroism. Also, we havedescribed here the most important applications ofcircular dichroism spectroscopy in structural bio-chemistry and nanoscience.
Received 25 January 2009, revised 4 May 2009 and accepted for publi-cation 16 May 2009
Some biomolecules possess molecular asymmetry, that is, theirmirror images are not identical. Such molecules are named to bechiral (1). One of the most well-known examples is a carbon atomthat is tetrahedrally bonded to four different atoms or groups ofatoms. Biomacromolecules also show chirality. For example, thea-helix, the most common helix in proteins, is wound in a right--hand sense. Although most polynucleotides are wound in a right-hand sense, helices that wind in a left hand sense also exist (2).
The interaction of a chiral molecule with polarized light (Figure 1) isvery specific and has proved to be an important method for charac-terizing both small molecule and macromolecular structures (3).Essentially, one type of measurements commonly made to deter-mine the effects of polarized light on asymmetric molecules is circu-lar dichroism (CD) (1), which is defined as the difference inabsorption of left-hand and right-hand circularly polarized light withoptically active compounds.
These effects are relatively small but can be measured readily withmodern instrumentation. Hence, measurement of circular dichroismgives detailed structural and enantiomeric information on proteins,carbohydrates, nucleic acids, pharmaceuticals, liquid crystals, etc.(3). For example, the conversion of simple peptides into the destruc-tive fibrils in some disorders such as Alzheimer disease can be fol-lowed using CD (4,5).
In last decades, there have been encountered various developmentsin CD-based techniques to improve the molecular measurements ofbiological structures (6). The best known of them are conventionalCD ⁄ electronic circular dichroism (ECD), magnetic CDs (MCD, mag-netic vibrational circular dichroism (MVCD), XMCD), fluorescencedetected CD (FDCD), near-infrared CD (NIR-CD), vibrational CDs(VCD, FTIR-VCD), HPLC-CD, stopped-flow CD, and synchrotron radia-tion CD (SRCD). In this review, various kinds of CD-spectroscopytechniques and their applications in biological studies and nano-structural analyses have been discussed.
Circular Dichroism
DescriptionDichroism is often expressed as the property possessed by somematerials of absorbing light to different extents dependent upon
101
Chem Biol Drug Des 2009; 74: 101–120
Review Article
ª 2009 John Wiley & Sons A/S
doi: 10.1111/j.1747-0285.2009.00847.x
the polarization form of the incident beam. Where the absorptionof light circularly polarized in one direction (right-handed) is differ-ent from the absorption of the light circularly polarized in the oppo-site direction (left handed), the material is said to exhibit circulardichroism (Figure 2) (1,2,7–9).
When the light is circularly polarized, a secondary absorbance com-ponent arises from circular dichroism. The secondary absorbancecomponent is measured by switching between left and right circu-larly polarized (RCP) light, and measuring the resulting difference inabsorbance (2,7).
Any conformational changes in the structure of macromoleculescould be assessed using circular dichroism. As a consequent,unfolding of biomolecules (such as proteins, nucleic acids, glyco-sides, etc.) is measured as a change in circular dichroism (CD) spec-tra, and serves to give a measure of the relative quantities ofchanges have been made in the components. As for absorptionspectra, as is known in the art for example, native proteins have acharacteristic CD spectra, with small changes unique to each partic-ular protein (3,9). The shape of the spectra curve, as well as thepositive maxima and negative maxima, provide information aboutthe protein. Thus, for example, peaks present in the 200–250 nmwavelength ('far-UV') range are generally a 'w'-shaped spectra withtroughs around 222 and 208 being indicative of the presence of a-helical structures, and a 'v'-shaped spectra with a trough around 217–220 nm being indicative of b-sheet structures. However, theaccuracies have been reported for CD are 97% for helices, 75% forbeta sheet, 50% for turns, and 89% for other secondary structures,respectively (10). Scans in the 'near-UV' range, i.e. 250–300 nm,give information about tertiary structure. Other parts of the
spectrum, as around 410 nm for haeme proteins, may yield struc-tural information as well (11).
The main unit has been defined for circular dichroism is 'ellipticity',which is described as the tangent of the ratio of the minor to majorelliptical axis. In the other word, the occurrence of ellipticity iscalled circular dichroism (1). According to the literature, for report-ing the CD of a sample, mean residue ellipticity (degree cm2
dmol)1) and molar circular dichroism or delta epsilon (L mol)1 cm)1)are common (2).
As we describe in the following modes, applications of CD spec-troscopy could be categorized in various regions of biologicalstudies such as: (i) conformational assessments of proteins andnucleic acids; (ii) determination of the thermodynamics of foldingand unfolding of biomolecules; (iii) interactional studies of asym-metric biomolecules (e.g. protein–protein interactions, protein–DNA interactions, protein–ligand interactions, and DNA–ligandinteractions); and (iv) kinetics of folding and unfolding of macro-molecules.
Protein analyses
Determination of protein secondary structureProtein secondary structure can be determined by CD spectroscopyin the 'far-UV' spectral region (190–250 nm). At these wavelengths,the chromophore is the peptide bond, and the signal arises when itis located in a regular, folded environment (11). The weakest energytransition in the peptide chromophore is an n fi p* transitionobserved at 210–220 nm, which involves non-bonding electrons of
A B C
Figure 1: Schemes of the elec-tric field components of unpolar-ized (A), linearly or plane polarizedlight (B). The light is moving alongthe y-axis. For unpolarized light, alldirections occur, whereas forlinearly or plane polarized lightonly the z-direction is found. Forcircularly polarized light (C), thedirection of rotation can be clock-wise or counterclockwise.
Figure 2: Scheme of CD inwhich a difference in absorption ismeasured.
Ranjbar and Gill
102 Chem Biol Drug Des 2009; 74: 101–120
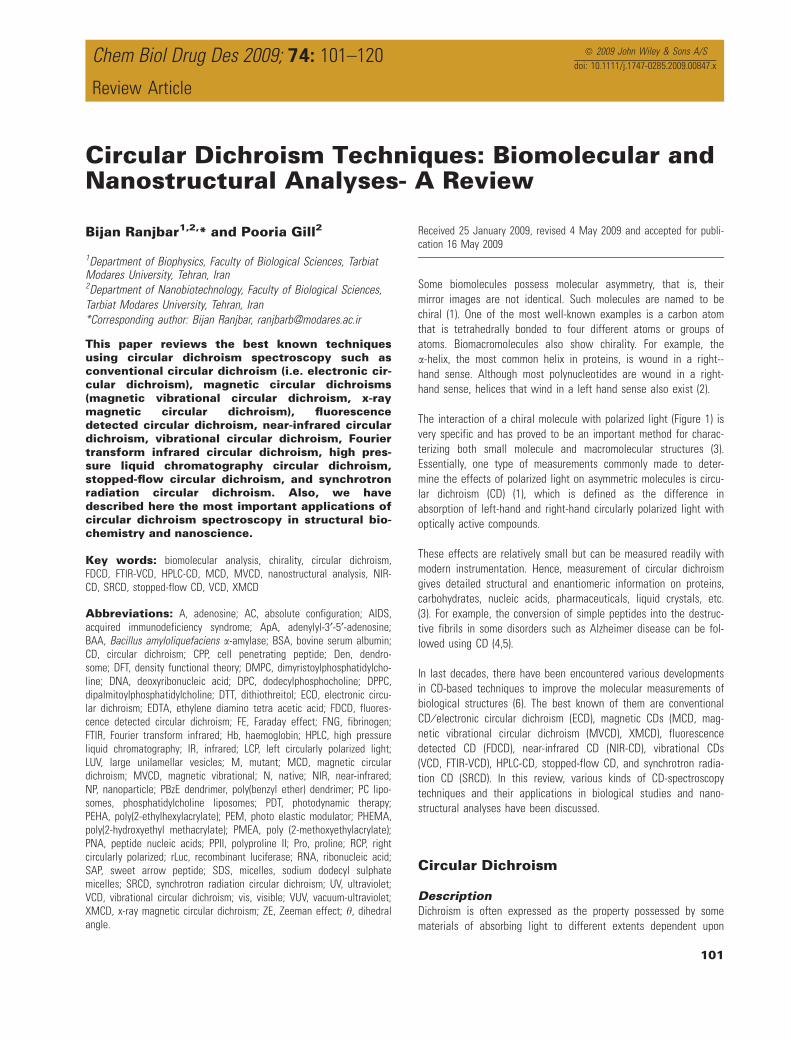
O of the carbonyl. However, the strongest energy one is an absorp-tion band centred at 190 nm because of p fi p* transitioninvolved the p-electrons of the carbonyl (1,2). Hence, the intensityof the transitions depends on F and W torsion angles. The a-helix,b-sheet, and random coil structures each give rise to a characteris-tic shape and magnitude of CD spectrum (Figure 3) (12).
For revealing any secondary structure in proteins, there are particu-lar characteristics for CD spectra. As determined, far-UV-CD of ran-dom coil is positive at 212 nm (n fi p*) and negative at 195 nm(p fi p*). Far-UV-CD of b-sheet is negative at 218 nm (p fi p*)and positive at 196 nm (n fi p*). For a-helix, the exciton couplingof the p fi p* transitions leads to positive (p fi p*) perpendicularat 192 nm, negative (p fi p*) parallel at 208 nm, and negative at222 nm is red shifted (n fi p*), respectively (10,12). The approxi-mate fraction of each secondary structure type that is present inany protein can thus be determined by analysing its far-UV CDspectrum as a sum of fractional multiples of such reference spectrafor each structural type. Although CD spectra reflect an average ofthe whole molecules (e.g. 50% of a protein contains beta-sheet),the technique is not powerful to determine which specific residuesare participated in the portion (2,12).
Technically, far-UV CD spectra require 20–200 lL of solution con-taining 1 mg ⁄ mL to 50 lg ⁄ mL protein, in any buffer which doesnot have a high absorbance in this region of the spectrum (such as
high concentrations of dithiothreitol, histidine, or imidazole, forexample, cannot be used in the far-UV region) (12,13).
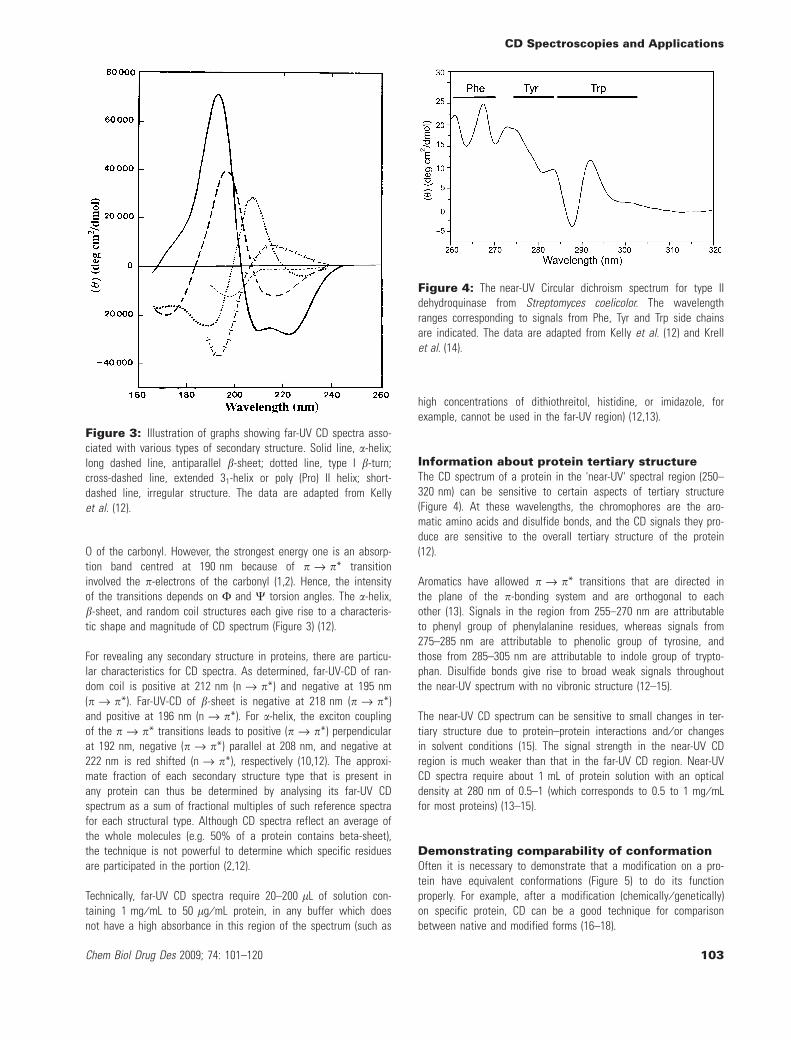
Information about protein tertiary structureThe CD spectrum of a protein in the 'near-UV' spectral region (250–320 nm) can be sensitive to certain aspects of tertiary structure(Figure 4). At these wavelengths, the chromophores are the aro-matic amino acids and disulfide bonds, and the CD signals they pro-duce are sensitive to the overall tertiary structure of the protein(12).
Aromatics have allowed p fi p* transitions that are directed inthe plane of the p-bonding system and are orthogonal to eachother (13). Signals in the region from 255–270 nm are attributableto phenyl group of phenylalanine residues, whereas signals from275–285 nm are attributable to phenolic group of tyrosine, andthose from 285–305 nm are attributable to indole group of trypto-phan. Disulfide bonds give rise to broad weak signals throughoutthe near-UV spectrum with no vibronic structure (12–15).
The near-UV CD spectrum can be sensitive to small changes in ter-tiary structure due to protein–protein interactions and ⁄ or changesin solvent conditions (15). The signal strength in the near-UV CDregion is much weaker than that in the far-UV CD region. Near-UVCD spectra require about 1 mL of protein solution with an opticaldensity at 280 nm of 0.5–1 (which corresponds to 0.5 to 1 mg ⁄ mLfor most proteins) (13–15).
Demonstrating comparability of conformationOften it is necessary to demonstrate that a modification on a pro-tein have equivalent conformations (Figure 5) to do its functionproperly. For example, after a modification (chemically ⁄ genetically)on specific protein, CD can be a good technique for comparisonbetween native and modified forms (16–18).
Figure 3: Illustration of graphs showing far-UV CD spectra asso-ciated with various types of secondary structure. Solid line, a-helix;long dashed line, antiparallel b-sheet; dotted line, type I b-turn;cross-dashed line, extended 31-helix or poly (Pro) II helix; short-dashed line, irregular structure. The data are adapted from Kellyet al. (12).
Figure 4: The near-UV Circular dichroism spectrum for type IIdehydroquinase from Streptomyces coelicolor. The wavelengthranges corresponding to signals from Phe, Tyr and Trp side chainsare indicated. The data are adapted from Kelly et al. (12) and Krellet al. (14).
CD Spectroscopies and Applications
Chem Biol Drug Des 2009; 74: 101–120 103
For instance, it was indicated that the expression of an activemutant luciferase (rLuc (Arg)) under the same condition as thenative form (rLuc) suggests formation and refolding of a properlyfolded luciferase without aggregation, which has been confirmed byCD (Figure 5) (16).
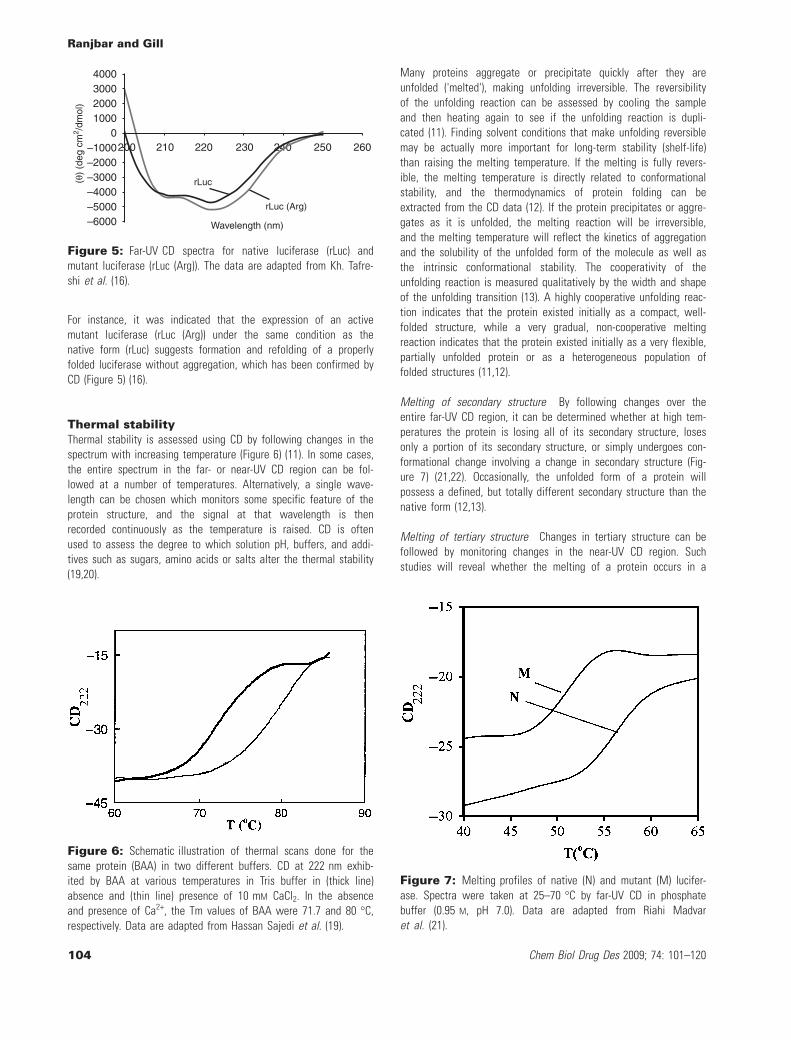
Thermal stabilityThermal stability is assessed using CD by following changes in thespectrum with increasing temperature (Figure 6) (11). In some cases,the entire spectrum in the far- or near-UV CD region can be fol-lowed at a number of temperatures. Alternatively, a single wave-length can be chosen which monitors some specific feature of theprotein structure, and the signal at that wavelength is thenrecorded continuously as the temperature is raised. CD is oftenused to assess the degree to which solution pH, buffers, and addi-tives such as sugars, amino acids or salts alter the thermal stability(19,20).
Many proteins aggregate or precipitate quickly after they areunfolded ('melted'), making unfolding irreversible. The reversibilityof the unfolding reaction can be assessed by cooling the sampleand then heating again to see if the unfolding reaction is dupli-cated (11). Finding solvent conditions that make unfolding reversiblemay be actually more important for long-term stability (shelf-life)than raising the melting temperature. If the melting is fully revers-ible, the melting temperature is directly related to conformationalstability, and the thermodynamics of protein folding can beextracted from the CD data (12). If the protein precipitates or aggre-gates as it is unfolded, the melting reaction will be irreversible,and the melting temperature will reflect the kinetics of aggregationand the solubility of the unfolded form of the molecule as well asthe intrinsic conformational stability. The cooperativity of theunfolding reaction is measured qualitatively by the width and shapeof the unfolding transition (13). A highly cooperative unfolding reac-tion indicates that the protein existed initially as a compact, well-folded structure, while a very gradual, non-cooperative meltingreaction indicates that the protein existed initially as a very flexible,partially unfolded protein or as a heterogeneous population offolded structures (11,12).
Melting of secondary structure By following changes over theentire far-UV CD region, it can be determined whether at high tem-peratures the protein is losing all of its secondary structure, losesonly a portion of its secondary structure, or simply undergoes con-formational change involving a change in secondary structure (Fig-ure 7) (21,22). Occasionally, the unfolded form of a protein willpossess a defined, but totally different secondary structure than thenative form (12,13).
Melting of tertiary structure Changes in tertiary structure can befollowed by monitoring changes in the near-UV CD region. Suchstudies will reveal whether the melting of a protein occurs in a
4000300020001000
0–1000200 210
rLuc
rLuc (Arg)
Wavelength (nm)
(θ)
(deg
cm
2 /dm
ol)
220 230 240 250 260–2000–3000–4000–5000–6000
Figure 5: Far-UV CD spectra for native luciferase (rLuc) andmutant luciferase (rLuc (Arg)). The data are adapted from Kh. Tafre-shi et al. (16).
Figure 6: Schematic illustration of thermal scans done for thesame protein (BAA) in two different buffers. CD at 222 nm exhib-ited by BAA at various temperatures in Tris buffer in (thick line)absence and (thin line) presence of 10 mM CaCl2. In the absenceand presence of Ca2+, the Tm values of BAA were 71.7 and 80 �C,respectively. Data are adapted from Hassan Sajedi et al. (19).
Figure 7: Melting profiles of native (N) and mutant (M) lucifer-ase. Spectra were taken at 25–70 �C by far-UV CD in phosphatebuffer (0.95 M, pH 7.0). Data are adapted from Riahi Madvaret al. (21).
Ranjbar and Gill
104 Chem Biol Drug Des 2009; 74: 101–120
single-step reaction (with concurrent loss of both secondary and ter-tiary structure), or in a two-step reaction (13,15).
For instance, melting curves for barnase as the CD versus tempera-ture in the far-(194 nm) and near-UV (280 nm) at pH 5.5 and 2.4(Figure 8) indicated the steep decrease in CD at 194 nm with risingtemperature is due to cooperative melting of secondary structure,and the decrease in CD at 280 nm indicated loss of tertiary struc-ture. The congruence of the 194 and 280 nm melting curves con-firmed that the alterations in secondary and tertiary structures areconcurrent (23).
Melting of protein complexes The effect of forming a protein–protein complex (e.g. ligand ⁄ receptor, antigen–antibody, ordimers ⁄ polymers) on the thermal stability of the individual proteinsin the complex can also be determined (Figure 9) (24). This worksbest if the individual proteins have CD spectra which are quite dif-ferent from each other, such that changes at specific wavelengthscan be monitored to follow changes in the corresponding protein. Insuch cases, it is possible to determine whether there is an increasein stability of one or both of the proteins following complex forma-tion (25).
The thermal unfolding of monomer and dimer of lysozyme at pH 2(Figure 9) indicated the monomer transition was sigmoidal with amidpoint Tm (about 52 �C), but in the dimer form the thermalunfolding was not sigmoidal, and its stability has been changed(24).
Detection of molten globule-like structure ofproteinsMolten globule is a stable, partially folded protein state found inmildly denaturing conditions such as low pH, mild denaturant orhigh temperature (26). Molten globules are collapsed and generallyhave some native-like secondary structure but a dynamic tertiarystructure as seen by far and near circular dichroism spectroscopy,respectively (27–31). These traits are similar to those observed in
the transient intermediate states found during the folding of certainproteins, especially globular proteins that undergo hydrophobic col-lapse, and therefore the term 'molten globule' is also used to referto certain protein folding intermediates corresponding to the nar-rowing region of the folding funnel higher in energy than the nativestate but lower than the denatured state. The molten globuleensembles sampled during protein folding and unfolding are thoughtto be roughly similar (32).
The experimental studies of the folding intermediates of variousglobular proteins have demonstrated that the molten globule is areal productive intermediate of folding (33). The structural character-istics of the molten globule state are apparent and common amongdifferent proteins, and indicate that the state is structurally inter-mediate between the native and the fully unfolded state (34).
Comparisons between the CD spectra in near-UV and Far-UV regionsof a protein could clarify how modifications affected its structure(Figure 10). For example, the transition to the molten globule statehas been shown to be accompanied by loss of tertiary interactionswhereas most of the secondary structure is preserved. This is mani-fested by the disappearance of the CD bands in the near-UV regionand the virtually unchanged CD spectrum in the far-UV region(31,35,36). As a consequent, if a protein retains secondary structurebut no defined three-dimensional structure (e.g. an incorrectlyfolded or 'molten-globule' structure), the signals in the near-UVregion will be nearly zero (31). On the other hand, the presence of
Figure 8: Melting curves for barnase at (1) pH 2.4 and (2) pH5.5 from the temperature dependence of CD at 280 (solid line) and194 nm (dashed line). Data are adapted from Schulga et al. (23).
A
B
Figure 9: Thermal unfolding of lysozyme monomer (A), and lyso-zyme dimer (B) as a complex protein at pH 2 monitored at 222 nm.Data are adapted from Maroufi et al. (24).
CD Spectroscopies and Applications
Chem Biol Drug Des 2009; 74: 101–120 105
significant near-UV signals is a good indication that the protein isfolded into a well-defined structure.
Biophysical analyses of cell-penetratingpeptidesCell penetrating peptides (CPPs) are peptides with the capacity totranslocate across the plasma membrane of mammalian cells (37).These biological macromolecules, have created a new horizon inbiomedical research to obtain most efficient ways to carry substan-tial cargoes such as peptides (38,39), proteins (40), plasmid DNA(41), oligonucleotides (42), peptide nucleic acids (PNA) (43,44), andeven nanoparticles (45) or liposomes (46) across the plasma mem-brane into cellular compartments. Circular dichroism allows a quickestimation of secondary structures of cell-penetrating peptides andis well suited for following changes in their secondary structuresdependent on peptide concentration, pH, buffer, and on the natureand composition of the lipid (47).
For instance, the presence of the polyproline II (PPII) secondarystructure in a Pro-rich peptide (as a CPP) can be easily assessedby circular dichroism (48,49). The PPII spectrum presents a weakpositive band at 228 nm and a strong negative band at 203 nm.Because of the weakness of the positive band, it is onlyobserved when working at low temperatures (Figure 11, inset).When rising the temperature, the peptide PPII structure becomesmore flexible, causing a decrease in the intensity of both bands(Figure 11) (48).
Similarly, the secondary structure of penetratin (as a CPP) has beendetermined in a number of studies under various conditions. As ageneral trend, penetratin is mainly unstructured in buffer (occasion-ally with a significant b-sheet contribution) and becomes a-helical inSDS micelles and neutral PC liposomes, whereas negatively chargedliposomes induced b-sheet formation (50–53). In another study (54),it was demonstrated that the a-helix to b-sheet transition occurredduring vesicle aggregation and a subsequent transformation back toan a-helical conformation took place during the spontaneous disag-gregation. Sequence modifications of penetratin in which one or twoTrp were replaced by Phe had a propensity to adopt the b-sheetstructure, while penetratin without this modification had a propensityfor the a-helical form (53). In general, the secondary structure of pe-netratin appears to be highly dependent on various key factors, liketype and charge of lipid, concentration, and peptide-to-lipid ratio. Incontrast to penetratin, CD analyses shown that the secondary struc-ture of transportan was less variable and independent of lipid chargedensity. Transportan displayed about 30% a-helicity in water and50–60% in membrane model systems like SDS micelles (55), Dod-ecylphosphocholine micelles (56), and large unilamellar vesicles (53).
Nucleic acid analyses
Comparison between nucleosides andnucleotidesNucleotides are the main building blocks, which have been used inasymmetric structure of nucleic acids (RNA ⁄ DNA). The chiral sugars
A 15 000 300
200
100
0 250 270 290 310
10 000
5000
–5000
–10 000
M
M
N
N 200 210 220 230 240 250
Wavelength (nm)
(θ)
(deg
cm
2 /dm
ol)
Wavelength (nm)
0
B
Figure 10: Far-UV CD spectra(A) and near-UV CD spectra (B) fornative (N) and modified (M) glu-cose oxidase. Data are adaptedfrom Hosseinkhani et al. (31).
190–40 000
–30 000
T+
–
T–
+
–20 000
–10 000
0
200 210 220
Wavelength (nm)
Wavelength/nm
[θ] M
R /d
eg.c
m2 .
dmol
–1
[θ] M
R /d
eg.c
m2 .
dm
ol–1
230
215–6000
–4000
–2000
0
2000
220 225 230 235 240
240 250
Figure 11: CD spectra of50 lM SAP at different tempera-tures (from 0 to 70 �C a spectrumevery 10 �C, and at 90 �C) in10 mM aqueous phosphate bufferat pH 7. Insert: amplification of theregion corresponding to the bandat 228 nm. The data are adaptedfrom Pujals and Giralt (48).
Ranjbar and Gill
106 Chem Biol Drug Des 2009; 74: 101–120
of nucleosides have an intrinsic asymmetry and the interaction ofthe strong pfip* transitions of the chromophoric bases with thehigher energy in the sugars yield a circular dichroism of low inten-sity (57). In fact, circular dichroism of nucleic acids is mainly depen-dent on the stacking geometry of the bases. The difference in CDbetween a nucleoside, adenosine (A), and a dinucleoside phosphate,adenylyl-3¢-5¢-adenosine (ApA), is illustrated in Figure 12 (58,59).
CD of the dinucleoside phosphate per adenosine is about a factorof 10 larger than the CD of adenosine. In adenosine, the CDdepends on the interaction of adenine with its ribose and phos-phate groups; whereas in the dinucleoside phosphate, the CD ismainly originated from the chiral adenine–adenine interaction(58,59). The combination of positive and negative extrema on eitherside of 260 nm is called an exciton band; there is another excitonband at 215 nm. The positive signs (long wavelength componentpositive, short wavelength component negative) of these two bandsindicate that the two adenines are forming a right-handed stack inApA (58–60).
Determination of nucleic acid conformationsThe circular dichroism spectra of A-RNA, A-DNA, B-DNA and Z-DNA in the 200–320 nm range are shown in Figure 13 (59,61–64).
Both A-RNA and A-DNA have spectra that are similar in shape. TheA-RNA has a maximum near 260 nm, a minimum near 210 nm, anda small negative CD between 290 and 300 nm. The A-DNA has amaximum at 270 nm, a minimum near 210 nm and zero CD at300 nm and beyond (59,61). B-DNA has a conservative CD spectrumabove 220 nm with approximately equal positive (275 nm) and neg-ative (245 nm) components centred around 260 nm (59,62).
The B-DNA maximum has less than one-half the magnitude of theA-DNA maximum. Of course, the exact shapes and magnitudes ofthe CD spectra will depend on the base sequences, but the overallpatterns will remain constant (59,64). The Z-DNA has a conservativespectrum above 240 nm with approximately equal negative(290 nm) and positive (260 nm) components centred around 280 nm(59,63).
Figure 12: CD spectra of adenylyl-3¢-5¢-adenosine (ApA) com-pared with adenosine (A). For both molecules, the spectra are givenper mole of nucleoside. The spectra are for aqueous solutions atpH 7 and room temperature. The data are adapted from Warshawand Cantor (58) and Bloomfield et al. (59).
Figure 13: Circular dichroism spectra above 200 nm for right-handed A-RNA and A-DNA, right-handed B-DNA, and left-handed Z-DNA (units are per M ⁄ cm ⁄ mol of nucleotide) [The data are adaptedfrom Bloomfield et al. (59)]. The A-RNA is Penicillium chrysogenumfungal virus double-stranded RNA with a G + C content of 54%; itis in 0.01 M Na+, pH 7 [The data are adapted from Gray et al. (61)].The A-DNA is from E. coli with G + C content of 50%; it is in 80%trifluoroethanol, 0.667 M phosphate, pH 7 [The data are adaptedfrom Sprecher et al. (62)]. The B-DNA is from E. coli DNA in 0.02 M
Na+, pH 7 [The data are adapted from Gray et al. (63)]. The Z-DNAis poly [d(CG) d(CG)] in 2 M NaClO, pH 7 [The data are adapted fromRiazance et al. (64)].
CD Spectroscopies and Applications
Chem Biol Drug Des 2009; 74: 101–120 107
Using vacuum CD has been shown that the right-handed nucleicacids (A-DNA, B-DNA, A-RNA) have an intense positive peak near186 nm and negative CD below 180 nm; the left handed molecules(Z-DNA, Z-RNA) have an intense negative peak at 190–195 nm, acrossover at 184 nm, and a positive peak below 180 nm (59,64).Calculations of CD spectra for sequences other than those mea-sured show that below 220- nm right-handed double helices have apositive CD couplet and left-handed duplexes have a negative cou-plet. Therefore, a good method to establish the sense of a duplexhelix is to measure the circular dichroism in the wavelength rangefrom 170 to 220 nm (59,64,65).
In summary, CD is most useful technique to compare DNA or RNAconformations and to detect changes when the solvent or tempera-ture is changed. For example, a variety of changes in conditions(temperature, alcohol solvents, and high salt) have been found tocause decrease in a specific wavelength (i.e., 275 nm) (66–74).However, the assignment of the 'C-form' CD spectrum is crucialsince it is often found for DNA in condensed or packaged systems.CD studies of bacteriophage (75,76), adenovirus (77), chromatin(78,79), and nucleosomes (80,81) all suggest that DNA adopts thestructure represented by this spectrum under biological conditions(59).
Determination of nucleic acid–ligandinteractionsDNA is an obvious target for drug intervention since disruption ofits structure clearly will have significant biological implications. Forinstance, studies on the interaction of cationic porphyrins (as aligand) and their derivatives with DNA have received interest inrecent years (82,83). Particularly, porphyrins have been reportedfrom the viewpoint of their use in photodynamic therapy of cancercells (84), DNA cleavers (85,86) and as drugs to treat some infec-tious diseases such as AIDS (87).
The negatively charged phosphate groups along the backbone struc-ture of DNA can bind small molecules through electrostatic interac-tions, but the major sites of drug binding in double-stranded DNAare the major and minor grooves in the double helical structure andintercalation between the bases (1,88). Many of the drugs usedcontain aromatic rings, and for instance of such binding, we con-sider the interaction of DNA with acridine orange, even though acri-dine orange is not actually a drug (1,88). It is not optically active byitself, but binding to DNA induces optical activity into the molecule.This is because, binding causes the electronic energy states ofachiral acridine orange to be coupled with the electronic energystates of chiral DNA. Induced optical activity is quite common whenachiral small molecules bind to chiral macromolecules. The CDspectra of acridine orange bound to DNA are shown in Figure 14for various ratios of (bound dye) ⁄ DNA (1,88).
Negative value of De is observed at very low values of (bounddye) ⁄ (acridine orange), but as this ratio increases, a large positiveband develops (1,88). At the highest ratio shown, both strong nega-tive and positive bands are observed. A molecular interpretation ofthese results has been developed. At very low concentrations ofacridine orange, the binding is through intercalation between the
bases, with the acridine orange ring structure parallel to the bases(1,88). This produces a negative induced circular dichroism with aminimum De of about -8 ⁄ M ⁄ cm. As the concentration of the ligandincreases, the dye binds to the groove which induces a positive CDwith a maximum value of about 30 ⁄ M ⁄ cm. These two induced CDsignals are enhanced at higher dye concentrations due to interac-tions between the electronic energy levels of the bound dye mole-cules (1,88). This example demonstrates the exquisite sensitivity ofthe CD spectrum to the nature of the binding process and to thesecondary structure of the DNA. Studies with many different typesof ligands have been carried out (89,90).
Nanostructural analyses
Conformational study of biomolecules uponinteracting with nanoparticlesDetermining the conformational behaviour of adsorbed biomoleculeson a nanoparticles surface using CD deserves some attention (91).Although from a CD spectrum it is not possible to determine exactlywhether a biomolecule retains its bioactivity, the degree of proteinor nucleic acid denaturing can be estimated by comparing the CDspectra of the native and the surface immobilized one (92). Forexample, Using CD, Plasma proteins [such as bovine serum albumin(BSA) and human plasma fibrinogen (FNG)] adsorption on various
Figure 14: CD per mole of acridine orange bound to DNA atthe indicated values of (bound dye) ⁄ (DNA). The data are adaptedfrom Fornasiero and Kurucsev (88) and Hammes (1).
Ranjbar and Gill
108 Chem Biol Drug Des 2009; 74: 101–120
nanopolymer surfaces was studied and demonstrated that thea-helical contents of BSA and FNG decreased on poly (2-methoxy-ethylacrylate) (PMEA), PHEMA, and poly(2-ethylhexylacrylate) (PEHA)compared with native BSA and native FNG (92). Consequently, thecontents of secondary structures could be analysed quantitativelybased on the CD spectra and it was obvious that a-helical contentsof native BSA, BSA adsorbed onto the surface of PMEA, PHEMA,and PEHA were 51%, 37%, 15% and 8%, respectively (93).
Similarly, the conformational change of DNA upon interacting withthe functionalized nanoparticles has been determined using CD(94,95). As defined, mixed monolayer-functionalized gold nanoparti-cles present a promising structure for the development of DNA-regulating molecules (96), and have already been shown to behighly effective transfection vectors (96). Some studies revealed thatquaternary ammonium-functionalized nanoparticles change the CDsignal of DNA to a substantial extent (97). For instance, the amine-terminated cationic nanoparticles (such as NP_L-Phe) denature theDNA secondary structure (Figure 15A), as indicated by the decreasein ellipticity at 280 nm upon addition of nanoparticles (94).
In case of nanoparticles with hydrophobic side chains, CD spectraof the aromatic side chains (i.e. NP_ L-Trp and NP_L-Phe) demon-strate more effective unwinding of the DNA strand in comparisonto the aliphatic side chains (i.e. NP_ L-Leu; Figure 15B) (94). Thisenhanced unwinding arises most likely from p-p stacking of thearomatic rings on the side chains with DNA bases (98). For nano-particles with hydrophilic side chains, NP_ L-Arg perturbs the DNAstructure more than NP_ L-Lys (Figure 15C) (94). This effect can beattributed to the possibility of stable hydrogen bonding betweenthe guanine moiety of arginine and interior DNA bases (94,99).
Information about nanocarriersCD studies are usual for characterizing of nanocarriers as potentialgene ⁄ drug delivery devices in nanomedicine and their interactionswith biomolecules and drugs have attracted considerable attentionin recent studies (100–103). Not only CD often allows one to obtainstructural information on the assembled structure of nanocarriers,but also, the CD spectra can predict the efficiency of such nanoma-terials in packaging a gene-construct for delivery to a host cell. Inaddition, conformation analysis of a DNA, before (or after) packag-ing in a nanocarrier can be monitored by CD (104–108).
When a single chiral group such as aminophenyl propanediol (109)or binaphthyl (110) is located at the core of PBzE dendrimers, theCD data affords information about the variation of the dihedralangle h in the binaphthyl (111). For fully chiral dendrimers, the chir-optical properties of two series of chiral polyarylether dendrimersfrom generation 0 to 3 (112) and of dendrimers based on dihydroxy-pyrrolidine (113) show that the CD spectra change dramatically,indicating conformational substructures in the branches.
The variations in the CD spectra of calf thymus- and linear DNAclearly indicated a transition from B- to A-DNA when exposed tolow levels (< 10 lg lL)1 solvent) of dendrosomes (Den123; self-organized from amphipathic monomers) (105,113). However, the CDspectral variations in calf thymus- and linear DNA shown a mild
Figure 15: Circular dichroism spectra of 37-mer double-stranded DNA (0.25 lM) in 5 mM AcOH ⁄ NaOH buffer (pH 5.0).(A) Decrease in ellipticity at 280 nm (h280) upon addition ofcationic nanoparticles into DNA solution. Change in CD spectraof DNA by (B) hydrophobic nanoparticles and (C) hydrophilicnanoparticles (NP 0.6 lM). The data are adapted from Ghoshet al. (94).
CD Spectroscopies and Applications
Chem Biol Drug Des 2009; 74: 101–120 109
transition from B- to A-DNA (intermediate between A and B-DNAstructures) when exposed to higher levels of Den123 (more than10 lg lL)1 solvent) (105) (Figure 16).
CD analyses indicate that DNA is present in the inter-lamellarwater space as the DNA is present in the C form as opposed tothe more usual B form. A similar change in the conformation ofDNA (from B to the C form) was observed upon the entrapmentand condensation of DNA into reverse nano-sized micelles formedby non-ionic surfactant (114). If the DNA was present in the centralaqueous space, it might be expected that the CD would be largelyunchanged from that of the B-form (Figure 17) (115). These changessuggest an alteration in DNA conformation when encapsulated inthe vesicles. Similar changes in the CD spectra are observed forDNA encapsulated in vesicles prepared using dipalmitoylphosphati-dylcholine and DMPC (114).
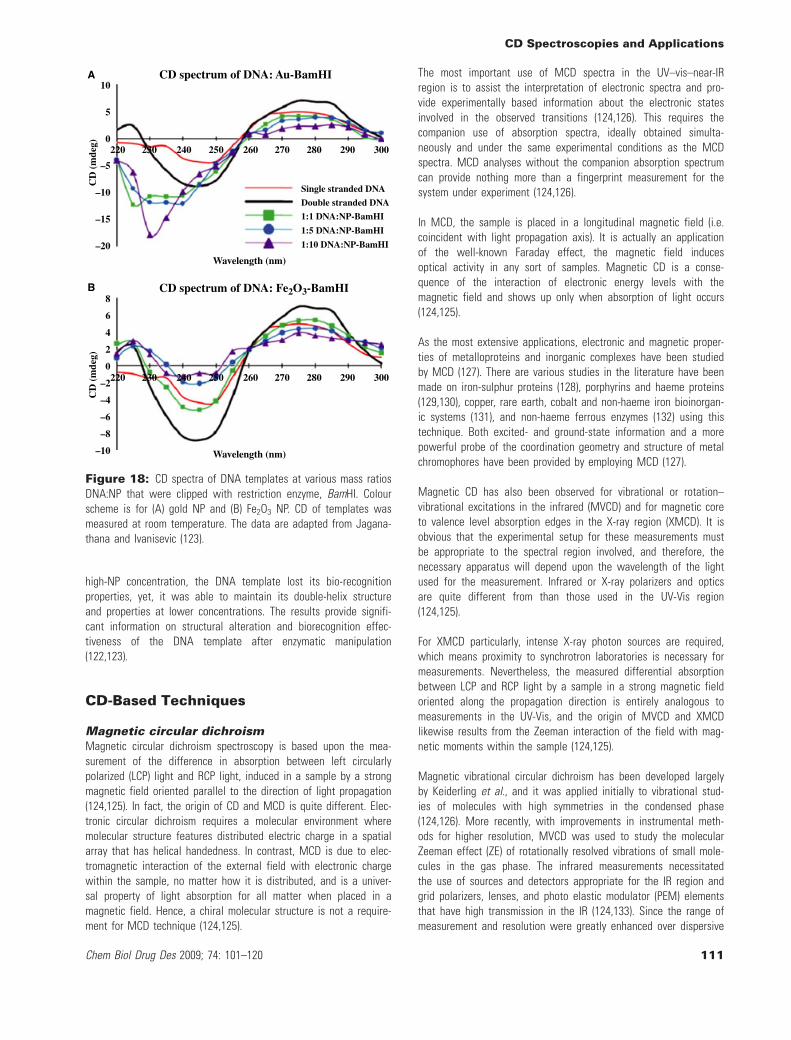
Analysis of DNA biofunctions on nanoparticlesFabrication of nanowires is showing great potential for future nan-odevices (116). In this way, magnetic nanowires are of interest formemory storage devices (117), and metallic nanowires have a highprospective in biosensors (118). Since it is essential to find cost-efficient controlled fabrication processes for these nanostructures(118), a promising way is the utilization of biomolecules at thenano-scale. However, the interaction between biomolecules andnanoparticles has not been known, clearly. Understanding themanipulation of biomolecules will allow controlling the fabricationmethod of nanowire templating, better. It was demonstrated thatDNA has desired properties for templating metal structures (119).Also, it has been shown that DNA can be used for the assembly ofmagnetic and metallic nanoparticles, creating DNA template nano-wires (120). With the use of restriction endonucleases and DNAligase, it was demonstrated using gel experiments that DNA tem-plate nanowires can be clipped at specific sequences and ligatedback together (120). In such studies, circular dichroism can be usedto examine the mechanism of endonuclease clipping and ligation ofthe DNA template nanowires (121). For example, enzymatic manipu-lation of the DNA template for magnetic and metallic nanowireswas explored through CD (Figure 18) (122,123).
It was shown at a 1:1 DNA:nanoparticle (NP) ratio, the digestedand ligated DNA templates were able to maintain the B-form DNAstructure for both metallic and magnetic NP. Also, at NP concentra-tions >1:5 DNA:NP, CD displayed denaturation and inhibited enzy-matic activity (123). Consequently, these phenomena shown that at
A
B
Figure 16: A. CD spectra of calf thymus DNA and its admix-tures with Den123 (a self-assembled amphipath) at low level of thelatter; (1) DNA alone, (2) Den ⁄ DNA:1 ⁄ 17, (3) Den ⁄ DNA:1 ⁄ 10, (4)Den ⁄ DNA:1 ⁄ 5, (5) Den ⁄ DNA:1 ⁄ 1, (6) Den ⁄ DNA:5 ⁄ 1. (B) CD spectraof calf thymus DNA and its admixture with Den123 at a high levelof the latter; (1) DNA alone, (2) Den ⁄ DNA:1 ⁄ 17, (3) Den ⁄ DNA:1 ⁄ 10,(4) Den ⁄ DNA:1 ⁄ 5, (5) Den ⁄ DNA:1 ⁄ 1. The data are adapted fromSadeghizadeh et al. (105).
220–10
–8
–6
–4
–2
0
2
4
6
8
10
230 240 250 260 270
Wavelength (nm)
CD
(m
deg)
280 290 300 310 320
Figure 17: The CD spectrum of free calf thymus DNA in water(present in its usual B-form) is shown in two concentrations, namely0.01 and 0.025 mg ⁄ mL. A significant left shift in the DNA spectrumwas observed when the DNA was encapsulated in nanovesicles.The wavelength when the CD recorded changes from being positiveto negative shifted from 260 nm for calf thymus DNA in solution to253 nm for DNA encapsulated in DSPC vesicles. The ratio of themaximum positive to negative CD absorbance for the DNA insidethe vesicles was 3.87 compared with 1.1 for calf thymus DNA insolution. The data are adapted from Kudsiova et al. (115).
Ranjbar and Gill
110 Chem Biol Drug Des 2009; 74: 101–120
high-NP concentration, the DNA template lost its bio-recognitionproperties, yet, it was able to maintain its double-helix structureand properties at lower concentrations. The results provide signifi-cant information on structural alteration and biorecognition effec-tiveness of the DNA template after enzymatic manipulation(122,123).
CD-Based Techniques
Magnetic circular dichroismMagnetic circular dichroism spectroscopy is based upon the mea-surement of the difference in absorption between left circularlypolarized (LCP) light and RCP light, induced in a sample by a strongmagnetic field oriented parallel to the direction of light propagation(124,125). In fact, the origin of CD and MCD is quite different. Elec-tronic circular dichroism requires a molecular environment wheremolecular structure features distributed electric charge in a spatialarray that has helical handedness. In contrast, MCD is due to elec-tromagnetic interaction of the external field with electronic chargewithin the sample, no matter how it is distributed, and is a univer-sal property of light absorption for all matter when placed in amagnetic field. Hence, a chiral molecular structure is not a require-ment for MCD technique (124,125).
The most important use of MCD spectra in the UV–vis–near-IRregion is to assist the interpretation of electronic spectra and pro-vide experimentally based information about the electronic statesinvolved in the observed transitions (124,126). This requires thecompanion use of absorption spectra, ideally obtained simulta-neously and under the same experimental conditions as the MCDspectra. MCD analyses without the companion absorption spectrumcan provide nothing more than a fingerprint measurement for thesystem under experiment (124,126).
In MCD, the sample is placed in a longitudinal magnetic field (i.e.coincident with light propagation axis). It is actually an applicationof the well-known Faraday effect, the magnetic field inducesoptical activity in any sort of samples. Magnetic CD is a conse-quence of the interaction of electronic energy levels with themagnetic field and shows up only when absorption of light occurs(124,125).
As the most extensive applications, electronic and magnetic proper-ties of metalloproteins and inorganic complexes have been studiedby MCD (127). There are various studies in the literature have beenmade on iron-sulphur proteins (128), porphyrins and haeme proteins(129,130), copper, rare earth, cobalt and non-haeme iron bioinorgan-ic systems (131), and non-haeme ferrous enzymes (132) using thistechnique. Both excited- and ground-state information and a morepowerful probe of the coordination geometry and structure of metalchromophores have been provided by employing MCD (127).
Magnetic CD has also been observed for vibrational or rotation–vibrational excitations in the infrared (MVCD) and for magnetic coreto valence level absorption edges in the X-ray region (XMCD). It isobvious that the experimental setup for these measurements mustbe appropriate to the spectral region involved, and therefore, thenecessary apparatus will depend upon the wavelength of the lightused for the measurement. Infrared or X-ray polarizers and opticsare quite different from than those used in the UV-Vis region(124,125).
For XMCD particularly, intense X-ray photon sources are required,which means proximity to synchrotron laboratories is necessary formeasurements. Nevertheless, the measured differential absorptionbetween LCP and RCP light by a sample in a strong magnetic fieldoriented along the propagation direction is entirely analogous tomeasurements in the UV-Vis, and the origin of MVCD and XMCDlikewise results from the Zeeman interaction of the field with mag-netic moments within the sample (124,125).
Magnetic vibrational circular dichroism has been developed largelyby Keiderling et al., and it was applied initially to vibrational stud-ies of molecules with high symmetries in the condensed phase(124,126). More recently, with improvements in instrumental meth-ods for higher resolution, MVCD was used to study the molecularZeeman effect (ZE) of rotationally resolved vibrations of small mole-cules in the gas phase. The infrared measurements necessitatedthe use of sources and detectors appropriate for the IR region andgrid polarizers, lenses, and photo elastic modulator (PEM) elementsthat have high transmission in the IR (124,133). Since the range ofmeasurement and resolution were greatly enhanced over dispersive
Wavelength (nm)
Wavelength (nm)
CD spectrum of DNA: Fe2O3-BamHI
CD spectrum of DNA: Au-BamHIA
B
220 230 240 250 260 270 280 290 300
220 230 240 250 260 270
Single stranded DNA
Double stranded DNA
1:1 DNA:NP-BamHI
1:5 DNA:NP-BamHI
1:10 DNA:NP-BamHI
280 290 300
CD
(m
deg)
–10
–8
–6
–4
–2
0
2
4
6
8
CD
(m
deg)
–20
–15
–10
–5
0
5
10
Figure 18: CD spectra of DNA templates at various mass ratiosDNA:NP that were clipped with restriction enzyme, BamHI. Colourscheme is for (A) gold NP and (B) Fe2O3 NP. CD of templates wasmeasured at room temperature. The data are adapted from Jagana-thana and Ivanisevic (123).
CD Spectroscopies and Applications
Chem Biol Drug Des 2009; 74: 101–120 111
spectrometers, the applications of Fourier transform IR (FTIR) meth-ods to MVCD were also notable. However, the differential signalsfor LCP and RCP light are often very small and instrumental arte-facts have been, and are still, problematic because they can belarge compared with the signals of interest (124,133).
Magnetic CD measurements in the X-ray region (XMCD) involveexcitation of core electrons to empty or partly filled valence orbi-tals. For example, the L-edge absorptions in transition metalsinvolve excitation of the spin–orbit split 2p core electrons to thevalence 3d or 4p levels. Interpretation of the MCD of these transi-tions requires experimental measurements that occur typically atenergies of hundreds of electron volts (eV) to several thousandelectron volts (keV). An interesting feature of XMCD is that it pro-vides an element-specific spectrum that is a measure of orbital andspin angular momentum and the related magnetic properties whichresult from such momentum. Hence, XMCD has largely involvedsolid-state samples, often at low temperature (124,125).
Fluorescence detected circular dichroismFluorescence detected circular dichroism combines the structuralsensitivity and chiral specificity of CD with the sensitivity andspecificity of fluorescence (134,135). It consists in measuring thedifferential emission of light from a sample excited with LCP (left-circularly polarized) and RCP (right-circularly polarized) radiations,and is based on the assumption that the amount of light emitteddepends exclusively on the amount absorbed; in other words, theexcitation spectrum of the fluorophore parallels the absorptionspectrum, and the molecular quantum yield is the same for both cir-cularly polarized components (136). FDCD is then an indirect way ofmeasuring a differential absorption (134,135). It is sensitive to bothchiral and fluorescent molecules, and therefore is far more specificthan standard transmission CD, because in principle the CD associ-ated with a single fluorophoric molecule or moiety may be selectiv-ity extracted in the presence of many non-fluorescentchromophores. Moreover, similar to the higher sensitivity of fluores-cence compared with absorption spectroscopy, the direct measure-ment of emitted radiation against a zero background renders FDCDmore sensitive than conventional CD (137).
In FDCD, the difference in fluorescence intensity for left and RCPexcitation is measured. In practice, the technique is very selective,because only fluorophores are detected (even in a multichromo-phoric molecule). Additionally, exciton coupled FDCD seems a verypromising approach, since selectivity and sensitivity are highlyenhanced (138,139).
Fluorescence detected circular dichroism helps in separating contri-butions from multi-component systems, and the quenching detectionof chiral molecules also through multidimensional FDCD experiments(140). It could also be employed in numerous examples of mixturesof a fluorophoric probe and a chromophoric species, (i.e., a fluores-cent dye associated with a biopolymer), or of a fluorophore insertedinto a non-fluorescent chiral biomolecules such as proteins ornucleic acids (140). Fluorescence detected circular dichroism may beapplied as a detection tool in chromatography, electrophoresis, anddetermination of enantiomeric excesses, whereas only a few other
reports have provided data regarding FDCD sensitivity enhancement(139,140).
Using a fluorescence cuvette and placing at 90� a second photo-multiplier tube with transfer optics, it is possible to collect CD andfluorescence from the sample, simultaneously. Emission signalshould be filtered by a long-pass filter, or, alternatively, by an emis-sion monochromator. In fact, the approach is getting today ratherpopular, mainly in applications requiring long thermal melting exper-iments to monitor conformational changes, since double informationcan be obtained, with limited hardware investment (140).
NIR-CDApplications of circular dichroism in the near-infrared region (NIR)are quite rare, but not uncommon. Many metals linked with pro-teins and several chiral metal complexes may give CD active bandsin the NIR region (NIR is starting from 700 nm up) (141,142). Con-ventional CD spectroscopies feature double prism monochromatorsfor best efficiency in the far-UV (<250 nm). Double prism monochro-mators have very low dispersion toward the NIR field, so the actuallimit of standard units are around 1100 nm. This wavelength is alsothe practical NIR limit of red extended (S1) photomultiplier tubesand of Si diodes (141,142). The capability of NIR-CD has beenemployed by Eglinton et al. to show that both the oxidized andreduced states of cytochrome c oxidase (as a metalloprotein) con-tain electronic states in the NIR region. The spectra have revealedall of the new bands could be assigned with reasonable confidenceto one or more of the metal centres in the protein. Consequently, itwas clear this spectral region allows observation of the two hemsa and a3 separately (143).
To approach the NIR further a different hardware is therefore nec-essary. Jasco's J-730 was designed for this purpose (144,145), itfeatures a filament source (halogen), a plane grating single mono-chromator, a linear polarizer, a conventional PEM and a liquid nitro-gen cooled in Sb detector. But the most important difference is thata further light modulator (a chopper) must be inserted in the beam,since typical IR detectors would not operate with CD signals(141,142).
Vibrational circular dichroismVibrational circular dichroism (VCD) is a spectroscopic technique,which uses circularly polarized light to provide information about asubstance (146,147). An interesting feature of many substances isthat they respond differently to incident light having different polar-ization, which they may absorb, reflect, and or transmit differentamounts of differently polarized light. VCD technique is generallydirected to determining the difference in absorption that a sub-stance exhibits between right and LCP light (148). VCD measure-ments are particularly useful in the field of stereochemistry, i.e.,the study of the shapes of molecules and the spatial arrangementof atoms therein (149). More particularly, VCD analyses are usefulin the study of substances which contain chiral molecules (mole-cules having structures which cannot be superimposed on their mir-ror images; The concept of chirality is illustrated by a person's righthand, which can be said to be chiral: it is a mirror image of their
Ranjbar and Gill
112 Chem Biol Drug Des 2009; 74: 101–120
left hand, but the hands cannot be superimposed no matter howone orients them relative to each other) (150,151). For example,many substances, particularly biological substances, contains chiralmolecules of opposite senses-that is, the molecules are mirrorimages of each other, in which case they are known as enantio-mers or optical isomers. Each of the enantiomers may have differ-ent properties, in particular, different biological response (e.g.sugars are chiral molecules, and the human body can digest anduse 'right-handed' sugars, but not their left-handed counterparts)(152). Since VCD spectral bands of enantiomers have opposite sign,VCD spectroscopy can allow one to differentiate between enantio-mers, a result which is extremely useful in pharmaceutical andchemical fields. Similarly, one can determine how much of oneenantiomer is present with respect to its twin, by looking at thespectrum of the mixture of enantiomers and comparing it to one ofthe pure enantiomers (since the difference will reflect how muchthe spectrum of one enantiomer attenuates the other) (148,149).
One of VCD-based technique has been improved using IR spectros-copy is FTIR (Fourier transform infrared)-VCD (146). As it was indi-cated, infrared absorption spectroscopy (IR) is the principal toolavailable for the study of molecular vibrations (147). Vibrational cir-cular dichroism (VCD) is the differential absorption of left and RCPinfrared light by vibrating molecules. The two techniques were com-bined to create the spectroscopic measurement technique that willbe described here, FTIR-VCD (153). FTIR-VCD is used to study thesubtle differences in vibrational spectra that result from moleculesthat differ only in their three dimensional geometry. The techniquehas been shown to be particularly useful for the study of the con-formational characteristics of biological macromolecules such asproteins and nucleic acids and smaller molecules like chiral pharma-ceuticals (153).
In summary, the technique can be used in conjunction with calcula-tions (i.e., density functional theory (DFT) calculations) to determinethe absolute configuration (AC) of newly synthesized molecules, andcan be used to determine enantiomeric purity in molecules whoseAC is already known (151). However, if the molecules are enor-mously large, DFT calculations are impractical. Consequently, bio-molecules (e.g. proteins and nucleic acids) cannot be studied. If themolecule is enormously flexible, and the number of populated con-formations is enormously large, the prediction of its VCD spectrumbecomes very time-consuming and less reliable. Therefore, VCD isnot applicable to the determination of ACs. VCD is a practical tech-nique for the majority of medium-sized organic molecules (151).
HPLC- circular dichroismPresently, pharmaceutical, food and biotechnology companies arefacing more and more problems producing enantiomerically pureproducts. The companies have to verify and certify the purity oftheir products to meet the regulations that are getting more andmore restrictive every day. A large investment is necessary for com-panies to build commercial-scale production processes for opticallypure pharmaceuticals and intermediates. These processes are gen-erally based on various methods such as catalytic asymmetric syn-thesis, biocatalytic resolution, diastereomeric crystallization,enantioselective absorption or combinations of these methods (154).
These processes must include facilities to verify and certify theoptical purity of the intermediate and end products or of theirmetabolites at the laboratory level. For three last decades, HPLChas been the most preferred separation method in these industries(155). Chiral HPLC, both for analytical and preparative scale, isprobably the easiest answer to these requests (156). Chiral HPLCseparations have been booming through continues development anda growing number of new chiral stationary phases, by the use ofchiral modifiers in the mobile phase or by precolumn derivatizationwith chiral reagents. As well-known enantiomers have the samechemical and physical properties and the only way to discriminateand quantify is their interactions with polarized light, so chiropticalHPLC detectors are the logical complement to any chiral separation(157,158). The tandem combination of chiral and mass-sensitivedetectors is very valuable when chromatographic separation canonly be partially achieved. This is probably the main appeal of mod-ern chiral HPLC detectors: the possibility to reliably quantify enan-tiomeric purity without separation is indeed a dramatic advantage.So while these detectors may well be used with chiral columns toverify elution order or to measure (in circular dichroism) the spectraof the compounds, the main interest is to quantify optical puritywhen using non-chiral chromatographic conditions (159). The capa-bilities have been applied in several studies (160,161). For instance,Gergely and colleagues have reported the application of HPLC-CDinstrument could provide the selective detection of chiral com-pounds, and subsequently it allowed the employment of high detec-tion wavelengths, presenting more selective detection with minimalbackground noise (161).
Many important progresses have been achieved in the last fewyears and various chiral detectors are now commercially available.Jasco has pioneered this field and is today offering chiral detectorsbased on circular dichroism (e.g. Jasco model OR-2090 Chiral detec-tor; http://www.jasco.co.uk/chiral.asp), which has the unique advan-tage to provide two different signals (CD and UV) simultaneously,the first proportional to the optical activity and the second relatedto the mass or amount of the sample compound (162). In additionto dedicated detectors also a conventional CD, equipped with aproper flow cell, can be profitably used for the application, provid-ing chiral and mass information, simultaneously (162).
Stopped-flow circular dichroismCombination of CD spectroscopies with high mixing speed stopped-flow devices is a well-known technique for fast kinetic measure-ments (12,163,164). Apart from obvious applications in the organicchemistry field, much interest is now going toward protein foldinganalyses. For example, Clarcke et al. have shown that stopped-flowsynchrotron CD can give outstanding information on the kinetics ofsecondary structure formation. They demonstrated a-helix initiationin peptides is at least 105 times slower than expected and long a-helices can fold with an overshoot in helix content (165).
These measurements may be tasking because of multiple shotsaccumulation may be necessary to extract a valuable result (166). Inaddition to CD, an instrument equipped with a suitable stopped-flow cell may become the proper optical bench to collect simulta-neously absorption and fluorescence data (167).
CD Spectroscopies and Applications
Chem Biol Drug Des 2009; 74: 101–120 113
Proper integration between cell and spectrometer is the first prere-quisite, but it is also essential to rely on suitable software to con-trol at the same time both the units. More advanced stopped-flowcells feature today syringes (2, 3 or 4) controlled by stepping-motors, and the possibility to exchange easily the observation cellfor different experiments. However, main application of stopped-flow CD is protein folding (166,167).
Synchrotron radiation circular dichroismSynchrotron radiation circular dichroism is an emerging techniquewhich offers significant improvements to the well-establishedmethod of conventional circular dichroism spectroscopy (168). Partic-ularly, developments in instrumentation of CD using vacuum-ultraviolet synchrotron radiation circular dichroism (VUV-SRCD) havemade CD a potentially powerful tool in proteomics (169). UsingVUV-SRCD, the spectra can be taken at lower range of wavelengthsrelative to that of conventional CD-spectroscopies. These types ofmeasurements allow us to elucidate finer details of secondarystructures of proteins and determine all the predicted folds andmotifs in protein secondary structures (170). As a consequence, ittakes advantage of the high light flux available from synchrotronsources over a wide range of wavelengths, which results in highersignal-to-noise ratios and enables the collection of lower wave-length data than possible using xenon arc lamps that are typicallythe illumination source in conventional CDs (171). Therefore consid-erably smaller amounts of protein are required to obtain a spectrumof comparable quality, and smaller differences can be distinguished(172).
Additionally, averaging times, defined as the times taken at eachwavelength to acquire a suitable signal, can be greatly reduced,thereby speeding up the process of obtaining a spectrum. This isadvantageous not only for increasing the rate of data collection(useful for structural genomics projects which seek to examine alarge number of proteins), but ultimately also for increasing thetime resolution of stopped-flow experiments (165).
With SRCD it is possible to collect data <205 nm in almost anysolvent and buffer commonly used in biological studies. Thus, thismethod should provide especially good improvements for assess-ing secondary structure in protein folding and unfolding studies.Although the technological advancements enabling these measure-ments were first demonstrated in two last decades (173), growth ofapplications in structural and functional genomics has been per-formed more recently (172). For example, applications of SRCD insecondary structure analyses (169), monitoring protein folding andkinetics (165), and drug investigation (169) have been introduced(174).
The applications of SRCD will mainly be divided to investigations ofmembrane proteins and in the pharmaceutical industry. Integralmembrane proteins constitute an important class of proteins that isgreatly under-represented in the databases of crystal structures(175). It has been estimated that about one-third of the proteins inthe human genome may be membrane-associated, and at presentnearly 60% of all drug targets are against membrane proteins. Todate, CD studies of membrane proteins have been limited in the
accuracy of their secondary structure determinations because noneof the reference databases currently available include any mem-brane proteins, even though it is obvious that such proteins havedifferent spectral characteristics from their soluble ones (176–178).Particularly, with its increased sensitivity and the potential for auto-mation of data collection, SRCD could provide a regular assay formonitoring drug–target interactions (179). Additionally, SRCD is cur-rently being used as a method for examining integrity of proteinfolding, and may assume an even greater role as more proteins areexpressed in high yields as inclusion bodies, requiring refolding toregain their native structures. Indeed, SRCD could find a use as astandard reference method for assays of fidelity of folded products(175).
In summary, SRCD extends the measurements possible with conven-tional CD instruments, providing much higher information contentand the ability to examine biological samples under a richer varietyof conditions. On the other hand, the availability of the three-dimensional crystal structure of a protein causally associated with adisease is very valuable in understanding the molecular bases ofthe disease and in aiding the process of rational drug design fordevelopment of pharmaceuticals to treat the disease (180). Knowl-edge of how the native protein differs from the mutant protein isespecially important for this process, although it is not always pos-sible to obtain structures for the mutant proteins, perhaps due todifferences in solubility or stability or other characteristics neces-sary for producing crystals. In this case, SRCD can be used to com-pare the native and mutant proteins in solution, and in combinationwith the native protein crystal structure and other biophysics andbioinformatics studies, provide information on the changes associ-ated with the mutant that produces the diseased state (181).
Conclusions
Circular dichroism is a powerful technique for evaluating the confor-mation of polypeptides and proteins. It is now mature and can beused to tackle more complex problems than those given by thestudy of small chiral molecules. CD is now routinely used to studybiological macromolecules (i.e., proteins, nucleic acids, etc.) andalso provides useful structural information. Additionally, recentadvances have made it possible to improve the time resolution ofnatural and magnetically induced CD spectral measurements fromthe millisecond to nanosecond and picosecond time regimes (182).
One of the goals of systems biology is to discover new emergentproperties that may arise from the systemic view used by this disci-pline in order to understand better the entirety of processes thathappen in a biological system (183). Hence, CD techniques wouldbe useful to provide new information about the structural dynamicsand electronic states of reaction intermediates (182).
As an analytical instrument, the technology can determine changesin secondary structure in a qualitative and even semi-quantitativefashion. Quantitative analysis of CD spectra for the amount of vari-ous secondary structural features is possible, but, as with anyassay, the accuracy and proper interpretation of the results dependson an accurate understanding of the procedure.
Ranjbar and Gill
114 Chem Biol Drug Des 2009; 74: 101–120
Since 1970s there have been developed various types of circulardichroism, which their using could improve the structural analysesof a wide range of asymmetric and symmetric substances. On theother hand, from the theoretical view, in the last decades consider-able progress has been made in calculating the optical rotation andCD spectra of macromolecules. The extension to larger systemsseems highly desirable and should allow the obtainment of precisestructural information for macromolecular systems. There are state-of-the-art CD-techniques may have current and future commercialapplications in synchrotron end-station design, microfluidics, drugdiscovery, pharmacology and structural biology.
In conclusion, with the easy availability of a wide range of empiri-cal algorithms for secondary structure calculations, new referencedatabases and other data analysis tools, CD-based techniquesshould prove to be even more valuable tools in structural biologyover the next decades than CD has been in the past 40 or moreyears since it was first used to estimate biomolecular structures.
Acknowledgement
The present study was partly supported by Tarbiat modares Univer-sity and Iranian Nanotechnology Initiative Council (INIC). We arealso grateful to Dr. Yaghoub Fathollahi for editing of the manu-script.
References
1. Hammes G.G. (2005) Spectroscopy for the Biological Sciences.New York, USA: John Wiley & Sons, Inc.
2. Berova N., Nakanishi K., Woody R.W. (2000) Circular Dichroism:Principles and Applications, 2nd edn. New York, USA: Wiley-VCH.
3. Fasman G.D. (1996) Circular Dichroism and the ConformationalAnalysis of Biomolecules. New York, USA: Plenum PublishingCorp.
4. Barrow C.J., Yasuda A., Kenny P.T., Zagorski M.G. (1992) Solu-tion conformations and aggregational properties of syntheticamyloid beta-peptides of Alzheimer's disease. Analysis of circu-lar dichroism spectra. J Mol Biol;225:1075–1093.
5. Hope J., Shearman M.S., Baxter H.C., Chong A., Kelly S.M.,Price N.C. (1996) Cytotoxicity of prion protein peptide (PrP106-126) differs in mechanism from the cytotoxic activity of theAlzheimer's disease amyloid peptide, Ah 25–35. Neurodegener-ation;5:1–11.
6. Whitmore L., Wallace B.A. (2008) Protein secondary structureanalyses from circular dichroism spectroscopy: methods andreference databases. Biopolymers;89:392–400.
7. Velluz L., Legrand M., Grosjean M. (1965) Optical CircularDichroism: Principles, Measurements and Applications. NewYork, NY: Academic Press.
9. Hennessey J.P., Johnson W.C. (1981) Information content in thecircular dichroism of proteins. Biochemistry;20:1085–1094.
10. Manavalan P., Johnson W.C. Jr (1987) Variable selectionmethod improves the prediction of protein secondary structurefrom circular dichroism spectra. Anal Biochem;167:76–85.
11. Kelly S.M., Price N.C. (1997) The application of circular dichro-ism to studies of protein folding and unfolding. Biochim Bio-phys Acta;1338:161–185.
12. Kelly S.M., Jess T.J., Price N.C. (2005) How to study proteinsby circular dichroism. Biochim Biophys Acta;1751:119–139.
13. Kelly S.M., Price N.C. (2000) The use of circular dichroism inthe investigation of protein structure and function. Curr ProteinPept Sci;1:349–384.
14. Krell T., Horsburgh M.J., Cooper A., Kelly S.M., Coggins J.R.(1996) Localization of the active site of type II dehydroquinas-es. Identification of a common arginine-containing motif in thetwo classes of dehydroquinases. J Biol Chem;271:24492–24497.
16. Kh. Tafreshi N., Hosseinkhani S., Sadeghizadeh M., SadeghiM., Ranjbar B., Naderi-Manesh H. (2007) The influence ofinsertion of a critical residue (Arg356) in structure and biolumi-nescence spectra of firefly luciferase. J Biol Chem;282:8641–8647.
17. Protasevich I., Ranjbar B., Lobachov V., Makarov A., Gilli A.,Briand C. (1997) Conformation and thermal denaturation ofapocalmodulin: role of electrostatic mutations. Biochemis-try;36:2017–2024.
18. Hadizadeh Shirazy N., Ranjbar B., Hosseinkhani S., Khalifeh K.,Riahi Madvar A., Naderi-Manesh H. (2007) Critical role ofGlu175 on stability and folding of bacterial luciferase: stopped-flow fluorescence study. J Biochem Mol Biol;40:453–458.
19. Hassan Sajedi R., Naderi-Manesh H., Khajeh K., Ranjbar B.,Ghaemi N., Naderi-Manesh M. (2004) Purification, characteriza-tion, and structural investigation of a new moderately thermo-philic and partially calcium-independent extracellular a-amylasefrom Bacillus sp. TM1. Appl Biochem Biotechnol;119:41–50.
20. Hassan Sajedi R., Taghdir M., Naderi-Manesh H., Khajeh K.,Ranjbar B. (2007) Nucleotide sequence, structural investigationand homology modeling studies of a Ca2+-independent a-amy-lase with acidic pH-profile. J Biochem Mol Biol;40:315–324.
21. Riahi Madvar A., Hosseinkhani S., Khajeh K., Ranjbar B., Aso-odeh A. (2005) Implication of a critical residue (Glu175) instructure and function of bacterial luciferase. FEBSLett;579:4701–4706.
22. Hassani L., Ranjbar B., Khajeh K., Naderi-Manesh H., Naderi-Manesh M., Sadeghi M. (2006) Horseradish peroxidasethermostabilization: the combinatorial effects of the surfacemodification and the polyols. Enz Microbial Technol;38:118–125.
23. Schulga A., Kurbanov F., Kirpichinikov M., Protasevich I., Lobac-hov V., Ranjbar B., Chekhov V., Polyakov K., Engelborghs Y.,Makarov A. (1998) Comparative study of binase and barnase:experience in chimeric ribonuclease. Protein Eng;11:775–782.
24. Maroufi B., Ranjbar B., Khajeh K., Naderi-Manesh H., YaghoubiH. (2008) Structural studies of hen egg-white lysozyme dimer:comparison with monomer. Biochim Biophys Acta;1784:1043–1049.
CD Spectroscopies and Applications
Chem Biol Drug Des 2009; 74: 101–120 115
25. Mattice W.L., Riser J.M., Clark D.S. (1976) Conformationalproperties of the complexes formed by proteins and sodiumdodecyl sulfate. Biochemistry;15:4264–4272.
26. Pande V.S., Rokhsar D.S. (1998) Is the molten globule a thirdphase of proteins? Proc Natl Acad Sci USA;95:1490–1494.
27. Kuwajima K. (2002) The role of the molten globule state inprotein folding: the search for a universal view of folding. ProcInd Natl Sci Acad;68:333–340.
28. Alikhajeh J., Khajeh K., Naderi-Manesh M., Ranjbar B., SajediR.H., Naderi-Manesh H. (2007) Kinetic analysis, structuralstudies and prediction of pKa values of Bacillus KR-8104a-amylase: The determinants of pH-activity profile. Enz MicrobTechnol;41:337–345.
29. Mossavarali S., Hosseinkhani S., Ranjbar B., Miroliaei M.(2006) Stepwise modification of lysine residues of glucoseoxidase with citraconic anhydride. Int J Biol Macromol;39:192–196.
30. Asghari S.M., Khajeh K., Moradian F., Ranjbar B., Naderi-Man-esh H. (2004) Acid-induced conformational changes in Bacillusamyloliquefaciens a-amylase: Appearance of a molten globulelike state. Enz Microb Technol;35:51–57.
31. Hosseinkhani S., Ranjbar B., Naderi-Manesh H., Nemat-Gorga-nia M. (2004) Chemical modification of glucose oxidase: possi-ble formation of molten globule-like intermediate structure.FEBS Lett;561:213–216.
32. Arai M., Kuwajima K. (2000) Role of the molten globule statein protein folding. Adv Protein Chem;53:209–282.
33. Shokri M.M., Khajeh K., Alikhajeh J., Asoodeh A., Ranjbar B.,Hosseinkhani S., Sadeghi M. (2006) Comparison of the moltenglobule states of thermophilic and mesophilic a-amylases. Bio-phys Chem;122:58–65.
34. Moosavi-Movahedi A.A., Chamani J., Goto Y., Hakimelahi G.H.(2003) Formation of the molten globule-like state of cytochromec induced by n-alkyl sulfates at low concentrations. J Bio-chem;133:93–102.
35. Boren K., Andersson P., Larsson M., Carlsson U. (1999) Charac-terization of a molten globule state of bovine carbonic anhydr-ase III: loss of asymmetrical environment of the aromaticresidues has a profound effect on both the near- and far-UVCD spectrum. Biochim Biophys Acta;1430:111–118.
36. Ptitsyn O.B. (1992) The molten globule state. In: Creighton T.E.,editor. Protein Folding. New York: Freeman;pp. 243–300.
37. Langel �. (2007) Handbook of Cell-Penetrating Peptides, 2ndedn. USA: Taylor & Francis Group, LLC.
38. Hallbrink M., Floren A., Elmquist A., Pooga M., Bartfai T., Lan-gel U. (2001) Cargo delivery kinetics of cell-penetrating pep-tides. Biochim Biophys Acta;1515:101–109.
39. Pooga M., Hallbrink M., Zorko M., Langel U. (1998) Cell pene-tration by transportan. FASEB J;12:67–77.
40. Morris M.C., Depollier J., Mery J., Heitz F., Divita G. (2001) Apeptide carrier for the delivery of biologically active proteinsinto mammalian cells. Nat Biotechnol;19:1173–1176.
41. Morris M.C., Chaloin L., Mery J., Heitz F., Divita G. (1999) Anovel potent strategy for gene delivery using a single peptidevector as a carrier. Nucleic Acids Res;27:3510–3517.
42. Morris M.C., Vidal P., Chaloin L., Heitz F., Divita G. (1997) Anew peptide vector for efficient delivery of oligonucleotidesinto mammalian cells. Nucleic Acids Res;25:2730–2736.
44. Eriksson M., Nielsen P.E., Good L. (2002) Cell permeabilizationand uptake of antisense peptide-peptide nucleic acid (PNA)into Escherichia coli. J Biol Chem;277:7144–7147.
45. Koch A.M., Reynolds F., Kircher M.F., Merkle H.P., WeisslederR., Josephson L. (2003) Uptake and metabolism of a dual fluo-rochrome Tat-nanoparticle in HeLa cells. BioconjugChem;14:1115–1121.
46. Tseng Y.L., Liu J.J., Hong R.L. (2002) Translocation of liposomesinto cancer cells by cell penetrating peptides penetratinand tat: a kinetic and efficacy study. Mol Pharmacol;62:864–872.
47. Herbig M.E., Weller K.M., Merkle H.P. (2007) Reviewing bio-physical and cell biological methodologies in cell-penetratingpeptide (CPP) research. Crit Rev Ther Drug Car Sys;24:203–255.
48. Pujals S., Giralt E. (2008) Proline-rich, amphipathic cell-penetrating peptides. Adv Drug Deliv Rev;60:473–484.
49. Rabanal F., Ludevid M.D., Pons M., Giralt E. (1993) CD of pro-line-rich polypeptides: application to the study of the repetitivedomain of maize glutelin-2. Biopolymers;33:1019–1028.
50. Berlose J.P., Convert O., Derossi D., Brunissen A., Chassaing G.(1996) Conformational and associative behaviours of the thirdhelix of antennapedia homeodomain in membrane-mimeticenvironments. Eur J Biochem;242:372–386.
51. Magzoub M., Eriksson L.E., Graslund A. (2002) Conformationalstates of the cell-penetrating peptide penetratin when interact-ing with phospholipid vesicles: effects of surface charge andpeptide concentration. Biochim Biophys Acta;1563:53–63.
52. Thoren P.E., Persson D., Esbjorner E.K., Goksor M., Lincoln P.,Norden B. (2004) Membrane binding and translocation of cell-penetrating peptides. Biochemistry;43:3471–3489.
53. Magzoub M., Eriksson L.E., Graslund A. (2003) Comparison ofthe interaction, positioning, structure induction and membraneperturbation of cell-penetrating peptides and non-translocatingvariants with phospholipid vesicles. Biophys Chem;103:271–288.
54. Persson D., Thoren P.E., Lincoln P., Norden B. (2004) Vesiclemembrane interactions of penetratin analogues. Biochemis-try;43:11045–11055.
55. Lindberg M., Jarvet J., Langel U., Graslund A. (2001) Secondarystructure and position of the cell-penetrating peptide transpor-tan in SDS micelles as determined by NMR. Biochemis-try;40:3141–3149.
56. Barany-Wallje E., Andersson A., Graslund A., Maler L. (2004)NMR solution structure and position of transportan in neutralphospholipid bicelles. FEBS Lett;567:265–269.
57. Van Holde K.E., Johnson W.C., Ho P.S. (1998) Principle of PhysicalBiochemistry. New Jersey, USA: Prentice-Hall Inc., p. 418–451.
58. Warshaw M.M., Cantor C.R. (1970) Oligonucleotide interac-tions. IV. Conformational differences between deoxy- and ribod-inucleoside phosphates. Biopolymers;9:1079–1103.
59. Bloomfield V.A., Crothers D.M., Tinoco I. Jr, with contributionfrom, Hearst J.E., Wemmer D.E., Kollman P.A., Turner D.H.(2000) Nucleic Acids: Structures, Properties, and Functions.Sausalito, California, USA: University Science Books.
Ranjbar and Gill
116 Chem Biol Drug Des 2009; 74: 101–120
60. Bush C.A., Tinoco I. Jr (1967) Calculation of the optical rotatorydispersion of dinucleoside phosphates. Appendix. Derivation ofthe ORD and CD curves from absorption and rotationalstrengths. J Mol Biol;23:601–614.
61. Gray D.M., Liu J.-J., Ratliff R.L., Allen F.S. (1981) Sequencedependence of the circular dichroism of synthetic double-stranded RNAs. Biopolymers;20:1337–1382.
62. Sprecher C.A., Baase W.A., Johnson W.C. Jr (1979)Conformation and circular dichroism of DNA. Biopoly-mers;18:1009–1019.
63. Gray D.M., Taylor T.N., Lang D. (1978) Dehydrated circularDNA: Circular dichroism of. molecules in ethanolic solutions.Biopolymers;17:145–157.
64. Riazance J.H., Baase W.A., Johnson W.C. Jr, Hall K., CNZ P.,Tinoco I. Jr (1985) Evidence for Z-Form RNA by vacuum UV-circular dichroism. Nucleic Acids Res;13:4983–4989.
65. Gray D.M., Johnson K.H., Vaughan M.E., Morris P.A., Suther-land J.C., Ratliff R.L. (1990) The vacuum VCD bands of repeat-ing DNA sequences are dependent on sequence andconformation. Biopolymers;29:317–323.
66. Williams A.L. Jr, Cheong C., Tinoco I. Jr, Clark L.B. (1986)Vacuum ultraviolet circular dichroism as an indicator of heli-cal handedness in nucleic acids. Nucleic Acids Res;14:6649–6659.
67. Nelson R.G., Johnson W.C.. Jr (1970) Conformation of DNA inethylene glycol. Biochem Biophys Res Commun;41:211–216.
68. Gennis R.B., Cantor C.R. (1972) Optical studies of a conforma-tional change in DNA before melting. J Mol Biol;65:381–399.
69. Studdert D.S., Patroni M., Davis R.C. (1972) Circular dichroismof DNA: temperature and salt dependence. Biopolymers (Pept.Sci.);11:761–779.
70. Ivanov V.I., Minchenkova L.E., Schyolkina A.K., Poletayev A.I.(1973) Different conformations of double-stranded nucleic acidin solution as revealed by circular dichroism. Biopolymers (Pept.Sci.);12:89–110.
71. Ivanov V.I., Minchenkova L.E., Minyat E.E., Frank-KamonetshiiM.D., Schyolkina A.K. (1974) The B to A transition of DNA insolution. J Mol Biol;87:817–833.
72. Girod J.C., Johnson W.C. Jr, Huntington S.K., Maestre M.F.(1973) Conformation of deoxyribonucleic acid in alcohol solu-tions. Biochemistry;12:5092–5096.
73. Johnson W.C. Jr, Girod J.C. (1974) A novel denaturation ofDNA. Biochim Biophys Acta;353:193–199.
74. Hanlon S., Brudno S., Wu T.T., Wolf B. (1975) Structural transi-tions of deoxyribonucleic acid in aqueous electrolyte solutions.I. Reference spectra of conformational limits. Biochemis-try;14:1648–1660.
75. Maestre M.F., Gray D.M., Cook R.B. (1971) Magnetic circulardichroism study on synthetic polynucleotides, bacteriophagestructure, and DNA's. Biopolymers (Pept. Sci.);10:2537–2553.
76. Dorman B.P., Maestre M.F. (1973) Experimental differentiallight-scattering correction to the circular dichroism of bacterio-phage T2. Proc Natl Acad Sci USA;70:255–259.
77. Baase W.A., Johnson W.C.. Jr (1979) Circular dichroism andDNA secondary structure. Nucleic Acids Res;6:797–814.
78. Shih T.Y., Fasman D.G. (1970) Conformation of deoxyribonucleicacid in chromatin: A circular dichroism study. J MolBiol;52:125–129.
79. Hanlon S., Johnson R.S., Wolf G., Chan A. (1972) Mixed con-formations of deoxyribonucleic acid in chromatin: a preliminaryreport. Proc Natl Acad Sci USA;69:3263–3267.
80. Lawrence J.-J., Chan D.C.F., Piette L.H. (1976) Conformationalstate of DNA in chromatin subunits. Circular dichroism, melt-ing, and ethidium bromide binding analysis. Nucleic AcidsRes;3:2879–2893.
81. Rill R., Van Holde K.E. (1973) Properties of nuclease-resistantfragments of calf thymus chromatin. J Biol Chem;248:1080–1083.
82. Asadi M., Safaei E., Ranjbar B., Hasani L. (2005) A study onthe binding of two water-soluble tetrapyridinoporphyrazinatocopper(II) complexes to DNA. J Mol Struct;754:116–123.
83. Asadi M., Safaei E., Ranjbar B., Hasani L. (2004) Thermody-namic and spectroscopic study on the binding of cationic ZD(II)and Co(II) tetrapyridinoporphyrazines to calf thymus DNA: Therole of the central metal in binding parameters. New JChem;28:1227–1234.
84. Fiel R.J., Datta-Gupta N., Mark E.H., Howard J.C. (1981) Induc-tion of DNA damage by porphyrin photosensitizers. CancerRes;41:3543–3545.
85. Prasueth D., Gaudemer A., Verlhac J., Kraljic I., Sissoeff I.,Guille E. (1986) Photocleavage of DNA in presence of syntheticwater-soluble porphyrins. Photochem Photobiol;44:717–724.
86. Magda D., Wright M., Miller R.A., Sessler J.L., Sansom P.I.(1995) Sequence-Specific Photocleavage of DNA by anExpanded Porphyrin with Irradiation above 700 nm. J Am ChemSoc;117:3629–3630.
87. Dixon D.W., Schinazi R., Marzilli L.G. (1990) Porphyrins asagents against the human immunodeficiency virus. Ann NYAcad Sci;616:511–513.
88. Fornasiero D., Kurucsev T. (1981) Circular dichroism spectra andthe interaction between acridine dyes and deoxyribonucleicacid. J Phys Chem;85:613–618.
89. Safaei E., Ranjbar B., Hasani L. (2007) A study of the assemblyof Fe(II) and dual binding of Ni(II) porphyrazines on CT-DNA. JPorphyrins Phthalocyanines;11:805–814.
90. Bathaie S.Z., Bolhasani A., Hoshyar R., Ranjbar B., Sabouni F.,Moosavi-Movahedi A.-A. (2007) Interaction of saffron carote-noids as anticancer compounds with ctDNA, oligo (dG.dC)15,and oligo (dA.dT)15. DNA Cell Biol;26:533–540.
91. Liu H., Webster T.J. (2007) Nanomedicine for implants: Areview of studies and necessary experimental tools. Biomateri-als;28:354–369.
92. Tziampazis E., Kohn J., Moghe P.V. (2000) PEG-variant biomate-rials as selectively adhesive protein templates model surfacesfor controlled cell adhesion and migration. Biomateri-als;21:511–520.
93. Tanaka M., Motomura T., Kawada M., Anzai T., Kasori Y., Shi-roya T., Shimura K., Onishi M., Mochizuki A. (2000) Blood com-patible aspects of poly (2-methoxyethylacrylate) (PMEA)relationship between protein adsorption and platelet adhesionon PMEA surface. Biomaterials;21:1471–1481.
94. Ghosh P.S., Han G., Erdogan B., Rosado O., Krovi S.A., RotelloV.M. (2007) Nanoparticles featuring amino acid-functionalizedside chains as DNA receptors. Chem Biol Drug Design;70:13–18.
CD Spectroscopies and Applications
Chem Biol Drug Des 2009; 74: 101–120 117
95. Goodman C.M., Chari N.S., Han G., Hong R., Ghosh P., RotelloV.M. (2006) DNA-binding by functionalized gold nanoparticles:mechanism and structural requirements. Chem Biol DrugDesign;67:297–304.
96. Goodman C.M., Rotello V.M. (2004) Biomacromolecule surfacerecognition using nanoparticles. Mini Rev Org Chem;1:103–114.
97. Sandhu K.K., McIntosh C.M., Simard J.M., Smith S.W., RotelloV.M. (2002) Gold nanoparticle-mediated transfection of mam-malian cells. Bioconjug Chem;13:3–6.
98. Kikuta E., Murata M., Katsube N., Koike T., Kimura E. (1999)Novel recognition of thymine base in double-stranded DNA byzinc(II)-macrocyclic tetraamine complexes appended with aro-matic groups. J Am Chem Soc;121:5426–5436.
99. Hermann T., Patel D.J. (2000) Biochemistry - adaptive recogni-tion by nucleic acid aptamers. Science;287:820–825.
100. Zhang X.G., Teng D.Y., Wu Z.M., Wang X., Wang Z., Yu D.M.,Li C.X. (2008) PEG-grafted chitosan nanoparticles as an inject-able carrier for sustained protein release. J Mater Sci: MaterMed;19:3525–3533.
101. Wang X.H., Goh S.H.Z.H., Lee S.Y., Wu C. (1999) Light-scattering characterization of fullerene-containing poly(alkylmethacrylate)s in THF. Macromolecules;32:2786–2788.
102. Singh J., Dutta P.K. (2008) Spectroscopic and conformationalstudy of chitosan acid salts. J Polym Res;8:9221–9223.
104. Caminade A.-M., Laurent R., Majoral J.-P. (2005) Characteriza-tion of dendrimers. Adv Drug Deliv Rev;57:2130–2146.
105. Sadeghizadeh M., Ranjbar B., Damaghi M., Khaki L., SarboloukiM.N., Najafi F., Parsaee S., Ziaee A.-A., Massumi M., LubitzW., Kudela P., Paukner S., Karami A. (2008) Dendrosomes asnovel gene porters-III. J Chem Technol Biotechnol;83:912–920.
106. Xu Y., Szoka F.C.. Jr (1996) Mechanism of DNA release fromcationic liposome–DNA complexes used in cell transfection.Biochemistry;35:5616–5623.
107. Chaumette J.L., Laufersweiler M.J., Parquette J.R. (1998) Syn-thesis and chiroptical properties of dendrimers elaborated froma chiral, nonracemic central core. J Org Chem;63:9399–9405.
108. Yevdokimov Y.M., Salyanov V.I. (2003) Liquid crystalline disper-sions of complexes formed by chitosan with double-strandednucleic acids. Liq Cryst;30:1057–1074.
109. Chen Y.M., Chen C.F., Xi F. (1998) Chiral dendrimers with axialchirality. Chirality;10:661–666.
110. Rosini C., Superchi S., Peerlings H.W.I., Meijer E.W. (2000) E-nantiopure dendrimers derived from the 1,1V-binaphthylmoiety: a correlation between chiroptical properties and confor-mation of the 1,1V-binaphthyl template. Eur J OrgChem;2000:61–71.
111. Murer P., Seebach D. (1995) Synthesis and properties of firstto third generation dendrimers with doubly and triply branchedchiral building blocks. Angew Chem Int Ed Engl;34:2116–2119.
112. Cicchi S., Goti A., Rosini C., Brandi A. (1998) Enantiomericallypure dendrimers based on a trans-3,4-dihydroxypyrrolidine. EurJ Org Chem;11:2591–2597.
113. Dennig J., Duncan E. (2002) Gene transfer into eukaryotic cellsusing activated polyamidiamine dendrimers. J Biotechnol;90:339–347.
114. Budker V.G., Slattum P.M., Monahan S.D., Wolff J.A. (2002)Entrapment and condensation of DNA in neutral reversemicelles. Biophys J;82:1570–1579.
115. Kudsiova L., Arafiena C., Lawrence M.J. (2008) Characterizationof chitosan-coated vesicles encapsulating DNA suitable forgene delivery. J. Pharma Sci;97:3981–3997.
116. Gu Q., Cheng C., Gonela R., Suryanarayanan S., Anabathula S.,Dai K., Haynie D.T. (2006) DNA nanowire fabrication. Nano-technol;17:R14–R25.
117. Yogeswaran U., Chen S. (2008) A review on the electrochemi-cal sensors and biosensors composed of nanowires as sensingmaterial. Sensors;8:290–313.
118. Li Y., Qian F., Xiang J., Lieber C.M. (2006) Nanowire electronicand optoelectronic devices. Mater Today;9:18–27.
119. Braun E., Eichen Y., Sivan U., Ben-Yoseph G. (1998) DNA-tem-plated assembly and electrode attachment of a conducting sil-ver wire. Nature;391:775–778.
120. Kinsella J.M., Ivanisevic A. (2007) DNA-templated magneticnanowires with different compositions: fabrication and analy-sis. Langmuir;23:3886–3890.
121. Kinsella J.M., Ivanisevic A. (2005) Enzymatic clipping of DNAwires coated with magnetic nanoparticles. J Am ChemSoc;127:3276–3277.
122. Kinsella J.M., Shalaev M.W., Ivanisevic A. (2007) Ligation ofnanoparticle coated DNA cleaved with restriction enzymes.Chem Mater;19:3586–3588.
123. Jaganathana H., Ivanisevic A. (2008) Circular dichroism studyof enzymatic manipulation on magnetic and metallic DNA tem-plate nanowires. Colloids Surf B Biointerf;67:279–283.
124. Mason W.R. (2007) A Practical Guide to Magnetic CircularDichroism Spectroscopy. New York, USA: John Wiley & Sons,Inc.
125. Ball D.W. (1991) An introduction to magnetic circular dichroismspectroscopy; general theory and applications. Spectros-copy;6:18–24.
126. Funk T., Deb A., George S.J., Wang H., Cramer S.P. (2005) X-ray magnetic circular dichroism-a high energy probe of mag-netic properties. Coord Chem Rev;249:3–30.
127. Johnson M.K. (2000) CD and MCD spectroscopy. In: Que L. Jr,editor. Physical Methods in Bioinorganic Chemistry: Spectros-copy and Magnetism. Sausalito, California: University ScienceBooks;p. 233–285.
128. Johnson M.K., Robinson A.E., Thomson A.J. (1982) Low-temperature magnetic circular dichroism of iron-sulfur proteins.In: Spiro T.G., editor. Iron-Sulfur Proteins. New York: Wiley;p.367–406.
129. Dawson J.H., Dooley D.M. (1989) Magnetic circular dichroismspectroscopy of iron porphyrins and heme proteins. In: LeverA.B.P., Gray H.B., editors. Iron Porphyrins, Part 3. New York:VCH Publishers;p. 1–92.
132. Solomon E.I., Pavel E.G., Loeb K.E., Campochiaro C. (1995)Magnetic circular dichroism spectroscopy as a probe of thegeometric and electronic structure of non-heme ferrousenzymes. Coord Chem Rev;144:369–460.
133. Cramer S.P. (2003) ACS symposium series 858 paramagneticresonance of metallobiomolecules. 358–364.
134. Tam C.N., Bour P., Keiderling T.A. (1996) Observations ofrotational magnetic moments in the ground and someexcited vibrational
Pstates of C2H2, C2HD, and C2D2 by
magnetic vibrational circular dichroism. J Chem Phys;104:1813–1824.
137. Tran C.D., Fendler J.H. (1979) Stereoselective energy transferinduced by circularly polarized light. J Am ChemSoc;101:1285–1288.
138. Harada N., Nakanishi K. (1983) Circular Dichroic Spectroscopy-Exciton Coupling in Organic Stereochemistry. Mill Valley, CA:University Science Books.
139. Dong J.G., Wada A., Takahashi T., Nakanishi K., Berova N.(1997) Sensitivity enhancement of exciton coupling by fluores-cence detected circular dichroism (FDCD). J Am ChemSoc;119:12024–12025.
140. Tanaka K., Pescitelli G., Nakanishi K., Berova N. (2005) Fluores-cence detected exciton coupled circular dichroism: developmentof new fluorescent reporter groups for structural studies. Mon-atshefte fur Chemie;136:367–395.
141. Ramsay G., Eftink M.R. (1994) A multidimensional spectropho-tometer for monitoring thermal unfolding transitions of macro-molecules. Biophys J;31:516–523.
142. Keiderling T.A. (1990) Vibrational CD: Comparison of Techniquesand Practical Considerations, in Practical Fourier TransformInfrared Spectroscopy. New York, USA: Academic Press;p. 203–284.
143. Eglinton D.G., Johnson M.K., Thomson A.J., Gooding P.E.,Greenwood C. (1980) Near-infrared magnetic and natural circu-lar dichroism of cytochrome c oxidase. Biochem J;191:319–331.
144. Oberg K.A., Ruysschaert J.M., Goormaghtigh E. (2004) The opti-mization of protein secondary structure determination withinfrared and circular dichroism spectra. Eur J Biochem;271:2937–2948.
145. Fujii H., Finnegan M.G., Miki T., Crouse B.R., Kakinuma K.,Johnson M.K. (1995) Spectroscopic identification of the hemeaxial ligation of cytochrome b558 in the NADPH oxidase ofporcine neutrophils. FEBS Lett;377:345–348.
146. Kudo K., Nonokawa D., Li J., Shiraishi S. (2002) Synthesis ofoptically active alicyclic polyimides from a chiral, nonracemicdianhydride. J PolymSci Part A: PolymChem;40:4038–4044.
147. Nafie L.A., Cheng J.C., Stephens P.J. (1975) Vibrational circulardichroism of 2,2,2-trifluoro-1-phenylethanol. J Am ChemSoc;97:3842–3843.
149. Keiderling T.A., Stephens P.J. (1976) Vibrational circular dichro-ism of overtone and combination bands. Chem PhysLett;41:46–48.
150. Keiderling T.A., Stephens P.J. (1977) Vibrational circular dichro-ism of dimethyl tartrate. A coupled oscillator. J Am ChemSoc;99:8061–8062.
151. Stephens P.J., Devlin F.J., Pan J.-J. (2008) The determination ofthe absolute configurations of chiral molecules using vibrationalcircular dichroism (VCD) spectroscopy. Chirality;20:643–663.
152. Chen G.-C., Polavarapu P.L., Weibel S. (1994) New design forFourier transform infrared vibrational circular dichroism spec-trometers. Appl Spectrosc;48:1218–1223.
153. Yoo R.K., Croatto P.V., Wang B., Keiderling T.A. (1991) A methodfor the determination of the zero-path-difference position in afourier transform infrared spectrometer: application to magneticvibrational circular dichroism. Appl Spectrosc;45:231–236.
154. Reetz M.T., Kuhling K.M., Hinrichs H., Deege A. (2000) Circulardichroism as a detection method in the screening of enantiose-lective catalysts. Chirality;12:479–482.
155. Drake A.F., Gould J.M., Mason S.F. (1980) Simultaneousmonitoring of ligh-absorption and optical activity in the liquidchromatography of chiral substance. J Chromatogr;202:239–245.
156. Salvadori P., Rosini C., Bertucci C. (1984) Circular dichroicdetection in the HPLC of chiral molecules: direct determinationof elution orders. J Org Chem;49:5050–5054.
157. Salvadori P., Bertucci C., Rosini C. (1991) Circular dichroismdetection in HPLC. Chirality;3:376–385.
158. Goodall D.M. (1993) Chiral analysis based on polarimetricdetection. Trends Anal Chem;12:177–184.
159. Brandl F., Pustet N., Mannschreck A. (1999) Applications of anovel type of detector for liquid chromatography of chiral com-pounds. Int Lab;29:10C–15C.
160. Gergely A., Zsila F., Horva¢th P., Sz�sz G. (1999) Determinationof absolute configuration of ketamine enantiomers by HPLC-CD-UV technique. Chirality;11:741–744.
161. Gergely A., Sz�sz G., Szentesi A., Gyimesi-Forr�s K., Kçkçsi J.,Szegv�ri D., Veress G. (2006) Evaluation of CD detection in anHPLC system for analysis of DHEA and related steroids. AnalBioanal Chem;384:1506–1510.
162. Bertucci C., Andrisano V., Cavrini V., Castiglioni E. (2000) Reliableassay of extreme enantiomeric purity values by a new circulardichroism based HPLC detection system. Chirality;12:84–92.
163. Khalifeh K., Ranjbar B., Khajeh K., Naderi-Manesh H., SadeghiM., Gharavi S. (2007) A stopped-flow fluorescence study of thenative and modified lysozyme. Biologia;62:258–264.
164. Noppert A., Gast K., Zirwer D., Damaschun G. (1998) Initialhydrophobic collapse is not necessary for folding RNase A.Folding & Design;3:213–221.
165. Clarke D.T., Doig A.J., Stapeley B.J., Jones G.R. (1999) Thealpha-helix folds on a millisecond time scale. Proc Natl AcadSci USA;96:7232–7237.
167. Kuwajima K., Fasman G.D. (1996) Stopped-Flow CD in CircularDichroism and the Conformational Analysis of Biomolecules.New York, USA: Plenum Press.
168. Wallace B.A. (2000) Synchrotron radiation circular-dichroismspectroscopy as a tool for investigating protein structures. JSynchrotron Radiat;7:289–295.
recognition and structural genomics. Curr Opin ChemBiol;5:567–571.
170. Khalifeh K., Ranjbar B. (2005) A novel application of quantumdots as a tool for storage of CD spectra data in proteomics.Med Hypotheses;65:821–822.
173. Sutherland J.C., Desmond E.J., Takacs P.Z. (1980) Versatilespectrometer for experiments using synchrotron radiation atwavelengths greater than 100 nm. Nucl Instr Meth-ods;172:195–199.
174. Wallace B.A., Wien F., Miles A.J., Lees J.G., Hoffmann S.V.,Evans P., Wistowc G.J., Slingsby C. (2004) Biomedical applica-tions of synchrotron radiation circular dichroism spectroscopy:Identification of mutant proteins associated with disease anddevelopment of a reference database for fold motifs. FaradayDiscuss;126:237–243.
175. Cascio M., Wallace B.A. (1994) Red- and blue-shifting in thecircular dichroism spectra of polypeptides due to dipole effects.Protein Pept Lett;1:136–140.
176. Cascio M., Wallace B.A. (1995) Effects of local environment onthe circular dichroism spectra of polypeptides. Anal Bio-chem;227:90–100.
177. Blundell T.L., Mizuguchi K. (2000) Structural genomics: an over-view. Prog Biophys Mol Biology;73:289–295.
178. Rodi D.J., Janes R.W., Sangasnee H.J., Soares A., Holton R.A.,Wallace B.A., Makowski L. (1999) Screening of a library ofphage-displayed peptides identifies human Bcl-2 as a Taxol-binding protein. J Mol Biol;285:197–203.
179. Milesa A.J., Wallace B.A. (2006) Synchrotron radiation circulardichroism spectroscopy of proteins and applications instructural and functional genomics. Chem Soc Rev;35:39–51.
180. Thulstrup P.W., Brask J., Jensen K.J., Larsen E. (2005) Synchro-tron radiation circular dichroism spectroscopy: Applied tometmyoglobin and a 4-a-helix bundle carboprotein. Biopoly-mers;78:46–52.
181. Gekko K., Yonehara R., Sakurada Y., Matsuo K. (2005) Structureanalyses of biomolecules using a synchrotron radiation circulardichroism spectrophotometer. J Elec Spec Rel Phen;144–147:295–297.
182. Lewis J.W., Goldbeck R.A., Kligler D.S. (1992) Time-resolvedcircular dichroism spectroscopy: experiment, theory, and appli-cations to biological systems. J Phys Chem;96:5243–5254.
183. Werner E. (2007) All systems go. Nature;446:493–494.