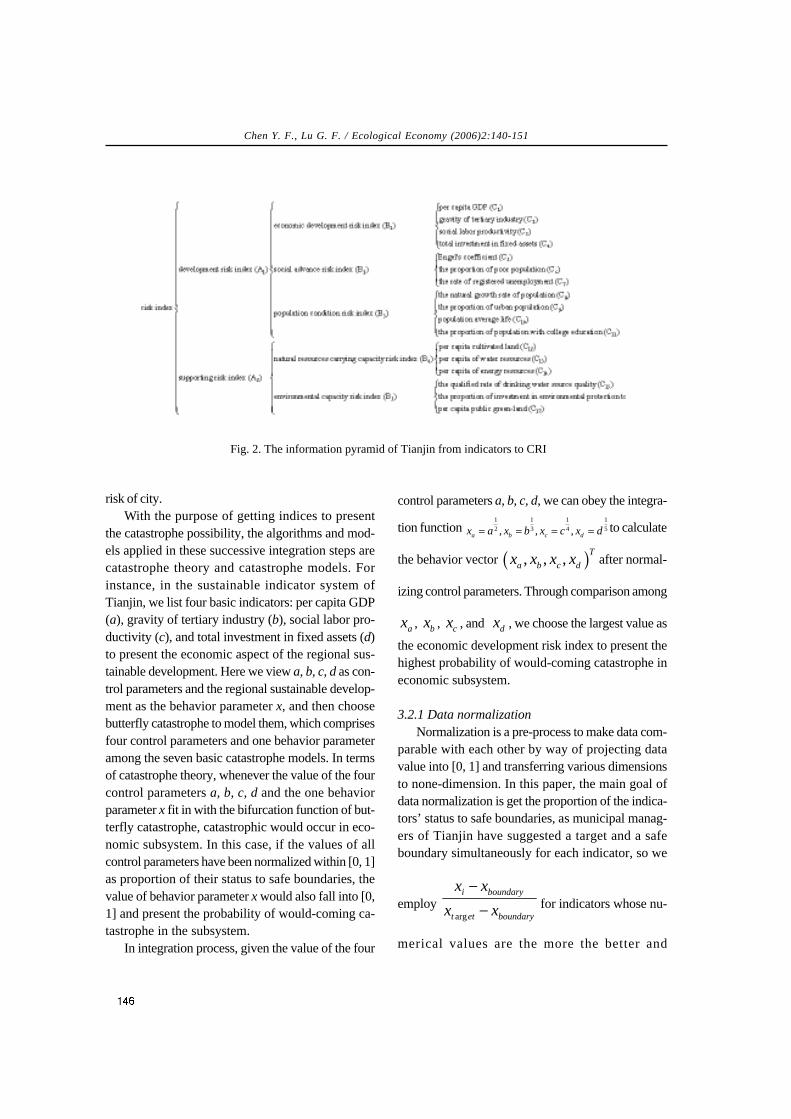
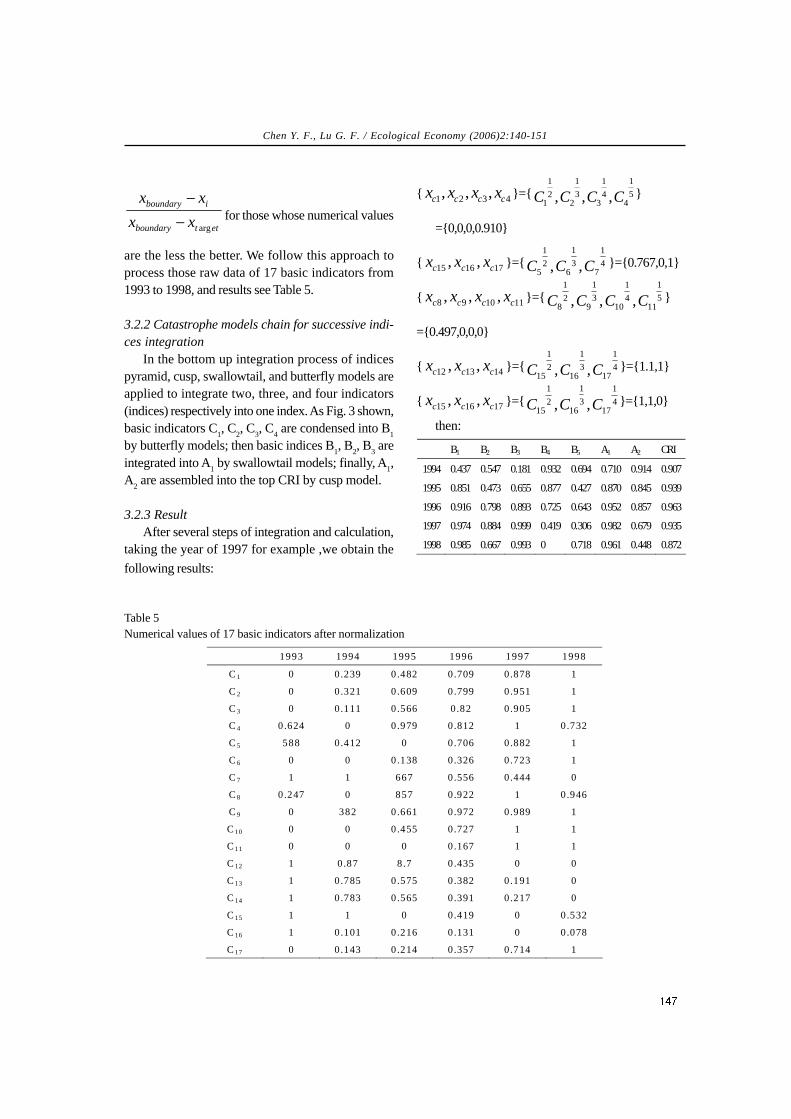
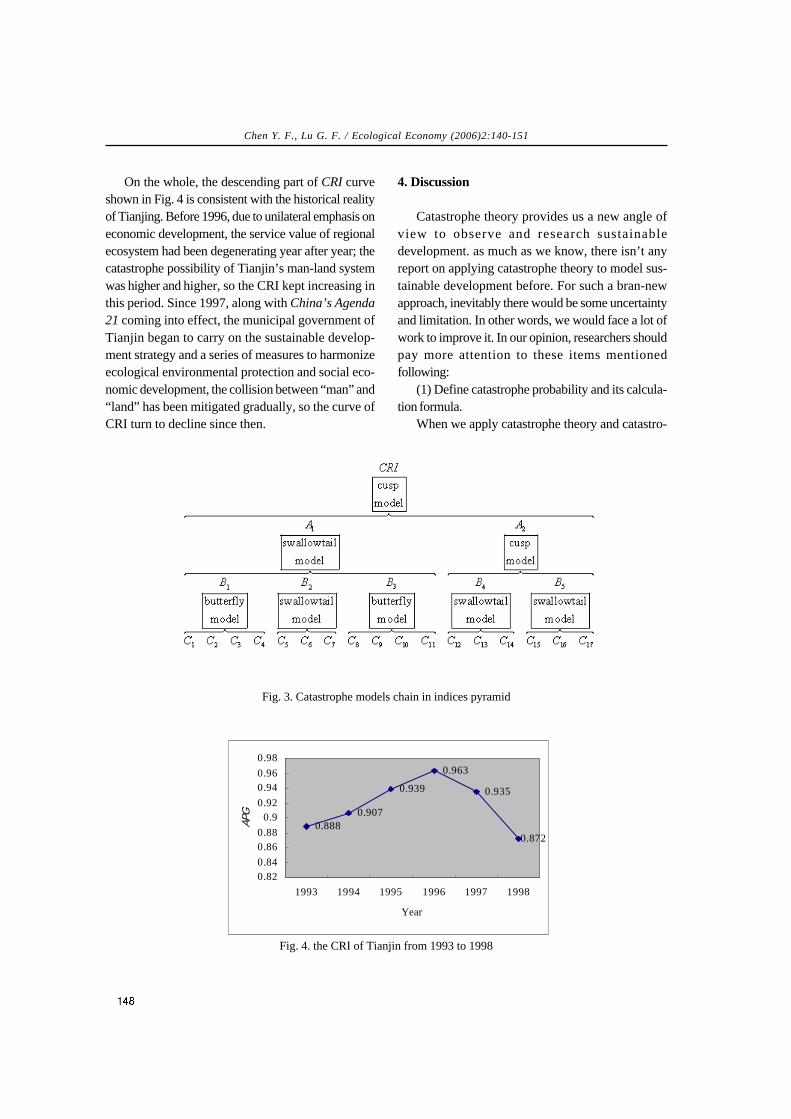
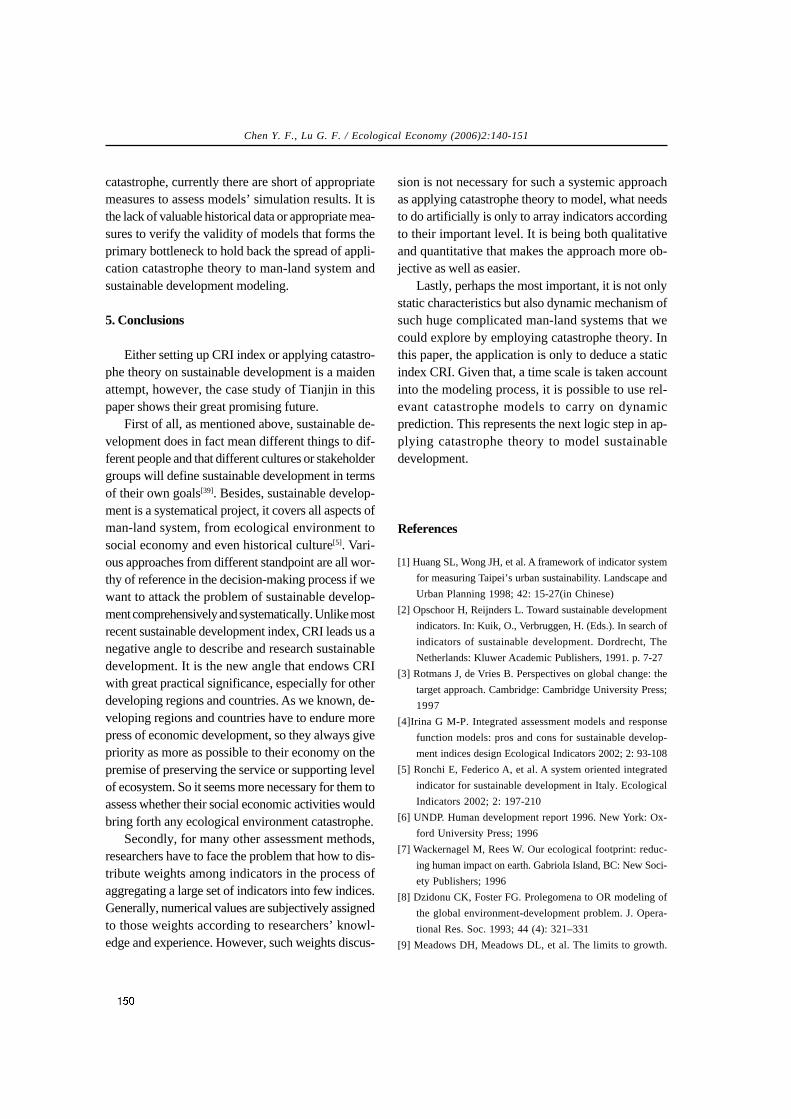
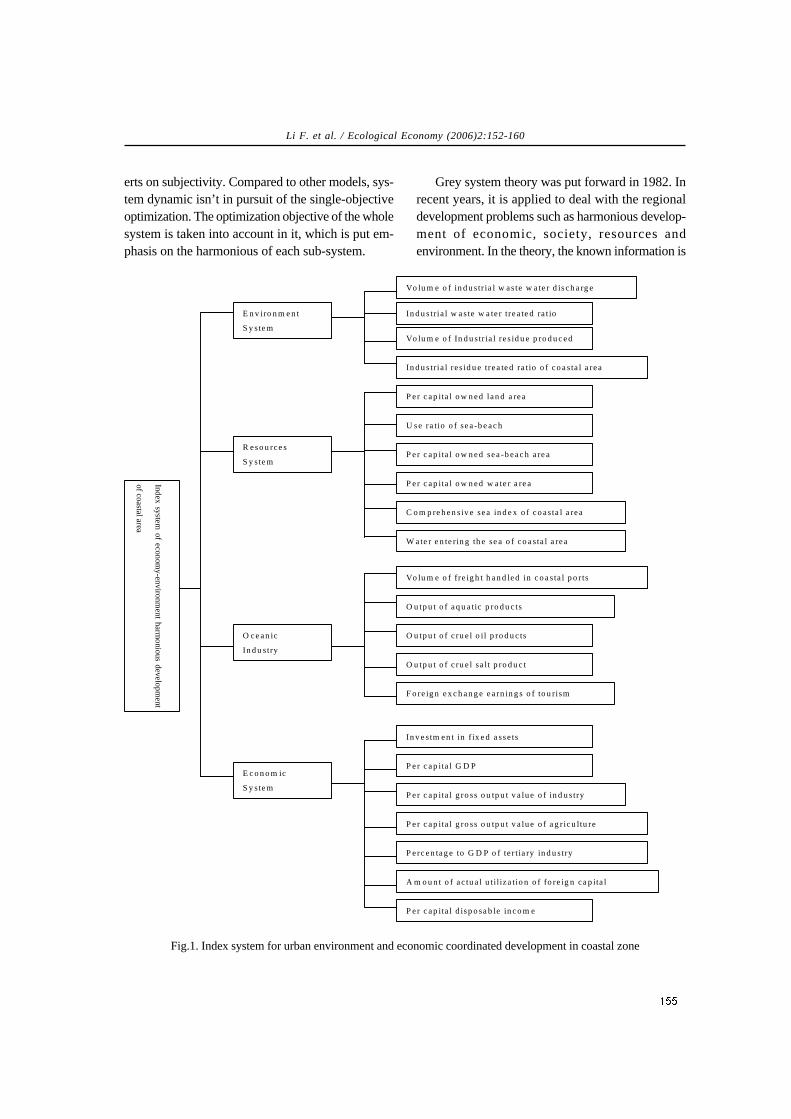
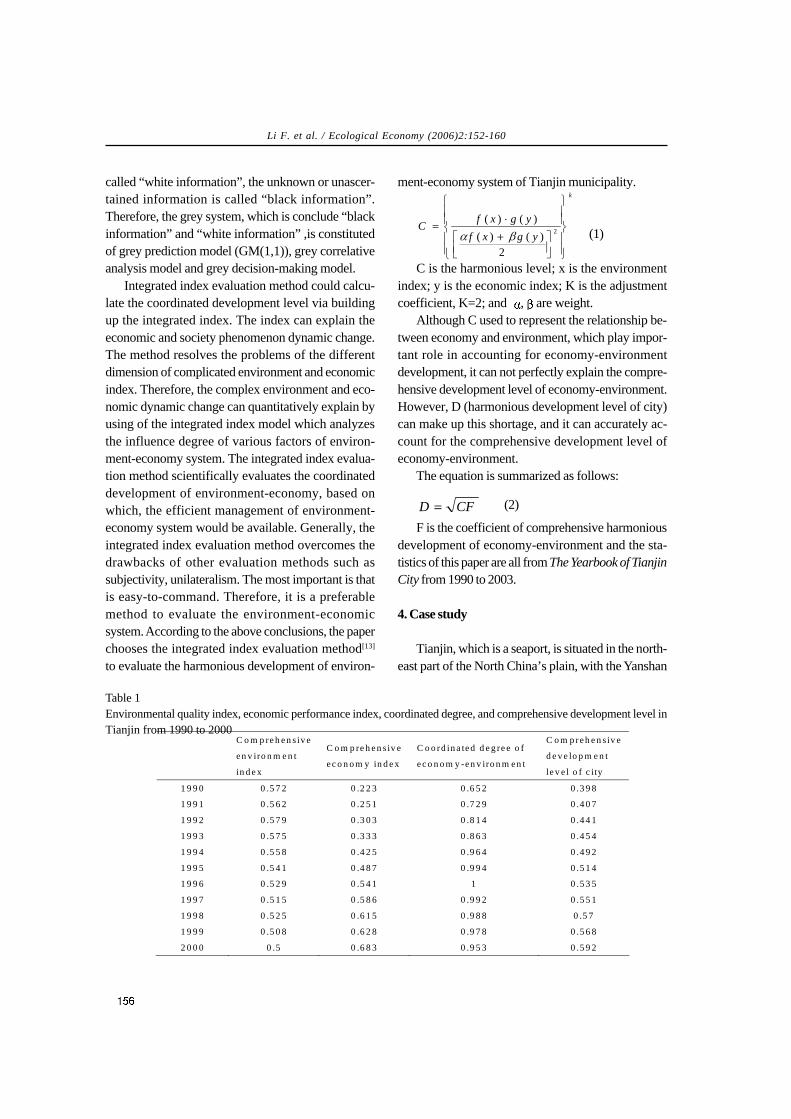
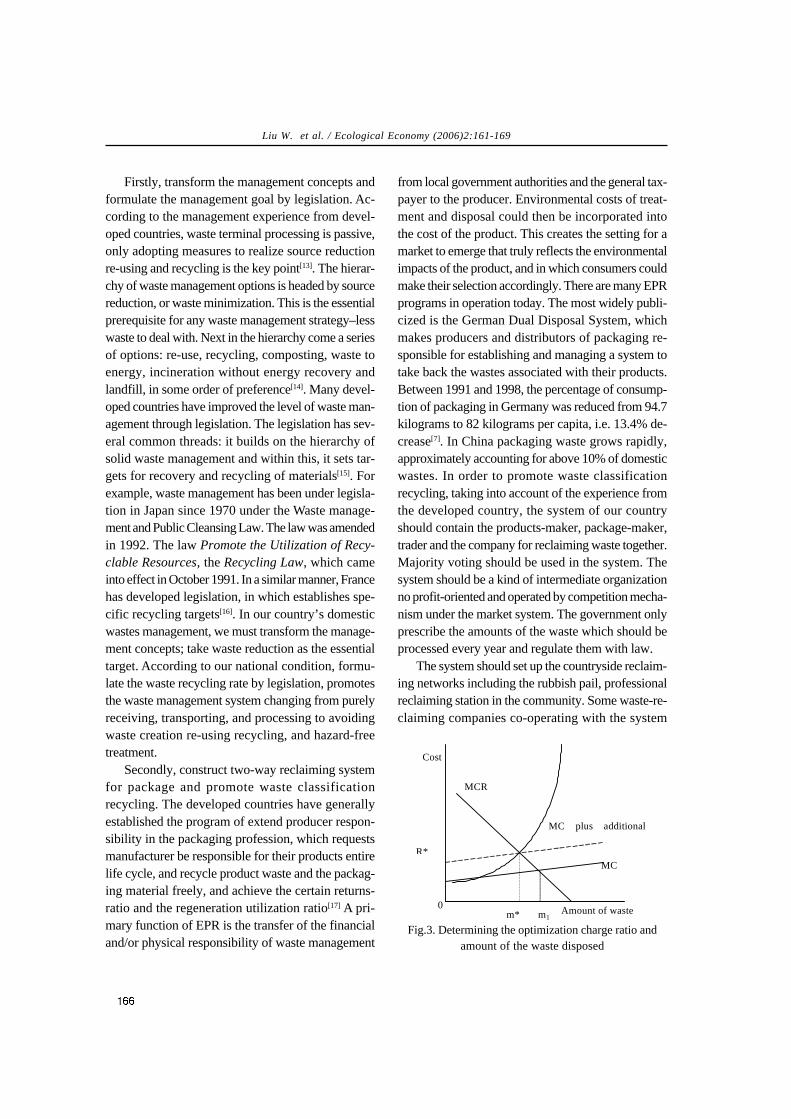
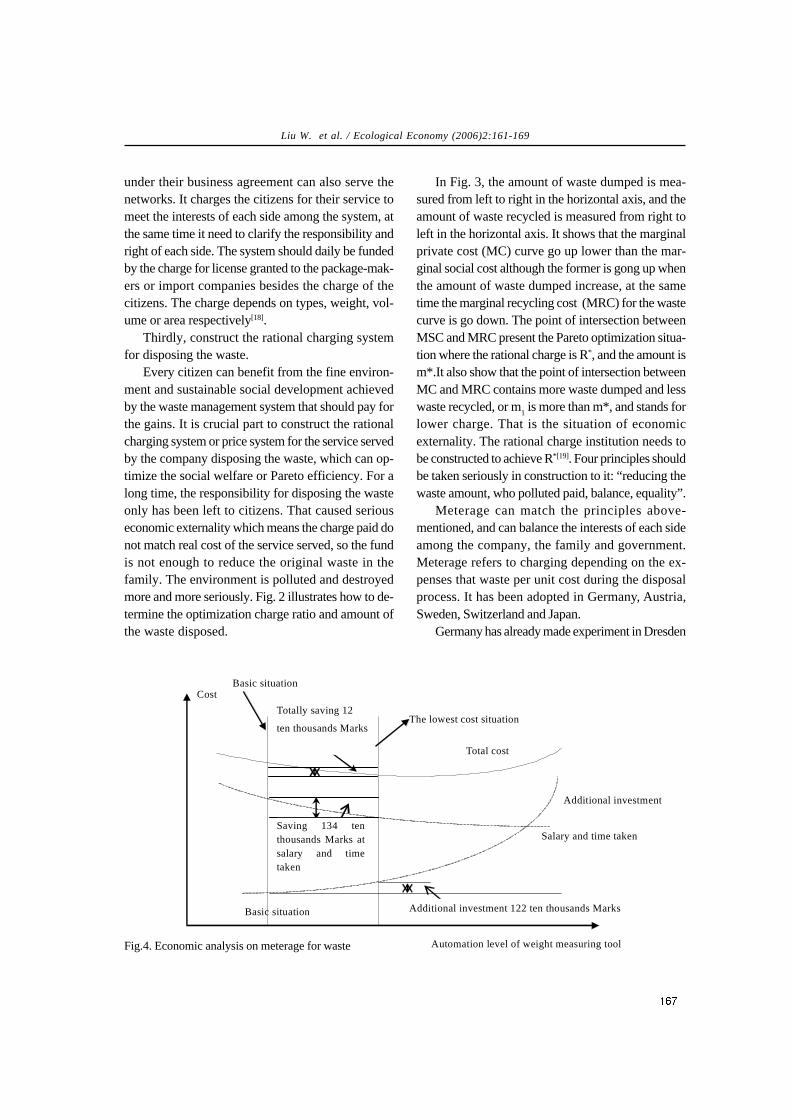
Ecological Economy (2006)2:102-114 Circular economy in China and recommendations Zhou Hongchun* Development Research Center of the State Council, Beijing 100010, P.R.China Received Dec.31, 2005; Accepted Jan.31, 2006 It is an overall, urgent and long-term strategic task for China to vigorously develop the circular economy and build a resource-saving and environ- mental-friendly society. China is now at the acceler- ating stage of industrialization and urbanization. Lower per-capita resource amount and tendency of environmental deterioration has not been fundamen- tally averted. Therefore a circular economy devel- opment is an inevitable choice to realize the goal of building a well-off society, ensure sustainable de- velopment of national economy, and coordinate the relationship between mankind and nature. 1. Connotation of circular economy and relevant concepts The articles about the circular economy published so far have more or less discussed its definition. Rel- evant research indicates that the circular economy is mainly defined from such aspects as relationship be- tween mankind and nature, technological paradigm and economic development pattern. There have not been many studies about the circular economy in the view of economics. Although there has not been a widely adopted definition, a consensus has been reached throughout the country over the essence of the circular economy as seen in the process of “re- sources – products – recycling resources”. The cir- cular economy development is, in essence, economic activities according to the ecological and economic regulations. It is actually an ecological economy, which appears to be social and material symbiosis of materials, energy and information between enterprises and even industries. The circular economy in China has been devel- oped in a more and more reasonable and in-depth way. The focus has also been adjusted. The coun- try has not only released with environment protec- tion laws and norms, but also preferential policies to bind and encourage enterprises to save resources and make full use of industrial wastes. From 1993, the government started to advocate cleaner production, and now it is pushing for the circular economy. All of these are the unremitting efforts that the country is making to realize a sustainable development. It is inferential that the circular economy will become an important practice for the country to sustain its socio-economic development. Circular economy can be traced to the same ori- gin with conservation and comprehensive resources use, cleaner production and pollution treatment, and each can be emphasized separately. For China, which is now in the period of accelerating industrialization and urbanization, and the per capita resource amount is below than the world average; the circular economy is, first of all, a strategy to save resources. It is not merely pursuing to lower resource consumption, but also efficient use and recycling use of resources so as to raise the utilization effi- ciency and reduce wastes discharge. Mass production, mass consumption and mass wastes– excessive exploitation of resources, characterized the industrialization of traditional pattern. Either in terms of political ideology or economic possibility, China does not possess the conditions to reach the indus- trialization and urbanization by following that pattern. As the country cannot be self-sufficient in many important mineral resources, and land and water resources are scarce in quite a few regions, China should place resource efficient use at an important and strategic position. Minimization of raw materi- als use and recycling of its wastes has always been a main means for the country to save energy as well * E-mail address: [email protected]Special Focus
Transcript
Ecological Economy (2006)2:102-114
Circular economy in China and recommendationsZhou Hongchun*
Development Research Center of the State Council, Beijing 100010, P.R.ChinaReceived Dec.31, 2005; Accepted Jan.31, 2006
It is an overall, urgent and long-term strategictask for China to vigorously develop the circulareconomy and build a resource-saving and environ-mental-friendly society. China is now at the acceler-ating stage of industrialization and urbanization.Lower per-capita resource amount and tendency ofenvironmental deterioration has not been fundamen-tally averted. Therefore a circular economy devel-opment is an inevitable choice to realize the goal ofbuilding a well-off society, ensure sustainable de-velopment of national economy, and coordinate therelationship between mankind and nature.
1. Connotation of circular economy and relevantconcepts
The articles about the circular economy publishedso far have more or less discussed its definition. Rel-evant research indicates that the circular economy ismainly defined from such aspects as relationship be-tween mankind and nature, technological paradigmand economic development pattern. There have notbeen many studies about the circular economy in theview of economics. Although there has not been awidely adopted definition, a consensus has beenreached throughout the country over the essence ofthe circular economy as seen in the process of “re-sources – products – recycling resources”. The cir-cular economy development is, in essence, economicactivities according to the ecological and economicregulations. It is actually an ecological economy, whichappears to be social and material symbiosis ofmaterials, energy and information between enterprisesand even industries.
The circular economy in China has been devel-oped in a more and more reasonable and in-depth
way. The focus has also been adjusted. The coun-try has not only released with environment protec-tion laws and norms, but also preferential policies tobind and encourage enterprises to save resourcesand make full use of industrial wastes. From 1993,the government started to advocate cleanerproduction, and now it is pushing for the circulareconomy. All of these are the unremitting effortsthat the country is making to realize a sustainabledevelopment. It is inferential that the circulareconomy will become an important practice for thecountry to sustain its socio-economic development.
Circular economy can be traced to the same ori-gin with conservation and comprehensive resourcesuse, cleaner production and pollution treatment, andeach can be emphasized separately. For China, whichis now in the period of accelerating industrializationand urbanization, and the per capita resource amountis below than the world average; the circulareconomy is, first of all, a strategy to save resources.It is not merely pursuing to lower resourceconsumption, but also efficient use and recyclinguse of resources so as to raise the utilization effi-ciency and reduce wastes discharge. Massproduction, mass consumption and mass wastes–excessive exploitation of resources, characterized theindustrialization of traditional pattern. Either in termsof political ideology or economic possibility, Chinadoes not possess the conditions to reach the indus-trialization and urbanization by following thatpattern. As the country cannot be self-sufficient inmany important mineral resources, and land and waterresources are scarce in quite a few regions, Chinashould place resource efficient use at an importantand strategic position. Minimization of raw materi-als use and recycling of its wastes has always beena main means for the country to save energy as well
as one of the important items of the circulareconomy.
Another respect of the circular economy is toeliminate the pollutant discharge. Development ofthe circular economy itself is an important measurefor environment protection. The initial means to pre-vent industrial pollution was to “end-of-pipe”control, which was a measure that only input butnot yielded economic output. Now the developedcountries have given up this practice for pollutiontreatment. In comparison, cleaner production empha-sizes the control of the whole production process,aiming to reduce pollutants by raising the resourceefficiency. In fact, this is the main means to realizethe circular economy in enterprise. However, cleanerproduction is quite different from circular economy.First, cleaner production is carried out in enterpriseswhile the circular economy can be linked by “wastesor by-products through trade” and energy use in abroader scope. Second, cleaner production stressesthe “from cradle to grave” – to reduce the environ-ment impact during the whole life cycle, the circulareconomy stresses “from cradle to cradle”, consider-ing recycling and comprehensive use from the be-ginning of product design. Third, cleaner produc-tion is actually a technological terminology whilecircular economy focuses on the social productionactivities.
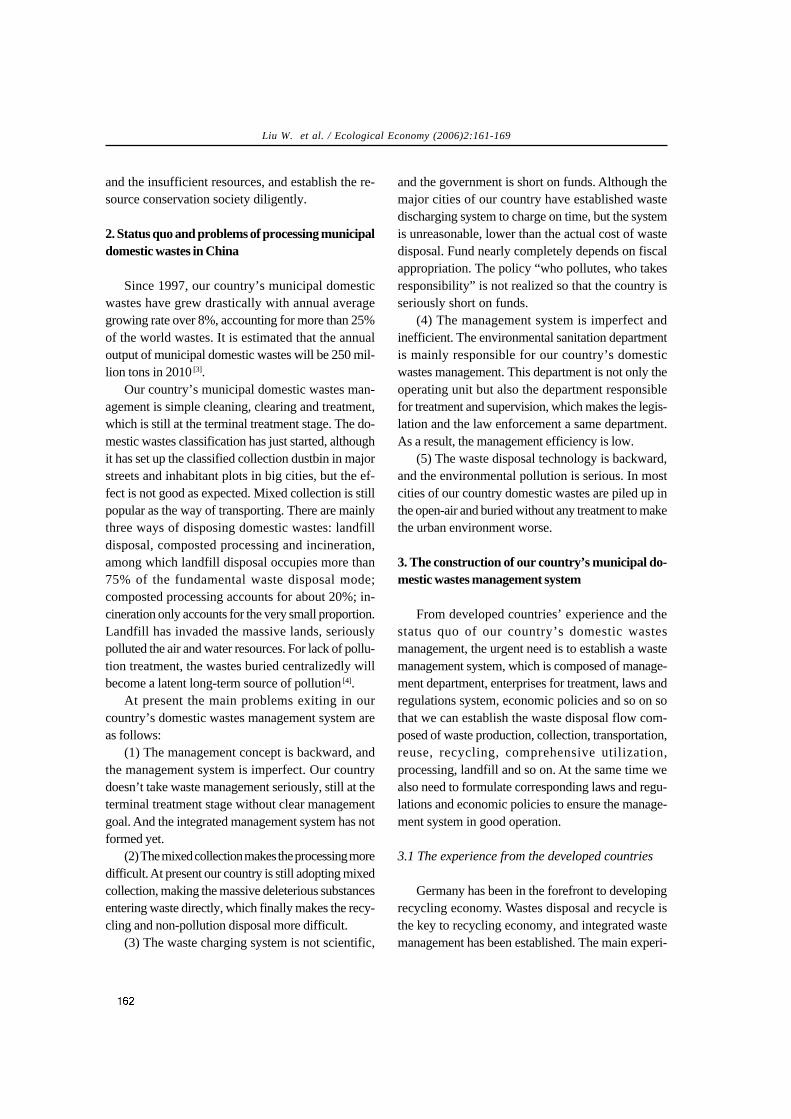
As a new development idea, pattern andindustries, the circular economy follows the macroprinciples of economic and ecological efficiency,environmental friendly, global environmental con-servation and technological leapfrogging. It adoptsthe micro operation of reduce, dematerialization,reuse, recycle, green manufacture (re-manufacture),detoxification, degradable, harmlessness (zeroemission). Circular economy is social production andreproduction activities characterized by efficient andrecycling use of resources. This idea is used to re-construct the economic activities in order to realizeoptimal production, sustainable consumption andminimum waste. In essence, the circular economy isto realize maximum development effect with as lessresource consumption and environment cost aspossible. It has changed the linear (one way) of tra-
ditional economy “resources—products—waste”and traditional route of industrialization – MassExploitation, Mass Consumption and Mass Waste.Therefore it is a way of sustainable production andconsumption pattern at the inevitable request of newindustrialization. Two points need to be made aboutthe connotations of the circular economy:
First, the circular economy can be understood ina broad and narrow sense. In the narrow sense, itrefers to reduce of wastes and resource recovery. Itcan fall into the category of “rubbish economy” or“waste economy”. In the broad sense, the circulareconomy covers all the socio-economic activities.Generally speaking, economy exists with certain pro-duction activities and always with industries. Forinstance, the concept of circular economy was cre-ated in Germany and Japan. What is going alongwith it is “recycling industry”, which refers to anindustry developed through resource-recovery ofwastes. It is so-called as against “artery industry”,which is developed by the use of natural resources.In light of the basic conditions of our country andstatus quo that complete shorts of coal and electric-ity recently, China should not advocate and pushthe circular economy in the narrow sense.
Second, the circular economy and circular eco-nomic system are two different concepts, the formerreferring to all the activities involving saving or re-cycling resources. For instance, households are en-gaged in power- and water-saving activities andgarbage classification; an office building saves en-ergy and makes use of renewable energy such assolar energy, treated water reuse and BCHP; an en-terprise saves energy consumption, makes compre-hensive use of resources and engages in cleanerproduction; and a community engages in classifiedcollection of garbage. These all fall into the categoryof circular economy. The circular economic systemis an idea mainly referring to the scope of research,such as a family, an office building or an enterprise,are all circular economic systems.
But the concept of circular economy is not a “bas-ket” that can include anything that has industriallinks. For instance, metabolism of power station andhigh energy-consumption industries (building an
Zhou H. C. / Ecological Economy (2006)2:102-114
electrolytic aluminum plant by a hydropower station)and deep processing of resources, etc. should notbe regarded as part of circular economy, which arethe natural industrial activities under a marketeconomy.
2. The status quo of the circular economy in China
2.1 A great deal of work has been done to improveresource efficiency
Since 1950’s, China has laid an industrial foun-dation of its own and established the strategic prin-ciple of “saving first”. During the planned economy,residents had to buy daily necessities with rationcoupons, which minimized the quantities they couldbuy. On the other hand, the country has also advo-cated recovery and recycling of waste products, in-cluding waste metal, rubber, batteries, toothpastetubes and used books. Since the reform policystarted in 1978, the state has issued a series ofpolicies, norms and laws to encourage enterprisesto save energy, water, land and other resources. Moreefforts have been increased in structural adjustmentand technological innovation with an aim to saveand reduce use of resources and develop applicabletechnologies, techniques and equipment, resultingin a fairly fast increase of resource efficiency. Statis-tics showed that the energy consumption per 10,000yuan GDP in 2003 declined by 65.5% compared with1980; water use for per 10,000 yuan GDP decreasedby 84.7% compared with 1980; the output for com-prehensive use of industrial waste water, gas andsolid wastes was 14.6 times as much as that in 1985;the total value for waste material recycling was 12.4times as much as that in 1985. Economic, social andenvironmental benefits have been integrated.
2.1.1 Cyclic utilization of industrial wastesSupported by the state policies, the comprehen-
sive use of resources has been more and morewidened, and the technical level has been remark-ably upgraded, achieving good economic and so-cial benefits. Encouraged by such policies as taxreduction and exemption, some Chinese enterprises
have recycled resources by re-melting of slag, brick-making or cement manufacturing with dust, recy-cling tailings and reusing cooling water. In 2003, thecountry realized 40 billion yuan of output value fromthe comprehensive use of industrial wastes, and thecomprehensive utilization rate for industrial wastesreached 53%; the rate for pulverized fuel ash wasabout 65% and the rate for gangue was about 56%.
2.1.2 The recovery and reuse of used productsIn some Chinese cities, the recovery of package
materials for cigarettes or wines has been collectedand turned into a waste flow opposite the directionof the goods supply – returning from retailers towholesalers who then return them to the plants forreuse. Other waste products have been collectedand classified. Waste metal was sent to metallurgi-cal plants. The industry that recovers old furniture,paper, plastics, waste timber and household appli-ances has built into a large network with large scale.This waste material recovery and processing sys-tem developed by itself has helped employ lots ofpeople, but also has improved the financial situa-tion in some localities. Each year, more than 60 mil-lion tons of scrapped iron and steel, non-ferrousmetals, electric and electronic products, papermak-ing materials and chemical materials have beenrecovered. In 2003, there were more than 5,000 wastematerial recovery enterprises and 160,000 such spots,more than 3000 recycling and processing units, whichemployed more than 1.4 million staff. The total valuefrom recycled resources was about 50 billion yuan.A nationwide waste material recovery network hasbeen developed.
2.1.3 Reuse of substances in the production andconsumption processes
There are professional maintenance teams for ma-chinery and electric appliances in the fields of bothproduction and consumption. Some enterprises havealso recovered and reused the glass containers, pa-per cartons and circular boxes. In recent years, wayshave been explored to remanufacture scrapped autoengines and machinery and electric products. Onthe one hand, the resource efficiency is raised as the
Zhou H. C. / Ecological Economy (2006)2:102-114
recycled use of resources is realized. On the otherhand, such products can be used after the productsare updated and their components are no longerproduced. In addition, the state also encouraged thedevelopment of flea markets so as to make fully useof second-hand commodities to satisfy the need oflow-income consumers.
2.1.4 Development of environmental goods and ser-vices
“End-of-pipe treatment” does not fall into thecategory of circular economy, but it does includesome content of circular economy. Urban garbageclassification, recovery and final treatment,composted refuse and thermal application of landfillgas and garbage power have formed an industrialchain. In 2003, more than 40 enterprises made use ofgarbage for power and thermal applicationnationwide. The marketization procedures of indus-trial wastewater and domestic sewage havehastened. Small and medium sided enterprises (SME)have entered the industrial parks in coastal areas,where wastewater has been collected for centralizedtreatment. It has not only reduced the fund invest-ment in sewage treatment, but also helped some en-terprises become major local taxpayers.
2.2 The state has stepped up to push for the devel-opment of circular economy these years
2.2.1 Public understanding is to be boostedAs a new concept, circular economy needs to be
gradually acknowledged and deepened. In recentyears, the relevant national ministries and depart-ments and media have increased the publicity of cir-cular economy and its ideas. After the central gov-ernment proposed the thought of scientific view ofdevelopment which stressed the principle of peoplefirst and coordinated and sustainable growth, thepublic has been better aware of the significance ofthe circular economy. The extensive media publicityhas created sound social environment for the devel-opment of circular economy. At the same time, envi-ronmental goods and service industry (tertiaryindustry), accreditation of environment-labeled
products, green schools, green communities andgreen government procurements become the goalsfor some localities to push for circular economy.
2.2.2 Pilot and demo projectsChina has conducted trial work for circular
economy at three levels i.e. cleaner production atenterprise level; build ecological industry parks(EIPs) in the industrial areas; and develop provin-cial and municipal experiment with circular economy.Initial achievements have been acquired.
(1) Actively carrying out cleaner productionChina is acknowledged as one of the developing
countries that carry out effective cleaner production.In 1993, China experiments with cleaner productionin brewing, papermaking and chemical industrythrough technical assistant project, B2 of the WorldBank. Resource efficiency has been raised and pol-lutants have been reduced or prevented throughimproved designs, the use of clean energy andmaterials, adopting advanced technologies andequipment and improved management. The state hasoffered key support to a number of major cleanerproduction technologies and industrialization dem-onstration projects. Cleaner production audit hasbeen done over more than 400 enterprises of morethan 20 industries and over 20 provinces, autono-mous regions and municipalities till 2002. Some 20industrial and local cleaner production centers havebeen set up, and more than 10,000 people have takenpart in various kinds of training. All these effortshave helped effectively raise the pollution preven-tion ability.
(2) Promoting the development of industrial ecol-ogy
Industry ecology has been vigorously devel-oped in industrial parks and economic developmentzones. Ecological principles are followed to orga-nize production so that the wastes or by-productsof the upstream enterprises become the raw materi-als of the downstream enterprises. The productionchains will be prolonged, and the resources are ef-fectively allocated among regions and enterprises.The wastes will be minimized, and “zero emissions”may even be realized. The State Administration of
Zhou H. C. / Ecological Economy (2006)2:102-114
Environment Protection has approved 14 types ofecological industry parks. Jiangsu has developedvarious types of environment-friendly industryparks. In Shanghai, recovery and recycling of wastemeal boxes has developed into an industrial chain.The Tianjin development zone has basically realizedzero emissions. All these practices are worthwhilebeing promoted.
(3) Substantial progress has been made in eco-logical agriculture
Ecological agriculture has been proposed longtime ago, and enthusiastically responded nationwide.Economic history shows that as early as in 900 ADin the Tang Dynasty, mulberry-dike fishpond sys-tem was developed in the Pearl River Delta region.From 1990s, the Ministry of Agriculture approvedtwo batches of 51 counties for ecological agricul-ture demonstration. After years of effort, more than100 ecological agriculture models have been sum-marized in crop planting, livestock and poultry breed-ing and agricultural product processing. In terms ofmaterial links, the models of ecological agriculturecan be divided into material metabolism, industrialsymbiosis and mixed types.
(4) Construction of ecological provinces and cit-ies and circular economic practice in pilot and demoproject
In some places, such experiments have been wellplanned, and have developed their own features.During the structural adjustment of old industrialbases, Liaoning Province have built a number ofenterprises, EIPs, cities and urban resource recov-ery and recycling system by carrying out the poli-cies for implementing circular economy, making fulluse of local resource and technological advantagesand optimizing industrial structure and layout. Suchefforts have helped produce more job opportunities.Shandong Province has pushed for the developmentof circular economy at the enterprise, industrial andoverall level. Under its “6-1-3 Projects”, the prov-ince has focused it effort on six backbone industriesof coal, building materials, power, light industry,chemical and metallurgical industry, 10 circular-based enterprises and 300 key enterprises of circu-lar-based economy.
At the working conference on circular economyheld by the National Development and Reform Com-mission in September 2004, Minister Ma Kai pointedout that “the idea of circular economy should beembodied in the formulating of the 11th Five-Year Plan.It should be placed in a prominent place whether inplan guideline or in various specific planning, zonalplan and urban overall plan. By 2010, we will build afairly complete system of laws, policy support, tech-nological progress and effective incentive as well asa large number of cleaner production enterprises withhigh resource efficiency and low discharge rate. Thesystem for the resource recycling will be establishedin key fields in order to lay a good foundation for thebuilding of a national economic system and resource-conserving society with low resource consumption,environment pollution and high economic return.”[1].
According to Xinhua News Agency, the StateCouncil will soon issue Some Opinions on Quick-ening the Development of Circular economy, whichwill become a guiding document for this effort. Ingeneral, the development of circular economy hashad some experiences and kept a good developmentmomentum. It is expected to serve as one of the im-portant ways to implement the scientific view of de-velopment and realize sustainable socio-economicdevelopment.
2.3 Creating institutional environment for circu-lar economy
Since the implementation of open and reformpolicy, the Chinese government had issued a seriesof regulations, policies and standards to build aninstitutional environment in favor of the develop-ment of circular economy.
2.3.1 Laws and regulations have been continuouslyimproved
China has been paying great attention to pre-venting environment pollution in industrialproduction. In 1983, the State Council issued theDecision on Preventing Industrial PollutionThrough Technological Innovation, demanding thatthe treatment of wastewater, gas and residue shouldcombined with comprehensive use and technologi-
Zhou H. C. / Ecological Economy (2006)2:102-114
cal innovation. Rational product mix should beadopted to develop pollution-free or less pollutingproducts. The products should be designed to meetthe environment requirements. Article 9 of CleanerProduction Promotion Law, which took into effecton Jan.1, 2003, stipulated: “Adjusting industrialstructure, developing circular economy and promot-ing the cooperation of enterprises in resource andcomprehensive use of wastes to realize efficiencyuse and recycling of resources.” Law of the PRC onConserving Energy, Law of the People’s Republicof China on Environmental Impact Assessment(EIA), and Renewable Energy Law have all had ar-ticles on the development of circular economy. Ar-ticle 3 of Law of the People’s Republic of China onthe Prevention and Control of Environmental Pol-lution by Solid Waste amended in 2004 pointed outthat “The State shall, in preventing and controllingenvironmental pollution by solid waste, implementthe principles of reducing the discharge of solid waste,fully and rationally utilizing solid waste, and making ithazardless through treatment in order to promote pro-duction and circular economy.” To carry out theCleaner production Promotion Law, the State Coun-cil transmitted the suggestions of the National Devel-opment and Reform Commission and other depart-ments on encouraging cleaner production and devel-oping environment industries. The government hasalso come up with mid-term and long-term plan forenergy saving, including the Rules for the Manage-ment for the Recovery of Scrapped Household Ap-pliances and Electronic Products, Methods for theAssessment of Cleaner Production and TechnicalGuidelines of China on Water Saving. Local regula-tions have also been issued. By 2003, provinces suchas Shaanxi, Liaoning and Jiangsu as well as citiessuch as Shenyang and Taiyuan have issued localcleaner production policies and rules. The city ofGuiyang has promulgated and implemented the Rulesof Guiyang for Building Ecological City of CircularEconomy. Such legislation efforts have laid a founda-tion for circular economy according to law.
2.3.2 Encouraging enterprises to engage in circu-lar economy through preferential policies
As an important part of circular economy, com-prehensive utilization of resources, recovery of wastematerials, environmental goods and services havealways been encouraged by the state. To promotethis undertaking, the state has adopted and imple-mented a series of preferential policies to encouragecomprehensive use of resources. In 1996, the StateCouncil transmitted the “Suggestions on FurtherImproving Comprehensive Use of Resources” of theState Economic and Trade Commission and otherdepartments (<1996>No.36). The document set thecomprehensive use of resources as a long-term strat-egy for national economy and social development.According to this document, the former State Eco-nomic and Trade Commission made public in twobatches “List of Industries, Products and Technolo-gies Encouraged by the State”. The commission alsoissued relevant preferential policies jointly with theMinistry of Finance and State Administration ofTaxation. The enterprises engaged in comprehen-sive use of resources will enjoy tax reduction andexemption policy.
2.3.3 The state has also taken a series of measuresto coordinate development and environment
(1) adjusting industrial structure, shutting downsome enterprises that have backward technologies,waste resources, pollute environment and have nomarket to cut industrial pollution and alleviate struc-tural pollution problem;
(2) optimizing energy structure, reducing the pro-portion of coal in energy, raising the utilization rateof coal, promoting clean coal technologies, devel-oping more hydropower and actively developingrenewable energy;
(3) Strictly controlling new pollution and eco-logical damage and exercising environmental impactassessment system over all construction projects toreduce pollution while increasing output;
(4) Quickening the construction of sewage andgarbage treatment facilities in some cities to bettertreat domestic pollution. In general, the state hastaken legal, administrative, economic and techno-logical measures adhered to the principle of “pollut-ants paying for treatment” and implemented the
Zhou H. C. / Ecological Economy (2006)2:102-114
market-regulated policies in pricing and taxation.These measures have played an active role in pro-moting circular economy and transferring way ofproduction.
2.4 Circular economy has a solid cultural basis inChina
The terminology of circular economy was men-tioned by the central decision-makers in recent years,but the idea of using resources rationally and pro-tecting environment has been pursued since ancienttimes both at home and abroad. In a certain sense,the central government has targeted the circulareconomy at raising resource efficiency, easing theresource and environment pressure in the course ofmodernization drive and seeking a harmony betweenman and nature. The idea of “five balanced aspects”and building harmonious society both contain thenotion of the harmony between man and nature.Seeking this ideal is one of the important character-istics of Chinese culture and civilization. The idea of“unity of heaven and humanity” developed beforethe Qin Dynasty had rich connotations; Zhuangziand Laozi advocated the idea of complying with thenature and opposing excessive exploitation ofnature; Confucius stressed the concept of essenceand heavenly way; Mencius has known for his heart/mind theory that stresses humane learning and self-learning; Guanzi stressed man’s harmony withheaven; and Xunzi advocated the idea of exploitingnature. At the same time, since ancient time, the Chi-nese nation has been valuing thrifty. More than 2000years ago, Xunzi pointed out that if nations built upthemselves and practiced thrift, natural resourceswould never be exhausted, and that if nations wereweak yet waste resources, nature would never helpthem become wealthy. In southeastern coastal areas,mulberry-dike fish-pond system, an ecological wayof developing agriculture and using sugarcane ba-gasse to make paper were adopted in ancient time,which indicated that the idea of circular economywas likely to be accepted by Chinese people.
In addition, the state relevant ministries and de-partments have organized much research on the
theory and practice. The office of the central finan-cial and economic leading group set up the projectof “the position of circular economy in China’s re-source strategy and relevant measures” as a majorresearch project for 2004. The State Developmentand Reform Commission entrusted the State Coun-cil Development Research Center to research on de-veloping circular economy and building a resource-conserving society – a main theme for the 11th Five-Year Plan. China Council for International Coopera-tion on Environment and Development conducted aspecial research project on “cleaner production andcircular economy”. The state’s mid- and long-termscientific development plan has listed ecologicalconstruction, environment protection and scientificand technological issues relating to circular economyas its research items. Supported by the Ministry ofScience and Technology, the State Environment Pro-tection Administration (SEPA) has done the researchon the technological support system for the circulareconomy. The development of China’s circulareconomy has also aroused much internationalattention, and it has become a prioritized item forinternational cooperation projects. For instance,World Bank has supported China’s National People’sCongress in the research on the legislation for circu-lar economy and backed the SEPA to carry out policyresearch on circular economy. Germany supportedGuiyang City in implementing circular economy. Allof such support has laid a foundation for the devel-opment of China’s circular economy.
3. Problems existed in the development of circulareconomy
Some theoretical and practical probes have beendone in the circular economy; it is just a beginningin China. Compared with developed countries, prob-lems remain in the following aspects.
3.1 Lack of awareness
The public has not been adequately aware of thesignificance of developing circular economy. First,people are not aware of the grim situation of re-
Zhou H. C. / Ecological Economy (2006)2:102-114
sources and environment as well as the urgency andimportance for circular economy; second, the publichas not know much about, or paid enough attentionto the problems and relationship between economicdevelopment and environment; third, the public hasnot know much about the concept, connotationsand role of circular economy. Some plans merely aimfor “drawing circles”. In fact, not all wastes can beturned into useful raw materials at any cost. It needsinvestment to do so. At the same time, there existuncertainties between some industrial chains. Forinstance, mad cow disease is related to improper useof animal protein for cows. So the research on theconnotation of development modes, theoretical ba-sis and basic characteristics of circulation needs tobe deepened.
3.2 Lack of overall planning and macro guidance
China is still at the initial stage to push for acircular economy. It has not made any overall planand implementing plans. So there has not been anyguidance and instruction. As the system has notbeen complete for the statistics and calculation ofresource utilization, it is very difficult to set up re-source-productivity indexes for the development ofcircular economy. It is urgent to place comprehen-sive use of resources and environment industryunder an overall plan and complete system.
3.3 Incomplete legal system
Generally speaking, there has not been a legalframework for the development of circular economy.The quality of relevant legislation needs improving:some of the existing rules have been vague and notquite operable; relevant laws have not been effec-tively coordinated, and some implementing ruleshave not been in place; and there lacks necessarycompulsory technical standards. Interest partieshave not been adequately involved in the makingand implementing the laws and regulations. Thegovernment departments’ views have been moreadopted than those from the public and experts.There has not been an effective evaluation system
for the implementation of the laws. Some of the pro-visions of environment laws have focused on “end-of-pipe treatment”, failing to meet the demand ofpollution prevention and circular economy under thenew situation.
3.4 There lacks an effective incentive system
An important basis for resource recovery andrecycling is the responsibility extension system forproducers and pricing system for classified recov-ery of renewable resources and recovery of wastematerials that are not easy to be recollected. Theseare where market mechanisms can hardly cover. Itneeds to be managed by the government’s macrocontrol policies. But so far there has not been aneffective incentive policy, a recycling system or pric-ing system. The policies have not been operable asthe regulations have not been well compatible, lead-ing to a high cost of execution and ineffectiveimplementation. Effective incentive policies, recov-ery treatment system and rational pricing mechanismhave not been in place. Some of the policies havenot been handled in the direction of its purpose.
3.5 Lack of common and key technologies to sup-port the development of circular economy.
At present, some breakthroughs have been madein raising resource efficiency, but in general, the re-search and application of science and technologyhave lagged behind the development of circulareconomy. Most of the enterprises have not beenable to develop common and key technologies thatcan help substantially raise resource efficiency, andthere also lack channels for them to know about rel-evant technological information. The developmentof circular economy should be based on a great dealof scientific research, including the theoretical re-search of the circular economy. China has had expe-riences of recovering and recycling waste and pack-ing products, but they have low technologicalcontent. As waste and scrapped materials have notbeen fully used, the best circular economy effecthas not been realized. Nor have they been soundly
Zhou H. C. / Ecological Economy (2006)2:102-114
linked with food and environment safety guaranteemechanism. In a word, the policy and theoretical re-search has lagged behind practice.
3.6 Lack of a sound operation mechanism ofgovernment’s promoting, market driving and pub-lic action to move forward the circular economy
Circular economy, as sustainable economic de-velopment mode and consumption model, is a com-plex system. It requires coordination from variouslocalities and departments. Now the work divisionof state departments and their functions have beenclearly clarified. Some bodies that are supposed toimplement the law according to law have disappeared.Some departments have overlapping and repeatedfunctions. The market is not yet effectivelyadministered, as the market for recycled products isnot in good order.
Generally speaking, China has made someprogress in developing circular economy, but prob-lems and obstacles still exist on the way. More re-search needs to be carried to come up with laws,policies and measures to back up the specific devel-opment plans.
4. Recommendations on the circular economy de-velopment in China
Circular economy concerns every citizen, family,community, enterprise, region and even the wholenation. At the present stage, the circular economyshould be focused on solving the resource and en-vironment problems from the perspective of devel-opment in light of the country’s conditions in theperiod of industrialization and urbanization.
4.1 Building legal system on the promotion of cir-cular economy
Transferring China’s mode of production fromextensive to intensive and raising the quality andefficiency of economic development cannot be real-ized overnight. Due to limitations of some factors,many of the macro efforts have been offset by micro
acts of wasting resources and polluting environment.According to foreign experiences, circular economycannot be automatically developed under the tradi-tional market economy. Necessary legislation mustbe hastened to change the behaviors of enterprisescompulsorily and prevent them from pursing quickgains through short-term acts.
Pushing the development of circular economyaccording to law. The legislation framework shouldbe made clear, which will include the basic law, com-prehensive law and special law. We should spare notime working on the Law of the PRC on ConservingEnergy, Cleaner Production Promotion Law andother auxiliary regulations as well as the regulationson comprehensive utilization of resources and re-newable resource recovery and recycling. The pro-ducers responsibility extension system should bestudied. The pollution discharge right trading sys-tem should be studied and implemented so that eco-nomic means would be adopted to alleviate the pres-sure of pollution over the environment. Energy labeland accreditation system should be implemented.Scientific production norms should be issued to stan-dardize every link of the production – preventingand reducing wastes from the very beginning. Dif-ferent pollution discharge standards should beadopted for different regions of different develop-ment levels and the charge rate for waste dischargeshould be raised. Supervision should be intensifiedto help enterprises involved in circular economy canprofit.
4.2 Readjusting industrial structure to optimizeeconomic layout
The government should guide the economy intoa strategic readjustment. China is accelerating in-dustrialization and urbanization, which makes it in-evitable to increase resource consumption. Build-ings cannot be built without consuming resources.Nor can the goal of urbanization be realized. Thecountry should build a resource-conserving indus-trial and production system centering on energy,material and water saving. The high and new tech-nology industries should be developed in order to
Zhou H. C. / Ecological Economy (2006)2:102-114
upgrade traditional industries with innovatedtechnologies. Priority should be given to informa-tion industry, which can substantially bring alongthe development of other sectors of the nationaleconomy. Taxation preferential treatment should begiven to high-tech industries and service trade whichconsumer less resource and produce high valueadded. Labor-intensive sectors and modern serviceindustry should be focused while the proportion ofthe tertiary industry should be raised. An importanttask should be set to curb blind investment and low-level repeated construction. The environment,safety, energy consumption, technology and qual-ity standards should be improved and strictly imple-mented as the market access should be strictlycontrolled. An import and export policy in favor ofsustainable use of resources and protection of envi-ronment should be carried out in order to realize areasonable pattern of international industrialdivision.
Formulating of plans to increase macro guidance.Under the conditions of a socialist market economy,compiling and implementing plans is of vital impor-tance to realizing the state’s strategic goal, makingup for the market failure and effectively allocatingpublic resources. In planning for the 11th Five-YearPlan for national economy and socio-economic de-velopment as well as major urban developmentprograms, we should place circular economy andbuilding a resource-conserving society in a promi-nent place. Special plans should be made for fuel,coal, power and waste saving as well as their com-prehensive utilization in addition to the developmentgoals, highlights and policy measures. Such plansshould be included in the 11th Five-Year Plan so thatthey would play their guiding role.
Guiding regional development with the idea ofcircular economy and rationally adjusting the re-gional economic layout in light of the conditions ofnatural resources and economic structures to con-struct regional circular economic system. Well ar-ranging the space planning and choosing rationalway of land use and transport is a fundamental wayto conserve resources at macro level, which shouldbe therefore paid much attention. The comprehen-
sive land planning should be started as soon aspossible. Otherwise, once the urban and transportsystem built under irrational regional viciouscompetition, energy would be wasted for long, andit would cost a great deal of money for renovation.
4.3 Guiding the development of circular economythrough policy guidance
The government must play a role in developingcircular economy. A system and policy environ-ment should be gradually established in favor ofthe development of circular economy. Industrialpolicies should emphasize raising resource effi-ciency and environment, promoting strategic eco-nomic restructuring so that they would be helpfulto building a circular economy system. The invest-ment policy and project selection should be guidedin the direction of industrial adjustment andupgrade. The state should offer some direct invest-ment or subsidies to the major basic facility projectsthat are needed by the development of circulareconomy. The State Development and Reform Com-mission has also proposed the “List of Energy Sav-ing Product” and “Suggestions on GovernmentEnergy-saving Procurement”. It should join financeand taxation sectors to discuss the tax reductionand exemption policies for use and production ofsuch products.
The government should play an exemplary role.It should include the circular economy and resource-saving indexes in the mandatory requirements, de-manding that the governments at various levelsshould implement resolutely. The governmentshould drive the demand for circular economythrough procurement plan and guide the public toconsume green products . In governmentprocurement, priority should be given to the prod-ucts that have been designed ecologically or haveenvironment label accreditation, the products thathave passed cleaner production audit or ISO14001and stationary products that have energy-savinglabel. Attention should be paid to saving, repeateduse and recovery of scrapped products. Thegovernment’s work efficiency should be raised; their
responsibility be defined; and the cost principlesshould be followed in the course of pushing circulareconomy to avoid “policy failure”.
4.4 Using economic means to build an incentivemechanism for circular economy
Using market means to promote circular economyis an extension of incentive mechanism for environ-ment protection adopted by OECD. As the OECDcountries have adopted a strict policy of “polluterspay the pollution”. The enterprises that recycle anduse waste products can get fund subsidies fromwaste producers. But the situation in China isdifferent. First, once the Chinese enterprises use thewastes of other enterprises, such as industrial slagand coal ash, the waste producers do not have topay, and even charge the users, which make the re-cycling enterprises gain nothing. Second, the pref-erential taxation treatment for comprehensive use ofresources cannot be received by enterprises. Suchpolicy has not been implemented. Or the benefitshave been taken away from local governments. Thissituation should be curbed.
Deepen institutional reform to play a better roleof the market in resource allocating. The propertyright system should be improved. Only after the prop-erty right of resources is made clear can the resourceefficiency be maximized and wastes minimized.
Develop a pricing system conducive water andpower saving. A “ladder” water pricing system shouldbe adopted to set the basic demand of urban con-sumers (for example, per capita 100 liter a day) as abase number, the extra use will be charged twice orthree times. While offering universal service, thegovernment should make use of pricing in adjustingthe demand for water. The pricing system that dis-tinguishes the prices of peak and valley hours andrain and dry seasons so that the prices can accu-rately reflect demand and supply while curbing theblind development of high energy-consuming indus-tries and reducing power waste. Fuel tax should belevied at a proper time to curb the fast growth ofautomobiles with larger auto emissions and thetransport of low-value commodities such as sand
and stone backed up by low fuel prices.Adjust and improve import and export taxation
policy. The export tariff rate for high energyconsuming, high material consuming, high pollut-ing and low efficient resource products and primaryproducts shall be raised. The exports of coal, coke,electrolytic aluminum and phosphorus ores, whichare in short supply in the country and pollutingenvironment, should be gradually reduced andabolished. Enterprises should be encouraged tobuild raw material bases abroad, jointly develop andimport mineral products badly needed domestically.The imports of iron and steel scrap and non-ferrousmetal should be encouraged while processing parksshould be built in the country to meet the domesticmarket demand.
Build complete information and consulting sys-tem for circular economy. Establish a smooth infor-mation sharing system to ensure the flexibility andeffectiveness of material exchange among differentindustries and enterprises. Organize industrial as-sociations and other kinds of intermediary organiza-tions to promote the exchanges of resource efficiencyknowledge and technologies by holding technologi-cal promotion and exhibition and experience ex-change meetings. Set up an information releasesystem. Making use of modern IT technology toissue domestic and international information on en-ergy consumption, water consumption and advancedtechnologies and management information whileguiding enterprises to tap potentials and upgradetechniques. Push contract energy performance con-tracting and energy saving financing guarantee andpopularizing energy saving voluntary agreement.Adopting comprehensive resource planning anddemand side management measures to guide the re-source allocation and utilization. Actively andsteadily advance the heat supply and property man-agement system reform to reduce the cost ofresources.
4.5 Developing common and applicable technolo-gies to form the technological support system forthe circular economy
The development of circular economy eventu-
Zhou H. C. / Ecological Economy (2006)2:102-114
ally relies on technological progress. So innovationeffort has to be stepped up to provide technologicalsupport for circular economy. China’s industrializa-tion and urbanization route and the high and newtechnology zones should be designed on the basisof an analysis of logistic flow and energy flow of theeconomic system. The resource and energy costshould be lowered and discharge of pollution bereduced in the course of production andconsumption. The technological development forcircular economy should be included in thecountry’s mid- and long-term scientific developmentplan. Scientific and technological principles as wellas tools and measures should be established to sup-port the circular economy. They include the prin-ciples and methods for products’ ecological design,method of logistic flow analysis and supply chainmanagement and technologies, the theory and meth-ods for the analysis of economic and technologicaleffect with an aim to raise ecological efficiency. Anumber of platform and common technologiesshould be developed that produce good economicreturn, consume less resource and have lesspollution, including information technology, substi-tution technology, cascade use of energytechnology, industrial chain extension and linkagetechnology and “zero” discharge technology andsubstitution technology for replacing poisonous andharmful technology and biological catalysttechnology, recycled ecological materials and recy-cling technologies and environment monitoringtechnology, network transport technology and re-cycling cost reduction technology. Research shallbe conducted over technology to link different en-terprises and products, optimal design technologyfor ecological industry zone and the technology ofbuilding common enterprise networks and ecologi-cal industry assembly system technology. The pur-pose is to link industry with agriculture and commu-nity logistic and energy flow to ensure that theywould obtain the most proper resources and realizeenergy efficiency. Cleaner production should beactively enhanced from single enterprises to eco-logical industry parks. Through experiments, a num-ber of such parks shall be built to build a new devel-
opment pattern and realize sustainable development.International cooperation shall be carried out to in-troduce advanced ideas and avoid past mistakes.
Build and improve statistical and evaluation in-dex system as well as a green national accountingsystem. A new index system should be studied andset up to reflect the economic development, use ofresource and environment protection to meet thedemand of evaluating the circular economy and aresource-conserving society. Such indexes includethe energy consumption in key industries, resource-productivity, recovery and recycling of wastes andwaste discharge per product unit, etc. The officials’assessment should also include such indexes in or-der to curb the wrong practice that achieves GDPgrowth at the expense of resources and environment,thus pushing the economic development on a healthyand sound track.
4.6 Quickening demo projects and push for circu-lar economy in an all-round way
Developing circular economy should proceedfrom key regions and key industries and settle theconflicts between socio-economic development andenvironment and resource protection from the pointview of development. In the southeastern coastalcities, the emphasis should be placed on develop-ing the industry of environment protection while theresource-based cities and old industrial bases shouldbe renovated through comprehensive use ofresources. The western areas should focus its de-velopment on ecological agriculture and foster newpoints of economic growth. The demonstration spotsand enterprises should be better used to spread itsinfluence in the campaign to build “advanced enter-prises in cleaner production.” With years’ efforts,the enterprises should reach domestic or interna-tional advanced level in terms of main indexes forcleaner production. At the industrial level, high-en-ergy consuming and heavy polluting industries, suchas metallurgy, non-ferrous metallurgy and buildingmaterials should be first be checked and renovatedso as to accumulate experiences and advance theprocess step by step. The construction of ecologi-
Zhou H. C. / Ecological Economy (2006)2:102-114
References
[1] Ma Kai. Carrying out the scientific view of developmentand vigorously advancing circular economy: a speech at anational conference on circular economy. September 2004(in Chinese)[2] Xie Zhenhua. Some thoughts on the theory and policyof circular economy. Guangming Daily, November 17, 2003(in Chinese)[3] Wang Yuqing. A speech at the 2004 annual academicconference of China Environmental Science Society; Sep-tember 23, 2004 (in Chinese)[4] Feng Zhijun. China circular economy forum. Beijing:People’s Publishing House; 2005 (in Chinese)[5] Seven ministries discuss the development of circularindustry. China Information Daily, March 17, 2005[6] William McDonough &Michael Braungart. From cradleto cradle: exploring design for the circular economy. Shanghai:Tongji University Press; 2005 (Chinese Edition)
cal industry zone should be stepped up, especiallythe new economic zones or industrial parks. Theplanning and design of such zones should take intoconsideration of the coordination with resource uti-lization and recycled use to meet the demand of cir-cular economy. Greater efforts will be made in build-ing demonstration cities in circular economy andadvance the regional development in terms of circu-lar economy.
4.7 Carrying out education and publicity activi-ties to create a favorable atmosphere
Vigorous effort should be made to increase pub-licity and education in order to help leaders, enter-prises and institutions and the public better awareof the importance of a circular economy. The activi-ties should be well organized for energy saving week,water saving day, land day and environment day.Various training activities will be organized to en-hance the sense of resource shortage and environ-ment protection among the public. The state shouldregard “saving resources” as one of the three basicpolicies together with “family planning” and “envi-ronment protection.” Building a resource-conserv-ing society should be regarded as an important itemfor the construction of spiritual civilization. The prin-ciple of “saving first and increasing supply secondshould be adopted in planning and approving newprojects. The middle and primary school textbooksshould include the content about building a re-source-conserving society, and the role of youngpioneers, Communist Youth League, Women’s Fed-eration and Trade Union as well as other non-gov-ernment organizations should be better played toadvocate proper material life and rich spiritual pur-suit as well as upright value of life and consumption.
Developing circular economy is by no means thematter of government departments. It is also a mat-ter of obligation for each citizen. Government orga-nizations should play a leading role in saving re-
sources and opposing waste. Activities shall be or-ganized to build resource-conserving cities andwaste-free enterprises as well as “green hotels” wheredisposable products will be reduced. Resource-sav-ing activities should also be conducted in publicplaces like grain saving in student canteens andrestaurants, repeated use of textbooks. Experimentsshall be done to classify recycled resources and re-newable energy. Residents shall be encouraged tosave daily products and become more conscientiousabout recycling. All the citizens shall be graduallydeveloping a resource-saving and environment-friendly way of life and consumption.
Acknowledgements
This paper is the achievement of “Theoreticaland Case Study of China’s Eco-economy” which issupported by the National Natural Science Founda-tion of China (Grant No. 40252001/D0110).
Zhou H. C. / Ecological Economy (2006)2:102-114
Ecological Economy (2006)2:115-126
Special Focus
An important way to build a new socialisticcountryside: developing circular economy
Ji Kunsen*Anhui Association for Science and Technology, Hefei 230000, P.R.China
Received Dec.23, 2005; Accepted Jan.22, 2006
It was put forward in the Fifth Session of Six-teenth Central Committee of the Party that “it is agreat historic mission on the path for China to mod-ernization to construct new socialistic countries”,and that “according to the requirements of develop-ing production, ample life, civilized countrysideclimate, clean countryside, democratic management,urban and rural social and economic developmentshould be unifiedly planned, modern agriculturalconstruction should be promoted, rural reformshould be deepened all round, rural public serviceshould be advanced, and peasants’ income shouldbe increased by all means.” Some time ago PremierWen Jiabao pointed out that problems about thecarrying capacity of resources and environment, forexample the decrease of arable land, the lack of fresh-water and eco-environmental deterioration, will betough challenges to agricultural development inChina. According to the requirement of construct-ing economical society and environment friendlysociety, agricultural circular economy should beadvanced to lengthen service life of limited agricul-tural resources. In fact, this is congruous with thepolicy of developing agriculture by “Scientific Con-cept of Development”. The spirit of the Fifth Ses-sion of Sixteenth Central Committee of the Party andPremier Wen Jiabao’s speech will guide us to thedirection of constructing new socialist countries.From the practice of developing agricultural circulareconomy, circular economy can be applied to ex-pansive rural areas and is of great significance.
(1) Circular economic eco-agriculture refers tothe way to develop economical society in rural areasby taking factors of production, such as land, water,
seeds, fertilizer, pesticide, electricity, oil, firewood,food, etc. into comprehensive consideration, to makecomprehensive plans, and to economizesystematically.
(2) Steadily improve the productivity of the re-sources in agricultural products and agriculturalcomprehensive productive capacity, pursue moreeconomic benefits, and constantly increase peas-ants’ income. Developing circular economy is oneof the essential solutions to new socialist countriesconstruction and “issues concerning agriculture,countryside and farmers”.
(3) Recycle and make multipurpose and full useof wastes from plant production and culture, urbanindustry with agricultural products as its rawmaterials, and township enterprises to bring moreeconomic, social and environmental benefits.
(4) Circular economic eco-agriculture not onlyfocuses on safe agricultural products but also is goodfor improving soil and increasing organiccomponents, which can improve area-sourcepollution, explore the way of building environmentfriendly society to realize the harmony between manand nature.
(5) It will create more job opportunities to pro-mote the adjustment of rural industrial structure,change agricultural increasing mode, expand indus-trial scale, and extend industry chain.
(6) Combine specialized technological and eco-nomic associate with advanced economic mode ofcircular economy, both of which will promote andinteract with each other. It is also an important partto deepen rural reform and implement democraticmanagement.
prehensively plan economic and social developmentand constructing eco-villages and eco-towns thatprovides stage, opportunities and conditions to de-velop circular economy.
Circular economy is a kind of economic mode ofmore economic benefits and job opportunities, lessresource consumption and pollution. Based on eco-logical rules, eco-economic theories, and re-planningindustrial development, developed countries haveput forward a new concept of recycling economicdevelopment Since 1980s in order to reduce resourceconsumption, prevent environmental pollution, pro-tect eco-environment, and create more comprehen-sive economic benefits. In recent years, countriesaround the world agree to develop circular economy.
Circular economy follows 4-R rule i.e. reduce,reuse, recycle and rethink, which is the characteris-tic of circular economy. Reduce rule i. e. reduce ma-terial consumption, is the most important principleof circular economy. It aims at increasing productiv-ity of resources and utilization ratio, reducing theexploitation of non-renewable resources, exploitingrenewable resources as more as possible and reduc-ing material flow and energy flow in the process ofproduction and consumption. Reuse rule means us-ing resources as more times or in more ways aspossible. Recycle rule means reclamation and pro-cessing of wastes. Rethink rule means reducing andavoid the production of wastes, increasing produc-tivity to its extent, minimizing pollution emission andrecycling wastes to the greatest advantage. Peopleare ceaselessly cognizing the rules of things, andtechnological development knows no bounds, so itcannot be complete once to build an ideal recyclingeconomic mode. Nature has experienced long-termevolution. When developing circular economy, wemust well understand essence or circular economy,apply 4-R rule flexibly, and ceaselessly think, explore,innovate and develop.
It is a big complex open system to construct newsocialist countries. Generalizing circular economy inrural areas is the important strategic goal to con-struct economical and environment friendly societyput forward in the Fifth Session of Sixteenth CentralCommittee of the Party and the important move to
construct new socialist countries.
1. “Save nine reduce one” – application of reducerule
“Save nine reduce one” means saving land, water,seeds, fertilizer, pesticide, electricity, oil, firewood(coal) and food, and reducing workforce.
1.1 Save land
Land saving and intensive land should be at-tached great importance to civilian houses building,town construction, road reparation, factory build-ing and infrastructure. Energy-saving and land-sav-ing houses and more underground constructionshould be developed in a big way. High yield andhigh quality of agriculture refers to reduction fromthe angle of land use. For example, rice yields 500kg/mu, while super-rice 800-1,000kg/mu; ordinary cornyields 500kg/mu, while fine breed corn yields 1,000kg/mu. That is to say yielding fine breed rice orcorn of uniform weight will use much less land com-pared with the ordinary breed. Another example, theraw sugarcane used by Guangxi Guitang (Group) Co.,Ltd. in the past was the ordinary breed of low yield3.5-4t/mu with 10%-20% sugar content, while thefine breed newly-introduced – No. 22 Taiwan Sugar-cane – yield 8-10 t/mu with 15% sugar content. Wecan see that the yield per mu of fine breed sugarcaneis equal to that of 2-3mu of ordinary breed, so yield-ing the same weight of fine breed can greatly reduceplanted area.
1.2 Save water
Agriculture, especially rice planting, is high wa-ter-consumption industry. In china the freshwaterper capita is 1/4 of that of the world; moreover, thefreshwater evenly distributes both spatio-temporallyand geographically. At present, 70% of water con-sumption attributes to agriculture. With the devel-opment of industrialization and urbanization, the ra-tio of agricultural water-consumption will decrease.Therefore, we should integrate water conservancy
Ji K. S. / Ecological Economy (2006)2:115-126
with water saving irrigation to change extensive freeflooding irrigation, advance water-saving agriculture,adjust the structure of agronomic crops and changeantagonism into adaptability. Even if water resourceis enough, we should pay great attention to it. Forexample, Austrian have realized that the less waterconsumption, the less pollution; therefore, they at-taches great importance to water saving even if thefreshwater per capita in Austria is 20,000 m3.
1.3 Save seed
15kg seeds are needed if one mu of wheat isplanted. However, 10kg seeds are needed if seedsare used scientifically. If the seeds are 1-odd yuan,more than 10 yuan can be saved. For example, thetechnology of dry raising, thin planting and seed-ling throwing have been popularized in LongquanTown in Dongzhi County of Anhui Province, 6kg ofearly rice seeds can be saved after experiment; thatis to say, 27 yuan per mu can be saved.
1.4 Save fertilizer
Abundant use of chemical fertilizer, especiallynitrogen fertilizer, not only affects the effect of fertil-izer but also causes imbalance of nitrogen,phosphorus, potassium and microelements in soil,compaction of the soil, weakness of land capability,and serious wastes. 46,366,000ton fertilizer was beused in China in 2004, with an increase of 79% com-pared with 1990. But more than 60% of the fertilizerflew without being absorbed to cause eutrophication,especially nitrogen fertilizer pollution i. e. nitritepollution. Therefore, advanced technologies, suchas surveying fertilization, fertilizer recommendationetc. should be greatly advanced to reduce produc-tion cost, improve soil pollution and water body pol-lution and guarantee the security of agricultural prod-ucts and people’s health and safety of their lives.
1.5 Save pesticide (including herbicides,antibiotics, hormones etc.)
Irrational overuse of pesticides, especially highly-
poisonous or high residue pesticides, not only re-stricts the export of agricultural products but alsoendangers the people’s health and the safety of theirlives. Therefore, pesticides should be usedscientifically; the production and utilization ofhighly-poisonous or high residue pesticides andoveruse of pesticides should be strictly prohibited;integrated control and biological control should begreatly advanced; substitution of biogas for pesti-cides should be advocated; virtuous eco-circleshould be applied to attract or multiply kinds of birdsfor prevention and cure of insects and diseases.
1.6 Save electricity
Advanced electricity-saving technologies,equipment, product, techniques and scientific man-agement should be greatly popularized to econo-mize the electricity for production and daily life inextensive rural areas.
1.7 Save oil
A lot of diesel fuel and gasoline are needed foragricultural machinery, which has great economicalpotential.
1.8 Save firewood (save coal)
In the areas where firewood, grass and strawsare used as fuels, advanced firewood-saving stovesshould be popularized and straws, rice husk, woodor bamboo chips can be processed into clean carbon;while in the areas where coal is used as fuel, coal-saving technologies should be advanced to reducecoal consumption and control environmentalprotection.
1.9 Save food
The waste of food is now very serious in urbanand rural areas, especially in cities and areas whererestaurants and university dining halls are locate.Processing industries that use food as raw materialshave great potential. The ratio of meat to feedstuff
can be increased and food can be economized inscientific ways.
Indeed, these are a part of examples in rural areas,and there are a lot needed to pay attention to.
1.10 Reduce workforce
Reduce peasant workforce to engage in singleproduction. According to different requirements fordifferent skilled workforce, the departments con-cerned should provide technical training to improvepeasants’ quality and skill toward market organically.It is an effective way of resolving current contradic-tions in rural areas, transferring rural labor force intobusiness of urban areas, and increasing peasants’income.
According to different conditions, different ar-eas can analyze and research on the “save nine re-duce one” mentioned above and take effectivemeasures. “Save nine reduce one” can not only re-duce agricultural production cost and lighten peas-ants’ burden but also increase peasants’ income andprotect agricultural eco-environment and effectivelycontrol agricultural area-source pollution. It is animportant and effective way of generalizing “Scien-tific Concept on Development”, changing agricul-tural increasing mode and carrying out sustainabledevelopment strategy.
2. Stress processing industry – the application ofreuse rule
The processing of agricultural products is thebridge connecting the primary industry with the sec-ondary and the tertiary industries and is the keymeasure to solve the glut of agricultural productsand the phenomenon of increasing output withoutincreasing income. It needs the promotion of theprocessing industry of agricultural products to ac-celerate the adjustment of economic structure in ru-ral areas. The development of the processing indus-try of agricultural products should be market-ori-ented and depend on the progress of technologyand science, improve the processing utilization ofagricultural products and transfer primary process-
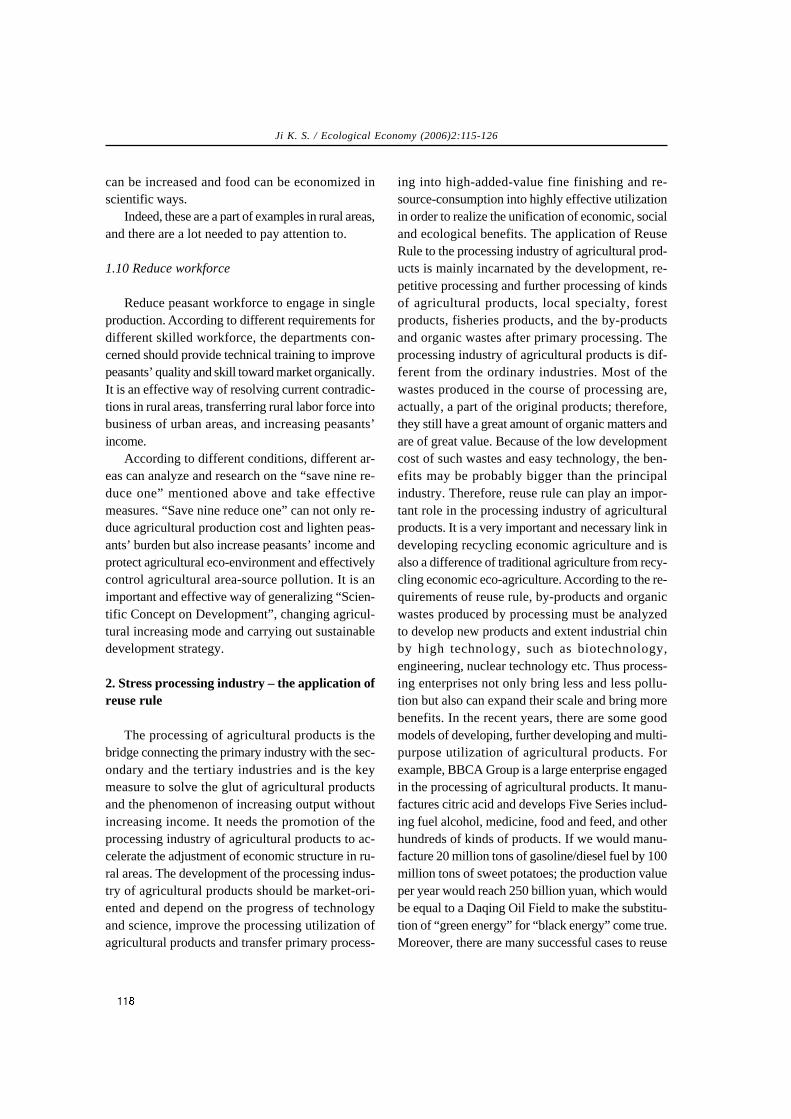
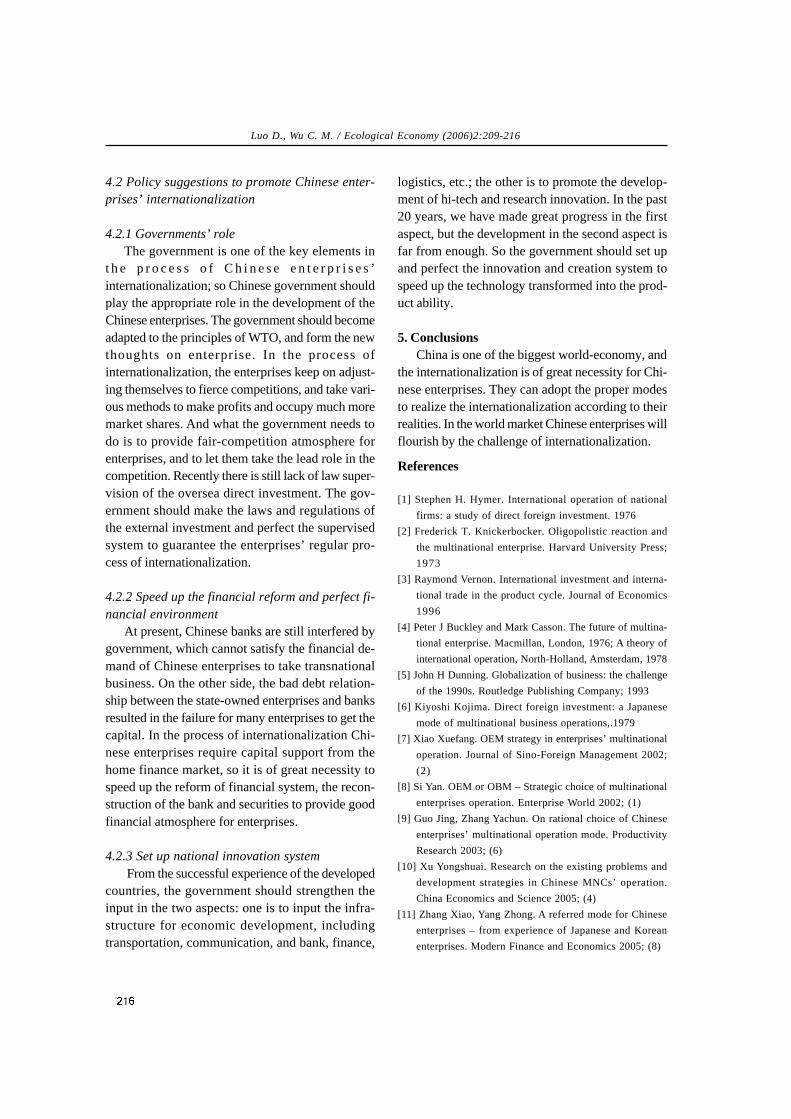
ing into high-added-value fine finishing and re-source-consumption into highly effective utilizationin order to realize the unification of economic, socialand ecological benefits. The application of ReuseRule to the processing industry of agricultural prod-ucts is mainly incarnated by the development, re-petitive processing and further processing of kindsof agricultural products, local specialty, forestproducts, fisheries products, and the by-productsand organic wastes after primary processing. Theprocessing industry of agricultural products is dif-ferent from the ordinary industries. Most of thewastes produced in the course of processing are,actually, a part of the original products; therefore,they still have a great amount of organic matters andare of great value. Because of the low developmentcost of such wastes and easy technology, the ben-efits may be probably bigger than the principalindustry. Therefore, reuse rule can play an impor-tant role in the processing industry of agriculturalproducts. It is a very important and necessary link indeveloping recycling economic agriculture and isalso a difference of traditional agriculture from recy-cling economic eco-agriculture. According to the re-quirements of reuse rule, by-products and organicwastes produced by processing must be analyzedto develop new products and extent industrial chinby high technology, such as biotechnology,engineering, nuclear technology etc. Thus process-ing enterprises not only bring less and less pollu-tion but also can expand their scale and bring morebenefits. In the recent years, there are some goodmodels of developing, further developing and multi-purpose utilization of agricultural products. Forexample, BBCA Group is a large enterprise engagedin the processing of agricultural products. It manu-factures citric acid and develops Five Series includ-ing fuel alcohol, medicine, food and feed, and otherhundreds of kinds of products. If we would manu-facture 20 million tons of gasoline/diesel fuel by 100million tons of sweet potatoes; the production valueper year would reach 250 billion yuan, which wouldbe equal to a Daqing Oil Field to make the substitu-tion of “green energy” for “black energy” come true.Moreover, there are many successful cases to reuse
Ji K. S. / Ecological Economy (2006)2:115-126
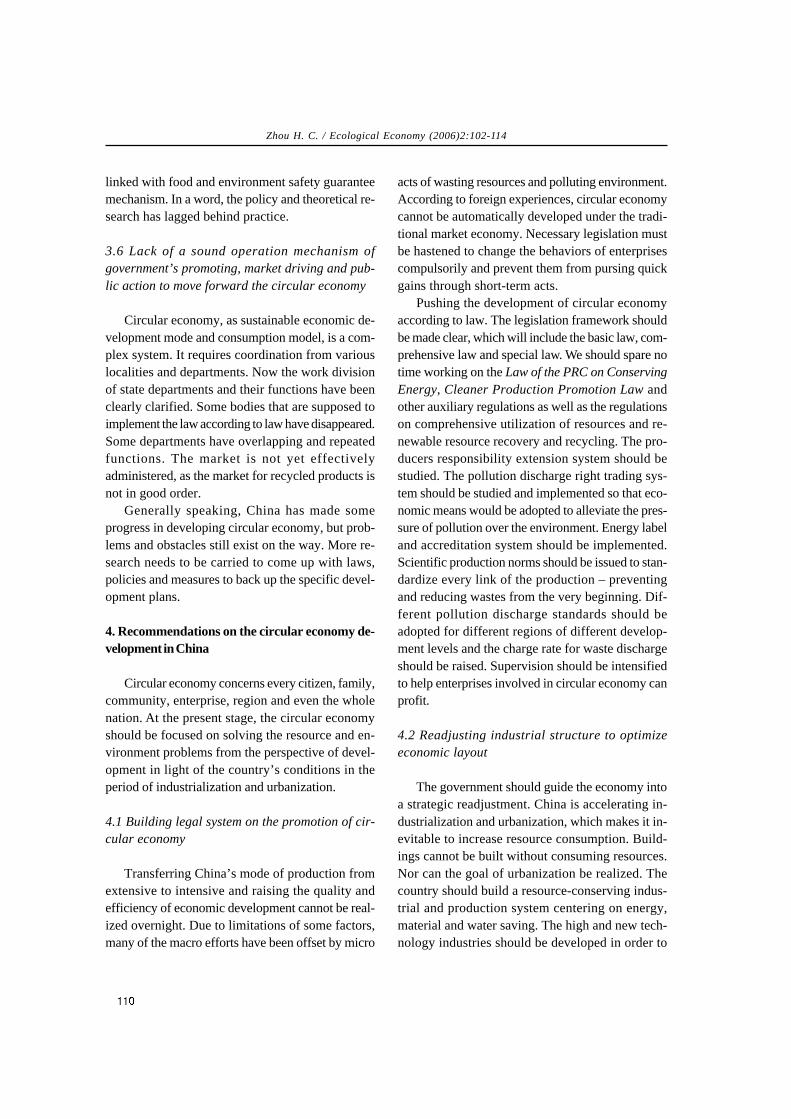
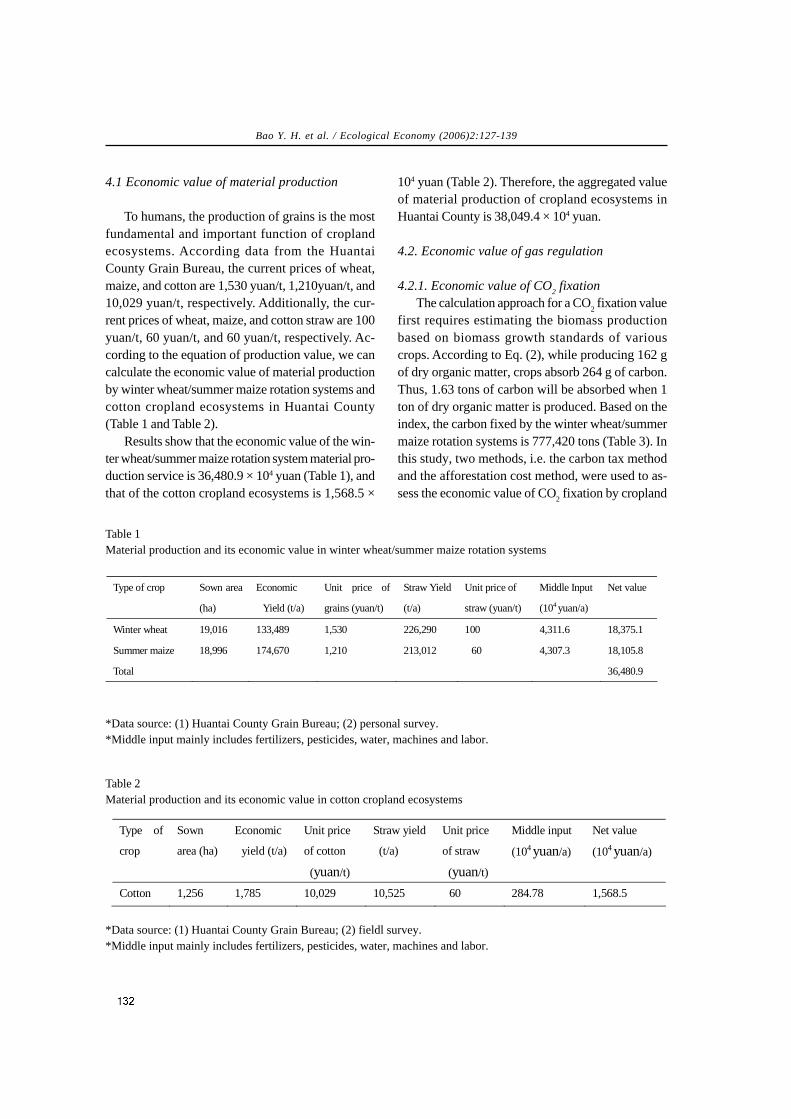
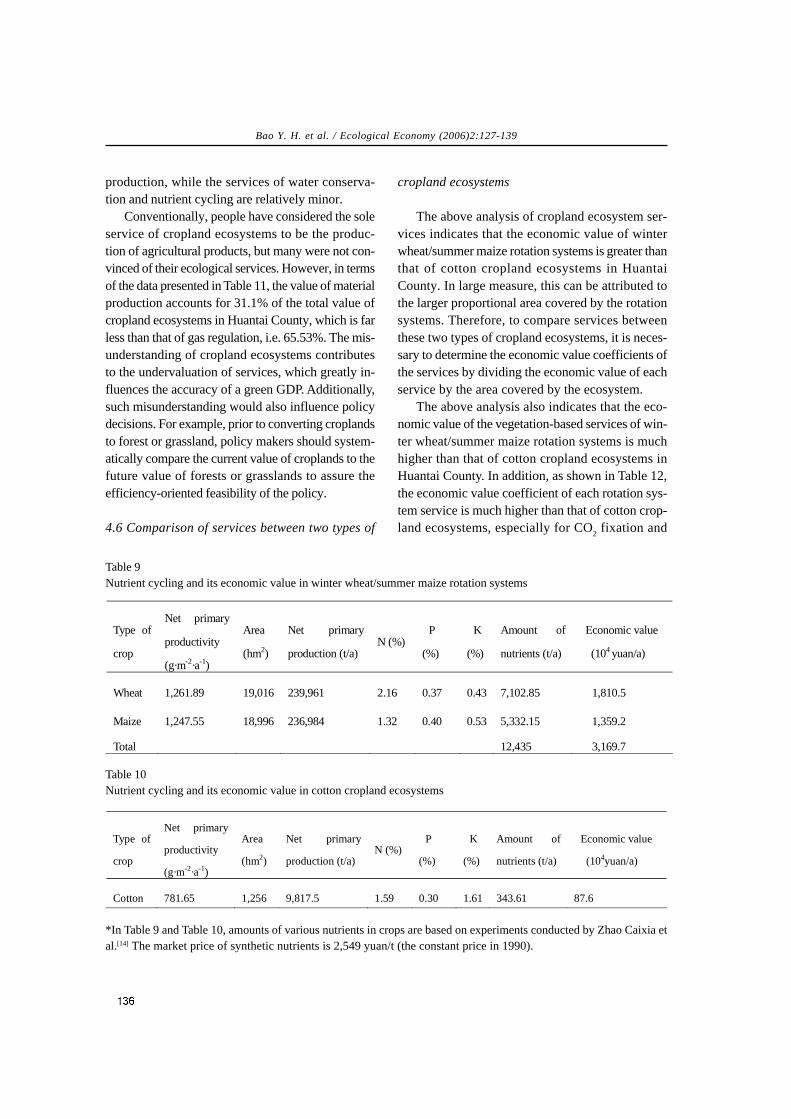
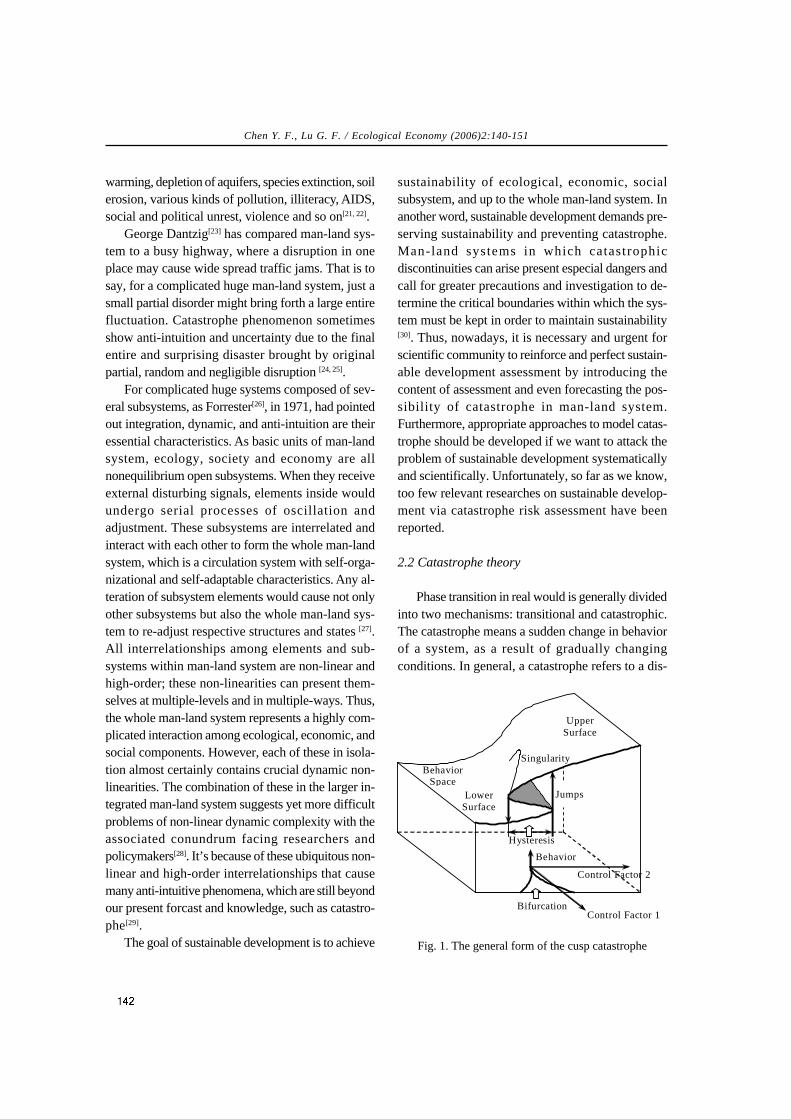
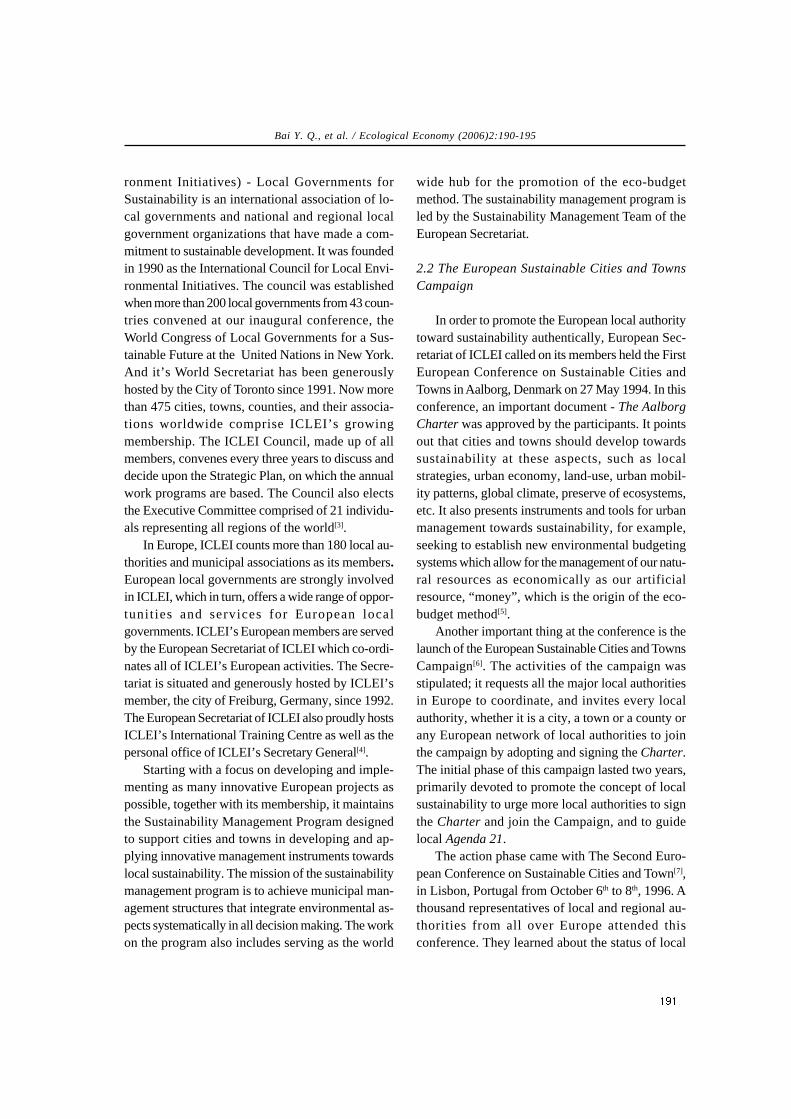
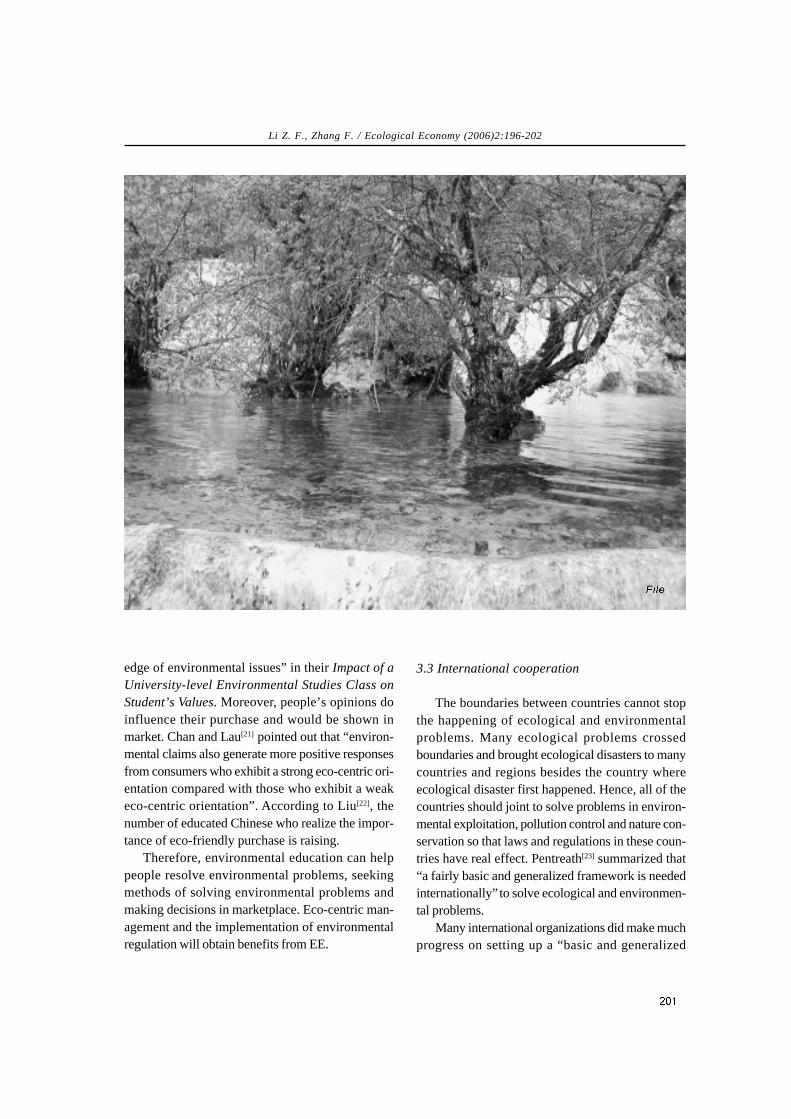
farmland
grain, melon,
fruit, vegetable
brewage
distiller’s grain
Further
processing of
feeding
cattle
cattle
excrement
drying
edible fungi
manure from
fungi residue
substitution
of marsh
fluid for
pesticidesubstitution
of residue for
manure edible fungi
marsh residue
culture medium
manure from
fungi residue
farmland
grain
straw
amination cattle
urine
biogas
clean
energy
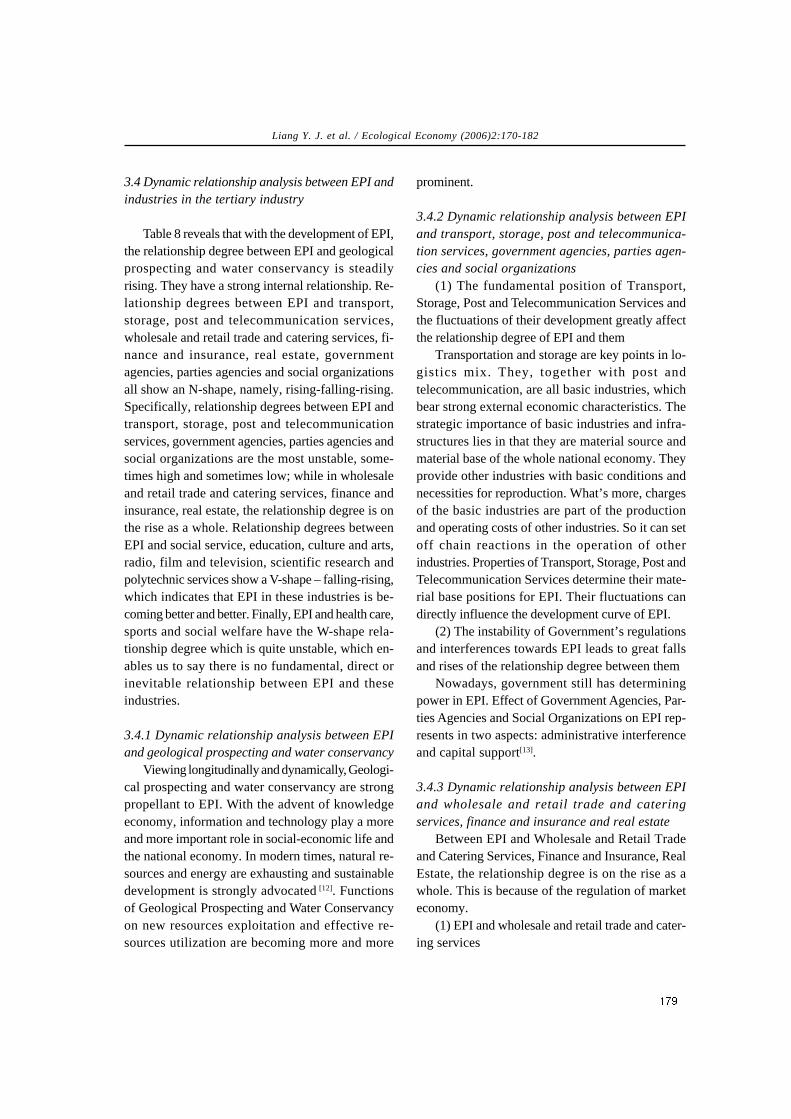
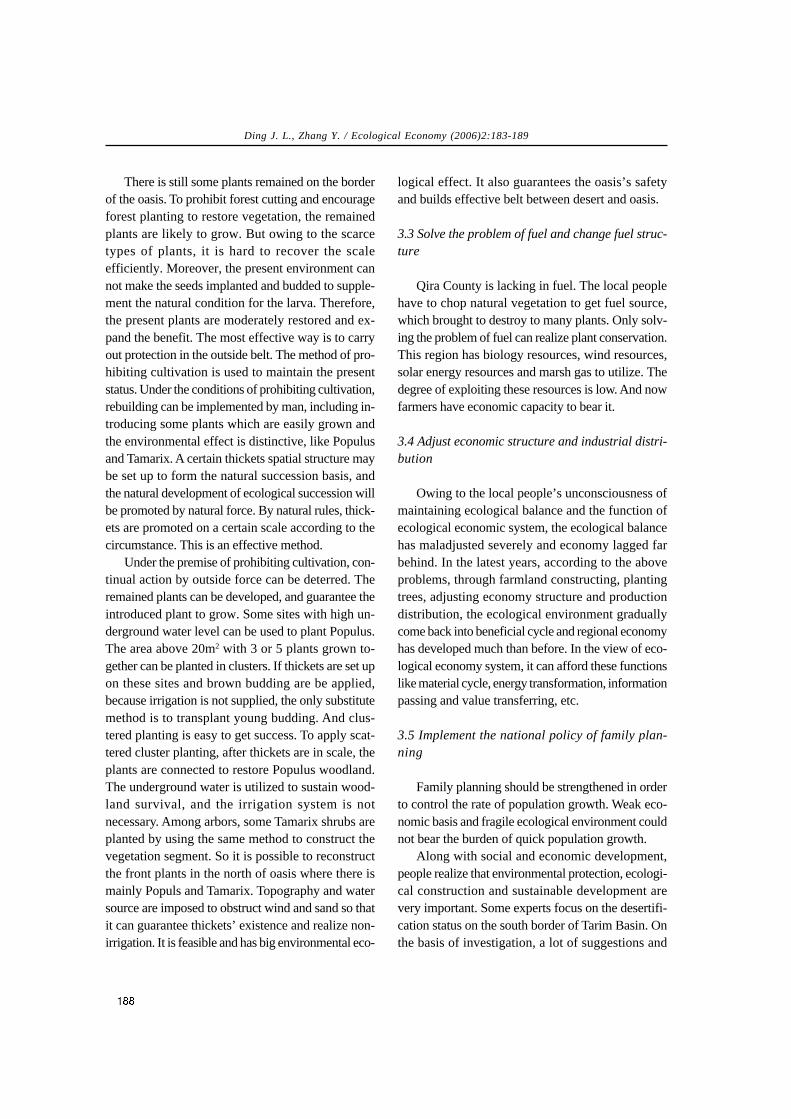
Fig.1 Cattle feeding circular economy flowchart1 of Changguan County in Linquan Town
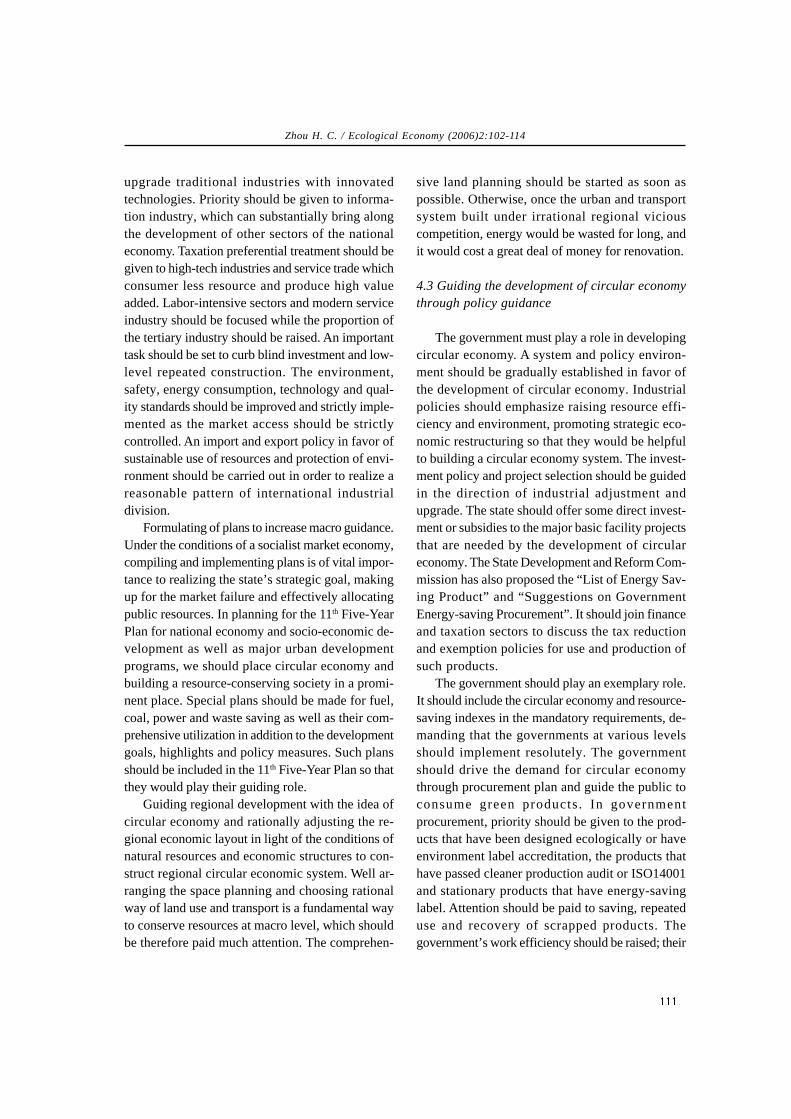
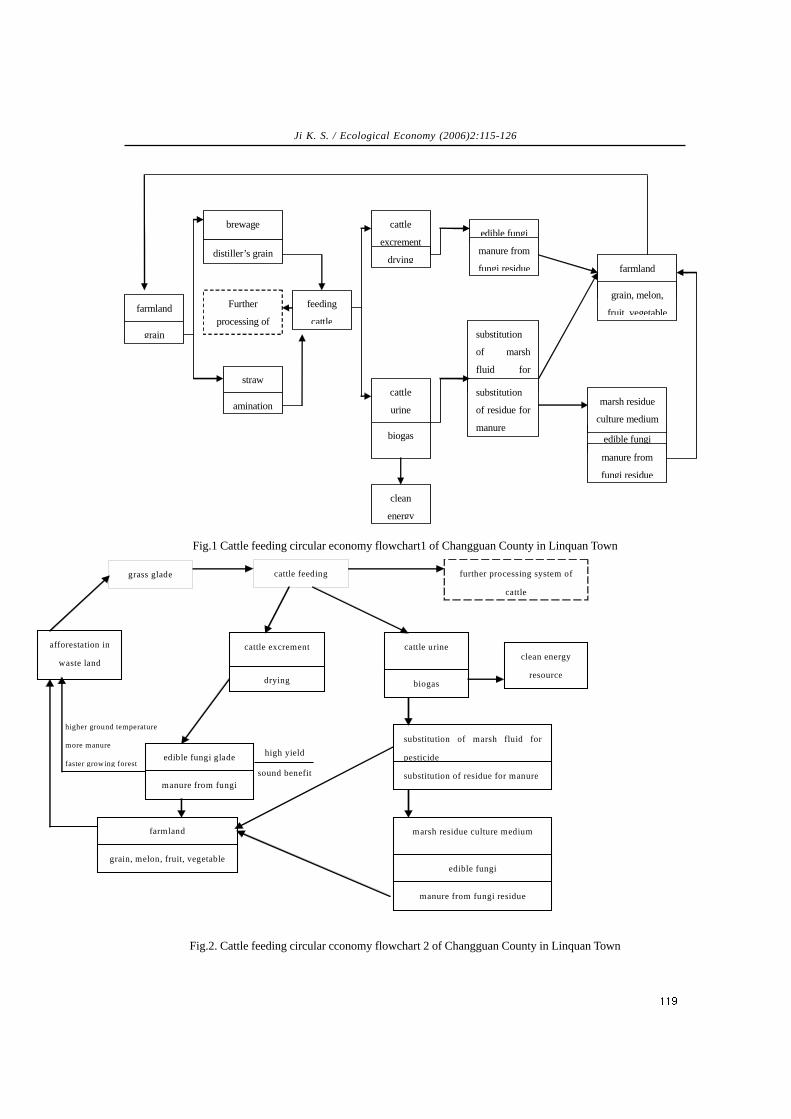
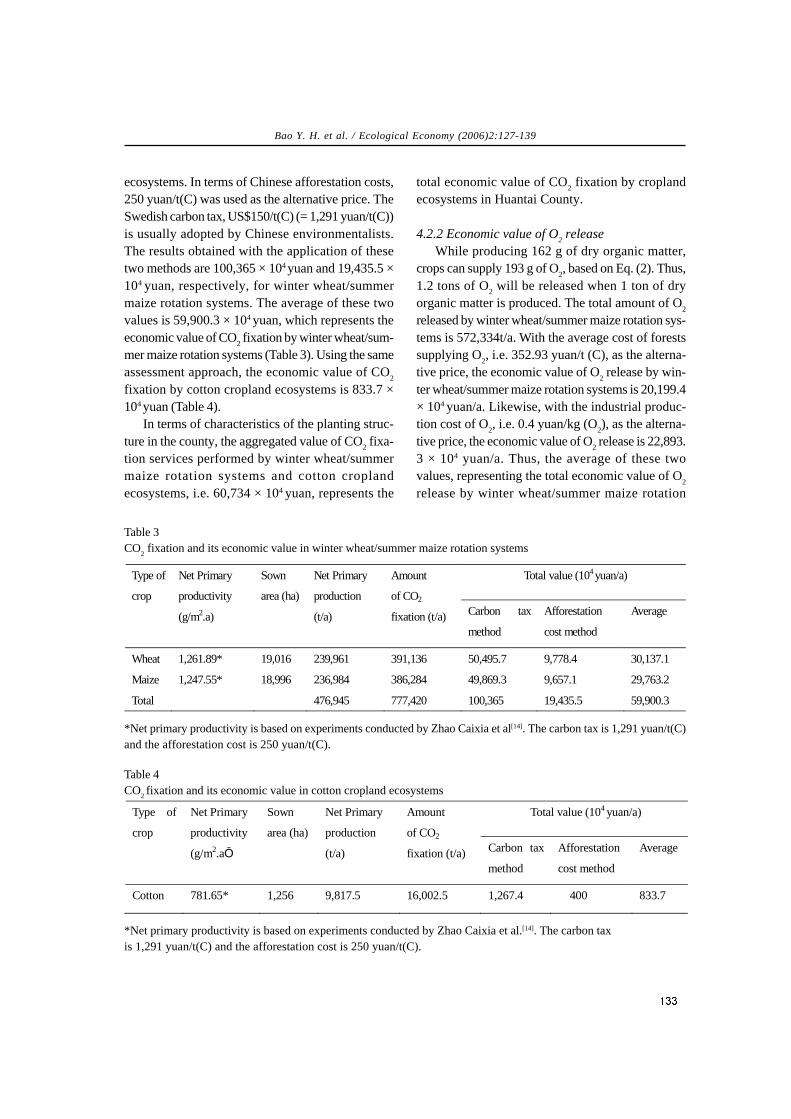
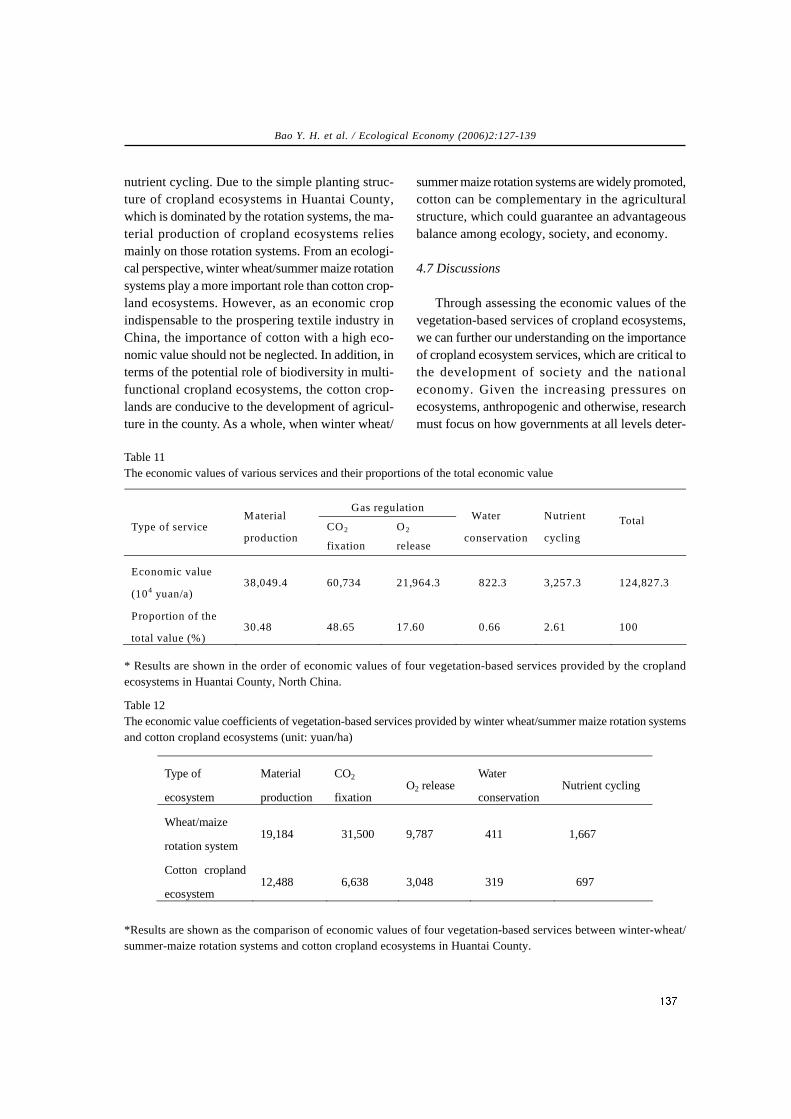
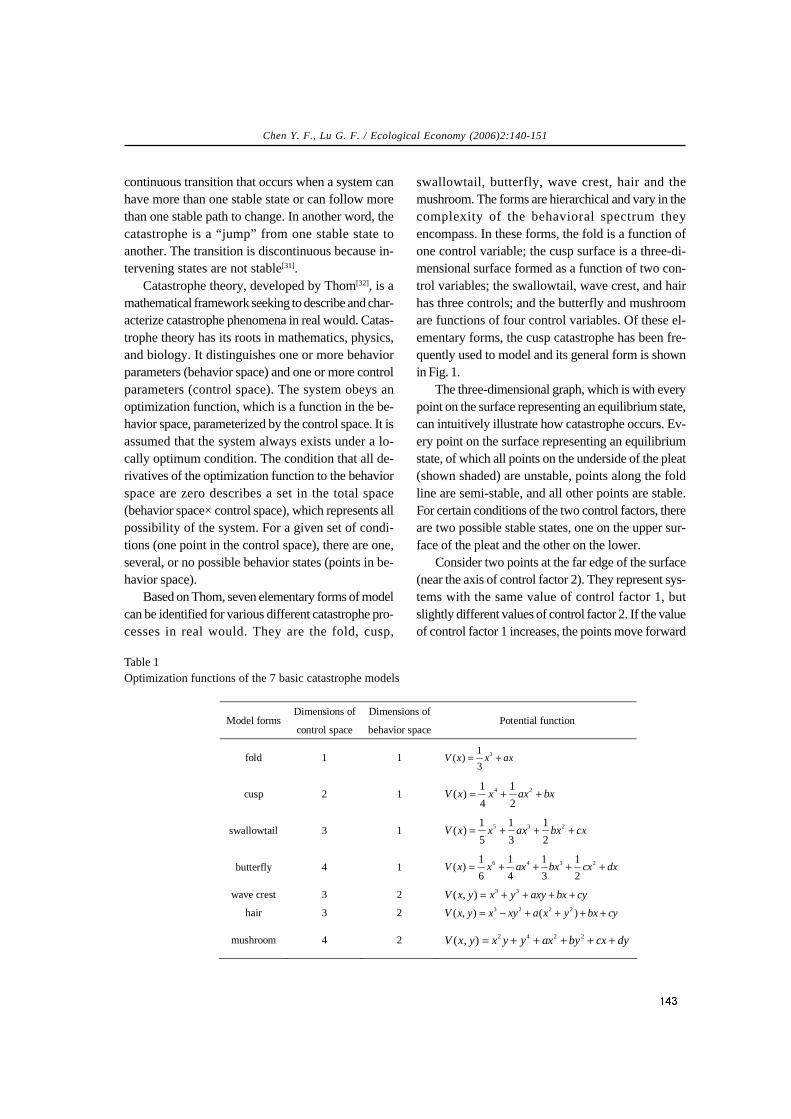
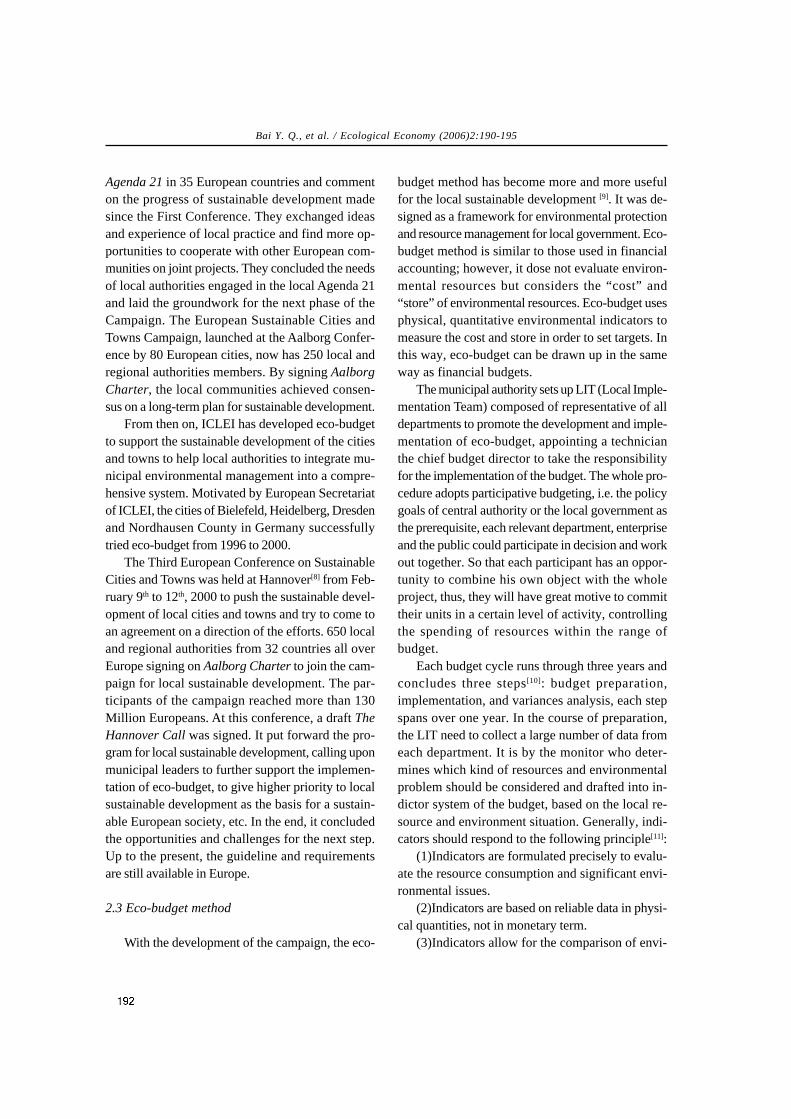
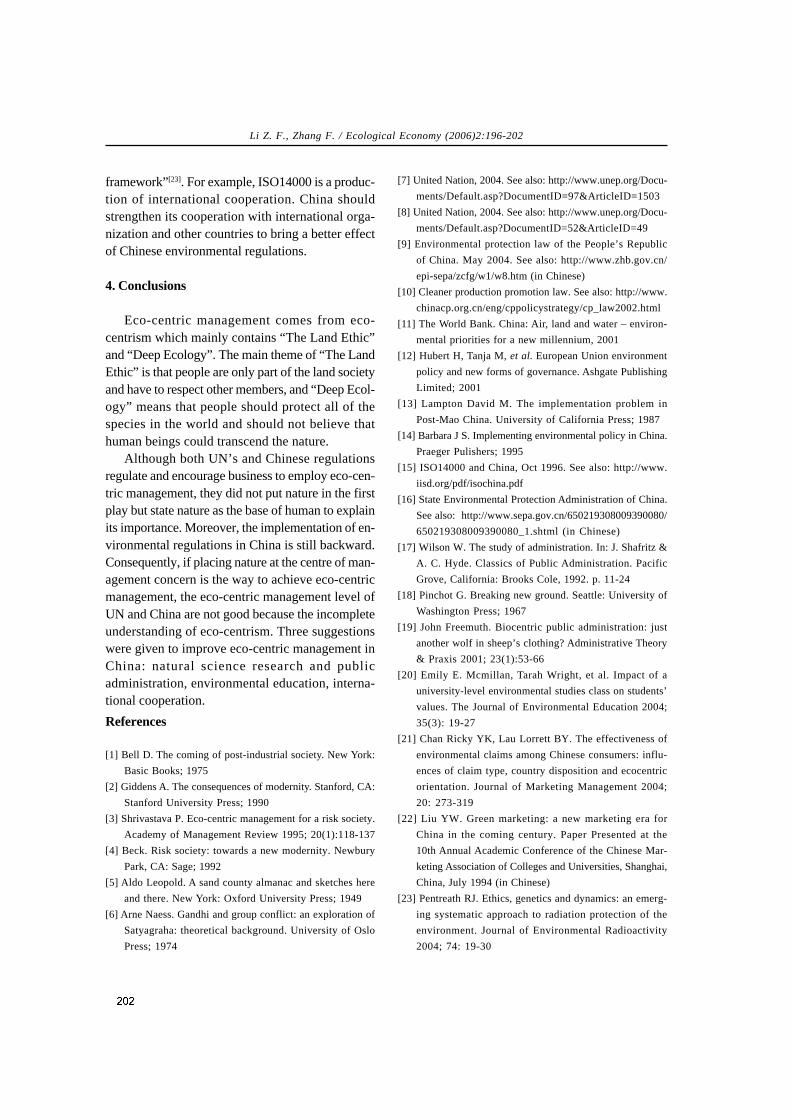
grass glade cattle feeding further processing system of
cattle
afforestation in
waste land
cattle excrement
drying
cattle urine
biogas
clean energy
resource
edible fungi glade
manure from fungi
farmland
grain, melon, fruit, vegetable
substitution of marsh fluid for
pesticide
substitution of residue for manure
marsh residue culture medium
edible fungi
manure from fungi residue
high yield
sound benefit
higher ground temperature
more manure
faster growing forest
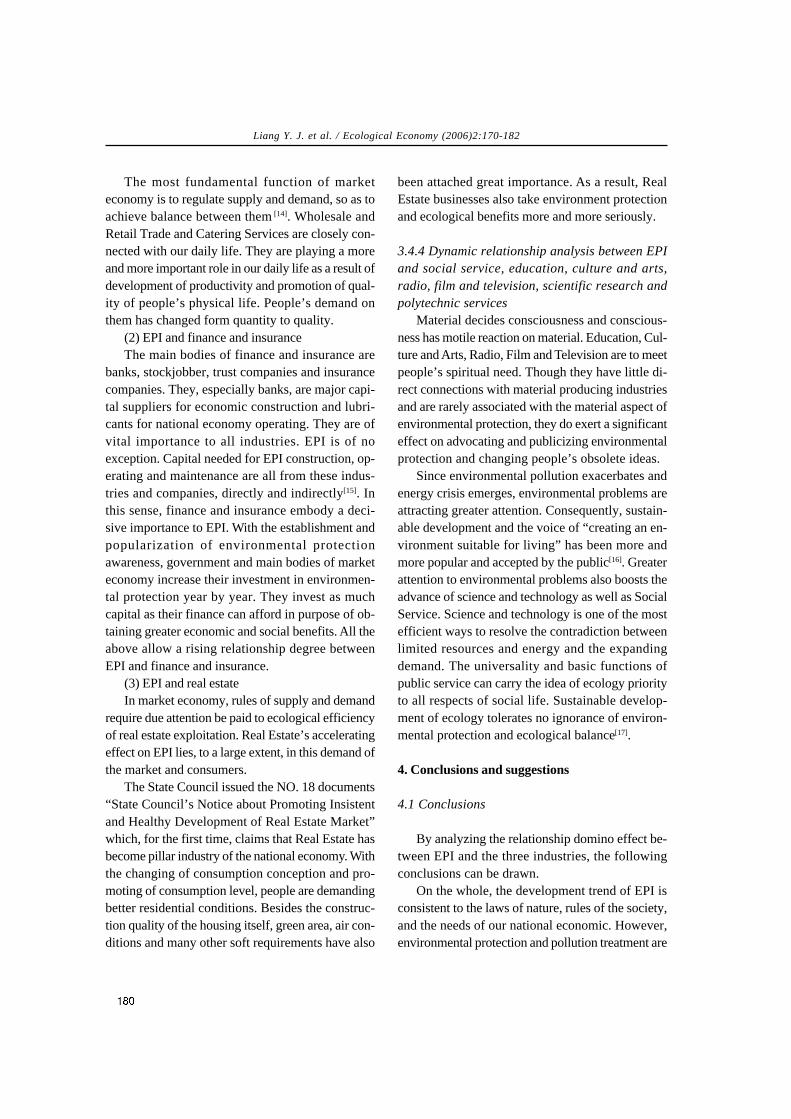
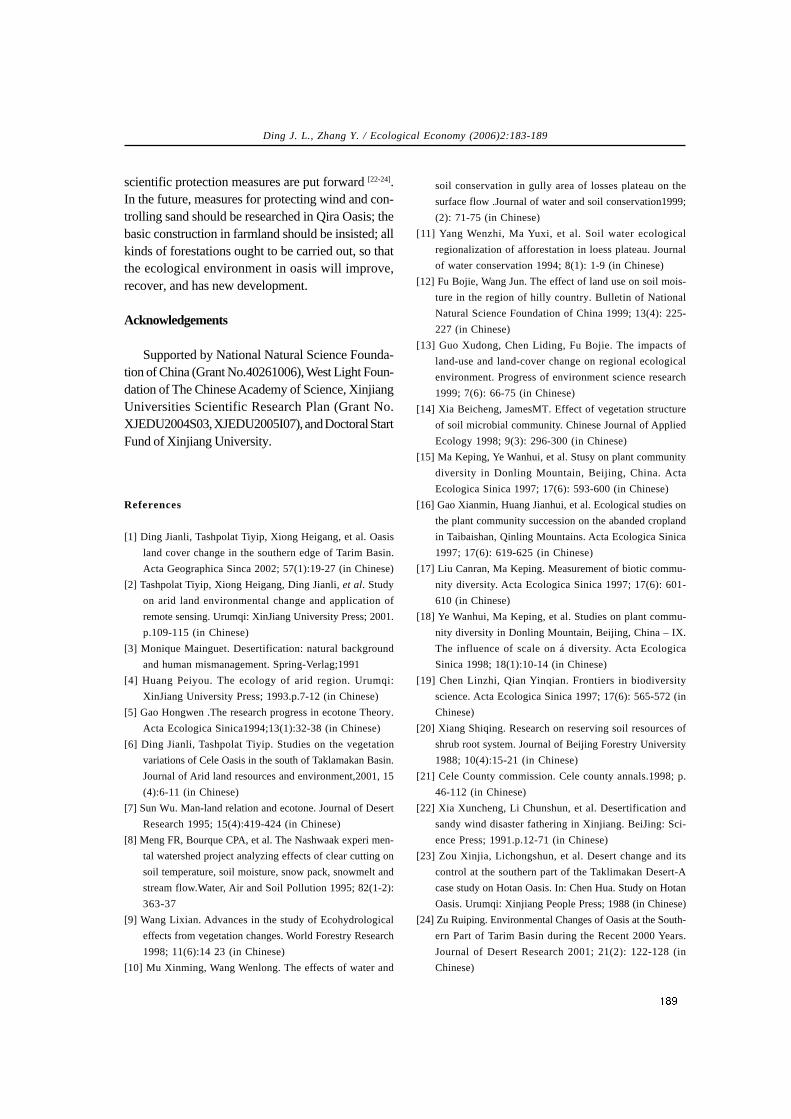
Fig.2. Cattle feeding circular cconomy flowchart 2 of Changguan County in Linquan Town
Ji K. S. / Ecological Economy (2006)2:115-126
straw or other biomaterials. For example, Feixi Countyof Anhui Province generates electricity by rice huskto save 0.21 yuan per kilowatt hour. Grinding rapestalk, cotton stalk, beanpod stalk etc. can be alsoused for electricity generation; solid wastes andwaste gas and water can be reused. Reutilizationcannot only solve pollution problems in rural areasbut also bring remarkable economic, social and eco-logical benefits.
3. “White agriculture” – the application of recyclerule
In the Second International White AgricultureSymposium in Beijing in April, 2004, Chinese andforeign experts consider microorganism as treasure,calling it “white agriculture”. Nuisance-free greenfood, non-pollution feed, manure and fertilizer, andother energy sources can be produced frommicroorganism. Experts say that we must make useof microorganism resources because the world isconfronted with problems of population, resources,and environment. The traditional agriculture depen-
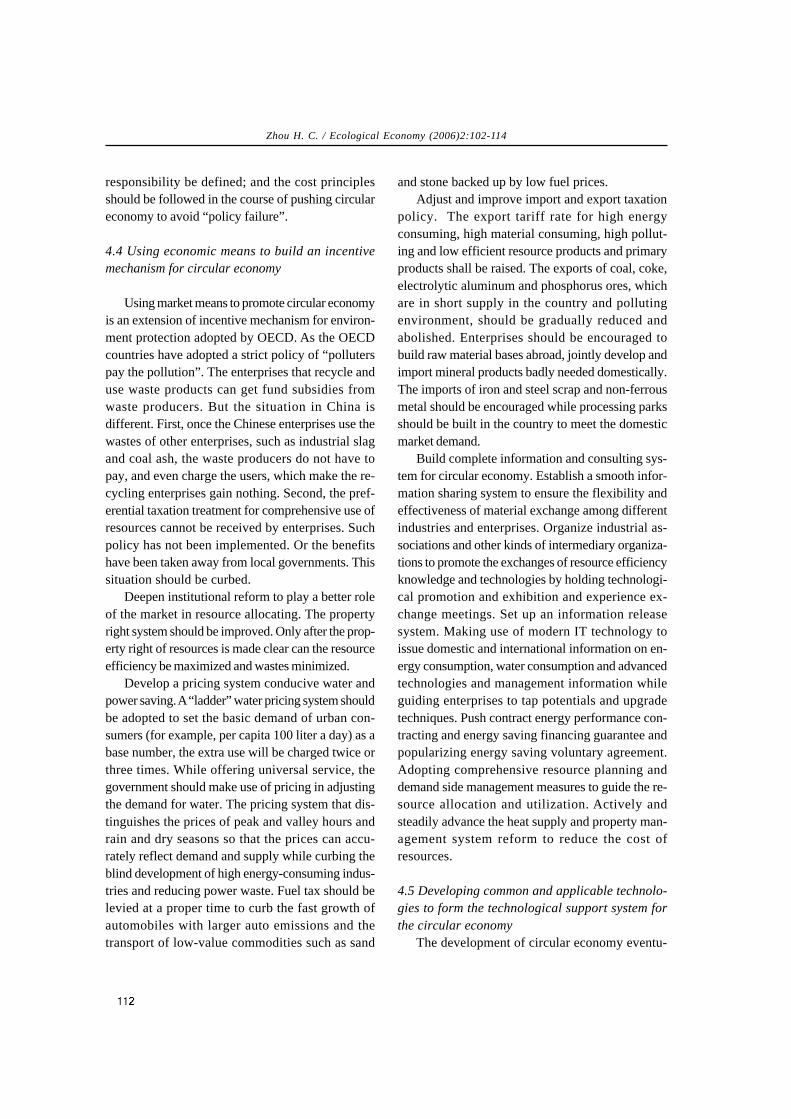
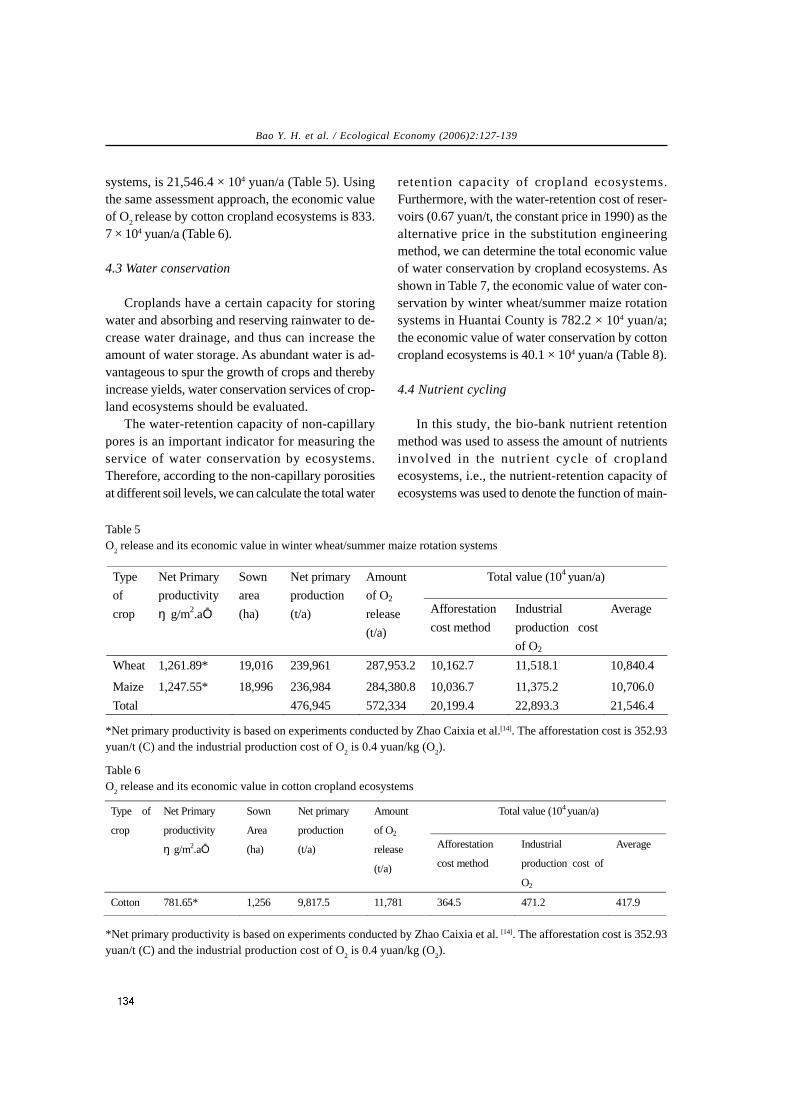
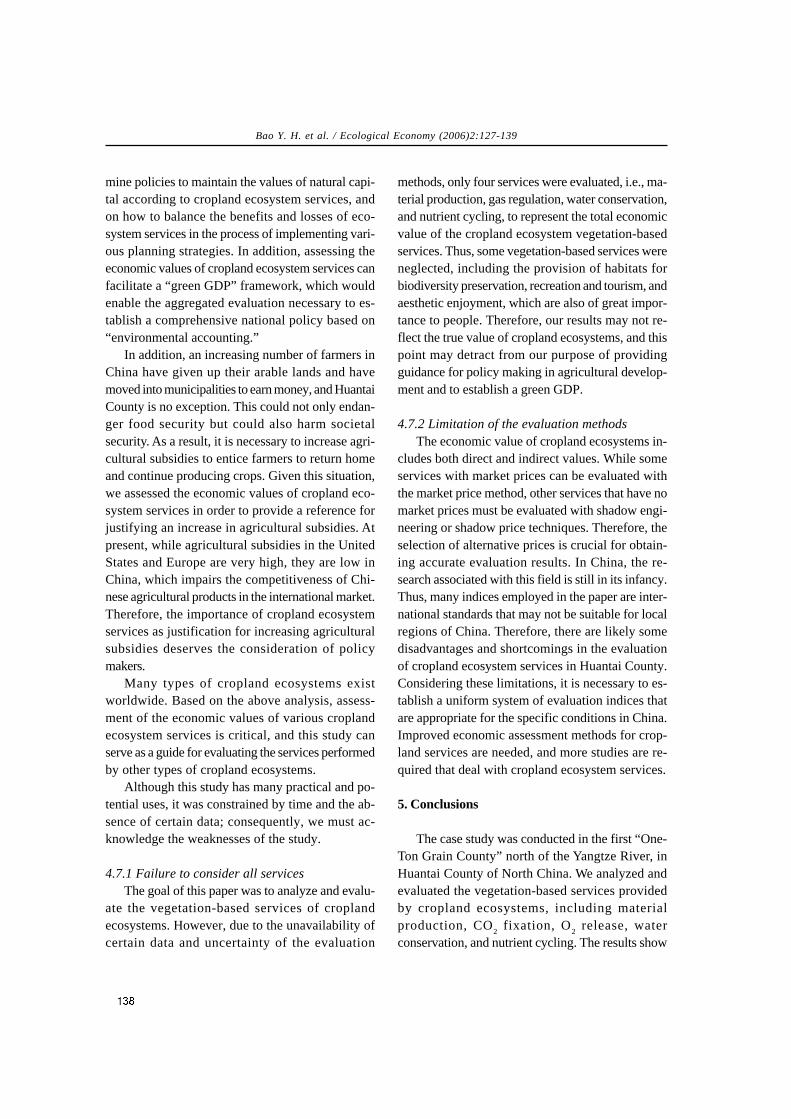
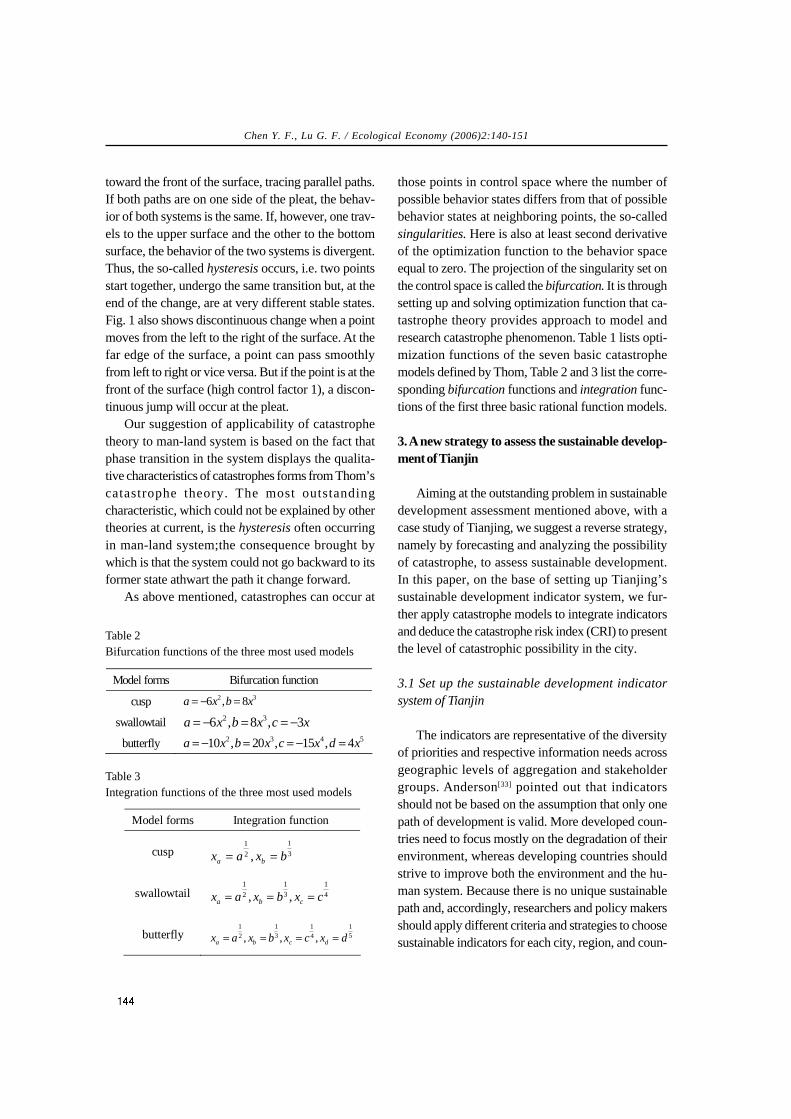
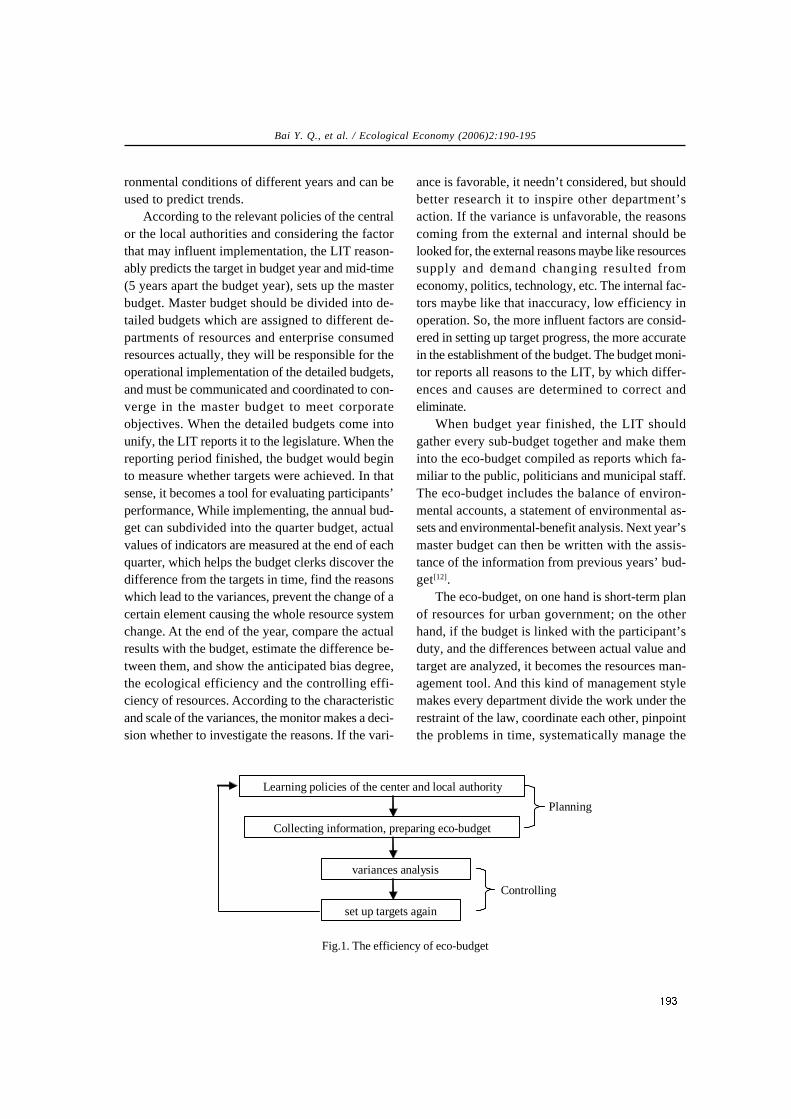
farmland
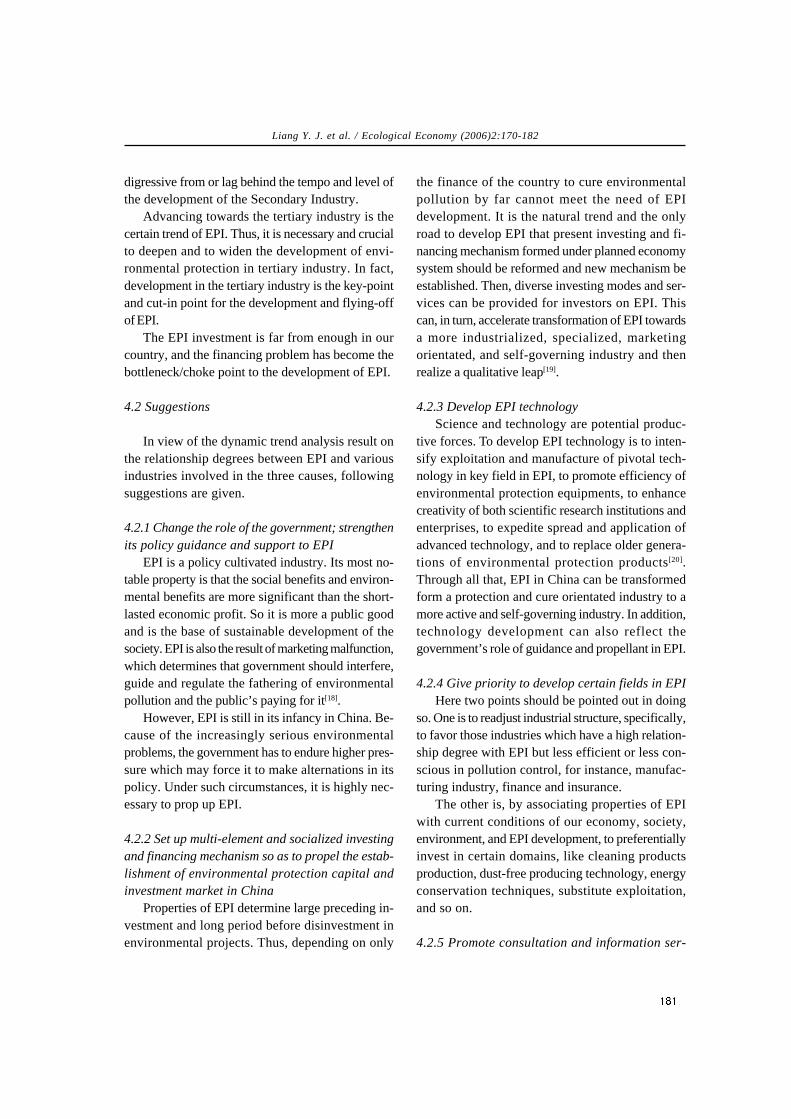
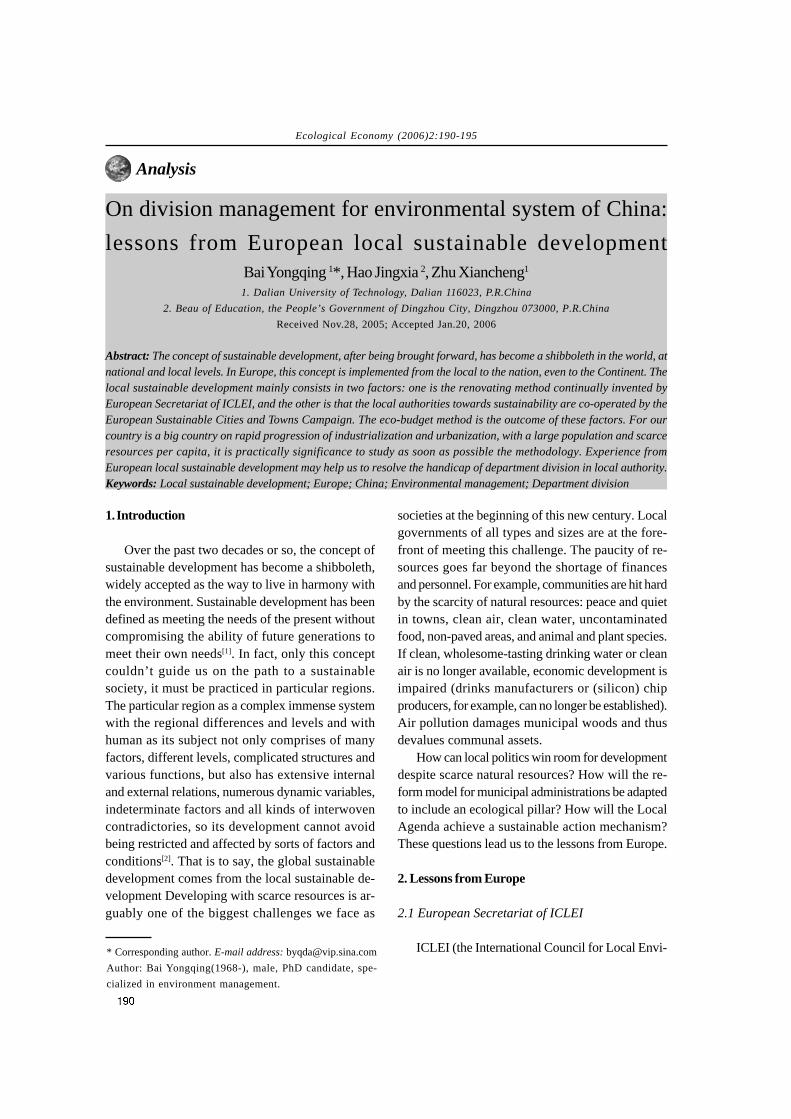
Fig.3. Goose feeding circular economy flow chart
dent on water and land will reach its carrying capac-ity limit. Therefore, we should find a new way ofdeveloping agriculture. The dean of Chinese Acad-emy of Agricultural Sciences, Dr. Zhai Huqu, thinksthat “utilizing microorganism resources can appeasethe contradict ion between resources andenvironment.” He said that in the recent years Chinahas made a great success in developing an agricul-tural microorganism resource – biogas and in pro-ducing alcohol by microorganism fermentation tech-nology to substitute for the draining petroleumresource. It can be forecast that white agriculturewill solve energy shortage and “issues concerningagriculture, countryside and farmers”. The conceptof white agriculture was originated from China. It isa new type industrialized agriculture with microor-ganism industry as its center to extent dependenceof traditional agriculture on animals and plant re-sources to the utilization of new resource –microorganism. Moreover, through white agriculturethe quality of farming and stockbreeding productscan be improved, environmental pollution can be
Ji K. S. / Ecological Economy (2006)2:115-126
prevented, and agricultural products value can beincreased. Therefore, it is a new way of increasingpeasants’ income (see Fig.1, Fig.2, Fig.3)
Nowadays biogas, which can provide peasants’production and life with clean resources, is very popu-lar in rural areas. Feces discharged by people andanimals and agricultural wastes are fermented; thenbiogas is produced. Maoji pilot area in Huainan ofAnhui produces biogas from feces of largehoggeries, which is then used to produce electricitywith the cost of 0.15 yuan per kilowatt hour. And theleftover of producing biogas, marsh fluid, can sub-stitute for pesticides; the residue can substitute formanure. The advantages of biogas can be concludedas follows: driving structure adjustment, promotingthe development of culture industry, reducing pro-duction cost, improving quality, solving problemsof chemical residue, providing clean energyresources, protecting forest resources, increasingproduction and peasants’ income, treating wastewater, opening the way of keeping products fresh,improving the clean environment in rural areas, pre-venting area-source pollution, raising the level ofrural civilization, and narrowing down the differencebetween town and countryside.
4. Protect eco-environment and develop agricul-tural product of good quality and safety – the appli-cation of rethink rule
4.1 Stress ecological construction and ecologicalcapital
In the early 2000, I put forward that if we diddeep research on and made full use of eco-environment, it could directly bring economicbenefits. i. e. We should stress eco-environmentcapital operation. Later, I put forward the concept ofeco-environment operation, which can further reflecthuman’s subjective initiative, enthusiasm andcreativity. Not only fine eco-environment must beprotected and made full use of, but also moderateeco-environment must be further optimized and de-veloped and the poor or destroyed eco-environmentmust be developed and made full use of based on
treatment and reconstruction. There are many ar-ticles about this; only several are mentioned in thefollowing. (1) Control and prevent soil erosion andmanage small watershed well. (2) Forestry: the hillsare setting apart for tree growing; we must developa way of being well-off with little wood cutting. Grainfor green. The ecology is the base, so we shouldfirst find out the local primary ecological appearance.(3) In rice-growing area, the low-yielding tea gardenshould be improved, including improving soil(deepening furrow, suspending tray, burying twigs,improving soil quality and building organic manurehouses and reservoirs), garden, seed (fine seed), pickmanagement and processing. (4) The governmentof Xinjiang Region encourages peasants to plantjuniper tamarisks and to inoculate desert cistanchein order to control sand and protect the valuableChinese traditional medicine – desert cistanche andto increase the peasants’ income with 3,000 yuan to5,000 yuan per mu. (5) Inner Mongolia Region hasdeveloped well in sand industry. For example, theMongolian willow, whose life is 3 to 4 years in thedesert before, is now use to produce wrapping pa-per of superior grade and its twigs can feed the sheepand cattle so that the pollution problem has beensolved, and peasants’ enthusiasm to control sandby planting Mongolian willows has been spurred.Thus we can not only control sand but also get “threewins” of economy, society and ecology. (6) It is typi-cal mode of ecological environment operation to de-velop “pasture fence” in the western grassland inorder to control pasture degradation, prevent rodentpest and develop stockbreeding. (7) Control ruralarea-source pollution. Domestic sewage can betreated in the way of biogas anaerobic fermentation;domestic wastes should be classified to recycle andtreat. The compostable wastes should becomposted; the recycling system of glass fragment,metal things, waste paper, waste plastic and all kindsof wastes of the secondary and tertiary industry mustbe established to increase resource utilization rateand innocent treatment rate. (8) In the town, whenthe waste water of ditches and ponds is treatedproperly, the value of the surrounding land willincrease.
Ji K. S. / Ecological Economy (2006)2:115-126
4.2 Make a great effort to increase soil benefits
Develop agricultural products of safety and highquality. We cannot consider developing safe foodas a pure problem about eco-agriculture or food. It isonly way for the Chinese agriculture to combine theprimary, secondary and tertiary industries together,to link production to market and to coordinate keymulti-subjects. It is important for the quality improve-ment of agriculture, rural economy and marketcompetitiveness, the increase of production andpeasants’ income, sustainable recycling agriculturedevelopment, the ability to guide socialistic marketeconomy and the people’s health and safety.Therefore, developing safe food is a strategic issueconcerning the whole countryside and “Three Rep-resents” theory practice and Scientific Concept ofDevelopment.
Countermeasures of developing agriculturalproducts of safety and high quality:
(1) Three goalsFirstly, non-polluted, green and organic food
up to the standard that can meet the demands ofthe market should be provided to protect consum-ers’ rights. Secondly, active revenue productsshould be produced to increase peasants’ incomeand protect producers’ rights. Thirdly, we shouldbegin with protecting and optimizing agriculturaleco-environment and treating area-source pollutionso that the production of the agricultural productsof safety and high quality can be rapid, coordi-nated and healthy.
(2) Holistic pushAccording to years of experience, it’s not enough
to develop agricultural products of safety and highquality only in rural pilots; so we must popularize itin the whole town.
A. Holistic test: the soil, water, air and residue ofpesticide and heavy metals content of the main agri-cultural products in every town should be testedentirely.
B. Holistic plan: according to the results of test,we should make a scientific and holistic plan thatwhich should be developed as organic food, or greenfood, or non-polluted food.
C. Holistic authentication: experts of authorita-tive institutions of three kinds of safe food shouldbe invited to the town to guide on the spot in orderto lighten the burden on peasants and enterprises(time and money), guarantee the quality of products,enlarge the production scale and speed up develop-ing agricultural products of safety and high quality.
D. Holistic brand: integrate existing brands thatcannot cancel each other out.
E. Holistic sale: it’s an urgent problem how todevelop the market of the agricultural products ofsafety and high quality. Establishing credit relation-ship is basic solution to the problem.
F. Holistic implementation: the government at alllevels must coordinate and develop agricultural prod-ucts of safety and high quality.
(3) Eight systemsSystem of Quality Standard, System of Test, Sys-
tem of Science and Technology, System of MarketInformation, System of Adequate and SystematicService, System of Circulation and Sale, and Systemof Legal Supervision.
Science and technology is an important factor todevelop Circular Economy in rural areas; yet low-cost, cost-effective and environmental friendly tech-nology should be adopted, and advanced designand experiment methods such as cooperatingorthogon etc. should be generalized.
(4) Five safeguardsA. Leadership and coordination improvement;B. vigorous mechanisms and more investment;C. wide advertisement and agreement;D. representatives establishment and combina-
tion of production and market;E. serious supervision and honest trade.
5. Construction of ecological villages and towns re-ferring to the concept of circular economy
The thought on the construction of ecologicalvillages and towns referring to the concept of circu-lar economy can be concluded as follows: achieveone goal, transform two modes, strengthen threefunctions, establish four systems, and make fiveplans.
Ji K. S. / Ecological Economy (2006)2:115-126
5.1 One goal
One goal refers to “constructing a well-off soci-ety in an all round” put forward in Sixteenth Na-tional Congress of the CPC and “developingproduction, rich life, civilized ethos, clean environ-ment and domestic management” put forward in theFifth Session of Sixteenth Central Committee of theParty.
5.2 The transformation of two modes
It refers to transforming economic growth modeand social development mode. It is not only the con-
notation of circular economy but also the key toconstructing ecological villages and countries. Inthe construction process, traditional extensive“single-way” and “linear” development mode of vil-lages and towns should be transformed into “recy-cling” and “benefiting” circular economic develop-ment mode.
5.3 Strengthen three functions
Firstly, eco-environment should be optimized inorder to further strengthen the function to provideecological services for the people in rural areas.Secondly, natural eco-system and resources should
C oun try side
C ity
S m all tow n
E co -in d u stry
E co -ag ricu ltu re
E co lo g ical serv ice in du s try
In d u stria l sys tem
W ater sys tem
Tran sp o rta tio n sy stem
R esou rce sys tem In fra stru ctu re sy stem
P o llu tion treatm ent
D isas ter p rev en tio n
A fforesta tion
S o cial p ub lic se rv ice sys tem
E du catio n
H ea lth care S c ien ce & tech n o log y
C u ltu re P h y sical cu ltu re
E co -en v iro n m en tal p ro tectio n
Fig.4 Circular economy chart of eco-town construction
Ji K. S. / Ecological Economy (2006)2:115-126
Ji K. S. / Ecological Economy (2006)2:115-126
be protected in order to further strengthen the func-tion to support economic and social development.Thirdly, circular economy construction should bestrengthened in order to guarantee the sustainabilityof the above functions.
5.4 Establish four systems
5.4.1 Circular economic industrial systemRecycling economic industries include eco-
industry, eco-agriculture and ecological serviceindustry. Eco-industry advocates clean productiontechniques and comprehensive utilization ofresources; eco-agriculture advances non-pollutedagricultural products, green and organic food; eco-logical service industry refers to developing eco-tourism, green restaurants and other green serviceindustries. It was put forward in the Fifth Session ofSixteenth Central Committee of the Party that Chinashould advance modern service industry and gradu-ally establish the industry system with an emphasison service industry.
5.4.2 Rural infrastructure systemThe key to rural infrastructure system is water
system, resource system, transformation system andconstruction system.
(1) Water system: water is the key to the ruraleconomic and social development. Four problems ofwater: flood, drought, dirty water and muddy watermust be solved. We should actively prevent floodingand drought, build houses following to the objectivelaws. Marsh, ponds and wash cannot be stuffed forconstruction; water source for daily life must beprotected; the consciousness of saving water shouldbe strengthened to develop water-saving agriculture,industry and service industry. Water net should bewell constructed for sound river bank environment.
(2) Resource system: in the rural area resourcesshould also be saved and renewable resourcesshould be generalized. Not only the individuals butalso the collectivity should use biogas. Solar en-ergy should be utilized. Design and constructionshould be simultaneous. Small hydropower shouldbe advanced in mountainous area. Geothermal
energy, tidal energy, wind power can be utilized inproper places.
(3) Transportation system: we should grasp theopportunity to develop roads in rural area, make all-around plans on road construction and design theroad allocation net. In order to construct eco-road inrural area, we must construct roads well, build houseswell, farm well, and make the rural area clean andcivilized.
(4) Construction system: energy-saving, land-saving and pollution treatment technologies andnon-polluted building materials should be appliedto new buildings. Building style should reflect localcharac te r i s t i cs and congruous wi th thesurroundings.
5.4.3 Eco-environmental protection system(1) Ecological construction: tree and shrubs,
grass, flowers and vines, needle-leaf and board-leaftrees should be planted mixedly. Ecology, matchingsite, economy, need and beauty of the trees shouldbe taken into consideration in order to temper theclimates, purify the air, preserve the water and soil,reserve water sources, and beautify the environment.
(2) Environmental pollution control: rubbish andwaste water in rural area should be treated properlyand effectively. In small towns rain and sewageshould be separated. Sewage can be treated in theway of biogas anaerobic fermentation, which canreduce cost and be effective. The treated sewagecan become the secondary water, which can be re-used as intermediate water. The system of reuse ofrubbish and non-pollution treatment should begradually established.
(3) Natural disasters prevention: the choice ofthe location of small towns is very important. Theinfluences of natural disasters on the towns shouldbe taken into consideration. Therefore, small townsshould not be built in the frequent-earthquake places.The towns built in the lower reaches of reservoirsshould take measures against flood. Moreover, smalltowns cannot occupy riverways, riverbed and soon.
5.4.4 Social career system
In rural area public service should be advanced,culture and education should be speed up, publicsanitation and health service should be improvedand new type cooperated medical treatment systemshould be popularized. Science and technology,education, culture, sanitation and physical cultureshould be arranged comprehensively, where moreshould be invested. The concept of all-round devel-opment should be established.
Fig.4 reflects the thought on comprehensive ar-rangement of economic and social development incity and countryside. Every system is establishedfollowing the concept of circular economy, and thefour systems can also form a whole circle. City andcountryside, industry and agriculture depend on andpromote each other to form a virtuous circle.Nowadays, the important aspect of contradiction isthat city supports countryside and that industry sup-ports agriculture. Thus “issues concerningagriculture, countryside and farmers” can be solvedto push the construction of all-round well-off soci-ety in rural areas.
5.5 Make five plans
5.5.1 Plan designBecause of the differences of areas, topography,
physiognomy, resources, climates, customs,traditions, building style, production and life, thefollowing points should be paid attention to in theplan design of the town. Firstly, different character-istics should be reflected. Secondly, the basic con-ditions for local social and economic developmentshould be start with. Thirdly, now and future, partand the whole, economic functions and socialfunctions, practical value and visual value, foreignexperience and Chinese traditions, present abilityand the potential of reform and opening-up shouldbe integrated; history, traditions, culture,characteristics, ecology and environmental protec-tion should be attached great importance to.Fourthly, the functions of towns should be clear.Which industries can be developed? What guaran-tees the development of towns? Transferring peas-ants to towns, or building enterprises, roads and
houses is not urbanization. An eco-town can ab-sorb exotics and be open. Otherwise, the town willbe lifeless. Moreover, functional area constructionshould be planned scientifically and arrangedreasonably.
5.5.2 Environmental design here refers to eco-en-vironmental design of towns
Eco-environment of towns, including the con-struction of forestry, agriculture, water conservancyetc. must be constructed and optimized accordingto the scale, industrial structure and allocation ofthe town in order to improve bearing capacity of thetown’s eco-system, and guarantee and promote eco-nomic and social development of the town.
5.5.3 Residential area designResidential area should be planned and designed
scientifically and ecologically according to eco-con-struction principles to form man-made eco-environ-ment made up of eco-buildings and eco-infrastruc-ture and social eco-environment involving culture,ethics, laws and spirit. The design of rural housescannot simply copy that of urban houses. It must becongruous with eco-environment and characteristic,and it must be comfortable, beautiful, clean,applicable, adiabatic, heat insulated, ventilated, en-ergy-saving, and land-saving. If possible, eco-yardeconomy can develop.
5.5.4 Industrial designFirstly, rural industrial design must reach the re-
quirement “developing production, rich life, soundecology”. Secondly, local natural resources, humanresources, talents resources should be made full useof to develop advanced industries, develop agricul-tural products of safety and high quality and furtherprocessing, developing eco-tourism. Thirdly, thetown should actively cooperate with enterprises inneighbor cities to develop companied products andservices. Fourthly, speed up opening-up to estab-lish new-type, environment friendly and profitableenterprises.
5.5.5 Sight design
Ji K. S. / Ecological Economy (2006)2:115-126
The sight design of the town must be simulta-neous with the overall planning. It must integratevisual value with ecological functions and be con-gruous with rural eco-environment.
6. Practice and achievements of circular economyin Anhui Province
The countryside of Anhui Province started de-veloping circular economy very early with lots ofexamples. The committee of the Communist Party ofAnhui Province and provincial government put for-ward eco-province construction with CircularEconomy as its core, set three pilot eco-cities andnine pilot eco-counties, and held “Hundred,Thousand, Ten Thousand Project” – constructing ahundred towns of sound environment, a thousandeco-villages and ten thousand eco-family. On 17th,October, 2001, when I went to remote mountain area,Xinzhong Village in Shitai County, Chizhou City, thedirector of the village committee mentioned how todevelop circular economy and how to run well eco-environmental capital operation. I asked them wherethey had learned such new knowledge; they saidthey had read my articles published in Anhui Dailyseveral days ago. They had discussed the issue fora day to reach the result. Peasants in remote moun-tain area can accept circular economy, which mademe determined to popularize circular economy. InDecember, 2002 when I went to Linquan County inFuyang City, I found that a peasant of ChangguanVillage named Wang Shouhong developed circular
economy dependent on Scalper Association. Wewidely propagandized the examples so that it is nowvery popular in Linquan County to develop circulareconomy dependent on specialized technologicaland economic associations. Since the associationsdevelop inter-provincely, peasants of Henan, Hubeietc. learn from the successful experience. Now therecome forth a lot of examples to actively develop Cir-cular Economy in Funan County, Maoji pilot,Quanjiao County, Qingyang County, Jixi County,Taihu County, Huoshan County, Xiuning County,Qiaocheng area etc. Recently State EnvironmentalProtection Administration appraised the first “envi-ronmental protection for well-off rural area” projectin Jixi County of Anhui Province. This project aimsat improving environmental quality of mountainousarea and increasing peasants’ income. Only the com-prehensive utilization of straw can be four millionyuan, while the revenue of the model projects oforganic food base can reach 100 million yuan a year.The Management Committee of the DevelopmentZone, Agriculture Committee, Commission OfFinance, Science Institution support and guide re-cycling economic development in rural areas andheld training course of cadreman for developing cir-cular economy with over 160 people to popularizecircular economy development in rural areas of thewhole province. Developing circular economy inrural areas of Anhui Province indicates that it is animportant way of constructing new socialistic coun-tries to develop circular economy.
Ji K. S. / Ecological Economy (2006)2:115-126
Ecological Economy (2006)2:127-139
Methods
Appraisal of the vegetation-based services for croplandecosystems: a case study of a high-yielding county in North China
Bao Yonghong, Wu Wenliang*, Wang Mingxin, Liu WennaCollege of Resources and Environmental Science, China Agricultural University, Beijing 100094, P. R. China
Received Nov.17, 2005; Accepted Dec.16, 2005
Abstract: As people become increasingly aware of the irreplaceability of ecosystem services, defined as “the naturalenvironmental conditions and effects upon which people rely for existence that are formed and maintained by ecosystemsand ecological processes”, more emphasis is being placed on these services. In recent years, numerous studies havefocused primarily on the services of natural ecosystems. This paper expands the scope of this field from naturalecosystems to semi-natural ecosystems, i.e. cropland ecosystems, which are closely associated with human productivityand life. Taking Huantai County in Shandong Province as an example, the vegetation-based services of winter wheat/summer maize rotation systems and cotton cropland ecosystems were systematically analyzed, including the materialproduction, carbon dioxide fixation, oxygen release, water conservation, and nutrient recycling. These services were thenevaluated in terms of economics through the applications of a market value technique, a substitution engineering method,and a shadow price method. The results indicated that the total economic value of cropland ecosystem vegetation-basedservices in Huantai County is 124,827.3 × 104 yuan, which is equivalent to 15.63% of the GDP of Huantai County (798,491 × 104 yuan). Among these services, the gas regulation value is 82,698.3 × 104 yuan (66.25%), the materialproduction value is 38,049.4 × 104 yuan (30.48%), the nutrient cycling value is 3257.3 × 104 yuan (2.61%), and the waterconservation value is 822.3 × 10⁴ yuan (0.66%). In addition, through the comparison between winter wheat/summermaize rotation systems and cotton cropland ecosystems, we conclude that the economic value of vegetation-basedservices provided by the former is much higher than that of the latter, which could provide a scientific guideline foradjusting the agricultural structure. Our study may facilitate the conservation of cropland ecosystems and promoteeffective use of vegetation-based services to achieve sustainable development of agriculture and guarantee nationwidefood security.Keywords: Cropland ecosystems; Ecosystem vegetation-based services; Economic valuation
* Corresponding author. E-mail address: [email protected]: Bao Yonghong (1976-), female, PhD candidate, spe-cialized in ecological economics and regional development.
1. Introduction
Ecosystem services are explicitly defined as “thenatural environmental conditions and effects uponwhich people rely for existence that are formed andmaintained by ecosystems and ecological processes”[1]. The valuation of ecosystem goods and serviceshas become an important issue in the field of envi-ronmental protection and sustainable development,which also represents one aspect of the United Na-tions Millennium Assessment. At present, the re-search associated with ecosystem services focusesprimarily on large-scale regions, including nations
or provinces, and mostly centers on forests,grasslands, and wetlands [2-4]. In contrast, few stud-ies have been conducted on cropland ecosystems,which are closely tied to human productivity andlife. Cropland ecosystems have a long history ofover thousands of years, and they cover 20-30% ofthe total area of the planet. As one important com-ponent of terrestrial ecosystems, cropland ecosys-tems play an important role in human productivityand life. Ecosystem and human productivity are thusdeterminants of the productivity of society as awhole. Because of our poor understanding of crop-land ecosystem services over the long term[5], un-due emphasis has been placed on the passive ef-fects of croplands, such as desertification and envi-
Bao Y. H. et al. / Ecological Economy (2006)2:127-139
ronmental pollution. Undoubtedly, such one-sidedassessment has resulted in a series of misunder-standings and restrictions against the developmentof food production. In addition, due to the missingmarket of cropland ecosystem services (reflectingthe fact that we do not place monetary values uponecosystem goods and services or incorporate theminto decision making)[6], people continue to overex-ploit agricultural resources and thus obstruct agri-cultural development in the long run, which will un-doubtedly pose a threat to food security worldwide.Consequently, a valuation of cropland ecosystemservices that could lead to managing agriculturesustainablely is critical to guarantee global foodsecurity.
Few studies have been conducted on croplandecosystem services. For example, the economicvalue of 17 services performed by 16 types of eco-systems worldwide was assessed at US$33.268 ×10¹², among which the value of cropland ecosys-tems was US$92 × 109[7]. However, these authorsonly considered material production and animal-based services of cropland ecosystems, includingpollination and biological control of pests anddiseases, but neglected the vegetation-based ser-vices that are the focus of our work. In China, XieGaodi[8] evaluated the ecological capital of theQinghai-Tibet Plateau and also assessed the eco-nomic value of cropland ecosystem services.However, based on the estimates by Costanza et al.[7] of all ecosystem service values worldwide, in con-junction with the biomass of cropland ecosystems,the evaluation result is simply a general conclusionthat cannot describe the particular conditions foundin specific regions.
In this study, we conducted field investigationsand experiments to evaluate the annual economicvalues produced by the vegetation-based servicesof cropland ecosystems in the high-yield area ofHuantai County, North China. Here, we refer to eco-system goods and services together as ecosystemvegetation-based services, which include materialproduction, carbon dioxide (CO2) fixation, oxygen(O2) release, water conservation, and nutrientcycling. The evaluation of these ecological services
is committed to informing the public and govern-ments at all levels of the cropland ecosystem ser-vice values in order to highlight the importance ofharmoniously developing economic structures andenvironmental protection, with the final goal to main-tain agricultural sustainability at the county level.
2. Description of Huantai County
Huantai County, which is situated in the centerof Shandong Province, North China (36°54 -́37°04´N,117°50 -́118°10´E; Fig. 1), covers approximately 509.53 km2 and encompasses 11 townships. Croplandscomprise 342.44 km2, accounting for 67.02% of thetotal land area. The main crops are wheat, maize, andcotton, which represent almost 80% of the arableland (Fig. 2). Because the county is located at thelower reaches of the Yellow River, the local climateand fertile soil are well suited to growing crops. Inthe 1990s, this county became the first “One-TonGrain County” north of the Yangtze River, making ita major commodity grain production base.Consequently, it has been called the “Mid-Shandong Bar”.
We chose Huantai County as study site becauseof specific conditions found there. Agriculture playsan important role in the economic development ofthis county, as it contains a high proportion of ar-able land. Currently, in order to achieve rapid eco-nomic growth, the local government is expeditingefforts to introduce more industries, including envi-ronmental polluters, which will endanger the envi-ronment and ecological resources. In addition, withthe development of paper manufacturing in thiscounty, farmers have increasingly planted trees oncroplands to enhance profits, thereby sacrificingcrop yields. This will inevitably pose a threat to thecounty- or country-level food security. A growingnumber of farmers have given up their arable landand have moved into cities to earn money, whichwill not only endanger food security but will alsoaffect societal security. As a result, it is necessary toincrease agricultural subsidies to stimulate farmersto return to their hometowns to continue producingagricultural products. Given this situation, we as-
Bao Y. H. et al. / Ecological Economy (2006)2:127-139
Fig. 1. Location of the study site in Zibo, ShandongProvince, North China. Map Source: Land and Re-
sources Bureau of Zibo.
sessed the economic values of cropland ecosystemservices to provide policy makers with a referenceto justify an increase in agricultural subsidies.Therefore, our work is important for the conserva-tion and management of cropland ecosystem ser-vices as well as for the effective use of croplandecosystems to optimize the utilization of resourcesand to meet the needs of the public.
Although cropland ecosystems can performmany different services, in this paper, we focusedonly on four vegetation-based services due to theactual conditions in the county and the unavailabil-ity of several necessary data for a more comprehen-sive survey. The four services investigated werematerial production, gas regulation (including CO2
fixation and O2 release), water conservation, andnutrient cycling.
3. Methods
Given the realities in Huantai County and usingavailable methodology, four vegetation-based eco-logical services were analyzed and appraised. De-scriptions of the methods used for determining theeconomic value of each service are as follows.
3.1 Material production value
Material production is the most fundamental andmost important service performed by croplandecosystems. The materials produced by croplandecosystems are referred to as goods with definitemarket prices, which can enter the market and thenbe exchanged between buyers and sellers. As aresult, in terms of the characteristics of croplandecosystems, including net primary productivity,sown area, and economic coefficients, the materialproduction function can be evaluated by applying amarket value technique (Eq. 1). Here, net primaryproduction includes economic production as wellas straw production. While evaluating the produc-tion service, both input and output must be consid-ered comprehensively:
∑∑∑ −−= iiiii RWPYSV (1)
where V is the material production value, Si is thesown area or production area of the ith type of agri-cultural product, Yi is the yield of the ith type ofagricultural product, Pi is the market price of the ithtype of agricultural product, Wi is the substance costfor producing the ith type of agricultural product,and Ri is the labor cost for producing the ith type ofagricultural product.
3.2 Gas regulation
Gas regulation by ecosystems involves atmo-sphere and climate regulation. Climate regulationrefers to the influences of air temperature,precipitation, and air currents, which could mitigatethe passive effects of excessive climate on humans.Atmosphere regulation refers to the regulation ofthe CO2/O2 balance, protection of the ozone layer,and abatement of greenhouse gases. CO2 and O2 areexchanged between ecosystems and the atmospherethrough photosynthesis and respiration, which playan irreplaceable role in the dynamic balance betweenCO2 and O2. Fertilizers and some agricultural prac-
tices result in the emission of greenhouse gases, sothe greenhouse effect must be considered whileevaluating the positive effect of gas regulation bycropland ecosystems. In this study, however, dueto the specific characteristics of winter wheat/sum-mer maize rotation systems and cotton croplandecosystems, which emit only a very small amount ofgreenhouse gases, we regarded the values of CO2
fixation and O2 release as the total economic valueof gas regulation performed by these two types ofcropland ecosystems and disregarded the passiveeffects of greenhouse gases.
3.2.1 Carbon dioxide fixationThe carbon tax method and the afforestation cost
method can be used to assess the economic valueof the ability of cropland ecosystems to fix CO2 andsupply O2.
Based on the formula of photosynthesis and res-piration (Eq. 2), to produce 180 g of glucose and 193g of O2, plants must absorb 264 g of CO2 and 108 g of
water. The 180 g of glucose are then transformedinto 162 g of polysaccharide inside the plant.Therefore, whenever a plant produces 162 g of dryorganic matter, 264 g of CO2 will be fixed, i.e., theproduction of every 1 g of dry organic matter can fix1.63 g of CO2
[11].
(162g))193()180()108()264( 2612622
ridePolysacchagOgOHCgOHgCO
→+→+
(2)
The carbon tax method has been established inmany countries that strive to reduce the emission ofgreenhouse gases in order to determine the lossvalue from CO2 emissions and levy a carbon tax. Atpresent, many different carbon taxes are usedthroughout the world. For example, the carbon taximplemented in most European countries is US$170/t(C), although the Swedish carbon tax of US$150/t(C) (= 1,291 yuan/t(C))[12] has been commonlyadopted worldwide.
The afforestation cost method is used to substi-tute the economic value of CO2 fixation with the cost
Fig. 2. Spatial distribution of the different types of land use in Huantai County in 2002[10]
*WMD represents the wheat/maize rotation systems with only wheat straw returned to the field; WMS indicates thewheat/maize rotation systems with both wheat and maize straw returned to the field.
Bao Y. H. et al. / Ecological Economy (2006)2:127-139
of planting trees that could fix the same amount ofCO2. In China, the widely recognized afforestationcost is 250 yuan/t(C) (the constant price in 1990)[11].
The total annual amount of dry organic matter ofcropland ecosystems can be estimated by using theannual net production values of various crops. Thisprovides a foundation for calculating the total amountof CO2 fixation by cropland ecosystems. In addition,the economic value of CO2 fixation can be estimatedby the total fixed CO2 amount multiplied by a stan-dard opportunity cost for per unit CO2 fixation, i.e. acarbon tax or afforestation cost.
3.2.2 Oxygen releaseWhile they absorb CO2, plants also release a large
amount of O2, which of course is indispensable tosustain human life. Therefore, it is necessary to as-sess the economic value of O2 release as part of thegas regulation value. Currently, the method of evalu-ating O2 release widely adopted worldwide is theafforestation cost method and the industrial prepa-ration cost of O2. The afforestation cost refers to thecost of planting trees that could release the sameamount of O2. The industrial preparation cost is thecost of preparing the same amount of O2 by indus-trial methods. According to the formula of photo-synthesis and respiration, to produce 162 g of dryorganic matter, plants release 193 g of O2, i.e., theproduction of every 1 g of dry organic matter re-leases 1.2 g of O2
[11]. The afforestation cost (352.93yuan/t(C), the constant price in 1990) or industrialproduction cost of O2 (0.40 yuan/kg (C)) is then usedas the alternative price to assess the economic valueof O2 release. The calculation process is similar tothat for determining the CO2 fixation value.
3.3 Water conservation
Because crops growing in cropland ecosystemscan slow the runoff of precipitation, and croplandsoil with a certain permeability can facilitate the infil-tration of rainwater to groundwater, cropland eco-systems could provide the service of waterconservation. This service can be described in threeways: increasing the quality of effective available
water, improving water quality, and reducing waterrunoff.
In this study, the soil non-capillary porosity pas-sive retention capacity method was used to calcu-late the amount of water conserved by croplandecosystems. In addition, we employed the substitu-tion engineering method, using the water-retentioncost of reservoirs (0.67 yuan/t, the constant price in1990) as the alternative price, to assess the economicvalue of water conservation performed by croplandecosystems.
3.4 Nutrient recycling
Crops absorb mineral nutrients from the soil inthe process of growth and accumulate the nutrientsin their bodies. From the perspective of a bio-bank,the nutrient-retention capacity of crops can be cal-culated according to net primary production, becausethe litter volume of crops is very small. The amountsof N, P, and K accumulated in crops can be calcu-lated in terms of some indices that are inclusive ofthe nutrient content in plants, sown area, and netprimary productivity. The economic value of nutri-ent accumulation can then be evaluated by the totalnet nutrient amount maintained in the crops multi-plied by the alternative market prices of nutrients ( 2,549 yuan/t(C), the constant price in 1990):
∑∑ ++= PKPNAPMA iiiiii )( (3)where A is the sown area of the ith type of crop,
P is the price of synthetic nutrients (N, P, and K),and M is the net amount of nutrients maintained inthe ith type of crop[13].
4. Results and discussions
In Huantai County, the area covered by winterwheat/summer maize rotation systems accounts for75% of the total area of arable land, and the remain-der of the arable land is mainly used for cotton.Therefore, the economic value of the goods and ser-vices of the winter wheat/summer maize rotationsystems and the cotton cropland ecosystems repre-sent the total value of the cropland ecosystem ser-vices in Huantai County (with 2002 as the base year).
Bao Y. H. et al. / Ecological Economy (2006)2:127-139
4.1 Economic value of material production
To humans, the production of grains is the mostfundamental and important function of croplandecosystems. According data from the HuantaiCounty Grain Bureau, the current prices of wheat,maize, and cotton are 1,530 yuan/t, 1,210yuan/t, and10,029 yuan/t, respectively. Additionally, the cur-rent prices of wheat, maize, and cotton straw are 100yuan/t, 60 yuan/t, and 60 yuan/t, respectively. Ac-cording to the equation of production value, we cancalculate the economic value of material productionby winter wheat/summer maize rotation systems andcotton cropland ecosystems in Huantai County(Table 1 and Table 2).
Results show that the economic value of the win-ter wheat/summer maize rotation system material pro-duction service is 36,480.9 × 104 yuan (Table 1), andthat of the cotton cropland ecosystems is 1,568.5 ×
104 yuan (Table 2). Therefore, the aggregated valueof material production of cropland ecosystems inHuantai County is 38,049.4 × 104 yuan.
4.2. Economic value of gas regulation
4.2.1. Economic value of CO2 fixationThe calculation approach for a CO2 fixation value
first requires estimating the biomass productionbased on biomass growth standards of variouscrops. According to Eq. (2), while producing 162 gof dry organic matter, crops absorb 264 g of carbon.Thus, 1.63 tons of carbon will be absorbed when 1ton of dry organic matter is produced. Based on theindex, the carbon fixed by the winter wheat/summermaize rotation systems is 777,420 tons (Table 3). Inthis study, two methods, i.e. the carbon tax methodand the afforestation cost method, were used to as-sess the economic value of CO2 fixation by cropland
Table 1Material production and its economic value in winter wheat/summer maize rotation systems
*Data source: (1) Huantai County Grain Bureau; (2) personal survey.*Middle input mainly includes fertilizers, pesticides, water, machines and labor.
Table 2Material production and its economic value in cotton cropland ecosystems
*Data source: (1) Huantai County Grain Bureau; (2) fieldl survey.*Middle input mainly includes fertilizers, pesticides, water, machines and labor.
Bao Y. H. et al. / Ecological Economy (2006)2:127-139
ecosystems. In terms of Chinese afforestation costs,250 yuan/t(C) was used as the alternative price. TheSwedish carbon tax, US$150/t(C) (= 1,291 yuan/t(C))is usually adopted by Chinese environmentalists.The results obtained with the application of thesetwo methods are 100,365 × 104 yuan and 19,435.5 ×104 yuan, respectively, for winter wheat/summermaize rotation systems. The average of these twovalues is 59,900.3 × 104 yuan, which represents theeconomic value of CO2 fixation by winter wheat/sum-mer maize rotation systems (Table 3). Using the sameassessment approach, the economic value of CO2
fixation by cotton cropland ecosystems is 833.7 ×10⁴ yuan (Table 4).
In terms of characteristics of the planting struc-ture in the county, the aggregated value of CO2 fixa-tion services performed by winter wheat/summermaize rotation systems and cotton croplandecosystems, i.e. 60,734 × 104 yuan, represents the
total economic value of CO2 fixation by croplandecosystems in Huantai County.
4.2.2 Economic value of O2 releaseWhile producing 162 g of dry organic matter,
crops can supply 193 g of O2, based on Eq. (2). Thus,1.2 tons of O2 will be released when 1 ton of dryorganic matter is produced. The total amount of O2
released by winter wheat/summer maize rotation sys-tems is 572,334t/a. With the average cost of forestssupplying O2, i.e. 352.93 yuan/t (C), as the alterna-tive price, the economic value of O2 release by win-ter wheat/summer maize rotation systems is 20,199.4× 104 yuan/a. Likewise, with the industrial produc-tion cost of O2, i.e. 0.4 yuan/kg (O2), as the alterna-tive price, the economic value of O2 release is 22,893.3 × 104 yuan/a. Thus, the average of these twovalues, representing the total economic value of O2
release by winter wheat/summer maize rotation
Table 3CO2 fixation and its economic value in winter wheat/summer maize rotation systems
*Net primary productivity is based on experiments conducted by Zhao Caixia et al[14]. The carbon tax is 1,291 yuan/t(C)and the afforestation cost is 250 yuan/t(C).
Table 4CO2 fixation and its economic value in cotton cropland ecosystems
*Net primary productivity is based on experiments conducted by Zhao Caixia et al.[14]. The carbon taxis 1,291 yuan/t(C) and the afforestation cost is 250 yuan/t(C).
Bao Y. H. et al. / Ecological Economy (2006)2:127-139
systems, is 21,546.4 × 104 yuan/a (Table 5). Usingthe same assessment approach, the economic valueof O2 release by cotton cropland ecosystems is 833.7 × 10⁴ yuan/a (Table 6).
4.3 Water conservation
Croplands have a certain capacity for storingwater and absorbing and reserving rainwater to de-crease water drainage, and thus can increase theamount of water storage. As abundant water is ad-vantageous to spur the growth of crops and therebyincrease yields, water conservation services of crop-land ecosystems should be evaluated.
The water-retention capacity of non-capillarypores is an important indicator for measuring theservice of water conservation by ecosystems.Therefore, according to the non-capillary porositiesat different soil levels, we can calculate the total water
retention capacity of cropland ecosystems.Furthermore, with the water-retention cost of reser-voirs (0.67 yuan/t, the constant price in 1990) as thealternative price in the substitution engineeringmethod, we can determine the total economic valueof water conservation by cropland ecosystems. Asshown in Table 7, the economic value of water con-servation by winter wheat/summer maize rotationsystems in Huantai County is 782.2 × 10⁴ yuan/a;the economic value of water conservation by cottoncropland ecosystems is 40.1 × 10⁴ yuan/a (Table 8).
4.4 Nutrient cycling
In this study, the bio-bank nutrient retentionmethod was used to assess the amount of nutrientsinvolved in the nutrient cycle of croplandecosystems, i.e., the nutrient-retention capacity ofecosystems was used to denote the function of main-
*Net primary productivity is based on experiments conducted by Zhao Caixia et al. [14]. The afforestation cost is 352.93yuan/t (C) and the industrial production cost of O2 is 0.4 yuan/kg (O2).
Table 6O2 release and its economic value in cotton cropland ecosystems
*Net primary productivity is based on experiments conducted by Zhao Caixia et al.[14]. The afforestation cost is 352.93yuan/t (C) and the industrial production cost of O2 is 0.4 yuan/kg (O2).
Table 5O2 release and its economic value in winter wheat/summer maize rotation systems
Bao Y. H. et al. / Ecological Economy (2006)2:127-139
taining nutrient cycling by ecosystems. The shadowprice method was used to evaluate the economicvalue of nutrient cycling by cropland ecosystems.We used the market price of synthetic nutrients (2,549 yuan/t, the constant price in 1990) as the alter-native price.
As shown in Table 9, based on the experimentalresults of nutrient amounts maintained in wheat andmaize[14], the nutrient-retention capacity (includingN, P, K) by winter wheat/summer maize rotation sys-tems is 3,169.7 t/a, and its economic value is 12,435 ×104 yuan/a (Table 9). Likewise, the economic valueof nutrient cycling by cotton cropland ecosystemsis 87.6 × 10⁴ yuan/a (Table 10).
4.5 Total economic value of the vegetation-based
services of cropland ecosystems
Due to the unavailability of data and uncertaintyof evaluation methods, the total economic value ofthe vegetation-based services of cropland ecosys-tems is represented by the aggregated value of thefour services considered in this paper. As shown inTable 11, the total economic value of cropland eco-systems in Huantai County is 124,827.3 × 104 yuan/a, among which the value of gas regulation, 82,698.3× 104 yuan/a, is the highest, followed by production,nutrient cycling, and water conservation at 38,049.4× 104, 3,257.3 × 104, and 822.3 × 10⁴ yuan/a,respectively. Figure 3 clearly illustrates that the veg-etation-based services of cropland ecosystems aremainly represented by gas regulation and material
*Total porosity and capillary porosity at different soil depths are based on experiments conducted in 2005 (unpublisheddata). The water-retention cost of reservoirs is 0.67 yuan/t (the constant price in 1990).
Table 8Water conservation and its economic value in cotton cropland ecosystems
*Total porosity and capillary porosity at different soil depths are based on experiments conducted in 2005 (unpublisheddata). The water-retention cost of reservoirs is 0.67 yuan/t (the constant price in 1990).
Table 7Water conservation and its economic value in winter wheat/summer maize rotation systems
Bao Y. H. et al. / Ecological Economy (2006)2:127-139
Soil depth
(cm)
Total
porosity (%)
Capillary
Porosity (%)
Non-capillary
Porosity (%)
Area
(ha)
Thickness of
soil layers (m)
Water-retention
capacity (t)
Economic
value (104 yuan/a)
0–20 51.2 39.1 12.1 19,016 0.20 4,601,872 308.3
20–40 43.8 37.2 6.5 19,016 0.20 2,472,080 165.6
40–60 46.9 34.8 12.1 19,016 0.20 4,601,872 308.3
Total 0.60 11,675,824 782.2
Soil depth (cm) Total
porosity (%)
Capillary
Porosity (%)
Non-capillary
Porosity (%)
Area (ha) Thickness of
soil layers (m)
Water-retention
capacity (t)
Economic value
(104 yuan/a)
0–20 55.5 44.3 11.2 1,256 0.2 281,344 18.9
20–40 47.9 41.2 6.7 1,256 0.2 168,304 11.3
40–60 48.7 42.8 5.9 1,256 0.2 148,208 9.9
Total 0.6 597,856 40.1
production, while the services of water conserva-tion and nutrient cycling are relatively minor.
Conventionally, people have considered the soleservice of cropland ecosystems to be the produc-tion of agricultural products, but many were not con-vinced of their ecological services. However, in termsof the data presented in Table 11, the value of materialproduction accounts for 31.1% of the total value ofcropland ecosystems in Huantai County, which is farless than that of gas regulation, i.e. 65.53%. The mis-understanding of cropland ecosystems contributesto the undervaluation of services, which greatly in-fluences the accuracy of a green GDP. Additionally,such misunderstanding would also influence policydecisions. For example, prior to converting croplandsto forest or grassland, policy makers should system-atically compare the current value of croplands to thefuture value of forests or grasslands to assure theefficiency-oriented feasibility of the policy.
4.6 Comparison of services between two types of
cropland ecosystems
The above analysis of cropland ecosystem ser-vices indicates that the economic value of winterwheat/summer maize rotation systems is greater thanthat of cotton cropland ecosystems in HuantaiCounty. In large measure, this can be attributed tothe larger proportional area covered by the rotationsystems. Therefore, to compare services betweenthese two types of cropland ecosystems, it is neces-sary to determine the economic value coefficients ofthe services by dividing the economic value of eachservice by the area covered by the ecosystem.
The above analysis also indicates that the eco-nomic value of the vegetation-based services of win-ter wheat/summer maize rotation systems is muchhigher than that of cotton cropland ecosystems inHuantai County. In addition, as shown in Table 12,the economic value coefficient of each rotation sys-tem service is much higher than that of cotton crop-land ecosystems, especially for CO2 fixation and
*In Table 9 and Table 10, amounts of various nutrients in crops are based on experiments conducted by Zhao Caixia etal.[14] The market price of synthetic nutrients is 2,549 yuan/t (the constant price in 1990).
Table 10Nutrient cycling and its economic value in cotton cropland ecosystems
Table 9Nutrient cycling and its economic value in winter wheat/summer maize rotation systems
Bao Y. H. et al. / Ecological Economy (2006)2:127-139
nutrient cycling. Due to the simple planting struc-ture of cropland ecosystems in Huantai County,which is dominated by the rotation systems, the ma-terial production of cropland ecosystems reliesmainly on those rotation systems. From an ecologi-cal perspective, winter wheat/summer maize rotationsystems play a more important role than cotton crop-land ecosystems. However, as an economic cropindispensable to the prospering textile industry inChina, the importance of cotton with a high eco-nomic value should not be neglected. In addition, interms of the potential role of biodiversity in multi-functional cropland ecosystems, the cotton crop-lands are conducive to the development of agricul-ture in the county. As a whole, when winter wheat/
summer maize rotation systems are widely promoted,cotton can be complementary in the agriculturalstructure, which could guarantee an advantageousbalance among ecology, society, and economy.
4.7 Discussions
Through assessing the economic values of thevegetation-based services of cropland ecosystems,we can further our understanding on the importanceof cropland ecosystem services, which are critical tothe development of society and the nationaleconomy. Given the increasing pressures onecosystems, anthropogenic and otherwise, researchmust focus on how governments at all levels deter-
*Results are shown as the comparison of economic values of four vegetation-based services between winter-wheat/summer-maize rotation systems and cotton cropland ecosystems in Huantai County.
Table 12The economic value coefficients of vegetation-based services provided by winter wheat/summer maize rotation systemsand cotton cropland ecosystems (unit: yuan/ha)
* Results are shown in the order of economic values of four vegetation-based services provided by the croplandecosystems in Huantai County, North China.
Table 11The economic values of various services and their proportions of the total economic value
Bao Y. H. et al. / Ecological Economy (2006)2:127-139
mine policies to maintain the values of natural capi-tal according to cropland ecosystem services, andon how to balance the benefits and losses of eco-system services in the process of implementing vari-ous planning strategies. In addition, assessing theeconomic values of cropland ecosystem services canfacilitate a “green GDP” framework, which wouldenable the aggregated evaluation necessary to es-tablish a comprehensive national policy based on“environmental accounting.”
In addition, an increasing number of farmers inChina have given up their arable lands and havemoved into municipalities to earn money, and HuantaiCounty is no exception. This could not only endan-ger food security but could also harm societalsecurity. As a result, it is necessary to increase agri-cultural subsidies to entice farmers to return homeand continue producing crops. Given this situation,we assessed the economic values of cropland eco-system services in order to provide a reference forjustifying an increase in agricultural subsidies. Atpresent, while agricultural subsidies in the UnitedStates and Europe are very high, they are low inChina, which impairs the competitiveness of Chi-nese agricultural products in the international market.Therefore, the importance of cropland ecosystemservices as justification for increasing agriculturalsubsidies deserves the consideration of policymakers.
Many types of cropland ecosystems existworldwide. Based on the above analysis, assess-ment of the economic values of various croplandecosystem services is critical, and this study canserve as a guide for evaluating the services performedby other types of cropland ecosystems.
Although this study has many practical and po-tential uses, it was constrained by time and the ab-sence of certain data; consequently, we must ac-knowledge the weaknesses of the study.
4.7.1 Failure to consider all servicesThe goal of this paper was to analyze and evalu-
ate the vegetation-based services of croplandecosystems. However, due to the unavailability ofcertain data and uncertainty of the evaluation
methods, only four services were evaluated, i.e., ma-terial production, gas regulation, water conservation,and nutrient cycling, to represent the total economicvalue of the cropland ecosystem vegetation-basedservices. Thus, some vegetation-based services wereneglected, including the provision of habitats forbiodiversity preservation, recreation and tourism, andaesthetic enjoyment, which are also of great impor-tance to people. Therefore, our results may not re-flect the true value of cropland ecosystems, and thispoint may detract from our purpose of providingguidance for policy making in agricultural develop-ment and to establish a green GDP.
4.7.2 Limitation of the evaluation methodsThe economic value of cropland ecosystems in-
cludes both direct and indirect values. While someservices with market prices can be evaluated withthe market price method, other services that have nomarket prices must be evaluated with shadow engi-neering or shadow price techniques. Therefore, theselection of alternative prices is crucial for obtain-ing accurate evaluation results. In China, the re-search associated with this field is still in its infancy.Thus, many indices employed in the paper are inter-national standards that may not be suitable for localregions of China. Therefore, there are likely somedisadvantages and shortcomings in the evaluationof cropland ecosystem services in Huantai County.Considering these limitations, it is necessary to es-tablish a uniform system of evaluation indices thatare appropriate for the specific conditions in China.Improved economic assessment methods for crop-land services are needed, and more studies are re-quired that deal with cropland ecosystem services.
5. Conclusions
The case study was conducted in the first “One-Ton Grain County” north of the Yangtze River, inHuantai County of North China. We analyzed andevaluated the vegetation-based services providedby cropland ecosystems, including materialproduction, CO2 fixation, O2 release, waterconservation, and nutrient cycling. The results show
Bao Y. H. et al. / Ecological Economy (2006)2:127-139
that the cropland ecosystems, consisting of winterwheat/summer maize rotation systems and cottoncropland ecosystems, provide a large range of goodsand services worth 124,827.3 × 104 yuan.
The most valuable service of cropland ecosys-tems in this county is gas regulation, followed bymaterial production, nutrient cycling, and waterconservation. Among these services, the economicvalue of gas regulation is 82,698.3.8 × 104 yuan (66.25%), the value of material production is 38,049.4 ×104 yuan (30.48%), the value of nutrient cycling is3257.3 × 104 yuan (2.61%), and the value of waterconservation is 822.3 × 10⁴ yuan (0.66%).
In Huantai County, the economic value of winterwheat/summer maize rotation systems is higher thanthat of cotton cropland ecosystems. From a com-parative analysis of the rotation systems and cottoncropland ecosystems, we conclude that the eco-nomic value coefficient of each winter wheat/sum-mer maize rotation system service is much higherthan that of cotton cropland ecosystems, especiallyin terms of CO2 fixation and nutrient cycling.Therefore, the rotation systems play a more impor-tant economic as well as ecological role than thecotton cropland ecosystems. Based on thisconclusion, the winter wheat/summer maize rotationsystems can be continuously promoted in thecounty. However, due to the importance of cottonin the development of the national economy and inthe maintenance of cropland biodiversity, cottonshould be grown in an appropriate proportion to thewhole planting structure.
Acknowledgments
The authors thank Ouyang Zhiyun and WangXiaoke from Chinese Academy of Sciences for valu-able comments. Moreover, we are extremely gratefulto Huantai County Government, Huantai Agricul-ture Bureau, and Huantai Agricultural Machinery Bu-reau for their support and assistance in this research.
References
[1] Daily GC. Nature’s services: societal dependence on natu-ral ecosystems. Washington D.C.: Island Press; 1997
[2] Chopra K. The value of non-timber forest products: anestimation for tropical deciduous forests in India. Eco-nomic Botany 1993; 47: 251-257
[3] Adger WN, Brown K, Cervigni R and Moran D. Totaleconomic value of forests in Mexico. AMBIO 1995; 24:286-296
[4] Gayatri Acharya. Approaches to valuing the hidden hy-drological services of wetland ecosystems. In: The Val-ues of Wetlands: Landscapes and Institutional Perspec-tives- Ecol. Econ. 2000; 35: 63-74.
[5] Lee M Stapleton, Scott D Young, Neil MJ Crout. Havemissing markets for ecological goods and services af-fected modelling of terrestrial C and N fluxes? Eco-nomical Modelling 2004; 179: 569-574
[6] Stephen C Farber, Robert Costanza, Matthew A Wilson.Economic and ecological concepts for valuing ecosys-tem services. Ecological Economics 2002; 41: 375-392
[7] Costanza R, d’Arge R, Groot R. The value of the world’secosystem services and natural capital. Nature 1997;387: 253-260
[8] Xie Gaodi, Lu Chunxia, Leng Yunfa. Ecological assetsvaluation of the Tibetan Plateau. Journal of NaturalResources 2003; 18(2): 189-196
[9] IPCC (Intergovernmental Panel on Climate Change).Climate change 2001: impacts , adaptat ion andvulnerability. Cambridge: Cambridge University Press;2001
[10] Liu Guangdong. Methods and applications to evaluatethe regional agricultural impacts on resources andenvironment: a case study on high-yielding county,Huantai, North China. Beijing: China AgriculturalUniversity; 2004 (in Chinese)
[11] Xue Dayuan, Clem Tisdell. Valuing ecological functionsof biodiversity in Changbaishan Mountain BiosphereReserve in Northeast China. Biodiversity and Conser-vation 2001; 10: 467-481
[12] Xin Kun. Evaluation of ecosystem services. Shenyang:Chinese Academy of Sciences; 2001 (in Chinese)
[13] Zhao Haizhen, Li Wenhua, Ma Aijin, He Yongtao. Valu-ation of barley agro-ecosystem services in Lhasa-rivervalley region: a case study of Dazi County. Journal ofNatural Resources 2004; 19(5): 633-636
[14] Zhao Caixia. Effect of different straw return and fertil-izer input on crop growth in high-yielding agro-ecosystem. Beijing: China Agricultural University; 2004(in Chinese)
Bao Y. H. et al. / Ecological Economy (2006)2:127-139
Ecological Economy (2006)2:140-151
Methods
Another strategy to assess sustainable developmentChen Yunfeng, Lu Genfa*
State Key Lab of Pollution Control and Resources Reuse,School of Environment, Nanjing University, Nanjing 210093, P.R.China
Received Oct.29, 2005; Accepted Dec.1, 2005
Abstract: The goal of sustainable development is to preserve sustainability and simultaneously prevent catastrophe in aman-land system. However, almost all the existing approaches to assessing sustainable development are to measure thesustainability, namely appraise from the obverse side of the sustainable development. So it seems necessary to attack thesame task on the reverse, namely to measure the possibility of catastrophe. In this paper, with a case study of Tianjin,China, we employ catastrophe theory and models to integrate Tianjin’s sustainable development indicators, and thendeduce the catastrophe risk index (CRI) to present the level of catastrophic possibility in the city. Applying catastrophetheory is a new strategy to assess sustainable development and shows great practical significance, especially for thosedeveloping regions or countries, who always give more priority to their economy and therefore have more obligation tomake sure whether their social economic activities might bring forth any ecological environment catastrophe. Besides,being both qualitative and quantitative, the approach could be employed to explore not only static characteristics but alsodynamic mechanism of man-land system. Although our work is only a maiden attempt and still calls for further effort toimprove it, the case study of Tianjin in this paper would assure us the great promising future to apply catastrophe theoryto sustainable development modeling.Keywords: Sustainable development modeling; Catastrophe theory; Catastrophe risk index (CRI); Man-land system
Sustainable development is nowadays the goalof most politicians and decision makers; the first fun-damental question for them is how to measure sus-tainable development appropriately. Ever since theEarth Summit was launched at Rio de Janeiro, Brazil,in 1992, many kinds of sets of indicators have beenproposed to assess sustainability.
Indicators are bits of information that reflect thestatus of large systems. They have long been usefulin science, health, economics and many public policyareas as feedback mechanisms to decision-making.Indicators represent components or processes of realworld systems. The numeric values of indicators tendto have a special meaning to particular observers, ameaning that goes beyond the numerical value itself[1]. Sustainability indicators differ from classical envi-ronmental indicators; they do not only simply reflectenvironmental conditions or pressures on theenvironment, but also indicate interactive characters
between socioeconomic and ecological systems[2].Indicators for sustainable development can be
helpful to provide decision-makers with informationon sustainable development that is simpler and morereadily understood than raw or even analyzed data [3].Development of appropriate sets of indicators is alaborious undertaking and is likely to involve manyarbitrary decisions on which variables to select andhow to aggregate them. In order to play a part in “merg-ing environment and economics in decision making”and policy development, the number of indicatorsproposed should not be too large[1]. In particular, thereis a need for highly aggregated and compositeindicators, as known as indices, in which condensedinformation is assembled[4]. Upon that, the secondfundamental question for politicians and decisionmakers is how to obtain corresponding indices ac-cording to various strategies and priorities.
The scientific community has been dealing withthe challenge of adopting an aggregation procedureto bring a large set of indicator up to one integratedindex[5], and several well known indices have beendeveloped, such as Human Development Index de-
Chen Y. F., Lu G. F. / Ecological Economy (2006)2:140-151
veloped by the United Nations Human DevelopmentProgramme[6], the Ecological Footprint developed byWackernagel and Rees[7], and so on. However,unfortunately, these indices are lack of comprehen-sive acceptance throughout the world for the follow-ing two reasons, on one hand, their aggregation pro-cesses are of a cost of loss of detail information andweighting discussions; on the other hand, integra-tion and dynamic, as the fundamental characteristicof man-land system, could not be effectively embod-ied in their aggregation processes.
Sustainable development of a man-land system isa call for compatible relationships among ecological,economic, and social subsystems. The object of sus-tainable development research is not only to studythe particular system structure and to classify anddescribe the entities (components) of the system, butalso to understand the processes, interactions andfeedback mechanisms within the system that gener-ate changes in its dynamics and structure. Therefore,the system approach seems to be an appropriatemethod to capture the complexity of the interrelation-ships between the various subsystems of the com-plex man-land system[3].
One of the main experiences in sustainable devel-opment research so far is that the reductionistic ap-proach based on aspect-compartment oriented re-search methods failed in analyzing such an adequatelycomplex, multidisciplinary, large-scale man-landsystem. A more feasible way is the holistic, integratedapproach based on a systems-oriented analysis, whichconcentrates on the interactions and feedback mecha-nisms between the different subsystems of cause-effect chains rather than focusing on each isolatedsubsystem[8]. One of the most promising methodsseems to use models, which can help (1) to relateindicators to each other, (2) to analyze consequencesof policies and changes, (3) to find critical aspects ofthe system (that could be useful indicators), (4) tomake world views explicit, and (5) to put indicators inan interactive context [3].
Ever since Meadows presented his WORLD3 in1972, there have been teeming various models whichare called sustainability models and deal with variousaspects of sustainable development: WORLD3 [9, 10],
TARGETS[3, 11], IMAGE[12], RAINS [13], Threshold 21[14], AEGIS+[15], LUCAS[16] and some others[17, 18].
Last but not the least, almost all the existing ap-proaches to assessing sustainable development areto measure the sustainability, namely appraise fromthe obverse side of the sustainable development. Inorder to make the assessment comprehensive andsystematical, it seems helpful to introduce anotherstrategy, i.e. from a reverse viewpoint, to do the samejob. In this paper, with a case study of Tianjin, China,we apply catastrophe theory to setting up a sustain-able development risk models chain. After succes-sive steps of integration we deduce the sustainabledevelopment risk index (CRI) of the city as a negativeindex of regional sustainable development.
2. The catastrophe phenomenon in man-land systemand catastrophe theory
2.1 The catastrophe phenomenon in man-land sys-tem
In ecological communities, one often observes ca-tastrophe phenomenon, such as the abrupt increaseof a species or the sudden extinction of a species.Tainaka[19] researched a representative prey-predatorsystem in 1996, which exhibited a phase transitionbetween a phase where both preys and predatorssurvived, and a phase where predators were extinct.This phase transition or catastrophe was broughtabout by very small disturbances. For example, theprey population abruptly increased with the repro-duction rate of prey decreasing slightly.
Analogous catastrophe phenomenon could alsobe observed in subsystems of economy, society, andup to the entire man-land system. As we often hearabout, currently in many countries, decades of indus-trialization and socio-economic changes have beendramatically increasing the severity and frequency ofnatural hazards[20]. Meanwhile, there are more andmore reports regional or national economies “sud-denly” collapsed within only one or two years afterundergoing a long-term and gradual ecological andsocial gradual degradation (such cases mostly tookplace in developing countries), such as global
Chen Y. F., Lu G. F. / Ecological Economy (2006)2:140-151
warming, depletion of aquifers, species extinction, soilerosion, various kinds of pollution, illiteracy, AIDS,social and political unrest, violence and so on[21, 22].
George Dantzig[23] has compared man-land sys-tem to a busy highway, where a disruption in oneplace may cause wide spread traffic jams. That is tosay, for a complicated huge man-land system, just asmall partial disorder might bring forth a large entirefluctuation. Catastrophe phenomenon sometimesshow anti-intuition and uncertainty due to the finalentire and surprising disaster brought by originalpartial, random and negligible disruption [24, 25].
For complicated huge systems composed of sev-eral subsystems, as Forrester[26], in 1971, had pointedout integration, dynamic, and anti-intuition are theiressential characteristics. As basic units of man-landsystem, ecology, society and economy are allnonequilibrium open subsystems. When they receiveexternal disturbing signals, elements inside wouldundergo serial processes of oscillation andadjustment. These subsystems are interrelated andinteract with each other to form the whole man-landsystem, which is a circulation system with self-orga-nizational and self-adaptable characteristics. Any al-teration of subsystem elements would cause not onlyother subsystems but also the whole man-land sys-tem to re-adjust respective structures and states [27].All interrelationships among elements and sub-systems within man-land system are non-linear andhigh-order; these non-linearities can present them-selves at multiple-levels and in multiple-ways. Thus,the whole man-land system represents a highly com-plicated interaction among ecological, economic, andsocial components. However, each of these in isola-tion almost certainly contains crucial dynamic non-linearities. The combination of these in the larger in-tegrated man-land system suggests yet more difficultproblems of non-linear dynamic complexity with theassociated conundrum facing researchers andpolicymakers[28]. It’s because of these ubiquitous non-linear and high-order interrelationships that causemany anti-intuitive phenomena, which are still beyondour present forcast and knowledge, such as catastro-phe[29].
The goal of sustainable development is to achieve
sustainability of ecological, economic, socialsubsystem, and up to the whole man-land system. Inanother word, sustainable development demands pre-serving sustainability and preventing catastrophe.Man-land systems in which catastrophicdiscontinuities can arise present especial dangers andcall for greater precautions and investigation to de-termine the critical boundaries within which the sys-tem must be kept in order to maintain sustainability[30]. Thus, nowadays, it is necessary and urgent forscientific community to reinforce and perfect sustain-able development assessment by introducing thecontent of assessment and even forecasting the pos-sibility of catastrophe in man-land system.Furthermore, appropriate approaches to model catas-trophe should be developed if we want to attack theproblem of sustainable development systematicallyand scientifically. Unfortunately, so far as we know,too few relevant researches on sustainable develop-ment via catastrophe risk assessment have beenreported.
2.2 Catastrophe theory
Phase transition in real would is generally dividedinto two mechanisms: transitional and catastrophic.The catastrophe means a sudden change in behaviorof a system, as a result of gradually changingconditions. In general, a catastrophe refers to a dis-
Behavior
Bifurcation
Singularity
Hysteresis
Jumps
Control Factor 1
Control Factor 2
Lower Surface
Upper Surface
Behavior Space
Fig. 1. The general form of the cusp catastrophe
Chen Y. F., Lu G. F. / Ecological Economy (2006)2:140-151
continuous transition that occurs when a system canhave more than one stable state or can follow morethan one stable path to change. In another word, thecatastrophe is a “jump” from one stable state toanother. The transition is discontinuous because in-tervening states are not stable[31].
Catastrophe theory, developed by Thom[32], is amathematical framework seeking to describe and char-acterize catastrophe phenomena in real would. Catas-trophe theory has its roots in mathematics, physics,and biology. It distinguishes one or more behaviorparameters (behavior space) and one or more controlparameters (control space). The system obeys anoptimization function, which is a function in the be-havior space, parameterized by the control space. It isassumed that the system always exists under a lo-cally optimum condition. The condition that all de-rivatives of the optimization function to the behaviorspace are zero describes a set in the total space(behavior space× control space), which represents allpossibility of the system. For a given set of condi-tions (one point in the control space), there are one,several, or no possible behavior states (points in be-havior space).
Based on Thom, seven elementary forms of modelcan be identified for various different catastrophe pro-cesses in real would. They are the fold, cusp,
swallowtail, butterfly, wave crest, hair and themushroom. The forms are hierarchical and vary in thecomplexity of the behavioral spectrum theyencompass. In these forms, the fold is a function ofone control variable; the cusp surface is a three-di-mensional surface formed as a function of two con-trol variables; the swallowtail, wave crest, and hairhas three controls; and the butterfly and mushroomare functions of four control variables. Of these el-ementary forms, the cusp catastrophe has been fre-quently used to model and its general form is shownin Fig. 1.
The three-dimensional graph, which is with everypoint on the surface representing an equilibrium state,can intuitively illustrate how catastrophe occurs. Ev-ery point on the surface representing an equilibriumstate, of which all points on the underside of the pleat(shown shaded) are unstable, points along the foldline are semi-stable, and all other points are stable.For certain conditions of the two control factors, thereare two possible stable states, one on the upper sur-face of the pleat and the other on the lower.
Consider two points at the far edge of the surface(near the axis of control factor 2). They represent sys-tems with the same value of control factor 1, butslightly different values of control factor 2. If the valueof control factor 1 increases, the points move forward
Model forms Dimensions of
control space
Dimensions of
behavior space Potential function
fold 1 1 31( )
3V x x ax= +
cusp 2 1 4 21 1( )
4 2V x x ax bx= + +
swallowtail 3 1 5 3 21 1 1( )
5 3 2V x x ax bx cx= + + +
butterfly 4 1 6 4 3 21 1 1 1( )
6 4 3 2V x x ax bx cx dx= + + + +
wave crest 3 2 3 3( , )V x y x y axy bx cy= + + + +
hair 3 2 3 2 2 2( , ) ( )V x y x xy a x y bx cy= − + + + +
mushroom 4 2 2 4 2 2( , )V x y x y y ax by cx dy= + + + + +
Table 1Optimization functions of the 7 basic catastrophe models
toward the front of the surface, tracing parallel paths.If both paths are on one side of the pleat, the behav-ior of both systems is the same. If, however, one trav-els to the upper surface and the other to the bottomsurface, the behavior of the two systems is divergent.Thus, the so-called hysteresis occurs, i.e. two pointsstart together, undergo the same transition but, at theend of the change, are at very different stable states.Fig. 1 also shows discontinuous change when a pointmoves from the left to the right of the surface. At thefar edge of the surface, a point can pass smoothlyfrom left to right or vice versa. But if the point is at thefront of the surface (high control factor 1), a discon-tinuous jump will occur at the pleat.
Our suggestion of applicability of catastrophetheory to man-land system is based on the fact thatphase transition in the system displays the qualita-tive characteristics of catastrophes forms from Thom’scatastrophe theory. The most outstandingcharacteristic, which could not be explained by othertheories at current, is the hysteresis often occurringin man-land system;the consequence brought bywhich is that the system could not go backward to itsformer state athwart the path it change forward.
As above mentioned, catastrophes can occur at
those points in control space where the number ofpossible behavior states differs from that of possiblebehavior states at neighboring points, the so-calledsingularities. Here is also at least second derivativeof the optimization function to the behavior spaceequal to zero. The projection of the singularity set onthe control space is called the bifurcation. It is throughsetting up and solving optimization function that ca-tastrophe theory provides approach to model andresearch catastrophe phenomenon. Table 1 lists opti-mization functions of the seven basic catastrophemodels defined by Thom, Table 2 and 3 list the corre-sponding bifurcation functions and integration func-tions of the first three basic rational function models.
3. A new strategy to assess the sustainable develop-ment of Tianjin
Aiming at the outstanding problem in sustainabledevelopment assessment mentioned above, with acase study of Tianjing, we suggest a reverse strategy,namely by forecasting and analyzing the possibilityof catastrophe, to assess sustainable development.In this paper, on the base of setting up Tianjing’ssustainable development indicator system, we fur-ther apply catastrophe models to integrate indicatorsand deduce the catastrophe risk index (CRI) to presentthe level of catastrophic possibility in the city.
3.1 Set up the sustainable development indicatorsystem of Tianjin
The indicators are representative of the diversityof priorities and respective information needs acrossgeographic levels of aggregation and stakeholdergroups. Anderson[33] pointed out that indicatorsshould not be based on the assumption that only onepath of development is valid. More developed coun-tries need to focus mostly on the degradation of theirenvironment, whereas developing countries shouldstrive to improve both the environment and the hu-man system. Because there is no unique sustainablepath and, accordingly, researchers and policy makersshould apply different criteria and strategies to choosesustainable indicators for each city, region, and coun-
Model forms Integration function
cusp 1132 ,a bx a x b= =
swallowtail 11 132 4, ,a b cx a x b x c= = =
butterfly 1 11 13 52 4, , ,a b c dx a x b x c x d= = = =
Table 3Integration functions of the three most used models
Model forms Bifurcation function
cusp 2 36 , 8a x b x= − = swallowtail 2 36 , 8 , 3a x b x c x= − = = −
butterfly 2 3 4 510 , 20 , 15 , 4a x b x c x d x= − = = − =
Table 2Bifurcation functions of the three most used models
Chen Y. F., Lu G. F. / Ecological Economy (2006)2:140-151
try[34].Recent global work on sustainable development
indicators has demonstrated that most countries pre-fer to develop their own approaches over and abovethe accepted international standards. In some casesadapting these standard approaches, whilst seekingto strike a delicate balance between globally acceptedenvironmental and socio-economic indicators, andnational and local peculiarities as well. The impera-tive in such cases is to avoid losing internationalcomparability. The choice must take account of thevarying space and time scales of each country withregard to sustainable development, as well as the roleof the national policymakers in selecting the approachto sustainability[5].
Making reference to principles and intention sug-gested by UNCSD[35, 36], and taking account of theparticularity of the city, we set up the sustainabledevelopment indicator system of Tianjin, withenvironmental, resource, economic, social, and popu-lation dimensions simultaneously. According to their
important level, we arrange these indicators indegressive order(see Table 4).
3.2 Deduce the catastrophe risk index of Tianjin
Fig. 2 depicts a sort of information pyramid[37] builtup by successive integration steps to condense along list of indicators into a key index. Starting withbasic ecological, economic and social indicators, theapplication of algorithms and models produces a suitof 3-hierarchy risk indices. On the base of integratingthe 17 basic sustainable development indicators, thefirst hierarchy covers five basic risk indices rangingfrom economic development to social advance, popu-lation condition, natural resources carrying capacity,and environmental capacity. Then the five basic riskindices are further concentrated into two risk indices:development and supporting risk indices, which formthe second hierarchy. Following the bottom up inte-gration process, the top of the pyramid lays the CRI,the key index presenting the potential catastrophe
dimension indicator symbol
per capita GDP C1
gravity of tertiary industry C2
social labor productivity C3 economy
total investment in fixed assets C4
Engel’s coefficient C5
the proportion of poor population C6 society
the rate of registered unemployment C7
the natural growth rate of population C8
the proportion of urban population C9
population average life C10 population
the proportion of population with college education C11
per capita cultivated land C12
per capita of water resources C13 resource
per capita of energy resources C14
the qualified rate of drinking water source quality C15
the proportion of investment in environmental protection to GDP C16 environment
per capita public green-land C17
Table 4The sustainable development indicators system of Tianjin
Chen Y. F., Lu G. F. / Ecological Economy (2006)2:140-151
Fig. 2. The information pyramid of Tianjin from indicators to CRI
risk of city.With the purpose of getting indices to present
the catastrophe possibility, the algorithms and mod-els applied in these successive integration steps arecatastrophe theory and catastrophe models. Forinstance, in the sustainable indicator system ofTianjin, we list four basic indicators: per capita GDP(a), gravity of tertiary industry (b), social labor pro-ductivity (c), and total investment in fixed assets (d)to present the economic aspect of the regional sus-tainable development. Here we view a, b, c, d as con-trol parameters and the regional sustainable develop-ment as the behavior parameter x, and then choosebutterfly catastrophe to model them, which comprisesfour control parameters and one behavior parameteramong the seven basic catastrophe models. In termsof catastrophe theory, whenever the value of the fourcontrol parameters a, b, c, d and the one behaviorparameter x fit in with the bifurcation function of but-terfly catastrophe, catastrophic would occur in eco-nomic subsystem. In this case, if the values of allcontrol parameters have been normalized within [0, 1]as proportion of their status to safe boundaries, thevalue of behavior parameter x would also fall into [0,1] and present the probability of would-coming ca-tastrophe in the subsystem.
In integration process, given the value of the four
control parameters a, b, c, d, we can obey the integra-
tion function 1 11 13 52 4, , ,a b c dx a x b x c x d= = = = to calculate
the behavior vector ( ), , , Ta b c dx x x x after normal-
izing control parameters. Through comparison among
ax , bx , cx , and dx , we choose the largest value as
the economic development risk index to present thehighest probability of would-coming catastrophe ineconomic subsystem.
3.2.1 Data normalizationNormalization is a pre-process to make data com-
parable with each other by way of projecting datavalue into [0, 1] and transferring various dimensionsto none-dimension. In this paper, the main goal ofdata normalization is get the proportion of the indica-tors’ status to safe boundaries, as municipal manag-ers of Tianjin have suggested a target and a safeboundary simultaneously for each indicator, so we
employ boundaryett
boundaryi
xxxx−
−
argfor indicators whose nu-
merical values are the more the better and
Chen Y. F., Lu G. F. / Ecological Economy (2006)2:140-151
ettboundary
iboundary
xxxx
arg−−
for those whose numerical values
are the less the better. We follow this approach toprocess those raw data of 17 basic indicators from1993 to 1998, and results see Table 5.
3.2.2 Catastrophe models chain for successive indi-ces integration
In the bottom up integration process of indicespyramid, cusp, swallowtail, and butterfly models areapplied to integrate two, three, and four indicators(indices) respectively into one index. As Fig. 3 shown,basic indicators C1, C2, C3, C4 are condensed into B1
by butterfly models; then basic indices B1, B2, B3 areintegrated into A1 by swallowtail models; finally, A1,A2 are assembled into the top CRI by cusp model.
3.2.3 ResultAfter several steps of integration and calculation,
taking the year of 1997 for example ,we obtain thefollowing results:
Table 5Numerical values of 17 basic indicators after normalization
Chen Y. F., Lu G. F. / Ecological Economy (2006)2:140-151
On the whole, the descending part of CRI curveshown in Fig. 4 is consistent with the historical realityof Tianjing. Before 1996, due to unilateral emphasis oneconomic development, the service value of regionalecosystem had been degenerating year after year; thecatastrophe possibility of Tianjin’s man-land systemwas higher and higher, so the CRI kept increasing inthis period. Since 1997, along with China’s Agenda21 coming into effect, the municipal government ofTianjin began to carry on the sustainable develop-ment strategy and a series of measures to harmonizeecological environmental protection and social eco-nomic development, the collision between “man” and“land” has been mitigated gradually, so the curve ofCRI turn to decline since then.
Fig. 3. Catastrophe models chain in indices pyramid
Fig. 4. the CRI of Tianjin from 1993 to 1998
4. Discussion
Catastrophe theory provides us a new angle ofview to observe and research sustainabledevelopment. as much as we know, there isn’t anyreport on applying catastrophe theory to model sus-tainable development before. For such a bran-newapproach, inevitably there would be some uncertaintyand limitation. In other words, we would face a lot ofwork to improve it. In our opinion, researchers shouldpay more attention to these items mentionedfollowing:
(1) Define catastrophe probability and its calcula-tion formula.
When we apply catastrophe theory and catastro-
0.8880.907
0.939
0.963
0.935
0.872
0.820.840.860.88
0.90.920.940.960.98
1993 1994 1995 1996 1997 1998
Year
CRI
Chen Y. F., Lu G. F. / Ecological Economy (2006)2:140-151
phe models to analyze a man-land system, what at-tracts us most focusing on the following two: one isto forecast what the system status (including statesof control parameters and behavior parameters) wouldbe if a catastrophe comes, the other is to manage toreveal the possibility or probability of such a catas-trophe accurately. In this paper, through data normal-ization of indicators we get the normalized behaviorparameter x, namely with numerical value fallen in [0,1], to present the catastrophe probability. However,because of continuing controversy over the ques-tion of how to develop targets and boundary forsustainability in scientific community[38], the numeri-cal value of x could only provide a reference. Givendifferent definition and calculation, we would get dif-ferent result. Only various researchers adopt the samemeaning and calculation formula of catastropheprobability, could their result be comparable and more
valuable. Currently, it is a necessary and urgent taskto define “catastrophe probability” and unify its cal-culation formula among research communities.
(2) Model reality check.A model should be the representation of reality or
our perception of reality, so the model reality check isof great importance for a model building process.Model reality check calls for a comparison betweensimulation results and perceived reality. The smallerthe differences between them are, the more confidentwe are that the models can adequately address theproblems to which it is being applied[29]. However, forcatastrophe theory and catastrophe models, it is verydifficult for modelers to carry out the reality check.First, it’s because of lack of relevant historical datafor reference, which make it very difficult or simplyimpossible to predict catastrophe. Second, especiallyfor forecasting the possibility or probability of
Chen Y. F., Lu G. F. / Ecological Economy (2006)2:140-151
References
[1] Huang SL, Wong JH, et al. A framework of indicator systemfor measuring Taipei’s urban sustainability. Landscape andUrban Planning 1998; 42: 15-27(in Chinese)
[2] Opschoor H, Reijnders L. Toward sustainable developmentindicators. In: Kuik, O., Verbruggen, H. (Eds.). In search ofindicators of sustainable development. Dordrecht, TheNetherlands: Kluwer Academic Publishers, 1991. p. 7-27
[3] Rotmans J, de Vries B. Perspectives on global change: thetarget approach. Cambridge: Cambridge University Press;1997
[4]Irina G M-P. Integrated assessment models and responsefunction models: pros and cons for sustainable develop-ment indices design Ecological Indicators 2002; 2: 93-108
[5] Ronchi E, Federico A, et al. A system oriented integratedindicator for sustainable development in Italy. EcologicalIndicators 2002; 2: 197-210
[6] UNDP. Human development report 1996. New York: Ox-ford University Press; 1996
[7] Wackernagel M, Rees W. Our ecological footprint: reduc-ing human impact on earth. Gabriola Island, BC: New Soci-ety Publishers; 1996
[8] Dzidonu CK, Foster FG. Prolegomena to OR modeling ofthe global environment-development problem. J. Opera-tional Res. Soc. 1993; 44 (4): 321–331
[9] Meadows DH, Meadows DL, et al. The limits to growth.
Chen Y. F., Lu G. F. / Ecological Economy (2006)2:140-151
catastrophe, currently there are short of appropriatemeasures to assess models’ simulation results. It isthe lack of valuable historical data or appropriate mea-sures to verify the validity of models that forms theprimary bottleneck to hold back the spread of appli-cation catastrophe theory to man-land system andsustainable development modeling.
5. Conclusions
Either setting up CRI index or applying catastro-phe theory on sustainable development is a maidenattempt, however, the case study of Tianjin in thispaper shows their great promising future.
First of all, as mentioned above, sustainable de-velopment does in fact mean different things to dif-ferent people and that different cultures or stakeholdergroups will define sustainable development in termsof their own goals[39]. Besides, sustainable develop-ment is a systematical project, it covers all aspects ofman-land system, from ecological environment tosocial economy and even historical culture[5]. Vari-ous approaches from different standpoint are all wor-thy of reference in the decision-making process if wewant to attack the problem of sustainable develop-ment comprehensively and systematically. Unlike mostrecent sustainable development index, CRI leads us anegative angle to describe and research sustainabledevelopment. It is the new angle that endows CRIwith great practical significance, especially for otherdeveloping regions and countries. As we known, de-veloping regions and countries have to endure morepress of economic development, so they always givepriority as more as possible to their economy on thepremise of preserving the service or supporting levelof ecosystem. So it seems more necessary for them toassess whether their social economic activities wouldbring forth any ecological environment catastrophe.
Secondly, for many other assessment methods,researchers have to face the problem that how to dis-tribute weights among indicators in the process ofaggregating a large set of indicators into few indices.Generally, numerical values are subjectively assignedto those weights according to researchers’ knowl-edge and experience. However, such weights discus-
sion is not necessary for such a systemic approachas applying catastrophe theory to model, what needsto do artificially is only to array indicators accordingto their important level. It is being both qualitativeand quantitative that makes the approach more ob-jective as well as easier.
Lastly, perhaps the most important, it is not onlystatic characteristics but also dynamic mechanism ofsuch huge complicated man-land systems that wecould explore by employing catastrophe theory. Inthis paper, the application is only to deduce a staticindex CRI. Given that, a time scale is taken accountinto the modeling process, it is possible to use rel-evant catastrophe models to carry on dynamicprediction. This represents the next logic step in ap-plying catastrophe theory to model sustainabledevelopment.
[24] Holling J, Berkes CS, et al. Science, sustainability andresources management. In: Berkes F, Folke C, and ColdingJ (Eds), Linking social and ecological system. Cambridge,UK: Cambridge University Press, 1999
[25] Bright C. Anticipating environmental surprises. In: BrownLR, Flavin C, and French H (eds), State of the world 2000.A world watch institute report on progress toward a sus-tainable society. Norton & Company, NY, USA, 2000
[26] Forrester JW. World dynamics. Cambridge, MA, USA:MIT Press; 1971
[27] Dent JB, Edwards-Jones G, et al. Simulation of ecological,social and economic factors in agricultural systems. Agri-cultural Systems1995; 49(4): 337-51
[28] Jr JBR. Complex ecologic–economic dynamics and envi-ronmental policy. Ecological Economics 2001; 37: 23-37
[29] Chen YF, Qi J, et al. Dynamic modeling of a man-landsystem in response to environmental catastrophe. Inter-national Journal of Human and Ecological Risk Assess-ment 2004
[30] Holling CS. Resilience and stability of ecological systems.Annual Review of Ecology and Systematics 1973; 4: 1-24
[31] Vaessen GEJ, Stein HN. The applicability of catastrophetheory to emulsion phase inversion. Journal of Colloid andInterface Science1995; 176: 378-387
[32] Thom R. Structural stability and morphogenesis: an out-line of a general theory of models. Reading, MA: W.A.Benjamin, Inc.; 1975
[33] Anderson V. Alternative economic indicators. Routledge,London. Sociology 1991; 59: 311-332
[34] Andriantiatsaholiniaina L A, Kouikoglou V S, et al. Evalu-ating strategies for sustainable development: fuzzy logicreasoning and sensitivity analysis. Ecological Economics2004; 48: 149-172
[35] UNCSD. Indicators of Sustainable Development: Frame-work and Methodologies. DESA/DSD/2001/3. NY, USA;2001
[36] UNCSD. Report on the Aggregation of Indicators of Sus-tainable Development. Bkg. paper to the IX CSD, NY,USA; 2001
[37] Jesinghaus J. An european system of environmental pres-sure indices. Handbook draft(Part I). EU JRC ISIS, Ispra,Italy; 1999
[38] Meadows DH. Indicators and information systems forsustainable development. The Sustainability Institute,Hartland Four Corners, VT, USA; 1998
[39] Kelly KL. A systems approach to identifying decisiveinformation for sustainable development. European Jour-nal of Operational Research 1998; 109: 452-464
Chen Y. F., Lu G. F. / Ecological Economy (2006)2:140-151
NY, USA: Universe Books; 1972[10] Meadows DH, Meadows DL, et al. Beyond the limits: a
world-wide catastrophe or a sustainable world. Spectrum/Aula, Utrecht; 1992
[11] Bakkes JA, van Woerden JW. The future of the globalenvironment: a model-based analysis supporting UNEP’sfirst global environment outlook. RIVM 402001007 andUNEP/DEIA/TR.97-1; 1997
[12] Alcamo J. Integrated modeling of global climate change,IMAGE 2.0. Journal of Water, Air and Soil Pollution 1994;April (Special issue)
[13] Alcamo J, Shaw R, et al. The RAINS model of acidification:science and strategies in Europe. Dordrecht, TheNetherlands: Kluwer Academic Publishers; 1990
[14] Millennium Institute. Documentation for threshold 21-bangladesh: a national sustainable development model. Mil-lennium Institute, Arlington, VA; 1996
[15] Luyten JG, et al. AEGIS+: agricultural and environmentalgeographic information system plus. Research report AGENo94-1, Agricultural Engineering Department, Instituteof Food and Agricultural Sciences. University of Florida,Gainsville, FL, 1994
[16] Berry MW, Hazen BC, et al. Flamm lucas: a system formodeling land-use change. IEEE Computational Scienceand Engineering 1996; 3(1)
[17] Gallopin GC, Winograd M. Ecological prospective fortropical Latin America. In: Nishizawa, T., Uitto, J.I. (Eds.),The Fragile Tropics of Latin America: Sustainable Man-agement of Changing Environments(Chapter 2). New York:United Nations University Press, 1995
[18] Turner RK, Pearce DW, et al. Environmental economics:an elementary introduction. 1994. In: Ackoff, R.L. (Ed.),Harvester Wheatsheaf, London, 1971; Towards a systemof systems concepts. Management Science July 1971, No.17.
[19] Tainaka K. Uncertainty in ecological catastrophe. Eco-logical Modeling 1996; 86: 125-128
[20] Brown LR, Flavin C, et al. State of the world 2000. Norton,New York; 2000
[21] International Union for the Conservation of Nature/UnitedNations Environment Program/WorldWide Fund for Na-ture (IUCN/UNEP/WWF). Caring for the earth: a strategyfor sustainable living. IUCN, Gland, Switzerland; 1991
[22] United Nations Environment Programme (UNEP). Car-ing for the earth: a learner’s guide to sustainable living.United Nations, New York; 1992
[23] Dantzig GB. The role of models in determining policy fortransition to a more resilient technological society, IIASADistinguished Lecture Series, vol. 1, 1979
Ecological Economy (2006)2:152-160
Methods
Evaluation of harmonious development foreconomy-environment system in coastal cities: a case study
of Tianjin MunicipalityLi Fen1*, Zhang Yuan2, Zheng Binghui2, Wang Xiqin1
1. School of Environment and Natural Resources Renmin University of China, Beijing 100873, P. R. China2. River and Coastal Environmental Research Center, Chinese Research Academy of Environmental Sciences,
Beijing 100012, P. R. ChinaReceived Dec.9, 2005; Accepted Jan.19, 2006
Abstract: With the aim of the harmonious development of economy-environment system in coastal cities in China, an indexsystem used to evaluate the economy-environment system is built up in this paper, which includes four aspects: economy,environment, resources, and ocean industry. Based on the analysis on present condition and future trends of economicdevelopment in Tianjin and the quantification of various evaluation indices, the author applies integrated index valuationmodel to valuate the harmonious development of economy-environment of Tianjin. The results show that the coordinateddegree of economy-environment would drop down in the future, from 0.95(superior level of harmonious development) in2000 to 0.59(inferior level of harmonious development) in 2015, under the circumstance of the current economicdevelopment mode. The level of comprehensive development of Tianjin also presents to descend. Based on the analyzingof status and future trends of environment-economy coordinated development, the paper puts forward the countermea-sures such as industry structure adjustment, increasing the level of environmental protection investment, strengtheningthe enforcement of environmental policies to improve the coordinated development of environment-economy in Tianjinmunicipality.Keywords: Coastal cities; Economy-environment system; Harmonious development; Coordination degree; Tianjin Mu-nicipality
1. Introduction
The coastal area is about 28.5×10⁴km2 which isabout 15% of the whole China, while the populationaccounts for over 40% of the whole population[1].With the rapid development of economy and the ex-tensive exploitation activities in the coastal area, theecosystem environment bears a huge pressure. Manyproblems have taken places there, such as popula-tion increases, resources dry-up, environment popu-lation and ecology destroy etc.[2] It has been put for-ward that we should pay more attention to the re-search on ecotone and sensitive trip by ResearchReport of Natural Science Development, publishedby finance committee of natural science. It also claimedthat sustainable development optimization model of
population, resources and environment in environ-ment fragility area will be one of the main researchesin the future. Therefore, the harmonious developmentof economy and environment in coastal zone area isan important topic deserved to study.
Since 1970s, theories about economic develop-ment and resources and environment developed bywestern scholars have experienced three stages: “eco-nomic growth determinism”, “zero growth theory”,and “harmonized development theory”. The first stageoverstated economic growth and ignored resourcecarrying capacity. The second stage stressed resourceand environmental protection and neglected the de-mand for regional economic development. Until theemergence of sustainable development theory, havehuman beings reached consensus on harmonizationof population, resource, environmental, social and eco-nomical development[3].* Corresponding author. E-mail address: [email protected]
The quantity analysis of the harmonious devel-opment of environment-economy started in 1950s, theoptimum economic growth mode could be establishedby using liner programming method on the conditionof resource constrain, Researchers[4-7] had broken anew path of the application of input-output model toenvironmental-economy system analysis from the lateof 1960s to the early of 1970s. They had gone deepinto the research of the environment-economic sys-tems in 1980s. Depotaks and Fisher[8] brought for-ward the universal balancing model on the basis ofindustry structure. Boyb[9] appraised the economiceffects of the environmental policies via CGE(Computable General Equilibrium). With the gradu-ally deep understanding of the correlation betweenenvironment and economy, the quantity analysis ofthe environment-economy was continuallymodifying. Ikeda[10] built up the environment-economy determinism and multi-objectives program-ming model. Arntzenand Braat, Brouwet et al.[11] setup the regional multi-scenarios simulation model.Riddell[12] established integrated model of ecologicalsimulation and economic optimization.
The domestic scholars have spread out the re-search about the harmonious development of envi-ronment-economy via learning international theoriesand practices. Yang Shi-hong[13] introduces the con-cepts of coordinated development and coordinateddegree of environment-economy. Taking Guangzhoumunicipality as a case study, a set of index of envi-ronment-economy systems was built up. The eco-nomic status of research area was analyzed andpredicted. According to the prediction, policiesadvices and countermeasures could be put forward.Based on the theory of multi-objectives optimizationof system engineering and synergism, new-typed pre-diction model[14] of harmonious development of envi-ronment-economy has been put forward. Wu Yuemingapplied it on Liyang municipality, and researched thecoordinated development of environment-economyand its future trends. The above research works couldprovide decision-making for the sustainable devel-opment of environment-economy of Liyangmunicipality. Li Yan et al. [15] introduced the harmoni-ous relationship between environment and economy.
Subsequently a set of index of environment-economysystem was built up, and then a numerical model wasput forward to evaluate the harmonious developmentof environment-economy system. Finally, a positiveresearch based on A city is given. Jin Jianjun[16] clari-fied the connotation of sustainable development incoastal area on the basis of the sustainable develop-ment theory. Taking some coastal cities in Liaoningprovince as cases study, the evaluation methods aboutcoastal area sustainable development were introducedin detail.
Above all, as far as the research field is concerned,most researches just concentrate on cities’environment, few of which are combined with coastalarea’s environment. So, the harmonious developmentof environment and economy of coastal area is lack ofresearch. The authors believed that it is a key topicdeserved to research. A set of index on behave of thecharacteristic of the coastal cities has been built up inthis paper. Taking Tianjin municipality as a case study,the coordinated degree of environment-economy wasevaluated by integrated index evaluation model, andthen it is predicted by GM (1, 1) model. In a brief, theresearch work in this paper would enrich the theoryof coastal cities’ management, and provide the scien-tific guidance to the harmonious development of en-vironment-economy of Tianjin in the future.
2. Index systems of harmonious development ofeconomy-environment of coastal city
How to choose index system is the key point to theevaluation of economy-environment system.Consequently, the right index system is an importantprior condition in evaluating the development statusof economy-environment system. Because the envi-ronment-economic system is a complicated and com-prehensive system, economy-environment system in-dex should be huge by all means. It seems to be veryimportant that we should choose the representativeindex from these huge and complicated index systems.
2.1 Index choosing
We choose index according to the methods of
Li F. et al. / Ecological Economy (2006)2:152-160
frequency analysis, theories analysis and expertconsultation. Guided by the theories analysis method[17], the representative index could be chosen via ana-lyzing the characteristic of economy, resources andenvironment systems; frequency analysis method[18]
review the papers of evaluation harmoniousdevelopment, and then choose the index frequentlyused in these papers; expert consultation method[19]
is has two steps: first, to build up a set of initial index,secondly, to consult experts opinions then adjust theoriginal index. The comprehensive usages of theabove methods got the general index system in thispaper. Before establishing the concrete index systemusing for evaluation of research area, the followingfactors should be considered: the nature environmen-tal characteristics, social economic development andthe available data etc.
2.2 The construction principles of index system
As for the complication of the harmonious devel-opment system, we should follow some principle [15]
to set up harmonious development index system in-cluding four aspects: society, economy, resources,and environment.
The principle of pertinence: the index system ofeconomy-environment harmonious developmentshould aim at the characteristics of economy and en-vironment system, making sure of its feasibility andrepresentative.
The principle of perspicuity: the chosen indexshould be likely to simple and understandable andcan reflect the change trends of the economy orenvironment.
Regional principle: when evaluating theeconomy-environment system, we should follow thisregional principle in order to objectively explain thedevelopment of economy-environment. As for coastalarea, the chosen index system can represent the char-acteristic of it.
The principle of combining dynamic state withstatic state: the index system should include not onlystatic index, but also dynamic index which can ac-count for change trend. Both of them can reflect thedevelopment of economy-environment system for
better.2.3 The basic framework of the index system of har-monious development
The index system of economy-environment har-monious development is the criteria to evaluate har-monious development of regional economy-environment. It integrates economic system with en-vironmental system in the light of hierarchicalrelationship.
According to above principle and regional char-acteristics of coastal area, the index system which isconstituted of system layer, sub-system layer andindex layer was built up. Among them, the systemlayer is to be constituted by the sub-system layer,and the evaluation target of it is the index system ofharmonious development of economy-environmentof coastal area; the sub-system is made up from con-crete index layer, including four aspects: economysub-system, resources sub-system, environment sub-system, oceanic industry sub-system, in terms ofabove analysis and industry characteristic of coastalarea; index layer is built up from 22 index such as:GDP per capital, the yield of oceanic industry, Indus-trial waste water treated ratio of coastal area£¬Com-prehensive sea index of coastal area etc.
The index system is shown as Fig. 1.
3. The harmonious Level of economy-environmentsystem
The quantity evaluation methods of economy-environment are constituted of system dynamicmethod, gray system evaluation method, comprehen-sive index method, etc. [20]
System dynamic method was founded by Jay.w.Forreste in 1956, who is the professor of MIT. Basedon the information theory, cybernetics theory andsystem theory, system dynamic method integratedquantity analysis with quality analysis and was usedof human-computer interaction. It is a useful tech-nique tool by modeling and emulation of reality. Inthe light of the model results, the countermeasurescould be put forward. Non-liner problems are prefer-ably resolved via system dynamic method, which ex-
Li F. et al. / Ecological Economy (2006)2:152-160
Index system of econom
y-environment harm
onious development
of coastal area
E n v iro n m e n t
S y s te m
R e s o u rc e s
S y s te m
O c e a n ic
In d u s try
E c o n o m ic
S y s te m
In d u s tria l w a s te w a te r tre a te d ra t io
Vo lu m e o f In d u s tr ia l re s id u e p ro d u c e d
In d u s tria l re s id u e tre a te d ra tio o f c o a s ta l a re a
P e r c a p ita l o w n e d la n d a re a
U s e ra tio o f se a -b e a c h
P e r c a p ita l o w n e d se a -b e a c h a re a
P e r c a p ita l o w n e d w a te r a re a
C o m p re h e n s iv e se a in d e x o f c o a s ta l a re a
W a te r e n te rin g th e se a o f c o a s ta l a re a
Vo lu m e o f fre ig h t h a n d le d in c o a s ta l p o r ts
O u tp u t o f a q u a tic p ro d u c ts
O u tp u t o f c ru e l o il p ro d u c ts
O u tp u t o f c ru e l sa lt p ro d u c t
F o re ig n e x c h a n g e e a rn in g s o f to u rism
In v e s tm e n t in f ix e d a ss e ts
P e r c a p ita l G D P
P e r c a p ita l g ro ss o u tp u t v a lu e o f in d u s try
P e r c a p ita l g ro ss o u tp u t v a lu e o f a g r ic u ltu re
P e rc e n ta g e to G D P o f te r tia ry in d u s try
A m o u n t o f a c tu a l u tiliz a tio n o f fo re ig n c a p ita l
P e r c a p ita l d is p o sa b le in c o m e
Vo lu m e o f in d u s tr ia l w a s te w a te r d is c h a rg e
Fig.1. Index system for urban environment and economic coordinated development in coastal zone
erts on subjectivity. Compared to other models, sys-tem dynamic isn’t in pursuit of the single-objectiveoptimization. The optimization objective of the wholesystem is taken into account in it, which is put em-phasis on the harmonious of each sub-system.
Grey system theory was put forward in 1982. Inrecent years, it is applied to deal with the regionaldevelopment problems such as harmonious develop-ment of economic, society, resources andenvironment. In the theory, the known information is
called “white information”, the unknown or unascer-tained information is called “black information”.Therefore, the grey system, which is conclude “blackinformation” and “white information” ,is constitutedof grey prediction model (GM(1,1)), grey correlativeanalysis model and grey decision-making model.
Integrated index evaluation method could calcu-late the coordinated development level via buildingup the integrated index. The index can explain theeconomic and society phenomenon dynamic change.The method resolves the problems of the differentdimension of complicated environment and economicindex. Therefore, the complex environment and eco-nomic dynamic change can quantitatively explain byusing of the integrated index model which analyzesthe influence degree of various factors of environ-ment-economy system. The integrated index evalua-tion method scientifically evaluates the coordinateddevelopment of environment-economy, based onwhich, the efficient management of environment-economy system would be available. Generally, theintegrated index evaluation method overcomes thedrawbacks of other evaluation methods such assubjectivity, unilateralism. The most important is thatis easy-to-command. Therefore, it is a preferablemethod to evaluate the environment-economicsystem. According to the above conclusions, the paperchooses the integrated index evaluation method[13]
to evaluate the harmonious development of environ-
ment-economy system of Tianjin municipality.k
ygxfygxfC
⎪⎪⎭
⎪⎪⎬
⎫
⎪⎪⎩
⎪⎪⎨
⎧
⎥⎦⎤
⎢⎣⎡ +
⋅= 2
2)()(
)()(βα (1)
C is the harmonious level; x is the environmentindex; y is the economic index; K is the adjustmentcoefficient, K=2; and , are weight.
Although C used to represent the relationship be-tween economy and environment, which play impor-tant role in accounting for economy-environmentdevelopment, it can not perfectly explain the compre-hensive development level of economy-environment.However, D (harmonious development level of city)can make up this shortage, and it can accurately ac-count for the comprehensive development level ofeconomy-environment.
The equation is summarized as follows:
CFD = (2)
F is the coefficient of comprehensive harmoniousdevelopment of economy-environment and the sta-tistics of this paper are all from The Yearbook of TianjinCity from 1990 to 2003.
4. Case study
Tianjin, which is a seaport, is situated in the north-east part of the North China’s plain, with the Yanshan
C o m p re h e n s iv e
e n v iro n m e n t
in d e x
C o m p re h e n s iv e
e c o n o m y in d e x
C o o rd in a te d d e g re e o f
e c o n o m y -e n v iro n m e n t
C o m p re h e n s iv e
d e v e lo p m e n t
le v e l o f c ity
1 9 9 0 0 .5 7 2 0 .2 2 3 0 .6 5 2 0 .3 9 8
1 9 9 1 0 .5 6 2 0 .2 5 1 0 .7 2 9 0 .4 0 7
1 9 9 2 0 .5 7 9 0 .3 0 3 0 .8 1 4 0 .4 4 1
1 9 9 3 0 .5 7 5 0 .3 3 3 0 .8 6 3 0 .4 5 4
1 9 9 4 0 .5 5 8 0 .4 2 5 0 .9 6 4 0 .4 9 2
1 9 9 5 0 .5 4 1 0 .4 8 7 0 .9 9 4 0 .5 1 4
1 9 9 6 0 .5 2 9 0 .5 4 1 1 0 .5 3 5
1 9 9 7 0 .5 1 5 0 .5 8 6 0 .9 9 2 0 .5 5 1
1 9 9 8 0 .5 2 5 0 .6 1 5 0 .9 8 8 0 .5 7
1 9 9 9 0 .5 0 8 0 .6 2 8 0 .9 7 8 0 .5 6 8
2 0 0 0 0 .5 0 .6 8 3 0 .9 5 3 0 .5 9 2
Table 1Environmental quality index, economic performance index, coordinated degree, and comprehensive development level inTianjin from 1990 to 2000
The coefficient of ecnomy-environment comprehensive development
The Balanced development level
Fig.3. Prediction of harmonious development for urban environment and economy in Tianjin
Mountains on the north and Bohai Sea on the east.The sea is the lifeline and a major source for the eco-nomic growth of Tianjin. With rapid economicdevelopment, the living standard has considerablyimproved over the recent decades but, unfortunately,at the expense of increasing environmentaldegradation.
4.1 Analysis of economy-environment present con-dition of Tianjin
4.1.1 index dispositionIn order to resolve the problems of different
dimension, original data need to be dealt with after
data collections. The simple and practical dimension-less method is used in this paper.
The equation is as follows:
⎪⎩
⎪⎨⎧
=indexasnegativex
indexaspositivexx
xx
ii
iii min/
max/ˆ
λ
λ (3)
or is the ideal value of the ix index. Inorder to set up the criterion valuation, the authorstake the reference of the relevant planning criteria stan-dards and the ideal target of domestic and interna-tional city and integrate with economic and environ-mental status of Tianjin.
The factor analysis is applied to calculate theweight of variety index system, which can avoid the
Li F. et al. / Ecological Economy (2006)2:152-160
influence of subjective factors and get the more ob-jective results.
4.1.2 Evaluation of coordinated degreeThe coordinated degree of economy-environ-
ment and the comprehensive development of citywere calculated by use of equation 1 and equation 2(see Table 1).
The results show that economic development ofTianjin experienced two stages. From 1990 to 1995, thedevelopment mode of Tianjin belongs to the economylag type as shown in table 1. At this stage, the environ-mental condition is worsening owing to overexploitresources, with the rapid development of economy.The comprehensive environment index and compre-hensive economic index tend to be the same, but thecomprehensive development level was still low.
On the contrary, from 1996 to 2000, the develop-ment mode of Tianjin belongs to the environment lagtype as a result of the worsen environment. Accord-ing to such development mode, it is predicated thatthe unharmonious between economic developmentand environmental condition would be worsen.
Since 1990s, the comprehensive development levelof Tianjin has jumped up from 0.398 of 1990 to 0.592 of2000, which means the relationship between economyand environment was harmonious. But neither thedeveloping level of economy nor comprehensive in-dex of environment still drops behind developedcountries. According to the statistics, the conflict ofeconomy and environment would be more and moreserious in the future in Tianjin municipality.
To explain the change of coordinated degree ofeconomic-environment, the authors analyze the in-dustries structure mode. And the results show thatforeign investment had focused on light industry from1978 to 1990. Therefore, the light industry had devel-oped more quickly so that the proportion of light in-dustry was higher than that of heavy industry.However, since 1990s, with the extension of economicscale and increase of foreign investment, the gov-ernment emphasizes on heavy and chemistry indus-tries such as ethane polyester. Therefore, many newchemistry industries have been built up and someold enterprises were reconstructed. The change of
industry structure is the most important factor tomake economic develop rapidly. But the ecologicalenvironment has bore great pressure and the rela-tionship of economic and environment has emergedto inharmonic due to the development of heavy in-dustry in recent years.
4.2 The prediction of coordinated degree and com-prehensive development level
After the evaluation of environment-economy de-velopment of Tianjin, based on the result of presentcondition evaluation, reliable prediction of harmoni-ous condition and development level can be obtainedin terms of traditional method-grey system model(GM(1,1)). In Fig. 3, these results are better to reveal thedevelopment trend of Tianjin.
According to the prediction, the relationship be-tween economy and environment will deterioratedramatically, if keeping with current economic policies,environmental protection policies and productiontechnique. In 2015, the value for harmonious devel-opment of economy-environment will drop down to0.59 (be placed in the departure of harmonious devel-opment level), a decrease by 0.36 from 2000. The com-prehensive development level also presents todescend. In terms of prediction results, it would dropdown to 0.7.
5. Conclusions and recommendations
A set of index of environment-economy had beenbuilt up in this paper, including four aspects:economy, environment, resources and ocean industry.According to the research, the results show that someindex are significant important in the whole index sys-tem such as volume of industrial waste waterdischarge, industrial waste water treated ratio, percapital owned sea-beach area, per capital owned wa-ter area, output of aquatic products, per capital GDP,per capital gross output value of industry etc, whichare comparing to other indicators. Therefore, theseindicators play important role in promoting the har-monious development of Tianjin. Consequently, gov-ernment should pay more attention to these impor-
Li F. et al. / Ecological Economy (2006)2:152-160
tant indicators in future, which dramatically influencethe environment-economy harmonious developmentof Tianjin.
As a developed coastal city, the coordinated de-gree of economic-environment and comprehensivedevelopment level of Tianjin had been dramaticallyimproved from 1990 to 2000. And the relationship be-tween economy and environment is harmonic.However, the type of economic-environment hadchanged from economic-lag type to environmental-lag type. The result shows that coordinated degree ofenvironment-economy will drop down in the future, ifunder the circumstance of the current economic de-velopment mode, environmental protection policesand product techniques. It is one of the primary fac-tors to cause the decrease of coordinated degree thatthe change of industry structure from light industryto heavy industry.
Based on the above research conclusions, the en-vironmental quality index would drops down becauseof the rapid development of economy, which put pres-sure on the environment. Although the integrated in-dex of environment-economy is getting more and moreincreasing, the coordinated degree of economic de-velopment and environmental quality go down to in-ferior level.
As a result, we should improve the environmentalquality to achieve the sustainable development andto build harmonious development. Therefore, the pa-per puts forward the following countermeasures:
(1) Industry structure adjustmentThe conversion and upgrade of industry struc-
ture has achieved remarkably effect since 1990. Butwith the rapid development of urbanization, there werea lot of industry structure obstruction which need tobe resolved. Thus the industry structure should beoptimized and adjusted. The proportion of tertiaryindustry to GDP is relatively low. The proportion isaround 46% in tianjin from 1998-2001; however, theproportion is beyond 50% in other developed citiessuch as Beijing, Shanghai, Guangzhou in the corre-sponding periods. Compared with these cities, theinterior structure of tertiary industry of Tianjin has manydrawbacks, for example, the over-high of traditionalindustry, the lag development of the rising industries
such as knowledge or talent intensive industry, and allof these insufficiencies would draggle the upgradingof city function. The economic development patternhas taken on the trends of over-rise, over-consump-tion and over-pollution. According to the developmentpattern characteristic, the government should put em-phasis on the development of transportation, trade andfinance. The rising industries such as real estate, traveland information should be developed vigorously tocome into being the own tertiary industries system ofTianjin. Consequently, the remarkable development ofTianjin has been achieved in adjusting and upgradingof industry structure.
(2) Increasing the level of environmental protec-tion investment
Tianjin Municipality should reform its taxation andlevy system for environmental protection and extendthe current financing channels. According to the cur-rent situation, new levy system should be formulatedand the levy standards should be raised so that thecollected money can meet the demand for maintain-ing constant operation of industrial pollution controlfacilities and alleviate the financial burden of thegovernment. The government should increase thelevel of using foreign investment in environmentalprotection, taking full advantage of Tianjin’s uniquestrength. It should also collect information about in-ternational financing for environmental protection andexplore the opportunities for acquiring financial aidsfrom multilateral cooperation organizations, NGOs andfoundations. While implementing financial supportpolicies, market-based mechanism should be adoptedto raise environmental protection fund, such as pub-lic fund, government bond and loans.
(3) Strengthening the enforcement of environmen-tal policies
Tianjin Municipality should establish a frameworkfor integrated decision-making for economic devel-opment and environmental protection, which is a stra-tegic program requiring efforts across different gov-ernmental departments and sectors. Therefore, thegovernment should set up effective integrated deci-sion-making mechanism, coordinating economic, en-vironmental and social benefits at the earliest stage. Itshould also improve the quantitative examining sys-
Li F. et al. / Ecological Economy (2006)2:152-160
References
[1] Shi Chun. The administration management system of sus-tainable development in coastal area. Shanghai: East ChinaNormal University; 2001(in Chinese)
[2] Lu Shouben, Ai Wanchou. Integrated management of coastalarea: a research on system and function mechanism. Beijing:Ocean Press; 2001(in Chinese)
[3] Fan Jie, Qian Qinglan. A comparative-study on the interac-tive relations between economic development and resource-environment in China’s eastern coastal areas. Journal ofNatural Resources 2004; 19(1): 96-105(in Chinese)
[4] Cumber JHA. Regional interindustry model for analysis ofdevelopment objectives. Regional Science Association Pa-per 1996; 17: 65-94
[5] Daly HE. On economics as a life science. Journal of Politi-cal Economy 1968; 76(2): 392-406
[6] Harton H, A Houwcling. Pollution abatement and the eco-nomic structure: empirical results of input-output compu-tations for the Netherlands. Occasional No 1, the Hauage:Central Planning Bureau; 1974
Li F. et al. / Ecological Economy (2006)2:152-160
[7] Cumber JHA, BN Stram. Empirical application of input-output models to environmental problems. In: K. Polenskeand J.V. Skolka(eds.). Advances in Input-Output Analysis,1976
[8] Despotakis KA, AC Fish. Energy in a regional economy: acomputable general equilibrium model for California. Jour-nal of Environmental Economics and Management 1988;(15): 313-330
[9] Boyd D. Methods of reducing environmental damages in acomputable general equilibrium model of the US. PaperPresented at the International Conference on Environ-mental Cooperation and Policy in the Single EuropeanMarket. Venice, 1990. p.17-20
[10] Ikeda S. Economic-ecological models in a regional setting.Sakura: University of Islikuba; 1984
[11] Arrntzen JW, L C Braat. An integrated model for regionalpolicy analysis. In: T.K. Lakshmanan and P. Nijkamp(eds.). Systems and Models for Energy and EnvironmentalAnalysis. Aldershot: Grower, 1983.p. 45-48
[12] Riddell R. Ecodevelopment. Aldershot: Gover; 1981.Robinson J et al. Continuing a sustainable society; 1990
[13] Yang Shihong. A study on the forecast and regulation ofcoordinated development of urban environment andeconomy in Guangzhou. Scientia Geographica Sinica 1994;14(2): 136-143 (in Chinese)
[14] Wu Yueming. Rearrangement of industrial structure andcoordinated development of urban environment andeconomy in Liyang City. Urban Environment & UrbanEcology 1996; 9(2): 47-50 (in Chinese)
[15] Li Yan, Zeng Zhenxiang. Study and application of evalu-ation method of coordinated development of economy-environment system. Theory and Practice of SystemicEngineering 2003; 5: 54-58 (in Chinese)
[16] Jin Jianjun, Hui Caixing. Concept and index system ofcoastal zone sustainable development. Marine Science Bul-letin 2001; 20(1): 61-66 (in Chinese)
[17] Wen Yanmao. Study on assessment system and assessmentmethod of sustainable development of human-earthsystem. Advance in Earth Sciences 1999; 14(1): 51-54 (inChinese)
[18] Xu Shilong. Suggestions on statistic index system for thequantitative evaluation of sustainable development. Statis-tics & Information Tribune 2000; 15(1): 7-14 (in Chinese)
[19] Liu Yulin. Design and assessment methods on statisticindex system for sustainable development of China. Eco-logical Economy 1999; 18(6):17-20 (in Chinese)
[20] Deng Julong. Grey system methods. Wuhan: HuazhongUniversity of Science and Technology Press; 1987 (inChinese)
tem for comprehensive environmental rehabilitation inTianjin and foster cooperative and deliberative mecha-nism among various stakeholders. Integrated economicand environmental accounting should be piloted toincorporate negative externalities of environmental pol-lution and resource depletion into economicaccounting, which can have implications for policydesign and decision-making for project constructionand regional development. A mechanism for assessing,alarming and monitoring the coordinated economic andenvironmental development should be founded basedon the framework of coordinated development to sci-entifically and reasonably evaluate the level of coordi-nated development in Tianjin. All the efforts will en-sure that Tianjin steps forward along a path of coordi-nated development.
Acknowledgements
Supported by the National High-Tech Research and Development Program of China (863 Program)(Grant. No. 863-2002AA648010).
Ecological Economy (2006)2:161-169
Study on the construction and operation for managementsystem of municipal domestic wastes
Liu Wei1, 2*, Wang Shuqiang3, Chen Jingxin3
1. Wuhan University of Technology, Wuhan 430070, P. R. China,2. North China Institute of Astronautic Engineering, Langfang 065000, P.R.China
3. Hebei University of Technology, Tianjin 300130, P. R. ChinaReceived Nov.23, 2005; Accepted Jan.9, 2006
Abstract: In recent years, the quantity of our country’s municipal domestic wastes increase rapidly, but the waste disposalstill has problems, such as the simple way of processing, wasting the resources, the serious environmental pollution andso on. By holding waste minimization as the center, the developed countries have formed perfect waste managementsystem. Based on analyzing the status quo and problems of processing in our country, on the principle of benefit, scale,waste minimization, reclamation and hazard-free treatment, according to the recycling model of processing, the articlehas constructed our country’s domestic wastes management system, proposed the measures of promoting the operationof system. It has realized the transformation of waste management system from terminal disposal to source reduction,achieved the goals, including domestic wastes categorizing and reclaiming, industrialization and non-pollution processing,and finally brought sustainable development for resources, environment, economy and society.Keywords: Recycling economy; Municipal domestic wastes; Waste reduction; Reclamation; Environmentally sound
Analysis
* Corresponding author. E-mail address: [email protected]: Liu Wei(1970-), male, PhD candidate in WuhanUniversity of Technology, lecture in North China Instituteof Astronautic Engineering, specialized in industrialeconomics.
1. Introduction
With the rapid growth of our country’s economyand the progress of urbanization, the total of ourcountry’s municipal domestic wastes drasticallyincrease, which have amounted to over 150 milliontons annually. But the situation becomes increasinglyserious because of the simple way of processing,wasting the resources, the serious environmentalpollution. The number of municipal domestic wastesrecycling schemes has risen markedly over the lastdecade, particularly across Europe and North Americaand there has been significant improvement in theoverall recycling rates for municipal domestic wastes.For example, the municipality of Aarhus in Denmarkhas a population of 282,000 and achieves an overallrecycling rate over 64% of all the different kinds ofwaste. Another example of a successful recycling isWiesbaden, Germany. The city which has a popula-tion of 267,000 reaches the recycling rate of 48% with
91,000 tons of municipal domestic wastes each yearand 43,500 tons recycled[1]. At present, the developedcountries have already made preliminarily perfectwaste management systems, which is called the modelfrom cradle to grave, among which German wastemanagement system is the most typical one. Thissystem takes prevention primarily, extended produc-ers’ responsibility (EPR) and the government’s coop-eration with the business as principles, takes avoid-ing waste production as the essential target by eco-nomic policies, such as waste charging, ecology tax,waste treatment industrialization to form the omni-directional waste management system, making thewaste disposal German economic important industrywhose annual turnover reach approximately 41 billioneuros. It has created more than 200,000 employmentopportunities every year and brought social and eco-nomic benefits[2]. From the overseas waste disposalexperience and based on the analysis on the statusquo and problems of processing in our country, it isan urgent task for us to construct the domestic wastesmanagement system of our country to realize recy-cling and non-polluted processing, reduce the con-tradiction between our country’s economy growth
Liu W. et al. / Ecological Economy (2006)2:161-169
and the insufficient resources, and establish the re-source conservation society diligently.
2. Status quo and problems of processing municipaldomestic wastes in China
Since 1997, our country’s municipal domesticwastes have grew drastically with annual averagegrowing rate over 8%, accounting for more than 25%of the world wastes. It is estimated that the annualoutput of municipal domestic wastes will be 250 mil-lion tons in 2010 [3].
Our country’s municipal domestic wastes man-agement is simple cleaning, clearing and treatment,which is still at the terminal treatment stage. The do-mestic wastes classification has just started, althoughit has set up the classified collection dustbin in majorstreets and inhabitant plots in big cities, but the ef-fect is not good as expected. Mixed collection is stillpopular as the way of transporting. There are mainlythree ways of disposing domestic wastes: landfilldisposal, composted processing and incineration,among which landfill disposal occupies more than75% of the fundamental waste disposal mode;composted processing accounts for about 20%; in-cineration only accounts for the very small proportion.Landfill has invaded the massive lands, seriouslypolluted the air and water resources. For lack of pollu-tion treatment, the wastes buried centralizedly willbecome a latent long-term source of pollution [4].
At present the main problems exiting in ourcountry’s domestic wastes management system areas follows:
(1) The management concept is backward, andthe management system is imperfect. Our countrydoesn’t take waste management seriously, still at theterminal treatment stage without clear managementgoal. And the integrated management system has notformed yet.
(2) The mixed collection makes the processing moredifficult. At present our country is still adopting mixedcollection, making the massive deleterious substancesentering waste directly, which finally makes the recy-cling and non-pollution disposal more difficult.
(3) The waste charging system is not scientific,
and the government is short on funds. Although themajor cities of our country have established wastedischarging system to charge on time, but the systemis unreasonable, lower than the actual cost of wastedisposal. Fund nearly completely depends on fiscalappropriation. The policy “who pollutes, who takesresponsibility” is not realized so that the country isseriously short on funds.
(4) The management system is imperfect andinefficient. The environmental sanitation departmentis mainly responsible for our country’s domesticwastes management. This department is not only theoperating unit but also the department responsiblefor treatment and supervision, which makes the legis-lation and the law enforcement a same department.As a result, the management efficiency is low.
(5) The waste disposal technology is backward,and the environmental pollution is serious. In mostcities of our country domestic wastes are piled up inthe open-air and buried without any treatment to makethe urban environment worse.
3. The construction of our country’s municipal do-mestic wastes management system
From developed countries’ experience and thestatus quo of our country’s domestic wastesmanagement, the urgent need is to establish a wastemanagement system, which is composed of manage-ment department, enterprises for treatment, laws andregulations system, economic policies and so on sothat we can establish the waste disposal flow com-posed of waste production, collection, transportation,reuse, recycling, comprehensive utilization,processing, landfill and so on. At the same time wealso need to formulate corresponding laws and regu-lations and economic policies to ensure the manage-ment system in good operation.
3.1 The experience from the developed countries
Germany has been in the forefront to developingrecycling economy. Wastes disposal and recycle isthe key to recycling economy, and integrated wastemanagement has been established. The main experi-
Liu W. et al. / Ecological Economy (2006)2:161-169
ence is as follows:Firstly, promote minimization, reuse and recycling
of wastes by legislation. Germany has adopted someof the toughest and most creative environmental lawsand policies in the world. Early in 1972, Waste Man-agement Act was passed. Great progress has made inwaste management in Germany since 1986. In 1991,German Parliament set targets for the recycling of 80%to 90% of packaging materials by legislation [5]. InJuly 1994, Germany passed the landmark environmen-tal law Closed Substance Cycle and Waste Manage-ment Act. The law is based on the polluter-paymentprinciple. It requires that those who generate wastesare responsible for finding ways to avoid generatingthe waste in the first place and to recycle, reuse, orsafely dispose the wastes[6].
Secondly, push Extended Producer Responsibil-ity Program actively. EPR, as an environmental policyapproach, requires that a producer’s responsibilityfor the product is extended to the post-consumer stageof a product’s life cycle. The two related characteris-tics of EPR policy are the transferring of responsibil-ity upstream (physically and/or financially, fully orpartially) to the producers from municipalities, and toprovide incentives for producers to take environmen-tal factors into considerations when they are design-ing their products. Because of the enforcement ofGerman Packaging Ordinance in 1991, Dual Dis-posal System was established, and it is a successfulEPR program. About seven years later, the systemhas proved successfully in several areas. First, manu-facturers have changed their packaging habits. Non-polluted packaging is taken into account during the
production process. Second, changes in the packag-ing market can be seen due to differences in licensefees for different materials and the burden of the feesthemselves. Packaging has become lighter and smaller.Third, the consumption of packaging materials hasreduced considerably in Germany. In 1997, 1.4 milliontons packaging materials were reduced than in 1991.Fourth, in the field of transportation of packaging,there is a trend towards reusable packaging, forexamples, the packaging for furniture, food, pharma-ceutical products and bicycles. Fifth, a nation-widecollection system has been set up for one-off packag-ing and increased recycling capacities for all packag-ing material. The recycling quotas for kinds of materi-als are 64% for plastics, 72% for compounds, 79% fortinplate, 80% of aluminum, 83% for glass and 87% forpaper and cardboard[7].
3.2 The establishment of principles of the system
The system should be established with the prin-ciples as following:
Firstly, pursue profit. After analyzing the eco-nomic status quo, researching the project investment,evaluating its direct or indirect economic benefit, theoptions of disposal methods and projects for domes-tic wastes should be identified and decided accord-ing to the principles with the least investment, thelowest cost for the highest comprehensive benefits.
Secondly, satisfy scale demand. With the rapidincrease of domestic wastes, the methods and projectsshould be operated on a large scale with a long life,which not only meets the need of city but also lowers
Recycle
Collect Categorize and
Reclaim
Reuse
Second Resources
Transferring
First Resources
Transferring
Non-polluted
treatment
Fig.1. Recycling mode of waste disposal
the operation cost under the scale-economic principle.The scale demand has been the crucial factor to de-cide the projects.
Thirdly, follow 3R principle. The waste disposalmethods and projects should succeed in followingthe 3R principles – Reduce, Reuse and Recycle. Fol-lowing the principle, we can optimize environmentalbenefit, economic benefit and social benefit.
3.3 The mode of the system establishment
When treating the waste, we will minimize the pro-duction of wastes, especially hazardous wastes, andif possible recycle materials and energy[8]. We shouldtreat wastes based on recycling in order to reachhigher level of reuse. We should applied non-pollu-tion technology to the waste that can’t be recycled torealize the recycling mode of waste disposal. Fig.1shows the recycling mode of waste disposal[9].
3.4 The procedure of the establishment of the system
In order to carry out above-mentioned three prin-ciples and to establish a perfect waste managementsystem, the following procedure should be takenseriously.
Firstly, categorize the waste. That step can helpto lower carrying and processing cost and raise therecycling ratio of waste. In order to achieve 3Rprinciples, it should be taken seriously. The domesticwastes should be divided into five categories fromthe experience of the developed country and realityof our country.
Left waste: it can’t be recycled and should be sentto landfill yard to bury or to burning center to burn.
Kitchen waste: it mainly comes from kitchen andcourtyard. It contains much organic compounds,which can be composted or used as the fertilizer andsoil ameliorant on sale.
Packaging waste: which is the package castoff ofthe commodities and foods sold by the supermarket,including useless glass, old cardboard and light pack-age material available for recycle, etc.
Large wastes and old and useless home electricalappliances: including old furniture and all kinds of
old and useless electronic appliances.Harmful waste: it cannot be treated by landfill and
burning, containing a lot of harmful components. Itmust be collected, transported alone and disposedinnocuously without polluting atmosphere, waterbody or doing other harm[10].
In order to popularize waste categorizing, somemeasures should be taken actively as follows:
Issue the manual of guidance to categorize thewastes as soon as possible. According to classifica-tion above-mentioned, we can subdivide them, listtheir concrete items and propose some suggestionsof guidance in order to follow the regulations.
Improve the auxiliary facilities. The categorizinggarbage bins should be set in the uptown, commu-nity or other public sites where the categorizing wastebags should also be distributed and the categorizingand reclaiming stations should be set up in order tocategorize and reclaim the waste conveniently.
Make more efforts to propagating. The variousmeasures should be taken which can help people torealize the significance of categorizing and reclaimingthe domestic wastes and to understand how to cat-egorize and reclaim them. By this way, the mass willunderstand more about it and comply with the regula-tions more voluntarily than ever[11].
Secondly, collect and transport wastes. In orderto accelerate the reclaiming of the waste, two systemscalled “sent” and “fetched” are used to categorizeand collect the various waste.
Left waste: it is dumped in the rubbish pail. It iscleared and the waste is transported away periodically.
Kitchen waste: it is dumped in the rubbish pail. Itis cleared and the waste is transported awayperiodically.
Packaging waste: The Dual Disposal Systemshould be set up. That is to say, the package-makershould pay the government the permission fee oncewhen selling a package. Everyone should pay theadditional price to be used to reclaim the packagewhen he/she buys something packed with it.
Large waste and old and useless home electricalappliances: they are reclaimed periodically in the com-munity or sent to reclaiming stations.
Harmful waste: it is dumped in the rubbish pail. it
Liu W. et al. / Ecological Economy (2006)2:161-169
is cleared and the waste is transported awayperiodically.
Thirdly, sort and process the wastes. The catego-rized waste should be sorted and processed by ad-vanced technologies. The processing methods formost kinds of waste are shown as following:
Waste paper: the waste paper is valuable afterbeing recycled. In the future waste paper should besorted by automatic product line instead of by handat present. Then they can be separated into someparts according to weight after being cut up in orderto improve the quality of the paper pulp.
Waste plastics package: most kinds of plasticsare recycled difficultly except PET, and most of themcannot sold easily after being processed, so the chemi-cal industry often denies recycling them. The author-ity should force them to recycle by rules. There aretwo methods to reclaim and recycle the waste plastics:the method of chemical process and the method ofphysical process.
Finally, reclaim and recycle the waste. After pro-cessing or transforming various domestic wastes, wecan reclaim, recycle and dispose them innocuously.All kinds of waste discussed can be finally processedin the ways as following:
Left waste: it is mainly sent to landfill yard or burn-
ing center.Kitchen waste: it is mainly composted or used as
the fertilizer and soil ameliorant on sale.Packaging waste: it is made into recycled prod-
ucts after being processed.Large waste and old and useless home electrical
appliances: it should enter the special reclaiming andrecycling system.
Harmful waste: it is mainly processed with envi-ronmentally sound technology.
All procedures processing domestic wastes havebeen shown by Fig.2.
4. The main measures of promoting the operation ofthe domestic wastes management system in China
New fuel Energy
reclaiming
Generating
electricity
Heating
Steam Hot water
Oil fuel
Solid fuel
Gas fuel
Glass waste residue
Iron
Non-iron
metal
Glass
Waste paper
Plastic
Original waste
Packages
Materials
reclaiming
Materials
Recycling
Construction
materials
Industrial
Materials
Solid
Waste
Transp-
orted
Cut up
Sorted
Transformed
Processed
Collected
Categorized
Recycled materials Purpose Recycled approach
Industrial
Materials
Fig.2. Procedure of processing domestic wastes [12]
Liu W. et al. / Ecological Economy (2006)2:161-169
Firstly, transform the management concepts andformulate the management goal by legislation. Ac-cording to the management experience from devel-oped countries, waste terminal processing is passive,only adopting measures to realize source reductionre-using and recycling is the key point[13]. The hierar-chy of waste management options is headed by sourcereduction, or waste minimization. This is the essentialprerequisite for any waste management strategy–lesswaste to deal with. Next in the hierarchy come a seriesof options: re-use, recycling, composting, waste toenergy, incineration without energy recovery andlandfill, in some order of preference[14]. Many devel-oped countries have improved the level of waste man-agement through legislation. The legislation has sev-eral common threads: it builds on the hierarchy ofsolid waste management and within this, it sets tar-gets for recovery and recycling of materials[15]. Forexample, waste management has been under legisla-tion in Japan since 1970 under the Waste manage-ment and Public Cleansing Law. The law was amendedin 1992. The law Promote the Utilization of Recy-clable Resources, the Recycling Law, which cameinto effect in October 1991. In a similar manner, Francehas developed legislation, in which establishes spe-cific recycling targets[16]. In our country’s domesticwastes management, we must transform the manage-ment concepts; take waste reduction as the essentialtarget. According to our national condition, formu-late the waste recycling rate by legislation, promotesthe waste management system changing from purelyreceiving, transporting, and processing to avoidingwaste creation re-using recycling, and hazard-freetreatment.
Secondly, construct two-way reclaiming systemfor package and promote waste classificationrecycling. The developed countries have generallyestablished the program of extend producer respon-sibility in the packaging profession, which requestsmanufacturer be responsible for their products entirelife cycle, and recycle product waste and the packag-ing material freely, and achieve the certain returns-ratio and the regeneration utilization ratio[17] A pri-mary function of EPR is the transfer of the financialand/or physical responsibility of waste management
from local government authorities and the general tax-payer to the producer. Environmental costs of treat-ment and disposal could then be incorporated intothe cost of the product. This creates the setting for amarket to emerge that truly reflects the environmentalimpacts of the product, and in which consumers couldmake their selection accordingly. There are many EPRprograms in operation today. The most widely publi-cized is the German Dual Disposal System, whichmakes producers and distributors of packaging re-sponsible for establishing and managing a system totake back the wastes associated with their products.Between 1991 and 1998, the percentage of consump-tion of packaging in Germany was reduced from 94.7kilograms to 82 kilograms per capita, i.e. 13.4% de-crease[7]. In China packaging waste grows rapidly,approximately accounting for above 10% of domesticwastes. In order to promote waste classificationrecycling, taking into account of the experience fromthe developed country, the system of our countryshould contain the products-maker, package-maker,trader and the company for reclaiming waste together.Majority voting should be used in the system. Thesystem should be a kind of intermediate organizationno profit-oriented and operated by competition mecha-nism under the market system. The government onlyprescribe the amounts of the waste which should beprocessed every year and regulate them with law.
The system should set up the countryside reclaim-ing networks including the rubbish pail, professionalreclaiming station in the community. Some waste-re-claiming companies co-operating with the system
m* m1 Amount of waste
Cost
0
MC
MC plus additional
MCR
R*
Fig.3. Determining the optimization charge ratio andamount of the waste disposed
Liu W. et al. / Ecological Economy (2006)2:161-169
under their business agreement can also serve thenetworks. It charges the citizens for their service tomeet the interests of each side among the system, atthe same time it need to clarify the responsibility andright of each side. The system should daily be fundedby the charge for license granted to the package-mak-ers or import companies besides the charge of thecitizens. The charge depends on types, weight, vol-ume or area respectively[18].
Thirdly, construct the rational charging systemfor disposing the waste.
Every citizen can benefit from the fine environ-ment and sustainable social development achievedby the waste management system that should pay forthe gains. It is crucial part to construct the rationalcharging system or price system for the service servedby the company disposing the waste, which can op-timize the social welfare or Pareto efficiency. For along time, the responsibility for disposing the wasteonly has been left to citizens. That caused seriouseconomic externality which means the charge paid donot match real cost of the service served, so the fundis not enough to reduce the original waste in thefamily. The environment is polluted and destroyedmore and more seriously. Fig. 2 illustrates how to de-termine the optimization charge ratio and amount ofthe waste disposed.
In Fig. 3, the amount of waste dumped is mea-sured from left to right in the horizontal axis, and theamount of waste recycled is measured from right toleft in the horizontal axis. It shows that the marginalprivate cost (MC) curve go up lower than the mar-ginal social cost although the former is gong up whenthe amount of waste dumped increase, at the sametime the marginal recycling cost (MRC) for the wastecurve is go down. The point of intersection betweenMSC and MRC present the Pareto optimization situa-tion where the rational charge is R*, and the amount ism*.It also show that the point of intersection betweenMC and MRC contains more waste dumped and lesswaste recycled, or m1 is more than m*, and stands forlower charge. That is the situation of economicexternality. The rational charge institution needs tobe constructed to achieve R*[19]. Four principles shouldbe taken seriously in construction to it: “reducing thewaste amount, who polluted paid, balance, equality”.
Meterage can match the principles above-mentioned, and can balance the interests of each sideamong the company, the family and government.Meterage refers to charging depending on the ex-penses that waste per unit cost during the disposalprocess. It has been adopted in Germany, Austria,Sweden, Switzerland and Japan.
Germany has already made experiment in Dresden
The lowest cost situation
Basic situation
Cost
Total cost
Totally saving 12
ten thousands Marks
Additional investment
Salary and time taken
Automation level of weight measuring tool
Basic situation
Additional investment 122 ten thousands Marks
Saving 134 ten thousands Marks atsalary and time taken
Fig.4. Economic analysis on meterage for waste
Liu W. et al. / Ecological Economy (2006)2:161-169
to evaluate the feasibility of the meterage for waste.The results are shown in Fig.4. When investment onequipment for measuring the weight increases, it willcost additional 122 ten thousands Marks, but save134 ten thousands Marks on salary and time takenwhich is substituted by the more equipment, so thenet gains is 12 ten thousands Marks at least. If takingaccount for the social benefit from reducing the wastedumped, it will save more. The results shows it isfeasible technologically and economically to adoptmeterage, because it can obviously reduce wastedumped[20].
According to the reality of our country, doublecharge system with lump toll and floating fee shouldbe adopted to realize meterage. It can be expressed bythe equation:
GS=GR+GVGS is total charge;GR is lump toll;GV is floating fee.The lump toll refers to the fixed cost which infra-
structure and equipment for reclaiming and recyclingspends in the waste management system, account-ing for 70% of total cost. In general, after construc-tion scheme, disposal technology and least capacitydesigned are decided, the lump toll can be determined.If the amounts reclaimed are less than the leastcapacity, the companies possibly take the risk of loss.So the lump toll should depend on the fixed cost andbe levied according to cost per capita or family. Thelump toll covers the infrastructure cost in order toensure the behalf of companies.
The variable part of the cost is taken on reclaim-ing and carrying the waste, which depends on theamounts of waste carried. More are carried, longertime they take, more they cost. It accounts for 30% ofthe total cost, which can be levied according to realmeterage, for example, according to the container ca-pacity or the weight of the waste.
Fourthly, transforming monopolized operation ofthe waste disposal industry and realizing itsindustrialization. The equipment for burning, pre-treat-ing mechanically and biologically and landfill thewaste is so expensive that only government can afford.So the industry is mainly monopolized. With the fleet
urbanization of our country, the rapid growth of thewaste amounts, monopolized operation has causedinefficiency on disposing and brought heavy burdenon government finance. From the developed coun-tries experience, the expenses which professional com-pany cost on disposing the waste is only the half ofwhich the government department cost. So we mustalter the management system. The industry monopo-lized by government should be broken. The govern-ment and enterprises, not only the organization butalso the function, should be separated in order toseparating operation and management. It is a generaltrend for waste disposal industry to be operated bymarket mechanism. According to the reform, the projectfor disposing the waste should be financed by differ-ent channels and be managed by the enterprises. Thegovernment’s main task is regulating the reasonablecharge and issuing preferential tax policy for enforce-ment and assuring the reasonable income of theenterprises.
There are three models for the industry’smanagement:
(1) The project is financed and built by thegovernment, then is relegated to the private companyfor operating.
(2) The project is financed by the government andprofessional companies together and then is man-aged by the latter. Both share the profits according tothe ownership proportions
(3) BOT solution. The project is financed, ownedand managed solely by enterprises, which own allprofits under the agreement made with government.At maturity by the agreement, the ownership is trans-ferred to government without charge.
Finally, we should strengthen R&D and applica-tion of the technology for disposing waste.
At present, process technology in our countrylags behind the developed country for 20-30 years.We lack graduate schools studying on waste disposaland lack the authoritative service and consultationagency. The government should encourage cross-regions, cross-industries, and cross-disciplines ofR&D, and particularly strengthen research and manu-facture on the crucial equipment, whole sets offacilities. It also encourages the application of high
Liu W. et al. / Ecological Economy (2006)2:161-169
technology, biological technology and informationtechnology in waste disposal. At the same time, weshould cooperate with the foreign company and ex-change in technology, introduce, digest and absorbadvanced technical equipment. Finally, we can form aset of technology system of disposing waste apply-ing to our country.
5. Conclusions
There is no useless waste but the resources putin wrong places. Through the establishment of do-mestic wastes management system, we can realizewaste classified recycling, circular utilization, envi-ronmentally sound in final processing, promote re-sources circular utilization and ecological environmentbalance, and realize economic and social sustainabledevelopment. The system’s main merits are as follows:
(1) It has realized waste management changingfrom terminal government to source controlling. Con-trolling waste growth is the key point to solve ourcountry’s domestic wastes. The establishment of ex-tend producer responsibility requests manufacturersto recycle their products’ waste and packaging mate-rial freely, which are advantageous in urging them toreduce waste on their initiative from the source. Themeterage pattern has the obvious effect in wastedecrement.
(2) It has realized waste classification recycling.Through waste classification and establishing thetwo-way reclaiming system, it has enhanced the recy-cling ratio.
(3) It has realized industrialization of waste dis-posal and created massive work posts, finally pro-moted economy growth.
(4) It has realized environmentally sound disposal,and made environment, economy and society sus-tainable development.
References
[1] Paul T, Williams. Waste treatment and disposal. JohnWiley and Sons; 2005: 138-140
[2] Zhongguancun International Environmental Industry
Promotion Center. Recycling economy global trendsand practices in china (1st Edition). Beijing: People’sPublishing House; 2005:185-205
[8] John Voorhees, Robert A Woellner, Anton G Camarota.International environment risk management. CRC Press;1997: 13-14
[9] Cui Tiening. Circular society and its programming theoryand method (1st Edition). Beijing: China Environmen-tal Science Press; 2005: 155-163
[10] Cai Lin. Waste classification recycling is the only wayto permanently cure waste pollution and develop recy-cling economy. Chinese Resources Comprehensive Uti-lization 2002; (2)
[11] Liu Zhijie. How does Germany classify and recyclewaste. Chinese Economic Weekly 2005; (35)
[12] Zhang Kun. The theory and practice of Recyclingeconomy (1st Edition). Beijing: China EnvironmentalScience Press; 2003: 134
[13] Liu Xingli. The procedures how to develop recyclingeconomy in developed countries. China City Economy2005; (5)
[14] P R White, M Franke, P Hindle. Integrated solid wastemanagement. Springer,1995: 8-10
[15] Charles R Rhyner. Waste Management and resourcerecovery. CRC Press; 1995: 17-20
[16] Oecd. Biotechnology for clean industrial products andprocesses organization for economic co-operation anddevelopment; 1998: 187-189
[17] National Development and Reform Committee Mac-roscopic Economical Research Institute. Study on de-velopmental strategy of China’s recycling economy (1stEdition). Beijing: Higher Education Press; 2005.p.178
[18] Dai Hongmin. German DSD system and recyclingeconomy. China Packaging 2002; (6)
[19] Robert S Pindyck, Daniel L Rubinfeld. Microeconomics.Renmin University of China Publishing House; 2000
[20] Zhang Yue. Management economics of municipal do-mestic wastes reduction. Chemical Industry Press; 2004
Liu W. et al. / Ecological Economy (2006)2:161-169
Dynamic trend analysis on relational effect of environmentalprotection industry in China
Liang Yanju, Yin Xiguo, Tan Zhixiong*, Ren YanyanChongqing University, Chongqing 400030, P. R. China
Received Nov.24, 2005; Accepted Jan.10, 2006
Abstract: EPI (environmental protection industry) and three industries constitute our national economic structure. ByGrey System Theory and correlation effect analytical method for the first time, this paper analyzes the relationship degreebetween environmental protection industry and the three causes including industries involved in China in both qualitativeand quantitative aspects. Both the innate rule and the realistic reasons of the relational degree are further analyzed byutilizing sustainable development theory, circulating economy theory, ecological equilibrium theory, externality theory,industrial structure theory, and ecology priority rules. From all the analysis, this paper reveals the relationship betweenEPI and three industries. In addition, it offers suggestions to the feasibility of adjusting the industrial structure anddeveloping the environmental protection industry in our country.Keywords: Grey system; Relationship degree; Environmental protection industry; Dynamic trend analysis
1. Introduction
Environmental protection industry (EPI) is anewly-emergent industry in our national economy,including technology exploitation, production, com-modity circulation, resources utilization, informationservice etc. with the main purpose of protecting andcontrol environmental pollution, improving theenvironment, and protecting natural resources[1]. Itsdevelopment is not only associated with the envi-ronmental protection and proper exploitation and uti-lization of raw materials, resources and energy inChina, but also has close relationships with the depthand width of our sustainable development practice,both politically and economically.
EPI is essentially different from three industriesand cannot be simply classified into any one of thethree industries, though it can’t survive or developif isolated from other industries. EPI is a comprehen-sive and emerging industry, which is trans-industry,trans-domain, trans-regional and permeates intoother economic departments. The intersections are
chiefly embodied in the following points: firstly,many environmental protection products and ser-vice are produced and offered by differentdepartments; secondly, many such products havemultiple functions themselves.
Because of complex relationship between EPI andthree industries, the information between them isvague and incomplete, which in turn leads to greyinformation in between. In other words, EPI and threeindustries constitute the overall framework of mate-rial production department in our national economytogether. Though EPI and three industries link eachother in various ways, the relationship is still some-what mysterious, like a “black box”. According tostatistics of Yearbook, we could not find out theexact proportion that three industries account for inthe producing process of the environmental protec-tion products. If the precise proportion isunavailable, the traditional method – input-outputanalysis, which is usually used to analyze the rela-tionship between EPI and three industries, becomesnull. In this case, we have to find another method tomeasure the relationship degree between EPI andthe three industries.
Grey System Theory, whose major use is to fig-
Liang Y. J. et al. / Ecological Economy (2006)2:170-182
ure out the relationship degree and developing trendbetween the factors in a system despite limited, evendiscontinuous data, can just meet such a demand.Using this theory, problems caused by incompletedata can be avoided when probing the inner rela-tionships between factors. The hypostasis of GreySystem Theory is that figuring out relatively exactconclusions according to incomplete factor infor-mation[2].
Grey System Theory put forward at the begin-ning of 1980s is a system theory on incomplete in-formation and an emerging method and techniqueof econometrics[3]. According to the System Theory,the nature can be regarded as a complex, consistingof many different systems, which can be sorted intothe white, the black and the grey. If the factors in thesystem are accurate, the relationship between themdefinite, the structure clear, and the principle of thesystem process known, the system is white; if thesystem information is utterly unknown or equivocal,it is black; if the system is something between thewhite and the black, then it is grey. To be specific, ingrey system, a part of the information is exact whilethe other is unknown or vague, and the relationshipbetween factors is indefinite[4].
Grey System Theory believes that the hugenessand complexity of a system is just the top of a plant;while the root of a plant is the grey character. Underthe seemingly disordered data and the complicatedphenomena, there is relation and law within thesystem. Factors have macro-function, and any ran-dom process is a grey vector within a certain scopeor a certain area in a certain time, i.e. the grey process.Indeed, the process to recognize a system is oneprocess from grey to white.
Recurring to the DPS processing system, thispaper explores the dynamic trend and situation aboutthe relationship degree between environmental pro-tection industry and the three industries includingindustries involved in accordance with different timesby applying Grey System Theory. And the longitu-dinal relationship is also revealed. This serves asthe basis of adjusting and balancing the industrialstructure; and consequently, ensuring healthy,tranquil, and sustainable development of our national
economy.
2. Processing and result of dynamic grey relation-ship calculation
The core calculation method of Grey SystemTheory is the relationship degree analysis method.The relationship degree refers to the measurementto the relationship between two systems (or factors).The basic principle of the grey relationship degreeanalysis method is comparing or describing quanti-tatively the status of the factors changing in thedevelopment over time, i.e. analyzing the geometryshape of time series curve, using the oncoming de-gree of the changed direction, and the rate to mea-sure the relationship between them[4]. If the changesof the two series are similar or almost consistent,they go through nearly simultaneous changes, andpossess similar trend, i.e. the relationship betweenthem is high; in contrast, the relationship degree islow. Essentially, such a relationship analysis is arelative sort analysis.
The main processes of the relationship degreeanalysis method are as follows: transforming the ini-tial data, calculating the relationship degreecoefficient, arranging the coefficients, and rankingthe matrix[5]. However, in practice, not all of the stepsare used at the same time; instead, to use what stepor steps depends on the questions being studied.
Defining m time series
)()(2
)(1
)2()2(2
)2(1
)1()1(2
)1(1
)()(2
)(1
21
mn
mm
n
n
tn
tt
xxxm
xxxxxxxxxt
L
LLLLL
L
L
L
, i.e.
{X1(0)(t)}, {X2
(0)(t)}, …, {Xm(0)(t)}
(t=1, 2, …, N )N is the length of the series, i.e. it represents the
number of the data; m is the number of the factors(or variables). Defining another time series, {X0
(0)
(t)} (t=1, 2, …, N ) and call it the parent series. Whilethe m time series mentioned above is the subsidiary
Liang Y. J. et al. / Ecological Economy (2006)2:170-182
series. Giving the relationship degree a basic calcu-lation model, the calculating process is as follows.2.1 Changing the initial data – averaging
At first, calculate the mean of each series; thenuse the mean to divide each initial datum; finally, newseries can be obtained, in which the data have nounits, and are comparable. The new series is {Xi (t)}.
2.2 calculating the relationship degree coefficient
Provided the time series {X0(0) (t)} (t=1, 2, …, N )
is the parent series, the formula is
max0
maxmin0 )(
)(∆+∆
∆+∆=ρk
ki
iL
Where:∆min is the minimum absolute value, whichis the dispersion between the parent series and thesubsidiary series at the same time of day. Since theparent series and the subsidiary series intersect,∆min 0;
∆max is the maximum one;p is the coefficient, and p∈ (0,1). Generally
speaking, p = 0.1 or 0.5.
2.3 Calculating the relationship degree r0i
Noir =
Where: r0i is the relationship degree of the par-ent series 0 and the subsidiary series i (i=1,2,…,m).
N is the length of the two series (or the numberof the data in the series).
2.4 Arranging the coefficients
That is to sort the m relationship coefficients bysize. Provided it as {X}, it reflects the influence thesubsidiary series to the parent series. If r0a >r0b, {Xa} is closer than {Xb } to the same parent series, viceversa.
2.5 Ranking the matrix
If there are n parent series, i.e. {Y1}, {Y2}, …, {Yn }
( 2≠n ) and m subsidiary series, i.e. {X1}, {X2}, …,{Xm }( 1≠m ), if the relationship degree of the sub-sidiary series to {Y1} is [r11, r12, …, r1m ], while to{Y2}is [r21, r22, …, r2m ], the relationship degree of thesubsidiary series to {Yn } is [rn1, rn2, …, rnm ],respectively.
Ranking rij (i=1, 2, …, n; j=1, 2, …, m) properly,we can get the relationship degree matrix. If the ith
list data in the matrix R meet the condition
⎥⎥⎥⎥⎥
⎦
⎤
⎢⎢⎢⎢⎢
⎣
⎡
>
⎥⎥⎥⎥⎥
⎦
⎤
⎢⎢⎢⎢⎢
⎣
⎡
mj
j
j
mi
i
i
r
r
r
r
rr
LL
2
1
2
1
( jandinji ≠∈∀ ,,...,2,1, ),
the parent series {Yi } is closer than other parentseries to the subsidiary series factors. Since the se-ries {Yi } is the closest one to the subsidiary series Xj
(j=1, 2, …, m), it is the optimal one.What is discussed here is fit for the most general
conditions, especially when there is only one parentseries. If such is the case, the relationship matrix is aline matrix, and there will be differentiation betweenoptimal or not. And this is exactly the condition un-der which this paper studies the system relationshipdegree.
2.5.1 Dynamic grey relationship between EPI andthree industries (see Table 1)
Processing the data of Table 1 by DPS, we couldget the result as in Table 2.
From Table 2, we can conclude that the primaryindustry and EPI go through the relationship degreeof falling and steadily rising; whereas both the sec-ondary and tertiary industry go through falling-ris-ing-falling-rising relationship degree with EPI.
2.5.2 Dynamic grey relationship between EPI andindustries involved in the primary industry (seeTable 3)
Processing the data of Table 3 by DPS, the resultis listed in Table 4.
Table 4 tells us that the relationship degree be-tween Farming and EPI is falling-rising; between for-
Table 1Product value of EPI and three industries (Unit: billion yuan)
Table 2Dynamic relationship matrix between EPI and three industries
year primary industry secondary industry tertiary industry EPI
1993 6,882.10 16,428.50 11,323.80 312.00
1995 11,993.00 28,173.30 18,094.20 403.00
1997 14,211.20 37,222.70 23,028.70 368.80
1998 14,552.40 38,619.30 25,173.50 572.50
1999 14,472.00 40,557.80 27,037.70 1,003.62
2000 14,628.20 44,935.30 29,904.60 1,080.00
2001 15,411.80 48,750.00 33,153.00 1,242.00
2002 16,117.30 53,540.70 35,132.60 2,200.00
primary industry secondary industry tertiary industry
Liang Y. J. et al. / Ecological Economy (2006)2:170-182
estry and EPI rising-falling-rising; between animalhusbandry and EPI falling-rising-falling-rising; be-tween fishery and EPI falling-rising.
2.5.3 Dynamic grey relationship between EPI andindustries involved in the secondary industry (seeTable 5)
Processing the data of Table 5 by DPS, the resultis listed in Table 6.
We can clearly get the idea from Table 6 that therelationship degree between industries involved inthe secondary industry and EPI all follows a N-shapelocus, namely, rising-falling-rising.
2.5.4 Dynamic grey relationship between EPI andindustries involved in the tertiary industry (seeTable 7)
Processing the data of Table 7 by DPS, the resultis listed in Table 8.
Table 8 reveals the relationship degree betweenEPI and a variety of industries in the tertiary industry.
We can summarize as follows: the relationship de-gree between EPI and Geological Prospecting andWater Conservancy is gradually and steadily rising;between EPI and Transport, Storage, Post and Tele-communication Services, Wholesale and Retail Tradeand Catering Services, Finance and Insurance, RealEstate, Government Agencies, Parties Agencies andSocial Organizations rising-falling-rising; betweenEPI and Social Service, Education, Culture and Arts,Radio, Film and Television, Scientific Research andPolytechnic Services falling-rising, whereas EPI andHealth Care, Sports and Social Welfare have the mostunsteady relationship which is falling-rising-falling-rising.
3. Analysis of dynamic grey relationship effect
3.1 General analysis
Through Table 2, we can conclude as follows.Compared longitudinally and dynamically, the rela-
Table 5The product value of EPI and industries involved in the secondary industry (Unit: billion yuan)
Table 6Dynamic relationship matrix between EPI and industries involved in the secondary industry
Liang Y. J. et al. / Ecological Economy (2006)2:170-182
tionship degree between the primary industry andEPI bears a rising trend, which means the EPI enjoysa better and better situation in this industry.However, the relationship degree between the othertwo industries and EPI goes through a wavy risingwhich indicates the instability, discontinuity, andunsustainablility between EPI and these twoindustries.
3.1.1 The strategic position of agriculture makesthe government attach greater importance on EPIin the primary industry
Food is the first necessity of the people. Agri-
culture is the foundation of China’s nationaleconomy and is the guarantee of our economicaldevelopment and national security. The appearanceof “three rural” problem (agriculture, country andfarmer) problem and of food security problem arousesattentions and heated discussions on the primaryindustry and puts agricultural environment problemson the work schedule as well. And the importanceswhich have been attached to agriculture and sup-ports in respects of technology, policy and capitalhave been granted to it by the government and thesociety. All those facilitate the development of EPIin the primary industry.
Table 7The product value of EPI and industries involved in the tertiary industry (Unit: billion yuan)
Liang Y. J. et al. / Ecological Economy (2006)2:170-182
There is still another reason for the EPI develop-ment in the primary industry: opportunities and chal-lenges after China’s entrance to WTO. Green tradehas become increasingly popular in internationaltrade. The new trade protection and strict restric-tions on standard of agricultural products’ importsand exports are also good reasons why such greatimportance is attached to environmental problemsin agriculture[6].
3.1.2 The properties of the secondary and tertiaryindustry together with the characteristics of tech-nology development result in the unstable relation-ship degree between them and EPI
(1) The universality and imbalance of industriesincluded in the secondary and tertiary industry isthe major reason for the unstable relationship de-gree between them and EPI
The secondary industry is the core of our na-tional economy. The tertiary industry is the mostwidely-included and the most active one in nationaleconomy. They are the main polluting sources ofthe environment, but they are also the major con-sumers and raw material suppliers of environmentalprotection products[7]. Thus, even development ofindustries included in the secondary and tertiary hasgreat influence on EPI.
(2) The recessive and lagging development of
Table 8The dynamic relationship matrix between EPI and industries involved in the tertiary industry
agencies and social organizations G(1,10)=0.44713 G(1,10)=0.49015 G(1,10)=0.48000 G(1,10)=0.42098 G(1,10)=0.51896
Liang Y. J. et al. / Ecological Economy (2006)2:170-182
environmental protection technology are importantreasons for the undulation of relationship degreebetween it and the two industries
The recessive of environmental protection tech-nology decides its indirect accelerating effect on EPIwhile the three industries become the media andbridge between technology and EPI.
The exploitation, research and popularization ofenvironmental protection technology all have theproperty of lagging behind environmental problems.On the one hand, environmental protection technol-ogy is investigated only after the appearance of en-vironmental problems with the purpose of findingout solutions. On the other hand, there exist timeintervals from environmental protection technol-ogy’s application and functioning. Hence, the lag-ging development of environmental protection tech-nology is an important reason for the undulation ofrelationship degree between the two industries andEPI.
3.2 Dynamic relationship analysis between EPI andindustries in the primary industry
From Table 4, we know that the relationship de-gree between Farming and EPI is falling-rising; be-tween Forestry and EPI rising-falling-rising; betweenAnimal Husbandry and EPI falling-rising-falling-rising; between Fishery and EPI falling-rising.
3.2.1 Dynamic relationship analysis between EPIand farming
The relationship degree between Farming andEPI is consistent with that between the primary in-dustry as a whole and EPI. In fact, the favorablesituation between the primary industry and EPI isrightly resulted from the EPI development in Farming.
3.2.2 Dynamic relationship analysis between EPIand forestry
Viewing longitudinally, we can safely get it thatthere has always been an optimistic relationshipdegree between Forestry and EPI. Though there doexist some undulations, the overall trend is on therise. That mainly lies in the policy of returning the
grain plots to forestry and to husbandry.Forest is the principal part and the core of the
terrestrial environment and the important balancerof it. It has the property and function of environ-mental protecting itself and its development is di-rectly connected with the environmental situation.
3.2.3 Dynamic relationship analysis between EPIand animal husbandry
The relationship degree between husbandry andEPI is very unstable which reveals it has no sustain-able acceleration to EPI. The reasons are as follows:Husbandry may severely pollute the environment.With the increasing demand of meat and milk, thescale of husbandry is on the rise. So is the excretion.According to an incomplete statistics, daily excre-tion in some cities even exceeds all other waste. Sofar, commercial husbandry in pursuit of profit hasbeen severely polluting the atmosphere, soil andwater.
Due to the insufficient investment in curing hus-bandry pollution, its acceleration to EPI is unstableand discontinuous. Developing the EPI, we musttake into consideration the innoxious processing andrecycling of husbandry waste which is both impor-tant and difficult in further developing EPI inhusbandry.
3.2.4 Dynamic relationship analysis between EPIand fishery
The relationship degree between EPI and Fish-ery goes through a falling-rising process. And fromTable 4, we know the degree is not high on the whole,but recently, it begins to be on the rise, which mightattribute to the government’s greater investment incuring Fishery pollution and policies on sustainabledevelopment age-long availability of sea resources.
3.3 Dynamic relationship analysis between EPI andindustries in the secondary industry
From Table 6, we know that the relationship de-gree between industries involved in the secondaryindustry and EPI all follows N-shape locus, namely,rising-falling-rising. However, there are some slight
Liang Y. J. et al. / Ecological Economy (2006)2:170-182
differences in different industries. Manufacturingindustry, Production and Supply of Power, Gas andWater have the rising relationship degree on thewhole; while Mining and Quarrying bears a low rela-tionship degree with EPI.
3.3.1 Dynamic relationship analysis between EPIand manufacturing industry
The properties of manufacturing industry deter-mine the rising relationship degree between it andEPI. “Report on How to Improve and Develop China’sManufacturing Industry in the New Century” pointsout, manufacturing industry, which is the core ofthe secondary industry, is the basis for nationaleconomy’s sustainable development and is the en-gine and motive for industrialization andmodernization.
Now, China is in the middle of industrialization.On the one hand, manufacturing industry, as thecore of the secondary industry, is the backbone ofthe national economy. It creates great wealth andadvance civilization, but also consumes a large por-tion of the limited resources and has become a majorsource of environmental pollution[8]. On the otherhand, trade barriers in foreign countries are mainlyabout environmental protection. With our entranceto WTO, we must adapt to accept these barriers.Under such circumstances, green manufacturing isimperative. And the basic approach to do so is tooptimize the circulation of manufacture resources,maximizing their utilization ratio, minimizing resourcewaste, and recycling renewable materials (includingwaste processing) [9]. All those are necessary in real-izing resources sustainable development strategy.
3.3.2 Dynamic relationship analysis between EPIand production and supply of power, gas and wa-ter
The high efficient usage and recycling utiliza-tion set theoretical foundations for Production andSupply of Power, Gas and Water. Production andSupply of Power, Gas and Water are fundamentalindustries which provide energy to all other sorts ofindustries. To shake off resources limitations, it isnot only a direct and effective way, but also the
trend and basic rule for resources sustainable de-velopment to promote the resources utilization ratioand to realize the recycling of resources[10]. The tem-porary decline of relationship degree between themand EPI is incidental and cannot represent or influ-ence the overall trend of their development.
3.3.3 Dynamic relationship analysis between EPIand construction
The exploitation and expansion of the marketdemand of architectural environmental protectionproducts is the major reason why the relationshipdegree between EPI and Construction is on the rise.
The essential characteristic of market economyis to maximize the economic efficiency through com-modity and service exchange taking market as thebasis for resources allocation. Greater demand ofconstruction environmental protection products inrecent years promotes the relationship degree be-tween it and EPI.
3.3.4 Dynamic relationship analysis between EPIand mining and quarrying
Mineral resources are material bases for both thehuman beings and the society and important ele-ments in productivity structure. They are also chiefconditions of a country’s rapid economical devel-opment and symbols of a country’s economicstrength. Mining and Quarrying is directly linked tonature and environment and its subjects are not re-newable resources like coal, metallic mineral ores,oil, natural gas. Therefore, Mining and Quarryinghas strong ruinous impact on natural landscape,water and soil conservation, forests, and vegetation,etc.[11] In addition, ore mining and washing is tradi-tional industry. Restricted by traditional technology,waste water and residue cannot be effectively re-cycled and put into use again. This not only resultsin resources wastage, but also poses great threatsto environment, which deviates from sustainabledevelopment principles of high efficiency resourcesutilization. All in all, properties of Mining and Quar-rying and bottleneck of its traditional technologylead to the low relationship degree between it andEPI.
Liang Y. J. et al. / Ecological Economy (2006)2:170-182
3.4 Dynamic relationship analysis between EPI andindustries in the tertiary industry
Table 8 reveals that with the development of EPI,the relationship degree between EPI and geologicalprospecting and water conservancy is steadilyrising. They have a strong internal relationship. Re-lationship degrees between EPI and transport,storage, post and telecommunication services,wholesale and retail trade and catering services, fi-nance and insurance, real estate, governmentagencies, parties agencies and social organizationsall show an N-shape, namely, rising-falling-rising.Specifically, relationship degrees between EPI andtransport, storage, post and telecommunicationservices, government agencies, parties agencies andsocial organizations are the most unstable, some-times high and sometimes low; while in wholesaleand retail trade and catering services, finance andinsurance, real estate, the relationship degree is onthe rise as a whole. Relationship degrees betweenEPI and social service, education, culture and arts,radio, film and television, scientific research andpolytechnic services show a V-shape – falling-rising,which indicates that EPI in these industries is be-coming better and better. Finally, EPI and health care,sports and social welfare have the W-shape rela-tionship degree which is quite unstable, which en-ables us to say there is no fundamental, direct orinevitable relationship between EPI and theseindustries.
3.4.1 Dynamic relationship analysis between EPIand geological prospecting and water conservancy
Viewing longitudinally and dynamically, Geologi-cal prospecting and water conservancy are strongpropellant to EPI. With the advent of knowledgeeconomy, information and technology play a moreand more important role in social-economic life andthe national economy. In modern times, natural re-sources and energy are exhausting and sustainabledevelopment is strongly advocated [12]. Functionsof Geological Prospecting and Water Conservancyon new resources exploitation and effective re-sources utilization are becoming more and more
prominent.
3.4.2 Dynamic relationship analysis between EPIand transport, storage, post and telecommunica-tion services, government agencies, parties agen-cies and social organizations
(1) The fundamental position of Transport,Storage, Post and Telecommunication Services andthe fluctuations of their development greatly affectthe relationship degree of EPI and them
Transportation and storage are key points in lo-gistics mix. They, together with post andtelecommunication, are all basic industries, whichbear strong external economic characteristics. Thestrategic importance of basic industries and infra-structures lies in that they are material source andmaterial base of the whole national economy. Theyprovide other industries with basic conditions andnecessities for reproduction. What’s more, chargesof the basic industries are part of the productionand operating costs of other industries. So it can setoff chain reactions in the operation of otherindustries. Properties of Transport, Storage, Post andTelecommunication Services determine their mate-rial base positions for EPI. Their fluctuations candirectly influence the development curve of EPI.
(2) The instability of Government’s regulationsand interferences towards EPI leads to great fallsand rises of the relationship degree between them
Nowadays, government still has determiningpower in EPI. Effect of Government Agencies, Par-ties Agencies and Social Organizations on EPI rep-resents in two aspects: administrative interferenceand capital support[13].
3.4.3 Dynamic relationship analysis between EPIand wholesale and retail trade and cateringservices, finance and insurance and real estate
Between EPI and Wholesale and Retail Tradeand Catering Services, Finance and Insurance, RealEstate, the relationship degree is on the rise as awhole. This is because of the regulation of marketeconomy.
(1) EPI and wholesale and retail trade and cater-ing services
Liang Y. J. et al. / Ecological Economy (2006)2:170-182
The most fundamental function of marketeconomy is to regulate supply and demand, so as toachieve balance between them [14]. Wholesale andRetail Trade and Catering Services are closely con-nected with our daily life. They are playing a moreand more important role in our daily life as a result ofdevelopment of productivity and promotion of qual-ity of people’s physical life. People’s demand onthem has changed form quantity to quality.
(2) EPI and finance and insuranceThe main bodies of finance and insurance are
banks, stockjobber, trust companies and insurancecompanies. They, especially banks, are major capi-tal suppliers for economic construction and lubri-cants for national economy operating. They are ofvital importance to all industries. EPI is of noexception. Capital needed for EPI construction, op-erating and maintenance are all from these indus-tries and companies, directly and indirectly[15]. Inthis sense, finance and insurance embody a deci-sive importance to EPI. With the establishment andpopularization of environmental protectionawareness, government and main bodies of marketeconomy increase their investment in environmen-tal protection year by year. They invest as muchcapital as their finance can afford in purpose of ob-taining greater economic and social benefits. All theabove allow a rising relationship degree betweenEPI and finance and insurance.
(3) EPI and real estateIn market economy, rules of supply and demand
require due attention be paid to ecological efficiencyof real estate exploitation. Real Estate’s acceleratingeffect on EPI lies, to a large extent, in this demand ofthe market and consumers.
The State Council issued the NO. 18 documents“State Council’s Notice about Promoting Insistentand Healthy Development of Real Estate Market”which, for the first time, claims that Real Estate hasbecome pillar industry of the national economy. Withthe changing of consumption conception and pro-moting of consumption level, people are demandingbetter residential conditions. Besides the construc-tion quality of the housing itself, green area, air con-ditions and many other soft requirements have also
been attached great importance. As a result, RealEstate businesses also take environment protectionand ecological benefits more and more seriously.
3.4.4 Dynamic relationship analysis between EPIand social service, education, culture and arts,radio, film and television, scientific research andpolytechnic services
Material decides consciousness and conscious-ness has motile reaction on material. Education, Cul-ture and Arts, Radio, Film and Television are to meetpeople’s spiritual need. Though they have little di-rect connections with material producing industriesand are rarely associated with the material aspect ofenvironmental protection, they do exert a significanteffect on advocating and publicizing environmentalprotection and changing people’s obsolete ideas.
Since environmental pollution exacerbates andenergy crisis emerges, environmental problems areattracting greater attention. Consequently, sustain-able development and the voice of “creating an en-vironment suitable for living” has been more andmore popular and accepted by the public[16]. Greaterattention to environmental problems also boosts theadvance of science and technology as well as SocialService. Science and technology is one of the mostefficient ways to resolve the contradiction betweenlimited resources and energy and the expandingdemand. The universality and basic functions ofpublic service can carry the idea of ecology priorityto all respects of social life. Sustainable develop-ment of ecology tolerates no ignorance of environ-mental protection and ecological balance[17].
4. Conclusions and suggestions
4.1 Conclusions
By analyzing the relationship domino effect be-tween EPI and the three industries, the followingconclusions can be drawn.
On the whole, the development trend of EPI isconsistent to the laws of nature, rules of the society,and the needs of our national economic. However,environmental protection and pollution treatment are
Liang Y. J. et al. / Ecological Economy (2006)2:170-182
digressive from or lag behind the tempo and level ofthe development of the Secondary Industry.
Advancing towards the tertiary industry is thecertain trend of EPI. Thus, it is necessary and crucialto deepen and to widen the development of envi-ronmental protection in tertiary industry. In fact,development in the tertiary industry is the key-pointand cut-in point for the development and flying-offof EPI.
The EPI investment is far from enough in ourcountry, and the financing problem has become thebottleneck/choke point to the development of EPI.
4.2 Suggestions
In view of the dynamic trend analysis result onthe relationship degrees between EPI and variousindustries involved in the three causes, followingsuggestions are given.
4.2.1 Change the role of the government; strengthenits policy guidance and support to EPI
EPI is a policy cultivated industry. Its most no-table property is that the social benefits and environ-mental benefits are more significant than the short-lasted economic profit. So it is more a public goodand is the base of sustainable development of thesociety. EPI is also the result of marketing malfunction,which determines that government should interfere,guide and regulate the fathering of environmentalpollution and the public’s paying for it[18].
However, EPI is still in its infancy in China. Be-cause of the increasingly serious environmentalproblems, the government has to endure higher pres-sure which may force it to make alternations in itspolicy. Under such circumstances, it is highly nec-essary to prop up EPI.
4.2.2 Set up multi-element and socialized investingand financing mechanism so as to propel the estab-lishment of environmental protection capital andinvestment market in China
Properties of EPI determine large preceding in-vestment and long period before disinvestment inenvironmental projects. Thus, depending on only
the finance of the country to cure environmentalpollution by far cannot meet the need of EPIdevelopment. It is the natural trend and the onlyroad to develop EPI that present investing and fi-nancing mechanism formed under planned economysystem should be reformed and new mechanism beestablished. Then, diverse investing modes and ser-vices can be provided for investors on EPI. Thiscan, in turn, accelerate transformation of EPI towardsa more industrialized, specialized, marketingorientated, and self-governing industry and thenrealize a qualitative leap[19].
4.2.3 Develop EPI technologyScience and technology are potential produc-
tive forces. To develop EPI technology is to inten-sify exploitation and manufacture of pivotal tech-nology in key field in EPI, to promote efficiency ofenvironmental protection equipments, to enhancecreativity of both scientific research institutions andenterprises, to expedite spread and application ofadvanced technology, and to replace older genera-tions of environmental protection products[20].Through all that, EPI in China can be transformedform a protection and cure orientated industry to amore active and self-governing industry. In addition,technology development can also reflect thegovernment’s role of guidance and propellant in EPI.
4.2.4 Give priority to develop certain fields in EPIHere two points should be pointed out in doing
so. One is to readjust industrial structure, specifically,to favor those industries which have a high relation-ship degree with EPI but less efficient or less con-scious in pollution control, for instance, manufac-turing industry, finance and insurance.
The other is, by associating properties of EPIwith current conditions of our economy, society,environment, and EPI development, to preferentiallyinvest in certain domains, like cleaning productsproduction, dust-free producing technology, energyconservation techniques, substitute exploitation,and so on.
4.2.5 Promote consultation and information ser-
Liang Y. J. et al. / Ecological Economy (2006)2:170-182
References
[1] Li Keguo, Wei Guoyin, Zhang Baoan. Environmenteconomics. Chinese Environmental Science PublishingCompany; 2003
[2] Luo Yuoxin, Zhang Longting, Li Min. Grey system theoryand the practice in mechanical engineering. NationalDefense Science and Technology University PublishingCompany; 2001
[3] Wang Jianjun. Study on region economics by grey sys-tem theory. Huadong Road 1998; 5
[4] Wang Xuemeng, Zhang Jizhong, Wang Rong. Grey sys-tem analysis and calculation process. Hua Zhong Uni-versity of Science and Technology Press; 2001
[13] Gao Guangkuo. Argument on sustainable developmentenvironment protection industry. China Population Re-sources and Environment 2002; 1
[14] Zhang Xuewen. Estimate and regulation on region sus-tainable development. The People Press of HeiLongjiang; 2003
[15] Lighart JE, Vander Ploeg F. Environmental policy, taxincidence, and the cost of public funds. Environmentaland Resource Economics 1999; 13(2)
[16] Liu Sihua. Ecological innovation on economic sustain-able development. China environmental science pub-lishing company; 2002
[17] Frankhauser S, Tol RSJ. Figuring the costs of climatechange: a reply. Environment and Planning A 1999; 31(3)
[18] Liu Xue. Environmental economics theory and practice.Economic Science Press; Dec. 2001
[19] Allen V, Kneese Robert U, Ayres Ralph C. A materialsbalance approach. Economics and Environment. U.S.A.: Resources for the Future; 1970
[20] Braten J, Golombek R. OPEC’s response to interna-tional climate agreements. Environmental and ResourceEconomics 1998; 12(4)
[21] Munda G. Environmental economics, ecological eco-nomics and the concept of sustainable development.Environmental Values 1997; 2
vice on environment protection; attach importanceto service in EPI
Service in EPI is a quite important part. Its levelof development represents level of EPI developmentas a whole[21]. Service in EPI is a sort of brain service.To promote it is to provide government and otherindustries and enterprises with consultation and in-formation on environment protection, following theprinciples of independence, reasonability and equal-ity and aiming at further development of EPI.
Note: The data in Table 1- Table 8 are cited fromChina Statistical Yearbook (1993-2003) and ChinaEnvironment Statistical Gazette (1993-2003)
Liang Y. J. et al. / Ecological Economy (2006)2:170-182
Ecological Economy (2006)2:183-189
Analysis
* Corresponding author. E-mail address: [email protected]: Ding Jianli (1974-), male, associate professor, post-doctoral research fellowship, specialized in remote sensingand 3s technology in arid area.
Vegetation actualities and feasibility of restoration for theperiphery of oasis in extreme arid region: taking Qira
County of Xinjiang as an exampleDing Jianli1, 2 *, Zhang Ying3
1. Postdoctoral Station of Theoretical Economics, Xinjiang University, Urumqi 830046, P. R. China2. College of Resources and Environment Science, Xinjiang University, Urumqi 830046, P. R. China3. Marketing Department, Xinjiang Institute of Finance & Economics, Urumqi 830012, P. R. China
Received Nov.28, 2005; Accepted Jan.16, 2006
Abstract: The periphery of oasis plays an important role in mutual transformation between desert and oasis. Vegetationis an important part in the ecosystem and it is an important index indicating certain landscape. Based on several timesfield investigation, this paper attaches importance to the feasible measures for vegetation restoration according to thecurrent condition of study area – Qira County of Xinjiang Uygur Autonomous Region. In order to improve the localecological environment, people lived in Qira County should work hard to protect their homeland and reduce the degreeof sandstorm. More protection forest should be established along with other ecological techniques. Results derived fromthis study contribute largely to the ecological environmental protection of oasis.Keywords: Periphery of oasis; Desertification; Ecological environmental protection
1. Introduction
Oasis, as a unique ecological unit of arid and semi-arid region, is the living place of the people in aridarea. It is one of the components in arid desert, that is,it is involved in the desert but different from desert,and they can be transformed mutually under certainconditions. In the oasis-desert ecosystem, the pe-riphery of oasis is the most outstanding area whosetransformation is extremely severe and frequent [1-3].The periphery, a transitional system, is the convertedplace for the two systems of oasis and desert. It is astable system derived from the natural succession ofan ecosystem under climatic condition. And it is alsovegetation gradient phenomenon that comes from en-vironmental gradient dominated by the factor of wa-ter [4]. The defining of transitional zone/belt is appliedby the commonly-used definition ecotone of ecology,that is to say, the oasis-desert transitional zone is thepart of desert near oasis destroyed by human being.The belt is developed on the basis of a nonlinear
ecotone of stable and semi-stable sand or soil withless floristics, simple structure, coverage ratio ofabout 5-40%, and underground water level of about2m-7m [5-7]. The shape is round or horseshoed, withaverage width about 3km-10km. The ecological envi-ronment in oasis fringe, more unstable than the inte-rior of oasis, is more easily damaged and difficult torecover. If it is destroyed during exploration, it hasthe potential trend to evolve into desert, which willinfluence the stable basis of oasis. The dynamic fea-ture of ecological environment in this zone is domi-nated by two factors of resources utilization and wa-ter condition. When the two factors are regulatedreasonably, this zone is evolved into oasis to preventdesert wind. Otherwise, it is evolved into desert toaccelerate the source of sand [4]. Vegetation is theimportant component in the land ecosystem, and thecentre of the matter circulation and energy flow. Inthe course of matter circulation and energy flow ofvegetation with environment, vegetation has greatimpact on environment factors like water, soil, gasand creature. The breakage of vegetation will havecertain negative impact on environment, even greatdisaster of environmental change will happen along
Ding J. L., Zhang Y. / Ecological Economy (2006)2:183-189
with the expansion of vegetation breakage. The re-search shows that vegetation restoration plays animportant role in the hydrological course. The inter-ception rate of the rainfall by the crown of vegeta-tions like trees and plantations is 11.4%-34.3%, withvariance of 6.68%-55.05%[8]. Generally, the influx rateof soil under forest vegetation is higher than that ofother vegetation types. The influx rate of steady for-est soil is about 8.0cm/h[9]. Vegetation has good sig-nificance for reserving water source [10]. The impact ofvegetation on soil environment can be divided intoseveral aspects like soil water, soil nutrient,microorganism, etc. Of the impact of vegetation onsoil water, the phenomenon so-called “soil dry crust”of loess plateau in arid region has been attracted at-tention at first [11-13]. It shows that biodiversity of soilmicroorganism and productivity and diversity of veg-etation community have positive correlation, and itwill increase along with the years of community ex-isted [14]. In China, there are some researches onbiodiversity change of vegetation restoration whichoffers good basis to vegetation restoration in the lat-est years [15-19]. According to the research of GuanJunwei, when the coverage of vegetation approachesabove 70%, it can be used to prevent plane erosion inspite of actual slope or vegetation constitutes. Theresearch by Xiang Shiqing also shows that the landwith shrub coverage larger than 60 % will protect soilfrom erosion [20].
Among these ecological problems, vegetation isan important part and an indicator for the whole habitat.Therefore, to investigate the present state of vegeta-tion habitat and to find out the ways of restorationhave great significance to explore the ecological char-acter of the periphery and to preserve oasis in thisarea [1].
2. The present state of vegetation in the periphery ofoasis in Qira
2.1 The survey of research area [21]
Qira County is located in the south of XinjiangUygur Autonomous Region, north of KunlunMountain, south of Taklamakan Desert, east longi-
tude 80°03'- 82°10', north latitude 35°17'-39°30'. Thehighest altitude is 6,810m and the lowest is 1,380m.The climate is warm temperate zone desert climatewith abundant heat and light, annual average tem-perature of 11.92 degree centigrade, accumulated tem-perature of 4,340degree centigrade, non-frost periodof 200 days, precipitation of 34mm-37mm, annualaverage evaporation of 2,600mm. The soil is mainlywind-sanded soil and brown desert soil; the vegeta-tion cover is only 10%-30%, the typical oasis-desertecotone. At present, people attach much importanceto the degree of desertification and its trend in thisarea. The desertification control, the economy, andsocial sustainable development, the utilization andexploration of land are also within the concern.
The precipitation in Taklamakan region is short,difficult to maintain the growth of surface vegetation,which makes a large part of ground bared and helpsthe quicksand move southwards. This progress isrepresented in the character of the sand dunes.
The field survey finds that the quicksand pushesdeeply into the south from the north when the groundsurface has no obstacle because of lack of protectionof vegetation. When it meets scattered shrubs, thepower of moving sand will be reduced, sand deposit-ing around the obstacles. After the sand covering upand burying the vegetation, it keeps on movingforward. Only Tamarisk can survive against the accu-mulated sand and then grows to tamarisk-dune toblock the quicksand. The large dune groups spreadover the fringe of Taklamakan Desert is commonlycaused by tamarisk-dune. When lacking in necessaryprotection of vegetation, the sand flow will movesouthwards. The ground surface covered by the sand,as a result, many kinds of vegetation are difficult tosettle and even much harder to control the mobilesand.
In the early 1980s, some protection forests werebuilt to hold back the mobile sand going on movingsouth, made much progress. The threat by sand at-tacking was reduced, in a relatively static state. Butthe state in the periphery of oasis hasn’t beenimproved. The disappearance of the vegetation in theperiphery makes oasis directly exposed to the mobilesand. The protection forests are only a temporary
Ding J. L., Zhang Y. / Ecological Economy (2006)2:183-189
partition. It seemed that the environment of the innerand outer of oasis is quite different. But when lackingthe outer vegetation, affected by the two systems,the relatively stable oasis-effect from the protectionarea of the periphery will be far away from the protec-tion forests and move inside, ultimately weaken therestorable capacity of the oasis. The stability of oasisis temporary. In order to develop the present oasis,vegetation zone in the periphery of oasis should beset up to slow down the sand moving southward soas to avoid the threaten of the mobile sand in essence.
2.2 The present state of vegetation of the study area
The vegetation types in Qira Oasis and oasis-desert ecotone can be divided into 19 plant communi-ties and 6 vegetation types: forest vegetation, shrubvegetation, meadow vegetation, psammophytevegetation, halophyte vegetation, and aquatic-swampvegetation.
Populeta euphratica, the precious resources indesert, is the unique wild arbor community in QiraCounty. The survival Populeta euphratica forest inthe recovering stage is only 4,722.8ha. It grows onthe surface of the ancient river by the oasis fringeunder elevation of 1,400m, and on the lower placewith underground water level of 1-4m, the high placeterra of 4-6m. Decayed Populeta euphratica is grownin the high terra by the river where underground wa-ter level is below 8m and near the dry riverbed. Itspreads over 8 places on the fringe of oasis, formingthree communities.
(1) Populus euphratica pure communityPopulus euphratica, spread over the alluvial fan
area on the south of Hongqi Reservoir, has been radi-cally destroyed. At present, there is 980ha in acreagefor the water source is abundant and it can be en-larged easily. The average height is 8m with the high-est of 13m.
(2) Populus euphratica - Tamarix ramosissimacomunity
Located on the two sides of Qira River in the north-
west of the Qira Oasis, the young Populus acreage isabout 250ha. The water condition is bad except for asmall amount of spring flood. Some Tamarixramosissima there has been felled with stumpovergrowing, which forms a wonderful landscape. Theheight of Populus is 5-8m with the highest of 12m,which is the first class of the community with cover-age of 30%. The height of Tamarix is 1.2m, cove de-gree 5%. The whole coverage of the community is35%.
(3) Populus euphratica- P.euphratica-Salsulacollna community
It is located at N37°05', E81°04'. The coverage ofthe left Populus forest in the river terra 10km north-west of Damu gouge is 35%, the average height 6m,the highest 10m. The associated species isZygophyllum fabagum L. Another distribution regionis at N37°06', E80°57'. The erosion terra 15km north-west of Gulahema is damaged severely. The wholecoverage is 58%, the average height 2.2m, the highest4.5m, associated with Salsula ruthenica Iljin.
2.2.2 Shrub vegetation type: T. ramosissima forma-tion
T. ramosissima formation can be divided into fourcommunities.
(1) Tamarix ranosissima communityIt is located in the region between north of Qira
alluvial fan and mobile sand south of Taklamakan. Itcommonly spreads over the flood plain and delta, riverterra and mobile sand area. The community is mainlydistributed beyond reed area with coverage is 20-25%,average height of 1.2m, the highest 2.7m, 17 to 67plants per hectare.
The coverage in the Gulahema Conservative Areais 50-60%, pants growing luxuriantly with large co-rona range. The mobile sand is stabilized to form sandhills with average height of 4-8m, and less herbageassociated. Because of chopping for firewood, a fewpart of it survived. The region between 16km northand 20km northeast of oasis is extremely barren, someplaces only having mobile sand.
It is distributed in the south of the first community.
Ding J. L., Zhang Y. / Ecological Economy (2006)2:183-189
Some places are in the restoring stage because ofprotection. There are little sand packs under Tamarix,Phragmites growing out of order. The whole cover-age is 15%; there are 33 plants per hectare.
(3) T. ramosissimas-Ph. australis -Karelina caspicacommunity
It is located between swamp and semi-stable sandhill; it forms a unique community among the Karelineon river terra. Ph. australis distributed randomly andTamarix hill, from ecological point of view, is a suc-cession stage of community. When the environmentis good, community of Ph.australis and Kareline ispredominant; when the environment getting bad, thecommunity of Tamarix is predominant.
(4) Tamarix ramosissima – Phragmites australis –Alhogi sparisifolia community
This community varies from underground watercondition, heterogeneity of environmental conditionand micro- landforms. The community has differentdistributed shapes. The underground water level islow to 5m below; horizontal root is developed well;but the extension and depth have no rules; the wholecoverage is 16%; there are 42 plants per hectare.
For.Phragmites australis formation has the follow-ing communities:
(1) Phragmites australis communityIt is located on the two sides of the ancient river
and fountain overflowing zone, or the flat place whereunderground water level is high. It can be often seennear the reservoir and some lakes and swamps. Thesoil is salt-sanded meadow soil. The community be-comes the main pasture near the oasis with high eco-nomic value. In this community, the underground wa-ter level is 1-4m; the average height is 1.2-1.5m; thecoverage is 45-65%. Inside the oasis the protectionland comes to 3-6.2m, which is used for constructionmaterial or feedstuff.
It is located at zone far from the bank of river terra,lake and reservoir. The first hierarchy is Tamarix whichis big but sparse, 1.5-3m in height; the second hierar-
chy is Phragmites below 1.5m, with associated plantsof Karelina caspica, Lycium ruthenicum and Sophoraalopecroides.
(3) Ph.australis - Phragmites australis - Karelinacaspica community
It is mainly distributed in the sand on the fringe offarmland. The associated plants are Echinops gmelliniTurcz and Convolvulus arvensis L., which is the firstbelt to conquer desertification.
2.2.4 Psammophyte typeThis type can be divided into two formations:(1) For.Tamarix laxa Willd communityIt is mainly located between the mobile and stable
sand, river floodplain, the sand land on erosion terrain Qira County. The coverage is 45%; the averageheight is 1.1m; the highest is 1.6m; the associatedplants are Karelina caspica, Ph.australis and Inulasalsdoides. There are many branches in the For.Tamarix laxa Willd with strong salt-resistance, whichis a good sand-binding plant.
(2) psammophyte grassland vegetation formationA. Karelina caspica communityIt mainly lives on sand hills and low-lying land of
the rolling topography. In semi-stable sand hill, it ap-pears to be colony; in the sand land, it assumes ran-dom distribution. The community is equal in heightwith average height of 48-52m; the highest point is90cm; the coverage is 25-55%. The livestock do noteat Karelina so that it remains to protect wind andcontrol sand.
B. Scorzonera divaricata communityGrowing below semi-stable or stable sand hills or
flat sandlot, its component is very simple, much dis-tinctive especially in the ecotone west of Qira County.The associated plants are Cirsiam arvense Soop andKareline caspica. The whole coverage is 25%; theaverage height is 30cm; the highest is 50cm. It is atypical common community but the area in Qira is notlarge.
C. Alhahi sparisifolia community It is located in flat sand of alluvial fan belt and
the lying border of stable, semi-stable sand hills. It isdistributed in the west of Qira, the external appear-ance of the community is in order; the height is even
with average height of 45cm; the highest is 80cm; thecoverage is 25-45%; the associated plants arePhragmites and Karelina.
D. Inula salsoloides community Located on riverbed or sand land, it plays a role
to protect and adapt for thin land. The height of plantis 30-50cm; the coverage is 20-30%; the associatedplant is Salsola ruthenica.
2.2.5 Halophitic vegetation type (1) Halostachys caspica communityThe distributing area is small, and is located in
N37°03', E80°52'northeast of Qira County. The sur-face has salt incrustation; the underground water levelis about 1.5m; the average height is 65cm; the highestis 80cm; the coverage is 38%. The associated plantsare Tamarix hispida,Lycium ruthenicum andPhragmites.
(2) Lycium ruthenicum communityIt is located in the Phragmites community, 5km
and 11km north of No.315 national highway betweenQira and Gulahema County, also south slope of stablesand hill and the area where underground water levelis much higher. It is also distributed in the north ofDamagou. The surface has salt incrustation; the as-sociated plants are Alhahi sparisifolia,Tamarix hispidaand Phragmites. The whole coverage is 10-15%; theheight of Lycium is 30cm; the highest is 45 cm.
(3) Tamarix hispida communityIt has small quantity on the border of salinization
farmland and swamp beside the river. The surface hassalt incrustation; the average height is 1.3m; the high-est is 2.5-3m.
2.2.6 Aquatic-swamp vegetation typeThe investigation for this type is relatively little,
mainly focusing inside oasis and near the reservoir.The main type are Typha angustifolia, Potomagetonperfoliatus, Chara sp.
3. The feasibility of vegetation restoration for theperiphery of oasis
Near the oasis periphery, owing to the topogra-phy fall by steep slope, this belt is convenient for
flood overflowing. In fact, in the low land in northoasis, vegetation on wavy terrains is extremely sparsewith bared land surface. In a sand hill 3m on the ground,the bud stuff of Tamarix is perforated to the surface.The bud is grown from the remains of Tamarix withthe widest bud of 4cm. But when it is bared on thesand surface, it is cut into a lot of branches, and re-stored the Tamarix cylindrical state. Investigated intothe process, it is found that the bared sand hills arealso humid. In the first ten days of September, water-bearing in surface sand will be about 2%, so that thewater bearing storage will sustain the survival of someplants. At present, majority of sand hills are baredbecause of grazing. As a result, Tamarix is not easilyseen within 2km on the fringe of forest.
All sorts of signs indicated that it has ability torestore and expand no matter from the water bearingstate of sand soil, underground water level or distri-bution of survival vegetation near the north fringe ofoasis. This belt, near oasis, with livestock grazed here,the survival plants decline continually. The mobilesand floating from north to south overlays on theretreated plants until the last plant disappears. As aresult, the mobile sand will float to oasis and destroyit finally. Therefore, robbing resources brings greatburden to its habitat.
3.1 The possibility of irrigation and its problems
Trench building and irrigation are applied, but itis impossible to get enough water to build plant forthe large area of desert because of water limit.Moreover, it is difficult to form enormous irrigationnet to implement irrigation limited by the topography.It can not be popularized on a large scale to irrigate byflood or channel. At most, it can only be carried out inthe narrow area along the river or road, and that theefficiency is low and unstable, difficult to guaranteethe woodland existence. Thus to build forest by irri-gation is not practical, and only some limited area canbe carried out. The environmental benefit will be verylow.
3.2 The basis of vegetation restoration by means ofnatural conditions and its feasibility
Ding J. L., Zhang Y. / Ecological Economy (2006)2:183-189
There is still some plants remained on the borderof the oasis. To prohibit forest cutting and encourageforest planting to restore vegetation, the remainedplants are likely to grow. But owing to the scarcetypes of plants, it is hard to recover the scaleefficiently. Moreover, the present environment cannot make the seeds implanted and budded to supple-ment the natural condition for the larva. Therefore,the present plants are moderately restored and ex-pand the benefit. The most effective way is to carryout protection in the outside belt. The method of pro-hibiting cultivation is used to maintain the presentstatus. Under the conditions of prohibiting cultivation,rebuilding can be implemented by man, including in-troducing some plants which are easily grown andthe environmental effect is distinctive, like Populusand Tamarix. A certain thickets spatial structure maybe set up to form the natural succession basis, andthe natural development of ecological succession willbe promoted by natural force. By natural rules, thick-ets are promoted on a certain scale according to thecircumstance. This is an effective method.
Under the premise of prohibiting cultivation, con-tinual action by outside force can be deterred. Theremained plants can be developed, and guarantee theintroduced plant to grow. Some sites with high un-derground water level can be used to plant Populus.The area above 20m2 with 3 or 5 plants grown to-gether can be planted in clusters. If thickets are set upon these sites and brown budding are be applied,because irrigation is not supplied, the only substitutemethod is to transplant young budding. And clus-tered planting is easy to get success. To apply scat-tered cluster planting, after thickets are in scale, theplants are connected to restore Populus woodland.The underground water is utilized to sustain wood-land survival, and the irrigation system is notnecessary. Among arbors, some Tamarix shrubs areplanted by using the same method to construct thevegetation segment. So it is possible to reconstructthe front plants in the north of oasis where there ismainly Populs and Tamarix. Topography and watersource are imposed to obstruct wind and sand so thatit can guarantee thickets’ existence and realize non-irrigation. It is feasible and has big environmental eco-
logical effect. It also guarantees the oasis’s safetyand builds effective belt between desert and oasis.
3.3 Solve the problem of fuel and change fuel struc-ture
Qira County is lacking in fuel. The local peoplehave to chop natural vegetation to get fuel source,which brought to destroy to many plants. Only solv-ing the problem of fuel can realize plant conservation.This region has biology resources, wind resources,solar energy resources and marsh gas to utilize. Thedegree of exploiting these resources is low. And nowfarmers have economic capacity to bear it.
3.4 Adjust economic structure and industrial distri-bution
Owing to the local people’s unconsciousness ofmaintaining ecological balance and the function ofecological economic system, the ecological balancehas maladjusted severely and economy lagged farbehind. In the latest years, according to the aboveproblems, through farmland constructing, plantingtrees, adjusting economy structure and productiondistribution, the ecological environment graduallycome back into beneficial cycle and regional economyhas developed much than before. In the view of eco-logical economy system, it can afford these functionslike material cycle, energy transformation, informationpassing and value transferring, etc.
3.5 Implement the national policy of family plan-ning
Family planning should be strengthened in orderto control the rate of population growth. Weak eco-nomic basis and fragile ecological environment couldnot bear the burden of quick population growth.
Along with social and economic development,people realize that environmental protection, ecologi-cal construction and sustainable development arevery important. Some experts focus on the desertifi-cation status on the south border of Tarim Basin. Onthe basis of investigation, a lot of suggestions and
Ding J. L., Zhang Y. / Ecological Economy (2006)2:183-189
scientific protection measures are put forward [22-24].In the future, measures for protecting wind and con-trolling sand should be researched in Qira Oasis; thebasic construction in farmland should be insisted; allkinds of forestations ought to be carried out, so thatthe ecological environment in oasis will improve,recover, and has new development.
Acknowledgements
Supported by National Natural Science Founda-tion of China (Grant No.40261006), West Light Foun-dation of The Chinese Academy of Science, XinjiangUniversities Scientific Research Plan (Grant No.XJEDU2004S03, XJEDU2005I07), and Doctoral StartFund of Xinjiang University.
Ding J. L., Zhang Y. / Ecological Economy (2006)2:183-189
References
[1] Ding Jianli, Tashpolat Tiyip, Xiong Heigang, et al. Oasisland cover change in the southern edge of Tarim Basin.Acta Geographica Sinca 2002; 57(1):19-27 (in Chinese)
[2] Tashpolat Tiyip, Xiong Heigang, Ding Jianli, et al. Studyon arid land environmental change and application ofremote sensing. Urumqi: XinJiang University Press; 2001.p.109-115 (in Chinese)
[3] Monique Mainguet. Desertification: natural backgroundand human mismanagement. Spring-Verlag;1991
[4] Huang Peiyou. The ecology of arid region. Urumqi:XinJiang University Press; 1993.p.7-12 (in Chinese)
[5] Gao Hongwen .The research progress in ecotone Theory.Acta Ecologica Sinica1994;13(1):32-38 (in Chinese)
[6] Ding Jianli, Tashpolat Tiyip. Studies on the vegetationvariations of Cele Oasis in the south of Taklamakan Basin.Journal of Arid land resources and environment,2001, 15(4):6-11 (in Chinese)
[7] Sun Wu. Man-land relation and ecotone. Journal of DesertResearch 1995; 15(4):419-424 (in Chinese)
[8] Meng FR, Bourque CPA, et al. The Nashwaak experi men-tal watershed project analyzing effects of clear cutting onsoil temperature, soil moisture, snow pack, snowmelt andstream flow.Water, Air and Soil Pollution 1995; 82(1-2):363-37
[9] Wang Lixian. Advances in the study of Ecohydrologicaleffects from vegetation changes. World Forestry Research1998; 11(6):14 23 (in Chinese)
[10] Mu Xinming, Wang Wenlong. The effects of water and
soil conservation in gully area of losses plateau on thesurface flow .Journal of water and soil conservation1999;(2): 71-75 (in Chinese)
[11] Yang Wenzhi, Ma Yuxi, et al. Soil water ecologicalregionalization of afforestation in loess plateau. Journalof water conservation 1994; 8(1): 1-9 (in Chinese)
[12] Fu Bojie, Wang Jun. The effect of land use on soil mois-ture in the region of hilly country. Bulletin of NationalNatural Science Foundation of China 1999; 13(4): 225-227 (in Chinese)
[13] Guo Xudong, Chen Liding, Fu Bojie. The impacts ofland-use and land-cover change on regional ecologicalenvironment. Progress of environment science research1999; 7(6): 66-75 (in Chinese)
[14] Xia Beicheng, JamesMT. Effect of vegetation structureof soil microbial community. Chinese Journal of AppliedEcology 1998; 9(3): 296-300 (in Chinese)
[15] Ma Keping, Ye Wanhui, et al. Stusy on plant communitydiversity in Donling Mountain, Beijing, China. ActaEcologica Sinica 1997; 17(6): 593-600 (in Chinese)
[16] Gao Xianmin, Huang Jianhui, et al. Ecological studies onthe plant community succession on the abanded croplandin Taibaishan, Qinling Mountains. Acta Ecologica Sinica1997; 17(6): 619-625 (in Chinese)
[17] Liu Canran, Ma Keping. Measurement of biotic commu-nity diversity. Acta Ecologica Sinica 1997; 17(6): 601-610 (in Chinese)
[18] Ye Wanhui, Ma Keping, et al. Studies on plant commu-nity diversity in Donling Mountain, Beijing, China – IX.The influence of scale on á diversity. Acta EcologicaSinica 1998; 18(1):10-14 (in Chinese)
[20] Xiang Shiqing. Research on reserving soil resources ofshrub root system. Journal of Beijing Forestry University1988; 10(4):15-21 (in Chinese)
[21] Cele County commission. Cele county annals.1998; p.46-112 (in Chinese)
[22] Xia Xuncheng, Li Chunshun, et al. Desertification andsandy wind disaster fathering in Xinjiang. BeiJing: Sci-ence Press; 1991.p.12-71 (in Chinese)
[23] Zou Xinjia, Lichongshun, et al. Desert change and itscontrol at the southern part of the Taklimakan Desert-Acase study on Hotan Oasis. In: Chen Hua. Study on HotanOasis. Urumqi: Xinjiang People Press; 1988 (in Chinese)
[24] Zu Ruiping. Environmental Changes of Oasis at the South-ern Part of Tarim Basin during the Recent 2000 Years.Journal of Desert Research 2001; 21(2): 122-128 (inChinese)
Ecological Economy (2006)2:190-195
Analysis
* Corresponding author. E-mail address: [email protected]: Bai Yongqing(1968-), male, PhD candidate, spe-cialized in environment management.
On division management for environmental system of China:lessons from European local sustainable development
Bai Yongqing 1*, Hao Jingxia 2, Zhu Xiancheng1
1. Dalian University of Technology, Dalian 116023, P.R.China2. Beau of Education, the People’s Government of Dingzhou City, Dingzhou 073000, P.R.China
Received Nov.28, 2005; Accepted Jan.20, 2006
Abstract: The concept of sustainable development, after being brought forward, has become a shibboleth in the world, atnational and local levels. In Europe, this concept is implemented from the local to the nation, even to the Continent. Thelocal sustainable development mainly consists in two factors: one is the renovating method continually invented byEuropean Secretariat of ICLEI, and the other is that the local authorities towards sustainability are co-operated by theEuropean Sustainable Cities and Towns Campaign. The eco-budget method is the outcome of these factors. For ourcountry is a big country on rapid progression of industrialization and urbanization, with a large population and scarceresources per capita, it is practically significance to study as soon as possible the methodology. Experience fromEuropean local sustainable development may help us to resolve the handicap of department division in local authority.Keywords: Local sustainable development; Europe; China; Environmental management; Department division
1. Introduction
Over the past two decades or so, the concept ofsustainable development has become a shibboleth,widely accepted as the way to live in harmony withthe environment. Sustainable development has beendefined as meeting the needs of the present withoutcompromising the ability of future generations tomeet their own needs[1]. In fact, only this conceptcouldn’t guide us on the path to a sustainablesociety, it must be practiced in particular regions.The particular region as a complex immense systemwith the regional differences and levels and withhuman as its subject not only comprises of manyfactors, different levels, complicated structures andvarious functions, but also has extensive internaland external relations, numerous dynamic variables,indeterminate factors and all kinds of interwovencontradictories, so its development cannot avoidbeing restricted and affected by sorts of factors andconditions[2]. That is to say, the global sustainabledevelopment comes from the local sustainable de-velopment Developing with scarce resources is ar-guably one of the biggest challenges we face as
societies at the beginning of this new century. Localgovernments of all types and sizes are at the fore-front of meeting this challenge. The paucity of re-sources goes far beyond the shortage of financesand personnel. For example, communities are hit hardby the scarcity of natural resources: peace and quietin towns, clean air, clean water, uncontaminatedfood, non-paved areas, and animal and plant species.If clean, wholesome-tasting drinking water or cleanair is no longer available, economic development isimpaired (drinks manufacturers or (silicon) chipproducers, for example, can no longer be established).Air pollution damages municipal woods and thusdevalues communal assets.
How can local politics win room for developmentdespite scarce natural resources? How will the re-form model for municipal administrations be adaptedto include an ecological pillar? How will the LocalAgenda achieve a sustainable action mechanism?These questions lead us to the lessons from Europe.
2. Lessons from Europe
2.1 European Secretariat of ICLEI
ICLEI (the International Council for Local Envi-
Bai Y. Q., et al. / Ecological Economy (2006)2:190-195
ronment Initiatives) - Local Governments forSustainability is an international association of lo-cal governments and national and regional localgovernment organizations that have made a com-mitment to sustainable development. It was foundedin 1990 as the International Council for Local Envi-ronmental Initiatives. The council was establishedwhen more than 200 local governments from 43 coun-tries convened at our inaugural conference, theWorld Congress of Local Governments for a Sus-tainable Future at the United Nations in New York.And it’s World Secretariat has been generouslyhosted by the City of Toronto since 1991. Now morethan 475 cities, towns, counties, and their associa-tions worldwide comprise ICLEI’s growingmembership. The ICLEI Council, made up of allmembers, convenes every three years to discuss anddecide upon the Strategic Plan, on which the annualwork programs are based. The Council also electsthe Executive Committee comprised of 21 individu-als representing all regions of the world[3].
In Europe, ICLEI counts more than 180 local au-thorities and municipal associations as its members.European local governments are strongly involvedin ICLEI, which in turn, offers a wide range of oppor-tunit ies and services for European localgovernments. ICLEI’s European members are servedby the European Secretariat of ICLEI which co-ordi-nates all of ICLEI’s European activities. The Secre-tariat is situated and generously hosted by ICLEI’smember, the city of Freiburg, Germany, since 1992.The European Secretariat of ICLEI also proudly hostsICLEI’s International Training Centre as well as thepersonal office of ICLEI’s Secretary General[4].
Starting with a focus on developing and imple-menting as many innovative European projects aspossible, together with its membership, it maintainsthe Sustainability Management Program designedto support cities and towns in developing and ap-plying innovative management instruments towardslocal sustainability. The mission of the sustainabilitymanagement program is to achieve municipal man-agement structures that integrate environmental as-pects systematically in all decision making. The workon the program also includes serving as the world
wide hub for the promotion of the eco-budgetmethod. The sustainability management program isled by the Sustainability Management Team of theEuropean Secretariat.
2.2 The European Sustainable Cities and TownsCampaign
In order to promote the European local authoritytoward sustainability authentically, European Sec-retariat of ICLEI called on its members held the FirstEuropean Conference on Sustainable Cities andTowns in Aalborg, Denmark on 27 May 1994. In thisconference, an important document - The AalborgCharter was approved by the participants. It pointsout that cities and towns should develop towardssustainability at these aspects, such as localstrategies, urban economy, land-use, urban mobil-ity patterns, global climate, preserve of ecosystems,etc. It also presents instruments and tools for urbanmanagement towards sustainability, for example,seeking to establish new environmental budgetingsystems which allow for the management of our natu-ral resources as economically as our artificialresource, “money”, which is the origin of the eco-budget method[5].
Another important thing at the conference is thelaunch of the European Sustainable Cities and TownsCampaign[6]. The activities of the campaign wasstipulated; it requests all the major local authoritiesin Europe to coordinate, and invites every localauthority, whether it is a city, a town or a county orany European network of local authorities to jointhe campaign by adopting and signing the Charter.The initial phase of this campaign lasted two years,primarily devoted to promote the concept of localsustainability to urge more local authorities to signthe Charter and join the Campaign, and to guidelocal Agenda 21.
The action phase came with The Second Euro-pean Conference on Sustainable Cities and Town[7],in Lisbon, Portugal from October 6th to 8th, 1996. Athousand representatives of local and regional au-thorities from all over Europe attended thisconference. They learned about the status of local
Bai Y. Q., et al. / Ecological Economy (2006)2:190-195
Agenda 21 in 35 European countries and commenton the progress of sustainable development madesince the First Conference. They exchanged ideasand experience of local practice and find more op-portunities to cooperate with other European com-munities on joint projects. They concluded the needsof local authorities engaged in the local Agenda 21and laid the groundwork for the next phase of theCampaign. The European Sustainable Cities andTowns Campaign, launched at the Aalborg Confer-ence by 80 European cities, now has 250 local andregional authorities members. By signing AalborgCharter, the local communities achieved consen-sus on a long-term plan for sustainable development.
From then on, ICLEI has developed eco-budgetto support the sustainable development of the citiesand towns to help local authorities to integrate mu-nicipal environmental management into a compre-hensive system. Motivated by European Secretariatof ICLEI, the cities of Bielefeld, Heidelberg, Dresdenand Nordhausen County in Germany successfullytried eco-budget from 1996 to 2000.
The Third European Conference on SustainableCities and Towns was held at Hannover[8] from Feb-ruary 9th to 12th, 2000 to push the sustainable devel-opment of local cities and towns and try to come toan agreement on a direction of the efforts. 650 localand regional authorities from 32 countries all overEurope signing on Aalborg Charter to join the cam-paign for local sustainable development. The par-ticipants of the campaign reached more than 130Million Europeans. At this conference, a draft TheHannover Call was signed. It put forward the pro-gram for local sustainable development, calling uponmunicipal leaders to further support the implemen-tation of eco-budget, to give higher priority to localsustainable development as the basis for a sustain-able European society, etc. In the end, it concludedthe opportunities and challenges for the next step.Up to the present, the guideline and requirementsare still available in Europe.
2.3 Eco-budget method
With the development of the campaign, the eco-
budget method has become more and more usefulfor the local sustainable development [9]. It was de-signed as a framework for environmental protectionand resource management for local government. Eco-budget method is similar to those used in financialaccounting; however, it dose not evaluate environ-mental resources but considers the “cost” and“store” of environmental resources. Eco-budget usesphysical, quantitative environmental indicators tomeasure the cost and store in order to set targets. Inthis way, eco-budget can be drawn up in the sameway as financial budgets.
The municipal authority sets up LIT (Local Imple-mentation Team) composed of representative of alldepartments to promote the development and imple-mentation of eco-budget, appointing a technicianthe chief budget director to take the responsibilityfor the implementation of the budget. The whole pro-cedure adopts participative budgeting, i.e. the policygoals of central authority or the local government asthe prerequisite, each relevant department, enterpriseand the public could participate in decision and workout together. So that each participant has an oppor-tunity to combine his own object with the wholeproject, thus, they will have great motive to committheir units in a certain level of activity, controllingthe spending of resources within the range ofbudget.
Each budget cycle runs through three years andconcludes three steps[10]: budget preparation,implementation, and variances analysis, each stepspans over one year. In the course of preparation,the LIT need to collect a large number of data fromeach department. It is by the monitor who deter-mines which kind of resources and environmentalproblem should be considered and drafted into in-dictor system of the budget, based on the local re-source and environment situation. Generally, indi-cators should respond to the following principle[11]:
(1)Indicators are formulated precisely to evalu-ate the resource consumption and significant envi-ronmental issues.
(2)Indicators are based on reliable data in physi-cal quantities, not in monetary term.
(3)Indicators allow for the comparison of envi-
ronmental conditions of different years and can beused to predict trends.
According to the relevant policies of the centralor the local authorities and considering the factorthat may influent implementation, the LIT reason-ably predicts the target in budget year and mid-time(5 years apart the budget year), sets up the masterbudget. Master budget should be divided into de-tailed budgets which are assigned to different de-partments of resources and enterprise consumedresources actually, they will be responsible for theoperational implementation of the detailed budgets,and must be communicated and coordinated to con-verge in the master budget to meet corporateobjectives. When the detailed budgets come intounify, the LIT reports it to the legislature. When thereporting period finished, the budget would beginto measure whether targets were achieved. In thatsense, it becomes a tool for evaluating participants’performance, While implementing, the annual bud-get can subdivided into the quarter budget, actualvalues of indicators are measured at the end of eachquarter, which helps the budget clerks discover thedifference from the targets in time, find the reasonswhich lead to the variances, prevent the change of acertain element causing the whole resource systemchange. At the end of the year, compare the actualresults with the budget, estimate the difference be-tween them, and show the anticipated bias degree,the ecological efficiency and the controlling effi-ciency of resources. According to the characteristicand scale of the variances, the monitor makes a deci-sion whether to investigate the reasons. If the vari-
ance is favorable, it needn’t considered, but shouldbetter research it to inspire other department’saction. If the variance is unfavorable, the reasonscoming from the external and internal should belooked for, the external reasons maybe like resourcessupply and demand changing resulted fromeconomy, politics, technology, etc. The internal fac-tors maybe like that inaccuracy, low efficiency inoperation. So, the more influent factors are consid-ered in setting up target progress, the more accuratein the establishment of the budget. The budget moni-tor reports all reasons to the LIT, by which differ-ences and causes are determined to correct andeliminate.
When budget year finished, the LIT shouldgather every sub-budget together and make theminto the eco-budget compiled as reports which fa-miliar to the public, politicians and municipal staff.The eco-budget includes the balance of environ-mental accounts, a statement of environmental as-sets and environmental-benefit analysis. Next year’smaster budget can then be written with the assis-tance of the information from previous years’ bud-get[12].
The eco-budget, on one hand is short-term planof resources for urban government; on the otherhand, if the budget is linked with the participant’sduty, and the differences between actual value andtarget are analyzed, it becomes the resources man-agement tool. And this kind of management stylemakes every department divide the work under therestraint of the law, coordinate each other, pinpointthe problems in time, systematically manage the
Fig.1. The efficiency of eco-budget
Collecting information, preparing eco-budget
variances analysis
set up targets again
Learning policies of the center and local authority Planning
Controlling
Bai Y. Q., et al. / Ecological Economy (2006)2:190-195
spending of resources.
3. Division Management for Environmental Systemof China
3.1 Division in the Chinese EMS
In Chinese local environmental managementsystem, the authority sets up administrative depart-ments of different environmental fields, being helpedto make the detailed rule of resources protection andpollution management, such as water resourceregulation, climate pollution control, etc. But be-cause the achievement ties to the responsibility ofthe department directly, what departments caredabout is how to safeguard their own privilege; theproblems paid close attention by some departmentsmight be treated very badly in other departments. Itmaybe only transfers the problem to the range ofother departments instead of resolving. For example,the municipal sewage becomes clean water aftertreatment by the water resource department, but alarge amount of precipitate might produce in thecourse of purifying; depositing it may lead to pollu-tion of land and ground water[13]. For another
example, the method of burning or land filling to dealwith city solid offal can no doubt reduce the quan-tity of rubbish greatly, but will cause pollution ofthe atmosphere, soil or ground water. Because de-partmental management might protect some re-sources but damage other kinds of resources, thenreducing pollution just turn into transfer the pollu-tion outdated.
3.2 Suggestion
A local administration committed to sustainabilitymust efficiently manage all its resources, especiallythe natural resources. The natural resources arematerial basis of sustainable development whichemphasize that humanity should harmonize with thenature. Yet, all kinds of natural resources do not ex-ist in isolation; they overlap alternately, dependingon each other on the earth, forming the intact re-source system. Wanton use of any kind of resourcewould exert an influence on other resources and thencause the change of the whole resource system.While government gets involved in the resourcesallocation, they should consider the need of everydepartment; coordinate the relationship of every
Bai Y. Q., et al. / Ecological Economy (2006)2:190-195
department and enterprise in order to utilize urbanresources efficiently.
We can use the eco-budget method to help ourlocal authorities manage the use of their local envi-ronmental issues, and co-ordinate their environmen-tal activities more effectively. The systemization oflocal authorities’ environmental activities and theirorientation on politically set targets will improve theefficiency and effectiveness of public administra-tion by identifying gaps in data, avoiding doublecollection or storage of data, and concentrating datacollection on real information needs. Planning in allparts of the local authorities will be developed andcarried out according to the same targets; monitor-ing and reporting will be structured to provide deci-sion-makers with relevant information. Participationin this budgetary system will allow individuals tobroaden their focus and consider their decisions andcontributions as “part of a bigger picture” therebybetter understanding the global perspective of theiractivities. The orientation to same targets, which areset politically with the environmental master budget,will lead to improved integration of all individualcontributions.
4. Conclusions
The European local authorities are cooperatedby the organization and campaign, which presentedthem innovate method and practical support. WithEuropean Secretariat of ICLEI’s innovate method,cities improved their competitiveness and becomemore sustainable and attractive places. Secondly,the co-operation by the European Sustainable Cit-ies and Towns Campaign promoted sustainable ur-ban development, and it presented a good practicalsupport, guidance and training by associations andnetworks of local authorities. Thirdly, the eco-bud-get method which was developed by ICLEI and theEuropean Sustainable Cities and Towns Campaign,can make local authorities manage the use of theirlocal environmental issues, and co-ordinate theirenvironmental activities more effectively. Finally, forour country is a big country on rapid progression ofindustrialization and urbanization, with a large popu-
lation and scarce resources per capita, severe envi-ronmental pollution and uneven regionaldevelopment, the sustainable development is espe-cially unbeneficial. So it is practically significance tostudy as soon as possible the methodology. Ourlocal authority should systematically manage thewhole of natural resources, which need not only toreform the former mechanism in environmental man-agement system, but also to adapt new method toour environmental management system. The unprec-edented amount of knowledge, capacity forinnovation, and new technologies can be a chancefor our cities to develop towards sustainability.
References
[1] Geoffrey Glasby. Sustainable development: the need fora new paradigm. Environment, Development andSustainability 2002; (4):333-345
[2] Cao Lijun. Evaluation and ways of sustainabledevelopment. Science Press; 1999(in Chinese)
[3] www.iclei.org[4] Charter of European ci t ies and towns towards
sustainability (The Aalborg Charter).[5] Cai Shouqiu. Study on the environmental policy and laws
in EU. Wuhan: Wuhan University Press; 2002(inChinese)
[6] www.iclei.org/europe[7] The Lisbon action plan: form charter to action[8] The hanover call of European municipal leaders at the
turn of the 21st century[9] Konrad Otto-Zimmermann. Local action 21: motto-
mandate-movement in the post-jphannesburg decade.Local Environment 2002; 7(4): 465-469
[10] Hao weixia, Tnegli, Wang Ziyan. Eco-budget: a modelof municipal environmental management. EcologicalEconomy 2005; 1(4):13-17
[11] Martin Znderle, Volker Stelzer. Eco-budget: local au-thority consumption within the natural condition(Translated by Yao Liqun). Industry and Environment2001; (1), (2) (in Chinese)
[12] Anthony A, et al. Management accounting. Beijing:Peking University Press; 2004 (Chinese Edition)
[13] Wang Jinnan. The system and policy of water pollutioncontrol in China. China Environmental Science Press;2003 (in Chinese)
Bai Y. Q., et al. / Ecological Economy (2006)2:190-195
An analysis of “eco-centric management” in China andmethods to improve it
Li Zhengfeng1*, Zhang Fan2
1. International Business School, Shaanxi Normal University, Xi’an 710062, P. R. China2. College of Foreign Languages, Northwest University, Xi’an 710069, P. R. China
Received Oct. 29, 2005; Accepted Dec.1, 2005
Abstract: This essay focuses on the question “what does the evidence on environmental regulation and its implementationtell us about the extent of eco-centric management in China and how to improve it”. The first part will introduce eco-centrism, eco-centric management, and one major way to achieve eco-centric management in reality. Second, theenvironmental regulations of United Nation (UN) and China will be analyzed and compared to find out whether they areeco-centric. Moreover, the implementation of environmental regulation in China will be analyzed because regulationcannot exist without proper implementation. Three suggestions were given to improve eco-centric management in China:natural science research and public administration, environmental education, international cooperation.Keywords: Eco-centrism; Management; China; Environmental Regulation
1. Introduction
Eco-centric management is spreading widely asa great number of environmental regulations havebeen established by many governments. However,the prospects for achieving eco-centric managementare different in different societies in terms of envi-ronmental regulations due to development level,economical consideration, education backgroundetc. This essay focuses on the question “what doesthe evidence on environmental regulation and itsimplementation tell us about the extent of eco-cen-tric management in China”, tries to illustrate differ-ent levels of eco-centric in different regulations andconsiders implementation of regulation as an impor-tant factor of regulation itself.
Many scholars concluded that postindustrial so-cieties have four features: huge amount of produc-tion in service and high-technology production, in-creasing globalization, ecological limits which con-strain economic growth and movements toward de-mocratization of markets and politics [1, 2]. Accordingto Shrivastava, “postindustrial societies are centeredon the risks that accompany the creation of and dis-
tribution of wealth” [3]. Beck explained that risks inpostindustrial society come from the action of soci-ety and reflect people’s actions and omissions, so itis the unintended and unforeseen effects of people’sactions that result in postindustrial risks[4].
Shrivastava pointed out that the way to decreasepostindustrial risks is to place ecology at the centralof people’s actions. Hence, eco-centric managementwill contribute to the survival and competence oforganization in postindustrial period.
1.1 Eco- centrism
Eco-centric management comes from eco-centrism which mainly contains two parts: one is“The Land Ethic” and the other is “Deep Ecology”.
“The Land Ethic” was introduced by AldoLeopold in 1949. According to Aldo Leopold, peopleare only part of the land society and have to respectother members such as other animals, plants, waterand so on. Every natural thing is entitled to live onthe earth and the nature has value not because itcan supply resource for people to live but becausethere is value in itself. People should not insist thatthey are the best species on the earth but treat them-selves as an ordinary member in the whole
Li Z. F., Zhang F. / Ecological Economy (2006)2:196-202
community. Moreover, people are responsible forthe nature in ethics[5].
Arne Naess, who introduced “Deep Ecology”,stated that people should protect all of the speciesin the world and should not believe that human be-ings could transcend the nature. Animals, Plants andthe whole ecology system not only are instrumentsand materials for human beings but also have theirown values. Other organisms are as the same impor-tant as people and if people destroy other organ-isms or eco-system, they cannot live alone[6].
1.2 Eco-centric management and how to achieve it
Eco-centric management employs the conceptof eco-centrism in management activities and it “fo-cuses on the management of organizational elementsthat have an impact on nature…The eco-centric para-digm aims at creating sustainable economic devel-opment and improving the quality of life worldwidefor all organizational stakeholders”[3]. Eco-centricmanagement tries to treat other organisms and eco-system friendly through the process of production:input, throughput and output.
In the input step, “eco-centric managers rejectuncontrolled organizational use of inputs in the formof natural resources and energy.” For example, theymay choose recycled or renewable materials insteadof nonrenewable materials. Thus in this step, man-agers try to minimize materials and nonrenewableenergy. In the throughput step, “eco-centric man-agement seeks to eliminate emissions, effluents,workplace hazards and risks of accident”, whichmeans that it tries to decrease possible pollution theproduction may raise. In the last step outputs, “eco-centric management seeks to minimize the life-cyclecost of its products and services…and treat wastein a manner least harmful to the environment” [3].
Therefore, Shrivastava pointed out that “plac-ing nature at the centre of management or organiza-tional concerns is the hallmark” of one way toachieve eco-centric management. “Because natureis fundamental to all life, and certainly human wel-fare depends on it” [3]. In the following parts, theenvironmental regulations of United Nation (UN) and
China will be analyzed to find out whether they en-courage or regulate managers put nature in the cen-tre of organizational concerns.
2. Regulations
Both the environmental regulations of UN andChina consider environment as a very important fac-tor in people’s lives. However, both UN’s regula-tions and Chinese regulations still do not put naturein the first order but state nature as the base of hu-man to explain its importance. Moreover, the imple-mentation of environmental regulations still has somedistance to a good level. Therefore, the progress forachieving eco-centric management in regulationsexists but the prospects of achieving eco-centricmanagement in China are not good.
2.1 Environmental regulations of UN
UN’s Declaration on Human Environment andAgenda 21 Project are two principle documents ofenvironment regulation and protection. Declarationon Human Environment is a basic guideline of solv-ing environmental problems and Agenda 21 Projectfocuses on the sustainable development of society.
UN announced the Declaration on Human Envi-ronment in Conference on Human Environment atStockholm in 1972. The declaration mentioned thatpeople are part of the environment and environmentshould be protected by human beings. “Man is bothcreature and molders of his environment, which giveshim physical sustenance and affords him the oppor-tunity for intellectual, moral, social and spiritualgrowth” [7]. However, it also persuaded people toprotect environment mainly from the point thatpeople have to depend on environment. “In our time,man’s capability to transform his surroundings, ifused wisely, can bring to all peoples the benefits ofdevelopment and the opportunity to enhance thequality of life. Wrongly or heedlessly applied, thesame power can do incalculable harm to human be-ings and the human environment” [7].
Agenda 21 Project was introduced by UN in 1992and focused on the sustainable development of
Li Z. F., Zhang F. / Ecological Economy (2006)2:196-202
society. This project contained the concept of eco-centrism and described some details of it. Moreover,it emphasized concerning environment in manage-ment activities. In Chapter 8, it was written that “theprimary need is to integrate environmental and de-velopmental decision-making processes. To do this,Governments should conduct a national review and,where appropriate, improve the processes of deci-sion-making so as to achieve the progressive inte-gration of economic, social and environmental is-sues in the pursuit of development that is economi-cally efficient, socially equitable and responsible andenvironmentally sound” [8]. UN also gave the orderof importance, and the integration of economic, so-cial and environmental considerations in decision-making is the first one. However, all of these actionsare still based on human being’s needs. “Integra-tion of environment and development concerns andgreater attention to them will lead to the fulfillmentof basic needs, improved living standards for all,better protected and managed ecosystems and asafer, more prosperous future” [8].
From the development process of environmen-tal regulations of UN, UN has already encouragedits members to employ eco-centric management intheir concerns but it still did not put nature in thefirst place.
2.2 Environment regulations of China
The environmental regulations in China are stillpartly based on anthropocentrism and partly basedon eco-centrism. The first and basic environmentallaw Environmental Protection Law of The People’sRepublic of China and a new law Cleaner Produc-tion Promotion Law reflect both the idea that peopleshould protect the environment because they haveto depend on natural environment and the idea thatnature should be positioned first. The main spiritsof these two laws and their relevant parts to eco-centric management will be introduced.
The basic environmental laws and regulations inChina were promulgated by the influence of UnitedNation. China took part in the United Nation’s Con-ference on Human Environment which was held in
Stockholm in 1972, and later Chinese governmentbegan to consider the environmental problems andestablished institutions in 1973. After several years’research and studying, the first Environmental Pro-tection Law of People’s Republic of China (for TrailImplementation) was promulgated in 1979.
The aim of Environmental Protection Law is“protecting and improving people’s environment andthe ecological environment, preventing and control-ling pollution and other public hazards, safeguard-ing human health and facilitating the developmentof socialist modernization” [9]. The law is still empha-sizing the importance of human in the ecological en-vironment and has not place nature at the centre ofpeople’s activities.
This basic law contained supervision and man-agement of the environment, protection and improve-ment of the environment, prevention and control ofenvironmental pollution and other public hazards andlegal liability. In the fourth chapter Prevention andControl of Environmental Pollution and Other Pub-lic Hazards, the spirit of eco-centric management isreflected. The organization which causes environmen-tal pollution “must adopt effective measures to pre-vent and control the pollution and harms caused tothe environment by waste gas, waste water, wasteresidues, dust, malodorous gases, radioactivesubstances, noise, vibration and electromagnetic ra-diation generated in the course of production, con-struction or other activities. For the technologicaltransformation of newly-built industrial enterprisesand existing industrial enterprises, facilities and pro-cesses that affect a high rate of the utilization of re-sources and a low rate of the discharge of pollutantsshall be used, along with economical and rational tech-nology for the comprehensive utilization of wastematerials and the treatment of pollutants” [9].
Another environmental law Clear ProductionPromotion Law was promulgated in 2002 and it is“enacted in order to promote cleaner production,increase the efficiency of the utilization rate ofresources, reduce and avoid the generation ofpollutants, protect and improve environments, en-sure the health of human beings and promote thesustainable development of the economy and soci-
ety” [10].The main regulations in it concerned the inputs
step, throughputs step and outputs step as well.Cleaner production “design improvement, utilizationof clean energy and raw materials, the implementa-tion of advanced processes, technologies andequipment, improvement of management and com-prehensive utilization of resources to reduce pollu-tion at source, enhance the rates of resource utiliza-tion efficiency, reduce or avoid pollution generationand discharge in the course of production, provi-sion of services and product use, so as to decreaseharm to the health of human beings and the environ-ment” [10]. This law introduced the principle ofrealization, implementation and encouragement ofcleaner production, and regulated business to pro-duce in an eco-centric way. Government requiresand encourages business to put nature at the centreof its production and sale. For example, governmentrequire organizations “adopting toxin-free, non-haz-ardous or low-toxin and low-harm raw materials toreplace toxic and hazardous raw materials” [10] in theirtechnological upgrades process.
Therefore, the environmental laws and regula-tions in China regulate and encourage business toachieve eco-centric management, but the laws arepartly based on the anthropocentrism view whichmeans that protect environment for human being’sutility. The environmental report from The WorldBank pointed out that “the economy’s continuedreliance on China’s repertoire of environmental laws,regulations, and standards is quite comprehensiveand has been continuously updated and expandedto improve effectiveness and cover emerging issues.Among comparable developing nations, China isunquestionably in the front rank, but it cannot be-come complacent” [11]. Although the environmentalregulation in China has reached an acceptable level,the implementation of environmental regulation isstill on a relatively low level.
2.3 The implementation of environmental regula-tion in China
Hubert Heinelt and his colleagues pointed out
that “a large number of legal regulations are accom-panied by a systematic lack of their effective appli-cation for purposes of steering” [12]. Thus, they statedthat the implementation of laws and regulations ismore important because of its real effect. However,people did not pay enough attention to environ-mental protection laws in 1980s in China, and theimplementation was improved in the middle 1990spartly due to the influence of WTO, especially incontrol industry pollution. The extent and result ofimplementation still have a distance to the level thatChina should achieve.
Although laws and bureaus were exist, the imple-mentation of environmental protection laws was notgood until 1997. According to Lampton, the politicalsystem below the highest level was “fragmentedauthoritarianism” in 1987 and there are four charac-ters of policy implementation in China: “units”,“systems”, “too many mothers-in-law” and “inde-pendent kingdoms”. Moreover, he found out thatthese characters “make policies that require cross-unit or cross-jurisdictional cooperation much harderto implement than policies that do not”[13].Unfortunately, “implementation of any policy initia-tive requires the cooperation of many units at vari-ous levels of government”. Barbara concluded that“EPBs could not make aggressive use of sanctionsagainst polluters unless they had the backing of lo-cal government leaders” and the implementation washighly influenced by economic reasons[14].
After the eco-label was discussed and requiredby WTO in 1996, implementation extend of environ-mental protection laws was different, especially inindustry pollution control. In fact, China had its owneco-label from 1993, but the discussion in WTO madeeco-label widespread and enhanced the action ofcorporations.
ISO14000 (International Organization forStandardization) is one of the international eco-la-bel that have been used in many countries from 1996and was highly praised by WTO. Most corporationswhich are exporting goods have to reach the stan-dard and it has seen as a symbol of good corpora-tions in other companies which do not export. It wasconcluded that ISO14000 would make the corpora-
Li Z. F., Zhang F. / Ecological Economy (2006)2:196-202
tions “consider” environmental impact when settingobjectives and targets; commit to “continuous im-provement” of environmental performance and pol-lution prevention (however defined); and complywith applicable legislative and regulatory require-ments in the jurisdiction where the facility is located(if such requirements exist)” [15]. A steering commit-tee in SEPA was established for “accreditation ser-vices for certification bodies and auditors”[11]. Thereare about 480 corporations that have obtained thecertification of ISO14000 and 15 model industrial dis-tractions of ISO14000 in China today[16]. These cor-porations implemented the environmental protectionlaws and resource laws very well and are the modelsof other corporations which would like to live in theinternational market as well as Chinese market.ISO14000 also made Chinese own eco-label too, andmore than 8,700 corporations have obtained thecertification.
However, compared with the huge numbers ofcorporations in China, this number is not enough,and it was found by the report of World Bank in 2001that the majority of these companies are not the majorpollution source of China[11]. It means that the majorpollution companies did not implement the Environ-mental Protection Law at a level that they shouldreach and their pollution behavior have not beencontrolled in an appropriate way by government.Therefore, the total level of implementation of envi-ronmental regulation has not reached an acceptablelevel even though there were some improvement af-ter ISO 14000 was introduced by WTO in China.
3. Methods to improve eco-centric management
Chinese environmental laws and regulations pro-vided a foundation to achieving eco-centricmanagement. Although the foundation is weak, itstill brings hope to eco-centric management.However, the implementation of environmental lawsand regulations which shows the real effect becamean obstacle of achieving eco-centric management.China could improve the constraint and effective-ness of environmental laws and regulations fromscientific research and public administration, envi-
ronmental education and international cooperationwhich help the accomplishment of eco-centricmanagement.
3.1 Scientific research and public administration
On the one hand, eco-centric management hasto apply many natural science theories to design,measurement, appraisal, improvement etc. On theother hand, public administration theories have tobe employed by government in regulationimplementation.
“Viewing organizations as components of indus-trial ecosystems suggests fundamental changes intheir operational scope, strategies, cost structures,location and management practices” [3]. It is certainlythat most changes have to be based on the result ofnumerous kinds of natural science researches, suchas chemistry, biology, environment and so forth.Changes in input, throughput and output step haveto be proved as contributing to an environmentalfriendly system.
Wilson[17] pointed out that a good administratorshould link with public opinion in forest administra-tion (which is related to eco-centric management).Employing democracy in administration process isone way of bringing in public opinion. Public admin-istration theories are very important in obtainingagreement from general public which is the basis ofmaking decisions for governments.
Although scholars are still arguing about whetherboth methods should be used and which methodshould be the dominant one [18, 19], both scientificresearches and public administration have to be in-volved in setting up eco-centric management system.
3.2 Environmental education (EE)
Many researches proved the importance of en-vironmental education chang people’s opinions intoa more “eco-centric” way. Mc Millan and her col-leagues[20] found that university students who stud-ied environmental courses “moved toward a moreeco-centric and less homocentric outlook and to anincreased degree of sophistication regarding knowl-
Li Z. F., Zhang F. / Ecological Economy (2006)2:196-202
edge of environmental issues” in their Impact of aUniversity-level Environmental Studies Class onStudent’s Values. Moreover, people’s opinions doinfluence their purchase and would be shown inmarket. Chan and Lau[21] pointed out that “environ-mental claims also generate more positive responsesfrom consumers who exhibit a strong eco-centric ori-entation compared with those who exhibit a weakeco-centric orientation”. According to Liu[22], thenumber of educated Chinese who realize the impor-tance of eco-friendly purchase is raising.
Therefore, environmental education can helppeople resolve environmental problems, seekingmethods of solving environmental problems andmaking decisions in marketplace. Eco-centric man-agement and the implementation of environmentalregulation will obtain benefits from EE.
3.3 International cooperation
The boundaries between countries cannot stopthe happening of ecological and environmentalproblems. Many ecological problems crossedboundaries and brought ecological disasters to manycountries and regions besides the country whereecological disaster first happened. Hence, all of thecountries should joint to solve problems in environ-mental exploitation, pollution control and nature con-servation so that laws and regulations in these coun-tries have real effect. Pentreath[23] summarized that“a fairly basic and generalized framework is neededinternationally” to solve ecological and environmen-tal problems.
Many international organizations did make muchprogress on setting up a “basic and generalized
Li Z. F., Zhang F. / Ecological Economy (2006)2:196-202
Li Z. F., Zhang F. / Ecological Economy (2006)2:196-202
framework”[23]. For example, ISO14000 is a produc-tion of international cooperation. China shouldstrengthen its cooperation with international orga-nization and other countries to bring a better effectof Chinese environmental regulations.
4. Conclusions
Eco-centric management comes from eco-centrism which mainly contains “The Land Ethic”and “Deep Ecology”. The main theme of “The LandEthic” is that people are only part of the land societyand have to respect other members, and “Deep Ecol-ogy” means that people should protect all of thespecies in the world and should not believe thathuman beings could transcend the nature.
Although both UN’s and Chinese regulationsregulate and encourage business to employ eco-cen-tric management, they did not put nature in the firstplay but state nature as the base of human to explainits importance. Moreover, the implementation of en-vironmental regulations in China is still backward.Consequently, if placing nature at the centre of man-agement concern is the way to achieve eco-centricmanagement, the eco-centric management level ofUN and China are not good because the incompleteunderstanding of eco-centrism. Three suggestionswere given to improve eco-centric management inChina: natural science research and publicadministration, environmental education, interna-tional cooperation.References
[1] Bell D. The coming of post-industrial society. New York:Basic Books; 1975
[2] Giddens A. The consequences of modernity. Stanford, CA:Stanford University Press; 1990
[3] Shrivastava P. Eco-centric management for a risk society.Academy of Management Review 1995; 20(1):118-137
[4] Beck. Risk society: towards a new modernity. NewburyPark, CA: Sage; 1992
[5] Aldo Leopold. A sand county almanac and sketches hereand there. New York: Oxford University Press; 1949
[6] Arne Naess. Gandhi and group conflict: an exploration ofSatyagraha: theoretical background. University of OsloPress; 1974
[7] United Nation, 2004. See also: http://www.unep.org/Docu-ments/Default.asp?DocumentID=97&ArticleID=1503
[8] United Nation, 2004. See also: http://www.unep.org/Docu-ments/Default.asp?DocumentID=52&ArticleID=49
[9] Environmental protection law of the People’s Republicof China. May 2004. See also: http://www.zhb.gov.cn/epi-sepa/zcfg/w1/w8.htm (in Chinese)
[10] Cleaner production promotion law. See also: http://www.chinacp.org.cn/eng/cppolicystrategy/cp_law2002.html
[11] The World Bank. China: Air, land and water – environ-mental priorities for a new millennium, 2001
[12] Hubert H, Tanja M, et al. European Union environmentpolicy and new forms of governance. Ashgate PublishingLimited; 2001
[13] Lampton David M. The implementation problem inPost-Mao China. University of California Press; 1987
[14] Barbara J S. Implementing environmental policy in China.Praeger Pulishers; 1995
[15] ISO14000 and China, Oct 1996. See also: http://www.iisd.org/pdf/isochina.pdf
[16] State Environmental Protection Administration of China.See also: http://www.sepa.gov.cn/650219308009390080/650219308009390080_1.shtml (in Chinese)
[17] Wilson W. The study of administration. In: J. Shafritz &A. C. Hyde. Classics of Public Administration. PacificGrove, California: Brooks Cole, 1992. p. 11-24
[18] Pinchot G. Breaking new ground. Seattle: University ofWashington Press; 1967
[19] John Freemuth. Biocentric public administration: justanother wolf in sheep’s clothing? Administrative Theory& Praxis 2001; 23(1):53-66
[20] Emily E. Mcmillan, Tarah Wright, et al. Impact of auniversity-level environmental studies class on students’values. The Journal of Environmental Education 2004;35(3): 19-27
[21] Chan Ricky YK, Lau Lorrett BY. The effectiveness ofenvironmental claims among Chinese consumers: influ-ences of claim type, country disposition and ecocentricorientation. Journal of Marketing Management 2004;20: 273-319
[22] Liu YW. Green marketing: a new marketing era forChina in the coming century. Paper Presented at the10th Annual Academic Conference of the Chinese Mar-keting Association of Colleges and Universities, Shanghai,China, July 1994 (in Chinese)
[23] Pentreath RJ. Ethics, genetics and dynamics: an emerg-ing systematic approach to radiation protection of theenvironment. Journal of Environmental Radioactivity2004; 74: 19-30
Ecological Economy (2006)2:203-208
Analysis
* Corresponding author. E-mail address: [email protected]: Jiang Minjin (1964- ), male, PhD of Beijing ForestUniversity, associate professor of Jiangxi University of Fi-nance and Economics, specialized in ecological economyand management.
Culture phenomenon analysis on theforest tour activity of China
Jiang Minjin1, 2*1. College of Economics and Management, Beijing Forest University, Beijing 100083, P. R. China
2. College of Resources & Environmental Management, Jiangxi University of Finance and Economics,Nanchang 330032, P. R. China
Received Oct.14, 2005; Accepted Jan.23, 2006
Abstract: This paper analyzes culture and forest culture, the intension of culture and forest culture, combines theunderstanding of the main cultural factor with the forest tour activity of China, analyzes the compatible phenomenon ofChinese forest culture and traditional culture, and explores culture of forest tourist site containing the meaning in foresttour. The author thinks the tour of forest culture which will be the important component of forest tour in forest culture.This paper puts forward simple questions existing in exploitation and advantage of forest tour culture, and proposessome countermeasures.Keywords: Forest tour; China; Culture; Forest culture; Tour culture
1. Introduction
The forest tour is the mankind’s returning to theforest and nature and the mankind’s aesthetic emo-tion of the forest. Our country is still relatively defi-cient in the culture phenomenon of forest tour thatis studied at present. This paper tries to analyze thecultural factors of the forest tourist activity in termsof culture.
1.1 Culture connotation
In Chinese “Wen” means a variety of laminationthat is interlock, and “Hua” means that changes eas-ily or brings good fortune. It is one word commonlyused now. It was used for the first time when a Japa-nese scholar was translating the western vocabulary.It can be stemmed from 2000 BC as “easy in week”:“watch astronomy in order to change whileexamining; watch humanity in order to be melted allday long”. The source of the word, “kultur” in Ger-man or “culture” in English, is “culture” in Latin; its
original meaning was the land and the crop wascultivated. Human cultivation is mankind’s purpose-ful activity of transforming of natural world to theoutside, symbolizing human civilization life. With thedevelopment of human civilization, ancientwesterners began understanding mankind himself.The meaning of “culture” changed, circulated suchcontents as “training, educating, developing,respecting”, etc. On the basis of original meaning,westerners make “culture” possess double meanings.First, people cultivate on land to become the exter-nal natural person. Second, people have the idealcitizen’s quality in the course of education and train-ing to become the inherent natural person. Thedouble meanings of this kind of culture are exactlythe original intention of “culture” in the modernmeaning. In 1871, Taylor, cultural scientist of Britain,defined that culture “includes knowledge, faith, art,morals, law, custom, anything as a social ability andhabit that member can obtain” [1]. Therefore, the keyquestion of culture is the people who can createculture. Culture is the embodiment of human intelli-gence and creativity, different races and nationali-ties have created different cultures. People not onlycreated and enjoyed cultures but also restrainedcultures at the same time, but finally developed cul-
Jiang M. J. / Ecological Economy (2006)2:203-208
tures constantly. Ancient mountains, rivers, grassor trees are not culture, but garden and tourist land-scape are culture; the animals in the ocean are notculture, but the aquarium and the dolphin and theseal that are trained by people and can give a perfor-mance reflect culture.
1.2 Tour culture connotation
Every mankind’s cultural phenomon is formedand thetic course even more, and forest tourist ac-tivity is also like this tour. We think forest tour cul-ture should mainly include the forest culture andhumanities landscapes culture.
3.1 The forest visual beauty
Tour is a kind of aesthetic and a culturalphenomenon. The forest visual beauty has reflectedthe visual culture of the forest. Forest reflects aes-thetic value of people. There are two sides of basicattributes of forest: natural attribute and socialattribute. The former refers to the materiality withaesthetics of forest; it is objective. The latter refersto human subjective consciousness. Natural at-tribute is the foundation of beauty; social attributeis emergence and expression of beauty. It is “per-sonification” of the forest that the forest is beautiful.Then, how was “personification” carried on? Na-ture is branded by mankind activities. It enablespeople to strength the visual creativity. Naturalthings are given by human practice and displayedby people changing nature at first. Obtain beautifulfeeling because of showing people’s greatness. It isstronger and stronger that mankind arranges natu-ral ability; the range is wider and wider. Therefore,appreciation of the surface is wider and wider; themore the aesthetic target expands, the more relate tonatural things and the sense is strengthened day byday. The natural thing is regarded as mankind’samiable and near living environment, which hasmeaning of “personification” and aesthetic value.
The visual beauty of forest is still reflected bybio-diversities. The varieties of plants or vegetationsare the most attractive factors in the beauty of forest
ecology. There can be different beauty because ofdifferent types of plants. The pine and cypress isevergreen and proud in snow and wind; the big ban-yan is tall, big and straight with dense shade, whichis the only wood growing in the forest, magical toshow a magnificent scenery; the weeping willow isgraceful, wisps of gentle silks; lots of flowers ofChinese scholar trees wrap the body with a burst offragrance. In one year, various kinds of plants dem-onstrate different American qualities of beauty. Peachin spring, lotus in summer, chrysanthemum inautumn, plum in winter decorate the world with beau-tiful flowers. The arbor is tall and straight, the bushhangs down suitably, attracting people by differentshapes. Various plants and vegetations of differentkinds and areas also interact. From head to foot un-even collocate well-balanced; the color is matched,the posture is looked after. It can increase its visualand aesthetic feeling. Ecosystem of various animalsis also a kind of unique forest and tourist resource.For instance, beautiful scenery “wind blow grass toshow cattle and sheep” that people sing the praises,will produce very unique aesthetic feeling.
People always live in certain environment, andthe environment always provides the services inmany aspects for somebody’s life; therefore, thesecan bring the safe, convenient, joyful things to some-body and become the thing that people depend on.The characters of the beautiful one, which wasbrought to tourists, is not merely tourist resources,but cultivates aesthetic values of person with cer-tain cultural charm.
The life of people can reflect human’s ideal andemotion. Regard all sorts of attributes of the naturalthing as the symbol of people or the mankind life;signify directly and indirectly two kinds of symbols.Persons who symbolize directly, for instant the fu-ture and light with the bright color of the sun. Withthe sparkling and crystal-clear ice crystal. The per-sons who signify indirectly like injecting the emo-tion and love into something else. For example,people say the Yellow River is a mother river of Chi-nese nation, injecting the emotion and love into theYellow River. Niulang and Zhinv’s beautiful legendmake starry sky more beautiful and Guilin Seven Star
Jiang M. J. / Ecological Economy (2006)2:203-208
Rock scenery and the Milky Way of Magpie Bridgemore pleasant. Chinese like 4 kinds of outstandingcharac te r s : p lum, o rch id , bamboo, andchrysanthemum, and call them “four gentlemen”,which has increased the beauty of plum, orchid,bamboo, chrysanthemum, and sung the praises ofthe noble character that the mankind advocates too.Proud wind and snow of plum defy severely cold;orchid delicate fragrance stay alone; chrysanthemumput radiant splendor alone autumn to the limit toturn on all sorts of flowers; and bamboo peacefulbend curved natural attribute. Poets personate themwith high personification. The lotus is not onlybeautiful, but refers to the people who are honestand unselfish for its natural attribute, compared withcharacter that the common custom associated withan evil person. Zhou Dunyi in Song Dynasty wrotea poem Lotus Love: I like lotus to produce silt thandying and wash the clear water without goblin. Thethree kinds of ways are a kind of higher beautifulrealm and distillation. Therefore, it is not merely natu-ral thing itself that the natural tourist resourcesspread out before tourist, but it is nature of culturalsense sheer. This is beauty of natural touristresources, which is the forest tourists pursue too.
3.2 Forest humanities landscape
Forest tourist considers natural forest as the core,but forest tour in China has a peculiar phenomenon,which coexist often forest view and traditional cul-tural landscape among the tourist zone in forest. Ac-cording to statistics, the traditional view and forestview mostly coexist with in major scenic spot of For-est Park of Fujian Province and in other provinces,such as Henan, Anhui etc. Chen Xinfeng and WangYan have talked about [7]: “The rest district of thetour around forest often has abundant culturalintension, which other countries can’t obtain. “Theso-called cultural intension here means traditionalculture, namely within the range of tourist zone offorest, exist temple, Taoist temple, some famous his-toric sites etc. The culture make history and cultureincorporate forest tour with the culture by oneunique form to coexist and become a factor of mak-
ing up of forest tour of culture.China’s forest tour culture should be the blend-
ing of traditional culture and modern civilization.Traditional national culture is influencing the foresttour as a kind of view factor of forest tour, makes theforest tour take the unique China flavor, embodiescivilization deep inside information and nationalunique aesthetic psychology for 5,000 years. On theother hand, as cultural tradition, influence of history,this national cultural psychology is driving and in-fluencing tourists to realize the information of his-tory and culture in the course of forest tour, modernexplanation to forest and history with modern civili-zation to construct modern forest tour culture.
Traditional culture is a core of the tour culture ofour country, and the backing that we develop tour-ist industry, the abundant human culture tourist re-sources in our country are their forms of expressionof material. Chinese cultural idea and aesthetic tem-perament and interest, fully reflect through poems,paintings, buildings, gardens etc. Someone dividesit into[8]: Tour history and culture, tour buildingculture, tour literature and art, tour amusementculture, tour religious culture, folk culture of the tour,etc. We think the human culture tourist resources inthe forest tour should also include ecological culture.It integrates aesthetic, ecology, forest visual beautyand human social beauty integrative tour culturalform[9].
3.2.1 Religious temple cultureNatural worships from the primitive mountains
and rivers has already been in the view of realizing“harmony between man and nature”, having pro-duced the religious system of polytheism too, andthe indigenous Chinese spirit (the God of mountain,the God of Wealth, the God of sea, God of s riveretc.) worships with the outside foreign spirit(Buddha) that introduces at the same time, therefore,has brought up the abundant human cultural views.Among them, it is the most brilliant and grandestthat regard Buddhism temple as a kind of touristresources with very deep cultural intension. Theplace that the religious temple choose beautiful scen-ery and geological ground form to be unique more is
built, so there is a saying “the monk takes more thefamous mountain all over the world”. In fact, monkand mountain to mutually promote honor revitalizealtogether, so-called “mountain high, there are ce-lestial being’s then names; water is not deep, dragonis efficacious”. Bring out the best in each other inthe famous mountain and famous temple. Four ma-jor Buddhism Holy Land of our country are MountWutai, Mount Emei, Jiuhuashan, and Putuoshan. Thegreat and bright beauty and the temple on the moun-tain become human tourist resources become hu-man tourist resources. Mount Qingcheng, MountWudang etc. are yearned for by people becauseTaoism’s culture and bright forest view assemble inone place.
The viewing and admiration of religion templetype tourist resources should include two respectsat least: First, appreciate beautifully, a lot of ancientand well-known trees are preserved in these ancient
temple of names are stopped in its forest view. Theperipheral mountains and rivers terrain of the temple,not only beautiful, but also characteristic, especiallyaccord with a certain culture and ideology. Second,appreciate its cultural intension. Confucianism,Buddhism, Taoism merge into each other to form thecultural intension of China together; therefore, thetemple tourist resources are the place where the east-ern culture assembles. Understanding certainlyabout such cultural intension can experience the civi-lized extensive knowledge and profound scholarshipfor 5,000 years and obtain beautiful enjoyment.
3.2.2 Human trace tourist resourcesMaking a general survey of famous mountains
and great rivers of China, we find that the civilizedone formed through thousands year, and is alreadyintegrated with humane accumulation closely. No oneis able to separate the natural landscape from culture.
Jiang M. J. / Ecological Economy (2006)2:203-208
Chinese Five Mountains are famous all over the worldbecause the emperor offers sacrifices to Heaven much,wonderful and incomparable things, and the men ofliterature and writing climb and compose chanting,and the exquisite building of hall of the temple andmysterious legend story appear vividly skilledly inmuch less four major Foshan too, it is famous withstrange and the scenery definitely, that is MountHuang, Mount Lushan, Yandang mountain, Tianmumountain, Wuyi Mountain,etc. These world famousmountains have a long history and generous culturalinformation[10].
Those dilapidated walls having experiencedmany vicissitudes of life and the outmoded palacetemple that peeled off and withered millennium an-cient tree, even desolate fatherless tomb incom-plete and tablet that grass bury, have one solemnand stirring historical play; it had once had brilliantpeaks, and have nowadays already stopped fight-ing cease to criticize. It makes people thinking, tourge people to wake up suddenly; the benevolenceperson sees benevolence, the wise see intelligently.The trace is the witness of history, and a civilizedsymbol too.
The beauty of the trace lies in its historicalauthenticity. The forest tour is a kind of responsibletour, because the trace is non-renewable, should putand protect it in the position of having priority, theperipheral relevant areas of the trace often also haveimportant historical value, therefore it should noticethe trace protecting to offer as a gift in planning andconstruction, protect its integral and culturalintension. The trace protects them from resent de-stroying and prevents carrying on the trace to im-prove according to modern idea; the trace is pro-tected to resent the mixed genuine with the spuriouseven more, the trace is the destruction to real traceto make the fake. It should avoid the consequenceto cause “false to is it come very false also really todo”. In addition, it is also a kind of culture resourcewhich attracts tourists that local folk culture etc. forthose tours.
4. Forests tour culture development questions andthe countermeasure
4.1 Questions of development of forest tour cultureresource
Forest traveling is the main eco-tourism form.The forest and the nature, the cultural environmentare its traveling resources foundation; inevitably ithas to its environment and the ecology highrequests. However, in reality activity, the tourism“the subject question” but voluntarily has not beensolved to environment this along with the forest trav-eling development. The forest traveling by no meansstarts protects the forest ecology. On the contrary,the forest traveling appearance and the forest eco-logical environment are destructed to have the di-rect relations. For example, the unreasonable travel-ing plan layout and the tourist facility constructiondestroyed has moved, plant’s habitat; sanitarysewage, transportation vehicle, excessively manyactivities and facility, creates the water body, theair, the noise as well as the vision pollution to theenvironment; infinite measures land the receptiontourist, blind expanded traveling scale facility, doesnot hesitate for the temporary economic to destroythe nature, the humanities landscape and so on.Obstensibly, these problems are the results oftechnology, economy and management. In essence,they are because of the people’s lack of essentialenvironment morals consciousness, the ecology pro-tection sense of responsibility[11], the ecology pro-tection culture idea. One side the people thought“the tourism is the tourism”, “the traveling is thelabor-intensive form industry which the lowinvestment, high delivers”, “the eco-tourism re-sources are renewable”, “since the eco-tourism isprotects the nature - development bring the envi-ronment the non-pollution. People may feel relievedboldly, need not to have scruple. These one-sidedunderstanding, finally causes the traveling and theecological environment contradictory intensification,which has both brought the huge influence and thedestruction for both sides[12].
4.2 Countermeasures of development
Phenomenon of management of plunders the re-
Jiang M. J. / Ecological Economy (2006)2:203-208
sources to occur in forests tour sometimes, posed theserious threat to the forest culture scenic resources.Therefore, we must achieve to the forest scenic re-sources development.
(1) Science planAvoid being eager for quick success and immedi-
ate gain; do not give a thought to the long-term ecol-ogy benefit and the social efficiency; do not carry onthe science plan but blindly to start but destroy thenatural resource because of the capital constructionthe phenomenon.
(2) Considers the environmental capacityEach forest park all has its certain environmental
capacity; surpasses this threshold value to be able tocreate to the resources destruction; such is fullyoccupied, trash everywhere as the pollution, the de-struction environment and so on.
(3) Improves human’s qualityFirst is to manage the service personnel who lack
the experience and the technology. Next is the partialtourists quality excessively is low. Cultural educationand moral level error, which causes everywhere tothrow the reject in tourist area. The serious pollutiondestroyed the environment.
5. Summary
We think the forest tour is tours of a kind of highrealm, which have abundant cultural intension. Thefinal purpose of the forest tourist activity is to makesense joyful. The so-called aesthetic feeling isroughly the same with the joyful sense of forest tour.The famous scholar Mr. Ye Lang says: “Tour, inessence, is a kind of aesthetic activity. If it isn’taesthetic, what does tour discuss? Tour involves allaesthetic fields to combine each other again.” Nomatter that kind of tour, all seek beautiful enjoyment
Jiang M. J. / Ecological Economy (2006)2:203-208
References
[1] Edward Taylor. Primitive culture. Shanghai: ShanghaiLiterary Arts Publishing House;1992
[2] Robert Macintosh, Kent Potter. Traveling study: essen-tial factor, practice, basic principle. Shanghai: ShanghaiCulture Publishing House; 1985, Chapter 2
[3] Xie Guian, Hua Guoliang. Science of culture of the tour.Beijing: Higher Education Press; 1999: 13
[4] Ma Bo. Science of culture of modern tour. Qingdao:Qingdao Press; 2001
[6] Zheng Xiaoxian. Forest culture, forest aesthetics andforest management and administration. Journal of BeijingForestry University 2001; 2: 93-95
[7] Chen Xinfeng, Wang Yan. Forest industry developmentreviewed. World Forestry Studies 1996; 6: 32-37
[8] Wang Mingxuan, Hu Dingpeng. Chinese tour culture.Zhejiang University Press; 1998
[9] Mao Wenyong. Influence appraisal. Centre of Assessesin Environmental Project of Environmental Protec-tion Head Bureau of China; 2001
[10] He Xiaoting. Two questions of historical narrative ofChinese tour. Journal of Travel 1988; 3 (3): 61- 62
[11] Huang Zhenfang. About tourism sustainable develop-ment environment ethics ponder. Journal of Travel2001; 16 (2): 68-71
[12] Yang Guihua, Zhong Linsheng, Ming Qingzhong. Eco-tourism. Beijing: Higher Education Press; 2000
in constant activity in order to make the body andmind joyful, cultivate people’s taste and add theenjoyment of life. Establishment of ecological envi-ronmental protection, scientific and reasonable de-velopment and utilization of resources become thestarting point and home point of forest tour. It is thekey intension of the forest tour culture[12].
Analysis
*Corresponding author. E-mail address: [email protected]:Luo Dan (1981-), female, postgraduate of Collegeof Economics and Management, Huazhong AgriculturalUniversity, specialized in cross-cultural management.
Study on Chinese enterprises’ internationalizationmode and strategy
Luo Dan *, Wu ChunmeiCollege of Economics and Management, Huazhong Agricultural University, Wuhan 430070, P. R. China
Received Nov.18, 2005; Accepted Feb.13, 2006Abstract: With the trend of world economic globalization, the enterprises must be influenced by the economic globalization.At the same time, Chinese economy has developed fast and entered WTO. There are opportunities as well as challengesfor Chinese enterprises; internationalization is the trend for Chinese enterprises to get more chances to develop. HowChinese enterprises take the multinational operation is a hot topic for both Chinese enterprise sector and academe sector,as well as for the government and all the Chinese people. This paper firstly reviews the multinational operation theoriesand thoughts of scholars from home and abroad, and describes the necessity for Chinese enterprises to take internation-alization road. Combined with the status quo and characteristics of Chinese enterprises’ internationalization, it con-cludes four modes available for Chinese enterprises: low-cost expansion, mergers and acquisitions, OBM and OEM,and analyzes four modes. Finally, it proposes some suggestions and countermeasures from the aspects of enterprisesand government according to the problems in the process of Chinese enterprises’ internationalization.Keywords: Internationalization operation; Chinese enterprises; Core competence
1. Introduction
Enterprise internationalization means that enter-prises take the production, operation, investmentactivities internationally and actively participate ininternational competition. In the world economicglobalization, enterprises cannot avoid having rela-tionship with the world economy, including Chineseenterprises. Therefore, this paper starts from theanalysis on the internationalization theory and ex-plains the status quo of Chinese enterprises, thecharacteristics and necessity of the Chinese enter-prises’ internationalization, as well as the problemsexisting in its developing process. Finally, it con-cludes some strategic suggestions for our Chineseenterprises’ internationalization.
Enterprises’ internationalization can be datedfrom charted company in Britain in the late 16th cen-tury and the early 17th century. French Bayer Chemi-cal Company started multi-national business, andthen in the 1920’s many companies, such as Switzer-land Nestle Company, Ford Company, GE
Corporation, Shell Company, etc. began overseainvestment.
As the internationalization becomes more andmore popular, people attach great importance to howto realize the internationalization and achieve thegoal of enterprises’ internationalization. Many re-searchers and scholars have made great efforts onthese problems. Stephen H. Hymer put forward themonopolistic advantage theory and he pointed outAmerican large-sized enterprises can take the ad-vantage of the technology and scale to oversea in-vest directly[1]. Then many theories appear basedon his theory, for instance core-asset theories,oligopolistic reaction theory proposed by FrederickT. Knickerbocker, etc.[2] In 1966, Raymond Vernon,Professor of Harvard University, indicated that thereason, opportunity and area choosing of Americanenterprises’ oversea direct investment in accordancewith the product life circle[3]. Peter J. Buckley andMark Casson mentioned the internalization theoryto explain the motivation of the oversea direct in-vestment from the relationship between the externalmarket and internal resource distribution[4]. ThenJohn H. Dunning put forward the eclectic theory ofinternational production in his Trade Location of
Ecological Economy (2006)2:209-216
Economic Activities and the MNE: a Search for anEclectic Approach[5]. The core of the theory is thatenterprises’ internationalization operation is the re-sult of ownership specific advantage, internationaladvantage and location specific advantage. It inte-grates the advantages of different schools, but itignores the influence of social, political and eco-nomical environment on enterprises’ operationbehaviors. Japanese scholar K. Kojima mentionedthe theory of comparative advantage in his worksDirect Foreign Investment and made a new explana-tion on the FDI behaviors and rules according toJapanese enterprises’ oversea investment experience[6].
In China, many scholars have made research onthis field. Xiao Xuefang discussed that OEM modewas one of the good ways for Chinese enterprisesto take internationalization operation[7]. He thoughtthere were both opportunities and challenges exist-ing in the process of internationalization operation.Si Yan indicated that in the internationalization op-eration different enterprises can choose the propermodes according to their realities[8]. Guo Jing andZhang Yachun pointed out the rational choice forour Chinese enterprises’ internationalization opera-tion[9]. Xu Yongshuai proposed that Chinese enter-prises should establish their original brand and im-prove the popularity of the brand in the internationalmarket[10]. Zhang Xiao and Yang Zhong suggestedthat Chinese enterprises’ internationalization couldlearn from Japan and Korea [11].
2. Analysis on modes of Chinese enterprises’ in-ternationalization operation
With the entry into WTO, China has strength-ened national power and the Chinese enterpriseshave been more competitive in business competition;internationalization is inevitable for the enterprisesto develop international market. Many enterpriseshave set up good examples, such as Haier’s abroadbusiness, mergence of German Schneider-electricCompany into TCL, Galanz microwave internation-ally well-known as No.1 OEM manufacturer. Differ-ent operating modes are adopted by the enterprises
according to their realities.According to Mc Kinsey, there are about four
modes adopted by Chinese enterprises to realize in-ternationalization recently.
2.1 Low-cost expansion
Low-cost expansion is to put all the resources ofthe enterprises into manufacture and sales of a cer-tain product, which can obtain the price advantagesand force the competitors to retreat from the marketto enlarge its own market shares. China InternationalMarine Containers (Group) Co., Ltd. has taken theroad of low-cost expansion. Through integrating thehome market, they’ve got cost advantages in stock,manufacture and transportation; then they make useof this advantage to integrate the whole industry toimprove its core competence and achieve its inter-nationalization target. It has occupied about 46% ofglobal market share in this industry.
Low-cost expansion is one of the easiest waysfor Chinese enterprises in the short run. It can makefull use of the unused capital in the society andquickly expand the production scale. But if the en-terprises reduce the price but not the cost, it willbring the enterprises troubles not profits. And evenif the low-cost expansion can bring revenues to theenterprises, there may exist some antidumpingincidents, such as Wenzhou Shoe Incident inSpanish. So in the long time, low-cost expansion isnot the proper way for internationalization operation.
2.2 Mergers and acquisitions
Generally speaking, the MNCs operation can bedivided into two kinds: entering the foreign marketmode and enterprises’ international corporation. Thefirst mode mainly includes mergers and acquisitions;the latter mode is to set up enterprise strategicalliance. Through M and A the enterprises can enterthe target market very quickly by existing equipment,management and technology personnel to set upoversea basis and occupy the market share. Besides,it can help enterprises get the operation resourcesin the market and because it isn’t involved into the
Luo D., Wu C. M. / Ecological Economy (2006)2:209-216
market redistribution, so the market competition isnot so fierce. It is one of the important ways for theMNCs to take the international direct investmentand enter the international market.
In the decade, M and A has been the main modeto run the mutli-national capitals. And recently manyChinese enterprises have taken this method as theirway to internationalization. For instance, TCLmergered Alcatel Mobile Phones into TCL andAlcatel Phone Limited (TAMP); Lenovo has boughtIBM PC operation, etc. Before the M and A, the en-terprise should consider the brand integration,technology, entry barrier to the local market, andculture factors. If they can’t well control the cost,they will be lost in the M and A process. Even worse,it would have a negative influence on the wholeoperation. So M and A is a method of both with riskand opportunity, and the enterprises adopting thismethod should take all the factors into consideration.
2.3 OBM (original brand manufacturing)
OBM means that the enterprises establish theiroriginal brands in the international market. Brand isthe important factor in the international market. Inthe past decades, many giant enterprises in Japanand Korea have succeeded in internationalizationoperation by this method, such as Panasonic, Sony,Hyundai, Samsung, etc. But at that time, the manu-facture in Europe and USA hasn’t taken the globalexpansion. Till now, many MNCs have taken mutli-production, and their cost is even lower than that ofChinese enterprises. So it is difficult for Chineseenterprises to adopt OBM in the process ofinternationalization.
But Haier has set a successful example for theChinese enterprises to adopt internationalizationoperation. Haier has paid attention to the qualityand technology, and since 1985, it has brought intohigh technology and advanced managementexperience. On the basis of these technology andmanagement experience, it made some innovationand creation. Haier strengthened the product qual-ity management, and regarded quality as the lifeline,so it can attract many foreign customers and obtain
high customer loyalty, which contributes to the riseof the brand. In 2004, the turnover of Haier hasreached to 101.6 billion RMB, rising by 68% com-pared with 1984. Now Haier is a well-known brand inthe international market. But to many enterprises,OBM is still a difficult choice, and it needs a longroad for them to take this mode.
2.4 OEM (original equipment manufacturing)
OEM means that an enterprise provides the prod-ucts or accessories ordered by other enterprises.Application of OEM must afford the costs of thematerial and conversion and avoid the risks of de-vice depreciation, production management. It canimprove the enterprises’ operation and managementability, and strengthen the competence and makeprofits by the brand effect and marketing network.
Galanz is the successful in applying OEM to re-alize its internationalization. In 1992, Galanz turnedto the microwave production; till 1999, it occupied67.1% of home market share; in 2001, its microwavesales amount reached to 12 million, seized about 75%of home market share, 35% of international marketshare. Different from Haier, Galanz focused on themicrowave production, fully exerted the professionaladvantages to form the scale effect, and set up about48 advanced product lines.
On one hand, OEM can provide great opportu-nities for the enterprises which haven’t got the ab-solute advantages in technology, scale, capital, andbrand effect etc., and they can use their comparativeadvantages to gain the international market share.On the other hand, Chinese enterprises are also con-fronted with great challenges. OEM can make theenterprises lack resources to develop their originalbrand, just focusing on the foreign brands. While inthe product value chain, manufacturing gets the leastprofits. Secondly, Chinese enterprises cannot getthe core technology through OEM, on the contrast,OEM can strengthen the foreign brands’ corecompetence, which makes the competition betweenthe own brands and foreign brands much heavier.At the same time, OEM mode has certain risk for theexport-oriented economic growth mode is not
Luo D., Wu C. M. / Ecological Economy (2006)2:209-216
omnipotent. It too much relies on the foreign marketand technology. So we have to combine OEM andOBM together, OEM is of necessity for theenterprises, but the final goal is to establish theirown brand, and make it more strong and perfect.
3. Status quo of Chinese enterprises’ internation-alization operation
3.1 Characteristics of Chinese enterprises’ inter-nationalization operation
Internationalization is bi-directional, includingexport-oriented side and internal-oriented one. Ex-port-oriented side involves using product export,investment abroad, licensing, and joint venture, andinternational strategic alliance etc. to enter the market,while internal-oriented one emphasizes the forms
such as import, bringing in the advanced technology,branching as the foreign companies etc.
Now in China, the characteristics can be con-cluded as follows:
In the aspect of export-oriented side, the prod-uct structure has been gradually reasonable and ex-port amount rapidly increases in China. In 2004, thetotal export amounted to 4643.58 billion RMB, andprocessing trade has developed fast in the export.The investment abroad enterprises are trade-oriented, with less oversea manufacturing bases. Inthe beginning, the invested areas were rather inten-sive in Southeast Asia, Hong Kong, Macao etc., andthen it reached many other developing countries bythe relationship of economics, technology and cul-ture in the history. Since 1990s, Chinese enterprisesinvested in developed countries, such as European,and America, etc. With the development of oversea
Table 1Oversea direct investment by sector (non-financial) (US$ 10,000)
Section 2003 2004
Agriculture, Forestry, Animal Husbandry and Fishing 8,136 28,866
Mining 137,866 180,021
Manufacturing 62,404 75,555
Production and Distribution of Electricity, Gas and Water 2,196 7,849
Construction 2,278 4,795
Transport, Storage and Post 7,721 82,866
Information Transmission, Computer Services and Software 883 3,050
Wholesale and Retail Trade 35,724 79,969
Hotel and Restaurants 85 203
Real Estate -1298 851
Leasing and Business Services 27,878 74,931
Scientific Research, Technical Service and Geologic Prospecting 638 1,806
Management of Water Conservancy, Environment and Public Facilities 634 120
Services to Households and Other Services 210 8814
Health, Social Security and Social Welfare 11 1
Culture, Sports and Entertainment 100 98
Public Management and Social Organization 5
Total 285,465 549,799
Luo D., Wu C. M. / Ecological Economy (2006)2:209-216
investment, its investment sectors are fromagriculture, forestry, mining, manufacturing, andconstruction to services, households and otherservices, to public management and socialorganization. We can see the oversea direct invest-ment from year 2003 to 2004 in Table 1. Many overseainvestment projects always focus on resource-de-veloped enterprises; furthermore, compared withEuropean countries and American enterprises, theinvestment scale is rather small and backward intechnology. Besides, due to the special status quoof China, most enterprises start their international-ization by joint venture.
In the aspect of internal-oriented side, the multi-national companies emphasize on the optimizationof industry value chain to get the highest revenue inthe manufacturing and operating process. Under thiscircumstance, many enterprises provide the OEM tothe MNCs, and simultaneously we can introducethe new technology.
3.2 Necessity for Chinese enterprises’ internation-alization operation
3.2.1 Inevitable trend of market economyAfter the reform and opening-up economy con-
tributes to clarify the international division and makesthe resources well distributed. Especially after 1960’sand 1970’s, international trade and direct investmentsharply increased and the MNCs was popular allover the world, which happened in not only the de-veloped countries but also the developing ones. WithChina’s entry to WTO, Chinese enterprises are fac-ing heavy pressure . I f they don’ t t akeinternationalization, they will fail in the home andabroad market.
3.2.2 To avoid the trade walls on ChinaRecently the export is mainly labor-intensive
products exporting to several markets, which is eas-ily brought trade wall to these goods. Besides, be-cause the cost and price of exported goods is ratherlow, the developed countries take the anti-dumpingsanction on the goods. Therefore, Chinese enter-prises take internationalization to set up new enter-
prises in the third countries to avoid these kinds ofwalls to occupy more international market.
3.2.3 International financing and management im-provement
Internationalization is a good way for manyenterprises, especially for the hi-tech ones to ab-sorb capitals in the world market. Furthermore, theenterprises can learn the advanced managementthoughts and methods to help the management pro-cess of their own enterprises.
3.2.4 Chinese enterprises internationalization canalso get more resources
In the future international competence, resourcesis the focus, while the utmost use of the natural re-sources is the utmost pursuit of the revenue. Sointernationalization is one of the best ways for Chi-nese enterprises to get natural resources.
3.3 Problems in the road for Chinese enterprises tointernationalization operation
It is necessary for Chinese enterprises to takeinternationalization, but in the road of international-ization there are many difficulties which will be thebottleneck of the development of the Chineseenterprises.
3.3.1 Problems of technology and brandAs far as the technology is concerned, although
China has made great progress in the technology,there are some gap in the hi-tech and manufacturingfields between China and the western developedcountries. Technology is one of the elements for theenterprises to foster their core competence. Accord-ing to Dunning, monopoly technology is the premiseof the oversea direct investment, so it is difficult forChinese enterprises to set up oversea enterprisesby technology advantages.
Many foreign consumers think that “made inChina” means cheap and inferior goods, which hasgreatly affected the oversea market shares occupa-tion of the Chinese goods. Because of the informa-tion asymmetry, many Chinese products in the in-
Luo D., Wu C. M. / Ecological Economy (2006)2:209-216
ternational market cannot get the advantage ofbrand.
3.3.2 Conservative investment and blind investmentproblems
Multi-national business needs cautious consid-eration and decision. From the enterprises’ the sta-tus quos, many enterprises don’t take the overseainvestment with restriction by human capitals,resources; on the other hand, there exist many en-terprises taking going-out plan and blindly invest-ing without scientific strategies and analysis. Theretwo ways are wasting the resources and low effi-ciency about the resource distribution.
3.3.3 Organization management problemEnterprise internationalization business is the
competition among the enterprises, whose essenceis the competition of the personnel. It is importantfor enterprises to train personnel who are familiarwith international routines and market environmentand can well manage the enterprises. At present, thestaffs are not qualified with their jobs, for they haven’tgot enough knowledge about international trade, law,even the languages, which bring obstacles tointernationalization. On the other hand, due to thecultural differences of different countries, it can causecultural conflicts in the co-working of staffs fromdifferent places. If the conflict cannot be well solved,it can decrease the efficiency of the cooperation ofthe staffs.
3.3.4 Failure to choose proper partnerBefore taking joint venture measure, the Chinese
enterprises have not made a good analysis aboutthemselves on technology, human resources, prod-uct resources and management experiences. In theprocess of joint venture, they seldom make goodanalysis about the cooperating partners before mak-ing final decisions. So the two sides make the failureof the cooperation.
4. Strategies
Although China has practiced taking the road of
internationalization for a long time, the real interna-tionalization business needs perfecting and there isstill a long road for Chinese enterprises. Entry intoWTO provides good international environments forChinese enterprises’ internationalization. But at thesame time, it forces them to take this measure. Thecompetitive environment of market economy in Chinahasn’t been perfect enough, and the enterprises lackgood strategies and they aren’t good at making be-forehand analysis, so they can’t well know the tar-get enterprises. Besides, cultural difference is a bigproblem. If different cultures can’t be well integrated,it will bring home enterprises home and abroadconflicts. To solve these problems, this paper makessome suggestions from the aspects of enterprise andgovernment.
4.1 Strategy analysis on speeding up Chinese en-terprises’ internationalization
4.1.1 Foster sense of transnational investmentAs China is a developing country, technologies
are comparatively backward. However, according toDunning’s theory, we can make use of the compara-tive advantages, such as advantages in textile, lightindustry, chemical industry, electric machine,medicine, etc. We still have the advantage to takegoing-out strategy. Enterprises should foster thesense of internationalization, and consider the pos-sibility to have transnational operation to expandthe enterprises’ development.
4.1.2 Strengthen their core competenceThe final competitiveness for an enterprise in-
cludes the advantages of cost, product and brand,which help enterprises expand their businesses ininternational market and contributes to theirinternationalization. The enterprises can exert theircomparative advantages to strengthen their corecompetence. Furthermore, they can take measuresto the corporate governance in the transnationaloperation. They should reform the structure of theenterprises, and make the whole enterprises workefficiently.
Besides, the enterprises can learn successful ex-
Luo D., Wu C. M. / Ecological Economy (2006)2:209-216
perience and management mechanism from foreigncompanies and combine them with our ownsituations, which can help the enterprises go on thenormal track of the operation as soon as possible.
4.1.3 Have clear target when taking oversea in-vestment
The transnational operation is a long-term stra-tegic oversea investment, which requires that theenterprises have clear target and get the detailedinformation about the target as well as themselves.If they have chosen a target enterprise, they shouldfirstly well know the enterprise, the local laws,customs, government management mechanism andculture, which are all important factors for enterprises’development in foreign countries. These factors canplay an important role in the transnational operation.If they cannot be well understood, it can cause con-flicts in the process of the business, and some can-not be well dealt with, they will block the develop-ment of enterprises’ internationalization operation.Therefore, it is necessary to well understand them.
Besides, before taking going-out strategy, they
have to make an analysis on themselves, and knowthe technology resources, human resources, prod-uct resources and management resources. Whennecessary, turn to some famous counsel companies,do a detailed analysis about the enterprise and makeappropriate long-term decisions.
4.1.4 Train internationalized personnelCurrently, the internationalized personnel are
badly needed in the process of internationalizationoperation, which now restricts the improvement oftransnational operation. To develop transnationaloperation needs the persons with the knowledgeof finance, law, accounting, advertisement,language, etc. So they should pay more attentionto the training of the persons who work for thetransnational operation. They can set up the mecha-nism of personnel, which includes international-ized course and cross-cultural training so that theycan flexibly deal with the enterprise managementproblems. They can make full use of our own Chi-nese personnel resources, as well as the targetcountries’ personnel.
Luo D., Wu C. M. / Ecological Economy (2006)2:209-216
4.2 Policy suggestions to promote Chinese enter-prises’ internationalization
4.2.1 Governments’ roleThe government is one of the key elements in
t h e p r o c e s s o f C h i n e s e e n t e r p r i s e s ’internationalization; so Chinese government shouldplay the appropriate role in the development of theChinese enterprises. The government should becomeadapted to the principles of WTO, and form the newthoughts on enterprise. In the process ofinternationalization, the enterprises keep on adjust-ing themselves to fierce competitions, and take vari-ous methods to make profits and occupy much moremarket shares. And what the government needs todo is to provide fair-competition atmosphere forenterprises, and to let them take the lead role in thecompetition. Recently there is still lack of law super-vision of the oversea direct investment. The gov-ernment should make the laws and regulations ofthe external investment and perfect the supervisedsystem to guarantee the enterprises’ regular pro-cess of internationalization.
4.2.2 Speed up the financial reform and perfect fi-nancial environment
At present, Chinese banks are still interfered bygovernment, which cannot satisfy the financial de-mand of Chinese enterprises to take transnationalbusiness. On the other side, the bad debt relation-ship between the state-owned enterprises and banksresulted in the failure for many enterprises to get thecapital. In the process of internationalization Chi-nese enterprises require capital support from thehome finance market, so it is of great necessity tospeed up the reform of financial system, the recon-struction of the bank and securities to provide goodfinancial atmosphere for enterprises.
4.2.3 Set up national innovation system From the successful experience of the developed
countries, the government should strengthen theinput in the two aspects: one is to input the infra-structure for economic development, includingtransportation, communication, and bank, finance,
Luo D., Wu C. M. / Ecological Economy (2006)2:209-216
References
[1] Stephen H. Hymer. International operation of nationalfirms: a study of direct foreign investment. 1976
[2] Frederick T. Knickerbocker. Oligopolistic reaction andthe multinational enterprise. Harvard University Press;1973
[3] Raymond Vernon. International investment and interna-tional trade in the product cycle. Journal of Economics1996
[4] Peter J Buckley and Mark Casson. The future of multina-tional enterprise. Macmillan, London, 1976; A theory ofinternational operation, North-Holland, Amsterdam, 1978
[5] John H Dunning. Globalization of business: the challengeof the 1990s. Routledge Publishing Company; 1993
[6] Kiyoshi Kojima. Direct foreign investment: a Japanesemode of multinational business operations,.1979
[7] Xiao Xuefang. OEM strategy in enterprises’ multinationaloperation. Journal of Sino-Foreign Management 2002;(2)
[8] Si Yan. OEM or OBM – Strategic choice of multinationalenterprises operation. Enterprise World 2002; (1)
[9] Guo Jing, Zhang Yachun. On rational choice of Chineseenterprises’ multinational operation mode. ProductivityResearch 2003; (6)
[10] Xu Yongshuai. Research on the existing problems anddevelopment strategies in Chinese MNCs’ operation.China Economics and Science 2005; (4)
[11] Zhang Xiao, Yang Zhong. A referred mode for Chineseenterprises – from experience of Japanese and Koreanenterprises. Modern Finance and Economics 2005; (8)
logistics, etc.; the other is to promote the develop-ment of hi-tech and research innovation. In the past20 years, we have made great progress in the firstaspect, but the development in the second aspect isfar from enough. So the government should set upand perfect the innovation and creation system tospeed up the technology transformed into the prod-uct ability.
5. ConclusionsChina is one of the biggest world-economy, and
the internationalization is of great necessity for Chi-nese enterprises. They can adopt the proper modesto realize the internationalization according to theirrealities. In the world market Chinese enterprises willflourish by the challenge of internationalization.