Circumgalactic Gas at Its Extreme: Tidal Gas Streams around the Whale GalaxyNGC 4631 Explored with HST/COS
P. Richter1 , B. Winkel2 , B. P. Wakker3 , N. M. Pingel4,5, A. J. Fox6 , G. Heald7, R. A. M. Walterbos8 , C. Fechner1,N. Ben Bekhti9, G. Gentile10, and L. Zschaechner11,12
1 Institut für Physik und Astronomie, Universität Potsdam, Karl-Liebknecht-Str. 24/25, D-14476 Golm, Germany2 Max-Planck-Institut für Radioastronomie (MPIfR), Auf dem Hügel 69, D-53121 Bonn, Germany
3 Supported by NASA/NSF, affiliated with the Department of Astronomy, University of Wisconsin-Madison, 475 North Charter Street, Madison, WI 53706, USA4 Department of Physics and Astronomy, West Virginia University, White Hall, Box 6315, Morgantown, WV 26506, USA
5 Center for Gravitational Waves and Cosmology, West Virginia University, Chestnut Ridge Research Building, Morgantown, WV 26505, USA6 Space Telescope Science Institute, 3700 San Martin Drive, Baltimore, MD 21218, USA7 CSIRO Astronomy and Space Science, P.O. Box 1130, Bentley WA 6102, Australia
8 Department of Astronomy, New Mexico State University, P.O. Box 30001, MSC 4500, Las Cruces, NM 88003, USA9 Fraunhofer Institute for High Frequency Physics and Radar Techniques FHR, Fraunhoferstr. 20, D-53343 Wachtberg, Germany
10 Department of Physics and Astrophysics, Vrije Universiteit Brussel, Pleinlaan 2, B-1050 Brussels, Belgium11 University of Helsinki, Physicum, Helsingin Yliopisto, Gustaf Hällströmin katu 2, FI-00560 Helsinki, Finland
12 Finnish Center for Astronomy with ESO, FI-20014 Turun yliopisto, FinlandReceived 2018 July 23; revised 2018 September 28; accepted 2018 October 12; published 2018 November 29
Abstract
We present a detailed analysis of the absorption properties of one of the tidal gas streams around the “Whale”galaxy NGC 4631 in the direction of the quasar 2MASS J12421031+3214268. Our study is based on ultravioletspectral data obtained with the Cosmic Origins Spectrograph (COS) on board the Hubble Space Telescope (HST)and 21cm-data from the HALOGAS project and the Green Bank Telescope (GBT). We detect strong H I Lyαabsorption in the velocity range +550 to +800 km s−1 related to gas from a NGC 4631 tidal stream known as Spur2. We measure a column density of log (N(H I/cm−2))=18.68±0.15, indicating that the quasar sightline tracesthe outer boundary of Spur 2 as seen in the 21 cm data. Metal absorption in Spur 2 is detected in the lines of O I,C II, Si II, and Si III in a complex absorption pattern that reflects the multiphase nature of the gas. We find that theaverage neutral gas fraction in Spur 2 toward 2MASS J12421031+3214268 is only 14%. This implies that ionizedgas dominates the total mass of Spur 2, which then may comprise more than 109M☉. No significant depletion of Siis observed, showing that Spur 2 does not contain significant amounts of dust. From the measured O I/H I columndensity ratio, we determine an α abundance in Spur 2 of 0.13 0.05
0.07-+ solar ([α/H]=−0.90±0.16), which is
substantially lower than what is observed in the NGC 4631 disk. The low metallicity and low dust content suggestthat Spur 2 represents metal-deficient gas stripped off a gas-rich satellite galaxy during a recent encounter withNGC 4631.
Galaxy evolution at low and high redshift is believed to belargely influenced by the galaxies’ interactions with theirimmediate cosmological environment. As most galaxies areexpected to consume their interstellar gas content on relativelyshort timescales to sustain star formation, the inflow of gasfrom outside belongs to the particularly interesting processesthat are believed to strongly influence a galaxy’s star formationrate and its evolutionary state (e.g., Daveé et al. 2012). Indeed,recent observational and theoretical studies have demonstratedthat the inflow of gaseous material from the intergalacticmedium (IGM) and the recycling of previously expelled gasadds significantly to today’s reservoir of baryonic matter in agalaxy, thus founding the basis for future star formationactivity (see recent reviews by Finlator 2017; Kacprzak 2017;Sánchezr-Almeida 2017, and references therein).
In addition to IGM accretion and gas recycling, thegravitational interaction of galaxies (including minor andmajor mergers) represents yet another important mechanismby which galaxies acquire gas. Merger processes can deposithuge amounts of gaseous material in the form of tidal streamsinto the circumgalactic region around interacting galaxies long
before the main stellar bodies of the galaxies are in closeproximity (Fraternali & Binney 2008; Di Teodoro & Fraternali2014). Furthermore, because the gravitational interaction alsopulls out gas from the inner-most regions of the merginggalaxies, tidal gas streams often contain large amounts of neutralgas, visible at low redshift in the 21 cm emission line of neutralhydrogen and (at low and high redshifts) in damped absorptionin the Lyα line at 1215.7Å.The most prominent local example for a massive tidal gas
stream is the Magellanic Stream in the halo of the Milky Way,which originates in the gravitational and hydrodynamicalinteraction between the Magellanic Clouds and the MilkyWay (e.g., Gardiner & Noguchi 1996; Connors et al. 2006;Besla et al. 2010, 2012; Nidever et al. 2010; Diaz & Bekki2011, 2012; Salem et al. 2015; D’Onghia & Fox 2016). Recentabsorption-line observations (Fox et al. 2013, 2014, 2018;Richter et al. 2013, 2018) and emission-line observations(Barger et al. 2013) indicate that the Magellanic Stream, whenconsidered together with the Leading Arm and the MagellanicBridge between the Large and the Small Magellanic Cloud,probably contains more than 3×10⁹M☉ of (mostly ionized)gas, thus exceeding the combined interstellar gas mass of the
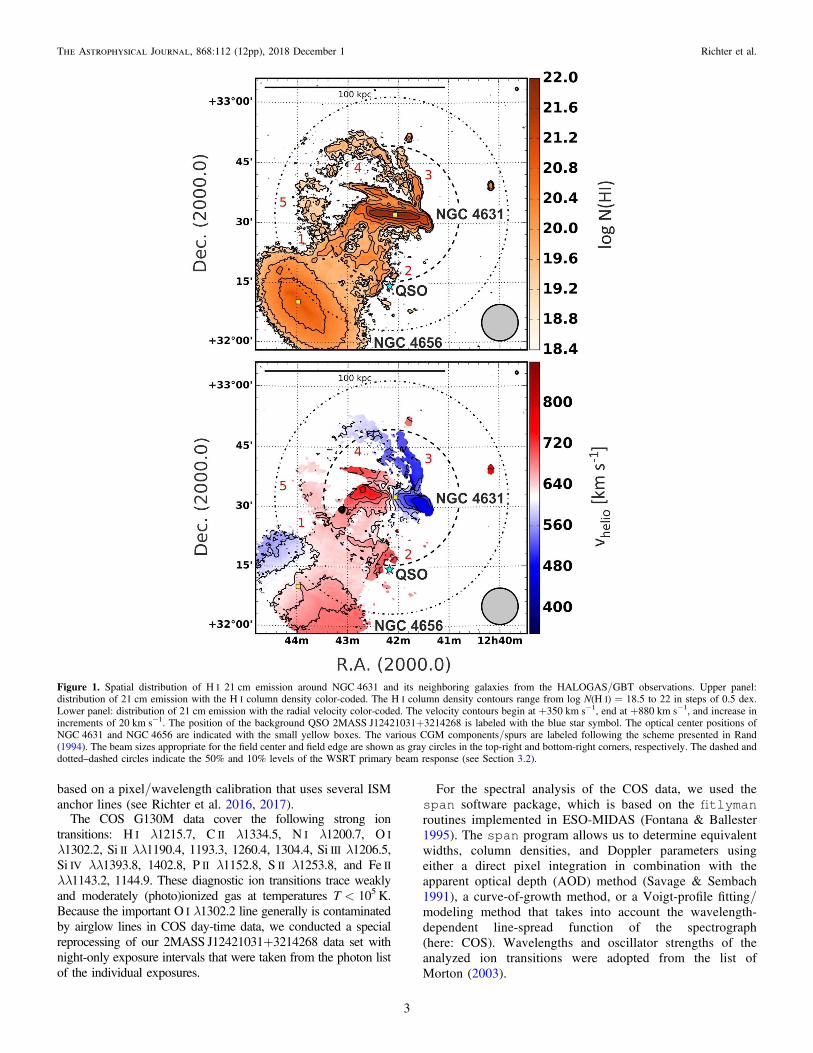
two Magellanic Clouds (Brüns et al. 2005; Fox et al. 2014;Richter 2017). Other prominent examples for extended tidalgas streams visible in 21 cm emission can be seen in the M81group (e.g., Yun et al. 1994; Chynoweth et al. 2008) and in the“Whale” galaxy NGC 4631 (Rand 1994), the latter being thesubject of the study presented here.
Detailed case studies of the circumgalactic medium (CGM)in nearby, merging galaxies hold the prospect of improving ourunderstanding of the role of galaxy interactions for thedistribution and physical properties of circumgalactic gas inthe general context of galaxy evolution. To reliably estimatethe chemical composition of the CGM, its distribution, itskinematics, and its total mass, the multiphase nature of the gasneeds to be taken into account. For this, the combination ofdeep 21 cm observations (tracing neutral hydrogen gas and itsspatial distribution) and high signal-to-noise (S/N) ultraviolet(UV) absorption-line measurements (tracing metal absorptionin the neutral and ionized circumgalactic gas phases) offers aparticularly powerful and efficient observing strategy.
In this paper, we present new UV absorption-line measure-ments of circumgalactic gas belonging to the tidal gas streamsaround the Whale galaxy NGC 4631 in the direction of thebackground quasar 2MASS J12421031+3214268. The quasaris located at an impact parameter of ρ=40 kpc to NGC 4631,a value that is comparable to the size of the galaxy’s H I disk(Figure 1). From the analysis of the UV data, we obtain newinformation on the metal and dust abundance in the south-western part of the gaseous streams, its origin, and itstotal mass.
Our paper is organized as follows: in Section 2, we describethe overall properties of the tidal gas streams around NGC 4631and summarize previous measurements. In Section 3, weoutline the HST/COS observations, the supplementary HALO-GAS and GBT 21 cm observations, and the analysis methods.The results from the absorption-line analysis are presented inSection 4. In Section 5, we discuss the implications of ourresults in regard to the origin and mass of the tidal gas aroundNGC 4631 and compare its properties with the MagellanicStream. Our study is summarized in Section 6.
2. Tidal Gas Streams around the Whale Galaxy
One particularly spectacular example for a tidal interactionbetween galaxies of different masses is the Whale galaxyNGC 4631 with its various companions (e.g., NGC 4656 andNGC 4627). NGC 4631 itself is a nearby (d=7.4±0.2 Mpc;cz=606 km s−1; Radburn-Smith et al. 2011) edge-on spiralgalaxy of Hubble type SB(s)d with a current star formation rateof 2.1M☉ yr−1 (Sanders et al. 2003; Kennicutt et al. 2008). It islocated in a galaxy group environment containing more than adozen galaxies (Giuricin et al. 2000). From field imagingsurveys, it is known that there are plenty of dwarf satellitegalaxies around NGC 4631 (Ann et al. 2011). Because most ofthese satellite galaxies are believed to be located within thevirial radius of NGC 4631, there must be strong on-going tidaland hydrodynamical interactions between NGC 4631 and itssatellite-galaxy population. The larger companion galaxiesNGC 4627 and NGC 4656 are located at 2.6′ to the northwestand 32′ to the southeast of NGC 4631. Therefore, with anassumed distance of 7.4 Mpc for NGC 4631, NGC 4627,and NGC 4656 are separated by about 6 kpc and 71 kpc,respectively, from NGC 4631.
In particular, NGC 4656 is a probable candidate for a closeencounter, which leads to tidal stripping of disk material,because it is massive enough to detach gas and stars from theinner regions of NGC 4631. The distorted morphology of thedwarf elliptical galaxy NGC 4627 and the well-known H Ibridge between NGC 4631 and NGC 4656 (Roberts 1968;Weliachew et al. 1978; Rand 1994) are clear signs for thestrong interactions between NGC 4631 and its satellitegalaxies. A detailed study of the 21 cm properties of thegaseous streams around NGC 4631 was presented by Rand(1994), who grouped the various tidal features into five majorspurs (see Figure 1). Combes (1978) showed that a parabolicencounter of NGC 4656 with NGC 4631 can explain part of thecircumgalactic H I distribution (Spurs 1, 4 and 5). Spurs 2 and3, on the other hand, could represent material stripped from asmaller companion of NGC 4631 (e.g., NGC 4627) or could bestirred-up material from the NGC 4631 disk from a closeencounter of NGC 4631 with one of its satellites. The latterscenario is supported by the fact that Spur 2 smoothly joinsonto the outer disk of NGC 4631 in the 21 cm data cube(Rand 1994).The widespread presence of circumgalactic gas components in
NGC 4631 is also indicated by a variety of other multiwavelengthobservations, from X-rays over Hα to other radio wavebands(Fabbiano & Trinchieri 1987; Wang et al. 1995; Neininger &Dumke 1999; Martin & Kern 2001; Bendo et al. 2006). Thedetection of (hot) ionized gas far away from the galactic plane wasseen as evidence that NGC 4631 drives a galactic superwind (e.g.,Melo & Muñoz-Tuñón 2002; Yamasaki et al. 2009).While the many previous observations of NGC 4631 and its
environment already unveil a fascinating amount of details onthe many aspects that drive the evolution of the galaxy in thiscomplicated environment, an absorption-line study of the CGMagainst one or several background QSOs (essential to derive themetallicity of the gas and its total mass) has not been carriedout so far. With this study, we are closing this gap.
3. Observations and Data Handling
3.1. HST/COS Observations and Spectral Analysis
HST/COS observations of the background QSO 2MASS J12421031+3214268 (alternative name: SDSS J124210.34+321427.2; 12 42 10. 322000
h m sa = , 32 14 26. 802000m sd = + , zm=
1.49, mFUV=18.78) were carried out on 2016 April 19(proposal ID: 14085; PI: P. Richter). The position of theQSO sightline with respect to the neutral gas distributionaround NGC 4631 and its companion galaxies is indicated inFigure 1. As can be seen, the 2MASS J12421031+3214268sightline passes the outer boundaries of Spur 2 south of theNGC 4631 disk.For the COS observations, we used the G130M grating
(centered on λ=1291.0Å), which covers a wavelength rangebetween 1150 and 1450Å. The spectral resolution at the COSlifetime position 3 is R=18,000, corresponding to a velocityresolution of 17 km s−1 FWHM and a native pixel size of3 km s−1 (Green et al. 2012; Debes et al. 2016). The data for2MASS J12421031+3214268 were collected over five HSTorbits with a total integration time of 13.6 ks. The individualscience exposures were processed with the CALCOS datareduction pipeline v3.1.7 and then coadded. For the coaddition,we used a custom-written code that aligns individual exposures
2
The Astrophysical Journal, 868:112 (12pp), 2018 December 1 Richter et al.
based on a pixel/wavelength calibration that uses several ISManchor lines (see Richter et al. 2016, 2017).
The COS G130M data cover the following strong iontransitions: H I λ1215.7, C II λ1334.5, N I λ1200.7, O Iλ1302.2, Si II λλ1190.4, 1193.3, 1260.4, 1304.4, Si III λ1206.5,Si IV λλ1393.8, 1402.8, P II λ1152.8, S II λ1253.8, and Fe IIλλ1143.2, 1144.9. These diagnostic ion transitions trace weaklyand moderately (photo)ionized gas at temperatures T<105 K.Because the important O I λ1302.2 line generally is contaminatedby airglow lines in COS day-time data, we conducted a specialreprocessing of our 2MASS J12421031+3214268 data set withnight-only exposure intervals that were taken from the photon listof the individual exposures.
For the spectral analysis of the COS data, we used thespan software package, which is based on the fitlymanroutines implemented in ESO-MIDAS (Fontana & Ballester1995). The span program allows us to determine equivalentwidths, column densities, and Doppler parameters usingeither a direct pixel integration in combination with theapparent optical depth (AOD) method (Savage & Sembach1991), a curve-of-growth method, or a Voigt-profile fitting/modeling method that takes into account the wavelength-dependent line-spread function of the spectrograph(here: COS). Wavelengths and oscillator strengths of theanalyzed ion transitions were adopted from the list ofMorton (2003).
Figure 1. Spatial distribution of H I 21 cm emission around NGC 4631 and its neighboring galaxies from the HALOGAS/GBT observations. Upper panel:distribution of 21 cm emission with the H I column density color-coded. The H I column density contours range from log N(H I)=18.5 to 22 in steps of 0.5 dex.Lower panel: distribution of 21 cm emission with the radial velocity color-coded. The velocity contours begin at +350 km s−1, end at +880 km s−1, and increase inincrements of 20 km s−1. The position of the background QSO 2MASS J12421031+3214268 is labeled with the blue star symbol. The optical center positions ofNGC 4631 and NGC 4656 are indicated with the small yellow boxes. The various CGM components/spurs are labeled following the scheme presented in Rand(1994). The beam sizes appropriate for the field center and field edge are shown as gray circles in the top-right and bottom-right corners, respectively. The dashed anddotted–dashed circles indicate the 50% and 10% levels of the WSRT primary beam response (see Section 3.2).
3
The Astrophysical Journal, 868:112 (12pp), 2018 December 1 Richter et al.
Note that another, bright QSO close to NGC 4631 (SDSSJ124044.68+330349.8) was also observed with COS as part ofthe HST observing program 14085. Although the GALEX UVmagnitude is mFUV=18.78, the COS data of SDSS−J124044.68+330349.8 does not show any significant UVflux. Since the pointing was checked to be correct, this fluxdeficit most likely is due to a Lyman-limit system (LLS) athigher redshift. As a consequence, the COS spectrum of SDSS−J124044.68+330349.8 does not yield any usable informationfor our study.
3.2. Supplementary WSRT/HALOGAS and GBT 21 cm Data
We supplement our HST/COS data with 21 cm observationsof NGC 4631 from the Hydrogen Accretion in LOcal GalaxieSproject (HALOGAS, PI: G. Heald; Heald et al. 2011).HALOGAS represents a comprehensive study of nearbygalaxies using the Westerbork Synthesis Radio Telescope(WSRT). The initial goal was to perform ultra-deep H Iobservations of 24 nearby spiral galaxies to search for neutralgas in the circumgalactic environment of these galaxies (seeZschaechner et al. 2011; Gentile et al. 2013; Kamphuis et al.2013 for results on individual HALOGAS galaxies). In theframework of HALOGAS, NGC 4631 was observed with theWSRT for 10×12 hr in the “maxishort” configuration with acharacteristic beam size of 15″ and a velocity resolution of∼4 km s−1 (see Heald et al. 2011 for more details on theobservations).
Additional 21 cm observations of the NGC 4631 environ-ment have been carried out with the Robert C. Byrd GreenBank Telescope,13 which provides an angular resolution of 9.1′at 1420MHz. The GBT data were obtained in 2014 as part ofproject GBT16B 293. An area of 2×2 deg2 was mappeddown to a theoretical column density level of 1018 cm−2 (at theGBT resolution), which corresponds to a total mapping time of10 hr. The observational techniques used are the same as thosedescribed in Pisano (2014), while the calibration and imagingwas done with the same script as in Pingel et al. (2018). Lessthan 0.1% of these data were flagged for RFI, then smoothed to6.4 km s−1 wide velocity bins.
To combine the GBT with the WSRT data, the CommonAstronomy Software Applications (CASA) task “feather” wasused. A detailed description on the combination procedure isprovided in the Appendix. The integrated total 21 cm columndensity map and the velocity field of NGC 4631 from thecombined WSRT/GBT observations are shown in Figure 1with the position of the QSO indicated with the blue starsymbol. The combined data set provides a spectacular newview on the complex H I distribution in the tidal gas featuresaround NGC 4631 and NGC 4656, complementing previousdeep 21 cm observations (Weliachew et al. 1978; Rand 1994).For the interpretation of Figure 1, it is important to note that theeffective angular resolution of the combined data set varieswith location in the field of view.
As opposed to a mosaic, the original WSRT observationswere performed with a single pointing. Because the standardreduction techniques of imaging and deconvolution of inter-ferometer data result in a model representation of the skymultiplied by the primary-beam response of the antennas, the
true sensitivity of the native WSRT data follows the responseof the primary-beam and thus decreases toward the edge of thefield of view. Overplotting the 50% (dashed) and 10% (dotted–dashed) level of the primary beam response (Figure 1)according to the numerical model discussed in Heald et al.(2011) reveals that the disk of NGC 4656 is well outside thehalf-power response of the WSRT primary beam. Effectively,the sensitivity of the original WSRT data becomes significantlyreduced toward the H I associated with NGC 4656. On theother hand, because the GBT data were obtained via multiplepointings over four square degrees, there is no variation in thesensitivity of the single dish data over the same field of view.As a result, the angular scale of the diffuse emissionsurrounding NGC 4656 in the combined image is almostcertainly dominated by the angular resolution of the GBT data.The apparent vertical extent of the diffuse halo encompassingNGC 4646 of ∼20 kpc in the combined image (Figure 1) istherefore likely an upper limit.That said, the GBT data detect almost 10 times more H I (in
terms of mass) than the native WSRT data, indicating that thereis extended structure that is both resolved out by the nativeWSRT data and missed due to the decreased sensitivity towardthe companion. Additional deep 21 cm interferometer datawould be very helpful to explore the full extent of diffuse21 cm emission in the larger environment of NGC 4631 andNGC 4656.
4. Results
4.1. Metal Absorption in the COS Data
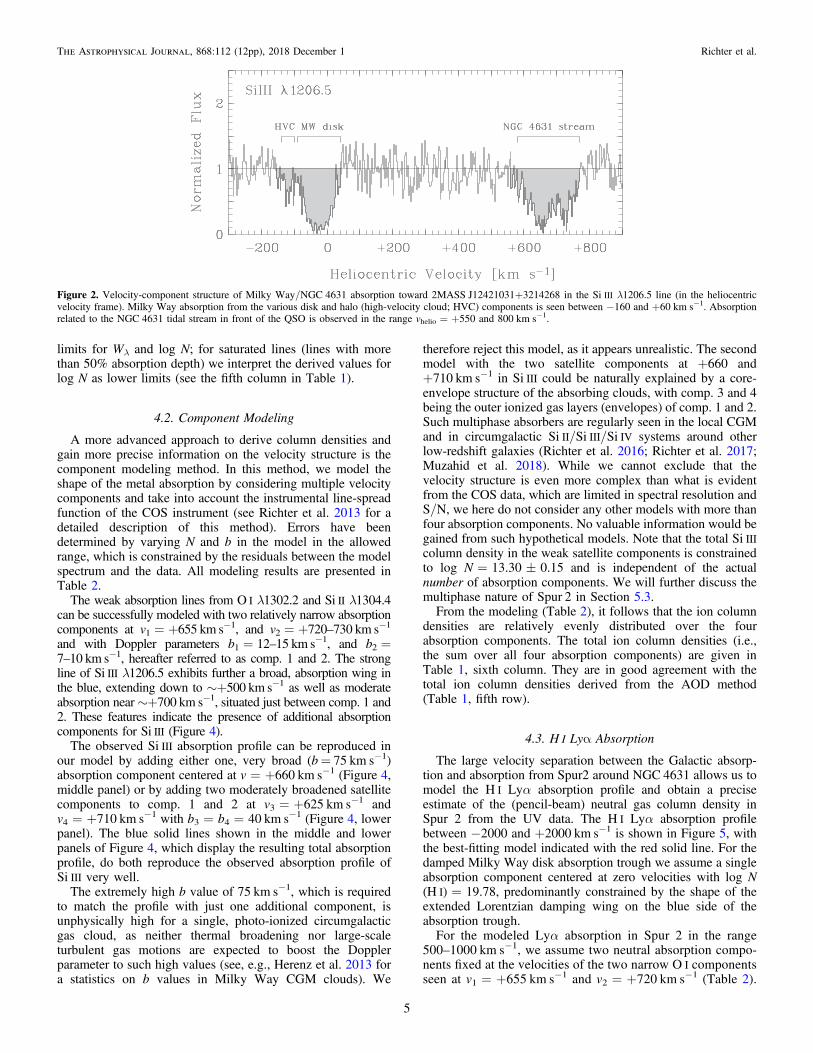
Metal absorption toward 2MASS J12421031+3214268 fromSpur 2 around NGC 4631 is seen in the velocity rangevhelio=+550 to +800 km s−1 in various transitions from themetal ions O I, Si II, C II, and Si III. Absorption from N I, Si IV,Fe II, and other ions is not detected.The velocity-component structure of Milky Way plus
NGC 4631 absorption toward 2MASS J12421031+3214268between −300 and +900 km s−1 is shown in Figure 2 for theexample of the Si III λ1206.5 line. Milky Way (MW) diskabsorption is seen between vhelio=−90 to +50 km s−1, whileGalactic-halo absorption from a high-velocity cloud (HVC) isseen near −110 km s−1. The strong NGC 4631 absorption atvhelio=+550 to +800 km s−1 is broad and asymmetric,already indicating the presence of multiple velocity subcom-ponents in the gas.In Figure 3, we display the velocity profiles of several lines
from O I, Si II, C II, Si III, Si IV, and Fe II together with the21 cm emission profile from the HALOGAS/GBT data in therange vhelio=+400 and +900 km s−1. A double-peakedabsorption profile is clearly seen in the lines of O I λ1302.2,Si II λ1193.3, and Si III λ1206.5. The lines of C II λ1334.5 andSi II λ1260.4 at vhelio�+700 km s−1 are blended by otherintervening absorbers, but the two absorption components,centered at +660 and +720 km s−1, still are readily visible. Aprecise modeling of these velocity components is presented inthe next subsection.We determined total equivalent widths, Wλ, and total
logarithmic column densities, log N, by a direct pixelintegration over the velocity profiles using the apparent opticaldepth method (Savage & Sembach 1991). The values for Wλ
and log N derived in this manner are listed in Table 1, columns4 and 5. In the case of nondetections, we determined upper
13 The Green Bank Observatory is a facility of the National ScienceFoundation, operated under a cooperative agreement by AssociatedUniver-sities, Inc.
4
The Astrophysical Journal, 868:112 (12pp), 2018 December 1 Richter et al.
limits for Wλ and log N; for saturated lines (lines with morethan 50% absorption depth) we interpret the derived values forlog N as lower limits (see the fifth column in Table 1).
4.2. Component Modeling
A more advanced approach to derive column densities andgain more precise information on the velocity structure is thecomponent modeling method. In this method, we model theshape of the metal absorption by considering multiple velocitycomponents and take into account the instrumental line-spreadfunction of the COS instrument (see Richter et al. 2013 for adetailed description of this method). Errors have beendetermined by varying N and b in the model in the allowedrange, which is constrained by the residuals between the modelspectrum and the data. All modeling results are presented inTable 2.
The weak absorption lines from O I λ1302.2 and Si II λ1304.4can be successfully modeled with two relatively narrow absorptioncomponents at v1=+655 km s−1, and v2=+720–730 km s−1
and with Doppler parameters b1=12–15 km s−1, and b2=7–10 km s−1, hereafter referred to as comp. 1 and 2. The strongline of Si III λ1206.5 exhibits further a broad, absorption wing inthe blue, extending down to ∼+500 km s−1 as well as moderateabsorption near∼+700 km s−1, situated just between comp. 1 and2. These features indicate the presence of additional absorptioncomponents for Si III (Figure 4).
The observed Si III absorption profile can be reproduced inour model by adding either one, very broad (b= 75 km s−1)absorption component centered at v=+660 km s−1 (Figure 4,middle panel) or by adding two moderately broadened satellitecomponents to comp. 1 and 2 at v3=+625 km s−1 andv4=+710 km s−1 with b3=b4=40 km s−1 (Figure 4, lowerpanel). The blue solid lines shown in the middle and lowerpanels of Figure 4, which display the resulting total absorptionprofile, do both reproduce the observed absorption profile ofSi III very well.
The extremely high b value of 75 km s−1, which is requiredto match the profile with just one additional component, isunphysically high for a single, photo-ionized circumgalacticgas cloud, as neither thermal broadening nor large-scaleturbulent gas motions are expected to boost the Dopplerparameter to such high values (see, e.g., Herenz et al. 2013 fora statistics on b values in Milky Way CGM clouds). We
therefore reject this model, as it appears unrealistic. The secondmodel with the two satellite components at +660 and+710 km s−1 in Si III could be naturally explained by a core-envelope structure of the absorbing clouds, with comp. 3 and 4being the outer ionized gas layers (envelopes) of comp. 1 and 2.Such multiphase absorbers are regularly seen in the local CGMand in circumgalactic Si II/Si III/Si IV systems around otherlow-redshift galaxies (Richter et al. 2016; Richter et al. 2017;Muzahid et al. 2018). While we cannot exclude that thevelocity structure is even more complex than what is evidentfrom the COS data, which are limited in spectral resolution andS/N, we here do not consider any other models with more thanfour absorption components. No valuable information would begained from such hypothetical models. Note that the total Si IIIcolumn density in the weak satellite components is constrainedto log N=13.30±0.15 and is independent of the actualnumber of absorption components. We will further discuss themultiphase nature of Spur 2 in Section 5.3.From the modeling (Table 2), it follows that the ion column
densities are relatively evenly distributed over the fourabsorption components. The total ion column densities (i.e.,the sum over all four absorption components) are given inTable 1, sixth column. They are in good agreement with thetotal ion column densities derived from the AOD method(Table 1, fifth row).
4.3. H I Lyα Absorption
The large velocity separation between the Galactic absorp-tion and absorption from Spur2 around NGC 4631 allows us tomodel the H I Lyα absorption profile and obtain a preciseestimate of the (pencil-beam) neutral gas column density inSpur 2 from the UV data. The H I Lyα absorption profilebetween −2000 and +2000 km s−1 is shown in Figure 5, withthe best-fitting model indicated with the red solid line. For thedamped Milky Way disk absorption trough we assume a singleabsorption component centered at zero velocities with log N(H I)=19.78, predominantly constrained by the shape of theextended Lorentzian damping wing on the blue side of theabsorption trough.For the modeled Lyα absorption in Spur 2 in the range
500–1000 km s−1, we assume two neutral absorption compo-nents fixed at the velocities of the two narrow O I componentsseen at v1=+655 km s−1 and v2=+720 km s−1 (Table 2).
Figure 2. Velocity-component structure of Milky Way/NGC 4631 absorption toward 2MASS J12421031+3214268 in the Si III λ1206.5 line (in the heliocentricvelocity frame). Milky Way absorption from the various disk and halo (high-velocity cloud; HVC) components is seen between −160 and +60 km s−1. Absorptionrelated to the NGC 4631 tidal stream in front of the QSO is observed in the range vhelio=+550 and 800 km s−1.
5
The Astrophysical Journal, 868:112 (12pp), 2018 December 1 Richter et al.
This approach is justified, because O I and H I have identicalionization potentials and they trace exactly the same gasphase. We further assume that the oxygen abundance in both
narrow components is identical, so that
N
N
N
N
O
O
H
H. 1
I
I
I
I
1
2
1
2=
( )( )
( )( )
( )
This approach allows us to fix the column density ratio in theH I Lyα model to that of O I and thus only the total H I columndensity remains as a free parameter in the model, if a constantmetallicity is assumed. Doing this, the total H I column densityin Spur 2 toward 2MASS J12421031+3214268 comes out tolog N(H I)=18.68±0.15. As can be seen in Figure 5, theresulting model reproduces the observed shape of the observedLyα absorption very well.There is no evidence that comp. 3 and 4 seen in Si III
contribute significantly to the H I Lyα absorption. This is inline with the idea that they contain predominantly ionized gaswith a small neutral gas fraction.
4.4. 21 cm Emission
Figure 1 indicates that the QSO sightline passes the tidal streamsaround NGC 4631 just beyond the outer boundaries of the 21 cmintensity contours of Spur 2. The H I column density measuredfrom the Lyα absorption (log N(H I)=18.68; see above) is belowthe detection limit of the high-resolution HALOGAS/WSRT data,suggesting that the 2MASS J12421031+3214268 sightline tracesthe diffuse outer envelope of Spur 2. In the lowest panel ofFigure 3, we show the 21 cm emission spectrum in the rangevhelio=400–900 km
−1 from the HALOGAS/WSRT data cubecentered on the position of 2MASS J12421031+3214268 (bluesolid line). No significant emission is seen in the WSRT data (asexpected), but we can place an upper limit on the H I columndensity of log N(H I)=19.15. This is in line with the measuredvalue of log N(H I)=18.68 from the Lyα absorption. With thered solid line we have overlaid the 21 cm emission spectrum fromthe combined WSRT+GBT data, which has a substantially largereffective beam size at the position of the QSO (see discussion inSection 3.2). A weak (TB,max≈0.25K) emission peak is seen at+680 km −1, corresponding to log N(H I)=19.65. This feature isa result of beam-smearing effects near the 21 cm boundary of Spur2, caused by the low angular resolution of the combined WSRT+GBT data. A substantial fraction of the combined WSRT+GBTbeam centered on 2MASS−J12421031+3214268 is filled with
Figure 3. Absorption profiles of metal ions in the COS spectrum of2MASS J12421031+3214268 and 21 cm emission profiles from the WSRT/GBT data. For displaying purposes, the COS data have been binned over 5pixels. Absorption from Spur 2 around NGC 4631 is seen in the velocity rangevhelio=+550 to +800 km s−1. The red solid line in the absorption spectrashows the best-fitting absorber model, as described in Section 4.2. The starsymbols indicate blending lines not related to Spur 2. In the lowest panel(21 cm data), the blue and red solid lines indicate the emission spectra from theWSRT only and WSRT+GBT combined data set in the direction of2MASS J12421031+3214268, respectively.
Table 1Summary of Column Density Measurements
Ion λ0 [Å] fa Wλ [mÅ] log NAODb log Nmodel
c
O I 1302.17 0.048 160±23 14.49±0.09 14.54±0.08C IId 1334.53 0.128 162−412 �14.11 14.93 0.53
0.09-+
Si II 1193.29 0.582 278±26 13.74±0.11 13.91±0.071260.42 1.176 387±44 �13.62 13.91±0.071304.37 0.086 �71 �13.94 13.91±0.07
Si III 1206.50 1.627 488±32 �13.61 13.79±0.12Si IV 1402.77 0.254 �67 �13.28 LFe II 1144.94 0.083 �36 �13.79 L
Notes.a Oscillator strength (Morton 2003).b Total column density in Spur 2, obtained by integrating the ion profiles in therange vhelio=550–800 km s−1.c Total column density in Spur 2, obtained by summing over N in all velocitycomponents based on the component model described in Section 4.2.d C II is blended by intervening H I Ly ζ absorption at z=0.043677.
6
The Astrophysical Journal, 868:112 (12pp), 2018 December 1 Richter et al.
21 cm emission from the inner region of Spur 2, leading to theobserved emission feature.
5. Discussion
5.1. Metallicity of the Gas
Because of the identical ionization potentials of neutraloxygen and hydrogen and the unimportance of dust depletioneffects for O, the O I/H I ratio is a reliable indicator for theoverall α abundance in neutral gas. For log N(H I)>18, onlyvery small ionization corrections (<0.1 dex) apply (see, e.g.,Richter et al. 2018).
From the O I and H I column densities listed in Table 2 andand the ionization model described in Section 5.3, wedetermine a metallicity of the gas of 0.13 0.05
0.07-+ solar or [α/H]=
−0.90±0.16, where we assume a solar oxygen reference
abundance of (O/H)e=−3.31±0.05 (Asplund et al. 2009).Such a metallicity is at the low end of the α-abundancedistribution observed in massive spiral galaxies (Pilyuginet al. 2014), but is very similar to the values found in the mainbody of the Magellanic Stream (MS) and other HVCs in thehalo of the Milky Way (Richter et al. 2001; Tripp et al. 2003;Fox et al. 2013).Interestingly, the derived metallicity of [α/H]=−0.90±0.16
in Spur 2 falls right into the metallicity gap seen in LLS at lowredshifts (Lehner et al. 2013 their Figure 3). In terms ofmetallicity, Spur 2 around NGC 4631 and the MW HVCs thusappear to be atypical for optically thick H I absorbers in the localuniverse. It remains to be explored in future studies whether this isdue to the limited statistics on the metallicity of low-redshift LLSor could be related to the tidal origin of Spur 2, the MS, and otherMW HVCs.
5.2. Possible Sources of Spur 2
In the following, we discuss the various possible sources ofSpur 2 by combining our metallicity measurement with otheravailable information.
5.2.1. The Outer Disk of NGC 4631
One possible scenario is that Spur 2 represents gas that hasbeen tidally torn out of the outer, metal-poor gas disk ofNGC 4631 during a close encounter of NGC 4627 or anothersatellite galaxy. Spur 2 does appear to connect spatially andkinematically with the outer NGC 4631 H I disk over a largesection of the disk’s major axis (Rand 1994), which supports anNGC 4631 disk origin.The derived metallicity of [α/H ]=−0.90±0.16 in Spur 2
is, however, significantly below the interstellar oxygen abun-dance in the central region of the NGC 4631 disk ([M/H]=−0.30± 0.06; Pilyugin et al. 2014). If we apply the observedradial metallicity gradient for NGC 4631 of −0.0194±0.0073dex/kpc (Pilyugin et al. 2014), the derived α abundance in Spur2 would match the metallicity of NGC 4631 only in the veryouter disk at r>20 kpc. Most likely, the extrapolation to suchlarge radii is not valid, as the metallicity gradients in diskgalaxies appear to flatten out at large radii (Werk et al. 2011).Therefore, the measured low α abundance in Spur 2 does notfavor an origin in the disk of NGC 4631.We further note that the initial metallicity of Spur 2, at the
time when the gas was separated from its source galaxy, couldhave been even lower than what is observed today. This isbecause the tidal features potentially have started to mix withthe ambient hot coronal gas around NGC 4631, which isexpected to be fed by outflowing, chemically enriched material
Table 2Parameters for the Absorption-line Modeling
O I +665 12 14.35 +720 7 14.10 +625 L L +710 L LC II +655 15 14.70a +730 10 14.20 +625 40 14.00a +710 40 13.80Si II +655 15 13.60 +730 10 13.10 +625 40 �13.40 +710 40 �13.10Si III +655 15 13.35 +730 10 13.30 +625 40 13.00 +710 40 13.00H I +655 25 18.50 +730 20 18.25 +625 L L +710 L L
Note.a Comp. 1 blended by intervening H I Ly ζ absorption at z=0.043677.
Figure 4. Decomposition of absorption profiles in the COS data, heredemonstrated for the strong Si III λ1206.5 line. Next to the two narrowcomponents 1 and 2 (upper panel) a third, very broad satellite component(middle panel) or, alternatively, two additional, moderately broadened satellitecomponents (lower panel) are required in the component model to match thedata (see Section 4.2 for details).
7
The Astrophysical Journal, 868:112 (12pp), 2018 December 1 Richter et al.
from star-forming regions and thus should be more metal-rich(see review by Fraternali 2017).
5.2.2. NGC 4627 or other Satellite Galaxies
Alternatively, Spur 2 could represent material that has beenstripped from a gas-rich companion of NGC 4631. The strippedgas would then be located in the halo of NGC 4631 andcurrently being accreted onto the disk, which would explain itsspatial and kinematical connection to the H I disk. Possiblegalaxy candidates are the dE satellite NGC 4627, or the tidallydisrupted satellite galaxy that forms the recently detected stellarstream around NGC 4631 (Martínez-Delgado et al. 2015), oranother recently disrupted gas-rich satellite galaxy.
Combes (1978) has presented a detailed model of the tidalinteractions between NGC 4631, NGC 4656, and NGC 4627based on the early 21 cm observations presented in Weliachewet al. (1978). From her model, which assumes a parabolicencounter of NGC 4656 with NGC 4631, follows that basicallyall gaseous material that is seen in Spurs 1, 4, and 5 and in thegas near NGC 4656 stems from the NGC 4631 disk. Spurs 2and 3, however, cannot be explained with this model. Combesproposes that the gas-rich progenitor galaxy of NGC 4627 haslost basically all its interstellar neutral gas in a close encounterwith NGC 4631, material that is now seen in 21 cm emission asSpurs 2 and 3. While the Combes model disfavors the nearbycompanion NGC 4656 as source for Spur 2, it is worth noticingthat the measured α abundance in Spur 2 coincides well withthe interstellar metallicity in the inner 10 kpc of NGC 4656(Pilyugin et al. 2014). If some of the neutral material in thegaseous bridge between NGC 4631 and NGC 4656 is con-nected to the extended H I halo of NGC 4656, then it cannotbe excluded that the absorption toward MASS J12421031+3214268 is related to gas that originally stems fromNGC 4656. Clearly, it would be highly desirable to remodelthe tidal interactions between NGC 4631, NGC 4656, andNGC 4627 using state-of-the art simulation codes together withthe most recent observational constraints as input parameters tofurther clarify these issues.
It is an interesting fact that the derived oxygen abundance of[M/H]=−0.90 in Spur 2 matches almost exactly themetallicity derived for the stellar stream ([M/H]=−0.92;Tanaka et al. 2017). The uncertainty for the stellar abundance isquite large, however, with a 90% confidence interval between−1.46 and −0.51 (see Tanaka et al. 2017). Therefore, thisapparent similarity does not provide strong constraints on apossible common origin. There are, in fact, several argumentsthat speak against a connection between the stellar and the
gaseous streams. From the tidal model of Martínez-Delgadoet al. (2015) it follows, for instance, that the stellar stream mustbe old, with a preferred age of ∼3.5 Gyr to qualitatively matchthe observed morphology of the stream. Spur 2 must besubstantially younger, however, because the stream’s gas isexpected to interact with the ambient hot coronal gas (e.g.,Heitsch & Putman 2009). As a result, the gas should either bedisrupted and incorporated into the corona, or be accreted ontothe disk of NGC 4631 on timescales much smaller than 3.5 Gyr(typical disruption timescales would be a few 100 Myr; Heitsch& Putman 2009), i.e., the gas structure would not survive forsuch a long time in such a massive galaxy halo. Another resultof the tidal model from Martínez-Delgado et al. (2015) is thatthe total initial stellar mass of the accreted dwarf galaxy musthave been small, <6×10⁸Me. This value is, however,smaller than the neutral gas mass of Spur 2 alone(∼8×10⁸)Me (Rand 1994). In conclusion, Spur 2 is almostcertainly not related to the stellar stream.
5.3. Ionization Conditions and Total Gas Mass
We now discuss the ionization conditions in the different gascomponents in more detail by analyzing the observed O I/C II/Si II column density ratios with a grid of Cloudy ionizationmodels (Ferland et al. 2013) that are based on the H I columndensities (limits) derived for comp. 1 and 2 (Table 2).We follow the strategy outlined in our previous studies (e.g.,
Richter et al. 2009, 2013, 2016, 2018) and model the ionizationconditions in Spur 2 assuming the absorbers to be a simple gasslab that is illuminated from both sides. In principle, thestrength and shape of the illuminating radiation field in a CGMcloud of a star-forming galaxy depends on the overallextragalactic UV background field at that redshift and thelocation of the cloud with respect to the UV-emitting star-forming disk. Since we are lacking any accurate information onthe distance of Spur 2 to the NGC 4631 stellar disk and theshape/intensity of the local radiation field, we consider threemodels with different assumptions for the local radiation fieldin Spur 2. In the first model, we use only the extragalactic UVbackground (UVB) field at z=0 normalized to a photoioniza-tion rate of log Γ=−13.34 (see the discussion in Kollmeieret al. 2014; Shull et al. 2015; Wakker et al. 2015). The secondmodel assumes a standard UVB field together with anadditional Milky Way–type radiation field (Fox et al. 2005,2014) at a galactocentric distance of d=50 kpc (UVB+G50),as explained in Fox et al. (2014) and Richter et al. (2009). Thethird model assumes a UVB field with an additional Milky
Figure 5. Modeling of the HI Lyα absorption in the COS spectrum of 2MASS J12421031+3214268. The red solid line shows the best-fitting model with Lyαabsorption from the Milky Way disk and halo gas near zero velocities and Lyα absorption from the NGC 4631 stream near +700 km −1 (see Section 4.3).
8
The Astrophysical Journal, 868:112 (12pp), 2018 December 1 Richter et al.
Way–type radiation field at a galactocentric distance ofd=10 kpc (UVB+G10).
For the H I column densities in components 1 and 2, theexpected ionization correction to determine (O/H) from themeasured O I/H I is only 0.03 dex. For the derived α abundance inthe gas ([α/H]=−0.90), Cloudy then delivers for each of thethree assumed radiation fields (UVB, UVB+G50, UVB+G10)predictions for the column densities of the other ions as a functionof the local gas density, log nH (see Figure 6 for a Cloudy exampleplot). By matching the observed column densities with the Cloudymodel predictions for UVB, UVB+G50, and UVB+G10, weobtain for each component an estimate for the ionized gas columndensity, N(H II), the gas density, the neutral gas fraction, fH I=N(H I)/[N(H I)+N(H II)], and the thickness of the absorbing gaslayer, l=N(H)/nH. The modeling results are listed in Table 3.
Note that we do not include Si III in our modeling for comp.1 and 2, as Si III and O I/Si II are not expected to arise in thesame gas phase (see discussions in Richter et al. 2016; Muzahidet al. 2018). The fine-tuning of the Si II/O I ratio in comp. 1and 2 in the Cloudy models was used to determine the dustdepletion of Si, as will be described in Section 5.4.
From the Cloudy modeling, it follows that the density incomp. 1 lies between log nH=−2.18 and −0.64, whichindicates an absorber size between ∼30 pc and 1 kpc,depending on the assumed radiation field (see Table 3). Thegas density in comp. 2 is predicted to be one order ofmagnitude higher (log nH=−0.87 to +0.67), indicating thatcomp. 2 represents a small gas clump with a size �10 pc. It is
important to keep in mind that these values are based on theabove outlined (idealized) assumptions on the radiation fieldand absorber geometry. Consequently, they should be inter-preted with some caution. If Spur 2 has a similarly largedistance to the disk of NGC 4631 as the main body of the MSto the MW disk (d=50–100 kpc), then the UVB+G50 modelapplies, indicating that the absorbing clouds have parsec-scalesizes at moderate densities. In this model, which we regard asthe most realistic one given the geometrical configuration of theSpurs around NGC 4631, the derived gas densities and clumpsizes are very similar to those seen in the MS and other HVCsin the Milky Way halo (Richter et al. 2009, 2013, 2018),pointing at comparable physical conditions.While we cannot provide any Cloudy modeling for the
satellite components 3 and 4, we can give a lower limit for thetotal hydrogen column density, N(H)=N(H I)+N(H II), ineach of these components. For this, we transform the observedSi III column density in comp. 3 and 4 (Table 2) into N(H)assuming that the silicon abundance in the gas is 0.13 solar,similar to what is measured in comp. 1 and 2. With theresulting value log (Si/H)=−5.29 in Spur 2, we find that logN(H)�18.29 in each of the two comp. 3 and 4, or log N(H)�18.59 in the two components together.Combining the results for all four components, we derive for the
mean neutral gas fraction in Spur 2 along the 2MASS J12421031+3214268 sightline a value of f 0.14H Iá ñ = , indicating that thereis ∼7 times more ionized hydrogen than neutral hydrogen in thestream in this direction. This ratio may not be typical for the entiretidal stream. This is because the 2MASS J12421031+3214268sightline passes the stream just at the boundaries of the 21 cmcontours where the neutral gas column is substantially smaller thanin the inner regions of Spur 2 (see Figure 1, upper panel). Yet, theCloudy results imply that Spur 2 contains substantial amounts ofionized gas that most likely brings its total gas mass to a few times109Me. This value is comparable to the total gas mass estimatedfor the Magellanic Stream in the Milky Way halo (Foxet al. 2014).
5.4. Dust Content
As has been demonstrated in the case of the MagellanicStream, interstellar dust grains can survive the tidal strippingprocess in merging galaxies (Lu et al. 1998; Gibson et al. 2001;Fox et al. 2013; Richter et al. 2013, 2018). To investigate thedust abundance in Spur 2, we compare in detail the abundanceof the two α elements Si and O in our Cloudy model forcomponents 1 and 2. The Si/O abundance ratio is a useful dustindicator. This is because even in relatively diffuse gas in theMilky Way’s ISM and CGM, Si is moderately depleted intodust grains, while O is not (e.g., Savage & Sembach 1996).The Cloudy models for comp. 1 and 2 predict Si II column
densities that are systematically higher than those observed,suggesting that Si indeed is depleted into dust grains. The effectis small, however, with an absolute depletion value of onlylog Si 0.22d =∣ ( )∣ dex (Table 3, fourth row). This valuecorresponds roughly to the systematic errors in the Cloudymodel, so in the following we regard log Si 0.2d∣ ( )∣ dex as arealistic upper limit for the Si depletion in Spur2.Interestingly, this upper limit is still substantially smaller
than the characteristic Si depletion values recently observed inthe Magellanic Stream, its Leading Arm, and the MagellanicBridge log Si 0.5d(∣ ( )∣ dex; Lehner 2002; Fox et al. 2013;
Figure 6. Predicted column densities (solid lines) for various ions as a functionof the gas density from the Cloudy ionization model for comp. 2, assuming justthe UV background as the ionization source (see Section 5.3; Table 3). Theobserved values (filled boxes) fit best to a gas density of log nH=−0.87. Thegray box symbol indicates the Si II column density assuming a depletion of logδ(Si)=−0.22 dex. The gray-shaded inset displays a zoom-in of the regionindicated with the gray solid frame.
9
The Astrophysical Journal, 868:112 (12pp), 2018 December 1 Richter et al.
Richter et al. 2013, 2018). As discussed in Richter et al. (2018),the level of depletion in star-less tidal streams possibly reflectthe initial conditions in the interstellar medium of the stream’ssource galaxy, if the gas has been removed “quiescently” fromits host (e.g., by gravitational forces), but not by dust-destroying energetic events (e.g., by stellar winds or super-nova-driven outflows). Therefore, independently of whetherSpur 2 originally stems from a satellite galaxy or from the outerdisk of NGC 4631, the small absolute Si depletion value inSpur 2 indicates an overall low dust content in the original hostenvironment of the gas.
6. Summary and Conclusions
We have analyzed HST/COS UV spectral data of thebackground QSO 2MASS J12421031+3214268 and 21 cmobservations from the HALOGAS project with support fromnew GBT observations to study the chemical composition andphysical conditions in one of the tidal gas streams (Spur 2)around the Whale galaxy NGC 4631. The main results of ourstudy can be summarized as follows:
1. Strong metal and hydrogen absorption related to Spur 2 isdetected in the COS spectrum of 2MASS J12421031+3214268 in the velocity range between +550 and800 km s−1, although the sightline passes the stream justbeyond the outer 21 cm boundaries. Detected atoms/ionsinclude H I, O I, C II, Si II, and Si III.
2. Four individual velocity components are identified inthe metal absorption with two narrow components(b=7–15 km s−1) and two broader components (b=40 km s−1). The broader components, which are seenonly in Si III, possibly trace more extended, ionized gaslayers that surround the denser gas structures sampled bythe low-ionization states. This complex absorptionpattern suggests a multiphase nature of the tidal gasstream, similar to what is seen in the Magellanic Streamin the outer Milky Way halo.
3. A fit to the H I Lyα absorption in the 2MASS J12421031+3214268 spectrum yields a neutral gas column densityof log N(H I)=18.68±0.15 in Spur 2, which is belowthe detection limit in the 21 cm data. From a set ofCloudy ionization models, it follows that the totalhydrogen column in Spur 2 toward 2MASS J12421031+3214268 is log N(H)=19.46, indicating a sightline-averaged neutral gas fraction of 14%. The gas density inthe narrow absorption components range between log
nH=−2.18 to +0.67, suggesting that these absorbers areCGM cloudlets on subkiloparsec scales.
4. From the unsaturated O I absorption, together with thederived H I column density and the Cloudy ionizationcorrection, we derive an α abundance in the gas of
H 0.13 0.040.05a = -
+( ) solar ([α/H]=−0.90± 0.16). Thisvalue is lower than the abundance in the NGC 4631 gasdisk, even if the radial abundance gradient is taken intoaccount. Although the kinematic connection of Spur 2 withthe gas disk (Rand 1994) points toward an NGC 4631 diskorigin, the low metallicity in the gas rather favors asatellite-galaxy origin for Spur 2. From the Cloudymodels, we derive an upper limit for the Si depletion inSpur 2 of log Si 0.2d∣ ( )∣ , suggesting that the gas has alow dust abundance.
We conclude that the observed properties of Spur 2 favor thescenario, in which metal- and dust-poor gas has been tidallytorn out of a (formerly) gas-rich satellite galaxy in a recentencounter. The dE satellite NGC 4627 at 6 kpc distance fromNGC 4631 thus represents a particularly promising candidatefor the encountering galaxy.The ionization conditions in the gas observed toward
2MASS J12421031+3214268 further indicate that Spur 2contains ∼7 times more ionized than neutral gas, which liftsits total mass to a value of a few times 109Me. If similarionization fractions apply to the other spurs around NGC 4631,however, then the combined total gas mass of the NGC 4631tidal gas streams may easily exceed 1010 M☉. This extremelylarge reservoir of relatively cool (T<Tvir), metal-poorcircumgalactic gas will potentially be accreted by NGC 4631over the next few hundred megayears and will boost its starformation rate. Additional information on the chemicalcomposition and physical conditions of the other four spursof the Whale galaxy’s tidal stream system would require alarger number of UV-bright background AGNs distributedaround NGC 4631, which unfortunately are not available. Fromwhat we know so far, however, the NGC 4631 gas spurs reflectmany of the properties seen in the the Magellanic Stream andits various components (Mathewson et al. 1974; Putman et al.1998; Brüns et al. 2005; D’Onghia & Fox 2016).While the analysis of individual QSO sightlines around
nearby galaxy mergers provide interesting information on theseparticular systems, a more systematic approach in studying theneutral and ionized gas distribution in group environments ishighly desirable. As demonstrated here, absorption spectroscopy
Table 3Results from Ionization Models
Comp. v log N(H I) log δ(Si) UV model log N(H II) log nH log fH I l[km s−1] [dex] [pc]
Notes.a Only the gas phase traced by O I, C II, and Si II is considered.b Si depletion value.c UV flux models considered: (1) EG=extragalactic UV background at z=0; (2) EG+G50kpc=extragalactic UV background + galaxy contribution assumingd=50 kpc impact parameter; (3) EG+G10kpc=EG+galaxy at d=10 kpc.
10
The Astrophysical Journal, 868:112 (12pp), 2018 December 1 Richter et al.
in the UV represents a powerful method to characterize themultiphase nature of tidal gas streams, to estimate their chemicalcomposition, and their ionized gas mass along individualsightlines. The combination of a larger sample of QSO sightlinespassing nearby galaxy groups, data from future deep 21 cmsurveys, deep X-ray observations, and high-resolution hydro-dynamical simulations holds the prospect of substantiallyimproving our understanding of the overall importance ofmassive tidal gas streams in the context of galaxy formation.
This work is based on observations obtained under program14085 with the NASA/ESA Hubble Space Telescope, which isoperated by the Space Telescope Science Institute (STScI) forthe Association of Universities for Research in Astronomy,Inc., under NASA contract NAS5D26555.
AppendixCombination of WSRT and GBT Data
The CASA task “feather,” which was used to combine theGBT with the WSRT data, first regrids the GBT data to matchthe spectral and spatial resolution of the WSRT data beforeFourier transforming each image to a gridded u–v plane. The u–v data of the GBT are then scaled by the ratio of the volume ofthe two beams
, 2WSRT
GBTa =
WW
( )
where we find α to equal 0.0059. This factor accounts for thedifference in flux of the two data sets based solely on thedifferences in resolution. The WSRT u–v data are then scaledby the factor
B1 , 3GBTb = - [ ] ( )F
where the second term represents the Fourier transform of theGBT beam as a function of sky angles. The two scaled u–v datasets are then summed and Fourier transformed back to theimage plane. The scaling depicted in Equation (3) ensures thatthe effects of the poorly sampled low spatial frequencies in theWSRT data are smoothly removed before the well-sampled lowspatial frequencies provided by the GBT data are added.
Before computing the zeroth (top) and first (bottom)statistical moments of the cube as shown in Figure 1, thecombined cube was masked at the 3σK (σ=10 mK) level toensure only emission is included in the final maps. Addition-ally, an unmasked spectrum was extracted at the position of theQSO sightline, which yields an upper column density limit oflog N(H I)=19.53.
ORCID iDs
P. Richter https://orcid.org/0000-0002-1188-1435B. Winkel https://orcid.org/0000-0001-6999-3635B. P. Wakker https://orcid.org/0000-0002-0507-7096A. J. Fox https://orcid.org/0000-0003-0724-4115R. A. M. Walterbos https://orcid.org/0000-0002-0782-3064L. Zschaechner https://orcid.org/0000-0002-9919-8672
References
Ann, H. B., Seo, M. S., & Baek, S.-J. 2011, JKAS, 44, 23Asplund, M., Grevesse, N., Jacques Sauval, A., & Scott, P. 2009, ARA&A,
47, 481Barger, K. A., Haffner, L. M., & Bland-Hawthorn, J. 2013, ApJ, 771, 132
Bendo, G. J., Dale, D. A., Draine, B. T., et al. 2006, ApJ, 652, 283Besla, G., Kallivayalil, N., Hernquist, L., et al. 2010, ApJL, 721, L97Besla, G., Kallivayalil, N., Hernquist, L., et al. 2012, MNRAS, 421, 2109Brüns, C., Kerp, J., Staveley Smith, L., et al. 2005, A&A, 432, 45Chynoweth, K. M., Langston, G. I., Yun, M. S., et al. 2008, AJ, 135, 1983Combes, F. 1978, A&A, 65, 47Connors, T. W., Kawata, D., & Gibson, B. K. 2006, MNRAS, 371, 108D’Onghia, E., & Fox, A. J. 2016, ARA&A, 54, 363Daveé, R., Finlator, K., & Oppenheimer, B. D. 2012, MNRAS, 421, 98Debes, J. H., Becker, G., Roman-Duval, J., et al. 2016, Instrument Science
Report COS 15, http://www.stsci.edu/hst/cos/documents/isrs/ISR2016_15.pdf
Di Teodoro, E. M., & Fraternali, F. 2014, A&A, 567, 68Diaz, J. D., & Bekki, K. 2011, MNRAS, 413, 2015Diaz, J. D., & Bekki, K. 2012, ApJ, 750, 36Fabbiano, G., & Trinchieri, G. 1987, ApJ, 315, 46Ferland, G. J., Porter, R. L., van Hoof, P. A. M., et al. 2013, RMxAA,
49, 137Finlator, K. 2017, ASSL, 430, 221Fontana, A., & Ballester, P. 1995, Msngr, 80, 37Fox, A. J., Barger, K. A., Wakker, B. P., et al. 2018, ApJ, 854, 142Fox, A. J., Richter, P., Wakker, B. P., et al. 2013, ApJ, 772, 110Fox, A. J., Wakker, B. P., Barger, K. A., et al. 2014, ApJ, 787, 147Fox, A. J., Wakker, B. P., Savage, B. D., et al. 2005, ApJ, 630, 332Fraternali, F. 2017, ASSL, 430, 323Fraternali, F., & Binney, J. J. 2008, MNRAS, 386, 935Gardiner, L. T., & Noguchi, M. 1996, MNRAS, 278, 191Gentile, G., Józsa, G. I. G., Serra, P., et al. 2013, A&A, 554, A125Gibson, B. K., Giroux, M. L., Penton, S. V., et al. 2001, AJ, 122, 3280Giuricin, G., Marinoni, C., Ceriani, L., & Pisani, A. 2000, ApJ, 543, 178Green, J. C., Froning, C. S., Osterman, S., et al. 2012, ApJ, 744, 60Heald, G., Józsa, G., Serra, P., et al. 2011, A&A, 526, A118Heitsch, F., & Putman, M. E. 2009, ApJ, 698, 1485Herenz, P., Richter, P., Charlton, J. C., & Masiero, J. R. 2013, A&A,
550, A87Kacprzak, G. 2017, ASSL, 430, 145Kamphuis, P., Rand, R. J., Józsa, G. I. G., et al. 2013, MNRAS, 434, 2069Kennicutt, R. C., Lee, J. C., Funes, S. J., et al. 2008, ApJS, 178, 247Kollmeier, J. A., Weinberg, D. H., Oppenheimer, B. D., et al. 2014, ApJL,
789, L32Lehner, N. 2002, ApJ, 578, 126Lehner, N., Howk, J. C., Tripp, T. M., et al. 2013, ApJ, 770, 138Lu, L., Sargent, W. L. W., Savage, B. D., et al. 1998, AJ, 115, 162Martin, C., & Kern, B. 2001, ApJ, 555, 258Martínez-Delgado, D., D’Onghia, E., Chonis, T. S., et al. 2015, AJ,
150, 116Mathewson, D. S., Cleary, M. N., & Murray, J. D. 1974, ApJ, 190, 291Melo, V., & Muñoz-Tuñón, C. 2002, in ASP Conf. Ser. 282, Galaxies: The
Third Dimension, ed. M. Rosada, L. Binette, & L. Arias (San Francisco,CA: ASP), 338
Morton, D. C. 2003, ApJS, 149, 205Muzahid, S., Fonseca, G., Roberts, A., et al. 2018, MNRAS, 476, 4965Neininger, N., & Dumke, M. 1999, PNAS, 96, 5360Nidever, D. L., Majewski, S. R., Burton, W. B., & Nigra, L. 2010, ApJ,
723, 1618Pilyugin, L. S., Grebel, E. K., & Kniazev, A. Y. 2014, AJ, 147, 131Pingel, N. M., Pisano, D. J., Heald, G., et al. 2018, ApJ, 865, 36Pisano, D. J. 2014, AJ, 147, 48Putman, M. E., Gibson, B. K., Staveley-Smith, L., et al. 1998, Natur, 394, 752Radburn-Smith, D. J., de Jong, R. S., Seth, A. C., et al. 2011, ApJS,
195, 18Rand, R. 1994, A&A, 285, 833Richter, P. 2017, ASSL, 430, 15Richter, P., Charlton, J. C., Fangano, A. P. M., Ben Bekhti, N., &
Masiero, J. R. 2009, ApJ, 695, 1631Richter, P., Fox, A. J., Wakker, B. P., et al. 2013, ApJ, 772, 111Richter, P., Fox, A. J., Wakker, B. P., et al. 2018, ApJ, 865, 145Richter, P., Nuza, S. E., Fox, A. J., et al. 2017, A&A, 607, A48Richter, P., Savage, B. D., Wakker, B. P., Sembach, K. R., &
Kalberla, P. M. W. 2001, ApJ, 549, 281Richter, P., Wakker, B. P., Fechner, C., et al. 2016, A&A, 590, A68Roberts, M. S. 1968, ApJ, 151, 117Salem, M., Besla, G., Bryan, G., et al. 2015, ApJ, 815, 77Sánchezr-Almeida, J. 2017, ASSL, 430, 67Sanders, D. B., Mazzarella, J. M., Kim, D.-C., Surace, J. A., & Soifer, B. T.
2003, AJ, 126, 1607
11
The Astrophysical Journal, 868:112 (12pp), 2018 December 1 Richter et al.
Savage, B. D., & Sembach, K. R. 1991, ApJ, 379, 245Savage, B. D., & Sembach, K. R. 1996, ARA&A, 34, 279Shull, J. M., Moloney, J., Danforth, C. W., & Tilton, E. M. 2015, ApJ, 811, 3Tanaka, M., Chiba, M., & Komiyama, Y. 2017, ApJ, 842, 127Tripp, T. M., Wakker, B. P., Jenkins, E. B., et al. 2003, AJ, 125, 3122Wakker, B. P., Hernandez, A. K., French, D., et al. 2015, ApJ, 814, 40Wang, Q. D., Walterbos, R. A. M., Steakley, M. F., Norman, C. A., &
Braun, R. 1995, ApJ, 439, 176
Weliachew, L., Sancisi, R., & Guélin, M. 1978, A&A, 65, 37Werk, J. K., Putman, M. E., Meurer, G. R., & Santiago-Figueroa, N. 2011,
ApJ, 735, 71Yamasaki, N. Y., Sato, K., Mitsuishi, I., & Ohashi, T. 2009, PASJ,
61, 291Yun, M. S., Ho, P. T. P., & Lo, K. Y. 1994, Natur, 372, 530Zschaechner, L. K., Rand, R. J., Heald, G. H., Gentile, G., & Kamphuis, P.
2011, ApJ, 740, 35
12
The Astrophysical Journal, 868:112 (12pp), 2018 December 1 Richter et al.