CIS 200 exunits11.ppt 1 Working with Units & Spreadsheet Design Objectives: Solving problems with unit conversions Using Multiple worksheets in a workbook Designing efficient/effective worksheets What-if Analysis Goal Seek
Transcript
CIS 200 exunits11.ppt 1
Working with Units & Spreadsheet Design
Objectives:Solving problems with unit conversionsUsing Multiple worksheets in a workbookDesigning efficient/effective worksheetsWhat-if AnalysisGoal Seek
CIS 200 exunits11.ppt 2
A Problem:• Your Gardening Nursery business is growing and you need
additional help. You need to determine if you will save money by hiring temporary employees vs. two full time employees. You have the following information:
– Temporary employees are paid $10/hour flat rate. You estimate you will need a total of 80 work hours a week for each of the 50 weeks you are open.
– Each permanent employee works 40 hours per week and is paid $1000 per month plus benefits worth $5000 per year. Each receives 2 weeks paid vacation while your store is closed in January - so they are paid for a full 12 months. You will need a total of 2 permanent employees.
CIS 200 exunits11.ppt 3
What information do you have?
• Temporary Employees– Cost per hour – # of hours per week– # of weeks per year
• Permanent Employees– # of permanent employees– Cost per month– # of months paid per year– Additional annual costs per
employee
Costs per Year
Costs per Year
What information do you need?
CIS 200 exunits11.ppt 4
If you are given data in dollars per hour and want total cost per year ($/yr) what do you do?
Temporary Employee AnalysisHave: – wages in dollar per hours– # of hours per week– # of weeks per year
dollars hour
* 80 hoursweek
= dollars week
10 800
* 50 weeksyear
= dollars year
40,000dollars week
800
The same units in the numerator & the
denominator cancel out
CIS 200 exunits11.ppt 5
Permanent Employees Analysis
- # of employees - Dollars per week per employee
- # of weeks paid per year - Dollars per year/employee
If you are given data in dollars per month per employee, and dollars per year per employee and want dollars per year what do you do?
There are 0.6 miles per kilometer:• How many miles do you have to go, if a sign reads 100 kilometers to the border?
Have kilometers - want miles 100 kilometers * 0.6 miles/kilometer = miles= 100 * A1
• How many kilometers is 10 miles?Have miles - want kilometer 10 miles/(0.6 miles/kilometer) = kilometers= 10/A1
A B1 0.60 miles/km
CIS 200 exunits11.ppt 11
data inputsdata inputs
calculationscalculations
output output
Now Lets Implement This Problem in a Spreadsheet:A Single Worksheet Design Is
Best With Limited Quantities Of Data
By listing each input separately – it will be
easy to make changes without worrying about
where each value is used.
CIS 200 exunits11.ppt 12
Designing a Spreadsheet SolutionUsing Multiple Worksheets• When creating
spreadsheets with large amounts of related data it may be more effective to place each “table” of data in a separate location.
• Excel provides us with the ability to have multiple worksheets within one workbook. Sheet tabs
Sheets may be named and displayed with different colors tabs, The order of the worksheets may be modified as well.
CIS 200 exunits11.ppt 13input calc
A B C1 part time analysis full time analysis
2 wages= input!B7 * input!B6 * input!B5
= input!B1 * input!B2 * input!B8
3 benefits 0 = input!B1 * input!B34 total =B2+B3 =C2+C3
A B1 # FT emp 22 FT $/ month 10003 FT benefit/ year 50004 # weeks/ year 525 # weeks/ year open 506 PT $/ hour 107 PT hrs/ week 808 # months / year 12
Formulas
Syntax: Sheetname!Cell Reference• Formulas may include cell references from multiple
worksheets: input!B1*input!B3• When referencing a cell on the same spreadsheet as the
active cell the sheet name is not required. C2+C3• Named ranges are unique to a workbook. So if cell
input!B1 is named ‘employee’ the formula in cell C3 could be written as employee * input!B3
Referencing Cells on Multiple Worksheets
CIS 200 exunits11.ppt 14
input calc
One method of organizing your data is with separate sheets for inputs, calculations and/or outputs. This
works well in the following instances:
•Many different sheets share the same inputs – so each piece of data need only be changed in one location
•When you want to present the results only on a single sheet comparing each of the different analyses
1
2
3
4
A B C D
Part Time Costs Full Time Costs Differencewages $ 40,000 $ 24,000 (16,000)$ benefits $ - $ 10,000 10,000$ total 40,000$ 34,000$ (6,000)$
12345678
A B# FT emp 2FT $/ month 1000FT benefit/ year 5000# weeks/ year 52# weeks/ year open 50PT $/ hour 10PT hrs/ week 80# months / year 12
The results of both analyses are
presented on a single sheet
CIS 200 exunits11.ppt 15
Excel allows you to view
multiple worksheets on
your screen
1. If your worksheet is maximized – click on the Restore Window button.
2. The size the window to easily view the contents of the worksheet using the sizing arrow from the edges of the window.
3. Open another window by selecting Windows from the menu and then New Window.
4. Select the next worksheet you desire to view and size it and place it on the screen so the contents is easy to view.
CIS 200 exunits11.ppt 16
This works well when:• Different cases have
different input values • When you want to
present the inputs/outputs and calculations of a single case on one sheet.
Another method of organizing workbooks is using separate sheets for
different “cases”
CIS 200 exunits11.ppt 17
Part Time Analysis Full Time Analysis Differencewages 128,000$ 88,800$ (39,200)$ benefits -$ 7,400$ 7,400$ total 128,000$ 96,200$ (31,800)$
All Stores
One advantage of using separate sheets for
different “cases” is the ability to easily create
summary sheets
We can write a single 3-Dimensional Formula and then copy it down the column & across the row
=SUM(case1:case3!B12) or = case1!B12+case2!B12+case3!B12
case1!
case2!
case3!
CIS 200 exunits11.ppt 18
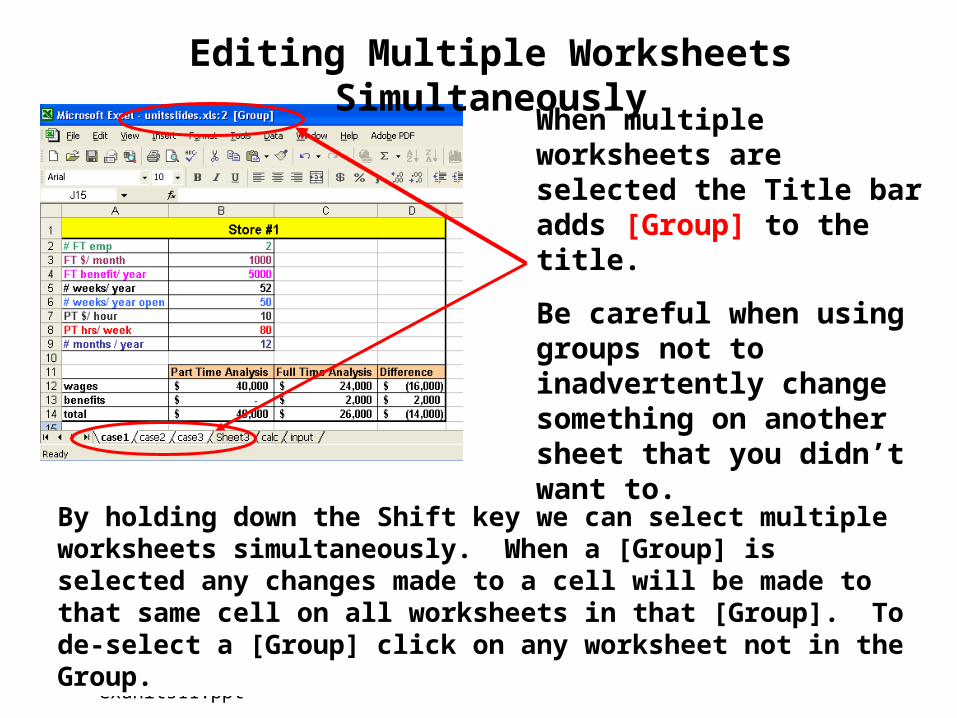
Editing Multiple Worksheets Simultaneously
By holding down the Shift key we can select multiple worksheets simultaneously. When a [Group] is selected any changes made to a cell will be made to that same cell on all worksheets in that [Group]. To de-select a [Group] click on any worksheet not in the Group.
When multiple worksheets are selected the Title bar adds [Group] to the title.
Be careful when using groups not to inadvertently change something on another sheet that you didn’t want to.
CIS 200 exunits11.ppt 19
Some tips for designing your spreadsheets
• Think before “typing” –organize your data, determine which inputs are likely to vary and which are fixed.
• Unless you have a very simple problem - consider multiple worksheets for multi-table input/outputs or multiple cases.
• Each data input should appear once and be used as a reference in subsequent calculations
• Document your workbooks - so that they can be easily understood by others
CIS 200 exunits11.ppt 20
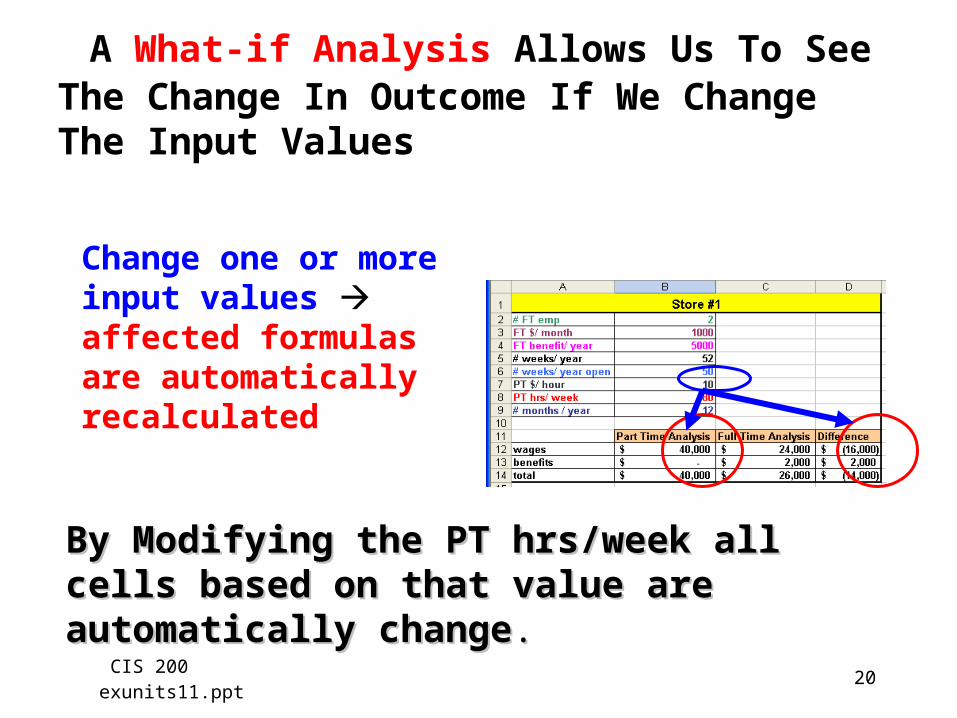
A What-if Analysis Allows Us To See The Change In Outcome If We Change The Input Values
Change one or more input values affected formulas are automatically recalculated
By Modifying the PT hrs/week all cells based By Modifying the PT hrs/week all cells based on that value are automatically changeon that value are automatically change..
CIS 200 exunits11.ppt 21
Goal Seek Allows Us To Determine An Input Value That Would Be Needed To Get A Given Output
• Allows us to work backwards in a worksheet• Lets you vary only one input variable• What-if analysis in the reverse direction.
– Ex. How much would we have to pay our part-time workers in $/hr to only spend $26,000 per year?
CIS 200 exunits11.ppt 22
1
23456789
1011121314
A B C D
# FT emp 2FT $/ month 1000FT benefit/ year 5000# weeks/ year 52# weeks/ year open 50PT $/ hour 10PT hrs/ week 80# months / year 12
Part Time Analysis Full Time Analysis Differencewages 40,000$ 24,000$ (16,000)$ benefits -$ 2,000$ 2,000$ total 40,000$ 26,000$ (14,000)$
Store #1
Goal Seek can be accessed from the Tools menu
If we want the value in B14 to be $26000, what would the value in B7 ($/hr PT) have to be, assuming none of the other inputs change?
B14
26000
B7
**Note: Goal seek will not work if a [Group] is selected


![Ppt1 [Edited]](https://static.documents.pub/doc/80x56/545438bfaf795978688b4ce8/ppt1-edited.jpg)


