23
Cisco Quality of Service and DDOS Engineering Issues for Adaptive Defense Network MITRE 7/25/2001

Cisco Quality of Service and DDOS
Engineering Issues for Adaptive Defense NetworkMITRE
7/25/2001

i
Contents
1. INTRODUCTION ...........................................................................................................................................................1
2. TESTBED SETUP..........................................................................................................................................................1
3. QUALITY OF SERVICE (QOS) TESTS.....................................................................................................................3
3.1. FIRST IN, FIRST OUT (FIFO).........................................................................................................................................33.2. PRIORITY QUEUING.......................................................................................................................................................63.3. WEIGHTED FAIR QUEUING.............................................................................................................................................93.4. WEIGHTED RANDOM EARLY DETECTION...................................................................................................................113.5. QOS POLICIES (POLICY 1)...........................................................................................................................................143.6. CUSTOM QUEUEING (CUSTOM QUEUE).......................................................................................................................163.7. RESOURCE RESERVATION PROTOCOL ........................................................................................................................18
4. CONCLUSION ..............................................................................................................................................................20
I
FiguresFIGURE 1 WAN SETUP ...............................................................................................................................................................2FIGURE 2 CISCO PACKET TRAFFIC DURING TRINOO ...............................................................................................................2FIGURE 3 FIFO TRAFFIC EFFECTS..............................................................................................................................................5FIGURE 4 FIFO TCP INTER-PACKET EFFECTS ............................................................................................................................6FIGURE 5 TELNET PRIORITY TRAFFIC EFFECTS ..........................................................................................................................7FIGURE 6 TELNET PRIORITY TELNET TRAFFIC EFFECT .............................................................................................................8FIGURE 7 TELNET PRIORITY TCP INTER-PACKET EFFECTS.......................................................................................................9FIGURE 8 FAIR QUEUE TRAFFIC EFFECTS ................................................................................................................................10FIGURE 9 FAIR QUEUE TCP INTER-PACKET EFFECTS...............................................................................................................11FIGURE 10 WRED TRAFFIC EFFECTS.......................................................................................................................................12FIGURE 11 WRED TELNET TRAFFIC EFFECT...........................................................................................................................13FIGURE 12 WRED TCP INTER-PACKET EFFECTS....................................................................................................................14FIGURE 13 POLICY QUEUE TRAFFIC EFFECTS...........................................................................................................................15FIGURE 14 POLICY QUEUE TCP INTER-PACKET EFFECTS ........................................................................................................16FIGURE 15 CUSTOM QUEUE TRAFFIC EFFECTS........................................................................................................................17FIGURE 16 CUSTOM QUEUE TCP INTER-PACKET EFFECTS ......................................................................................................18FIGURE 17 RSVP TRAFFIC EFFECTS .........................................................................................................................................19FIGURE 18 RSVP TCP INTER-PACKET EFFECTS......................................................................................................................20
1
1. Introduction
During DDoS attacks, attackers can flood a network by launching huge amounts of data traffic frommultiple sources with one or more Internet-connected systems. This tactic essentially shuts the hostsdown by consuming available bandwidth and thus denying reasonable service to normal user traffic.Moreover, since the degradation-of-service may not be immediately noticed, it can potentially occurfor long periods of time.
The purpose of this test is to investigate the impact to the network bandwidth under varying QoSmodes when a traffic flood DDoS occurs. The Cisco router is capable of limiting the bandwidthavailable to selected traffic, assigning traffic priority, or reclassifying the traffic.
2. Testbed Setup
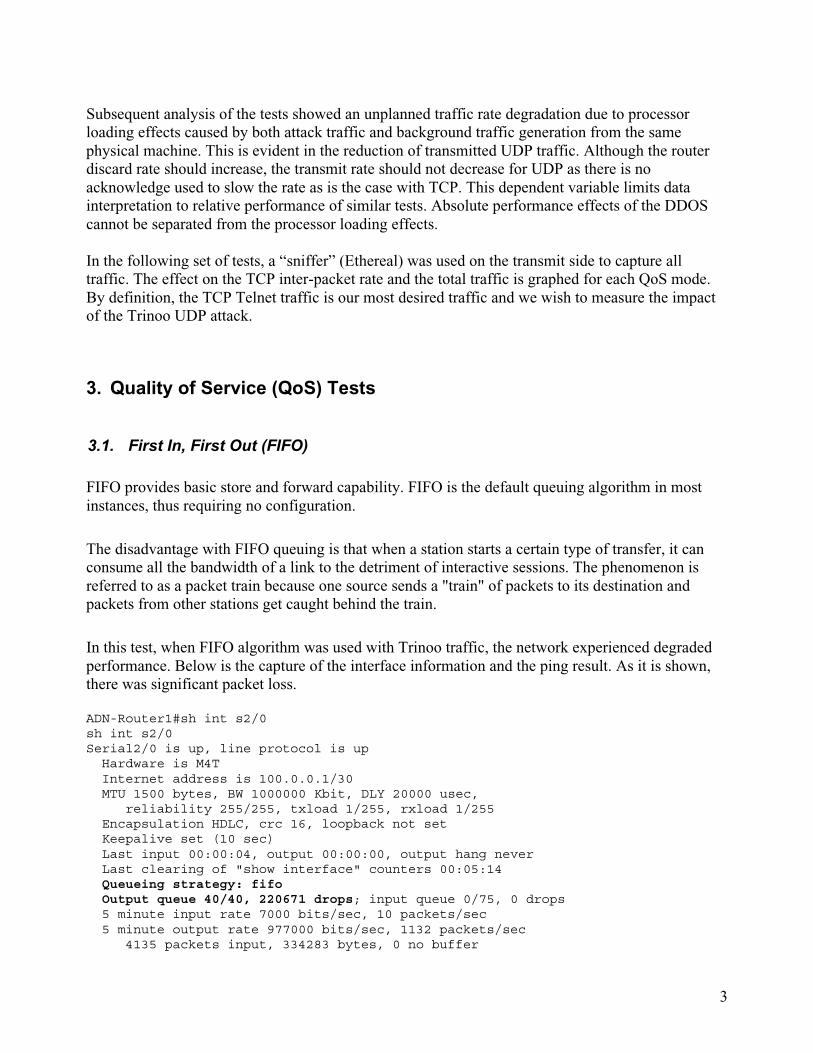
A WAN network was setup for the test as shown in Figure 1. Two Cisco 7200 routers connectedwith simulated T1 serial link, and a victim host on one Ethernet link of router 2. Three attack hostswith Trinoo daemons are located on the Ethernet interfaces of router 1. Host "Org5" was used tosend attack commands to the attacker daemons.
In order to observe the effect of the attack on network bandwidth consumption, a Trinoo DoS attackwas launched. Trinoo daemons generated UDP traffic with random port numbers to the victim host.
A dumb hub, (not shown), was interposed between Orgs 2,3,&4 and the router to provide a tap pointfor an ethernet sniffer.
Figure 2 shows the bandwidth change on the serial link between two Cisco routers when the Trinooattack occurred for 60 seconds with no other traffic.

2
Router 2
Router 1
T1 Link100.0.0.0/30
Org110.0.0.1
Org440.0.0.1
Org330.0.0.1
Org220.0.0.1
Org550.0.0.1
Networkmanagement
Victim
Attacker 1 Attacker 2 Attacker 3
Figure 1 WAN Setup
Figure 2 CISCO Packet Traffic During Trinoo
During the tests, background traffic of 800kbps UDP packets and 150kbps TCP packets weregenerated through the 1 mbps bandwidth link. During the Trinoo attacks, it was observed that asudden increase in traffic saturated the serial link. Under this condition, continuous telnet trafficwas generated via shell script to simulate the mission-critical traffic. Different QoS algorithms weretested to determine the best method to let the desired telnet traffic pass through the link in the faceof the attack.
3
Subsequent analysis of the tests showed an unplanned traffic rate degradation due to processorloading effects caused by both attack traffic and background traffic generation from the samephysical machine. This is evident in the reduction of transmitted UDP traffic. Although the routerdiscard rate should increase, the transmit rate should not decrease for UDP as there is noacknowledge used to slow the rate as is the case with TCP. This dependent variable limits datainterpretation to relative performance of similar tests. Absolute performance effects of the DDOScannot be separated from the processor loading effects.
In the following set of tests, a “sniffer” (Ethereal) was used on the transmit side to capture alltraffic. The effect on the TCP inter-packet rate and the total traffic is graphed for each QoS mode.By definition, the TCP Telnet traffic is our most desired traffic and we wish to measure the impactof the Trinoo UDP attack.
3. Quality of Service (QoS) Tests
3.1. First In, First Out (FIFO)
FIFO provides basic store and forward capability. FIFO is the default queuing algorithm in mostinstances, thus requiring no configuration.
The disadvantage with FIFO queuing is that when a station starts a certain type of transfer, it canconsume all the bandwidth of a link to the detriment of interactive sessions. The phenomenon isreferred to as a packet train because one source sends a "train" of packets to its destination andpackets from other stations get caught behind the train.
In this test, when FIFO algorithm was used with Trinoo traffic, the network experienced degradedperformance. Below is the capture of the interface information and the ping result. As it is shown,there was significant packet loss.
ADN-Router1#sh int s2/0sh int s2/0Serial2/0 is up, line protocol is up Hardware is M4T Internet address is 100.0.0.1/30 MTU 1500 bytes, BW 1000000 Kbit, DLY 20000 usec, reliability 255/255, txload 1/255, rxload 1/255 Encapsulation HDLC, crc 16, loopback not set Keepalive set (10 sec) Last input 00:00:04, output 00:00:00, output hang never Last clearing of "show interface" counters 00:05:14 Queueing strategy: fifo
Output queue 40/40, 220671 drops; input queue 0/75, 0 drops 5 minute input rate 7000 bits/sec, 10 packets/sec 5 minute output rate 977000 bits/sec, 1132 packets/sec 4135 packets input, 334283 bytes, 0 no buffer

4
Received 0 broadcasts, 0 runts, 0 giants, 0 throttles 0 input errors, 0 CRC, 0 frame, 0 overrun, 0 ignored, 0 abort 358419 packets output, 38306091 bytes, 0 underruns 0 output errors, 0 collisions, 1 interface resets 0 output buffer failures, 0 output buffers swapped out 3 carrier transitions DCD=up DSR=up DTR=up RTS=up CTS=up
ADN_Router#pingProtocol [ip]:Target IP address: 10.0.0.1Repeat count [5]: 500Datagram size [100]:Timeout in seconds [2]:Extended commands [n]:Sweep range of sizes [n]:Type escape sequence to abort.Sending 500, 100-byte ICMP Echos to 10.0.0.1, timeout is 2 seconds:.!!!!!!!!!!!!!!!!!!!!!!!!!!.!!..!!!!!!!...!!!!!!!.!!!!!!!!!!!!!!!!!!!!!!!!!....!!!!!!..!!!.!!!!!!..!..!.!!...!!!!!!!!!!!!!!!!!!!!!!!!!!!!!!!!!!.!!!!.!!!!!..!!.!!!!!!!!!!!!.!!!!!!!!!!!!!!!!!!!!!!!!!!!!!!!!!..!!!!!!!!!!!!!!!!!!!!!!!!!!!!!!!!!!!!!!!!!!!!!!!!!!!!!!!!!!!!!!!!.!!!!!!!!.!!!.!!.!!!..!!.!!!!!!!!!!!!!!!!!!!.!!..!!.!!!!.!!!..!!!..!.!!!!!..!!.!..!!!!!!!!!!!!!!!!!!!!!!!!!!!!!!!!!!!!!.!!!!!!!!!!...!!.!!!.!!.!!.!!!!.!!!!.!!!!!!!!.!!!!!!!!!!!!!!!!!!!!!!!!!!!!!!!!!!!!!!!!....!....!!!.!!!!!!!!!!!Success rate is 85 percent (427/500), round-trip min/avg/max = 4/52/144 msADN_Router#
The symbol "!" is successful ping and "." is the ping packet loss.
Figure 3 Shows transmit traffic load for all types of traffic during the test. Note that the 38%reduction in UDP traffic during the Trinoo attack is not a function of the attack but a side effect ofprocessor loading. TCP traffic reduction is affected by both cpu load and acknowledge ratereduction during the attack. In this test, the affects are not separable.
Figure 4 Shows inter-packet time for the transmitted TCP traffic Before, During, & After the Trinooattack. A number of features are apparent. The total number of packets is reduced during the attackwhile at the same time the inter-packet time is significantly increased as shown by the large amountof scattering from the norm. There also appears to be a cyclic effect of approximately 13 secondsthat is continuous throughout the entire test period. No explanation at this time for the 13 secondcycle.

5
UDP, TCP & Trinoo FIFO 1 Mbit
0
200,000
400,000
600,000
800,000
1,000,000
1,200,000
1,400,000
1,600,000
1,800,000
bps before Trinoo bps during Trinoo bps after Trinoo
Test Time
Bit
s p
er S
eco
nd
Org4 Trinoo
Org3 Trinoo
Org2 TrinooOrg4 TCP sent
Org3 TCP sent
Org2 TCP sentOrg4 UDP sent
Org3 UDP sent
Org2 UDP sent
All UDP reduction is due to processorloading.
TCP reduction is mixed processorload and router bandwidth delays.
Figure 3 FIFO Traffic Effects

6
Figure 4 FIFO TCP Inter-packet Effects
3.2. Priority Queuing
Priority queuing is useful in an environment where the network needs strict control over whichtraffic is forwarded. Priority queuing is typically used in situations where it is necessary toguarantee timely delivery of mission-critical traffic. During transmission, the algorithm giveshigher-priority queues preferential treatment over low-priority queues. The priority list commandsets the priority of the traffic defined. The access-list command defines the traffic for the option listused in the priority-list command. The configuration example is as follows:
access-list 150 permit tcp any 100.0.0.2 0.0.0.0 eq telnet
priority-list 1 protocol ip high list 150
priority-list 1 interface Serial2/0 high
priority-list 1 protocol ip medium

7
priority-list 1 default low
In this configuration, the telnet packets are set as the highest priority. The telnet session withdestination 100.0.0.2 is guaranteed to be transferred first.
Figure 5 Shows transmit traffic load for all types of traffic during the test. Note the 26% reductionin UDP traffic during the Trinoo attack. This is a cpu load dependency. Another point to note is thelack of Org3 TCP traffic. Apparently the Org3 TCP traffic generator failed. This lack of Org3 TCPtraffic continues on subsequent test runs.
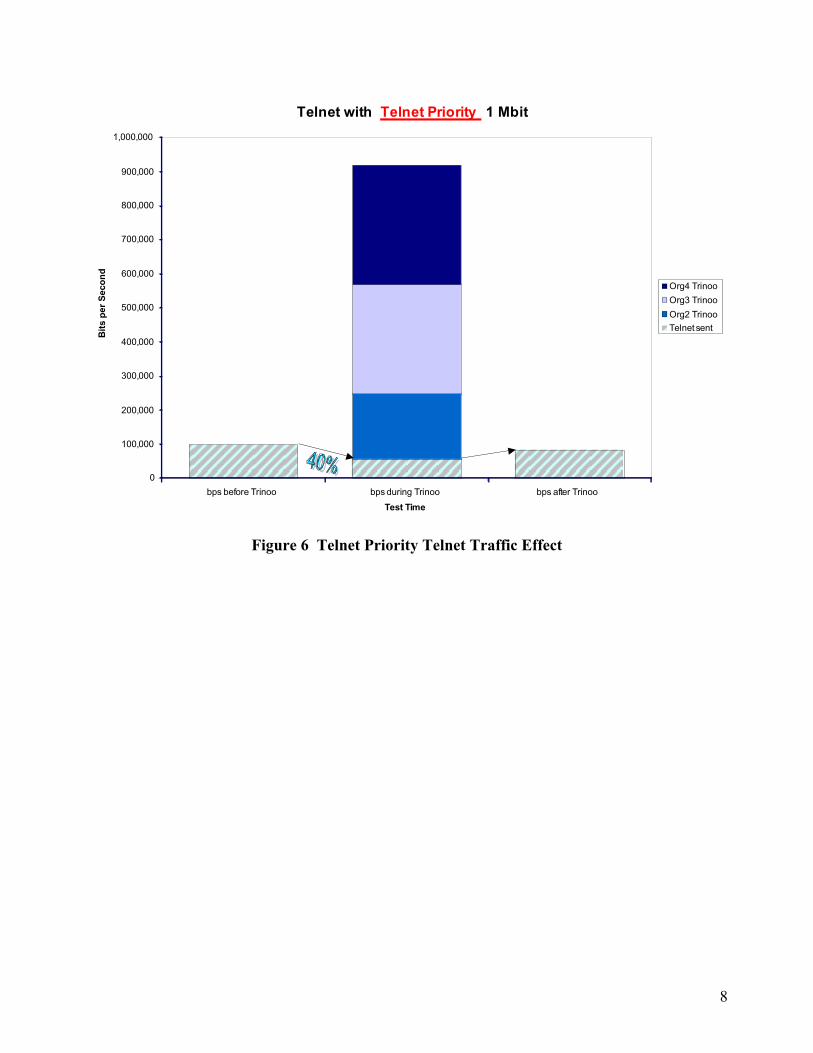
Figure 6 Shows transmit traffic load for Telnet traffic during the test. Note the 40% reduction inTelnet traffic during the Trinoo attack. An unknown portion of this reduction is attributable toprocessor load. Despite the Telnet priority, the actual Telnet reduction is only slightly less than theother TCP traffic.
Figure 7 Shows inter-packet time for the transmitted TCP traffic Before, During, & After the Trinooattack.
Figure 5 Telnet Priority Traffic Effects
8
Telnet with Telnet Priority 1 Mbit
0
100,000
200,000
300,000
400,000
500,000
600,000
700,000
800,000
900,000
1,000,000
bps before Trinoo bps during Trinoo bps after Trinoo
Test Time
Bit
s p
er S
eco
nd
Org4 Trinoo
Org3 Trinoo
Org2 TrinooTelnet sent
Figure 6 Telnet Priority Telnet Traffic Effect

9
Figure 7 Telnet Priority TCP Inter-packet Effects
3.3. Weighted fair queuing
WFQ applies priority (or weights) to identified traffic to classify traffic into conversations anddetermine how much bandwidth each conversation is allowed relative to other conversations. WFQclassifies traffic into different flows based on such characteristics as source and destination address,protocol, and port & socket of the session. Weighted fair queuing is very efficient and requires littleconfiguration. The following is example of fair queuing configuration
Interfaces serial 2/0:
Interface serial 2/0
Fair-queue
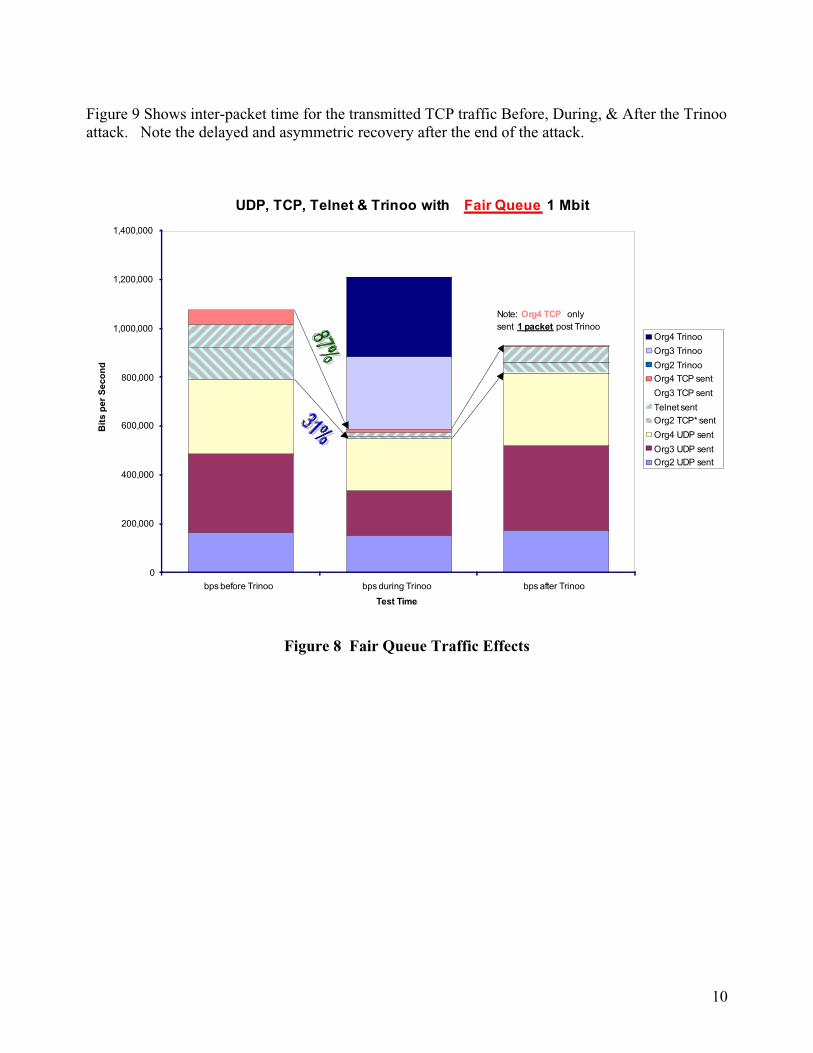
Figure 8 Shows transmit traffic load for all types of traffic during the test. Note that the TCP trafficwas devastated during the Trinoo attack and that recovery afterwards was delayed. Org4 onlymanaged to just start transmitting TCP traffic by the end of the test.
10
Figure 9 Shows inter-packet time for the transmitted TCP traffic Before, During, & After the Trinooattack. Note the delayed and asymmetric recovery after the end of the attack.
UDP, TCP, Telnet & Trinoo with Fair Queue 1 Mbit
0
200,000
400,000
600,000
800,000
1,000,000
1,200,000
1,400,000
bps before Trinoo bps during Trinoo bps after Trinoo
Test Time
Bit
s p
er S
eco
nd
Org4 Trinoo
Org3 Trinoo
Org2 TrinooOrg4 TCP sent
Org3 TCP sent
Telnet sentOrg2 TCP* sent
Org4 UDP sent
Org3 UDP sentOrg2 UDP sent
Note: Org4 TCP only sent 1 packet post Trinoo
Figure 8 Fair Queue Traffic Effects

11
TCP with Telnet traffic Sent Fair Queue 1 MbitInter-packet Delta Time
0.000001
0.00001
0.0001
0.001
0.01
0.1
1
10
100
0 10 20 30 40 50 60 70 80 90
Test Seconds
Inte
rfra
me
Del
ta S
eco
nd
s
Trinoo Start
Org2 TCP* Traffic
Org3 TCP Traffic (none)Org4 TCP traffic
Telnet
Trinoo End
Figure 9 Fair Queue TCP Inter-packet Effects
3.4. Weighted Random Early Detection
Congestion avoidance techniques monitor network traffic loads in an effort to anticipate and avoidcongestion at common network bottlenecks. Congestion avoidance is achieved through packetdropping. Random Early Detection (RED) is a congestion avoidance mechanism that takesadvantage of the congestion control mechanism of TCP. By randomly dropping packets prior toperiods of high congestion, RED tells the packet source to decrease its transmission rate. WREDdrops packets selectively based on IP Precedence. Edge routers assign IP Precedence to packets asthey enter the network. WRED is useful on any output interface where you expect to havecongestion. However, WRED is usually used in the core routers of a network, rather than at theedge. WRED uses these precedences to determine how it treats different types of traffic.
The command to enable WRED is:
Interface serial 2/0
random-detect
There is no need to specify any other commands or parameters in order to configure WRED on theinterface. WRED will use the default parameter values. Cisco recommends not changing the

12
parameters from their default values unless it has been determined that the applications will benefitfrom the changed values.
Figure 10 Shows transmit traffic load for all types of traffic during the test.
Figure 11 Shows transmit traffic load for Telnet traffic during the test.
Figure 12 Shows inter-packet time for the transmitted TCP traffic Before, During, & After theTrinoo attack.
UDP, TCP, Telnet & Trinoo with WRED Priority 1 Mbit
0
200,000
400,000
600,000
800,000
1,000,000
1,200,000
1,400,000
1,600,000
1,800,000
bps before Trinoo bps during Trinoo bps after Trinoo
Test Time
Bit
s p
er S
eco
nd
Org4 Trinoo
Org3 Trinoo
Org2 TrinooOrg4 TCP sent
Org3 TCP sent
Telnet sentOrg2 TCP* sent
Org4 UDP sent
Org3 UDP sentOrg2 UDP sent
Figure 10 WRED Traffic Effects

13
Telnet with WRED Priority 1 Mbit
0
200,000
400,000
600,000
800,000
1,000,000
1,200,000
bps before Trinoo bps during Trinoo bps after Trinoo
Test Time
Bit
s p
er S
eco
nd
Org4 Trinoo
Org3 Trinoo
Org2 TrinooTelnet sent
Figure 11 WRED Telnet Traffic Effect

14
TCP with Telnet traffic Sent WRED Priority 1 MbitInter-packet Delta Time
0.000001
0.00001
0.0001
0.001
0.01
0.1
1
10
0 10 20 30 40 50 60 70 80 90
Test Seconds
Inte
rfra
me
Del
ta S
eco
nd
s
Trinoo Start
Org2 TCP* Traffic
Org3 TCP Traffic (none)Org4 TCP traffic
Telnet
Trinoo End
Figure 12 WRED TCP Inter-packet Effects
3.5. QoS Policies (Policy 1)
Policy-based routing (BPR) provides a mechanism to mark packets so that certain kinds of trafficreceive differentiated, preferential service when used in combination with queuing techniquesenabled. These queuing techniques provide a flexible tool to implement routing policies innetworks. QoS can be provided to differentiate traffic by setting the precedence or type of servicevalues in the IP packet headers at the periphery of the network and leveraging queuing mechanismsto prioritize traffic in the core or backbone of the network. By tagging packets with policy routing,network administrators can classify the network traffic at the perimeter of the network for variousclasses of service and then implement those classes of service in the core of the network usingpriority, custom or weighted fair queuing. This setup improves network performance by eliminatingthe need to classify the traffic explicitly at each WAN interface in the core or backbone network.
Following is the configuration of the QoS policy test:
class-map match-all class1
match access-group 101
policy-map policy1

15
class class1
bandwidth 400000
queue-limit 30
interface Serial2/0
service-policy output policy1
access-list 101 permit tcp any any eq telnet
Figure 13 Shows transmit traffic load for all types of traffic during the test. Note here that the Telnettraffic was not reduced proportionately to the other TCP traffic.
Figure 14 Shows inter-packet time for the transmitted TCP traffic Before, During, & After theTrinoo attack.
UDP, TCP, Telnet & Trinoo with Policy #1 1 Mbit
0
200,000
400,000
600,000
800,000
1,000,000
1,200,000
1,400,000
1,600,000
bps before Trinoo bps during Trinoo bps after Trinoo
Test Time
Bit
s p
er S
eco
nd
Org4 Trinoo
Org3 Trinoo
Org2 TrinooOrg4 TCP sent
Org3 TCP sent
Telnet sentOrg2 TCP* sent
Org4 UDP sent
Org3 UDP sentOrg2 UDP sent
Figure 13 Policy Queue Traffic Effects

16
TCP with Telnet traffic Sent Policy #1 1 MbitInter-packet Delta Time
0.000001
0.00001
0.0001
0.001
0.01
0.1
1
10
0 10 20 30 40 50 60 70 80 90
Test Seconds
Inte
rfra
me
Del
ta S
eco
nd
s
Trinoo Start
Org2 TCP* Traffic
Org3 TCP Traffic (none)Org4 TCP traffic
Telnet
Trinoo End
Figure 14 Policy Queue TCP Inter-packet Effects
3.6. Custom Queueing (custom queue)Custom queuing (CQ) was designed to allow various applications or organizations to share thenetwork among applications with specific minimum bandwidth or latency requirements. In theseenvironments, bandwidth must be shared proportionally between applications and users. This CiscoCQ feature provides a guaranteed bandwidth at a potential congestion point, assuring the specifiedtraffic a fixed portion of available bandwidth and leaving the remaining bandwidth to other traffic.Custom queuing handles traffic by assigning a specified amount of queue space to each class ofpackets and then servicing the queues in a round-robin fashion. The following configuration wasused for our custom queueong test:access-list 101 permit tcp any any eq telnet
access-list 102 permit udp any any
access-list 103 permit tcp any any gt telnet
queue-list 1 protocol ip 1 list 101
queue-list 1 protocol ip 2 list 102
queue-list 1 protocol ip 3 list 103
queue-list 1 default 4

17
queue-list 1 queue 1 byte-count 9000
queue-list 1 queue 2 byte-count 500
In this test, the telnet traffic was configured to be in queue 1 with 9000 bytes in the queue whereasthe UDP traffic was in the queue 2 with 500 byte in the queue. And any TCP traffic other than telnetis in queue3.
Figure 15 Shows transmit traffic load for all types of traffic during the test. Note that the Telnettraffic does not show the expected priority.
Figure 16 Shows inter-packet time for the transmitted TCP traffic Before, During, & After theTrinoo attack.
UDP, TCP, Telnet & Trinoo with Custom Queue 1 Mbit
0
200,000
400,000
600,000
800,000
1,000,000
1,200,000
1,400,000
1,600,000
bps before Trinoo bps during Trinoo bps after Trinoo
Test Time
Bit
s p
er S
eco
nd
Org4 Trinoo
Org3 Trinoo
Org2 TrinooOrg4 TCP sent
Org3 TCP sent
Telnet sentOrg2 TCP* sent
Org4 UDP sent
Org3 UDP sentOrg2 UDP sent
Figure 15 Custom Queue Traffic Effects

18
TCP with Telnet traffic Sent Custom Queue 1 MbitInter-packet Delta Time
0.000001
0.00001
0.0001
0.001
0.01
0.1
1
10
0 10 20 30 40 50 60 70 80 90
Test Seconds
Inte
rfra
me
Del
ta S
eco
nd
s
Trinoo Start
Org2 TCP* Traffic
Org3 TCP Traffic (none)Org4 TCP traffic
Telnet
Trinoo End
Figure 16 Custom Queue TCP Inter-packet Effects
3.7. Resource Reservation Protocol
RSVP is designed to deliver QoS for multimedia packets that require sustained bandwidth, lowdelay and low variance over the Internet. RSVP defines the paths for data flow by installing therequirements or specifications for delivery in routers (network data transmitters) and hosts (localoperating systems). To achieve such a function, each router and host along the data flow path mustpossess an entity to act as an agent of RSVP.
The RSVP protocol is part of a larger effort to enhance the current Internet architecture with supportfor QoS flows. The RSVP protocol is used by a host to request specific qualities of service from thenetwork for particular application data streams or flows. RSVP is also used by routers to deliverquality-of-service (QoS) requests to all nodes along the path(s) of the flows and to establish andmaintain state to provide the requested service. RSVP requests will generally result in resourcesbeing reserved in each node along the data path.
In this test, RSVP was setup between the serial interfaces of the two routers. It was configured as:

19
ip rsvp reservation 100.0.0.2 100.0.0.1 TCP 23 23 100.0.0.2 Serial2/0 FF LOAD 300000 400
interface Serial2/0fair-queue 64 256 1000ip rsvp bandwidth 300000 300000
Figure 17 Shows transmit traffic load for all types of traffic during the test. Note that the TCPtraffic was devastated during the Trinoo attack. Indications are that this test was reverse optimized.
Figure 18 Shows inter-packet time for the transmitted TCP traffic Before, During, & After theTrinoo attack. Traffic seemed to block up by source and type in this mode with long delaysbetween changes. This is shown here by the source grouping before and after the attack with animplied UDP type grouping during the attack.
UDP, TCP, Telnet & Trinoo with RSVP 300K 1 Mbit
0
200,000
400,000
600,000
800,000
1,000,000
1,200,000
1,400,000
1,600,000
Test Time
Bit
s p
er S
eco
nd
Org4 Trinoo
Org3 Trinoo
Org2 TrinooOrg4 TCP sent
Org3 TCP sent
Telnet sentOrg2 TCP* sent
Org4 UDP sent
Org3 UDP sentOrg2 UDP sent
Figure 17 RSVP Traffic Effects

20
TCP with Telnet traffic Sent RSVP 300K 1 MbitInter-packet Delta Time
0.000001
0.00001
0.0001
0.001
0.01
0.1
1
10
100
0 10 20 30 40 50 60 70 80 90
Test Seconds
Inte
rfra
me
Del
ta S
eco
nd
s
Trinoo Start
Org2 TCP* Traffic
Org3 TCP Traffic (none)Org4 TCP traffic
Telnet
Trinoo End
Figure 18 RSVP TCP Inter-packet Effects
4. ConclusionUsing this one type of attack, (TRINOO normal UDP packet flooding), it’s clear that the routerconfiguration used can radically effect performance. Performance in the face of attack ranged fromsignificantly degraded to completely devastated.
It appears that even severely degraded, there is enough in-band channel availability to allowconfiguration control traffic. This is probably dependent upon not overwhelming the routercapabilities but it is reasonable to assume that the router traffic capability is always greater than thechannel bandwidth capacity in any viable network configuration.
Future tests need to isolate the “normal” traffic and the “attack” traffic on physically separatemachines. This is necessary to eliminate the dependency inadvertently introduced due to cpuloading effects. Similarly both input and output traffic need to be captured and correlated toeliminate the need to infer packet discards.
Other classes of attack that are not simple traffic flooding, (such as malformed packets), need to betested. It cannot be assumed that the relative effects will be similar.
Defense mechanisms must be tested with the assumption of a knowledgeable attacker. That is,control ports and devices are known and are themselves subject to attack and misuse.


