Page 1
Cisco Systems, Inc. July 1st, 2018
1 | P a g e
Cisco Systems, Inc.
Summary
Cisco Systems, Inc. is a Communications
Equipment company that creates networking,
routing, data management, cloud-based solutions
and data security hardware and software for
business-to-business customers. Founded in 1984
and incorporated in San Jose, California, Cisco
Systems, Inc. is the largest networking company in
the world with over $200 billion in market
capitalization.
Investment Thesis
We are recommending that investors SELL Cisco
Systems, Inc. due to the following reasons:
• Much of the current stock price is
speculative based on a strategic shift to a
recurring revenue stream the company has
not yet achieved
• Cisco’s market share in certain key areas of
business have been declining in recent
years and may continue to decline as focus
shifts
• Discounted Cash Flow and Valuation
Metrics show Cisco’s stock price to be
overvalued when shifts in revenue are
considered
Risks
Risks to investing in Cisco Systems, Inc. include:
• Macroeconomic factors like tariffs that may
slowdown current economic expansion
• Federal Reserve interest rate increases
• Slowdown in IT spending
Company Information
Ticker CSCO
Sector Information Technology
Industry Communication Equipment
Price as of 5/23/18 $43.68
Market cap (mn) $218,837
Shares Outstanding (mn) 5,010
Recommendation
Stock Rating Sell
Price Target $41.11
Implied Upside -5.88%
Dividend Yield 3.02%
Key Statistics
Revenue (TTM- mn) $48,005
Earnings (TTM- mn) $30,224
EPS (TTM) $1.90
P/E 20.83
Beta 1.26
Performance History
52-week High $46.37
52-week Low $30.36
1-year return 53%
Contact Information
Email [email protected]
Phone Number (818) 571-2075
BUSFIN 7225 – Student Investment Management Fund Manager: Royce West Research Analyst: Korey Murnane July 1st, 2018
Page 2
Cisco Systems, Inc. July 1st, 2018
2 | P a g e
Company Overview ………………………………………………………………………………………………………………….3
Business Segments ……………………………………………………………………………………………………….3
Products ……………………………………………………………………………………………………………4
Services …………………………………………………………………………………………………………….6
Market Landscape ………………………………………………………………………………………………………..6
Sector Landscape ………………………………………………………………………………………………6
Competitive Landscape …………………………………………………………………………………….7
Market Drivers ………………………………………………………………………………………………….8
Strategy Shift …………………………………………………………………………………………………….9
Recent Stock News ……………………………………………………………………………………………………….9
Mixed Results …………………………………………………………………………………………………...9
New Partnerships ……………………………………………………………………………………………10
Investment Thesis ………………………………………………………………………………………………………………….10
Fundamental Drivers ………………………………………………………….……………………………………...10
Economic Analysis …………………………………………………………………………………………………………………..13
Financial Forecasts ………………………………………………………………………………………………………………….14
Valuation and Price Target …………………………………………………………………………………………………………………..15
Risks …………………………………………………………………………………………………………………………………………………….16
Industry Risks ………………………………………………………………………………………………………………………….16
Company-specific Risks ……………………………………………………………………………………………………………17
Conclusion ……………………………………………………………………………………………………………………………………………17
Appendices ………………………………………………………………………………………………………………………………………….18
Appendix I: Cisco Systems, Inc. Income Statement ………………………………………………………………….18
Appendix II: Cisco Systems, Inc. Discounted Cash Flow ……………………………………………………………19
Appendix III: Cisco Systems, Inc. Competitors’ 1-year Share Return ………………………………………..20
References …………………………………………………………………………………………………………………………………………..20
Page 3
Cisco Systems, Inc. July 1st, 2018
3 | P a g e
Company Overview
Cisco Systems, Inc. is an Information Technology company specializing in networking, security,
collaboration and cloud-based technologies. Cisco Systems places an emphasis on acquiring
companies and technologies and integrating them into the Cisco Strategy, making over 25
acquisitions since 2013. Notable acquisitions include OpenDNS, WebEx, Jabber and Jasper.
Over the last few years, Cisco Systems has placed a larger emphasis on their Services Revenue
and expanding their Internet of Things product and services offerings.1
Cisco Systems, Inc. is headquartered in San Jose, California, within the heart of the Silicon
Valley. Cisco Systems operates worldwide, separating its business into geographic segments:
Americas; Europe, Middle East and Africa; and Asia Pacific, Japan and China.2 Founded in 1984
and incorporated in California, Cisco Systems is the largest networking company in the world
based on market capitalization.3
Business Segments
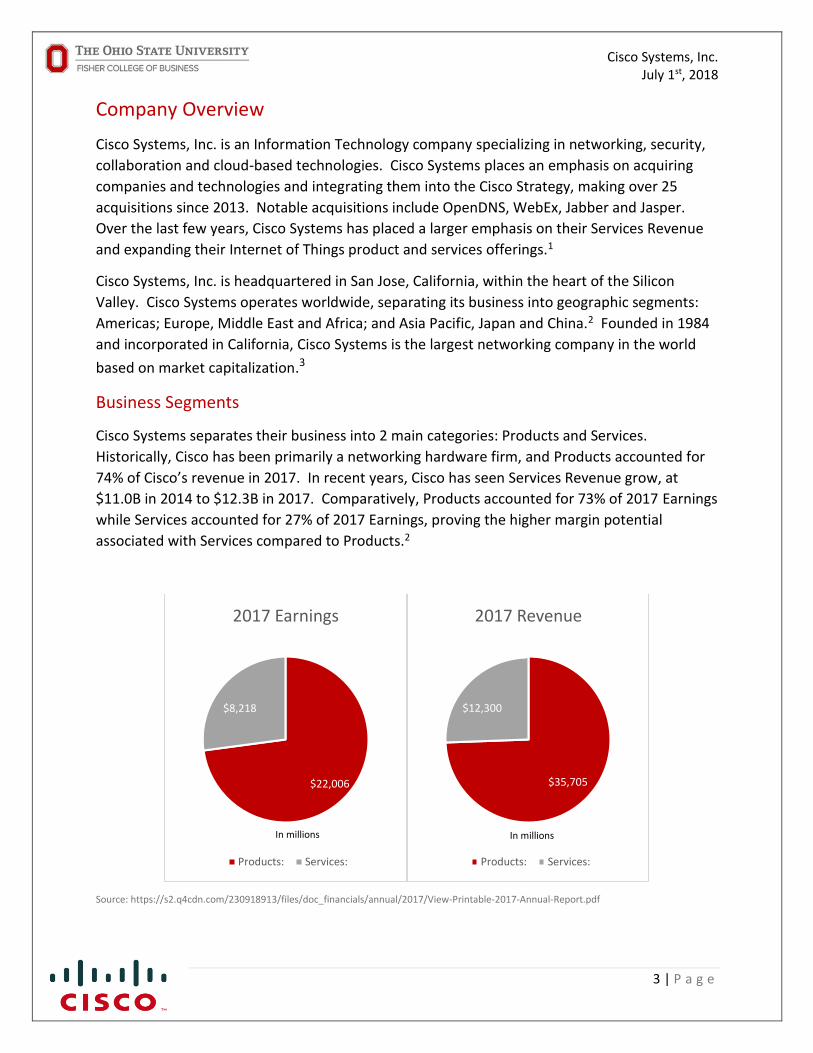
Cisco Systems separates their business into 2 main categories: Products and Services.
Historically, Cisco has been primarily a networking hardware firm, and Products accounted for
74% of Cisco’s revenue in 2017. In recent years, Cisco has seen Services Revenue grow, at
$11.0B in 2014 to $12.3B in 2017. Comparatively, Products accounted for 73% of 2017 Earnings
while Services accounted for 27% of 2017 Earnings, proving the higher margin potential
associated with Services compared to Products.2
$22,006
$8,218
2017 Earnings
Products: Services:
In millions
$35,705
$12,300
2017 Revenue
Products: Services:
In millions
Source: https://s2.q4cdn.com/230918913/files/doc_financials/annual/2017/View-Printable-2017-Annual-Report.pdf
Page 4
Cisco Systems, Inc. July 1st, 2018
4 | P a g e
Products
Cisco breaks down the product category into 8 subcategories: Switching, Next-Generation
Network (NGN) Routing, Collaboration, Data Center, Wireless, Security, Service Provider Video
and Other.2
Switching
The Switching subcategory is the largest of the product categories, making up 39% of Products
Revenue and 29% of total Revenue for Cisco in 2017.2 The Switching segment works with
technology to interconnect different devices on the same network and help them to work
efficiently together. This segment deals primarily with business-to-business relationships,
promoting managed switching technology to create more controllable and secure networks.4
Next-Generation Network (NGN) Routing
The NGN Routing subcategory is the second largest product category, accounting for 22% of
Products Revenue and 16% of Cisco’s total revenue in 2017.2 NGN Routing is an initiative by
companies like Cisco to create one more efficient network that can transport all types of
information, including voice, video, data and signaling, and be able to package and transport it
through this efficient network. This technology creates efficiencies for companies utilizing
different forms of communication within its network.5
Collaboration
The Collaboration subcategory accounted for 12% of Cisco’s Products Revenue and 9% of Total
Revenue in 2017. Collaboration focuses on communications and telecommunications
technology, such as Unified Communications, Conferencing, Collaboration Endpoints and
Business Messaging. Video and voice conferencing, including WebEx, are included within this
subcategory.2
Data Center
The Data Center subcategory accounted for 9% of Cisco’s Products Revenue and 7% of Total
Revenue in 2017.2 Cisco’s Data Centers offer customers an efficient, smart, secure, self-
adapting and analytical place to store and retrieve data. Cisco’s Data Centers are equipped
with Artificial Intelligence that will not only store but analyze data that customers deem
valuable to learning about their business.6
Wireless
The Wireless subcategory accounted for 8% of Cisco’s Products Revenue and 6% of Total
Revenue in 2017.2 Cisco’s Wireless business is centered around providing businesses with
wireless access to the internet and clouds and is very important to the Internet of Things
Page 5
Cisco Systems, Inc. July 1st, 2018
5 | P a g e
initiative. This subcategory offers products like wireless access points, WLAN controllers,
connected mobile experiences and software associated with wireless access security.7
Security
The Security subcategory accounted for 6% of Cisco’s Products Revenue and 4% of Total
Revenue in 2017. Cisco’s Security products are focused on providing their customers with ways
to shorten the time it takes to detect and respond to a cyber-attack and to identify ransomware
and malware very quickly so customers can feel secure that the information in their networks
and clouds is secure.2
Service Provider Video
The Service Provider Video subcategory accounted for 3% of Cisco’s Products Revenue and 4%
of Total Revenue in 2017. Service Provider Video seeks to utilize Internet Protocol (IP) to
broadcast and transmit entertainment that has traditionally been transmitted through cable or
satellite devices. Cisco launched their Infinite Video Platform within this subcategory to provide
customers with faster speeds and the video-over-IP they are looking for.2
Other Products
Other Products accounted for 2% of Cisco’s Products Revenue and 1% of Total Revenue in 2017.
This subcategory consists mostly of emerging technologies and products that Cisco offers and
includes new products associated with expanding the Internet of Things initiative. This
subcategory includes the acquired Jasper technologies and products, which works with
companies to launch Internet of Things technologies around the globe.2
Source: https://s2.q4cdn.com/230918913/files/doc_financials/annual/2017/View-Printable-2017-Annual-Report.pdf
In millions
Page 6
Cisco Systems, Inc. July 1st, 2018
6 | P a g e
Services
Cisco offers a variety of services alongside their products, many of which are related to
technical support for the products themselves. Cisco additionally offers advanced services to
customers with very specific needs to help them solve communications and networking
problems. Cisco breaks their services customers into 4 segments: Enterprise Businesses,
Commercial Businesses, Service Providers and Public Sector. No single customer makes up
more than 10% of the Services Revenue.2
Cisco tracks Service Revenue by geographic regions: Americas; Europe, Middle East and Africa
(EMEA); Asia Pacific, Japan and China (APJC). Of these geographic areas, Americas accounts for
64% of the Total Services Revenue.2
Market Landscape
Sector Landscape
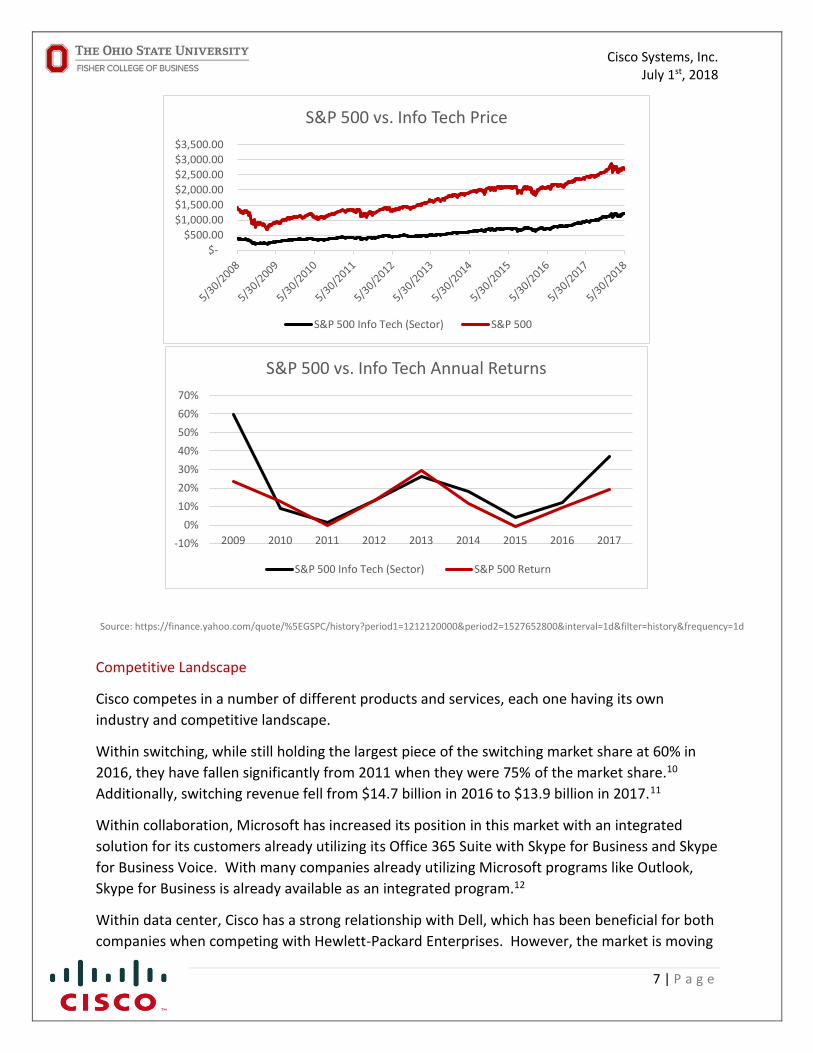
The current expansion has seen the S&P 500 increase by 95% in 10 years. During that same period, the
Information Technology sector has increased by 211%.8 Current belief is that the market is approaching
the end of the current expansion. However, if this is true, the Information Technology sector is not
behaving how it is expected to during the end of an expansion. The Information Technology sector is
expected to outperform the S&P 500 during the early and middle stages of an economic expansion, but
then underperform the S&P 500 during the later stages of expansion and during any recession.9 The
Information Technology sector saw its largest gains since 2009 during 2017, with an average return of
37%. This may signal that an economic downturn could be further off than many believe.
Source: https://s2.q4cdn.com/230918913/files/doc_financials/annual/2017/View-Printable-2017-Annual-Report.pdf
In millions
Page 7
Cisco Systems, Inc. July 1st, 2018
7 | P a g e
Competitive Landscape
Cisco competes in a number of different products and services, each one having its own
industry and competitive landscape.
Within switching, while still holding the largest piece of the switching market share at 60% in
2016, they have fallen significantly from 2011 when they were 75% of the market share.10
Additionally, switching revenue fell from $14.7 billion in 2016 to $13.9 billion in 2017.11
Within collaboration, Microsoft has increased its position in this market with an integrated
solution for its customers already utilizing its Office 365 Suite with Skype for Business and Skype
for Business Voice. With many companies already utilizing Microsoft programs like Outlook,
Skype for Business is already available as an integrated program.12
Within data center, Cisco has a strong relationship with Dell, which has been beneficial for both
companies when competing with Hewlett-Packard Enterprises. However, the market is moving
$-
$500.00
$1,000.00
$1,500.00
$2,000.00
$2,500.00
$3,000.00
$3,500.00
S&P 500 vs. Info Tech Price
S&P 500 Info Tech (Sector) S&P 500
-10%
0%
10%
20%
30%
40%
50%
60%
70%
2009 2010 2011 2012 2013 2014 2015 2016 2017
S&P 500 vs. Info Tech Annual Returns
S&P 500 Info Tech (Sector) S&P 500 Return
Source: https://finance.yahoo.com/quote/%5EGSPC/history?period1=1212120000&period2=1527652800&interval=1d&filter=history&frequency=1d
Page 8
Cisco Systems, Inc. July 1st, 2018
8 | P a g e
away from a converged infrastructure, which Cisco offers with its HyperFlex product, and
moving toward Hyperconverged, which Dell offers with its VxRack and VxRail products.
Additionally, smaller players, like Arista and Broadcom, are expected to increase competition in
this market in the coming years.12
Within Security, Cisco has a competitive advantage because very few alternatives can offer
customers security at so many different points in a customer’s network. Companies like
FireEye, VMware and Fortinet are companies that are beginning to emerge as players within
this market. However, expectations are that it will be a few years before they will be in a
position to compete with Cisco.12
Within Wireless, Cisco CEO Chuck Robbins is predicting that controller-less solutions are
becoming preferred within the market, which could put Cisco at a disadvantage in the coming
years. Companies like Aruba and Aerohive are primed to introduce more controller-less
solutions and could move market share away from Cisco in this way.12
Market Drivers
Between 2018 and 2017, spending on Information Technology is expected to grow at a rate of
4.4%, and expectations are that it should continue to grow by 2.7% into 2019.13 This points to
continued expansion within the Information Technology sector of the S&P 500, as companies
use items like the tax cuts and high revenues to upgrade and invest in technologies to help
business. With Cisco’s emphasis on business-to-business IT solutions and creating efficient
networks for businesses, it is expected that Cisco’s revenue should increase in 2018 and 2019.
$-
$500
$1,000
$1,500
$2,000
$2,500
$3,000
$3,500
$4,000
Data C
enter Syste
ms
Ente
rprise So
ftware
Device
s
IT Services
Co
mm
un
ication
sSe
rvices
Overall IT
IT Spending
2017 Spending 2018 Spending 2019 Spending (Expected)
In millions
Source: https://www.gartner.com/newsroom/id/3845563
Page 9
Cisco Systems, Inc. July 1st, 2018
9 | P a g e
Strategy Shift
In 2016, Cisco announced that they would be overhauling their strategy and moving away from
a hardware-based business and begin moving into cloud-based software programming and
subscription-based services to create a more stable revenue stream.14 Considering that in
2017, Product Revenue consisted of 74% of revenue while Services accounted for 26%, this is a
major shift in Cisco’s core business.
Recent Stock News
Mixed Results
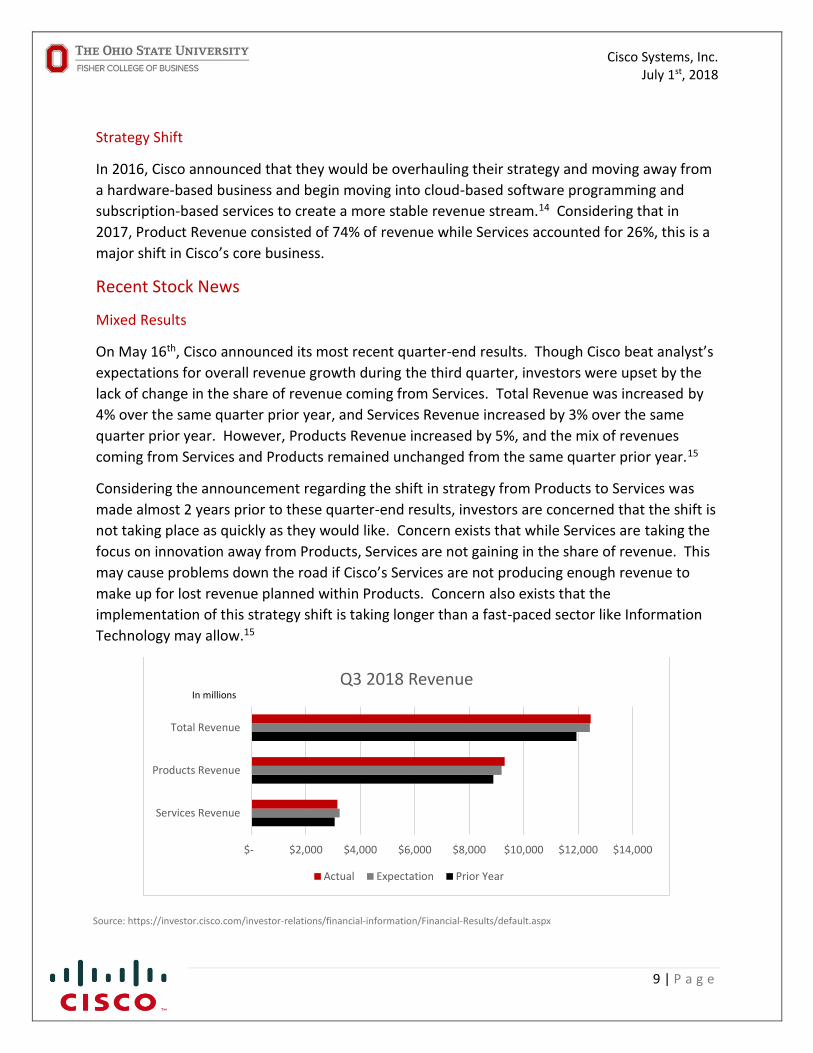
On May 16th, Cisco announced its most recent quarter-end results. Though Cisco beat analyst’s
expectations for overall revenue growth during the third quarter, investors were upset by the
lack of change in the share of revenue coming from Services. Total Revenue was increased by
4% over the same quarter prior year, and Services Revenue increased by 3% over the same
quarter prior year. However, Products Revenue increased by 5%, and the mix of revenues
coming from Services and Products remained unchanged from the same quarter prior year.15
Considering the announcement regarding the shift in strategy from Products to Services was
made almost 2 years prior to these quarter-end results, investors are concerned that the shift is
not taking place as quickly as they would like. Concern exists that while Services are taking the
focus on innovation away from Products, Services are not gaining in the share of revenue. This
may cause problems down the road if Cisco’s Services are not producing enough revenue to
make up for lost revenue planned within Products. Concern also exists that the
implementation of this strategy shift is taking longer than a fast-paced sector like Information
Technology may allow.15
$- $2,000 $4,000 $6,000 $8,000 $10,000 $12,000 $14,000
Services Revenue
Products Revenue
Total Revenue
Q3 2018 Revenue
Actual Expectation Prior Year
In millions
Source: https://investor.cisco.com/investor-relations/financial-information/Financial-Results/default.aspx
Page 10
Cisco Systems, Inc. July 1st, 2018
10 | P a g e
New Partnerships
Google Cloud
In June 2018, Cisco announced at their annual Cisco Live US event in Orlando that they would
be partnering with Google to utilize Google’s Cloud technology to jumpstart its efforts to
implement more cloud networking software. This announcement comes as competitors of
Cisco, like IBM and Oracle, have implemented their own cloud technology and struggled to
reach customers due to concerns around data security and functionality within the cloud. Cisco
seeks to capitalize on Google’s brand name and experience with an integrated cloud to move
forward with its shift of focus from hardware to more cloud-based software programming.16
Disney StudioLAB
In June 2018, Cisco and Disney announced a partnership to collaborate on Disney’s StudioLAB
initiative. This initiative was launched in March of 2018 by Disney to innovate and change how
audiences consume entertainment, which Disney believes Cisco can help with. Cisco and
Disney believe that Cisco’s technology can be used to create more efficient studio production
processes and can allow for data and production assets to be uploaded from studio sets to the
cloud. Additionally, Cisco will help Disney with security and using collaborative software.17
Investment Thesis
Fundamental Drivers
There are three drivers that will determine Cisco’s outlook moving forward, some of which are
currently over-valued: 1) Cloud-based software initiatives, 2) Move to subscription-based
service revenue, 3) Hardware staying competitive to hedge software and service revenues.
The current outlook for Cisco is uncertain, which should be reflected in the current stock price.
However, investors have speculated that Cisco will successfully make the transition to service
revenue, which is artificially inflating the stock price.
Cloud-Based Software Initiatives
Historically, most large companies have been concerned with control and security around their
data. This has led technology companies like Cisco to invest in Enterprise Content Management
(ECM), which puts data on-site for organizations. While ECM has been more secure, it limits an
enterprise’s employees’ ability to access the information remotely, is very costly to maintain
and house the equipment required, and the data transfer can be inefficient. With advances in
cloud-based storage security, companies are now looking to move to cloud-based data storage
to capitalize on the efficiencies and cost savings that this technology can provide. Because of
this, the worldwide annual spend on cloud computing rose more than 20% between 2015 and
2017, and is expected to increase by more than 15% between 2018 and 2020.18
Page 11
Cisco Systems, Inc. July 1st, 2018
11 | P a g e
As was noted in the Recent Stock News section, Cisco recently entered into a partnership with
Google to utilize the brand and security associated with the Google Cloud as Cisco moves into
more cloud-based products for its customers. With many large and highly-publicized data
breach cases that have tarnished the image of companies like Equifax, companies are
concerned that not all clouds are secure. With the desire still existing for more cloud-based
data storage, companies are looking for secure solutions. Google’s cloud technology provides
Cisco with a highly secure cloud environment that Cisco’s customers can trust.16
Move to Subscription-based Service Revenue
With the strategy shift to cloud-based and subscription-based Services revenue to create more
recurring revenue compared to Cisco’s traditional strategy of completing large, one-time sales
and equipment installations, Cisco is attempting to create a more predictable revenue stream.
However, the third quarter results that were announced in May showed some troubling trends
for a company two years into a strategy shift. While much emphasis can be put on the lack of
revenue shifting from products to services, what may be more troubling is that only 32% of
Cisco’s revenue during this quarter was recurring revenue.15 The past 4 quarters had seen
steady increases in recurring revenue as a percent of total revenue.2
$67
$82
$99
$117
$138
$162
$-
$20
$40
$60
$80
$100
$120
$140
$160
$180
2015 2016 2017 2018 2019 2020
Worldwide Cloud Computing SpendingIn billions
Source: https://www.forbes.com/sites/louiscolumbus/2017/04/29/roundup-of-cloud-computing-forecasts-2017/#70b0507731e8
Page 12
Cisco Systems, Inc. July 1st, 2018
12 | P a g e
Hardware Staying Competitive
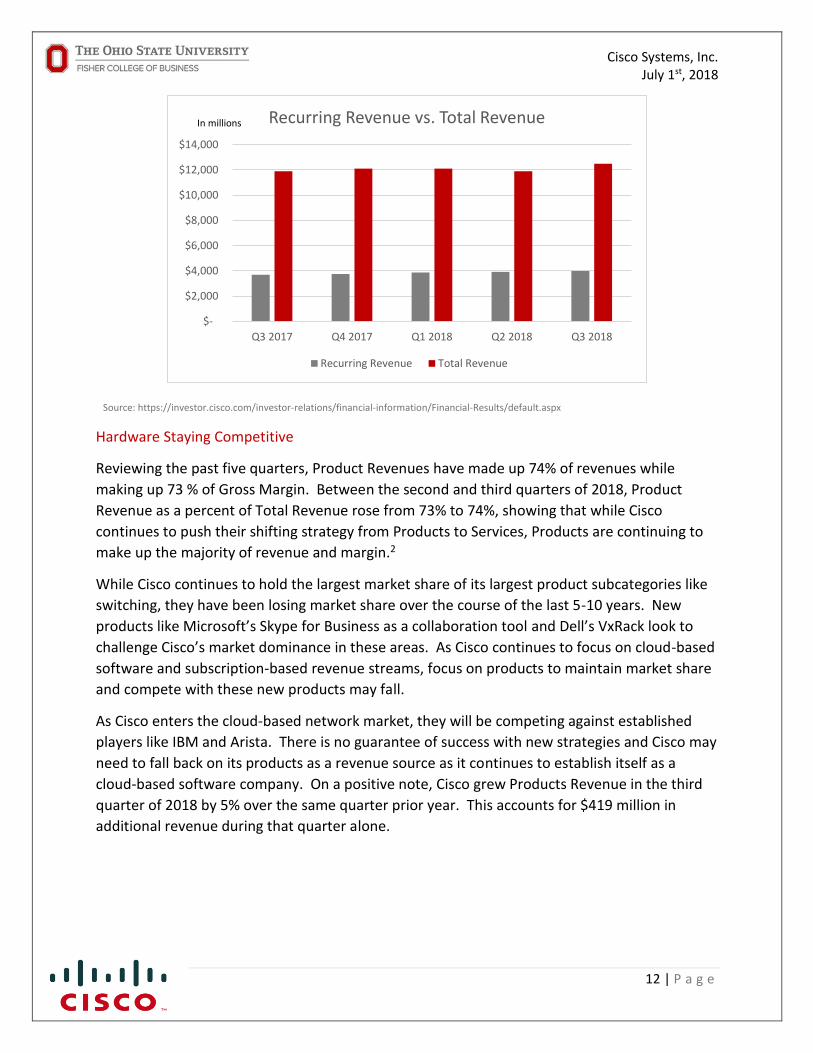
Reviewing the past five quarters, Product Revenues have made up 74% of revenues while
making up 73 % of Gross Margin. Between the second and third quarters of 2018, Product
Revenue as a percent of Total Revenue rose from 73% to 74%, showing that while Cisco
continues to push their shifting strategy from Products to Services, Products are continuing to
make up the majority of revenue and margin.2
While Cisco continues to hold the largest market share of its largest product subcategories like
switching, they have been losing market share over the course of the last 5-10 years. New
products like Microsoft’s Skype for Business as a collaboration tool and Dell’s VxRack look to
challenge Cisco’s market dominance in these areas. As Cisco continues to focus on cloud-based
software and subscription-based revenue streams, focus on products to maintain market share
and compete with these new products may fall.
As Cisco enters the cloud-based network market, they will be competing against established
players like IBM and Arista. There is no guarantee of success with new strategies and Cisco may
need to fall back on its products as a revenue source as it continues to establish itself as a
cloud-based software company. On a positive note, Cisco grew Products Revenue in the third
quarter of 2018 by 5% over the same quarter prior year. This accounts for $419 million in
additional revenue during that quarter alone.
$-
$2,000
$4,000
$6,000
$8,000
$10,000
$12,000
$14,000
Q3 2017 Q4 2017 Q1 2018 Q2 2018 Q3 2018
Recurring Revenue vs. Total Revenue
Recurring Revenue Total Revenue
In millions
Source: https://investor.cisco.com/investor-relations/financial-information/Financial-Results/default.aspx
Page 13
Cisco Systems, Inc. July 1st, 2018
13 | P a g e
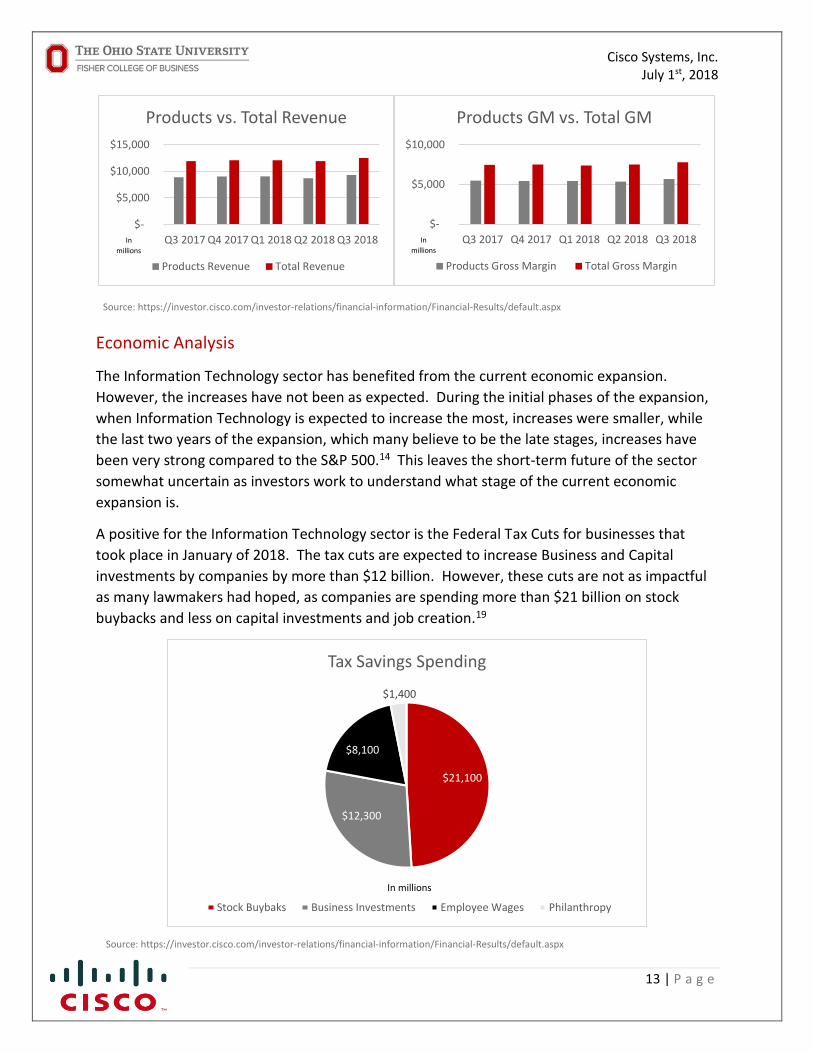
Economic Analysis
The Information Technology sector has benefited from the current economic expansion.
However, the increases have not been as expected. During the initial phases of the expansion,
when Information Technology is expected to increase the most, increases were smaller, while
the last two years of the expansion, which many believe to be the late stages, increases have
been very strong compared to the S&P 500.14 This leaves the short-term future of the sector
somewhat uncertain as investors work to understand what stage of the current economic
expansion is.
A positive for the Information Technology sector is the Federal Tax Cuts for businesses that
took place in January of 2018. The tax cuts are expected to increase Business and Capital
investments by companies by more than $12 billion. However, these cuts are not as impactful
as many lawmakers had hoped, as companies are spending more than $21 billion on stock
buybacks and less on capital investments and job creation.19
$-
$5,000
$10,000
$15,000
Q3 2017 Q4 2017 Q1 2018 Q2 2018 Q3 2018
Products vs. Total Revenue
Products Revenue Total Revenue
In
millions
$-
$5,000
$10,000
Q3 2017 Q4 2017 Q1 2018 Q2 2018 Q3 2018
Products GM vs. Total GM
Products Gross Margin Total Gross Margin
In
millions
$21,100
$12,300
$8,100
$1,400
Tax Savings Spending
Stock Buybaks Business Investments Employee Wages Philanthropy
In millions
Source: https://investor.cisco.com/investor-relations/financial-information/Financial-Results/default.aspx
Source: https://investor.cisco.com/investor-relations/financial-information/Financial-Results/default.aspx
Page 14
Cisco Systems, Inc. July 1st, 2018
14 | P a g e
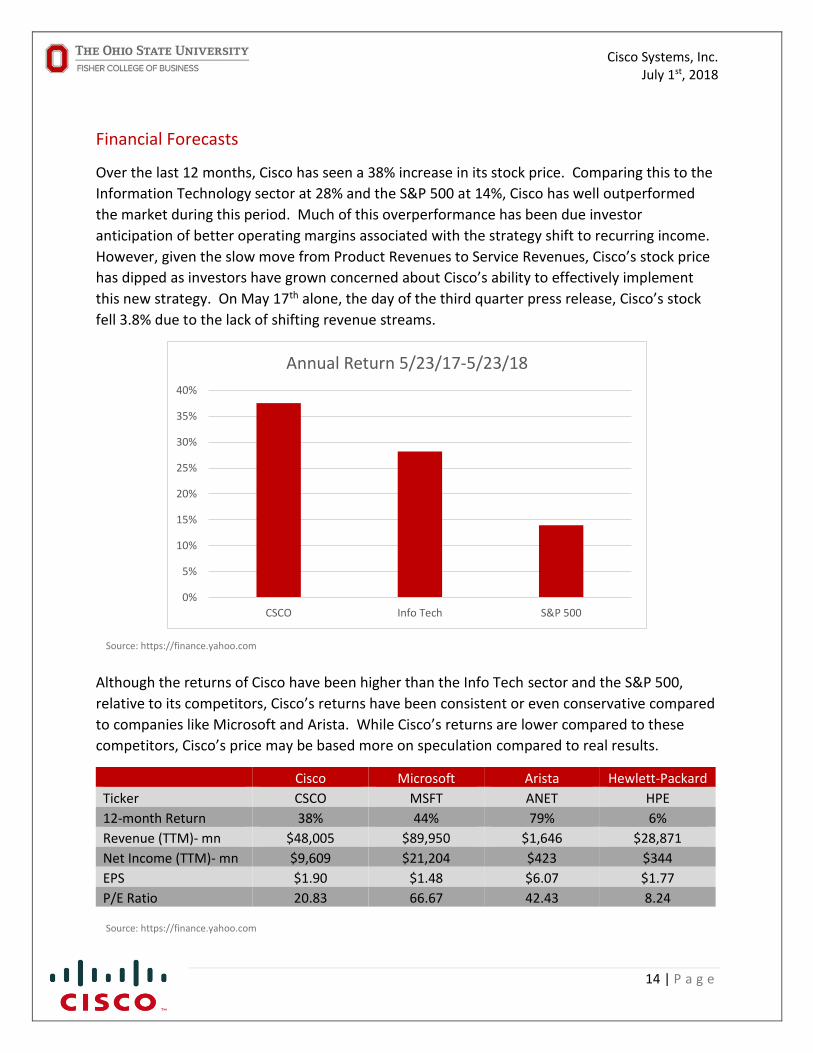
Financial Forecasts
Over the last 12 months, Cisco has seen a 38% increase in its stock price. Comparing this to the
Information Technology sector at 28% and the S&P 500 at 14%, Cisco has well outperformed
the market during this period. Much of this overperformance has been due investor
anticipation of better operating margins associated with the strategy shift to recurring income.
However, given the slow move from Product Revenues to Service Revenues, Cisco’s stock price
has dipped as investors have grown concerned about Cisco’s ability to effectively implement
this new strategy. On May 17th alone, the day of the third quarter press release, Cisco’s stock
fell 3.8% due to the lack of shifting revenue streams.
Although the returns of Cisco have been higher than the Info Tech sector and the S&P 500,
relative to its competitors, Cisco’s returns have been consistent or even conservative compared
to companies like Microsoft and Arista. While Cisco’s returns are lower compared to these
competitors, Cisco’s price may be based more on speculation compared to real results.
Cisco Microsoft Arista Hewlett-Packard
Ticker CSCO MSFT ANET HPE
12-month Return 38% 44% 79% 6%
Revenue (TTM)- mn $48,005 $89,950 $1,646 $28,871
Net Income (TTM)- mn $9,609 $21,204 $423 $344
EPS $1.90 $1.48 $6.07 $1.77
P/E Ratio 20.83 66.67 42.43 8.24
0%
5%
10%
15%
20%
25%
30%
35%
40%
CSCO Info Tech S&P 500
Annual Return 5/23/17-5/23/18
Source: https://finance.yahoo.com
Source: https://finance.yahoo.com
Page 15
Cisco Systems, Inc. July 1st, 2018
15 | P a g e
Our projected income statement for Cisco is shown in Appendix I. Our projections reflect
management’s goal of moving revenue from Products to Services and the higher margins
associated with Services compared to Products.
We expect Product Revenue to grow by 1% each year for three years and Service Revenue to
grow by 4% each year for three years. We believe Gross Margin Percent for both Products and
Services will increase, with Products continuing to increase to 65% and Services to increase to
70%. Operating Margin is expected to increase from 25% in 2017 to over 28% for each of the
next three years.
Valuation and Price Target
Beginning with the Discounted Cash Flow (DCF) Model, we used the Income Statement in
Appendix I to incorporate the effects of growing Service Revenue at a faster rate than Product
Revenue and the higher margins associated with the Services Revenue. This change reflects the
strategic shift of Cisco’s management. We are projecting that 2021 is the year that Cisco will be
able to fully capitalize on their cloud-based software platforms to create more recurring
revenue, with revenues in 2021 and 2022 reaching 7% growth, 5% in 2023 and then 3% after
that. Additionally, we assumed Operating Income would increase to 30% in 2021 and stay level
in the years that follow. Based on these assumptions, and using a 10.8% terminal discount rate,
the DCF Model projects Cisco’s current equity value to be $200 billion. With over 5 billion
shares outstanding, the implied equity value/share of Cisco is currently $39.93. Comparing this
to Cisco’s current stock price of $43.68, the DCF Model predicts a downside of purchasing Cisco
of 8.59%.
Moving to a comparison of valuation metrics, we compared Cisco with its closest 5 competitors:
Microsoft (MSFT), Arista (ANET), Hewlett-Packard Enterprises (HPE), Arris International (ARRS)
and F5 Networks (FFIV). Comparing this, Cisco is under the average for both the P/E ratio and
the P/S ration, but very close to average on both P/B ratio and EV/EBITDA.
Ticker P/E Ratio P/S Ratio P/B Ratio EV/EBITDA
Average 28.42 3.08 4.46 12.88
CSCO 20.84 4.23 4.46 12.20
MSFT 66.67 7.63 9.57 20.75
ANET 10.84 0.20 1.79 11.50
HPE 8.24 0.73 0.93 10.45
ARRS 38.68 0.68 1.44 7.60
FFIV 25.27 4.99 8.59 14.80
Applying these multiples to Cisco, we get a range of valuations and share prices, from $29.86 a
share for the P/S ratio on the low end, to $54.00 a share for the P/E ratio on the high end. We
Source: https://finance.yahoo.com
Page 16
Cisco Systems, Inc. July 1st, 2018
16 | P a g e
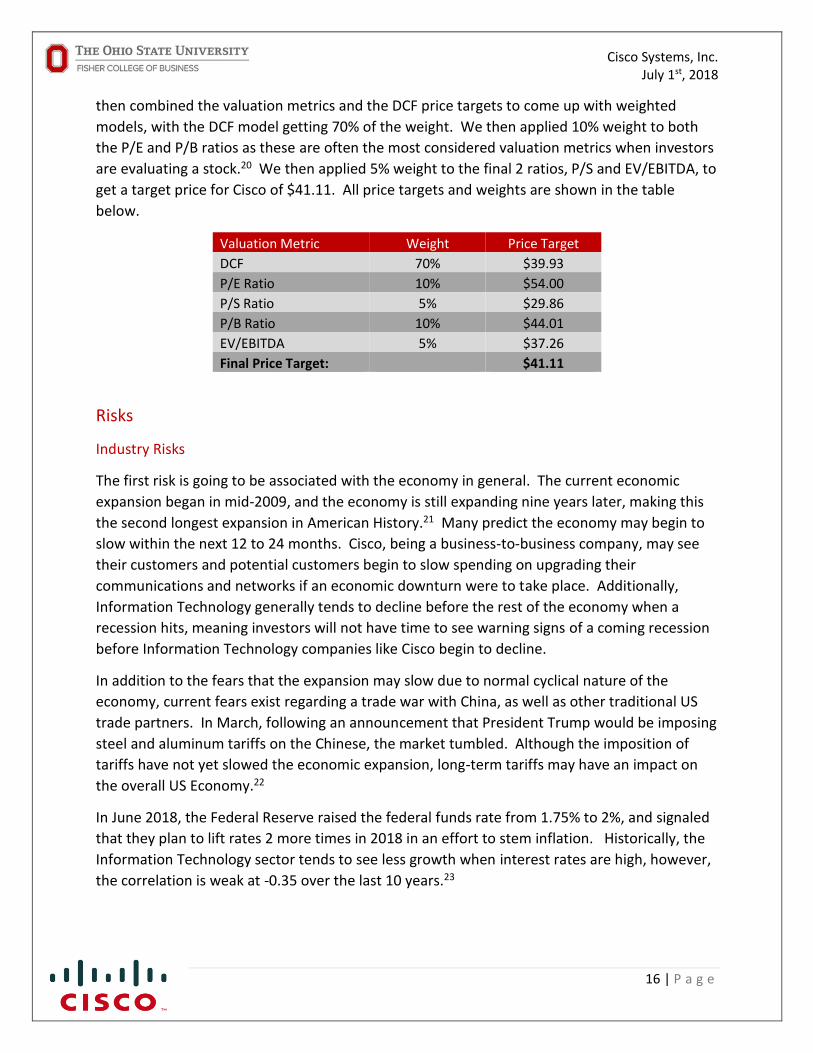
then combined the valuation metrics and the DCF price targets to come up with weighted
models, with the DCF model getting 70% of the weight. We then applied 10% weight to both
the P/E and P/B ratios as these are often the most considered valuation metrics when investors
are evaluating a stock.20 We then applied 5% weight to the final 2 ratios, P/S and EV/EBITDA, to
get a target price for Cisco of $41.11. All price targets and weights are shown in the table
below.
Valuation Metric Weight Price Target
DCF 70% $39.93
P/E Ratio 10% $54.00
P/S Ratio 5% $29.86
P/B Ratio 10% $44.01
EV/EBITDA 5% $37.26
Final Price Target: $41.11
Risks
Industry Risks
The first risk is going to be associated with the economy in general. The current economic
expansion began in mid-2009, and the economy is still expanding nine years later, making this
the second longest expansion in American History.21 Many predict the economy may begin to
slow within the next 12 to 24 months. Cisco, being a business-to-business company, may see
their customers and potential customers begin to slow spending on upgrading their
communications and networks if an economic downturn were to take place. Additionally,
Information Technology generally tends to decline before the rest of the economy when a
recession hits, meaning investors will not have time to see warning signs of a coming recession
before Information Technology companies like Cisco begin to decline.
In addition to the fears that the expansion may slow due to normal cyclical nature of the
economy, current fears exist regarding a trade war with China, as well as other traditional US
trade partners. In March, following an announcement that President Trump would be imposing
steel and aluminum tariffs on the Chinese, the market tumbled. Although the imposition of
tariffs have not yet slowed the economic expansion, long-term tariffs may have an impact on
the overall US Economy.22
In June 2018, the Federal Reserve raised the federal funds rate from 1.75% to 2%, and signaled
that they plan to lift rates 2 more times in 2018 in an effort to stem inflation. Historically, the
Information Technology sector tends to see less growth when interest rates are high, however,
the correlation is weak at -0.35 over the last 10 years.23
Page 17
Cisco Systems, Inc. July 1st, 2018
17 | P a g e
Company-specific Risks
Cisco faces some uncertainty in how their planned business model is going to pan out.
Historically, Cisco has capitalized on providing companies with secure solutions to data,
networking and collaboration. Companies, however, are shifting their focus and now want not
just security, but ease of use and low implementation and housing costs. As Cisco continues to
work on their cloud-based software initiatives and create more recurring revenue, they are
challenged to make this strategic shift while still innovating in products to hedge their strategic
bets.
Cisco also faces new competitive risks. Companies like Microsoft and Dell that weren’t
traditionally integrated to compete with collaboration and data storage are now poised to
begin offering these products to their customers as an alternative to Cisco’s products.
Companies like Arista are also coming into the cloud-based market with products that compete
with Cisco.
Conclusion
SELL Cisco Systems, Inc (NASDAQ: CSCO) with a target price of $41.11 and an implied upside
of -2.86%.
Cisco is currently slightly overvalued and much of their current share price has speculation
associated with the planned strategic shift to recurring revenues. If Cisco is able to effectively
implement their cloud-based software initiatives over the next 12 months and shift more
revenue to their service category, Cisco’s value will increase slightly over the current share
price, however, Cisco’s shift is already factored into this share price and therefore has limited
upside if it does make the revenue shift.
00.511.522.533.544.5
0
200
400
600
800
1000
1200
1400
Info Tech vs. 10-Year Treasury Interest Rate
S&P 500 Information Technology (Sector) 10-Year Treasury Note Interest Rate
Source: https://www.investing.com/rates-bonds/u.s.-10-year-bond-yield-historical-data
Page 18
Cisco Systems, Inc. July 1st, 2018
18 | P a g e
Appendices
Appendix I: Cisco Systems, Inc. Income Statement
in millions, except per-share amounts FY 2020E FY 2019E FY 2018E FY 2017 FY 2016 FY 2015 FY 2014 FY 2013
Consensus 52,029 50,730 49,260
REVENUE:
Product 36,787 36,423 36,062 35,705 37,254 37,750 36,172 38,029
Service 13,836 13,304 12,792 12,300 11,993 11,411 10,970 10,578
Total revenue 50,623 49,726 48,854 48,005 49,247 49,161 47,142 48,607
COST OF SALES:
Product (a) - (e) 12,875 12,748 12,622 13,699 14,161 15,377 15,641 15,541
Service (a) & (d) 4,151 3,991 3,838 4,082 4,126 4,103 3,732 3,626
Total cost of sales (a) - (e) 17,026 16,739 16,459 17,781 18,287 19,480 19,373 19,167
GROSS MARGIN (a) - (e) 33,597 32,987 32,395 30,224 30,960 29,681 27,769 29,440
Product gross margin percentage 65.0% 65.0% 65.0% 61.6% 62.0% 59.3% 56.8% 59.1%
Service gross margin percentage 70.0% 70.0% 70.0% 66.8% 65.6% 64.0% 66.0% 65.7%
Total gross margin percentage 66.4% 66.3% 66.3% 63.0% 62.9% 60.4% 58.9% 60.6%
OPERATING EXPENSES:
Research and development (a) & (d) 6,440 6,326 6,215 6,059 6,296 6,207 6,294 5,942
Sales and marketing (a) & (d) 9,965 9,788 9,617 9,184 9,619 9,821 9,503 9,538
General and administrative (a) & (d) 2,100 2,063 2,027 1,993 1,814 2,040 1,934 2,264
Amortization of purchased intangible assets (b) 332 326 321 259 303 359 275 395
Restructuring and other charges (e) 426 418 411 756 268 484 418 105
Total operating expenses (a), (b), (d) & (e) 19,263 18,922 18,590 18,251 18,300 18,911 18,424 18,244
Operating expense as a percentage of revenue 38.1% 38.1% 38.1% 38.0% 37.2% 38.5% 39.1% 37.5%
OPERATING INCOME (a) - (e) 14,333 14,065 13,805 11,973 12,660 10,770 9,345 11,196
Operating income as a percentage of revenue 28.3% 28.3% 28.3% 24.9% 25.7% 21.9% 19.8% 23.0%
Interest income 932 915 899 1,338 1,005 769 691 654
Interest expense (680) (668) (656) (861) (676) (566) (564) (583)
Other income (loss), net 42 42 41 (163) (69) 228 243 (40)
Interest and other income (loss), net 294 289 284 314 260 431 370 31
INCOME BEFORE PROVISION FOR INCOME TAXES (a) - (e) 14,628 14,354 14,089 12,287 12,920 11,201 9,715 11,227
Provision for income taxes (f) - (g) 2,926 2,871 2,818 2,678 2,181 2,220 1,862 1,244
NET INCOME (a) - (g) 11,702 11,484 11,271 9,609 10,739 8,981 7,853 9,983
Net income per share:
Basic (a) - (g) 2.34$ 2.29$ 2.25$ 1.92$ 2.13$ 1.76$ 1.50$ 1.87$
Diluted (a) - (g) 2.32$ 2.27$ 2.23$ 1.90$ 2.11$ 1.75$ 1.49$ 1.86$
Consenus 2.73$ 2.61$ 2.34$
Shares used in per-share calculation:
Basic 5,010 5,010 5,010 5,010 5,053 5,104 5,234 5,329
Diluted 5,049 5,049 5,049 5,049 5,088 5,146 5,281 5,380
Cash dividends declared per common share 1.10$ 0.94$ 0.80$ 0.72$ 0.62$
Tax Rate 20.0% 20.0% 20.0% 21.8% 16.9% 19.8% 19.2% 11.1%
Balance Sheet
Receivables 5,568 5,470 5,374 5,146 5,847 5,344 5,157 5,470
% of Sales 11.0% 11.0% 11.0% 10.7% 11.9% 10.9% 10.9% 11.3%
Inventory 1,012 1,243 1,466 1,616 1,217 1,627 1,591 1,476
% of Sales 2.0% 2.5% 3.0% 3.4% 2.5% 3.3% 3.4% 3.0%
Payables 1,266 1,243 1,221 1,385 1,056 1,104 1,032 1,029
% of Sales 2.5% 2.5% 2.5% 2.9% 2.1% 2.2% 2.2% 2.1%
Change in WC 110 105 86 (27) (45) (295) 195
Cash Flow
Depreciation & Amortization 2,531 2,486 2,443 2,286 2,150 2,442 2,439 2,460
% of Sales 5.0% 5.0% 5.0% 4.8% 4.4% 5.0% 5.2% 5.1%
CapEx 1,012 995 977 964 1,146 1,227 1,275 1,160
% of Sales 2.0% 2.0% 2.0% 2.0% 2.3% 2.5% 2.7% 2.4%
Expenses as % of Sales
Research and development (a) & (d) 12.7% 12.7% 12.7% 12.6% 12.8% 12.6% 13.4% 12.2%
Sales and marketing (a) & (d) 19.7% 19.7% 19.7% 19.1% 19.5% 20.0% 20.2% 19.6%
General and administrative (a) & (d) 4.1% 4.1% 4.1% 4.2% 3.7% 4.1% 4.1% 4.7%
Amortization of purchased intangible assets (b) 0.7% 0.7% 0.7% 0.5% 0.6% 0.7% 0.6% 0.8%
Restructuring and other charges (e) 0.8% 0.8% 0.8% 1.6% 0.5% 1.0% 0.9% 0.2%
Total operating expenses (a), (b), (d) & (e) 38.1% 38.1% 38.1% 38.0% 37.2% 38.5% 39.1% 37.5%
Interest income 1.8% 1.8% 1.8% 2.8% 2.0% 1.6% 1.5% 1.3%
Interest expense -1.3% -1.3% -1.3% -1.8% -1.4% -1.2% -1.2% -1.2%
Other income (loss), net 0.1% 0.1% 0.1% -0.3% -0.1% 0.5% 0.5% -0.1%
Interest and other income (loss), net 0.6% 0.6% 0.6% 0.7% 0.5% 0.9% 0.8% 0.1%
Operating Margin 28.3% 28.3% 28.3% 24.9% 25.7% 21.9% 19.8% 23.0%
Page 19
Cisco Systems, Inc. July 1st, 2018
19 | P a g e
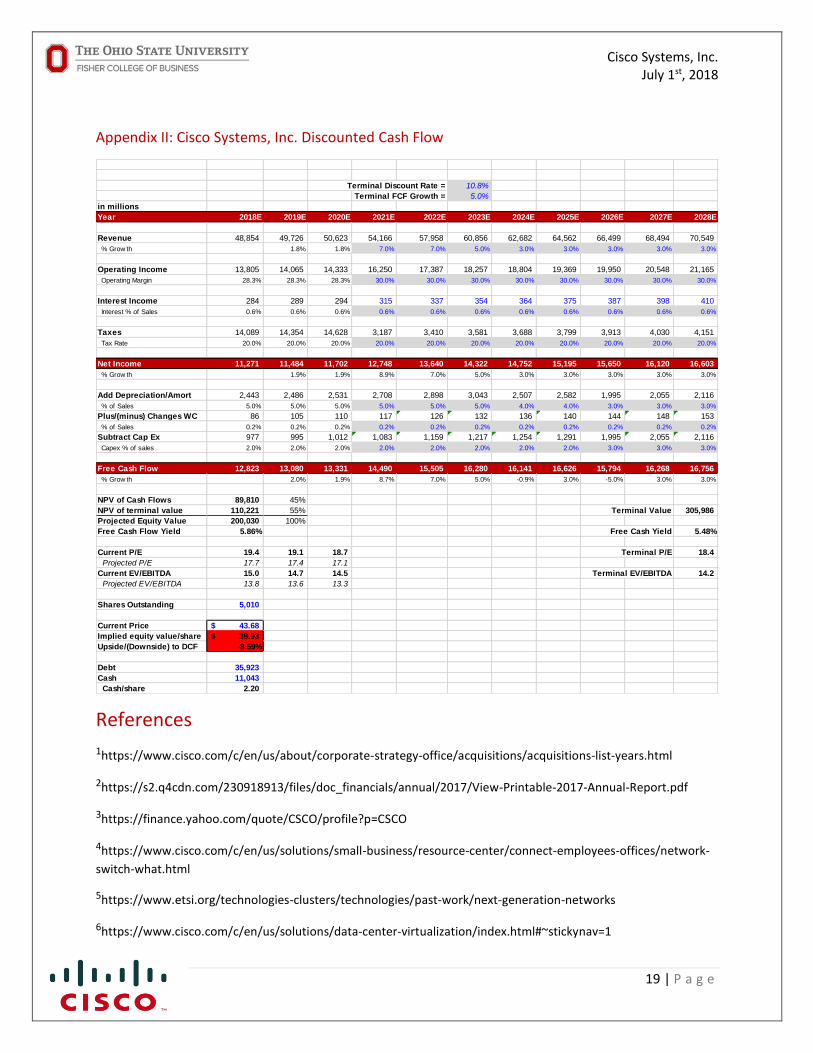
Appendix II: Cisco Systems, Inc. Discounted Cash Flow
References
1https://www.cisco.com/c/en/us/about/corporate-strategy-office/acquisitions/acquisitions-list-years.html
2https://s2.q4cdn.com/230918913/files/doc_financials/annual/2017/View-Printable-2017-Annual-Report.pdf
3https://finance.yahoo.com/quote/CSCO/profile?p=CSCO
4https://www.cisco.com/c/en/us/solutions/small-business/resource-center/connect-employees-offices/network-
switch-what.html
5https://www.etsi.org/technologies-clusters/technologies/past-work/next-generation-networks
6https://www.cisco.com/c/en/us/solutions/data-center-virtualization/index.html#~stickynav=1
Terminal Discount Rate = 10.8%
Terminal FCF Growth = 5.0%
in millions
Year 2018E 2019E 2020E 2021E 2022E 2023E 2024E 2025E 2026E 2027E 2028E
Revenue 48,854 49,726 50,623 54,166 57,958 60,856 62,682 64,562 66,499 68,494 70,549
% Grow th 1.8% 1.8% 7.0% 7.0% 5.0% 3.0% 3.0% 3.0% 3.0% 3.0%
Operating Income 13,805 14,065 14,333 16,250 17,387 18,257 18,804 19,369 19,950 20,548 21,165
Operating Margin 28.3% 28.3% 28.3% 30.0% 30.0% 30.0% 30.0% 30.0% 30.0% 30.0% 30.0%
Interest Income 284 289 294 315 337 354 364 375 387 398 410
Interest % of Sales 0.6% 0.6% 0.6% 0.6% 0.6% 0.6% 0.6% 0.6% 0.6% 0.6% 0.6%
Taxes 14,089 14,354 14,628 3,187 3,410 3,581 3,688 3,799 3,913 4,030 4,151
Tax Rate 20.0% 20.0% 20.0% 20.0% 20.0% 20.0% 20.0% 20.0% 20.0% 20.0% 20.0%
Net Income 11,271 11,484 11,702 12,748 13,640 14,322 14,752 15,195 15,650 16,120 16,603
% Grow th 1.9% 1.9% 8.9% 7.0% 5.0% 3.0% 3.0% 3.0% 3.0% 3.0%
Add Depreciation/Amort 2,443 2,486 2,531 2,708 2,898 3,043 2,507 2,582 1,995 2,055 2,116
% of Sales 5.0% 5.0% 5.0% 5.0% 5.0% 5.0% 4.0% 4.0% 3.0% 3.0% 3.0%
Plus/(minus) Changes WC 86 105 110 117 126 132 136 140 144 148 153
% of Sales 0.2% 0.2% 0.2% 0.2% 0.2% 0.2% 0.2% 0.2% 0.2% 0.2% 0.2%
Subtract Cap Ex 977 995 1,012 1,083 1,159 1,217 1,254 1,291 1,995 2,055 2,116
Capex % of sales 2.0% 2.0% 2.0% 2.0% 2.0% 2.0% 2.0% 2.0% 3.0% 3.0% 3.0%
Free Cash Flow 12,823 13,080 13,331 14,490 15,505 16,280 16,141 16,626 15,794 16,268 16,756
% Grow th 2.0% 1.9% 8.7% 7.0% 5.0% -0.9% 3.0% -5.0% 3.0% 3.0%
NPV of Cash Flows 89,810 45%
NPV of terminal value 110,221 55% Terminal Value 305,986
Projected Equity Value 200,030 100%
Free Cash Flow Yield 5.86% Free Cash Yield 5.48%
Current P/E 19.4 19.1 18.7 Terminal P/E 18.4
Projected P/E 17.7 17.4 17.1
Current EV/EBITDA 15.0 14.7 14.5 Terminal EV/EBITDA 14.2
Projected EV/EBITDA 13.8 13.6 13.3
Shares Outstanding 5,010
Current Price 43.68$
Implied equity value/share 39.93$
Upside/(Downside) to DCF -8.59%
Debt 35,923
Cash 11,043
Cash/share 2.20
Page 20
Cisco Systems, Inc. July 1st, 2018
20 | P a g e
7https://www.cisco.com/c/dam/en/us/solutions/collateral/enterprise-networks/802-11ac-solution/at-a-glance-
c45-734218.pdf
8https://finance.yahoo.com/quote/%5EGSPC/history?period1=1212120000&period2=1527652800&interval=1d&fi
lter=history&frequency=1d
9https://eresearch.fidelity.com/eresearch/markets_sectors/sectors/sectors_in_market.jhtml?tab=sdbusiness§
or=45
10https://www.forbes.com/forbes/welcome/?toURL=https://www.forbes.com/sites/greatspeculations/2017/04/1
2/where-does-cisco-stand-in-the-ethernet-switch-market/&refURL=&referrer=#38740437434a
11https://s2.q4cdn.com/230918913/files/doc_financials/annual/2016/2016-annual-report-full.pdf
12https://www.networkworld.com/article/3149585/uc-voip/what-to-expect-from-ciscos-competitors-in-2017.html
13https://www.gartner.com/newsroom/id/3845563
14https://investorplace.com/2018/05/cisco-earnings-report-clarifies-how-slow-the-train-is-moving/
15https://s2.q4cdn.com/230918913/files/doc_news/Q3FY18-Press-Release.pdf
16https://www.networkcomputing.com/data-centers/cisco%E2%80%99s-container-journey-cloud/721136785
17https://www.msn.com/en-us/finance/smallbusiness/disney-partners-with-cisco-for-its-studiolab/ar-AAzcEbQ
18https://www.forbes.com/sites/louiscolumbus/2017/04/29/roundup-of-cloud-computing-forecasts-
2017/#16ed8e0831e8
19https://www.bloomberg.com/gadfly/articles/2018-03-05/five-charts-that-show-where-those-corporate-tax-
savings-are-going
20https://www.investopedia.com/articles/fundamental-analysis/09/five-must-have-metrics-value-investors.asp
21http://money.cnn.com/2018/01/30/news/economy/us-economy-boom-history/index.html
22https://www.usatoday.com/story/money/2018/03/05/tariffs-trump-impact/395314002/
23http://www.businessinsider.com/federal-reserve-fomc-statement-and-interest-rate-decision-june-2018-2018-6