12640 Phys. Chem. Chem. Phys., 2011, 13, 12640–12645 This journal is c the Owner Societies 2011 Cite this: Phys. Chem. Chem. Phys., 2011, 13, 12640–12645 XPS revelation of tungsten edges as a potential donor-type catalyst Yanguang Nie, a Xi Zhang, a Shouzhi Ma, a Yan Wang, b Jisheng Pan c and Chang Q. Sun* ade Received 27th January 2011, Accepted 13th May 2011 DOI: 10.1039/c1cp21421g We report an efficient yet simple technology of photoelectron spectroscopic purification for identifying the capability of, and direction of charge flow in, a catalyst in a reaction, which has enabled the finding, for the first time, of the similarity of the valence band of tungsten edges to that of Rh adatoms and Ag/Pd alloy and hence suggested that W undercoordinated atoms could be a suitable candidate for replacing the costly Rh adatoms and Ag/Pd alloy as a cheaper, richer, and efficient donor-type catalyst for CO and NO oxidation applications. The new technology and new findings will be stimulating to the community for new catalyst design and identification and provide a better understanding of the electronic process of a catalytic reaction associated with undercoordinated atoms. 1. Introduction Atomic undercoordination associated with vacancies, defects, terrace edges, and nanostructures of various shapes demon- strate excellent properties, such as the extremely high catalytic ability that cannot be seen even from a flat surface of the same specimen, such as Au, Rh, and Pt. 1 The altered local structural and electronic environment modifies the bond length, bond energy, potential trap depth, and hence the Hamiltonian, work function, electroaffinity, and the atomic cohesive energy that locally determine the performance of a material, such as the catalytic, electronic, dielectric, optic, magnetic, mechanical, and thermal properties. 2 Thus, understanding the bonding and the energetic behavior of electrons localized in atomic-scaled zones surrounding undercoordinated atoms is the key for one to harness the process of catalytic reaction. X-Ray photoelectron spectroscopy (XPS) is a powerful tool for detecting the energetic behavior of electrons in the valance band and below, showing the fingerprints of the crystal potential change with the local chemical and coordination environment and its consequences on the electronic energy and structure in the deeper core bands. 3 Generally, XPS data can be decomposed into several components corresponding to contributions from bulk (B) and surfaces (S i , i = 1,2...) of different atomic layers in sequence. Three kinds of surface core level shift (SCLS), i.e., positive, negative, and mixed shift are generally assumed for the component assignment. Fig. 1a illustrates the positive SCLS, which means that the B and S i (i = 1,2,...) are arranged in the sequence of S 1 ,S 2 ,..., and B from lower (larger absolute value of energy) to higher binding energy in the XPS profile. 4 A represents the entrapped components due to the undercoordinated adatoms or edge atoms and P represents the screened polarization states. The SCLS is often attributed to the ‘‘initial–final’’ states 5 or the ‘‘surface bond contraction’’ 6 effects. The latter has been confirmed experimentally from Ta, 7 Nb, 8 and Mo 9 surfaces and Au 10 and Cu 11 atomic clusters using XPS and low-energy electron diffraction. The first interlayer spacing of a W(320) surface has been found to contract by up to 25%. 12 However, decomposing the XPS spectra with derivatives of quantitative information of bonds and electronic energy has long been problematic because of the lack of constraints for the XPS profile deconvolution: (i) the number of components in one XPS spectrum; (ii) the energy separation between the components and their correlations; (iii) the reference point from which the core level shifts; and (iv) the direction of the energy shift upon surface and edge formation. Establishment of these constraints is highly needed, in addition to a consistent under- standing of the nature and the physical origin of the SCLS and their indications in catalyst design. The SCLS of W(100), (110), and (111) surfaces 13 and their (320) and (540) vicinals 14 have been well measured for more than 30 years using different techniques, such as the synchrotron and XPS, unfortunately with discrepancies in the assignment of the direction of the energy shifts and the energy of the bulk component. 13b,d,14b,15 A negative shift was assigned with the bulk component at 31.4 eV and the surface component at 31.1 eV. a School of Electrical and Electronic Engineering, Nanyang Technological University, Singapore 639798. E-mail: [email protected]b School of Information and Electronic Engineering, Hunan University of Science and Technology, Xiangtan 411201, China c Institute of Materials Research and Engineering, Agency for Science, Technology and Research (A*STAR), Singapore 117602 d School of Materials Science, Jilin University, Changchun 130012, China e Faculty of Materials, Photoelectronics and Physics, Xiangtan University, Changsha 400073, China PCCP Dynamic Article Links www.rsc.org/pccp PAPER Downloaded by Nanyang Technological University on 24 July 2011 Published on 14 June 2011 on http://pubs.rsc.org | doi:10.1039/C1CP21421G View Online
Transcript
12640 Phys. Chem. Chem. Phys., 2011, 13, 12640–12645 This journal is c the Owner Societies 2011
12642 Phys. Chem. Chem. Phys., 2011, 13, 12640–12645 This journal is c the Owner Societies 2011
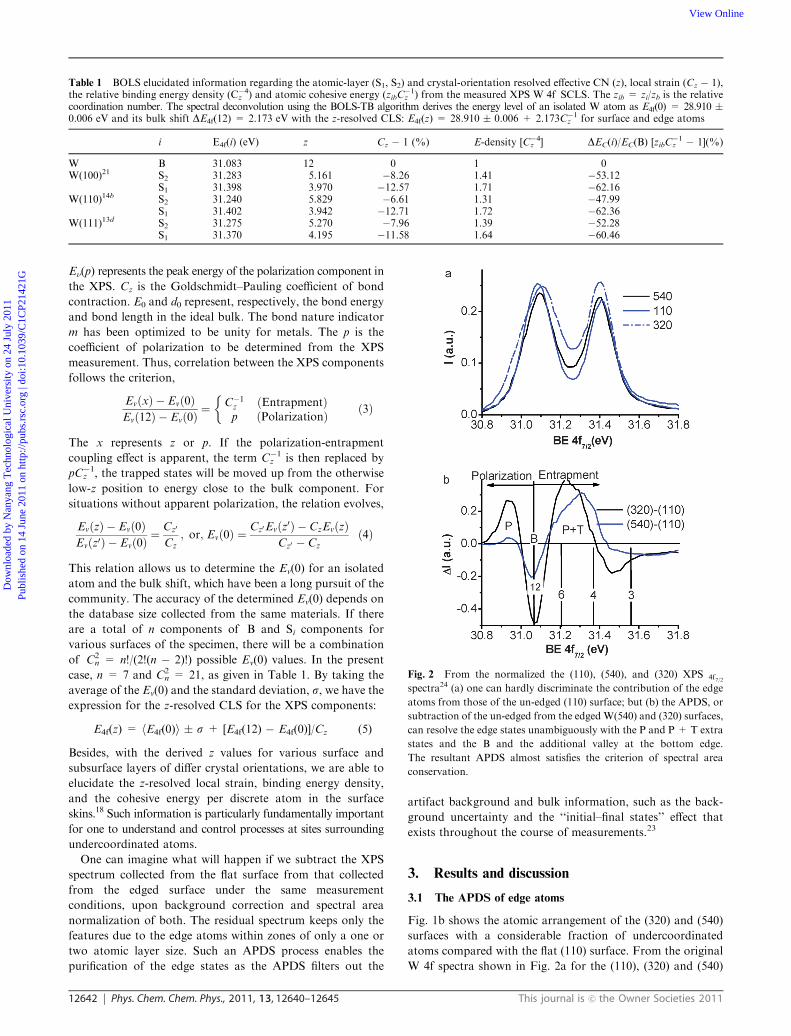
En(p) represents the peak energy of the polarization component in
the XPS. Cz is the Goldschmidt–Pauling coefficient of bond
contraction. E0 and d0 represent, respectively, the bond energy
and bond length in the ideal bulk. The bond nature indicator
m has been optimized to be unity for metals. The p is the
coefficient of polarization to be determined from the XPS
measurement. Thus, correlation between the XPS components
follows the criterion,
EvðxÞ � Evð0ÞEvð12Þ � Evð0Þ
¼ C�1z ðEntrapmentÞp ðPolarizationÞ
�ð3Þ
The x represents z or p. If the polarization-entrapment
coupling effect is apparent, the term C�1z is then replaced by
pC�1z , the trapped states will be moved up from the otherwise
low-z position to energy close to the bulk component. For
situations without apparent polarization, the relation evolves,
EvðzÞ � Evð0ÞEvðz0Þ � Evð0Þ
¼ Cz0
Cz; or; Evð0Þ ¼
Cz0Evðz0Þ � CzEvðzÞCz0 � Cz
ð4Þ
This relation allows us to determine the Ev(0) for an isolated
atom and the bulk shift, which have been a long pursuit of the
community. The accuracy of the determined Ev(0) depends on
the database size collected from the same materials. If there
are a total of n components of B and Si components for
various surfaces of the specimen, there will be a combination
of C2n = n!/(2!(n � 2)!) possible Ev(0) values. In the present
case, n = 7 and C2n = 21, as given in Table 1. By taking the
average of the Ev(0) and the standard deviation, s, we have theexpression for the z-resolved CLS for the XPS components:
E4f(z) = hE4f(0)i � s + [E4f(12) � E4f(0)]/Cz (5)
Besides, with the derived z values for various surface and
subsurface layers of differ crystal orientations, we are able to
elucidate the z-resolved local strain, binding energy density,
and the cohesive energy per discrete atom in the surface
skins.18 Such information is particularly fundamentally important
for one to understand and control processes at sites surrounding
undercoordinated atoms.
One can imagine what will happen if we subtract the XPS
spectrum collected from the flat surface from that collected
from the edged surface under the same measurement
conditions, upon background correction and spectral area
normalization of both. The residual spectrum keeps only the
features due to the edge atoms within zones of only a one or
two atomic layer size. Such an APDS process enables the
purification of the edge states as the APDS filters out the
artifact background and bulk information, such as the back-
ground uncertainty and the ‘‘initial–final states’’ effect that
exists throughout the course of measurements.23
3. Results and discussion
3.1 The APDS of edge atoms
Fig. 1b shows the atomic arrangement of the (320) and (540)
surfaces with a considerable fraction of undercoordinated
atoms compared with the flat (110) surface. From the original
W 4f spectra shown in Fig. 2a for the (110), (320) and (540)
Table 1 BOLS elucidated information regarding the atomic-layer (S1, S2) and crystal-orientation resolved effective CN (z), local strain (Cz � 1),the relative binding energy density (C�4z ) and atomic cohesive energy (zibC
�1z ) from the measured XPS W 4f SCLS. The zib = zi/zb is the relative
coordination number. The spectral deconvolution using the BOLS-TB algorithm derives the energy level of an isolated W atom as E4f(0) = 28.910 �0.006 eV and its bulk shift DE4f(12) = 2.173 eV with the z-resolved CLS: E4f(z) = 28.910 � 0.006 + 2.173C�1z for surface and edge atoms
i E4f(i) (eV) z Cz � 1 (%) E-density [C�4z ] DEC(i)/EC(B) [zibC�1z � 1](%)
W B 31.083 12 0 1 0W(100)21 S2 31.283 5.161 �8.26 1.41 �53.12
12644 Phys. Chem. Chem. Phys., 2011, 13, 12640–12645 This journal is c the Owner Societies 2011
detected using XPS, but it happens to the Rh and Ag/Pd alloy,
as confirmed using ultra-violet photoelectron spectroscopy,
showing the consistency of charge polarization direction in all
the bands of the same specimen.20,22
(iii) The P component at 30.945 eV results from the screening
and splitting of the crystal potential by the polarized valence
electrons. We can estimate the polarization coefficient with the
known energies of the P and the B components, p = [E4f7/2(p) �
E4f7/2(0)]/[E4f7/2
(12) � E4f7/2(0)] = (30.945 � 28.910)/2.173 =
93.6%, which means that the crystal potential has been
partially screened and elevated by 6.4% of the bulk value.
The otherwise T component turns out to be T + P with an
additional valley at the bottom edge of the core band because
of the coupling effect of entrapment and polarization. The T
component is supposed to add a component at energy corres-
ponding to z o 4, if the polarization is absent or it is
sufficiently weak. The state loss (second valley) at 31.454 eV
with an effective CN of 3.57 is supposed to be absent; the
strong interaction between edge atoms should enhance the
intensity of the states at lower-z positions instead, if no
polarization happens. However, as we discussed, the screening
effect also applies to the trapped states, and therefore, this
valley becomes present, and the T component becomes P + T.
The C�13 is replaced with pC�13 = C�13.75, which means that the
original edge states located at z = 3 shift up to energy being
equivalent to z = 3.75. The edge bond is strengthened by
[E4f7/2(T + P) � E4f7/2
(0)]/[E4f7/2(12) � E4f7/2
(0)] = (31.310 �28.910)/2.173 = 1.104, or 10.4%, because of the joint effect of
entrapment and polarization. It should be 1.104/p = 1.104/
0.936 = 1.18 instead, if no polarization occurs.
3.4 Potential catalytic behavior
The extra P and the P + T states in the APDS are due to the
edge atoms only, as the APDS has filtered out the background
and bulk information. It has been confirmed that the valence
and the core electrons of a specimen shift simultaneously in the
same direction because of the screening effect to the core
charge, such as the cases of AgPd and CuPd bimetallic alloy
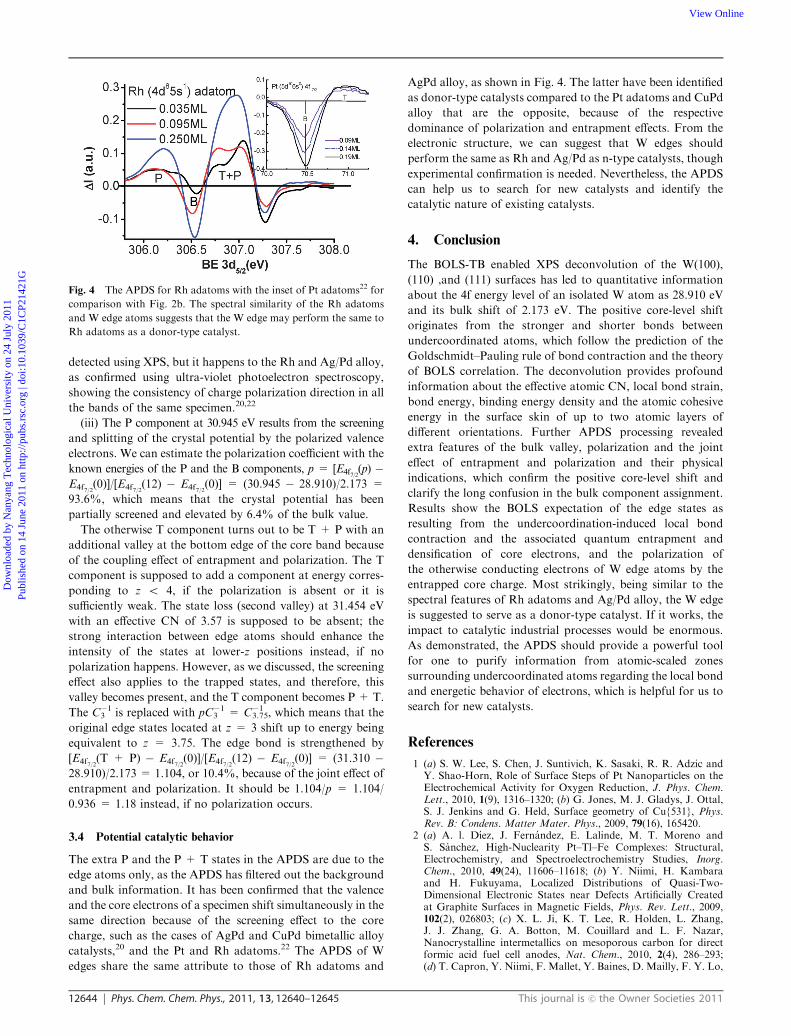
catalysts,20 and the Pt and Rh adatoms.22 The APDS of W
edges share the same attribute to those of Rh adatoms and
AgPd alloy, as shown in Fig. 4. The latter have been identified
as donor-type catalysts compared to the Pt adatoms and CuPd
alloy that are the opposite, because of the respective
dominance of polarization and entrapment effects. From the
electronic structure, we can suggest that W edges should
perform the same as Rh and Ag/Pd as n-type catalysts, though
experimental confirmation is needed. Nevertheless, the APDS
can help us to search for new catalysts and identify the
catalytic nature of existing catalysts.
4. Conclusion
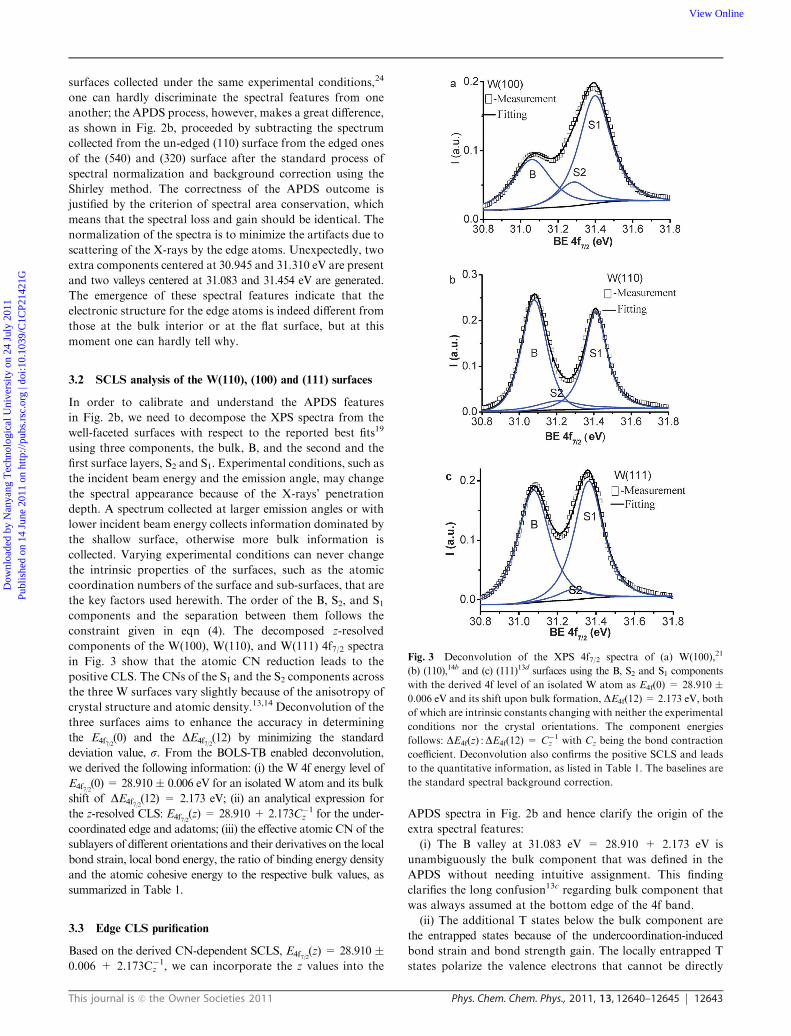
The BOLS-TB enabled XPS deconvolution of the W(100),
(110) ,and (111) surfaces has led to quantitative information
about the 4f energy level of an isolated W atom as 28.910 eV
and its bulk shift of 2.173 eV. The positive core-level shift
originates from the stronger and shorter bonds between
undercoordinated atoms, which follow the prediction of the
Goldschmidt–Pauling rule of bond contraction and the theory
of BOLS correlation. The deconvolution provides profound
information about the effective atomic CN, local bond strain,
bond energy, binding energy density and the atomic cohesive
energy in the surface skin of up to two atomic layers of
different orientations. Further APDS processing revealed
extra features of the bulk valley, polarization and the joint
effect of entrapment and polarization and their physical
indications, which confirm the positive core-level shift and
clarify the long confusion in the bulk component assignment.
Results show the BOLS expectation of the edge states as
resulting from the undercoordination-induced local bond
contraction and the associated quantum entrapment and
densification of core electrons, and the polarization of
the otherwise conducting electrons of W edge atoms by the
entrapped core charge. Most strikingly, being similar to the
spectral features of Rh adatoms and Ag/Pd alloy, the W edge
is suggested to serve as a donor-type catalyst. If it works, the
impact to catalytic industrial processes would be enormous.
As demonstrated, the APDS should provide a powerful tool
for one to purify information from atomic-scaled zones
surrounding undercoordinated atoms regarding the local bond
and energetic behavior of electrons, which is helpful for us to
search for new catalysts.
References
1 (a) S. W. Lee, S. Chen, J. Suntivich, K. Sasaki, R. R. Adzic andY. Shao-Horn, Role of Surface Steps of Pt Nanoparticles on theElectrochemical Activity for Oxygen Reduction, J. Phys. Chem.Lett., 2010, 1(9), 1316–1320; (b) G. Jones, M. J. Gladys, J. Ottal,S. J. Jenkins and G. Held, Surface geometry of Cu{531}, Phys.Rev. B: Condens. Matter Mater. Phys., 2009, 79(16), 165420.
2 (a) A. l. Dıez, J. Fernandez, E. Lalinde, M. T. Moreno andS. Sanchez, High-Nuclearity Pt–Tl–Fe Complexes: Structural,Electrochemistry, and Spectroelectrochemistry Studies, Inorg.Chem., 2010, 49(24), 11606–11618; (b) Y. Niimi, H. Kambaraand H. Fukuyama, Localized Distributions of Quasi-Two-Dimensional Electronic States near Defects Artificially Createdat Graphite Surfaces in Magnetic Fields, Phys. Rev. Lett., 2009,102(2), 026803; (c) X. L. Ji, K. T. Lee, R. Holden, L. Zhang,J. J. Zhang, G. A. Botton, M. Couillard and L. F. Nazar,Nanocrystalline intermetallics on mesoporous carbon for directformic acid fuel cell anodes, Nat. Chem., 2010, 2(4), 286–293;(d) T. Capron, Y. Niimi, F. Mallet, Y. Baines, D. Mailly, F. Y. Lo,
Fig. 4 The APDS for Rh adatoms with the inset of Pt adatoms22 for
comparison with Fig. 2b. The spectral similarity of the Rh adatoms
and W edge atoms suggests that the W edge may perform the same to
This journal is c the Owner Societies 2011 Phys. Chem. Chem. Phys., 2011, 13, 12640–12645 12645
A. Melnikov, A. D. Wieck, L. Saminadayar and C. Bauerle,Low-temperature dephasing in irradiated metallic wires, Phys.Rev. B: Condens. Matter Mater. Phys., 2008, 77(3), 033102.
3 E. Sacher, Asymmetries in Transition Metal XPS Spectra: MetalNanoparticle Structure, and Interaction with the Graphene-Structured Substrate Surface, Langmuir, 2010, 26(6), 3807–3814.
4 F. Matsui, T. Matsushita, Y. Kato, M. Hashimoto, K. Inaji,F. Z. Guo and H. Daimon, Atomic-layer resolved magnetic andelectronic structure analysis of Ni thin film on a Cu(001) surface bydiffraction spectroscopy, Phys. Rev. Lett., 2008, 100(20), 207201.
5 A. Howard, D. N. S. Clark, C. E. J. Mitchell, R. G. Egdell andV. R. Dhanak, Initial and final state effects in photoemission fromAu nanoclusters on TiO2(110), Surf. Sci., 2002, 518(3), 210–224.
6 R. A. Bartynski, D. Heskett, K. Garrison, G. Watson,D. M. Zehner, W. N. Mei, S. Y. Tong and X. Pan, The 1stinterlayer spacing of Ta(100) determined by photoelectrondiffraction, J. Vac. Sci. Technol., A, 1989, 7(3), 1931–1936.
7 D. M. Riffe and G. K. Wertheim, TA(110) Surface and subsurfacecore-level shifts and 4F7/2 line-shapes, Phys. Rev. B: Condens.Matter, 1993, 47(11), 6672–6679.
8 B. S. Fang, W. S. Lo, T. S. Chien, T. C. Leung, C. Y. Lue,C. T. Chan and K. M. Ho, Surface band structures on Nb(001),Phys. Rev. B: Condens. Matter, 1994, 50(15), 11093–11101.
9 N. Wu, Y. B. Losovyj, Z. Yu, R. F. Sabirianov, W. N. Mei,N. Lozova, J. A. C. Santana and P. A. Dowben, The surfacerelaxation and band structure of Mo(112), J. Phys.: Condens.Matter, 2009, 21(47), 474222.
10 (a) W. J. Huang, R. Sun, J. Tao, L. D. Menard, R. G. Nuzzo andJ. M. Zuo, Coordination-dependent surface atomic contraction innanocrystals revealed by coherent diffraction, Nat. Mater., 2008,7(4), 308–313; (b) J. T. Miller, A. J. Kropf, Y. Zha,J. R. Regalbuto, L. Delannoy, C. Louis, E. Bus and J. A. vanBokhoven, The effect ofgold particle size on Au–Au bond lengthand reactivity toward oxygen in supported catalysts, J. Catal.,2006, 240(2), 222–234; (c) V. Petkov, Y. Peng, G. Williams,B. H. Huang, D. Tomalia and Y. Ren, Structure of goldnanoparticles suspended in water studied by X-ray diffractionand computer simulations, Phys. Rev. B: Condens. Matter Mater.Phys., 2005, 72(19), 195402.
11 D. Q. Yang and E. Sacher, Initial- and final-state effects on metalcluster/substrate interactions, as determined by XPS: copperclusters on Dow Cyclotene and highly oriented pyrolytic graphite,Appl. Surf. Sci., 2002, 195(1–4), 187–195.
12 J. H. Cho, D. H. Oh and L. Kleinman, Core-level shifts of lowcoordination atoms at the W(320) stepped surface, Phys. Rev. B:Condens. Matter, 2001, 64(11), 115404.
13 (a) G. K. Wertheim and P. H. Citrin, Surface-atom core-level shiftsof W(111), Phys. Rev. B, 1988, 38, 7820; (b) A. M. Shikin,A. Varykhalov, G. V. Prudnikova, V. K. Adamchuk, W. Gudatand O. Rader, Photoemission from Stepped W(110): Initial or
Final State Effect?, Phys. Rev. Lett., 2004, 93, 146802;(c) D. M. Riffe, B. Kim, J. L. Erskine and N. D. Shinn, Surfacecore-level shifts and atomic coordination at a stepped W(110)surface, Phys. Rev. B: Condens. Matter, 1994, 50, 14481;(d) K. G. Purcell, J. Jupille, G. P. Derby and D. A. King,Identification of underlayer components in the surface core-levelspectra of W(111), Phys. Rev. B, 1987, 36, 1288.
14 (a) D. Chauveau, P. Roubin, C. Guillot, J. Lecante, G. Treglia,M. C. Desjonqueres and D. Spanjaard, Surface core level spectro-scopy of the stepped surface, Solid State Commun., 1984, 52(7),635–639; (b) X. Zhou and J. L. Erskine, Surface core-level shifts atvicinal tungsten surfaces, Phys. Rev. B: Condens. Matter Mater.Phys., 2009, 79, 155422.
15 K. G. Purcell, J. Jupille and D. A. King, Coordination number andsurface core-level shift spectroscopy: Stepped tungsten surfaces,Surf. Sci., 1989, 208(3), 245–266.
16 M. A. Omar, Elementary Solid State Physics: Principles andApplications, Addison-Wesley, New York, 1993.
17 Y. Wang, Y. G. Nie, L. L. Wang and C. Q. Sun, Atomic-Layer- and Crystal-Orientation-Resolved 3d(5/2) Binding EnergyShift of Ru(0001) and Ru(1010) Surfaces, J. Phys. Chem. C, 2010,114(2), 1226–1230.
18 Y. Wang, Y. G. Nie, J. S. Pan, L. Pan, Z. Sun and C. Q. Sun, Layerand orientation resolved bond relaxation and quantum entrapmentof charge and energy at Be surfaces, Phys. Chem. Chem. Phys.,2010, 12, 12753–12759.
19 Y. Wang, Y. G. Nie, J. S. Pan, L. K. Pan, Z. Sun, L. L. Wang andC. Q. Sun, Orientation-resolved 3d(5/2) binding energy shift of Rhand Pd surfaces: anisotropy of the skin-depth lattice strain andquantum trapping, Phys. Chem. Chem. Phys., 2010, 12(9),2177–2182.
20 C. Q. Sun, Y. Wang, Y. G. Nie, B. R. Mehta, M. Khanuja,S. M. Shivaprasad, Y. Sun, J. S. Pan, L. K. Pan and Z. Sun,Interface quantum trap depression and charge polarization in theCuPd and AgPd bimetallic alloy catalysts, Phys. Chem. Chem.Phys., 2010, 12(13), 3131–3135.
21 J. Jupille, K. G. Purcell and D. A. King, W{100} clean surfacephase transition studied by core-level-shift spectroscopy:Order-order or order-disorder transition, Phys. Rev. B, 1989,39(10), 6871.
22 C. Q. Sun, Y. Wang, Y. G. Nie, Y. Sun, J. S. Pan, L. K. Pan andZ. Sun, Adatoms-Induced Local Bond Contraction, QuantumTrap Depression, and ChargePolarization at Pt and Rh Surfaces,J. Phys. Chem. C, 2009, 113(52), 21889–21894.
23 N. Pauly and S. Tougaard, Surface and core hole effects in X-rayphotoelectron spectroscopy, Surf. Sci., 2010, 604(13–14),1193–1196.
24 X. B. Zhou and J. L. Erskine, Surface core-level shifts at vicinaltungsten surfaces, Phys. Rev. B: Condens. Matter Mater. Phys.,2009, 79(15), 155422.