30
McKesson: In Business for Better Health Citi Global Healthcare Conference James Beer Executive Vice President and Chief Financial Officer McKesson Corporation February 25, 2014

McKesson: In Business for Better Health Citi Global Healthcare Conference
James Beer
Executive Vice President and
Chief Financial Officer
McKesson Corporation
February 25, 2014
Forward-Looking Statements
Some of the information in this presentation is not historical in nature and may
constitute forward-looking statements, which are made pursuant to the safe
harbor provisions of the Private Securities Litigation Reform Act of 1995.
These statements may be identified by the use of forward-looking terminology
such as “believes,” “expects,” “anticipates,” “may,” “will,” “should,” “seeks,”
“approximately,” “intends,” “plans,” “estimates,” or the negative of these words
or other comparable terminology. The discussion of financial trends, strategy,
plans or intentions may also include forward-looking statements. These forward-
looking statements involve risks and uncertainties that could cause actual
results to differ materially from those projected, anticipated or implied by such
statements. Although it is not possible to predict or identify all such risks and
uncertainties, they may include, but are not limited to, those described in the
Company’s annual, quarterly and current reports (i.e., Form 10-K, Form 10-Q
and Form 8-K) as filed or furnished with the Securities and Exchange
Commission (SEC). You are cautioned not to place undue reliance on any such
forward-looking statements, which speak only as of the date such statements
were first made. To the degree financial information is included in this
presentation, it is in summary form only and must be considered in the context
of the full details provided in the Company’s most recent annual, quarterly or
current report as filed or furnished with the SEC. The Company’s SEC reports
are available at www.mckesson.com under the “Investors” tab. Except to the
extent required by law, the Company undertakes no obligation to publicly release
the result of any revisions to these forward-looking statements to reflect events
or circumstances after the date hereof, or to reflect the occurrence of
unanticipated events.
2
GAAP / Non-GAAP
Reconciliation
In an effort to provide additional
and useful information regarding
the Company’s financial results
and other financial information as
determined by generally accepted
accounting principles (GAAP),
certain materials presented during
this event include non-GAAP
information. The rationale for
management’s use of non-GAAP
information, a reconciliation of that
information to GAAP, and other
related information is available on
www.mckesson.com under the
“Investors” tab. A reconciliation
between GAAP and non-GAAP
financial information is available in
the supplemental material
attached as an appendix to this
presentation.
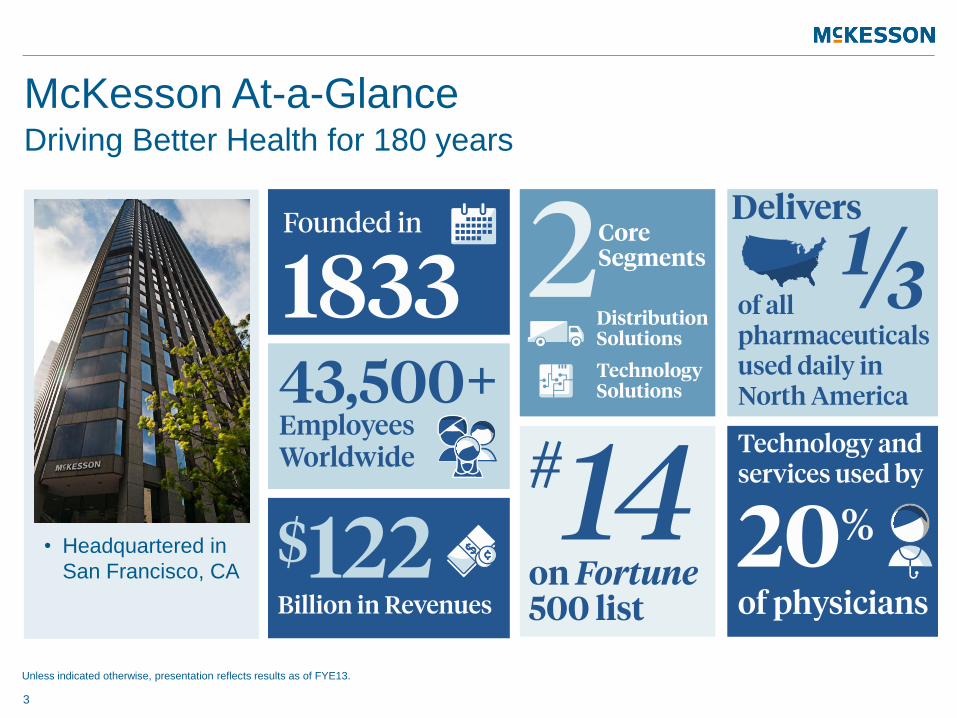
Driving Better Health for 180 years
McKesson At-a-Glance
3
• Headquartered in
San Francisco, CA
Unless indicated otherwise, presentation reflects results as of FYE13.
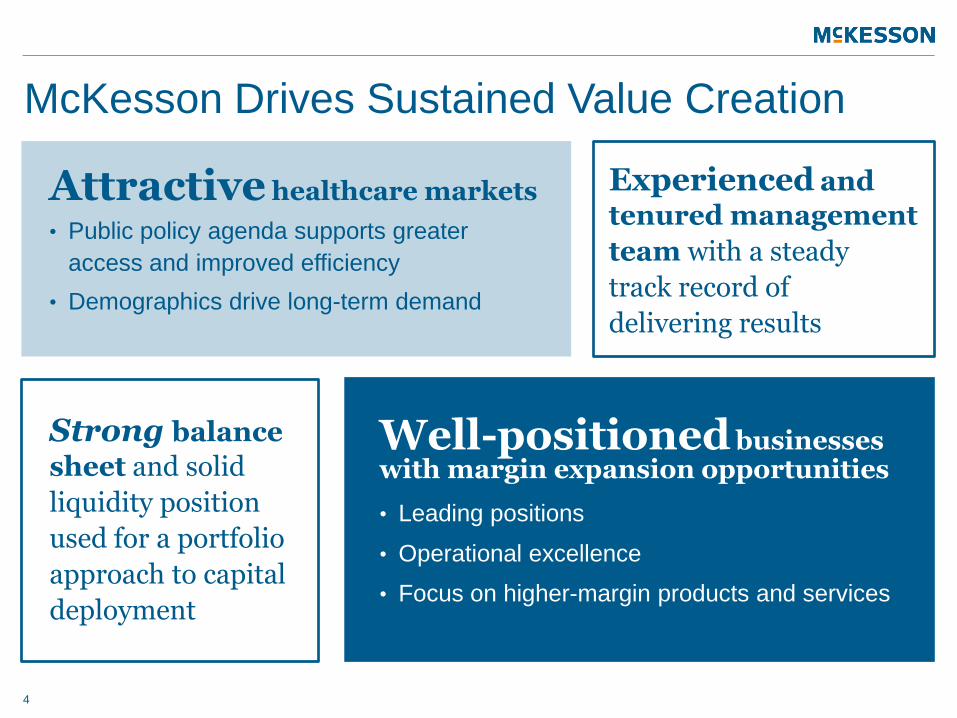
McKesson Drives Sustained Value Creation
4
Attractive healthcare markets
• Public policy agenda supports greater
access and improved efficiency
• Demographics drive long-term demand
Strong balance
sheet and solid
liquidity position
used for a portfolio
approach to capital
deployment
Well-positioned businesses with margin expansion opportunities
• Leading positions
• Operational excellence
• Focus on higher-margin products and services
Experienced and
tenured management
team with a steady
track record of
delivering results
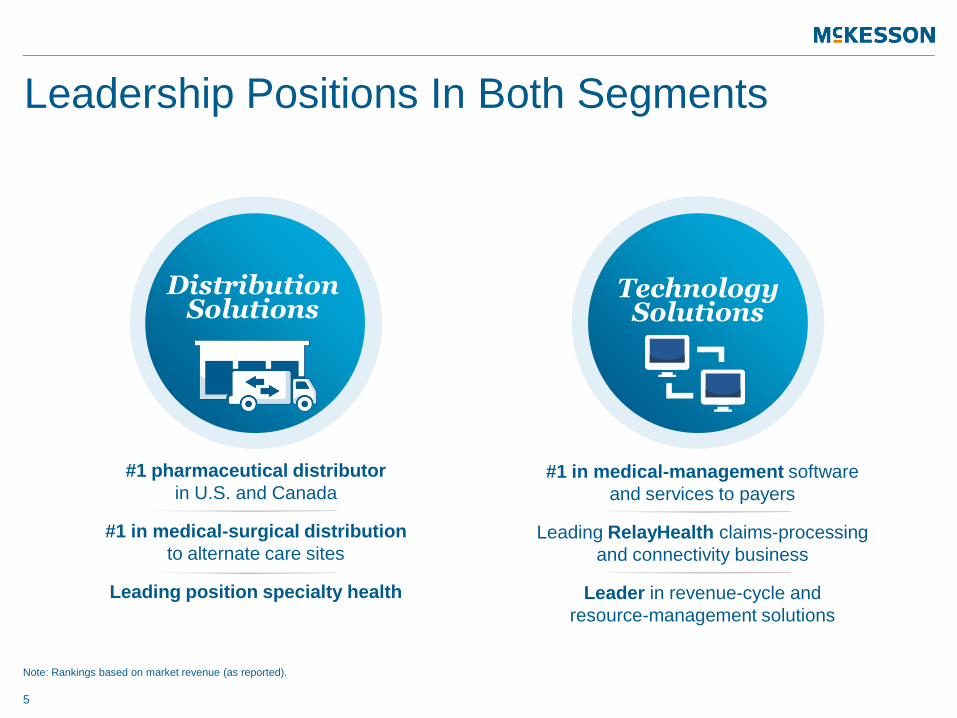
Leadership Positions In Both Segments
5
Technology Solutions
#1 pharmaceutical distributor
in U.S. and Canada
#1 in medical-surgical distribution
to alternate care sites
Leading position specialty health
#1 in medical-management software
and services to payers
Leading RelayHealth claims-processing
and connectivity business
Leader in revenue-cycle and
resource-management solutions
Distribution Solutions
Note: Rankings based on market revenue (as reported).
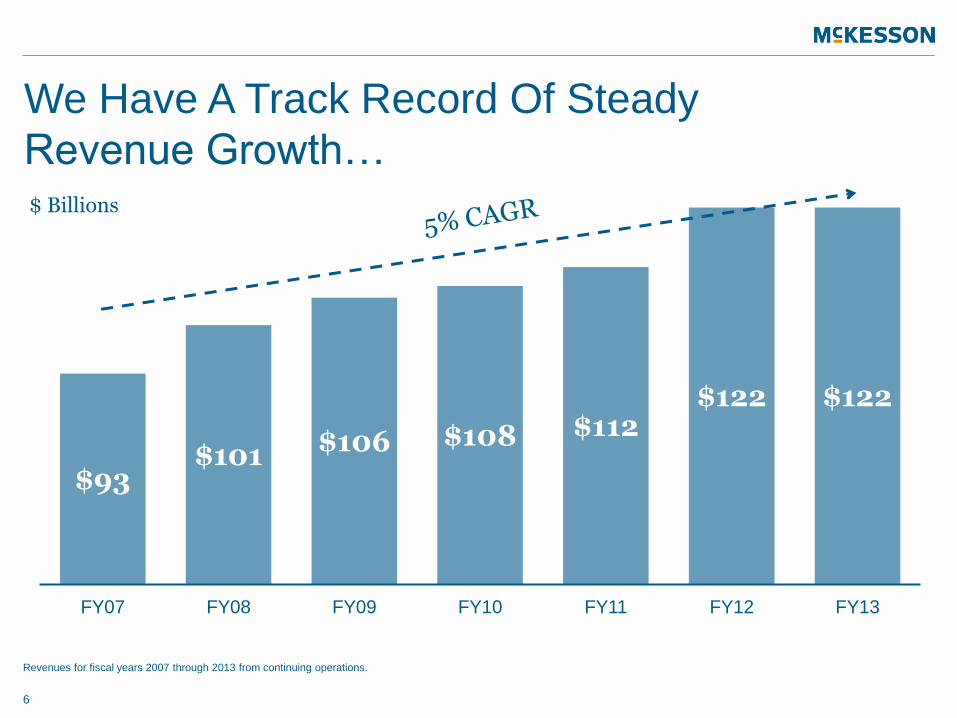
$93 $101 $106 $108 $112
$122 $122
FY07 FY08 FY09 FY10 FY11 FY12 FY13
We Have A Track Record Of Steady
Revenue Growth…
Revenues for fiscal years 2007 through 2013 from continuing operations.
6
$ Billions
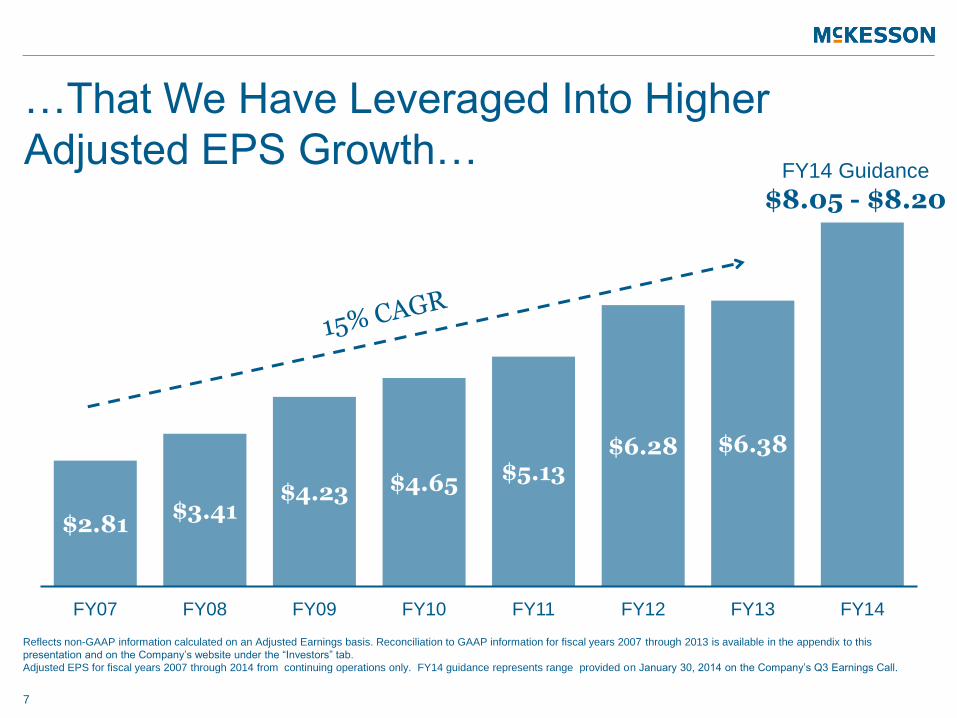
$2.81 $3.41
$4.23 $4.65 $5.13 $6.28 $6.38
FY07 FY08 FY09 FY10 FY11 FY12 FY13 FY14
…That We Have Leveraged Into Higher
Adjusted EPS Growth…
Reflects non-GAAP information calculated on an Adjusted Earnings basis. Reconciliation to GAAP information for fiscal years 2007 through 2013 is available in the appendix to this
presentation and on the Company’s website under the “Investors” tab.
Adjusted EPS for fiscal years 2007 through 2014 from continuing operations only. FY14 guidance represents range provided on January 30, 2014 on the Company’s Q3 Earnings Call.
7
FY14 Guidance
$8.05 - $8.20
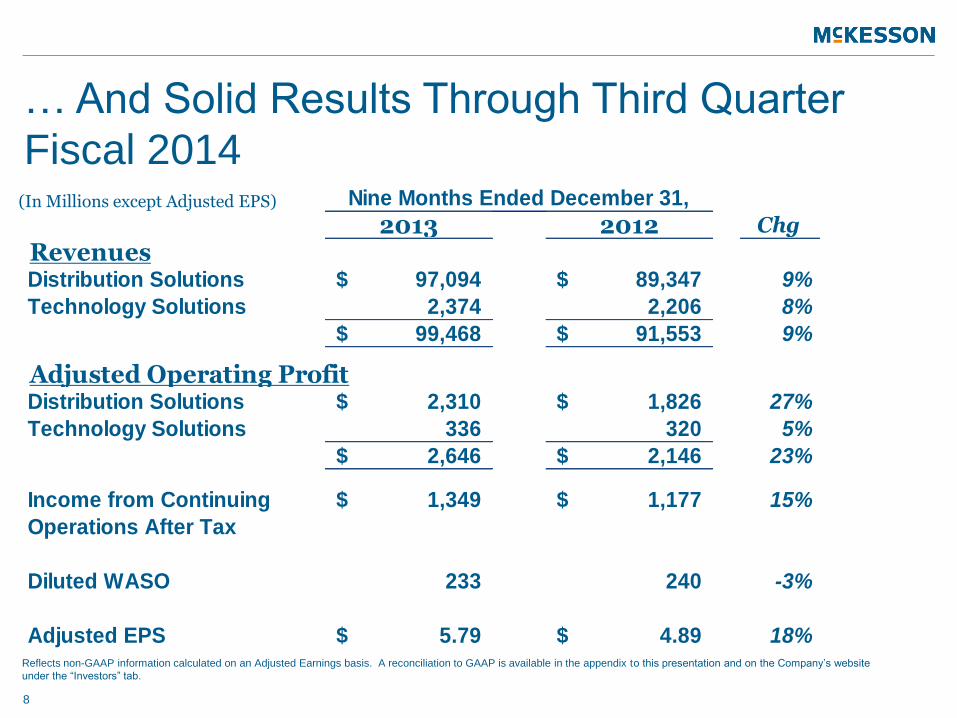
2013 2012 Chg
RevenuesDistribution Solutions 97,094$ 89,347$ 9%
Technology Solutions 2,374 2,206 8%
99,468$ 91,553$ 9%
Adjusted Operating ProfitDistribution Solutions 2,310$ 1,826$ 27%
Technology Solutions 336 320 5%
2,646$ 2,146$ 23%
Income from Continuing 1,349$ 1,177$ 15%
Operations After Tax
Diluted WASO 233 240 -3%
Adjusted EPS 5.79$ 4.89$ 18%
Nine Months Ended December 31,
Reflects non-GAAP information calculated on an Adjusted Earnings basis. A reconciliation to GAAP is available in the appendix to this presentation and on the Company’s website
under the “Investors” tab.
… And Solid Results Through Third Quarter
Fiscal 2014
8
(In Millions except Adjusted EPS)
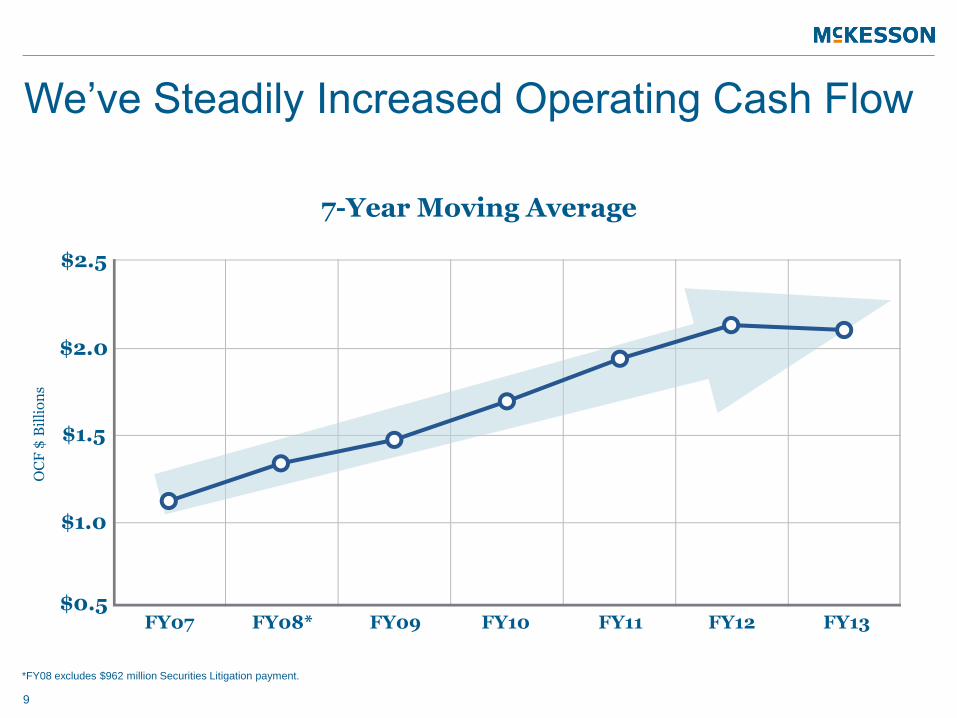
We’ve Steadily Increased Operating Cash Flow
7-Year Moving Average
OC
F $
Bil
lio
ns
$2.5
$2.0
$1.5
$1.0
$0.5 FY07 FY08* FY09 FY10 FY11 FY12 FY13
*FY08 excludes $962 million Securities Litigation payment.
9
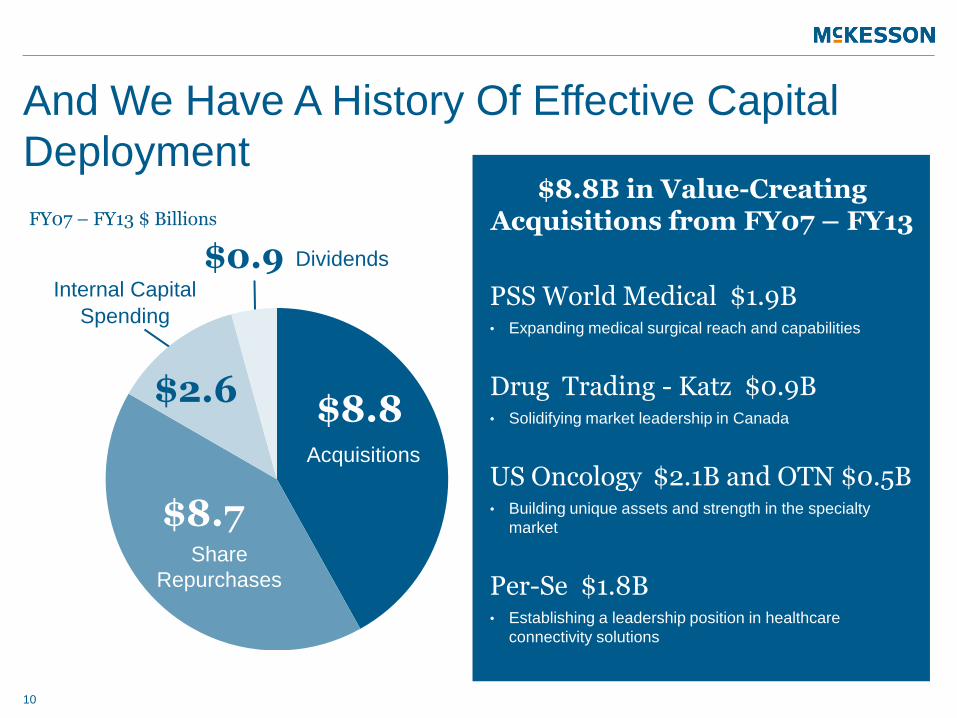
$8.7
$8.8 $2.6
Share
Repurchases
Acquisitions
And We Have A History Of Effective Capital
Deployment
10
FY07 – FY13 $ Billions
$8.8B in Value-Creating Acquisitions from FY07 – FY13
PSS World Medical $1.9B • Expanding medical surgical reach and capabilities
Drug Trading - Katz $0.9B • Solidifying market leadership in Canada
US Oncology $2.1B and OTN $0.5B • Building unique assets and strength in the specialty
market
Per-Se $1.8B • Establishing a leadership position in healthcare
connectivity solutions
$0.9 Dividends
Internal Capital
Spending
PSS World Medical Integration Update
11
Leadership Integration
Synergies
Salesforce Engagement
Expanding Global Reach
12
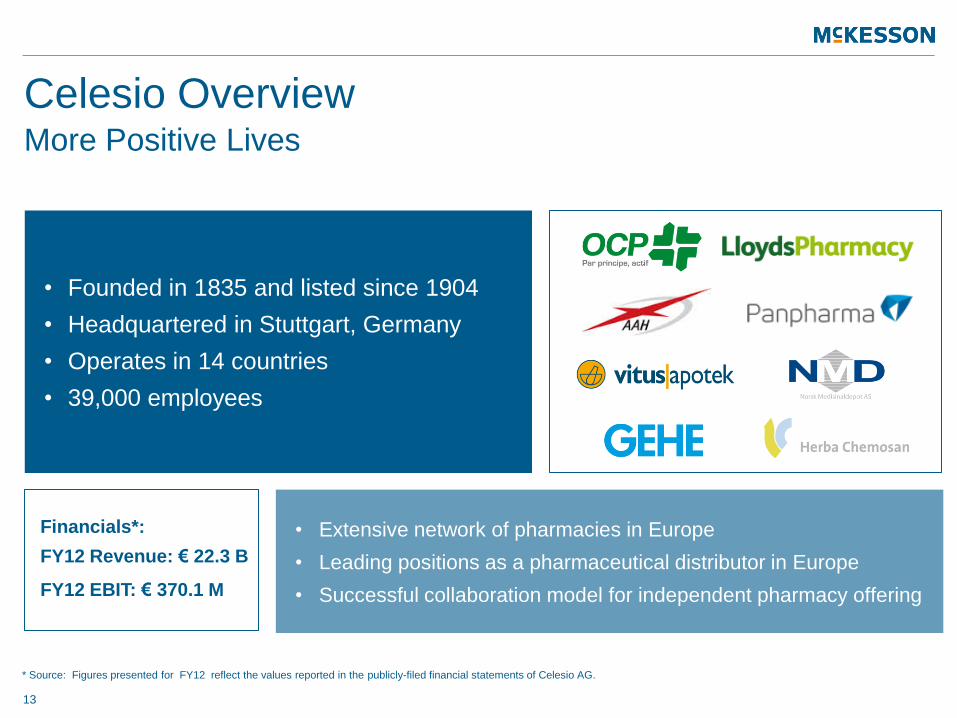
Celesio Overview More Positive Lives
* Source: Figures presented for FY12 reflect the values reported in the publicly-filed financial statements of Celesio AG.
13
• Founded in 1835 and listed since 1904
• Headquartered in Stuttgart, Germany
• Operates in 14 countries
• 39,000 employees
• Extensive network of pharmacies in Europe
• Leading positions as a pharmaceutical distributor in Europe
• Successful collaboration model for independent pharmacy offering
Financials*:
FY12 Revenue: € 22.3 B
FY12 EBIT: € 370.1 M
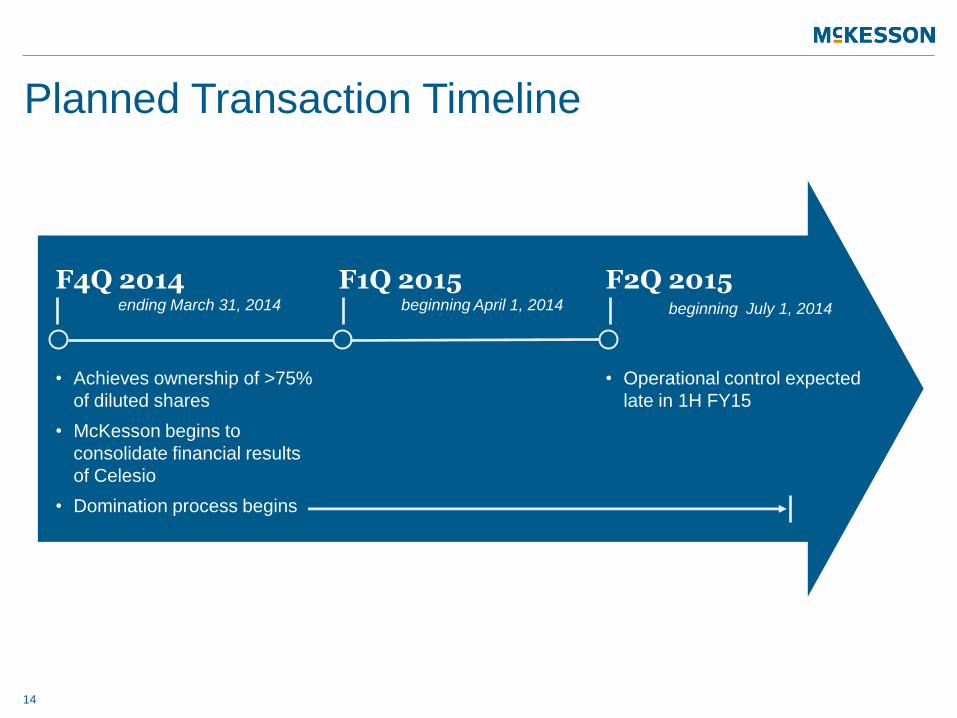
Planned Transaction Timeline
14
F4Q 2014 ending March 31, 2014
F1Q 2015 beginning April 1, 2014
F2Q 2015
• Achieves ownership of >75%
of diluted shares
• McKesson begins to
consolidate financial results
of Celesio
• Domination process begins
• Operational control expected
late in 1H FY15
beginning July 1, 2014
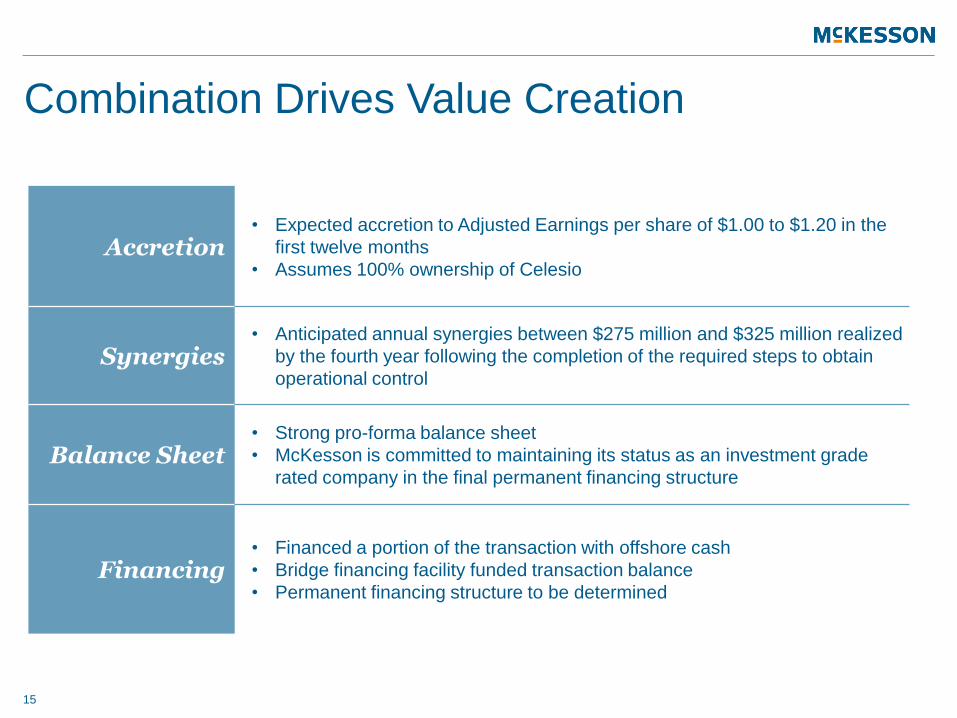
Combination Drives Value Creation
15
Accretion • Expected accretion to Adjusted Earnings per share of $1.00 to $1.20 in the
first twelve months
• Assumes 100% ownership of Celesio
Synergies • Anticipated annual synergies between $275 million and $325 million realized
by the fourth year following the completion of the required steps to obtain
operational control
Balance Sheet • Strong pro-forma balance sheet
• McKesson is committed to maintaining its status as an investment grade
rated company in the final permanent financing structure
Financing • Financed a portion of the transaction with offshore cash
• Bridge financing facility funded transaction balance
• Permanent financing structure to be determined
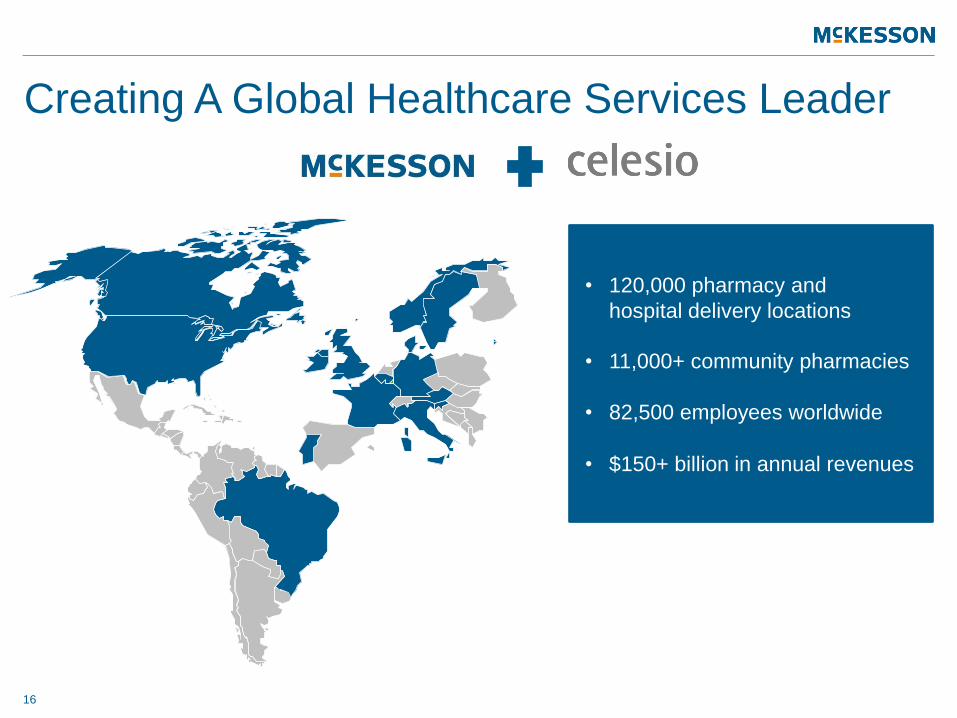
Creating A Global Healthcare Services Leader
16
• 120,000 pharmacy and
hospital delivery locations
• 11,000+ community pharmacies
• 82,500 employees worldwide
• $150+ billion in annual revenues
17
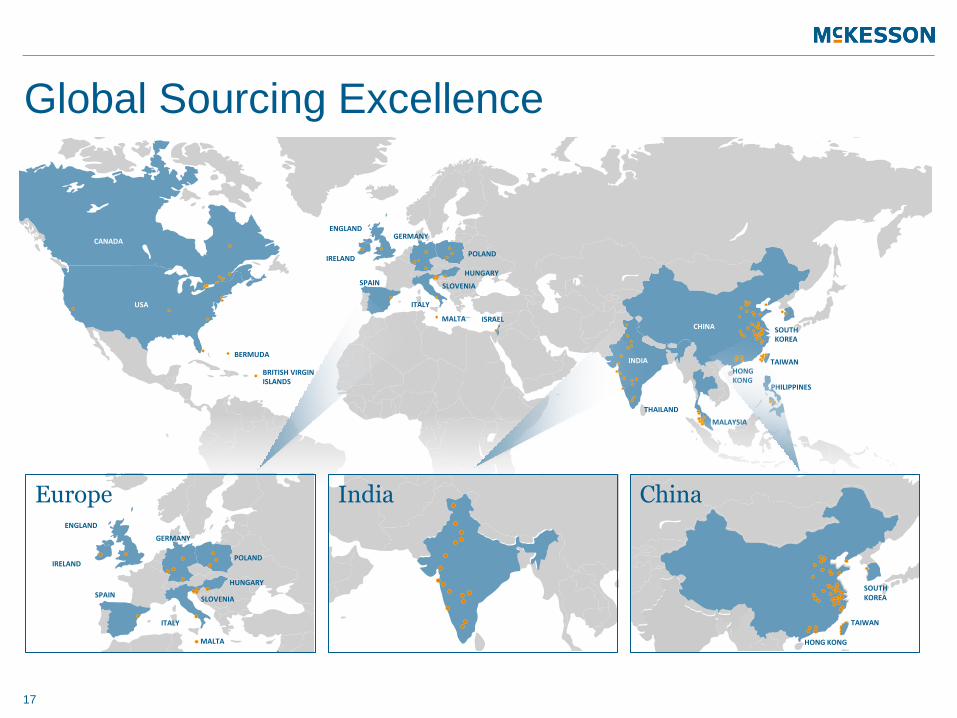
USA
CANADA
IRELAND
SLOVENIA
GERMANY
INDIA
CHINA
TAIWAN
MALAYSIA
SPAIN
MALTA
PHILIPPINES
HUNGARY
SOUTH KOREA
THAILAND
ISRAEL
POLAND
HONG KONG
ITALY
BRITISH VIRGIN ISLANDS
BERMUDA
ENGLAND
IRELAND
SLOVENIA
GERMANY
SPAIN
MALTA
HUNGARY
POLAND
ITALY
ENGLAND
Europe India China
SOUTH KOREA
TAIWAN
HONG KONG
Global Sourcing Excellence
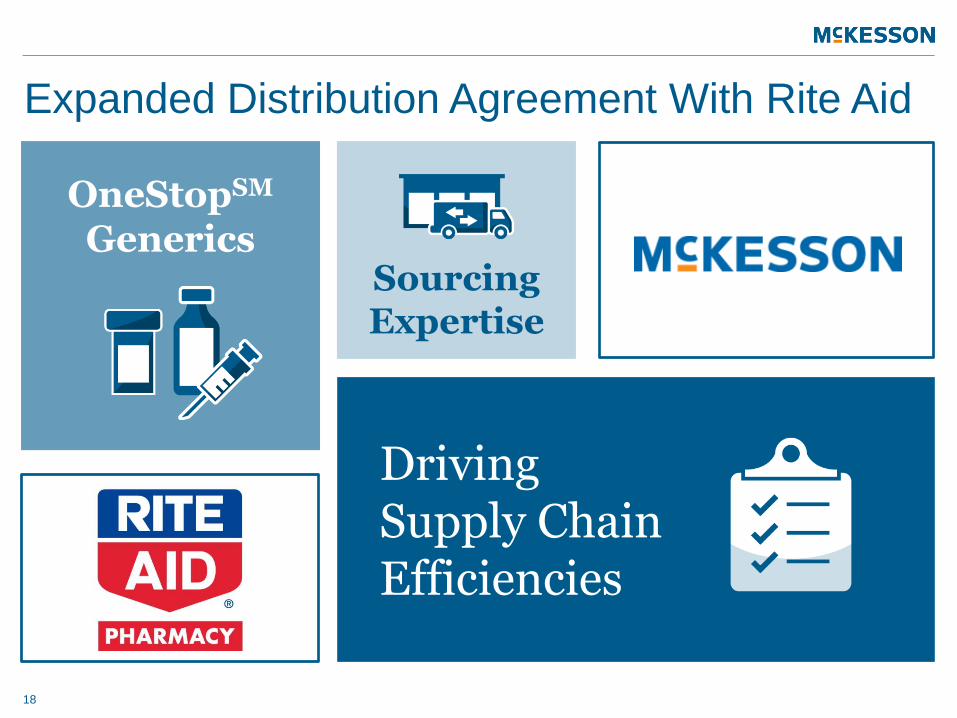
Expanded Distribution Agreement With Rite Aid
18
Driving Supply Chain Efficiencies
Sourcing Expertise
OneStopSM Generics

In Business For Better Health
19
Appendix
The Company believes the presentation of non‐GAAP measures such as Adjusted Earnings provides useful supplemental information to investors with regard to its core operating performance, as well as assists with the comparison of its past financial performance to the Company’s future financial results. Moreover, the Company believes that the presentation of Adjusted Earnings assists investors’ ability to compare its financial results to those of other companies in the same industry. However, the Company's Adjusted Earnings measure may be defined and calculated differently by other companies in the same industry. The Company internally uses non‐GAAP financial measures such as Adjusted Earnings in connection with its own financial planning and reporting processes. Specifically, Adjusted Earnings serves as one of the measures management utilizes when allocating resources, deploying capital and assessing business performance and employee incentive compensation. Nonetheless, non‐GAAP financial results and related measures disclosed by the Company should not be considered a substitute for, nor superior to, financial results and measures as determined or calculated in accordance with GAAP. Adjusted Earnings represents income from continuing operations, excluding the effects of the following items from the Company’s GAAP financial results, including the related income tax effects: Amortization of acquisition‐related intangibles ‐ Amortization expense of acquired intangible assets purchased in connection with acquisitions by the Company. Acquisition expenses and related adjustments ‐ Transaction and integration expenses that are directly related to acquisitions by the Company. Examples include transaction closing costs, professional service fees, restructuring or severance charges, retention payments, employee relocation expenses, facility or other exit‐related expenses, recoveries of acquisition‐related expenses or post‐closing expenses, bridge loan fees, gains or losses related to foreign currency contracts, and gains or losses on business combinations. Litigation reserve adjustments ‐ Adjustments to the Company’s reserves, including accrued interest, for estimated probable losses for its Average Wholesale Price and Securities Litigation matters, as such terms were defined in the Company’s Annual Reports on Form 10‐K for the fiscal years ended March 31, 2013 and 2009. LIFO‐related adjustments ‐ Last‐In‐First‐Out (“LIFO”) inventory related adjustments. Income taxes on Adjusted Earnings are calculated in accordance with Accounting Standards Codification 740, “Income Taxes,” which is the same accounting principles used by the Company when presenting its GAAP financial results.
Adjusted Earnings (Non-GAAP) Financial
Information
22
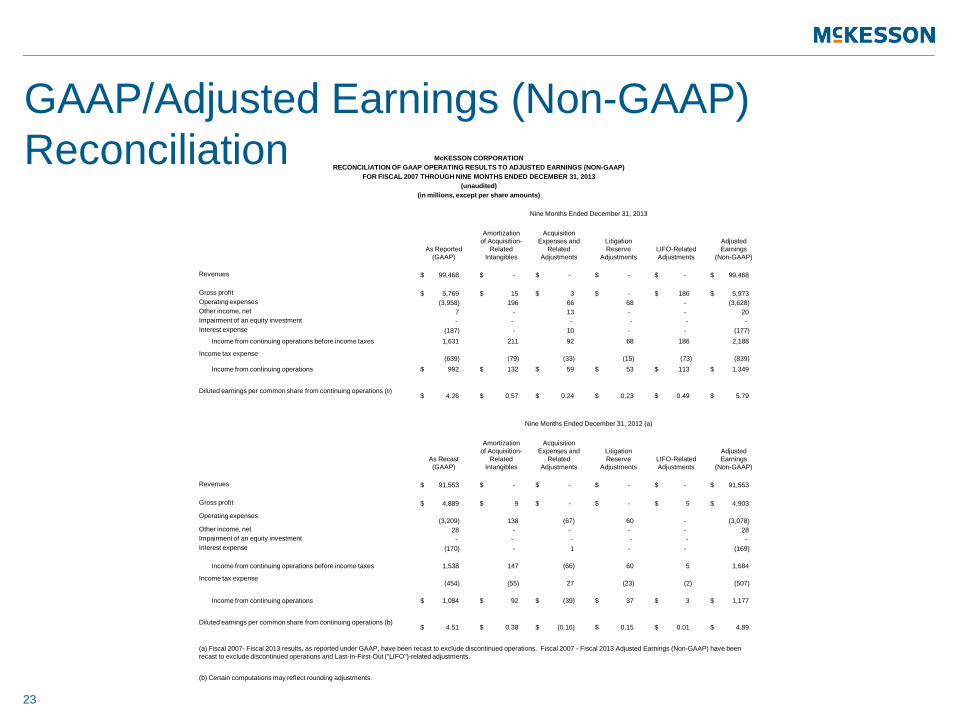
GAAP/Adjusted Earnings (Non-GAAP)
Reconciliation
23
McKESSON CORPORATION
RECONCILIATION OF GAAP OPERATING RESULTS TO ADJUSTED EARNINGS (NON-GAAP)
FOR FISCAL 2007 THROUGH NINE MONTHS ENDED DECEMBER 31, 2013
(unaudited)
(in millions, except per share amounts)
Nine Months Ended December 31, 2013
As Reported
(GAAP)
Amortization
of Acquisition-
Related
Intangibles
Acquisition
Expenses and
Related
Adjustments
Litigation
Reserve
Adjustments
LIFO-Related
Adjustments
Adjusted
Earnings
(Non-GAAP)
Revenues $ 99,468 $ - $ - $ - $ - $ 99,468
Gross profit $ 5,769 $ 15 $ 3 $ - $ 186 $ 5,973
Operating expenses (3,958) 196 66 68 - (3,628)
Other income, net 7 - 13 - - 20
Impairment of an equity investment - - - - - -
Interest expense (187) - 10 - - (177)
Income from continuing operations before income taxes 1,631 211 92 68 186 2,188
Income tax expense (639) (79) (33) (15) (73) (839)
Income from continuing operations $ 992 $ 132 $ 59 $ 53 $ 113 $ 1,349
Diluted earnings per common share from continuing operations (b) $ 4.26 $ 0.57 $ 0.24 $ 0.23 $ 0.49 $ 5.79
Nine Months Ended December 31, 2012 (a)
As Recast
(GAAP)
Amortization
of Acquisition-
Related
Intangibles
Acquisition
Expenses and
Related
Adjustments
Litigation
Reserve
Adjustments
LIFO-Related
Adjustments
Adjusted
Earnings
(Non-GAAP)
Revenues $ 91,553 $ - $ - $ - $ - $ 91,553
Gross profit $ 4,889 $ 9 $ - $ - $ 5 $ 4,903
Operating expenses (3,209) 138 (67) 60 - (3,078)
Other income, net 28 - - - - 28
Impairment of an equity investment - - - - - -
Interest expense (170) - 1 - - (169)
Income from continuing operations before income taxes 1,538 147 (66) 60 5 1,684
Income tax expense (454) (55) 27 (23) (2) (507)
Income from continuing operations $ 1,084 $ 92 $ (39) $ 37 $ 3 $ 1,177
Diluted earnings per common share from continuing operations (b) $ 4.51 $ 0.38 $ (0.16) $ 0.15 $ 0.01 $ 4.89
(a) Fiscal 2007- Fiscal 2013 results, as reported under GAAP, have been recast to exclude discontinued operations. Fiscal 2007 - Fiscal 2013 Adjusted Earnings (Non-GAAP) have been
recast to exclude discontinued operations and Last-In-First-Out ("LIFO")-related adjustments.
(b) Certain computations may reflect rounding adjustments.
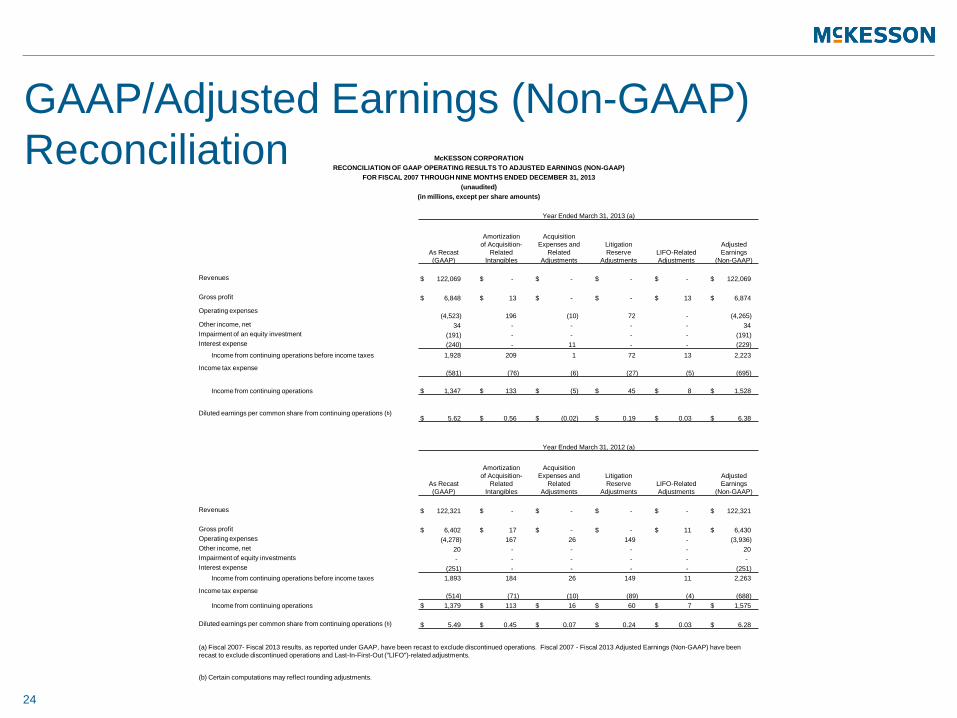
GAAP/Adjusted Earnings (Non-GAAP)
Reconciliation
24
McKESSON CORPORATION
RECONCILIATION OF GAAP OPERATING RESULTS TO ADJUSTED EARNINGS (NON-GAAP)
FOR FISCAL 2007 THROUGH NINE MONTHS ENDED DECEMBER 31, 2013
(unaudited)
(in millions, except per share amounts)
Year Ended March 31, 2013 (a)
As Recast
(GAAP)
Amortization
of Acquisition-
Related
Intangibles
Acquisition
Expenses and
Related
Adjustments
Litigation
Reserve
Adjustments
LIFO-Related
Adjustments
Adjusted
Earnings
(Non-GAAP)
Revenues $ 122,069 $ - $ - $ - $ - $ 122,069
Gross profit $ 6,848 $ 13 $ - $ - $ 13 $ 6,874
Operating expenses (4,523) 196 (10) 72 - (4,265)
Other income, net 34 - - - - 34
Impairment of an equity investment (191) - - - - (191)
Interest expense (240) - 11 - - (229)
Income from continuing operations before income taxes 1,928 209 1 72 13 2,223
Income tax expense (581) (76) (6) (27) (5) (695)
Income from continuing operations $ 1,347 $ 133 $ (5) $ 45 $ 8 $ 1,528
Diluted earnings per common share from continuing operations (b) $ 5.62 $ 0.56 $ (0.02) $ 0.19 $ 0.03 $ 6.38
Year Ended March 31, 2012 (a)
As Recast
(GAAP)
Amortization
of Acquisition-
Related
Intangibles
Acquisition
Expenses and
Related
Adjustments
Litigation
Reserve
Adjustments
LIFO-Related
Adjustments
Adjusted
Earnings
(Non-GAAP)
Revenues $ 122,321 $ - $ - $ - $ - $ 122,321
Gross profit $ 6,402 $ 17 $ - $ - $ 11 $ 6,430
Operating expenses (4,278) 167 26 149 - (3,936)
Other income, net 20 - - - - 20
Impairment of equity investments - - - - - -
Interest expense (251) - - - - (251)
Income from continuing operations before income taxes 1,893 184 26 149 11 2,263
Income tax expense (514) (71) (10) (89) (4) (688)
Income from continuing operations $ 1,379 $ 113 $ 16 $ 60 $ 7 $ 1,575
Diluted earnings per common share from continuing operations (b) $ 5.49 $ 0.45 $ 0.07 $ 0.24 $ 0.03 $ 6.28
(a) Fiscal 2007- Fiscal 2013 results, as reported under GAAP, have been recast to exclude discontinued operations. Fiscal 2007 - Fiscal 2013 Adjusted Earnings (Non-GAAP) have been
recast to exclude discontinued operations and Last-In-First-Out ("LIFO")-related adjustments.
(b) Certain computations may reflect rounding adjustments.

GAAP/Adjusted Earnings (Non-GAAP)
Reconciliation
25
McKESSON CORPORATION
RECONCILIATION OF GAAP OPERATING RESULTS TO ADJUSTED EARNINGS (NON-GAAP)
FOR FISCAL 2007 THROUGH NINE MONTHS ENDED DECEMBER 31, 2013
(unaudited)
(in millions, except per share amounts)
Year Ended March 31, 2011 (a)
As Recast
(GAAP)
Amortization
of Acquisition-
Related
Intangibles
Acquisition
Expenses and
Related
Adjustments
Litigation
Reserve
Adjustments
LIFO-Related
Adjustments
Adjusted
Earnings
(Non-GAAP)
Revenues $ 111,677 $ - $ - $ - $ - $ 111,677
Gross profit $ 5,797 $ 16 $ - $ - $ 3 $ 5,816
Operating expenses (4,031) 115 43 213 - (3,660)
Other income, net 35 - (16) - - 19
Impairment of equity investments - - - - - -
Interest expense (222) - 25 - - (197)
Income from continuing operations before income taxes 1,579 131 52 213 3 1,978
Income tax expense (496) (51) (16) (64) (1) (628)
Income from continuing operations $ 1,083 $ 80 $ 36 $ 149 $ 2 $ 1,350
Diluted earnings per common share from continuing operations (b) $ 4.12 $ 0.30 $ 0.14 $ 0.57 $ - $ 5.13
Year Ended March 31, 2010 (a)
As Recast
(GAAP)
Amortization
of Acquisition-
Related
Intangibles
Acquisition
Expenses and
Related
Adjustments
Litigation
Reserve
Adjustments
LIFO-Related
Adjustments
Adjusted
Earnings
(Non-GAAP)
Revenues $ 108,295 $ - $ - $ - $ - $ 108,295
Gross profit $ 5,498 $ 21 $ - $ - $ 8 $ 5,527
Operating expenses (3,549) 97 - (20) - (3,472)
Other income, net 43 - - - - 43
Impairment of equity investments - - - - - -
Interest expense (186) - - - - (186)
Income from continuing operations before income taxes 1,806 118 - (20) 8 1,912
Income tax expense (601) (46) - 8 (3) (642)
Income from continuing operations $ 1,205 $ 72 $ - $ (12) $ 5 $ 1,270
Diluted earnings per common share from continuing operations (b) $ 4.41 $ 0.26 $ - $ (0.04) $ 0.02 $ 4.65
(a) Fiscal 2007- Fiscal 2013 results, as reported under GAAP, have been recast to exclude discontinued operations. Fiscal 2007 - Fiscal 2013 Adjusted Earnings (Non-GAAP) have been
recast to exclude discontinued operations and Last-In-First-Out ("LIFO")-related adjustments.
(b) Certain computations may reflect rounding adjustments.
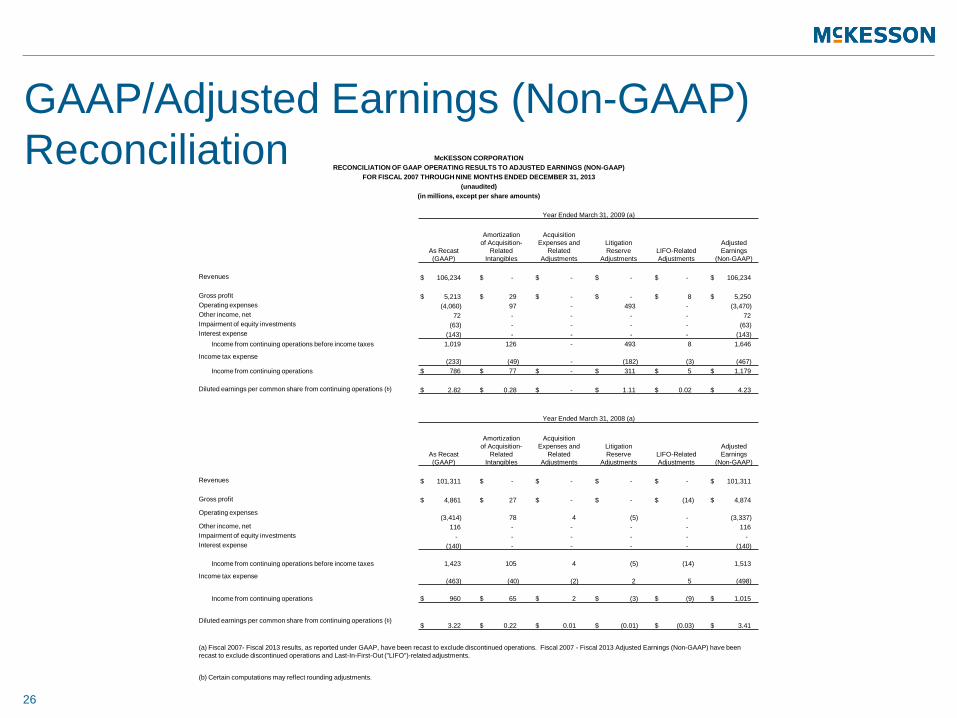
GAAP/Adjusted Earnings (Non-GAAP)
Reconciliation
26
McKESSON CORPORATION
RECONCILIATION OF GAAP OPERATING RESULTS TO ADJUSTED EARNINGS (NON-GAAP)
FOR FISCAL 2007 THROUGH NINE MONTHS ENDED DECEMBER 31, 2013
(unaudited)
(in millions, except per share amounts)
Year Ended March 31, 2009 (a)
As Recast
(GAAP)
Amortization
of Acquisition-
Related
Intangibles
Acquisition
Expenses and
Related
Adjustments
Litigation
Reserve
Adjustments
LIFO-Related
Adjustments
Adjusted
Earnings
(Non-GAAP)
Revenues $ 106,234 $ - $ - $ - $ - $ 106,234
Gross profit $ 5,213 $ 29 $ - $ - $ 8 $ 5,250
Operating expenses (4,060) 97 - 493 - (3,470)
Other income, net 72 - - - - 72
Impairment of equity investments (63) - - - - (63)
Interest expense (143) - - - - (143)
Income from continuing operations before income taxes 1,019 126 - 493 8 1,646
Income tax expense (233) (49) - (182) (3) (467)
Income from continuing operations $ 786 $ 77 $ - $ 311 $ 5 $ 1,179
Diluted earnings per common share from continuing operations (b) $ 2.82 $ 0.28 $ - $ 1.11 $ 0.02 $ 4.23
Year Ended March 31, 2008 (a)
As Recast
(GAAP)
Amortization
of Acquisition-
Related
Intangibles
Acquisition
Expenses and
Related
Adjustments
Litigation
Reserve
Adjustments
LIFO-Related
Adjustments
Adjusted
Earnings
(Non-GAAP)
Revenues $ 101,311 $ - $ - $ - $ - $ 101,311
Gross profit $ 4,861 $ 27 $ - $ - $ (14) $ 4,874
Operating expenses (3,414) 78 4 (5) - (3,337)
Other income, net 116 - - - - 116
Impairment of equity investments - - - - - -
Interest expense (140) - - - - (140)
Income from continuing operations before income taxes 1,423 105 4 (5) (14) 1,513
Income tax expense (463) (40) (2) 2 5 (498)
Income from continuing operations $ 960 $ 65 $ 2 $ (3) $ (9) $ 1,015
Diluted earnings per common share from continuing operations (b) $ 3.22 $ 0.22 $ 0.01 $ (0.01) $ (0.03) $ 3.41
(a) Fiscal 2007- Fiscal 2013 results, as reported under GAAP, have been recast to exclude discontinued operations. Fiscal 2007 - Fiscal 2013 Adjusted Earnings (Non-GAAP) have been
recast to exclude discontinued operations and Last-In-First-Out ("LIFO")-related adjustments.
(b) Certain computations may reflect rounding adjustments.
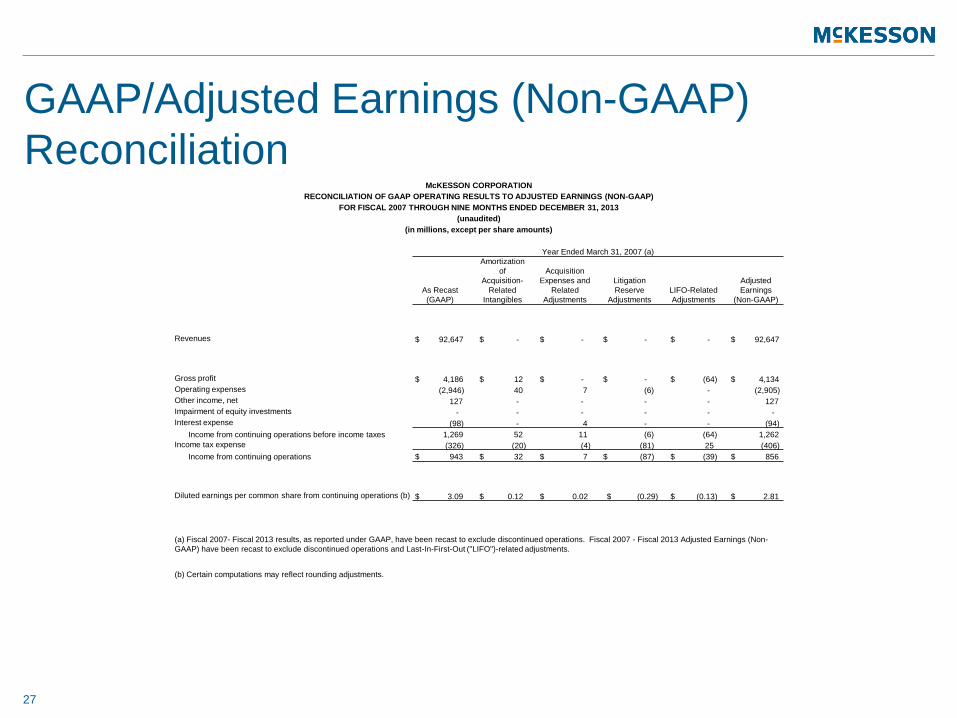
GAAP/Adjusted Earnings (Non-GAAP)
Reconciliation
27
McKESSON CORPORATION
RECONCILIATION OF GAAP OPERATING RESULTS TO ADJUSTED EARNINGS (NON-GAAP)
FOR FISCAL 2007 THROUGH NINE MONTHS ENDED DECEMBER 31, 2013
(unaudited)
(in millions, except per share amounts)
Year Ended March 31, 2007 (a)
As Recast
(GAAP)
Amortization
of
Acquisition-
Related
Intangibles
Acquisition
Expenses and
Related
Adjustments
Litigation
Reserve
Adjustments
LIFO-Related
Adjustments
Adjusted
Earnings
(Non-GAAP)
Revenues $ 92,647 $ - $ - $ - $ - $ 92,647
Gross profit $ 4,186 $ 12 $ - $ - $ (64) $ 4,134
Operating expenses (2,946) 40 7 (6) - (2,905)
Other income, net 127 - - - - 127
Impairment of equity investments - - - - - -
Interest expense (98) - 4 - - (94)
Income from continuing operations before income taxes 1,269 52 11 (6) (64) 1,262
Income tax expense (326) (20) (4) (81) 25 (406)
Income from continuing operations $ 943 $ 32 $ 7 $ (87) $ (39) $ 856
Diluted earnings per common share from continuing operations (b) $ 3.09 $ 0.12 $ 0.02 $ (0.29) $ (0.13) $ 2.81
(a) Fiscal 2007- Fiscal 2013 results, as reported under GAAP, have been recast to exclude discontinued operations. Fiscal 2007 - Fiscal 2013 Adjusted Earnings (Non-
GAAP) have been recast to exclude discontinued operations and Last-In-First-Out ("LIFO")-related adjustments.
(b) Certain computations may reflect rounding adjustments.
GAAP/Adjusted Earnings (Non-GAAP)
Reconciliation
28
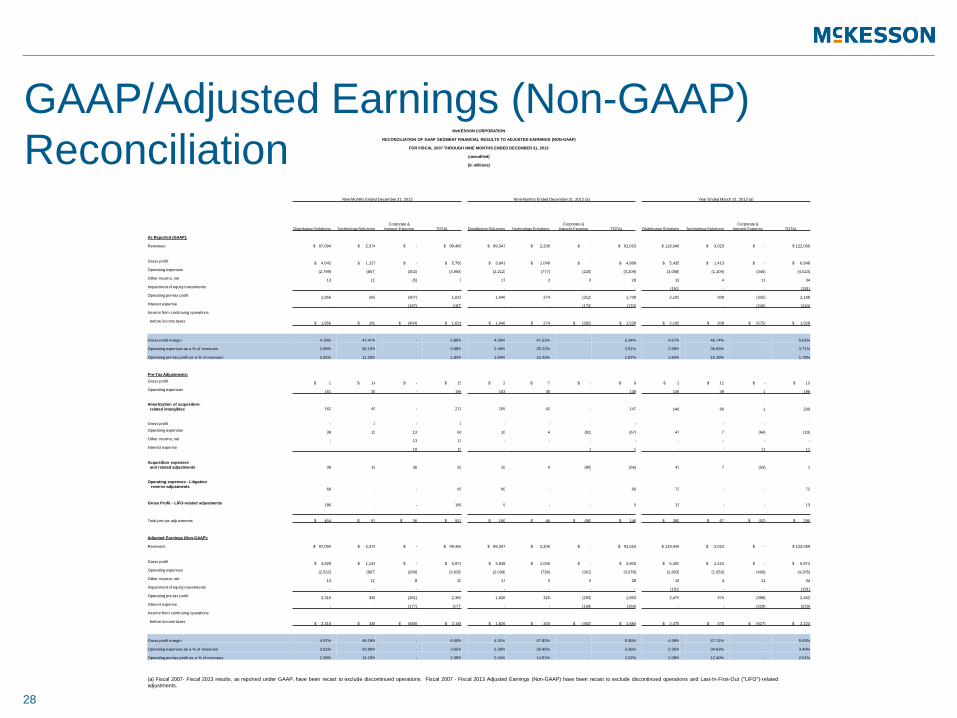
McKESSON CORPORATION
RECONCILIATION OF GAAP SEGMENT FINANCIAL RESULTS TO ADJUSTED EARNINGS (NON-GAAP)
FOR FISCAL 2007 THROUGH NINE MONTHS ENDED DECEMBER 31, 2013
(unaudited)
(in millions)
Nine Months Ended December 31, 2013 Nine Months Ended December 31, 2012 (a) Year Ended March 31, 2013 (a)
Distribution Solutions Technology Solutions
Corporate &
Interest Expense TOTAL Distribution Solutions Technology Solutions
Corporate &
Interest Expense TOTAL Distribution Solutions
Technology Solutions
Corporate &
Interest Expense TOTAL
As Reported (GAAP):
Revenues $ 97,094 $ 2,374 $ - $ 99,468 $ 89,347 $ 2,206 $ - $ 91,553 $ 119,046 $ 3,023 $ - $ 122,069
Gross profit $ 4,642 $ 1,127 $ - $ 5,769 $ 3,841 $ 1,048 $ - $ 4,889 $ 5,435 $ 1,413 $ - $ 6,848
Operating expenses (2,799) (857) (302) (3,958) (2,212) (777) (220) (3,209) (3,068) (1,109) (346) (4,523)
Other income, net 13 (1) (5) 7 17 3 8 28 19 4 11 34
Impairment of equity investments - - - - - - - - (191) - - (191)
Operating pre-tax profit 1,856 269 (307) 1,818 1,646 274 (212) 1,708 2,195 308 (335) 2,168
Interest expense - - (187) (187) - - (170) (170) - - (240) (240)
Income from continuing operations
before income taxes $ 1,856 $ 269 $ (494) $ 1,631 $ 1,646 $ 274 $ (382) $ 1,538 $ 2,195 $ 308 $ (575) $ 1,928
Gross profit margin 4.78% 47.47% - 5.80% 4.30% 47.51% - 5.34% 4.57% 46.74% - 5.61%
Operating expenses as a % of revenues 2.88% 36.10% - 3.98% 2.48% 35.22% - 3.51% 2.58% 36.69% - 3.71%
Operating pre-tax profit as a % of revenues 1.91% 11.33% - 1.83% 1.84% 12.42% - 1.87% 1.84% 10.19% - 1.78%
Pre-Tax Adjustments:
Gross profit $ 1 $ 14 $ - $ 15 $ 2 $ 7 $ - $ 9 $ 2 $ 11 $ - $ 13
Operating expenses 161 35 - 196 103 35 - 138 146 49 1 196
Amortization of acquisition-
related intangibles 162 49 - 211 105 42 - 147 148 60 1 209
Gross profit - 3 - 3 - - - - - - - -
Operating expenses 38 15 13 66 10 4 (81) (67) 47 7 (64) (10)
Other income, net - - 13 13 - - - - - - - -
Interest expense - - 10 10 - - 1 1 - - 11 11
Acquisition expenses
and related adjustments 38 18 36 92 10 4 (80) (66) 47 7 (53) 1
Operating expenses - Litigation
reserve adjustments 68 - - 68 60 - - 60 72 - - 72
Gross Profit - LIFO-related adjustments 186 - - 186 5 - - 5 13 - - 13
Total pre-tax adjustments $ 454 $ 67 $ 36 $ 557 $ 180 $ 46 $ (80) $ 146 $ 280 $ 67 $ (52) $ 295
Adjusted Earnings (Non-GAAP):
Revenues $ 97,094 $ 2,374 $ - $ 99,468 $ 89,347 $ 2,206 $ - $ 91,553 $ 119,046 $ 3,023 $ - $ 122,069
Gross profit $ 4,829 $ 1,144 $ - $ 5,973 $ 3,848 $ 1,055 $ - $ 4,903 $ 5,450 $ 1,424 $ - $ 6,874
Operating expenses (2,532) (807) (289) (3,628) (2,039) (738) (301) (3,078) (2,803) (1,053) (409) (4,265)
Other income, net 13 (1) 8 20 17 3 8 28 19 4 11 34
Impairment of equity investments - - - - - - - - (191) - - (191)
Operating pre-tax profit 2,310 336 (281) 2,365 1,826 320 (293) 1,853 2,475 375 (398) 2,452
Interest expense - - (177) (177) - - (169) (169) - - (229) (229)
Income from continuing operations
before income taxes $ 2,310 $ 336 $ (458) $ 2,188 $ 1,826 $ 320 $ (462) $ 1,684 $ 2,475 $ 375 $ (627) $ 2,223
Gross profit margin 4.97% 48.19% - 6.00% 4.31% 47.82% - 5.36% 4.58% 47.11% - 5.63%
Operating expenses as a % of revenues 2.61% 33.99% - 3.65% 2.28% 33.45% - 3.36% 2.35% 34.83% - 3.49%
Operating pre-tax profit as a % of revenues 2.38% 14.15% - 2.38% 2.04% 14.51% - 2.02% 2.08% 12.40% - 2.01%
(a) Fiscal 2007- Fiscal 2013 results, as reported under GAAP, have been recast to exclude discontinued operations. Fiscal 2007 - Fiscal 2013 Adjusted Earnings (Non-GAAP) have been recast to exclude discontinued operations and Last-In-First-Out ("LIFO")-related
adjustments.
GAAP/Adjusted Earnings (Non-GAAP)
Reconciliation
29
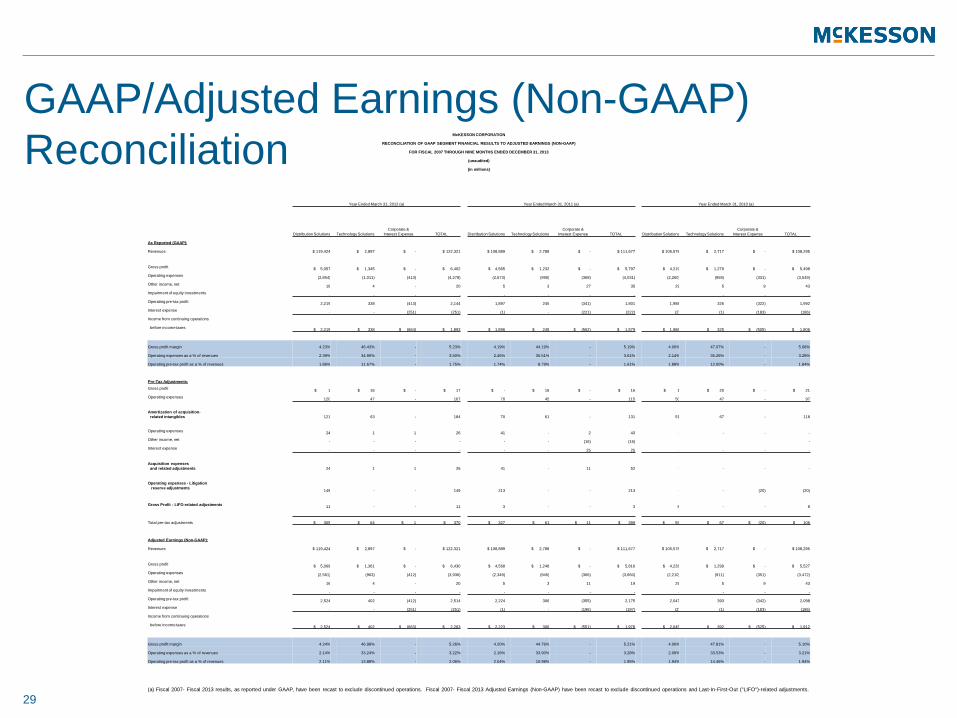
McKESSON CORPORATION
RECONCILIATION OF GAAP SEGMENT FINANCIAL RESULTS TO ADJUSTED EARNINGS (NON-GAAP)
FOR FISCAL 2007 THROUGH NINE MONTHS ENDED DECEMBER 31, 2013
(unaudited)
(in millions)
Year Ended March 31, 2012 (a) Year Ended March 31, 2011 (a) Year Ended March 31, 2010 (a)
Distribution Solutions Technology Solutions
Corporate &
Interest Expense TOTAL Distribution Solutions Technology Solutions
Corporate &
Interest Expense TOTAL Distribution Solutions Technology Solutions
Corporate &
Interest Expense TOTAL
As Reported (GAAP):
Revenues $ 119,424 $ 2,897 $ - $ 122,321 $ 108,889 $ 2,788 $ - $ 111,677 $ 105,578 $ 2,717 $ - $ 108,295
Gross profit $ 5,057 $ 1,345 $ - $ 6,402 $ 4,565 $ 1,232 $ - $ 5,797 $ 4,219 $ 1,279 $ - $ 5,498
Operating expenses (2,854) (1,011) (413) (4,278) (2,673) (990) (368) (4,031) (2,260) (958) (331) (3,549)
Other income, net 16 4 - 20 5 3 27 35 29 5 9 43
Impairment of equity investments - - - - - - - - - - - -
Operating pre-tax profit 2,219 338 (413) 2,144 1,897 245 (341) 1,801 1,988 326 (322) 1,992
Interest expense - - (251) (251) (1) - (221) (222) (2) (1) (183) (186)
Income from continuing operations
before income taxes $ 2,219 $ 338 $ (664) $ 1,893 $ 1,896 $ 245 $ (562) $ 1,579 $ 1,986 $ 325 $ (505) $ 1,806
Gross profit margin 4.23% 46.43% - 5.23% 4.19% 44.19% - 5.19% 4.00% 47.07% - 5.08%
Operating expenses as a % of revenues 2.39% 34.90% - 3.50% 2.45% 35.51% - 3.61% 2.14% 35.26% - 3.28%
Operating pre-tax profit as a % of revenues 1.86% 11.67% - 1.75% 1.74% 8.79% - 1.61% 1.88% 12.00% - 1.84%
Pre-Tax Adjustments:
Gross profit $ 1 $ 16 $ - $ 17 $ - $ 16 $ - $ 16 $ 1 $ 20 $ - $ 21
Operating expenses 120 47 - 167 70 45 - 115 50 47 - 97
Amortization of acquisition-
related intangibles 121 63 - 184 70 61 - 131 51 67 - 118
Operating expenses 24 1 1 26 41 - 2 43 - - - -
Other income, net - - - - - - (16) (16) -
Interest expense - - - - - - 25 25 - - - -
Acquisition expenses
and related adjustments 24 1 1 26 41 - 11 52 - - - -
Operating expenses - Litigation
reserve adjustments 149 - - 149 213 - - 213 - - (20) (20)
Gross Profit - LIFO-related adjustments 11 - - 11 3 - - 3 8 - - 8
Total pre-tax adjustments $ 305 $ 64 $ 1 $ 370 $ 327 $ 61 $ 11 $ 399 $ 59 $ 67 $ (20) $ 106
Adjusted Earnings (Non-GAAP):
Revenues $ 119,424 $ 2,897 $ - $ 122,321 $ 108,889 $ 2,788 $ - $ 111,677 $ 105,578 $ 2,717 $ - $ 108,295
Gross profit $ 5,069 $ 1,361 $ - $ 6,430 $ 4,568 $ 1,248 $ - $ 5,816 $ 4,228 $ 1,299 $ - $ 5,527
Operating expenses (2,561) (963) (412) (3,936) (2,349) (945) (366) (3,660) (2,210) (911) (351) (3,472)
Other income, net 16 4 - 20 5 3 11 19 29 5 9 43
Impairment of equity investments - - - - - - - - - - - -
Operating pre-tax profit 2,524 402 (412) 2,514 2,224 306 (355) 2,175 2,047 393 (342) 2,098
Interest expense - - (251) (251) (1) - (196) (197) (2) (1) (183) (186)
Income from continuing operations
before income taxes $ 2,524 $ 402 $ (663) $ 2,263 $ 2,223 $ 306 $ (551) $ 1,978 $ 2,045 $ 392 $ (525) $ 1,912
Gross profit margin 4.24% 46.98% - 5.26% 4.20% 44.76% - 5.21% 4.00% 47.81% - 5.10%
Operating expenses as a % of revenues 2.14% 33.24% - 3.22% 2.16% 33.90% - 3.28% 2.09% 33.53% - 3.21%
Operating pre-tax profit as a % of revenues 2.11% 13.88% - 2.06% 2.04% 10.98% - 1.95% 1.94% 14.46% - 1.94%
(a) Fiscal 2007- Fiscal 2013 results, as reported under GAAP, have been recast to exclude discontinued operations. Fiscal 2007- Fiscal 2013 Adjusted Earnings (Non-GAAP) have been recast to exclude discontinued operations and Last-In-First-Out ("LIFO")-related adjustments.
GAAP/Adjusted Earnings (Non-GAAP)
Reconciliation
30
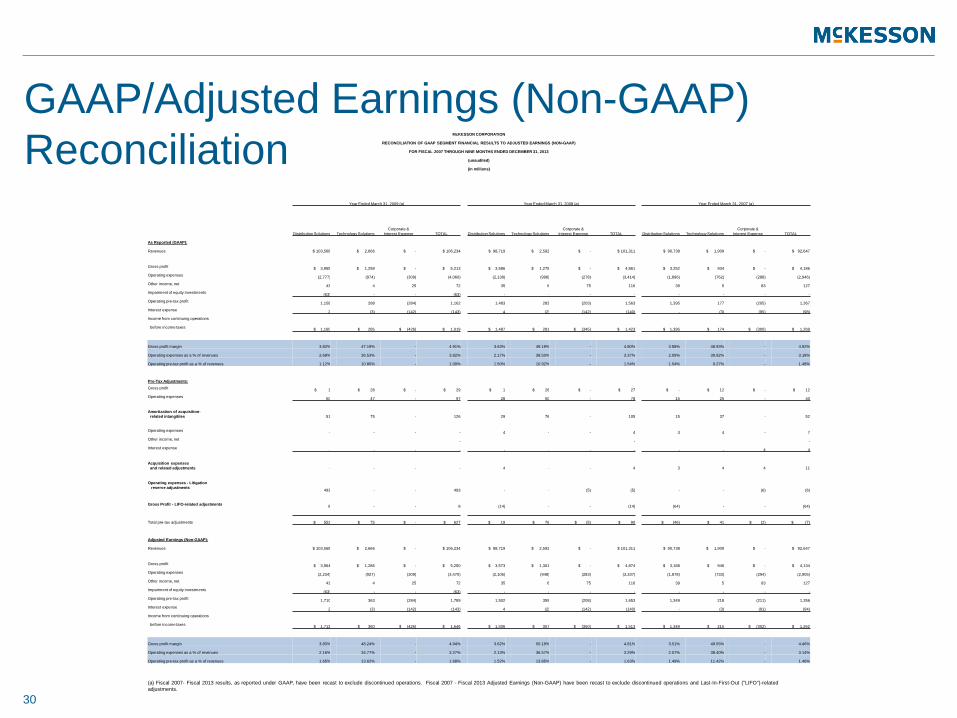
McKESSON CORPORATION
RECONCILIATION OF GAAP SEGMENT FINANCIAL RESULTS TO ADJUSTED EARNINGS (NON-GAAP)
FOR FISCAL 2007 THROUGH NINE MONTHS ENDED DECEMBER 31, 2013
(unaudited)
(in millions)
Year Ended March 31, 2009 (a) Year Ended March 31, 2008 (a) Year Ended March 31, 2007 (a)
Distribution Solutions Technology Solutions
Corporate &
Interest Expense TOTAL Distribution Solutions Technology Solutions
Corporate &
Interest Expense TOTAL Distribution Solutions Technology Solutions
Corporate &
Interest Expense TOTAL
As Reported (GAAP):
Revenues $ 103,568 $ 2,666 $ - $ 106,234 $ 98,719 $ 2,592 $ - $ 101,311 $ 90,738 $ 1,909 $ - $ 92,647
Gross profit $ 3,955 $ 1,258 $ - $ 5,213 $ 3,586 $ 1,275 $ - $ 4,861 $ 3,252 $ 934 $ - $ 4,186
Operating expenses (2,777) (974) (309) (4,060) (2,138) (998) (278) (3,414) (1,896) (762) (288) (2,946)
Other income, net 43 4 25 72 35 6 75 116 39 5 83 127
Impairment of equity investments (63) - - (63) - - - - - - - -
Operating pre-tax profit 1,158 288 (284) 1,162 1,483 283 (203) 1,563 1,395 177 (205) 1,367
Interest expense 2 (3) (142) (143) 4 (2) (142) (140) - (3) (95) (98)
Income from continuing operations
before income taxes $ 1,160 $ 285 $ (426) $ 1,019 $ 1,487 $ 281 $ (345) $ 1,423 $ 1,395 $ 174 $ (300) $ 1,269
Gross profit margin 3.82% 47.19% - 4.91% 3.63% 49.19% - 4.80% 3.58% 48.93% - 4.52%
Operating expenses as a % of revenues 2.68% 36.53% - 3.82% 2.17% 38.50% - 3.37% 2.09% 39.92% - 3.18%
Operating pre-tax profit as a % of revenues 1.12% 10.80% - 1.09% 1.50% 10.92% - 1.54% 1.54% 9.27% - 1.48%
Pre-Tax Adjustments:
Gross profit $ 1 $ 28 $ - $ 29 $ 1 $ 26 $ - $ 27 $ - $ 12 $ - $ 12
Operating expenses 50 47 - 97 28 50 - 78 15 25 - 40
Amortization of acquisition-
related intangibles 51 75 - 126 29 76 - 105 15 37 - 52
Operating expenses - - - - 4 - - 4 3 4 - 7
Other income, net - - -
Interest expense - - - - - - - - - - 4 4
Acquisition expenses
and related adjustments - - - - 4 - - 4 3 4 4 11
Operating expenses - Litigation
reserve adjustments 493 - - 493 - - (5) (5) - - (6) (6)
Gross Profit - LIFO-related adjustments 8 - - 8 (14) - - (14) (64) - - (64)
Total pre-tax adjustments $ 552 $ 75 $ - $ 627 $ 19 $ 76 $ (5) $ 90 $ (46) $ 41 $ (2) $ (7)
Adjusted Earnings (Non-GAAP):
Revenues $ 103,568 $ 2,666 $ - $ 106,234 $ 98,719 $ 2,592 $ - $ 101,311 $ 90,738 $ 1,909 $ - $ 92,647
Gross profit $ 3,964 $ 1,286 $ - $ 5,250 $ 3,573 $ 1,301 $ - $ 4,874 $ 3,188 $ 946 $ - $ 4,134
Operating expenses (2,234) (927) (309) (3,470) (2,106) (948) (283) (3,337) (1,878) (733) (294) (2,905)
Other income, net 43 4 25 72 35 6 75 116 39 5 83 127
Impairment of equity investments (63) - - (63) - - - - - - - -
Operating pre-tax profit 1,710 363 (284) 1,789 1,502 359 (208) 1,653 1,349 218 (211) 1,356
Interest expense 2 (3) (142) (143) 4 (2) (142) (140) - (3) (91) (94)
Income from continuing operations
before income taxes $ 1,712 $ 360 $ (426) $ 1,646 $ 1,506 $ 357 $ (350) $ 1,513 $ 1,349 $ 215 $ (302) $ 1,262
Gross profit margin 3.83% 48.24% - 4.94% 3.62% 50.19% - 4.81% 3.51% 49.55% - 4.46%
Operating expenses as a % of revenues 2.16% 34.77% - 3.27% 2.13% 36.57% - 3.29% 2.07% 38.40% - 3.14%
Operating pre-tax profit as a % of revenues 1.65% 13.62% - 1.68% 1.52% 13.85% - 1.63% 1.49% 11.42% - 1.46%
(a) Fiscal 2007- Fiscal 2013 results, as reported under GAAP, have been recast to exclude discontinued operations. Fiscal 2007 - Fiscal 2013 Adjusted Earnings (Non-GAAP) have been recast to exclude discontinued operations and Last-In-First-Out ("LIFO")-related
adjustments.


