143
CITIC Group Corporation Annual Report 2013 The Annual Report is printed on environmentally friendly paper.
CITIC
Group C
orporation Annual R
eport 2013
The Annual Report is printed on environmentally friendly paper.
02
04
08
12
14
28
31
FINANCIAL SUMMARY
ORGANISATION CHART
CHAIRMAN’S LETTER
BUSINESS HIGHLIGHTS
MANAGEMENT REPORT
CORPORATE SOCIAL RESPONSIBILITY
BOARD OF DIRECTORS, BOARD OF SUPERVISORS AND SENIOR MANAGEMENT OF CITIC GROUP CORPORATION AND CITIC LIMITED
THE CITIC SPIRIT
Law-abiding Upright & Honest
Practical & Realistic Innovative
Modest & Prudent Working as a Team
Industrious & Self-motivated
Contents
INVESTOR RELATIONS
CORPORATE GOVERNANCE
RISK MANAGEMENT
AUDITOR’S REPORT AND FINANCIAL STATEMENTS
CONTACT US
46
48
52
56
138
Vigorous & Efficient in Implementation
2
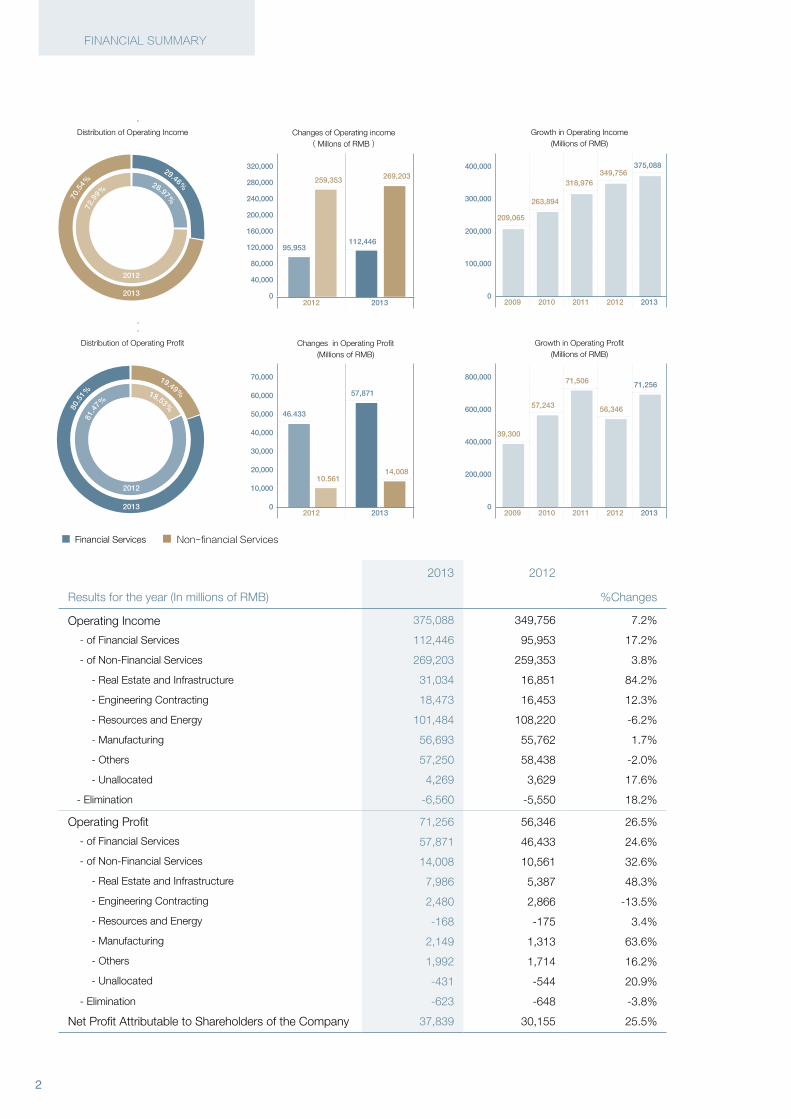
FINANCIAL SUMMARY
Financial Services Non-financial Services
26.97%
72.9
9%
29.46%
70.5
4%
2012
2013
Distribution of Operating Income
18.53%
19.49%
80.5
1%
81.4
7%
2012
2013
Distribution of Operating Profit
2013 2012
Results for the year (In millions of RMB) %Changes
Operating Income
- of Financial Services
- of Non-Financial Services
- Real Estate and Infrastructure
- Engineering Contracting
- Resources and Energy
- Manufacturing
- Others
- Unallocated
- Elimination
375,088
112,446
269,203
31,034
18,473
101,484
56,693
57,250
4,269
-6,560
349,756
95,953
259,353
16,851
16,453
108,220
55,762
58,438
3,629
-5,550
7.2%
17.2%
3.8%
84.2%
12.3%
-6.2%
1.7%
-2.0%
17.6%
18.2%
Operating Profit
- of Financial Services
- of Non-Financial Services
- Real Estate and Infrastructure
- Engineering Contracting
- Resources and Energy
- Manufacturing
- Others
- Unallocated
- Elimination
Net Profit Attributable to Shareholders of the Company
71,256
57,871
14,008
7,986
2,480
-168
2,149
1,992
-431
-623
37,839
56,346
46,433
10,561
5,387
2,866
-175
1,313
1,714
-544
-648
30,155
26.5%
24.6%
32.6%
48.3%
-13.5%
3.4%
63.6%
16.2%
20.9%
-3.8%
25.5%
Growth in Operating Income(Millions of RMB)
100,000
0
200,000
300,000
400,000
209,065
263,894
318,976349,756
375,088
2009 2010 2011 2012 2013
Growth in Operating Profit(Millions of RMB)
200,000
0
400,000
600,000
800,000
39,300
57,243
71,506
56,346
71,256
2009 2010 2011 2012 2013
Changes of Operating income(Millons of RMB)
320,000
280,000
240,000
200,000
160,000
120,000
80,000
40,000
0
95,953
259,353
112,446
269,203
2012 2013
Changes in Operating Profit(Millions of RMB)
70,000
60,000
50,000
40,000
30,000
20,000
10,000
0
46.433
10.561
57,871
14,008
2012 2013

3
2013 2012
At the Balance sheet date (In millions of RMB) %Changes
Total Assets
- of Financial Services
- of Non-Financial Services
- Real Estate and Infrastructure
- Engineering Contracting
- Resources and Energy
- Manufacturing
- Others
- Unallocated
- Elimination
Total Liabilities
Total Equity Attributable to Shareholders of the Company
4,299,678
3,691,575
718,583
211,842
38,214
168,482
85,602
85,839
128,605
-110,480
3,871,701
271,910
3,565,572
2,996,499
667,514
189,537
38,173
161,915
82,908
72,104
122,877
-98,441
3,185,084
235,412
20.6%
23.2%
7.7%
11.8%
0.1%
4.1%
3.2%
19.0%
4.7%
12.2%
21.6%
15.5%
Financial Ratios % % +/(-)%
Net Profit Growth
Return on Total Assets1
Return on Equity2
25.48%
0.96%
14.92%
-17.42%
0.88%
13.69%
42.90%
0.08%
1.23%
Financial Services Non-financial Services
Distribution of Total Assets
1 Calculated by dividing net profit by the average of total assets as at the beginning and the end of the year.2 Calculated by dividing net profit attributable to shareholders of the company by the average of total equity attributable to shareholders of the company as at the beginning and end of the year.
Growth in Total Assets(Millions of RMB)
Growth in Equity Attributable to Shareholders of the Company (Millions of RMB)
Changes in Total Assets(Millions of RMB)
4,000,000
3,600,000
3,200,000
2,800,000
2,400,000
2,000,000
1,600,000
1,200,000
800,000
400,000
0
5,000,000
4,500,000
4,000,000
3,500,000
3,000,000
2,500,000
2,000,000
1,500,000
1,000,000
500,000
0
300,000
250,000
200,000
150,000
100,000
50,000
0
2,996,499
667,514
3,691,575
718,583
2012 2013
137,436
173,556
205,108
235,412
271,910
2009 2010 2011 2012 2013
2,151,7272,538,266
3,277,0533,565,572
4,299,678
2009 2010 2011 2012 2013
81.7
8%83.7
1%18.22%
2012
2013
16.29%
0.1%
4
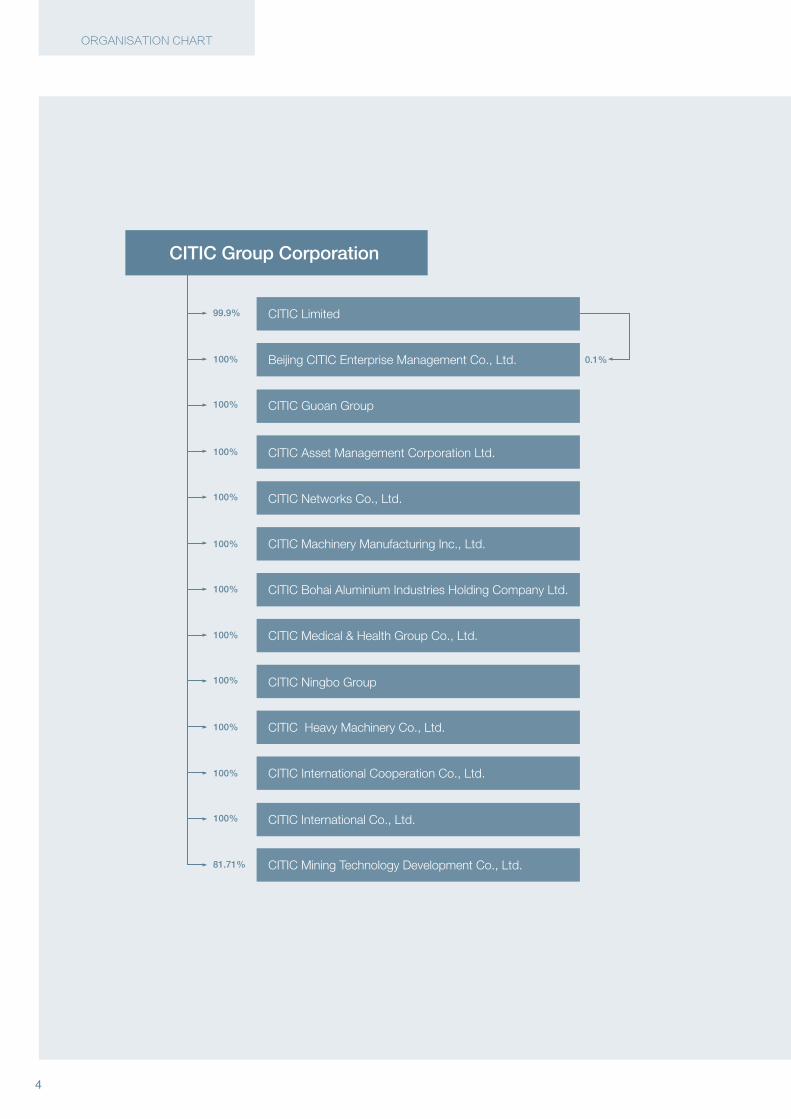
99.9%
100%
100%
100%
100%
100%
100%
100%
100%
100%
100%
100%
81.71%
CITIC Limited
Beijing CITIC Enterprise Management Co., Ltd.
CITIC Guoan Group
CITIC Asset Management Corporation Ltd.
CITIC Networks Co., Ltd.
CITIC Machinery Manufacturing Inc., Ltd.
CITIC Bohai Aluminium Industries Holding Company Ltd.
CITIC Medical & Health Group Co., Ltd.
CITIC Ningbo Group
CITIC Heavy Machinery Co., Ltd.
CITIC International Cooperation Co., Ltd.
CITIC International Co., Ltd.
CITIC Mining Technology Development Co., Ltd.
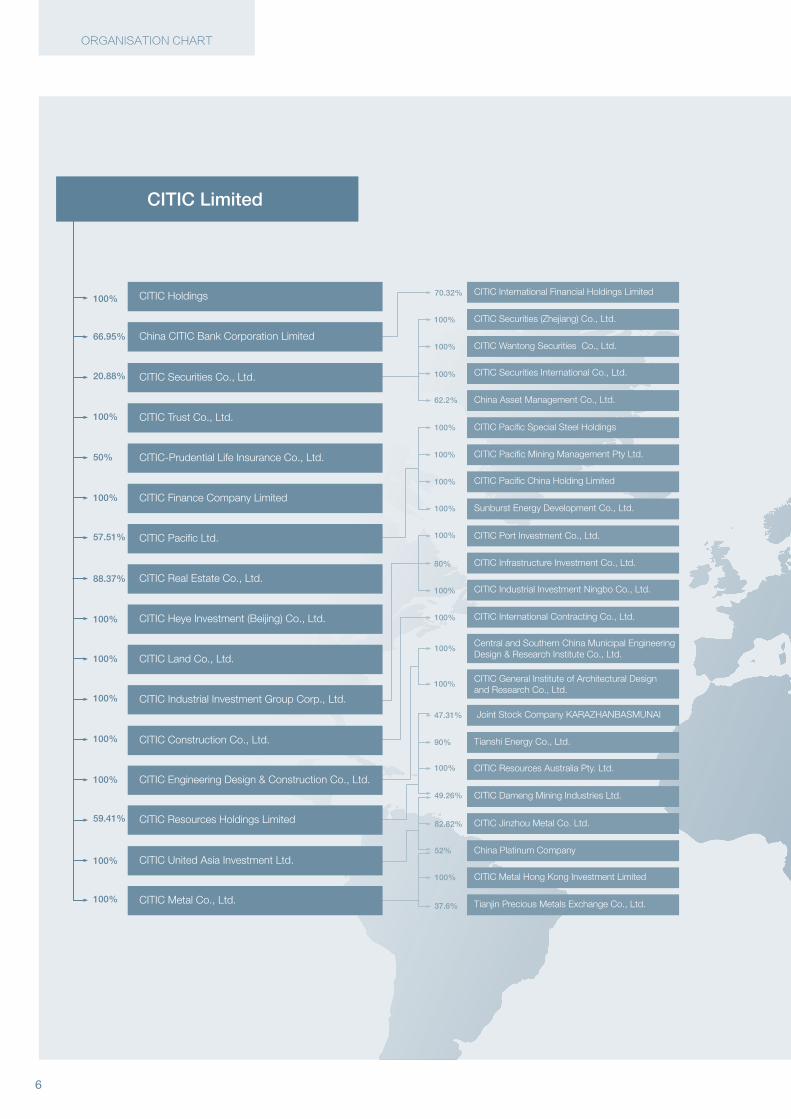
CITIC Group Corporation
ORGANISATION CHART
5
6
66.95%
57.51%
59.41%
88.37%
20.88%
100%
100%
100%
100%
100%
50%
100%
100%
100%
100%
100%
100%
100%
CITIC Holdings 70.32% CITIC International Financial Holdings Limited
China CITIC Bank Corporation Limited
CITIC Securities Co., Ltd.
CITIC Trust Co., Ltd.
CITIC-Prudential Life Insurance Co., Ltd.
CITIC Finance Company Limited
CITIC Pacific Ltd.
CITIC Real Estate Co., Ltd.
CITIC Heye Investment (Beijing) Co., Ltd.
CITIC Land Co., Ltd.
CITIC Industrial Investment Group Corp., Ltd.
CITIC Resources Holdings Limited
CITIC Construction Co., Ltd.
CITIC United Asia Investment Ltd.
CITIC Engineering Design & Construction Co., Ltd.
CITIC Metal Co., Ltd.
100% CITIC Securities (Zhejiang) Co., Ltd.
100% CITIC Pacific Special Steel Holdings
47.31% Joint Stock Company KARAZHANBASMUNAI
82.82% CITIC Jinzhou Metal Co. Ltd.
100% CITIC Port Investment Co., Ltd.
Central and Southern China Municipal Engineering Design & Research Institute Co., Ltd.
100% CITIC Wantong Securities Co., Ltd.
100% CITIC Pacific Mining Management Pty Ltd.
90% Tianshi Energy Co., Ltd.
52% China Platinum Company
80% CITIC Infrastructure Investment Co., Ltd.
CITIC General Institute of Architectural Design and Research Co., Ltd.
100% CITIC International Contracting Co., Ltd.
100% CITIC Securities International Co., Ltd.
100% CITIC Pacific China Holding Limited
100% CITIC Resources Australia Pty. Ltd.
100% CITIC Metal Hong Kong Investment Limited
100% CITIC Industrial Investment Ningbo Co., Ltd.
62.2% China Asset Management Co., Ltd.
100% Sunburst Energy Development Co., Ltd.
49.26% CITIC Dameng Mining Industries Ltd.
37.6% Tianjin Precious Metals Exchange Co., Ltd.
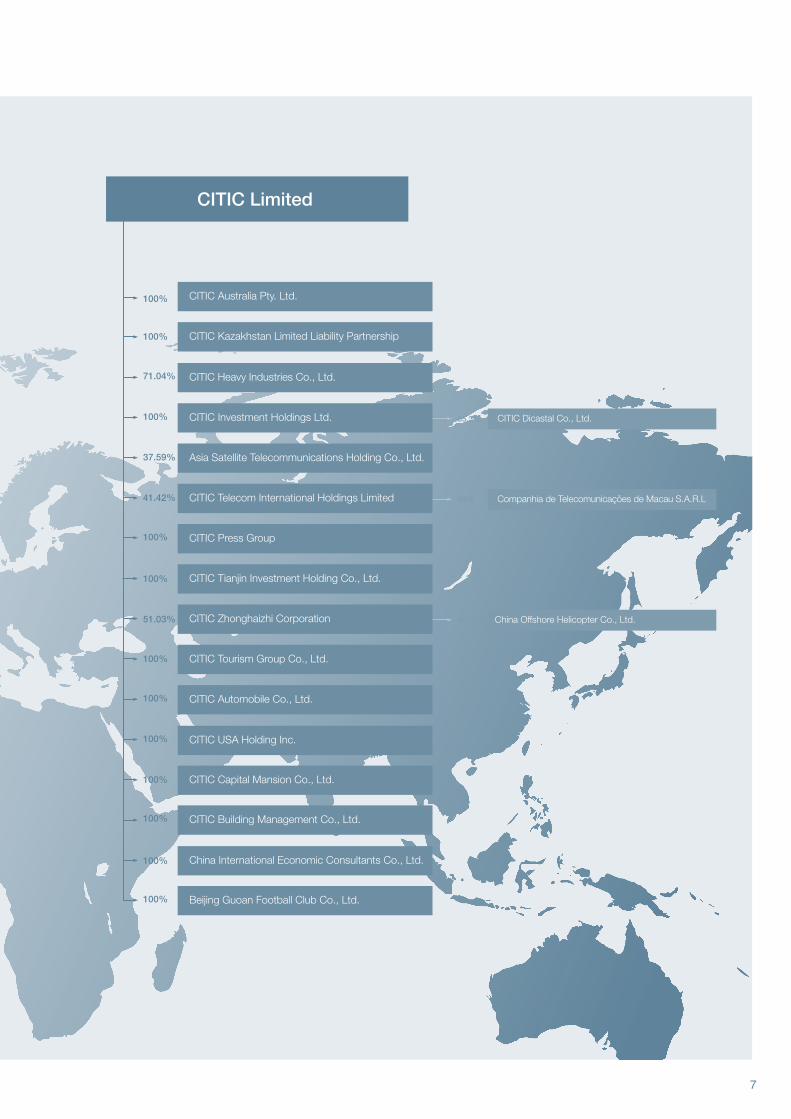
CITIC Limited
ORGANISATION CHART
7
100%
100%
100%
100%
71.04%
65.3%
99%
42.18%
100%
100%
41.42%
37.59%
51.03%
100%
100%
100%
100%
100%
100%
CITIC Australia Pty. Ltd.
CITIC Dicastal Co., Ltd.
Companhia de Telecomunicações de Macau S.A.R.L
China Offshore Helicopter Co., Ltd.
CITIC Kazakhstan Limited Liability Partnership
CITIC Heavy Industries Co., Ltd.
CITIC Investment Holdings Ltd.
Asia Satellite Telecommunications Holding Co., Ltd.
CITIC Telecom International Holdings Limited
CITIC Press Group
CITIC Tianjin Investment Holding Co., Ltd.
CITIC Zhonghaizhi Corporation
CITIC Tourism Group Co., Ltd.
CITIC Automobile Co., Ltd.
CITIC Building Management Co., Ltd.
CITIC USA Holding Inc.
China International Economic Consultants Co., Ltd.
CITIC Capital Mansion Co., Ltd.
Beijing Guoan Football Club Co., Ltd.
CITIC Limited

CHAIRMAN’S LETTER
8
9
To our shareholders, partners and customers:
As the world economy came back softly in 2013, three concurrent processes were taking place in
China: the growth gears were shifting; the economy was adapting to and weathering painful restructur-
ing; the earlier policy stimuli were being assimilated. At CITIC Group, we tapped on our advantage of
being both a financial and industrial player, and stayed committed to prudent operation and innovation.
This has enabled us to achieve stable and quality growth. We also scored record highs in key business
indicators, as operating income increased by 7.2% from prior year to RMB 375.1 billion, and net profit
by 25% to RMB 37.8 billion. On the Fortune Global 500 rankings, we climbed 22 spots from last year’s
to claim the 172nd place.
Reform and innovation continued to be the Group’s drivers for sustainable growth. Many of our busi-
nesses responded to changes in market dynamics and regulatory policies by re-crafting strategies to
transform themselves, and by searching and re-charting new paths into the future. CITIC Bank focused
on developing modern services, consumer finance and internet finance, and has since made good
headway. Early signs of success are already showing. CITIC Securities buffered its lead in the tradition-
al business, at the same time pursued innovative business ideas such as capital intermediary service
to create new profit engines. CITIC Trust continued to surpass its industry peers as it introduced the
country’s first land-transfer trust product and explored the potential of high-end wealth management
services, including family trust.
For our non-financial businesses, CITIC Heavy Machinery leveraged its strengths in technological inno-
vation to transform itself, switching from mere equipment manufacturing to providing high-end, green
and integrated industrial solutions. CITIC Construction repackaged its services to provide a broader
offering that ranged from financing, engineering, and resources to manufacturing, thereby linking the
upstream and downstream supply segments. In doing so, it succeeded in reinventing itself, and has
shifted from being a project contractor to an integrated-service provider. CITIC real estate reconstituted
its business makeup and product mix, and made new inroads into markets such as integrated urban
operations and real estate finance.
As a conglomerate, CITIC Group espouses the customer-first approach and works hard to build
broader and deeper synergies. Through closer strategic cooperation with more Fortune Global 500
companies, central state-owned enterprises and industry leaders, we managed to win major projects
and acquired important business opportunities. Much of our work was targeted at the subsidiary level.
Among our financial subsidiaries, we continued to promote cross-selling and joint product-innovation.
These initiatives have paid off in terms of stable growth in comprehensive financial services, and culmi-
CHAIRMAN’S LETTER
10
CHAIRMAN’S LETTER
nated in 281 products jointly developed by our financial subsidiaries and RMB 140.7 billion in revenue.
Non-financial subsidiaries were given guidance to align with the appropriate industrial chains, upgrade
their technology capabilities, and transform their businesses. We also helped our subsidiaries team up
to expand into overseas markets in a unified effort to develop new areas of growth. As the Group an-
chored its business on innovative models and unleashed the potential of synergised operations, it suc-
ceeded in achieving increased overall competitiveness and profitability.
We also drew on our resources in both the domestic and overseas markets to optimise the Group’s
global resource allocation. The results were manifold: CITIC Securities acquired CLSA to become
the first local securities enterprise with an extensive global network; CITIC Construction broadened
its global presence by providing investment-cum-financing services to gain market advantage; CITIC
Heavy Machinery expanded its global footprint by establishing in overseas markets relatively compre-
hensive research & development, sales and after-sales service operations; CITIC Telecom International
completed its acquisition of CTM, hence successfully establishing itself in basic telecommunications
services; CITIC Pacific’s iron ore project in Australia made substantial progress, as it commenced trial
production on its first production line and began exporting iron ore concentrate.
Internally, the Group has also achieved notable progress in optimising its investment decision mecha-
nism and in raising capital efficiency. Good headway is also made in terms of improving our internal
control and risk management, in talent management and in fulfilling our corporate social responsibili-
ties. None of this would have been possible without the diligence and dedication of our management
and staff, to whom I owe a big “Thank You!”
2014 promises another mixed year of difficulties and opportunities, as the world economy continues
to crawl its way to recovery. The 3rd Plenum of the 18th CPC Central Committee has set the tone for
China to embark on an extensive reform agenda focusing on economic reform. The market will now
play a decisive role in the economy; there will be greater efforts to develop a hybrid economy. We all
know the principle—that we have to seed to germinate and prune to grow. The reformation that China
has undertaken will shape the course of China’s socio-economic development in more ways than we
know and for a long time to come.
Over the past three decades, CITIC Group has been a forerunner in China’s economic reform. Our
courage to innovate makes us the spearhead in many uncharted territories; hence we are at where
we are now—an international conglomerate big in both financial and non-financial sectors. As the new
round of reform unfolds, CITIC Group will consolidate its vast resources, including its brand, custom-
ers, channels and businesses, with a view to forging a sustainable growth model.

11
As always, the Group has an abiding interest to do well and do better. In the financial sector, we will
continue to strengthen our financial businesses, expedite overseas ventures, improve our profitability
and risk resilience, and sharpen our edge in comprehensive financial services. In the industrial sector,
we will support and expedite key investments, and improve our competitiveness through technological
innovation. We will also branch into other growth areas, such as energy conservation, environmental
protection, consumer products, health- and elder-care and other emerging industries to develop new
strategic growth drivers.
In terms of management and control, we will upgrade our management control methods, and direct
resources toward areas that promise the biggest potential for value creation and that best fit with the
Group’s strategic direction. For our key subsidiaries, companies in priority industries, and financial in-
vestments, we will introduce a differentiated management control regime.
We are also working toward an earlier listing of the Group. To do that, we will capitalise on Hong
Kong’s strengths as sound governance, robust legal infrastructure and extensive talent pool to improve
our management and operations, and to boost endogenous and sustainable growth.
Indeed, a roc soars not with a lone scanty plume, and a steed bolts not with one sole mighty hoof.
We have always behind us the unflagging support of our shareholders, customers, partners, staff and
other stakeholders. With this bastion of strength, we at the CITIC Group will stay on top of the evolving
market and persist in reform and innovation. As surely as we embark on our new journey, we will carve
new frontiers and scale new heights.
Chang Zhenming
Chairman
CITIC Group Corporation
1212
CITIC Limited and CITIC Resources co-invested
AUD 470 million to acquire a 13.6% interest in
Australian company Alumina Limited, with CITIC
Limited holding 5.22% interest and CITIC Resources
8.4%.
CITIC Pacific issued USD 500 million of medium-
term notes and in May 2013, USD 1 billion of per-
petual subordinated capital securities.
CITIC Group and CITIC Pacific completed the share
reorganisation of CITIC Telecom International, which
acquired a 99% interest in Companhia de Teleco-
municaes de Macau S.A.R.L (CTM).
CITIC Securities completed acquisition of the
remaining 80.1% stake in CLSA Asia-Pacific Mar-
kets, making CLSA its wholly owned subsidiary.
CITIC Group was ranked No. 172 on the 2013 For-
tune Global 500 List and No. 16 in terms of profit-
ability among Chinese companies.
CITIC Pacific Sino Iron Project in Australia saw the
commissioning of its Production Line No.1. The aver-
age magnetite concentrate grade was 66% of iron by
weight. In December 2013, the first shipment of con-
centrate was shipped back to China.
February July
April & May July
June July
12
BUSINESS HIGHLIGHTS
13
The “China Zun” project started construction on
land parcel Z15, known as the centre of Beijing’s
CBD. When completed, China Zun will be the tallest
building in Beijing.
CITIC Group acquired from Banco Bilbao Vizcaya
Argentaria (BBVA), its stake of 5.1% CITIC Bank H-
shares to increase the Group’s holdings of CITIC
Bank to 66.95%.
CITIC Trust launched China’s first trust product
backed by collective rural land rights.
The Chongqing Riverside Motorway project, in
which CITIC Industrial Investment Group and CITIC
Construction jointly invested RMB 8.6 billion, was
completed on schedule and open to traffic.
CITIC Limited concluded a 5-year offshore syndicat-
ed loan for USD 1 billion. The syndicated loan was
oversubscribed by 60%.
2012
2013
2014
August December
October December
October
13
Management Report
P15 P20Financial Businesses
Non-financial Businesses
Real Estate and Infrastructure
Businesses [Page 20]
Engineering Contracting Business
[Page 22]
Energy and Resources [Page 23]
Manufacturing [Page 25]
Other businesses [Page 26]
14
Banking Business [Page 15]
Securities Business [Page 17]
Trust Business [Page 18]
Insurance Business [Page 18]
Other Financial Businesses
[Page 19]
15
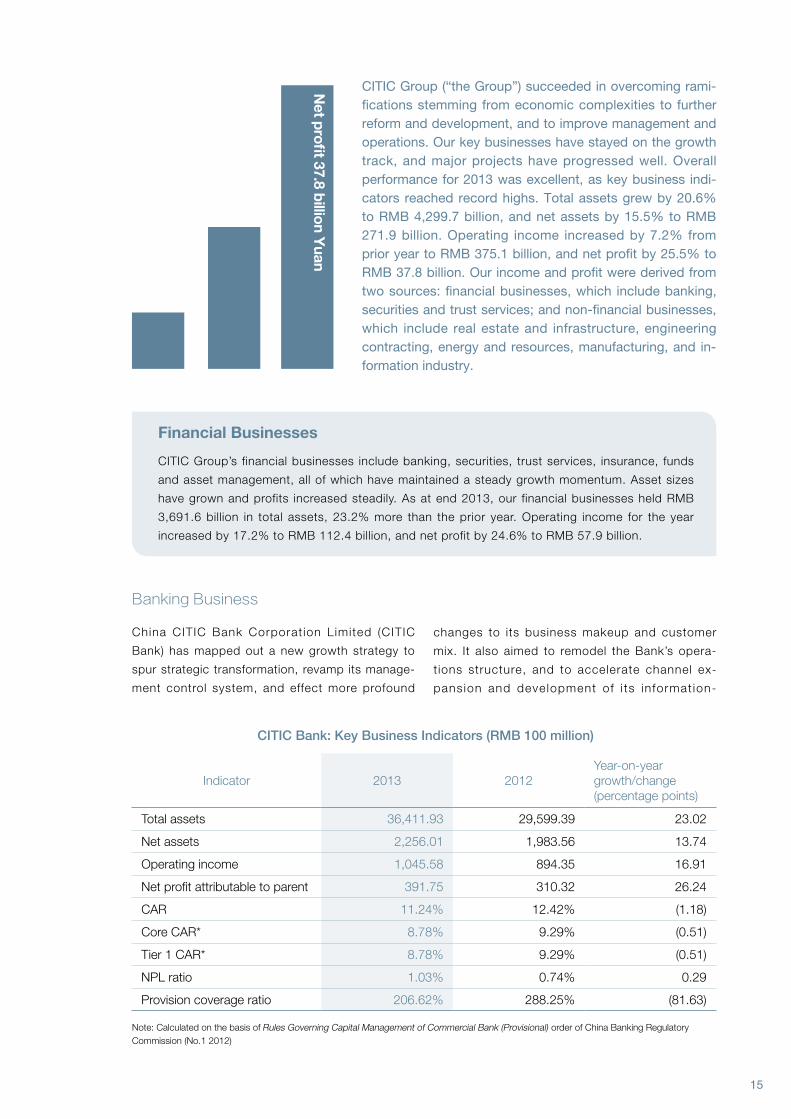
CITIC Group (“the Group”) succeeded in overcoming rami-fications stemming from economic complexities to further reform and development, and to improve management and operations. Our key businesses have stayed on the growth track, and major projects have progressed well. Overall performance for 2013 was excellent, as key business indi-cators reached record highs. Total assets grew by 20.6% to RMB 4,299.7 billion, and net assets by 15.5% to RMB 271.9 billion. Operating income increased by 7.2% from prior year to RMB 375.1 billion, and net profit by 25.5% to RMB 37.8 billion. Our income and profit were derived from two sources: financial businesses, which include banking, securities and trust services; and non-financial businesses, which include real estate and infrastructure, engineering contracting, energy and resources, manufacturing, and in-formation industry.
Financial Businesses
CITIC Group’s financial businesses include banking, securities, trust services, insurance, funds
and asset management, all of which have maintained a steady growth momentum. Asset sizes
have grown and profits increased steadily. As at end 2013, our financial businesses held RMB
3,691.6 billion in total assets, 23.2% more than the prior year. Operating income for the year
increased by 17.2% to RMB 112.4 billion, and net profit by 24.6% to RMB 57.9 billion.
Banking Business
China CITIC Bank Corporat ion Limited (CITIC
Bank) has mapped out a new growth strategy to
spur strategic transformation, revamp its manage-
ment control system, and effect more profound
Net profit 37.8 billion Y
uan
changes to its business makeup and customer
mix. It also aimed to remodel the Bank’s opera-
tions structure, and to accelerate channel ex-
pansion and development of i ts in format ion-
Indicator 2013 2012Year-on-year growth/change (percentage points)
Total assets 36,411.93 29,599.39 23.02
Net assets 2,256.01 1,983.56 13.74
Operating income 1,045.58 894.35 16.91
Net profit attributable to parent 391.75 310.32 26.24
CAR 11.24% 12.42% (1.18)
Core CAR* 8.78% 9.29% (0.51)
Tier 1 CAR* 8.78% 9.29% (0.51)
NPL ratio 1.03% 0.74% 0.29
Provision coverage ratio 206.62% 288.25% (81.63)
CITIC Bank: Key Business Indicators (RMB 100 million)
Note: Calculated on the basis of Rules Governing Capital Management of Commercial Bank (Provisional) order of China Banking Regulatory Commission (No.1 2012)
16
MANAGEMENT REPORT
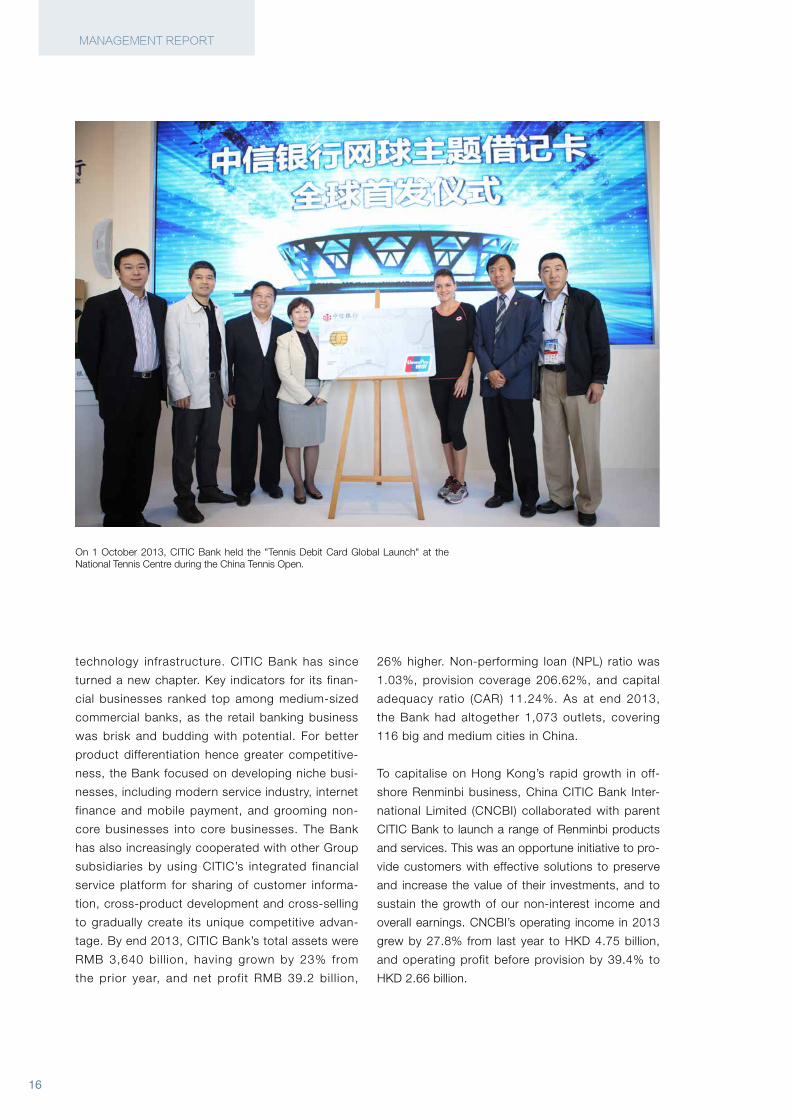
On 1 October 2013, CITIC Bank held the "Tennis Debit Card Global Launch" at the National Tennis Centre during the China Tennis Open.
26% higher. Non-performing loan (NPL) ratio was
1.03%, provision coverage 206.62%, and capital
adequacy ratio (CAR) 11.24%. As at end 2013,
the Bank had altogether 1,073 outlets, covering
116 big and medium cities in China.
To capitalise on Hong Kong’s rapid growth in off-
shore Renminbi business, China CITIC Bank Inter-
national Limited (CNCBI) collaborated with parent
CITIC Bank to launch a range of Renminbi products
and services. This was an opportune initiative to pro-
vide customers with effective solutions to preserve
and increase the value of their investments, and to
sustain the growth of our non-interest income and
overall earnings. CNCBI’s operating income in 2013
grew by 27.8% from last year to HKD 4.75 billion,
and operating profit before provision by 39.4% to
HKD 2.66 billion.
technology infrastructure. CITIC Bank has since
turned a new chapter. Key indicators for its finan-
cial businesses ranked top among medium-sized
commercial banks, as the retail banking business
was brisk and budding with potential. For better
product differentiation hence greater competitive-
ness, the Bank focused on developing niche busi-
nesses, including modern service industry, internet
finance and mobile payment, and grooming non-
core businesses into core businesses. The Bank
has also increasingly cooperated with other Group
subsidiaries by using CITIC’s integrated financial
service platform for sharing of customer informa-
tion, cross-product development and cross-selling
to gradually create its unique competitive advan-
tage. By end 2013, CITIC Bank’s total assets were
RMB 3,640 bil l ion, having grown by 23% from
the prior year, and net profit RMB 39.2 bil l ion,
17
Securities Business
CITIC Securities Co., Ltd. (CITICS) acquired 100%
stake in CITIC Wantong Securities and regained a
controlling stake in China Asset Management Co.,
Ltd. It also completed acquisition of the full stake
in CLSA to become the first Chinese securities
firm with extensive networks in major markets in
the world. CITICS capitalises on its combination of
strengths to buffer its lead in China’s securities in-
dustry, and was ranked top, either based on market
indicators or within the industry, in the following as-
pects: market share in brokerage business, amount
underwritten as lead underwriter, value of assets un-
der management, volume of inter-bank bond trans-
action, QFII transaction volume and domestic mar-
ket share in margin trading and securities lending.
CITICS actively sought to transform its business and
increase its financial leverage, and has maintained
its lead in the industry in terms of operating income
and net profit. Its operating income for the period
increased by 37.8% to RMB 16.12 billion, and net
profit by 23.8% to RMB 5.24 billion.
The major subsidiaries of CITICS also came away with
a sterling year. CITIC Securities (Zhejiang) Co., Ltd. re-
ported RMB 1.77 billion in operating income and RMB
620 million in net profit; CITIC Wantong Securities Co.,
Ltd., RMB 950 million in operating income and RMB
310 million in net profit; CITIC Securities International
Co., Ltd., RMB 2.52 billion in operating income and
RMB 350 million in net profit; China Asset Manage-
ment Co., Ltd., RMB 3.05 billion in operating income
and RMB 970 million in net profit; and CITIC Futures
Co., Ltd., RMB 650 million in operating income and
RMB 230 million in net profit.
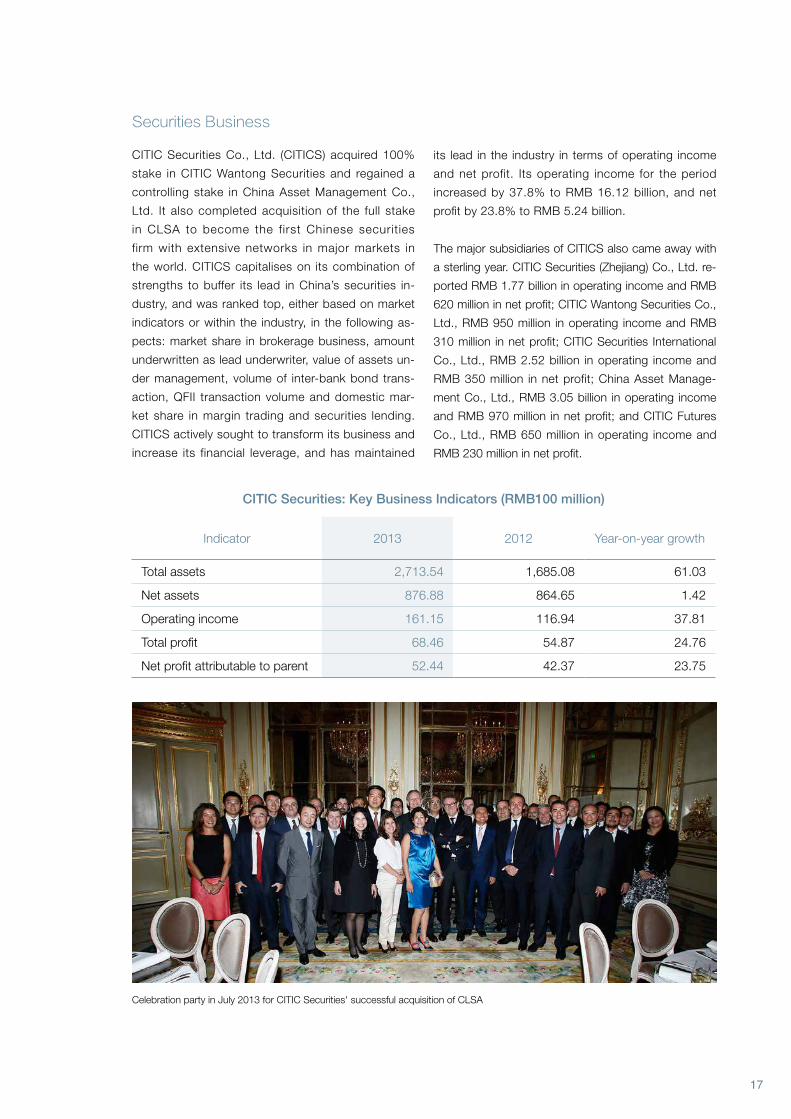
Celebration party in July 2013 for CITIC Securities' successful acquisition of CLSA
Indicator 2013 2012 Year-on-year growth
Total assets 2,713.54 1,685.08 61.03
Net assets 876.88 864.65 1.42
Operating income 161.15 116.94 37.81
Total profit 68.46 54.87 24.76
Net profit attributable to parent 52.44 42.37 23.75
CITIC Securities: Key Business Indicators (RMB100 million)

18
MANAGEMENT REPORT
CITIC Trust: Key Business Indicators (RMB 100 million)
Indicator 2013 2012 Year-on-year growth
Total assets 148.87 118.23 26%
Net assets 130.29 99.38 31%
Operating income 54.87 44.76 23%
Total profit 41.94 36.08 16%
Net profit attributable to parent 31.44 27.17 16%
Trust assets 7297 5913 23%
Insurance Business
CITIC-Prudential Life Insurance Co., Ltd. shifted its
business strategy and increased the number of service
outlets. By end 2013, the company’s business activities
covered 55 cities. To expand sales, a multiple-channel
strategy was employed, which included internet-sales
and more aggressive telemarketing. Compared to last
year, the company’s new annual premium equivalent
(APE) increased by 41.2%, profit from new policies by
21.6%, and embedded value increased to RMB 5.67
billion. Its solvency margin ratio reached 181%.
Trust Business
As CITIC Trust Co., Ltd. continued to consolidate
its traditional businesses, it persisted in innovation-
led growth and launched the first trust product in the
country backed by collective rural land rights. It ex-
panded its business in credit asset securitisation, cash
management trust and in small and medium enterpris-
es trust. It has also obtained interests in precious metal
CITIC Trust and Beijing High-end Manufacture Industrial Base signing Strategic Cooperation Agreement
exchanges. As at end 2013, CITIC Trust had RMB
729.7 billion in trust assets, the largest in the industry
for 7 consecutive years. Its operating income increased
by 23% from prior year to RMB 5.49 billion, and net
profit by 16% to RMB 3.14 billion. The company con-
tinued to lead the industry based on performance indi-
cators and in terms of overall organisational strength.
19
Other Financial Businesses
CITIC Holdings Co., Ltd. continued to develop and
improve the structure and the applications of its
unified platform for financial information system,
and went on to launch CITIC Group’s e-commerce
platform “ecitic”. By end 2013, ecitic’s average
daily page views had reached 1.19 million, and on-
line transaction volume was RMB 28,280 billion for
banking matters, and RMB 4,370 billion for securi-
ties trading.
CITIC Asset Management Co., Ltd. saw robust and
rapid growth in its micro-pawn, finance lease and fac-
toring businesses, and worked on optimising its branch
network. The company’s operating income increased
by 44.7% to RMB 1.11 billion, and net profit by 34.3%
to RMB 180 million.
CITIC Finance Company Limited has built a unified
capital pool and settlement platform as part of the
company’s efforts to establish a centralised capital
management and control system for greater efficiency
in the Group’s internal capital operations.
CITIC-Prudential Fund Management Co., Ltd. launched
9 new funds in 2013, and had, by end 2013, a total of
28 funds under management with a total size of RMB
18.45 billion. Operating income for the year was RMB
298 million and net profit was RMB 59.55 million.
CITIC Kingview Capital Management Co., Ltd. had
RMB 26.65 billion in assets under management (AUM),
including 2 equity trust funds, 24 onshore limited
partnership private equity funds and 2 offshore funds.
For 2013, the company reported RMB 140 million in
operating income and RMB 70 million in net profit, and
paid out to investors RMB 820 million in dividends and
investment returns.
CITIC Capital Holdings Limited and the funds it man-
aged completed investment in several new projects,
including S.F. Express, Focus Media and Asiainfo-
Linkage. The company had USD 4.4 billion in AUM as
at end 2013.
CITIC International Assets Management Limited ad-
opted a green investment strategy, and concluded ma-
jor transactions in new energy applications and energy
management to improve its investment portfolio.
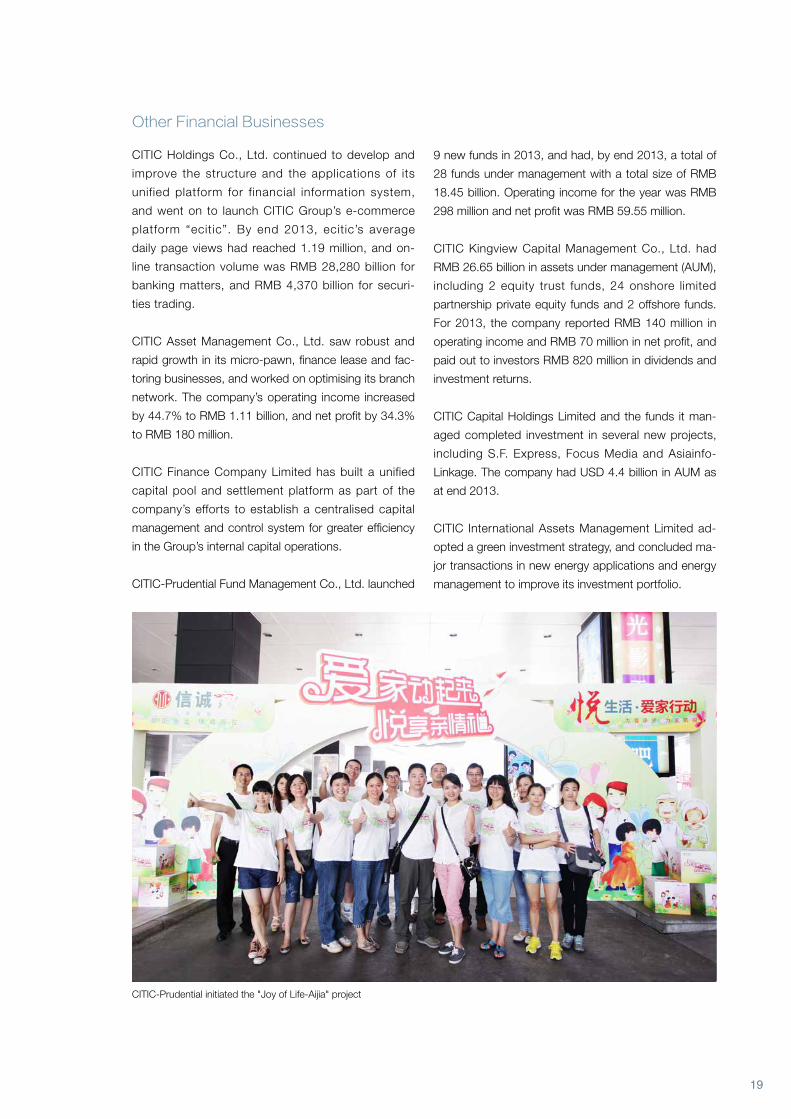
CITIC-Prudential initiated the "Joy of Life-Aijia" project
20
MANAGEMENT REPORT
Beijing
Tianjin
Changchun
Qingdao
Dalian
YantaiBohai Rim
City Cluster
Yangtze River DeltaCity Cluster
Pan-Pearl River DeltaCity Cluster
Hainan InternationalTourism Island
Western ChinaCity Cluster
Shanghai
HuizhouShantouShenzhen
Haikou
Boao
LingshuiSanya
Hangzhou
Suzhou
HuangshanJiujiang
NanchangChangsha
Chongqing
Chengdu
Dujiangyan
ZhuhaiZhongshan
Foshan
Guangzhou
Dongguan
Xining
South China Sea Islands
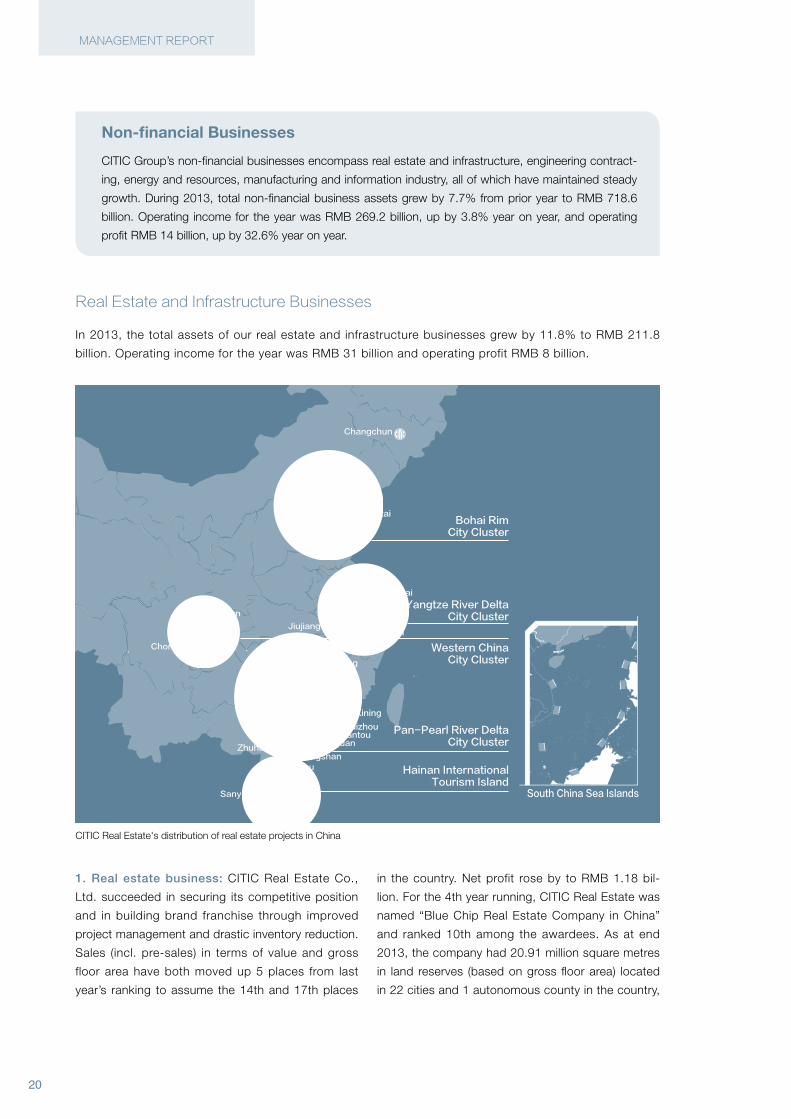
CITIC Real Estate's distribution of real estate projects in China
Non-financial Businesses
CITIC Group’s non-financial businesses encompass real estate and infrastructure, engineering contract-
ing, energy and resources, manufacturing and information industry, all of which have maintained steady
growth. During 2013, total non-financial business assets grew by 7.7% from prior year to RMB 718.6
billion. Operating income for the year was RMB 269.2 billion, up by 3.8% year on year, and operating
profit RMB 14 billion, up by 32.6% year on year.
Real Estate and Infrastructure Businesses
In 2013, the total assets of our real estate and infrastructure businesses grew by 11.8% to RMB 211.8
billion. Operating income for the year was RMB 31 billion and operating profit RMB 8 billion.
in the country. Net profit rose by to RMB 1.18 bil-
lion. For the 4th year running, CITIC Real Estate was
named “Blue Chip Real Estate Company in China”
and ranked 10th among the awardees. As at end
2013, the company had 20.91 million square metres
in land reserves (based on gross floor area) located
in 22 cities and 1 autonomous county in the country,
1. Real estate business: CITIC Real Estate Co.,
Ltd. succeeded in securing its competitive position
and in building brand franchise through improved
project management and drastic inventory reduction.
Sales (incl. pre-sales) in terms of value and gross
floor area have both moved up 5 places from last
year’s ranking to assume the 14th and 17th places
21
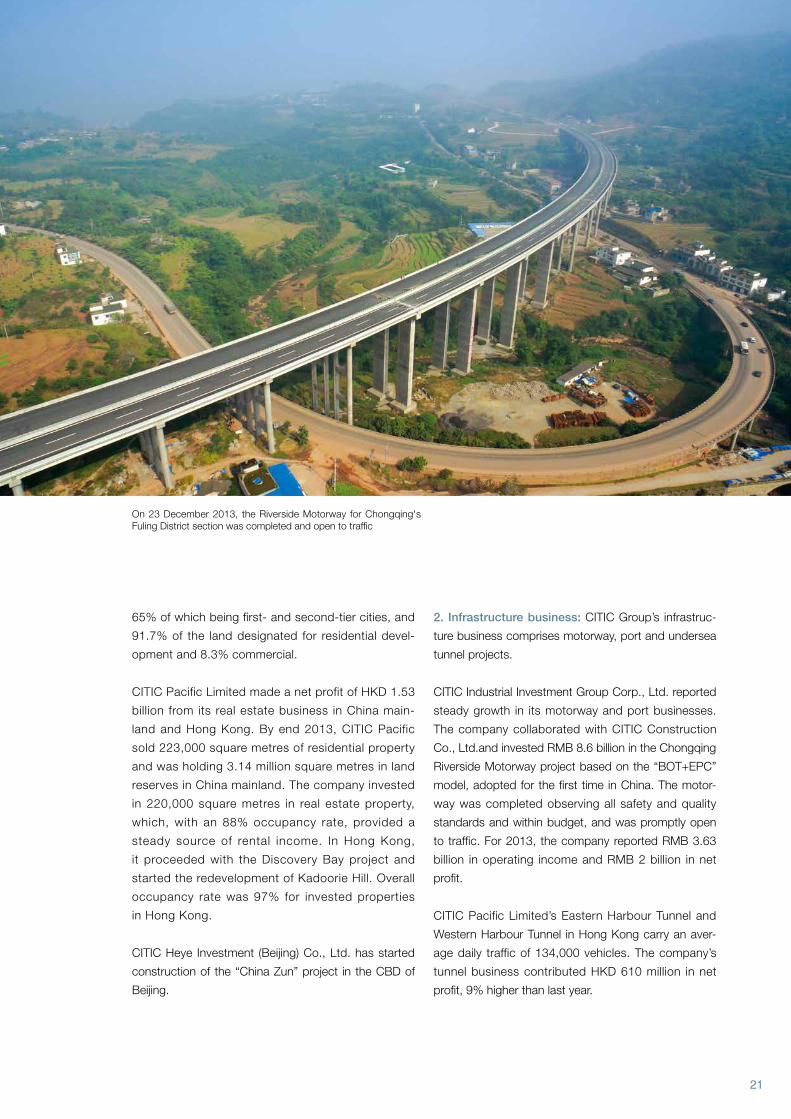
On 23 December 2013, the Riverside Motorway for Chongqing's Fuling District section was completed and open to traffic
65% of which being first- and second-tier cities, and
91.7% of the land designated for residential devel-
opment and 8.3% commercial.
CITIC Pacific Limited made a net profit of HKD 1.53
billion from its real estate business in China main-
land and Hong Kong. By end 2013, CITIC Pacific
sold 223,000 square metres of residential property
and was holding 3.14 million square metres in land
reserves in China mainland. The company invested
in 220,000 square metres in real estate property,
which, with an 88% occupancy rate, provided a
steady source of rental income. In Hong Kong,
it proceeded with the Discovery Bay project and
started the redevelopment of Kadoorie Hill. Overall
occupancy rate was 97% for invested properties
in Hong Kong.
CITIC Heye Investment (Beijing) Co., Ltd. has started
construction of the “China Zun” project in the CBD of
Beijing.
2. Infrastructure business: CITIC Group’s infrastruc-
ture business comprises motorway, port and undersea
tunnel projects.
CITIC Industrial Investment Group Corp., Ltd. reported
steady growth in its motorway and port businesses.
The company collaborated with CITIC Construction
Co., Ltd.and invested RMB 8.6 billion in the Chongqing
Riverside Motorway project based on the “BOT+EPC”
model, adopted for the first time in China. The motor-
way was completed observing all safety and quality
standards and within budget, and was promptly open
to traffic. For 2013, the company reported RMB 3.63
billion in operating income and RMB 2 billion in net
profit.
CITIC Pacific Limited’s Eastern Harbour Tunnel and
Western Harbour Tunnel in Hong Kong carry an aver-
age daily traffic of 134,000 vehicles. The company’s
tunnel business contributed HKD 610 million in net
profit, 9% higher than last year.

22
MANAGEMENT REPORT
Venezuela
Angola
Indonesia
South Africa
Brazil
Belarus
Turkey
Uzbekistan KazakhstanTurkmenistan
China
Burma
Australia
Algeria
Argentina
CITIC Construction's worldwide business distribution
Cement production line project in Belarus
Engineering Contracting Business
As at end 2013, the engineering contracting business
owned total assets of RMB 38.2 billion, 0.1% more
than the year’s opening balance. Operating income for
the year was RMB 18.47 billion and operating profit
RMB 2.48 billion.
CITIC Construction Co., Ltd. has ensured vigorous
project management and steady advancement of in-
progress projects. The Kilamba Kiaxi Satellite City
project in Angola was completed and delivered, and
has commenced use; 3 EPC/turnkey cement plants
of 4.5 million tons in annual production in Belarus
were completed and production has begun. CITIC
Construction has anchored its business key markets
as Angola and Venezuela, and from which devel-
oped its regional business by exploring opportunities
in other countries, such as Uganda, Columbia and
Ukraine. The total value of new contracts for 2013
was USD 2.77 billion. CITIC Construction ranked
43rd among the “ENR World Top 225 International
Engineering Contractors” in 2013, with an operating
income of RMB 16.5 billion and net profit of RMB
1.59 billion.
CITIC General Institute of Architectural Design and Re-
search Co., Ltd. and the Central and Southern China
Municipal Engineering Design & Research Institute Co.,
Ltd. have completed their strategic restructuring and
registered a new company called CITIC Engineering
Design and Construction Co., Ltd. (“CITIC Engineer-
ing”). CITIC Engineering will harness the key strengths
of the two institutes to establish itself in urban con-
struction, water and environmental protection and
new energy, and develop its business in the total value
chain, with a focus on general contracting. The total
value of new contracts for the year was RMB 2.27 bil-
lion, operating income RMB 1.5 billion and net profit
RMB 280 million.
23
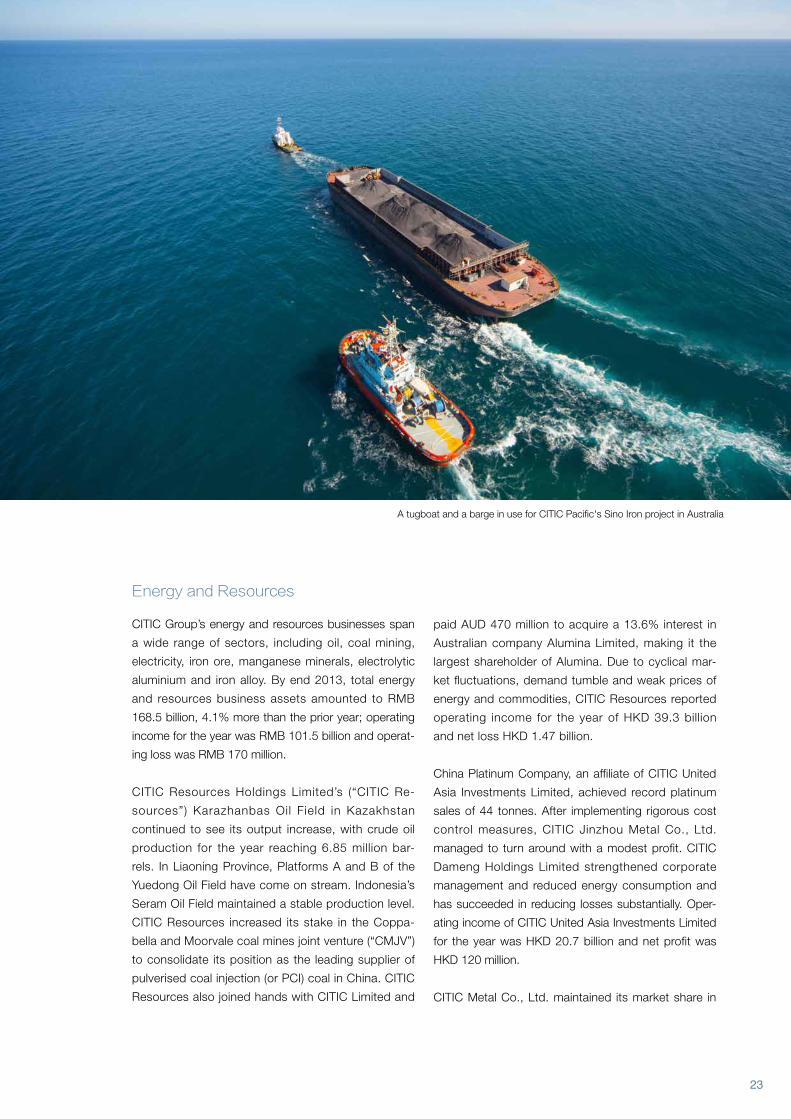
Energy and Resources
CITIC Group’s energy and resources businesses span
a wide range of sectors, including oil, coal mining,
electricity, iron ore, manganese minerals, electrolytic
aluminium and iron alloy. By end 2013, total energy
and resources business assets amounted to RMB
168.5 billion, 4.1% more than the prior year; operating
income for the year was RMB 101.5 billion and operat-
ing loss was RMB 170 million.
CITIC Resources Holdings Limited’s (“CITIC Re-
sources”) Karazhanbas Oil Field in Kazakhstan
continued to see its output increase, with crude oil
production for the year reaching 6.85 million bar-
rels. In Liaoning Province, Platforms A and B of the
Yuedong Oil Field have come on stream. Indonesia’s
Seram Oil Field maintained a stable production level.
CITIC Resources increased its stake in the Coppa-
bella and Moorvale coal mines joint venture (“CMJV”)
to consolidate its position as the leading supplier of
pulverised coal injection (or PCI) coal in China. CITIC
Resources also joined hands with CITIC Limited and
paid AUD 470 million to acquire a 13.6% interest in
Australian company Alumina Limited, making it the
largest shareholder of Alumina. Due to cyclical mar-
ket fluctuations, demand tumble and weak prices of
energy and commodities, CITIC Resources reported
operating income for the year of HKD 39.3 billion
and net loss HKD 1.47 billion.
China Platinum Company, an affiliate of CITIC United
Asia Investments Limited, achieved record platinum
sales of 44 tonnes. After implementing rigorous cost
control measures, CITIC Jinzhou Metal Co., Ltd.
managed to turn around with a modest profit. CITIC
Dameng Holdings Limited strengthened corporate
management and reduced energy consumption and
has succeeded in reducing losses substantially. Oper-
ating income of CITIC United Asia Investments Limited
for the year was HKD 20.7 billion and net profit was
HKD 120 million.
CITIC Metal Co., Ltd. maintained its market share in
A tugboat and a barge in use for CITIC Pacific's Sino Iron project in Australia
24
MANAGEMENT REPORT
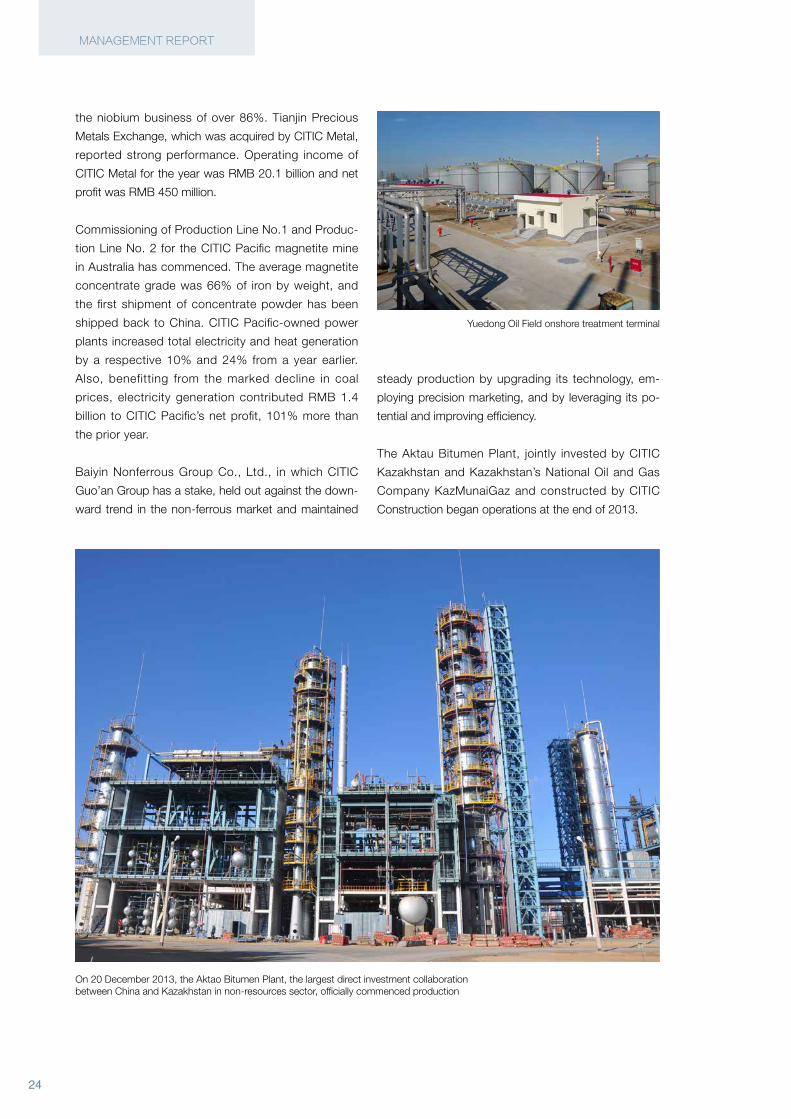
Yuedong Oil Field onshore treatment terminal
On 20 December 2013, the Aktao Bitumen Plant, the largest direct investment collaboration between China and Kazakhstan in non-resources sector, officially commenced production
the niobium business of over 86%. Tianjin Precious
Metals Exchange, which was acquired by CITIC Metal,
reported strong performance. Operating income of
CITIC Metal for the year was RMB 20.1 billion and net
profit was RMB 450 million.
Commissioning of Production Line No.1 and Produc-
tion Line No. 2 for the CITIC Pacific magnetite mine
in Australia has commenced. The average magnetite
concentrate grade was 66% of iron by weight, and
the first shipment of concentrate powder has been
shipped back to China. CITIC Pacific-owned power
plants increased total electricity and heat generation
by a respective 10% and 24% from a year earlier.
Also, benefitting from the marked decline in coal
prices, electricity generation contributed RMB 1.4
billion to CITIC Pacific’s net profit, 101% more than
the prior year.
Baiyin Nonferrous Group Co., Ltd., in which CITIC
Guo’an Group has a stake, held out against the down-
ward trend in the non-ferrous market and maintained
steady production by upgrading its technology, em-
ploying precision marketing, and by leveraging its po-
tential and improving efficiency.
The Aktau Bitumen Plant, jointly invested by CITIC
Kazakhstan and Kazakhstan’s National Oil and Gas
Company KazMunaiGaz and constructed by CITIC
Construction began operations at the end of 2013.
25
Manufacturing
CITIC Group’s manufacturing business includes
heavy equipment, special steel and auto parts. By
end 2013, total assets of the manufacturing busi-
ness had increased by 3.2% to RMB 85.6 billion. Its
operating income for the year was RMB 56.7 billion
and operating profit was RMB 2.15 billion.
Despite shrinking market demand and a difficult
operating environment, CITIC Heavy Industries
Co., Ltd. developed a creative business model
and strived to develop the market for equipment
systems. Order va lue for equipment systems
was RMB 6.59 b i l l ion, account ing for 59.8%
of the company’s total order value. The com-
pany expedited incubation and development of
strategic emerging industr ies, and orders for
energy-saving and green products and circu-
lar economy re lated products valued at RMB
2.18 bi l l ion. The company has also developed
high-end equipment for high-voltage frequency
inverter, and has successful ly crossed over to
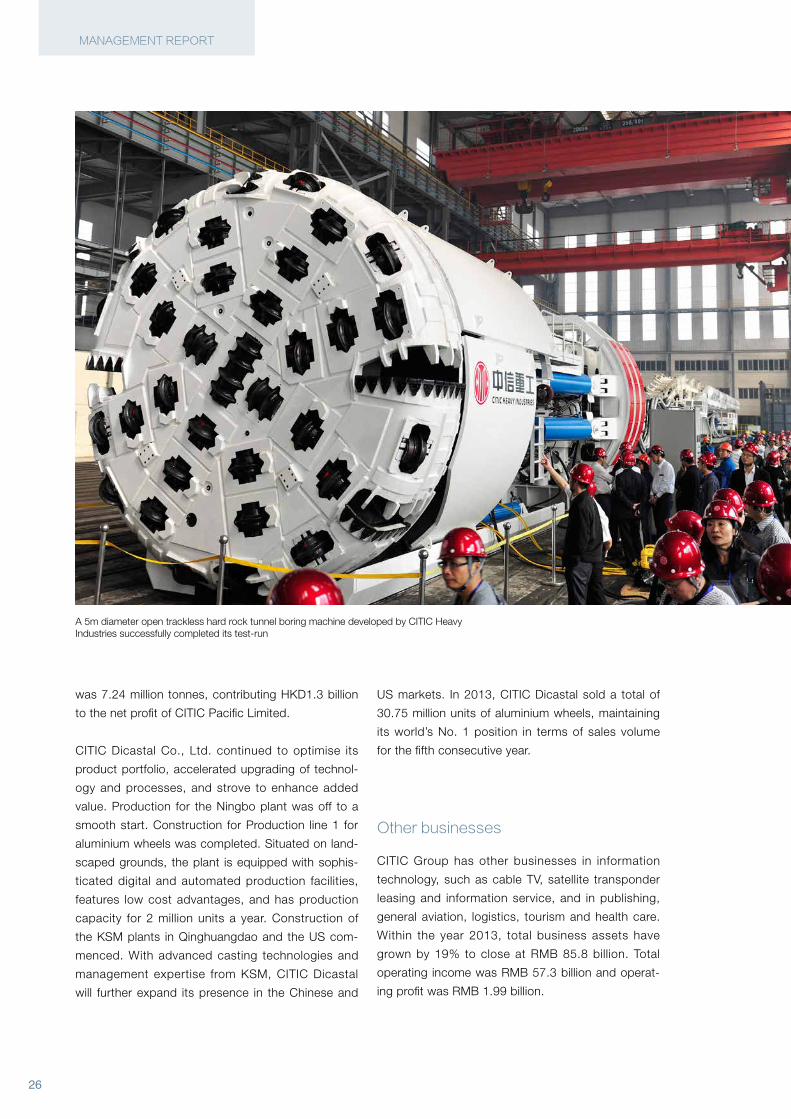
the power and electronics industry. By pressing
ahead with technological innovation, the com-
pany has successfully developed a 5m-diameter
open trackless hard rock tunnel boring machine.
Geographically, it has also further expanded its
overseas presence to compete in the high-end
global market. The company has basical ly put
in place its overseas sales and marketing, R&D
and service teams. CITIC Censa in Spain contin-
ued to perform well. Operating income of CITIC
Heavy Industries Co., Ltd. for the year was RMB
5.1 billion; net profit was RMB500 million.
CITIC Pacific Special Steel Holdings improved pro-
duction efficiency, optimised its product portfolio,
and strengthened marketing for auto parts and the
power sector, and has outperformed industry play-
ers in steel & iron manufacturing and processing and
the larger steel industry. Steel output for the year
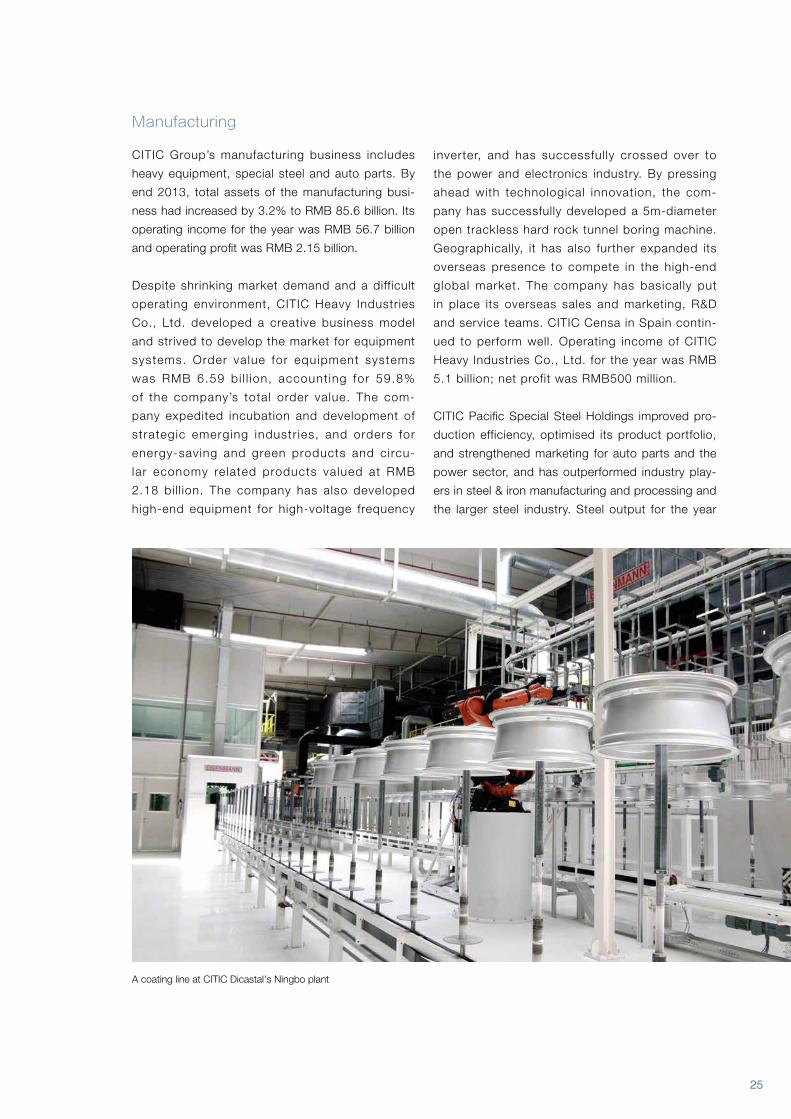
A coating line at CITIC Dicastal's Ningbo plant
26
MANAGEMENT REPORT
A 5m diameter open trackless hard rock tunnel boring machine developed by CITIC Heavy Industries successfully completed its test-run
was 7.24 million tonnes, contributing HKD1.3 billion
to the net profit of CITIC Pacific Limited.
CITIC Dicastal Co., Ltd. continued to optimise its
product portfolio, accelerated upgrading of technol-
ogy and processes, and strove to enhance added
value. Production for the Ningbo plant was off to a
smooth start. Construction for Production line 1 for
aluminium wheels was completed. Situated on land-
scaped grounds, the plant is equipped with sophis-
ticated digital and automated production facilities,
features low cost advantages, and has production
capacity for 2 million units a year. Construction of
the KSM plants in Qinghuangdao and the US com-
menced. With advanced casting technologies and
management expertise from KSM, CITIC Dicastal
will further expand its presence in the Chinese and
Other businesses
CITIC Group has other businesses in information
technology, such as cable TV, satellite transponder
leasing and information service, and in publishing,
general aviation, logistics, tourism and health care.
Within the year 2013, total business assets have
grown by 19% to close at RMB 85.8 billion. Total
operating income was RMB 57.3 billion and operat-
ing profit was RMB 1.99 billion.
US markets. In 2013, CITIC Dicastal sold a total of
30.75 million units of aluminium wheels, maintaining
its world’s No. 1 position in terms of sales volume
for the fifth consecutive year.
27
CITIC Networks Co., Ltd. studied the new busi-
ness potentials in the telecommunication sector
and conducted experimentation and trial operation
on optimisation of internet traffic on “pentium.icoc.
cc”, using the site’s existing resources. Henan
Cable TV and Chongqing Cable TV have made
steady progress in digital TV transition. Operating
income of CITIC Networks for the year was RMB
460 million.
CITIC Guoan Group has scaled up the upgrading
process of cable TV network to handle two-way
transmission for interactive data services, pressed
ahead with optimisation of network systems, and
stepped up marketing efforts for its value-added
services. Project returns grew steadily. The com-
pany was also extensively involved in network
integration in different localities, and its business
has continued to expand as a result. Its cable TV
subscribers grew 10% in the year, and by end
2013, CITIC Group had 38.95 mil l ion cable TV
subscribers.
Asia Satellite Telecommunications Holding Limit-
ed, in which CITIC Group has a stake, continued
to provide premier broadcasting and telecom-
munications services to the Asia Pacific region
with its four satellites, consolidating its position
as the market leader. Preparat ions for launch
o f As iaSat 6 and As iaSat 8 were underway.
The company’s net profit for the year stood at
HKD750 million.
CITIC Telecom International Holdings Limited ac-
quired a 99% interest in Companhia de Telecomu-
nicações de Macau S.A.R.L (CTM) and became
a leading telecom service provider with a diverse
range of product offerings. Its net profit for the year
was HKD1.07 billion.
During the year, CITIC Publishing Co., Ltd. changed
its name to CITIC Press Group. The company em-
barked on an aggressive expansion of its digital
publishing and education & training businesses.
CITIC-published books and CITIC book stores have
continued to gain popularity, and have significantly
boosted recognition for the CITIC brand.
China Offshore Helicopter Co., Ltd. continued to
grow its offshore helicopter oil services. With a
market share at 60.8%, the company was well-
entrenched as the leading industry player.
CITIC Automobile Co., Ltd. growed its conven-
tional logistics business, and at the same time re-
engineered its business model and expanded into
new areas as logistics financing, energy logistics and
cold chain logistics. Operating income for the year
was RMB 3.86 billion.
CITIC Tourism Group Co., Ltd. stepped up direct
sales for the outbound sector, and recorded a year-
on-year increase of 6.4% in operating income and
10.8% in net profit. Total tourists received were
770,000, 9.4% higher than the prior year.
CITIC-Xiangya Reproductive & Genetic Hospital and
Hangzhou Plastic Surgery Hospital, both of which
are subsidiaries of CITIC Medical & Health Group
Co., Ltd., recorded excellent performance.
Dah Chong Hong Holdings, in which CITIC Pacific
Limited holds a 55.6% stake, was aggressively de-
veloping its motor & motor-related business, food
& consumer products business, and logistics busi-
ness. The company contributed HKD 490 million in
net profit to CITIC Pacific Limited.
Overall, as complexities loom large, 2014 will remain a challenging year for both domestic and global economies. CITIC Group will stay prudent as it progresses, transforms and betters quality, and will steadfastly pursue business reform and consolidation, as well as optimisation and development. We are com-mitted to achieving robust growth for every single business and to obtaining the best returns for our ever trustful and supportive shareholders and customers.
28
CORPORATE SOCIAL RESPONSIBILITY
Corporate Social Responsibility

29
We funded a xiaokang demonstration village of 32
households in Xiongmei Town, Xainza County, Ti-
bet. Through the project, we improved the housing
and living conditions of local farmers and herders
to one of modest standard (“xiaokang”), thereby
contributed to the government’s policy of building
a new countryside and spurred economic growth.
We also helped alleviate the local employment
problem by providing 112 jobs for graduates of Ti-
betan tertiary institutions and Tibetan workers.
We embarked upon poverty alleviation initiatives
in Yuanyang and Pingbian counties by relocating
entire villages, providing safe housing and training
the villagers in livelihood skills. The locals were en-
abled through our efforts, and were able to com-
bat poverty and live a better life. Our initiatives
helped balance local socioeconomic development
and environmental protection. To support local
education, we have set up the CITIC financial aid
and scholarship, which has benefited more than
900 students and teachers in 2013.
We proceeded smoothly with the Huangyangtan
sandstorm control and greening project, covering
20,000 mu (or 1333.33 hectares) of land in Xuan-
hua County, Hebei Province, and continued to pre-
serve the 30-mu (or 2-hectare) land in Changping
District for greening and for sandstorm control and
prevention. As a development strategy, we have
also introduced various energy conservation mea-
sures and implemented paperless office. CITIC
Bank has adhered to the government’s policy to
promote green credit and to restrict financing in-
dustries with overcapacity, and has incorporated
the green credit concept in its business opera-
tions to reduce overcapacity. It ensured that loans
and financing options were offered to sectors that
meet technological upgrading requirements as well
as carbon emission and green standards. These
were part of our contributions to building a green,
circular and low-carbon economy.
CITIC Group and its subsidiaries have provided
more than 300,000 jobs at home and abroad.
CITIC Group (“the Group”) has been an active corporate citizen performing its social responsibilities, while generat-ing social wealth. In 2013, the Group contributed nearly RMB 100 million to social causes such as providing assis-tance for Tibet, poverty alleviation and greening, and has created real social benefits.
Alleviating poverty in Yuanyang County and Pingbi-an County in Honghe Prefecture, Yunnan Province
Supporting socioeconomic development in Xainza County of Tibet Autonomous Region
Protecting the environment and promoting low-carbon business
Creating jobs and enabling CITIC and CITIC Staff to grow together

30
CORPORATE SOCIAL RESPONSIBILITY
To fulf i l our larger goal, we have drawn up our
medium- and long-term development plans, and
improved upon our labour contract scheme and
work environment. Our focus on employee living
and work conditions is part of the Group’s effort to
share its achievements and profit with the staff to
sustain long-term and healthy development.
CITIC Group continued to sponsor Beijing Music
Festival. CITIC Bank contributed RMB 2 million to
the Tsinghua University Education Foundation to
support indigent students. The “Smile Initiative”
founded by Hangzhou Plastic Surgery Hospital, a
subsidiary of CITIC Medical and Health Group, has
treated more than 160 people with cleft lip and
palate.
After the Ya’an earthquake in Sichuan Province
on 20 Apri l 2013, the Group’s companies and
employees donated about RMB24 million to the
quake-stricken areas as disaster relief and recon-
struction fund. CITIC Bank provided more than
RMB 16 million, and worked with the China Foun-
dation for Poverty Alleviation to jointly kick-start
the “CITIC Bank -New Great Wall High School
Self-Strengthening (Ziqiang) Class” project to help
500 students of 12 ethnic groups from 21 counties
complete high school. The bank also granted RMB
1 mill ion to the “Mountain Flower Tennis (Shan
Hua Wangqiu )” project to provide professional ten-
nis training for girls in ethnic minority areas.
“Colour, Way of Love (Wei’ai Shangse )” was an
education aid programme which CITIC Real Estate
co-sponsored with Nippon Paint China. The local
organiser was the Work Committee for Depart-
ments under Jiangxi Provincial Committee of the
CPC. The programme which targeted at primary
and secondary schools in underdeveloped areas,
covered the Boyang Lake Eco-economic Zone and
southern Jiangxi Province, and included activities
as renovating school grounds, painting external
walls of school buildings, and donating libraries.
CITIC Construction f inanced 19 Angolan agri-
cultural technicians to attend a one-year training
programme in modern agricultural technology at
Shihezi University in Xinjiang Uyghur Autonomous
Region, and 10 Angolan planners for a one-month
exchange programme in Tsinghua University, the
Urban Planning Society of China and the Chinese
Academy of Urban Planning & Design. As patron
of the programme “My Well-equipped Home” ini-
tiated by the Ministry of Housing and Habitat of
Venezuela, CITIC Bank supported the Tiuna Social
Housing Project by providing RMB 13 million for
purchase of furniture and appliances for the resi-
dents. CITIC Resources invested RMB 5 million to
support infrastructure projects in Kazakhstan.
CITIC Group’s commitment to social responsi-
bilities has been well-recognised by the relevant
authorit ies and the public. The State Council’s
Leading Group Office of Poverty Alleviation and
Development has awarded CITIC Group with the
title of “Model of Poverty Alleviation”. The interna-
tional social responsibilities undertaken by CITIC
Construction have been selected for inclusion in
the Case Book of Outstanding Contributions by
Chinese and Foreign Enterprises in Delivering In-
ternational Social Responsibil it ies by the China
Foundation for Poverty Alleviation. In fulfilling its
corporate social responsibility, CITIC Group will
continue to give more, deliver more, and return
more to society.
Sponsoring educational, cultural, technology, and public health activities
Helping the disadvantaged
Fulfilling social responsibilities overseas
31
Board of Directors, Board of Supervisors and Senior Management of CITIC Group Corporation and CITIC Limited
P37CITIC Limited
P32CITIC Group Corporation
32
BOARD OF DIRECTORS, BOARD OF SUPERVISORS AND SENIOR MANAGEMENT OF CITIC GROUP CORPORATION AND CITIC LIMITED
CITIC Group Corporation
Nine Members on the Board of Directors
Mr CHANG Zhenming
Chairman
Born in October 1956. Mr Chang has been the Chairman of CITIC Group Corporation’s
Board of Directors since December 2011. He graduated from New York Insurance In-
stitute with a master’s degree in business administration. He is a senior economist by
profession.
Previous appointments: Vice President of CITIC Industrial Bank; Executive Director
and Vice President of CITIC Group; Vice Chairman and President of China Construction
Bank; Vice Chairman and President of CITIC Group; and Chairman of CITIC Group.
Mr WANG Jiong
Vice Chairman and President
Born in March 1960. Mr Wang has been the Vice Chairman and President of CITIC
Group Corporation since May 2013. He graduated from Shanghai University of Finance
and Economics with a master’s degree in economics.
Previous appointments: Deputy General Manager of CITIC Shanghai Co., Ltd.; Gen-
eral Manager and Chairman of CITIC Shanghai (Group) Co., Ltd.; General Manager and
Chairman of CITIC East China (Group) Co., Ltd.; Assistant President of China Interna-
tional Trust & Investment Corporation; Executive Director and Vice President of CITIC
Group Corporation; and Vice President of CITIC Limited.
Mr DOU Jianzhong
Executive Director
Born in February 1955. Mr Dou has been an Executive Director of CITIC Group Cor-
poration since December 2011. He has a bachelor’s degree in English language and
literature from the University of International Business and Economics and a master’s
degree in economics from the College of International Economics at Liaoning Univer-
sity. He is a senior economist by profession.
Previous appointments: Vice President, Executive Vice President and President of
CITIC Industrial Bank; Assistant President of China International Trust & Investment
Corporation; and Executive Director and Vice President of CITIC Group.
33
Mr ZHAO Jingwen
Executive Director
Born in July 1954. Mr Zhao has been an Executive Director of CITIC Group Corpora-
tion since September 2013. He graduated from China University of Political Science
and Law with a master’s degree in economic law.
Previous appointments: Deputy Director-General of the Supervisory Office, Director-
General of the Department of Supervision and Legal Department and Assistant Presi-
dent of China International Trust & Investment Corporation; and Executive Director and
Vice President of CITIC Group.
Mr YANG Jinming
Non-executive Director
Born in October 1957. Mr Yang has been a Non-executive Director of CITIC Group
Corporation since December 2011. He graduated from the Correspondence Institute of
the Central Party School with a college diploma in international economics.
Previous appointments: Deputy Director of the General Office, China National Salt
Industry Corporation Beijing Branch; Deputy Chief of the Payroll Division of General
Planning Department, Ministry of Finance; Chief of Extra-budgetary Fund Management
Division of Policy and Reform Department; and Chief of Government Procurement Divi-
sion and Assistant Inspector of Treasury Department.
Mr YU Zhensheng
Non-executive Director
Born in September 1956. Mr Yu has been a Non-executive Director of CITIC Group
Corporation since December 2011. He graduated from Beijing International Studies
University with a bachelor’s degree in Japanese language and literature. He also pur-
sued advanced studies at the Nomura Research Institute from October 1983 to Febru-
ary 1985.
Previous appointments: Officer of the Loan Office, State Import & Export Regula-
tory Commission; Officer of the Loan Bureau and Foreign Capital Bureau, Ministry of
Foreign Trade and Economic Cooperation; Deputy Chief of the Foreign Trade Division,
Department of Foreign Trade and Economic Cooperation, Tibet Autonomous Region;
Deputy Chief, Chief and Assistant Inspector of Division V, Department of Foreign Loans
Management, Ministry of Foreign Trade and Economic Cooperation; Assistant Inspec-
tor of the Government Bond Department, Ministry of Finance; and Deputy Director-
General and Inspector of the Department of Finance, Ministry of Finance.
34
BOARD OF DIRECTORS, BOARD OF SUPERVISORS AND SENIOR MANAGEMENT OF CITIC GROUP CORPORATION AND CITIC LIMITED
Ms QU Yonglan
Non-executive Director
Born in September 1954. Ms Qu Yonglan has been a Non-executive Director of CITIC
Limited since December 2011. She graduated from the Economics Department of Lia-
oning University and the Graduate School of the Central Party School with a graduate
diploma in economics and management.
Previous appointments: Senior Staff Member of the Publicity Division of the Party
Committee, Inspector (Deputy Division Chief level and Division Chief level) of the Disci-
pline Inspection Committee, and Chief of the Organisation Division of the Party Com-
mittee, Ministry of Finance; Deputy Director-General of the Supervision Bureau, Ministry
of Finance, appointed by the CPC Central Commission for Discipline Inspection and
Ministry of Supervision; and Secretary of the Discipline Inspection Committee, and Ex-
ecutive Deputy Secretary of the Party Committee, Ministry of Finance.
Ms CAO Pu
Non-executive Director
Born in December 1952. Ms Cao Pu has been a Non-executive Director of CITIC
Group since July 2012. She graduated from Wuhan University with a college diploma in
insurance. She is a senior economist by profession.
Previous appointments: Deputy Director and Director of the Office of PICC Henan
Branch; President of PICC Zhengzhou Sub-branch and Vice President of PICC Henan
Branch; General Manager of Finance Department of China Reinsurance (Group) Cor-
poration and its Assistant Manager; and Vice President of China Export & Credit Insur-
ance Corporation.
Mr LIU Zhiqiang
Staff-elected Director
Born in September 1956. Mr Liu has been the Staff-elected director of CITIC Group
Corporation since December 2011 and the Chairman and President of CITIC Asset
Management Corporation Ltd. since December 2004. He graduated from Zhongnan
University of Economics and Law with a graduate diploma and a PhD in economics.
He is a senior economist by profession.
Previous appointments: Deputy Chief and Chief of the Planning Department and
Financial Survey and Statistics Department, People’s Bank of China; Director of the Fi-
nancial Affairs Office for Hong Kong, Macau and Taiwan; Deputy Director-General of the

35
Department of Economics, Xinhua News Agency Hong Kong Branch; Deputy General
Manager and Chief Financial Officer of Guangdong International Trust & Investment Cor-
poration; President of Guangdong Development Bank; Vice President of CITIC Bank;
Director and Vice President of CITIC Holdings Co., Ltd.; and Director of CITIC Group.
Five Members on the Board of Supervisors
Mr LIN Meifang
Supervisor and Temporary Convenor of Board of Supervisors
Born in December 1955. Mr Lin has been a Non-employee Supervisor and Temporary
Convenor of CITIC Group Corporation’s Board of Supervisors since December 2011.
He graduated from Xiamen University with a college diploma in Finance and Account-
ing, and is an accountant by profession. He also attended the Graduate Programme of
Investment and Economics at Dongbei University of Finance and Economics.
Previous appointments: Deputy Division Chief and Division Chief of the Administrative
Department, Ministry of Finance; Deputy Director-General of the Basic Construction
Department, Ministry of Finance; Full-time Supervisor (Deputy Director-General level)
and Deputy Director of the General Office, and Full-time Supervisor (Director-General
level) and Director of the General Office, China Construction Bank; and Full-time Su-
pervisor (Director-General level) of the Board of Supervisors and Director of the General
Office of Agricultural Development Bank of China, the Export-Import Bank of China and
CITIC Group.
Mr LI Zengyuan
Supervisor
Born in July 1958. Mr Li has been a Non-employee Supervisor of CITIC Group Corpo-
ration since December 2011. He graduated from Dongbei University of Finance and
Economics with a college diploma in Public Finance.
Previous appointments: Senior Staff Member of the Budget Management Depart-
ment, Ministry of Finance; Deputy Chief of the Provincial Affairs Department, Ministry of
Finance; Researcher of the Special Fund Division and Central Government Spending
Division II of the Budget Department, Ministry of Finance; Manager (Deputy Division
Chief level) and Manager (Division Chief level) of the Finance Department, Ta Kung Pao
(Hong Kong) Limited; and Officer (Deputy Director-General level) of Ministry of Finance.
36
BOARD OF DIRECTORS, BOARD OF SUPERVISORS AND SENIOR MANAGEMENT OF CITIC GROUP CORPORATION AND CITIC LIMITED
Mr DOU Hongquan
Non-employee Supervisor
Born in August 1968. Mr Dou has been a Non-employee Supervisor of CITIC Group
Corporation since December 2011. He graduated from the Banking and Finance Re-
search Institute of People’s Bank of China (PBOC) with a PhD in Finance. He is a senior
economist by profession.
Previous appointments: Senior Staff Member of the Financial Market Division, Non-
banking Financial Regulation Department, PBOC; and Deputy Chief, Researcher, and
Full-time Supervisor (Division Chief level) of the Boards of Supervisors of China Ever-
bright Group and CITIC Group.
Mr ZHANG Xiaoping
Staff-elected Supervisor
Born in January 1953. Mr Zhang has been an Staff-elected supervisor of CITIC Group
Corporation since December 2011. He graduated from the Graduate School of the
Central Party School with a graduate diploma in World Economics. He is a senior politi-
cal advisor by profession.
Previous appointments: Chief of the Publicity Division, CPC Party Committee of or-
gans directly under the party committee of the China International Trust & Investment
Corporation; Deputy Editor-in-Chief of Zhongxinren Newspaper; Assistant Director of
the Organisation Department of the CPC Party Committee, Deputy General-Secretary
of CPC Party Committee of Organisations directly under CITIC Group, Deputy Direc-
tor of the Department of Party Affairs and Executive Vice Chairman of the Union, CITIC
Group; and Executive Vice Chairman of the Union, CITIC Limited.
Ms ZHENG Yongqin
Staff-elected Supervisor
Born in October 1955. Ms Zheng has been an Staff-elected supervisor of CITIC Group
Corporation since December 2011. She graduated from the Industrial Management
and Engineering Programme at the University of Science and Technology Beijing with a
master’s degree in economics. She is a senior accountant by profession.
Previous appointments: Lecturer at the School of Economics and Management, the
University of Science and Technology Beijing; Chief of the Finance Department, CITIC
Trading Company; Deputy Chief, Chief and Assistant Director of the Finance Depart-
ment, China International Trust & Investment Corporation; and Deputy Director of the
Finance Department, CITIC Group.
37
CITIC Limited
Eight Members on the Board of Directors
Mr CHANG Zhenming
Chairman
Born in October 1956. Mr Chang has been the Chairman of CITIC Limited’s Board of
Directors since December 2011. He graduated from New York Insurance Institute with
a master’s degree in business administration. He is a senior economist by profession.
Previous appointments: Vice President of CITIC Industrial Bank; Executive Director
and Vice President of CITIC Group; Vice Chairman and President of China Construction
Bank; Vice Chairman and President of CITIC Group; and Chairman of CITIC Group.
Mr WANG Jiong
Vice Chairman and President
Born in March 1960. Mr. Wang has been the Vice Chairman and President of CITIC
Limited since May 2013. He graduated from Shanghai University of Finance and Eco-
nomics with a master’s degree in Economics.
Previous appointments: Deputy General Manager of CITIC Shanghai Co., Ltd.; Gen-
eral Manager and Chairman of CITIC Shanghai (Group) Co., Ltd.; General Manager and
Chairman of CITIC East China (Group) Co., Ltd.; Assistant President of China Interna-
tional Trust & Investment Corporation; Executive Director and Vice President of CITIC
Group Corporation; and Vice President of CITIC Limited.
Mr DOU Jianzhong
Executive Director and Vice President
Born in February 1955. Mr Dou has been an Executive Director of and Vice President of
CITIC Limited since December 2011. He has a bachelor’s degree in English Language
from the University of International Business and Economics and a master’s degree in
Economics from the College of International Economics at Liaoning University. He is a
senior economist by profession.
Previous appointments: Vice President, Executive Vice President and President of
CITIC Industrial Bank; Assistant President of China International Trust & Investment
Corporation; and Executive Director and Vice President of CITIC Group.

38
BOARD OF DIRECTORS, BOARD OF SUPERVISORS AND SENIOR MANAGEMENT OF CITIC GROUP CORPORATION AND CITIC LIMITED
Mr ZHAO Jingwen
Executive Director and Vice President
Born in July 1954. Mr Zhao has been an Executive Director of CITIC Limited since Sep-
tember 2013 and Vice President of CITIC Limited since December 2011. He graduated
from China University of Political Science and Law with a master’s degree in Economic
Law.
Previous appointments: Deputy Director-General of the Supervisory Office, Director-
General of the Department of Supervision and Legal Department and Assistant Presi-
dent of China International Trust & Investment Corporation; and Executive Director and
Vice President of CITIC Group.
Mr YANG Jinming
Non-executive Director
Born in October 1957. Mr Yang has been a Non-executive Director of CITIC Limited
since December 2011. He graduated from the Correspondence Institute of the Central
Party School with a bachelor’s degree in International Economics.
Previous appointments: Deputy Director of the General Office, China National Salt
Industry Corporation Beijing Branch; Deputy Chief of the Payroll Division of General
Planning Department, Ministry of Finance; Chief of Extra-budgetary Fund Management
Division of Policy and Reform Department; and Chief of Government Procurement Divi-
sion and Assistant Inspector of Treasury Department.
Mr YU Zhensheng
Non-executive Director
Born in September 1956. Mr Yu Zhensheng has been a Non-executive Director of
CITIC Limited since December 2011. He graduated from Beijing International Studies
University with a bachelor’s degree in Japanese language and literature. He also stud-
ied at the Nomura Research Institute from October 1983 to February 1985.
Previous appointments: Officer of the Loan Office, State Import & Export Regulatory
Commission; Officer of the Loan Bureau and Foreign Capital Bureau, Ministry of For-
eign Trade and Economic Cooperation; Deputy Chief of Foreign Trade Division, Depart-
ment of Foreign Trade and Economic Cooperation, Tibet Autonomous Region; Deputy
Chief, Chief and Assistant Inspector of Division V, Department of Foreign Loans Man-
agement, Ministry of Foreign Trade and Economic Cooperation; Assistant Inspector of
39
Government Bond Department, Ministry of Finance; and Deputy Director-General and
Inspector of Department of Finance, Ministry of Finance.
Ms QU Yonglan
Non-executive Director
Born in September 1954. Ms Qu Yonglan has been a Non-executive Director of CITIC
Limited since December 2011. She graduated from the Economics Department of Lia-
oning University and the Graduate School of the Central Party School with a master’s
degree in Economics and Management.
Previous appointments: Senior Staff Member of the Publicity Division of the Party
Committee, Inspector (Deputy Division Chief level and Division Chief level) of the Disci-
pline Inspection Committee, and Chief of the Organisation Division of the Party Com-
mittee, Ministry of Finance; Deputy Director-General of the Supervision Bureau, Ministry
of Finance, appointed by the CPC Central Commission for Discipline Inspection and
Ministry of Supervision; and Secretary of the Discipline Inspection Committee, and Ex-
ecutive Deputy Secretary of the Party Committee, Ministry of Finance.
Ms CAO Pu
Non-executive Director
Born in December 1952. Ms Cao Pu has been a Non-executive Director of CITIC Lim-
ited since July 2012. She graduated from Wuhan University with a college diploma in
insurance. She is a senior economist by profession.
Previous appointments: Deputy Director and Director of the Office of PICC Henan
Branch; President of PICC Zhengzhou Sub-branch and Vice President of PICC Henan
Branch; General Manager of the Finance Department of China Reinsurance (Group)
Corporation and its Assistant Manager; and Vice President of China Export & Credit
Insurance Corporation.
Four Members on the Board of Supervisors
Mr LIN Meifang
Supervisor and Temporary Convenor of the Board of Supervisors
Born in December 1955. Mr Lin has been a Non-employee Supervisor and Temporary
Convenor of CITIC Limited’s Board of Supervisors since December 2011. He gradu-
ated from Xiamen University in finance and accounting, and is an accountant by pro-
40
BOARD OF DIRECTORS, BOARD OF SUPERVISORS AND SENIOR MANAGEMENT OF CITIC GROUP CORPORATION AND CITIC LIMITED
fession. He also attended the Graduate Programme of Investment and Economics at
Dongbei University of Finance and Economics and has obtained a college diploma.
Previous appointments: Deputy Division Chief and Division Chief of the Administra-
tive Department, Ministry of Finance; Deputy Director-General of the Basic Construc-
tion Department, Ministry of Finance; Supervisor (Deputy Director-General level) and
Deputy Director of the General Office, and Full-time Supervisor (Director-General level)
and Director of the General Office, China Construction Bank; and Full-time Supervisor
(Director-General level) of the Board of Supervisors and Director of the General Office
of Agricultural Development Bank of China, the Export-Import Bank of China and CITIC
Group.
Ms WANG Xuemei
Supervisor
Born in February 1963. Ms Wang has been a Non-employee Supervisor of CITIC Lim-
ited since December 2011. She majored in macroeconomics in the School of Manage-
ment of Zhejiang University, and graduated with a master’s degree in economics.
Previous appointments: Deputy Division Chief and Researcher of the Policy Research
Office, Zhejiang Provincial CPC Party Committee; Inspector of the General Office of the
Board of Supervisors and Deputy Division Chief of the Banking Division of the General
Office of the Board of Supervisors, CPC Central Financial Work Commission; Chief and
Deputy Inspector of the Banking Division of the Board of Supervisors, China Banking
Regulatory Commission; and Full-time Supervisor (Deputy Director-General level) of the
Board of Supervisors of Key State-owned Financial Institutions.
Mr ZHENG Xuexue
Staff-elected Supervisor
Born in February 1955. Mr Zheng has been an Staff-elected supervisor and Director of
the Audit Department of CITIC Limited since December 2011. He graduated from the
Accountancy Programme at the First Branch Campus of Renmin University of China
with a bachelor’s degree in economics. He is a senior accountant by profession.
Previous appointments: Deputy Division Chief, Division Chief, Assistant Director and
Deputy Director of the Audit Department of China International Trust & Investment Cor-
poration; and Director of the Audit Department and Staff-elected supervisor of CITIC
Group.
41
Mr LIU Hesheng
Staff-elected Supervisor
Born in October 1953. Mr Liu has been an Staff-elected supervisor and Director of the
Supervision Department of CITIC Limited since December 2011. He graduated from
China University of Political Science and Law with a junior college diploma in economic
law. He was a senior political counsellor.
Previous appointments: Deputy Division Chief and Division Chief of the Supervision
Office, Assistant Director of the Legal Department, Deputy Director of the Supervision
Department, and Part-time Supervisor of China International Trust & Investment Corpo-
ration; and Director of the Supervision Department of CITIC Group.
Eleven Other Senior Executives
Mr ZHU Xiaohuang
Vice President
Born in July 1956. Mr Zhu has been a Vice President of CITIC Limited since August
2012. He graduated from the Lingnan College of Sun Yat-Sen University with graduate
diploma in world economics and a PhD in economics. He is a senior economist by pro-
fession.
Previous appointments: Deputy Director of the General Office, Deputy Director of
Credit Division I, Deputy Director-General of the Credit Management Department of
China Construction Bank; Deputy General Manager of China Construction Bank Lia-
oning Branch; Director-General of the Business Department of China Construction
Bank; General Manager of China Construction Bank Guangdong Branch; and Director-
General of the Corporate Business Department, Chief Risk Officer, Vice President and
Executive Director of China Construction Bank.
Mr JU Weimin
Vice President, Chief Financial Officer and Board Secretary
Born in August 1963. Mr Ju has been a Vice President, Chief Financial Officer and
Board Secretary of CITIC Limited since December 2011. He graduated from the Ac-
countancy Programme at Renmin University of China with a master’s degree in eco-
nomics.
42
BOARD OF DIRECTORS, BOARD OF SUPERVISORS AND SENIOR MANAGEMENT OF CITIC GROUP CORPORATION AND CITIC LIMITED
Previous appointments: Deputy Director-General and Director-General of the Finance
Department of China International Trust & Investment Corporation; Managing Direc-
tor of Shortridge Limited; Chief Accountant of China International Trust & Investment
Corporation; Chairman of CITIC Trust Co., Ltd.; Director, Chief Financial Officer and
Director-General of the Finance Department of CITIC Group; and Executive Director
and Vice President of CITIC Group.
Mr Zhang Jijing
Vice President
Born in September 1955. Mr Zhang has been a Vice President of CITIC Limited since
December 2011. He majored in vacuum technology and equipment in Hefei University
of Technology and in quantitative economics in the Graduate School of the Chinese
Academy of Social Sciences. He has a master’s degree in economics, and is a senior
economist by profession.
Previous appointments: Deputy General Manager of CITIC Australia Pty. Ltd. and its
General Manager; Director-General of the Strategy and Planning Department of China
International Trust & Investment Corporation; Director, Assistant President, and Direc-
tor-General of the Strategy and Planning Department of CITIC Group; Managing Direc-
tor of CITIC Pacific Ltd; and Executive Director and Vice President of CITIC Group.
Mr FENG Guang
Secretary of the Party Discipline Inspection Commission
Born in June 1957. Mr Feng has been the Secretary of the Party Discipline Inspection
Commission of CITIC Limited since December 2011. He graduated from the Graduate
School of the Central Party School with a master’s degree in jurisprudence.
Previous appointments: Deputy Division Chief, Division Chief and Deputy Director of
Supervision Office II, and Deputy Director of Supervision Office VII of the CPC Central
Commission for Discipline Inspection.
Ms LI Qingping
Vice President
Born in October 1962. Ms Li has been a Vice President of CITIC Limited since Septem-
43
ber 2013. She graduated from the International Finance Programme at Nankai Univer-
sity with a master’s degree in economics. She is a senior economist by profession.
Previous appointments: Deputy General Manager and General Manager of the In-
ternational Department of Agricultural Bank of China; General Manager of Agricultural
Bank of China Guangxi Branch; and Director of the Retail Business Department, Gen-
eral Manager of the Personal Business Department, General Manager of the Personal
Credit Business Department, and General Manager of the Personal Finance Depart-
ment of Agricultural Bank of China.
Mr PU Jian
Vice President
Born in October 1958. Mr Pu has been a Vice President of CITIC Limited since Novem-
ber 2013. He graduated from Fordham University with a master’s degree in business
administration. He is a senior economist by profession.
Previous appointments: Vice President of CITIC Securities Co., Ltd.; Vice Chairman
of China Offshore Helicopter Co., Ltd.; President of CITIC Offshore Helicopter Co., Ltd.;
Director of CITIC Group; and President and Chairman of CITIC Trust Co., Ltd..
Mr LUO Ning
Assistant President
Born in March 1959. Mr Luo has been an Assistant President of CITIC Limited, Vice
Chairman of CITIC Guoan Group, and Chairman and President of CITIC Networks Co.,
Ltd.since December 2011. He graduated from the Central Party School with a post-
graduate diploma in modern history.
Previous appointments: Deputy General Manager of Beijing Guoan Electric Co., Ltd.;
Deputy General Manager and General Manager of the First Branch Company of the
China United Network Communications Group Co., Ltd.; Executive Deputy General
Manager, General Manager and Chairman of CITIC Communications Project Manage-
ment Co., Ltd.; Chairman and President of CITIC Network Management Co., Ltd.; As-
sistant President of China International Trust & Investment Corporation; and Director
and Assistant President of CITIC Group.
44
BOARD OF DIRECTORS, BOARD OF SUPERVISORS AND SENIOR MANAGEMENT OF CITIC GROUP CORPORATION AND CITIC LIMITED
Mr SUN Yalei
Assistant President
Born in April 1968. Mr Sun has been an Assistant President of CITIC Limited, and Vice
Chairman and General Manager of CITIC Guoan Group since December 2011. He
graduated from the Industrial Economics and Management Programme at Renmin Uni-
versity of China with a bachelor’s degree in economics.
Previous appointments: President and Vice Chairman of CITIC Guoan Information In-
dustry Co., Ltd.; Vice Chairman and President of CITIC Guoan Group; and Director and
Assistant President of CITIC Group.
Mr GUO Ketong
Assistant President
Born in June 1954. Mr Guo has been an Assistant President of CITIC Limited since
December 2011. He graduated from Renmin University of China with a junior college
diploma in party and government administration. He is an economist by profession.
Previous appointments: Director and Assistant Director-General of the Human Re-
sources Department, and Deputy Director-General and Director-General of the Human
Resources and Education Department of China International Trust & Investment Corpo-
ration; and Director and Assistant President of CITIC Group.
Mr REN Qinxin
Assistant President
Born in November 1955. Mr Ren has been an Assistant President of CITIC Limited
since September 2013, and Vice Chairman of CITIC Heavy Industries Co., Ltd.since
December 2010. He graduated from Huazhong University of Science and Technology
with a college diploma in business administration and a PhD in management. He is a
senior engineer (professor level) by profession.
Previous appointments: Vice President, Executive Director and President of CITIC
Heavy Industries Company; Director of CITIC Group; and Vice Chairman and President
of CITIC Heavy Industries Co., Ltd..
45
Ms HONG Bo
Assistant President
Born in November 1960. Ms Hong has been an Assistant President of CITIC Limited
since December 2013, and Chairman of CITIC Construction Co., Ltd.since October
2009. She graduated from the MBA Programme at the University of International Busi-
ness and Economics. She is a senior engineer by profession.
Previous appointments: Vice President, Acting President and President of CITIC In-
ternational Contracting Co., Ltd.; Vice President and President of CITIC Construction
Co., Ltd., and Chairman of CITIC International Contracting Co., Ltd.; Director of CITIC
Group; and Vice Chairman of CITIC Construction Co., Ltd..
Note:
1. In April 2013, Mr Tian Guoli resigned as Vice Chairman and President of CITIC Group Corporation and of
CITIC Limited
2. In April 2013, Mr Wang Dongming no longer serves as Assistant President of CITIC Limited
3. In May 2013, Mr Wang Jiong appointed as Vice Chairman and President of CITIC Group Corporation and of
CITIC Limited
4. In September 2013, Ms Li Qingping appointed as Vice President of CITIC Limited
5. In September 2013, Mr Ren Qinxin appointed as Assistant President of CITIC Limited
6. In September 2013, Mr Zhao Jingwen appointed as Executive Chairman of CITIC Group Corporation
7. In October 2013, Mr Zhao Jingwen appointed as Executive Chairman of CITIC Limited
8. In December 2013, Mr Pu Jian appointed as Vice President of CITIC Limited
9. In December 2013, Ms Hong Bo appointed as Assistant President of CITIC Limited
10. In March 2014, Mr Zhu Xiaohuang appointed as Chairman of the Board of Supervisors of CITIC Group
Corporation and of CITIC Limited
(Listed in chronological order)

46
INVESTOR RELATIONS
Investor Relations
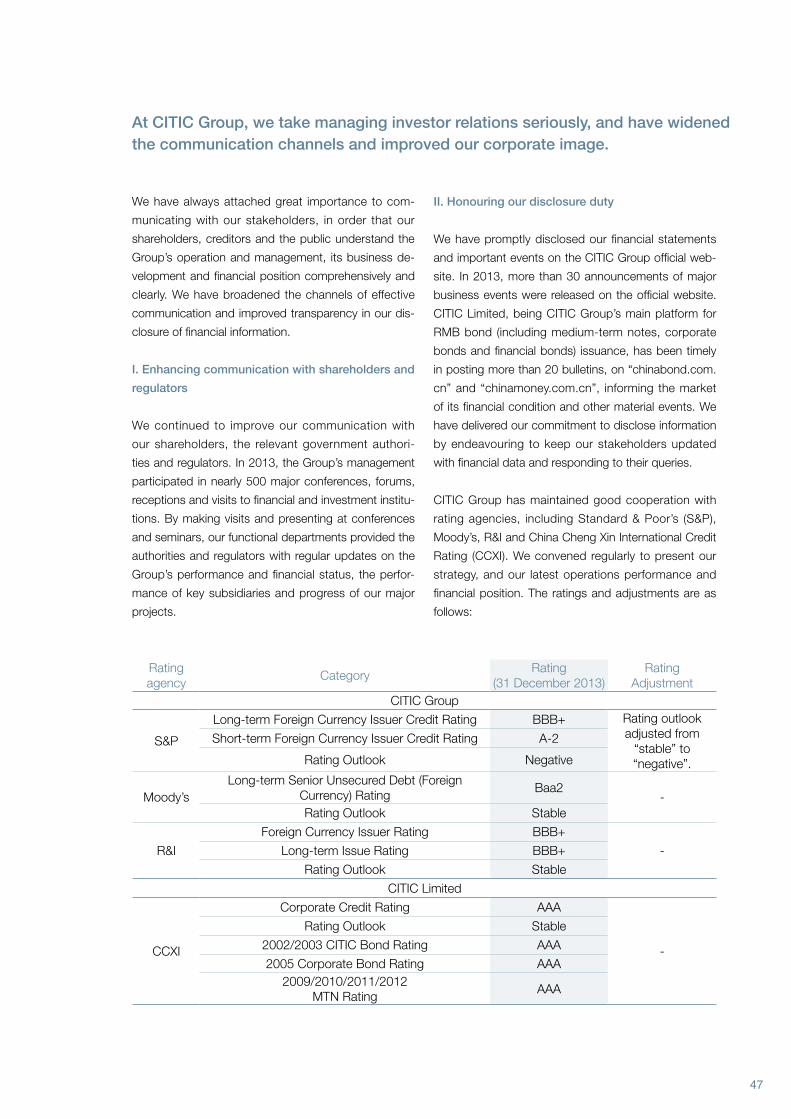
47
We have always attached great importance to com-
municating with our stakeholders, in order that our
shareholders, creditors and the public understand the
Group’s operation and management, its business de-
velopment and financial position comprehensively and
clearly. We have broadened the channels of effective
communication and improved transparency in our dis-
closure of financial information.
I. Enhancing communication with shareholders and
regulators
We continued to improve our communication with
our shareholders, the relevant government authori-
ties and regulators. In 2013, the Group’s management
participated in nearly 500 major conferences, forums,
receptions and visits to financial and investment institu-
tions. By making visits and presenting at conferences
and seminars, our functional departments provided the
authorities and regulators with regular updates on the
Group’s performance and financial status, the perfor-
mance of key subsidiaries and progress of our major
projects.
II. Honouring our disclosure duty
We have promptly disclosed our financial statements
and important events on the CITIC Group official web-
site. In 2013, more than 30 announcements of major
business events were released on the official website.
CITIC Limited, being CITIC Group’s main platform for
RMB bond (including medium-term notes, corporate
bonds and financial bonds) issuance, has been timely
in posting more than 20 bulletins, on “chinabond.com.
cn” and “chinamoney.com.cn”, informing the market
of its financial condition and other material events. We
have delivered our commitment to disclose information
by endeavouring to keep our stakeholders updated
with financial data and responding to their queries.
CITIC Group has maintained good cooperation with
rating agencies, including Standard & Poor’s (S&P),
Moody’s, R&I and China Cheng Xin International Credit
Rating (CCXI). We convened regularly to present our
strategy, and our latest operations performance and
financial position. The ratings and adjustments are as
follows:
At CITIC Group, we take managing investor relations seriously, and have widened the communication channels and improved our corporate image.
Rating agency
CategoryRating
(31 December 2013)Rating
AdjustmentCITIC Group
S&P
Long-term Foreign Currency Issuer Credit Rating BBB+ Rating outlook adjusted from
“stable” to “negative”.
Short-term Foreign Currency Issuer Credit Rating A-2
Rating Outlook Negative
Moody’sLong-term Senior Unsecured Debt (Foreign
Currency) RatingBaa2
-Rating Outlook Stable
R&I
Foreign Currency Issuer Rating BBB+
-Long-term Issue Rating BBB+
Rating Outlook Stable
CITIC Limited
CCXI
Corporate Credit Rating AAA
-
Rating Outlook Stable
2002/2003 CITIC Bond Rating AAA
2005 Corporate Bond Rating AAA2009/2010/2011/2012
MTN Rating AAA

48
CORPORATE GOVERNANCE
Corporate Governance
49
(I) CITIC Group’s Governance Structure
1. Shareholders
CITIC Group is a conglomerate approved for establish-
ment by the State Council, the People’s Republic of
China, and funded by the Ministry of Finance on behalf
of the State Council.
2. Board of Directors
The Board of Directors comprises 9 members, including
1 chairman, 1 vice chairman and 1 employee director.
The mandates of the Board of Directors include: devis-
ing corporate development strategy, business policies
and investment plans; adopting corporate business
plans and investment proposals, and deciding on man-
agement setup and managers’ compensation; formu-
lating basic corporate policies and bylaws; preparing
annual corporate budget, final accounts, profit distri-
bution and financial recuperation plans; developing
plans for corporate merger, division, dissolution and/
or alteration of corporate form; planning amendments
to the articles of association; reviewing and approving
the general manager’s work report; appointing and/or
removing general manager and/or other senior execu-
tives, and hiring or dismissing external auditors.
3. Board of Supervisors
The Board of Supervisors comprises 5 members,
including 3 internal supervisors and 2 staff-elected su-
pervisors.
The mandates of the Board of Supervisors include:
looking into the Group’s financial position; supervising
directors’ and the management’s actions.
4. The Management
The Management decides on matters relating to man-
agement and operations within its mandate as set forth
under the Articles of Association.
(II) Key Measures to Improve Corporate Governance
1. The Group further enhanced its governance frame-
work in line with modern business operations, and
improved coordination, support, and checks and bal-
ances between the shareholders, Board of Directors,
Board of Supervisors and the Management as set forth
under the Company Law and the Articles of Associa-
tion, hence, putting in place the institutions necessary
for greater operation efficiency. In 2013, the Board of
Directors convened 3 times and reviewed 10 propos-
als; the Board of Supervisors convened once and re-
viewed 3 proposals.
2. To strengthen strategic management, the Group
established a Strategic and Investment Management
Committee, Asset and Liability Management Com-
mittee, and the Internal Oversight and Management
Committee. It also took steps to advance reform of
its review and approval system, strengthen portfolio
management for better asset profitability, liquidity and
safety, and to improve oversight and management
effectiveness. A pilot programme on performance ap-
praisal of the accountability system for asset opera-
tions was implemented, whereby the Group entered
into appraisal agreements with certain subsidiaries to
guide them in improving their ability to create value and
in delivering higher shareholder returns.
3. The Group’s financing capability and fund usage effi-
ciency improved, as short-term fund operations report-
ed stronger returns than prior year. Investment capital
CITIC Group (“the Group”) continued to improve corporate governance, as it refined its governance framework and mechanisms and the respective rules according to the laws, regulations and as required by the regulatory authorities. Enhanced governance has enabled better risk prevention and optimised deci-sion making.
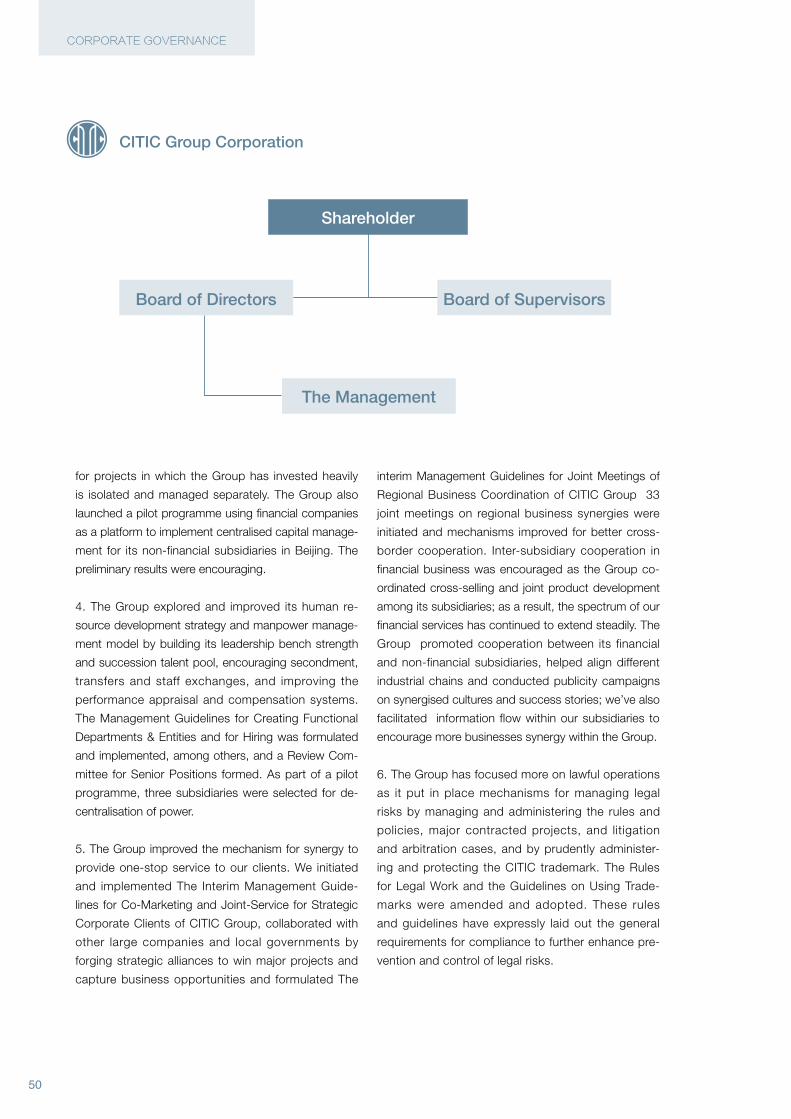
50
CORPORATE GOVERNANCE
for projects in which the Group has invested heavily
is isolated and managed separately. The Group also
launched a pilot programme using financial companies
as a platform to implement centralised capital manage-
ment for its non-financial subsidiaries in Beijing. The
preliminary results were encouraging.
4. The Group explored and improved its human re-
source development strategy and manpower manage-
ment model by building its leadership bench strength
and succession talent pool, encouraging secondment,
transfers and staff exchanges, and improving the
performance appraisal and compensation systems.
The Management Guidelines for Creating Functional
Departments & Entities and for Hiring was formulated
and implemented, among others, and a Review Com-
mittee for Senior Positions formed. As part of a pilot
programme, three subsidiaries were selected for de-
centralisation of power.
5. The Group improved the mechanism for synergy to
provide one-stop service to our clients. We initiated
and implemented The Interim Management Guide-
lines for Co-Marketing and Joint-Service for Strategic
Corporate Clients of CITIC Group, collaborated with
other large companies and local governments by
forging strategic alliances to win major projects and
capture business opportunities and formulated The
interim Management Guidelines for Joint Meetings of
Regional Business Coordination of CITIC Group 33
joint meetings on regional business synergies were
initiated and mechanisms improved for better cross-
border cooperation. Inter-subsidiary cooperation in
financial business was encouraged as the Group co-
ordinated cross-selling and joint product development
among its subsidiaries; as a result, the spectrum of our
financial services has continued to extend steadily. The
Group promoted cooperation between its financial
and non-financial subsidiaries, helped align different
industrial chains and conducted publicity campaigns
on synergised cultures and success stories; we’ve also
facilitated information flow within our subsidiaries to
encourage more businesses synergy within the Group.
6. The Group has focused more on lawful operations
as it put in place mechanisms for managing legal
risks by managing and administering the rules and
policies, major contracted projects, and litigation
and arbitration cases, and by prudently administer-
ing and protecting the CITIC trademark. The Rules
for Legal Work and the Guidelines on Using Trade-
marks were amended and adopted. These rules
and guidelines have expressly laid out the general
requirements for compliance to further enhance pre-
vention and control of legal risks.
Board of Directors
The Management
Shareholder
CITIC Group Corporation
Board of Supervisors
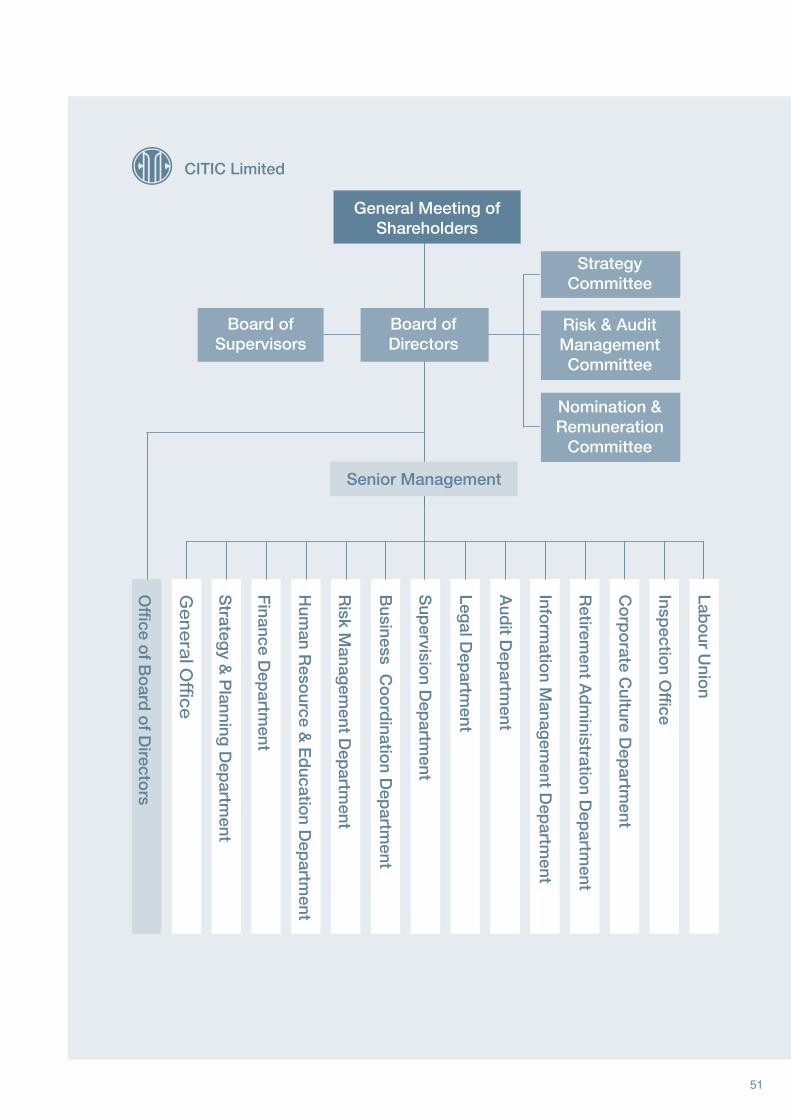
51
Board of Supervisors
Strategy Committee
Risk & Audit Management Committee
Nomination & Remuneration
Committee
Office o
f Bo
ard o
f Directo
rs
Ge
ne
ral O
ffice
Strateg
y & P
lanning D
epartm
ent
Hum
an Reso
urce & E
ducatio
n Dep
artment
Risk M
anagem
ent Dep
artment
Finance D
epartm
ent
Senior Management
CITIC Limited
General Meeting of Shareholders
Board of Directors
Business C
oo
rdinatio
n Dep
artment
Sup
ervision D
epartm
ent
Legal D
epartm
ent
Aud
it Dep
artment
Inform
ation M
anagem
ent Dep
artment
Retirem
ent Ad
ministratio
n Dep
artment
Co
rpo
rate Culture D
epartm
ent
Inspectio
n Office
Labo
ur Unio
n
52
RISK MANAGEMENT
Risk Management
53
The Group is exposed to the following risk factors:
Strategic risks: As complexities persist, global eco-
nomic recovery remains weighed down by uncertain-
ties and destabilising factors. Shifts in macroeconomic
policy in some countries will add to the uncertainties,
as emerging markets confront new problems and chal-
lenges. Domestic economic factors and conditions
originally conducive to growth are undergoing profound
changes, waging downward pressure across the econ-
omy. As the government pursues stable growth and
reform and innovation, it is also pressing ahead with
restructuring the economy and remodelling growth.
For state-owned enterprise reform, the government
proposed that management of state-owned asset be
improved by strengthening supervision of state assets
through managing state capital. As a state-owned
conglomerate involved in a wide range of sectors, the
Group’s development objectives and strategic plans
are subject to macroeconomic fluctuations both at
home and abroad. And when exploring market-ori-
ented solutions for state-owned enterprise reform and
development, it must also deal with fresh challenges.
Policy risks: The 3rd Plenum of the 18th CPC Con-
gress and the Report on the Work of the Government
(2014) have charted the general direction for China in
the new era for pushing through sweeping reforms,
opening China’s doors wider and pursuing innovation-
driven growth. The government will vigorously develop
a hybrid economy, reform the state-owned sector and
revamp the fiscal and tax regime. It will also advance
the building of a modern market system and establish
a receptive and open economic system.
The financial sector will be further opened to both do-
mestic and foreign players, and qualified private capital
will be allowed to set up financial institutions, such
as small- and medium-sized banks. Other measures
include improvement and vitalisation of the multi-tier
capital market, fine-tuning of the formation mechanism
for a market-based Renminbi exchange rate, and ex-
pedited liberalisation of interest rates. As reform poli-
cies gradually unfold, the Group may face increasing
policy risks as certain industries, business segments,
business models and competitive landscapes may be
affected.
Financial risks: Given the multitude of uncertainties
in the world economy, the prices of factors including
labour, land, energy and resources may trend up and
add to the cost of in-progress projects. Interest rate
liberalisation may make financing more expensive, and
the progress of projects and actual return on invest-
ment may fall short of expectations. If liquidity tightens,
the Group’s investment and financing businesses will
be constrained, therefore any business expansion may
mean greater liquidity risks. All this bodes ill for the
Group’s financial position.
Credit risks: Amidst a complex and unpredictable
economic climate, and as reforms intensify, different
markets are teeming with new entrants, new business
models, new products and new practices. Increased
counterparty diversity also means that credit risks will
become increasingly multifarious and complex. The
Group’s businesses may, therefore, face greater coun-
terparty risk, which complicates the conglomerate’s
management.
Market risks: The world economic landscape is un-
dergoing profound adjustments, and global competi-
tion intensifying. Country monetary policies, trade and
investment patterns, and commodity price volatility
are uncertainties to contend with, as inflationary pres-
sures mount and asset bubbles grow. At home, China
is implementing deeper and more extensive reforms:
In 2013, CITIC Group (“the Group”) had to navigate complexities in both do-mestic and global markets and plan its risk mitigation strategy around its ex-tensive and diversified business portfolio. It continued to improve its risk man-agement and strengthen internal control, and has taken a rigorous approach to risk management, such that sound risk management was embedded into the day-to-day operations.
54
RISK MANAGEMENT
it will establish and improve the market-based pricing
regime; relax market access for investment and expe-
dite the building of free trade zones; pursue counter-
cyclical regulations through taxation reform and pro-
mote economic restructuring; liberalise interest rates,
and develop inclusive finance and internet finance; and
persist in regulating the housing market. We foresee
that the Group’s relevant business segments will be
confronted with greater complexities and a more com-
petitive landscape both at home and abroad.
Operational risks: The Group is developing fast, with
a diversified portfolio. As new markets, new products,
new clients and new businesses emerge, operations
become increasingly complex and challenging. Opera-
tions and management involving people, institutions,
processes and information systems as such must keep
up with the rapid growth of our businesses, and will
face new challenges. Similarly, potential natural disas-
ters may pose risks and must be closely scrutinised.
Legal and compliance risks: Legal and compliance
risks abound, as the Group’s financial businesses are
regulated by the authorities, and non-financial busi-
nesses must observe the relevant government policies
and industry codes. Overseas businesses are subject
to local laws and regulations.
The Group aims for public listing at the right opportu-
nity, in which case it must observe external supervision
and market scrutiny whether at home or overseas,
including fulfilling disclosure obligations. Given its vast
number of subsidiaries, the Group faces intricate in-
formation disclosure issues, whereby the disclosed
information for all listed subsidiaries must be aligned
and consistent. As such, the scope and content of dis-
closure become more complicated than other public
companies. Any untimely, irregular or inconsistent infor-
mation disclosed will jeopardise the Group’s reputation
and may incur regulatory penalty or even legal action.
Country risks: The Group is engaged in engineering
contracting, resource development and trade in many
countries and regions. Additionally, it is exporting more
machinery from its local factories. These businesses
are vulnerable to changes in the political, economic
and social variables in the host countries.
The Group has taken the following measures to miti-
gate the above risks:
1. Adjusted business portfolio, optimised control
methods and modified management systems to en-
hance preparedness and resilience against risks.
To give equal weight to developing financial services and
industrial investment, the Group re-focused its business
strategy to limited diversification, and evolved subsidiaries
to achieve greater specialisation. It has also refined its de-
velopment strategies and business models, consolidated
business segments and optimised its business mix. For
better asset management, the Group increased asset op-
erations accountability, and allocated resources based on
the value creation potential of capital and in a way that is
consistent with its strategic direction. A new performance
evaluation system and budget management system
was introduced to improve upon the project review and
approval system, so that subsidiaries develop toward
greater synergism that benefits the Group as a whole, as
well as create better value, increase dividend pay-out and
improve risk management.
2. Enhanced monitoring of key projects to ensure
safety and higher returns.
This was a critical period of implementation for some of
the Group’s key projects. As such, supervision of key
projects has been strengthened, together with rigorous
contract management, cost control and safety measures
to ensure prompt and full completion. We identified
problems that arose during project implementation and
addressed them promptly and appropriately, to ensure
quality as well as expedite progress.
3. Continued to improve risk management, and en-
hanced the Group’s risk management capabilities.
The Group built upon its corporate governance structure
to set up a four-tier risk management system comprising
the Board of Directors, the Senior Management, the Risk
Management Department and related functional units,
and its subsidiaries. Under the Senior Management, the
Strategy and Investment Management Committee, the
Asset and Liability Management Committee and the In-
ternal Oversight Committee will review the Group’s risk
profile from different perspectives based on their respec-
55
tive functions. This risk management framework has
enabled better decision- making and enhanced oversight
and management effectiveness.
The Group also assisted business units at all levels in
establishing and improving their organisational arrange-
ments for managing risks to ensure that they fulfil their
risk management responsibilities. Subsidiaries were re-
quired to carry out on-going risk assessments and risk
reporting, and risk-based inspections were performed in
key subsidiaries to ensure that key risk assessments and
monitoring for key projects and major businesses were in
place for timely identification and mitigation of risks. We
also ensured strengthening of management of counter-
party credit risk and large exposures. At both Group and
subsidiary levels, we redoubled efforts to develop a more
robust system of key risk indicators and early-warning
mechanism for potential risks.
4. Maintained a prudent financial policy to ensure
fund security and liquidity.
A top priority for the period was on liquidity management.
Financing channels were expanded and new investments
and credit extension were strictly controlled to guarantee
sufficient funding for in-progress projects. We promptly
adjusted the asset-liability ratio, and re-matched interest
rates and terms to maturity according to changes in in-
ternational and domestic financial markets, so as to stave
off market and currency risks. We have also improved
our capital and credit structures to reduce borrowing cost
and optimise resource allocation. To prevent and control
financial risks, the Group has tightened monitoring and
management of liquidity at subsidiary level and imple-
mented financial tracking and analysis of key subsidiaries
and major projects. The quality and efficiency of financial
reporting and financial accounting were also improved to
reduce the relevant risks.
5. Strengthened legal operations and information
disclosure to control legal, compliance and reputa-
tion risks.
Key businesses, major projects and important work have
continued to receive legal support and services. Key con-
tracts, in particular, were subject to rigorous legal review.
The CITIC group companies have augmented capacity-
building and management of their legal units and teams,
improved relevant work policies and raised the legal
awareness of employees for a higher level of legal compli-
ance in management and operations.
To meet the requirements for overseas listing, a Group-
wide information disclosure system was established. We
ensured that management and operations referred to the
standards for listed companies for continued improve-
ment, and that information disclosure were timely, accu-
rate, complete and consistent.
The CITIC trademark was strictly managed to maintain
our good reputation and safeguard our lawful interests.
The Group has complied with the government’s increas-
ingly stringent requirements for production safety and
environmental protection to strengthen management of
safety and compliance risks in non-financial subsidiaries.
6. Strengthened internal auditing to leverage its su-
pervisory role.
The Group improved its audit system and compliance
levels by setting up a professional and efficient internal
audit system that is managed centrally and executed at
different levels using shared resources. Subsidiaries were
required to establish a sound internal audit arrangement,
giving consideration to organisational structure, resource
allocation, employee professionalism and IT infrastructure.
We ensured that audit was independent and unbiased,
and the professional capabilities of the audit team con-
tinually improved, and audit programmes rigorous and
strictly implemented with the help of information technol-
ogy for better compliance and consistency.
7. Improved human resource management to meet
the Group’s manpower needs
Human resource management was tailored to serve the
Group’s business development requirements. The Group
has developed innovative mechanisms and improved
management policies and procedures, and has further
expanded its talent pool and strengthened capacity build-
ing for its human resource regime. The Group also ad-
opted a scientific approach to work, protected the lawful
rights of the company and employees, and has therefore,
created a reliable source of manpower for sustainable de-
velopment.
AUDITOR'S REPORT AND FINANCIAL STATEMENTS
P57 P72Auditors’ Report 2013 Annual
Financial Statements
Auditors’ Report [Page 57]Consolidated Balance Sheet [Page 58]Consolidated Income Statement [Page 60]Consolidated Statement of Cash Flows [Page 61]Consolidated Statement of Changes inShareholders’ Equity [Page 64]Balance Sheet [Page 66]Income Statement [Page 68]Statement of Cash Flows [Page 69]Statement of Changes in Shareholders’ Equity [Page 71]
56
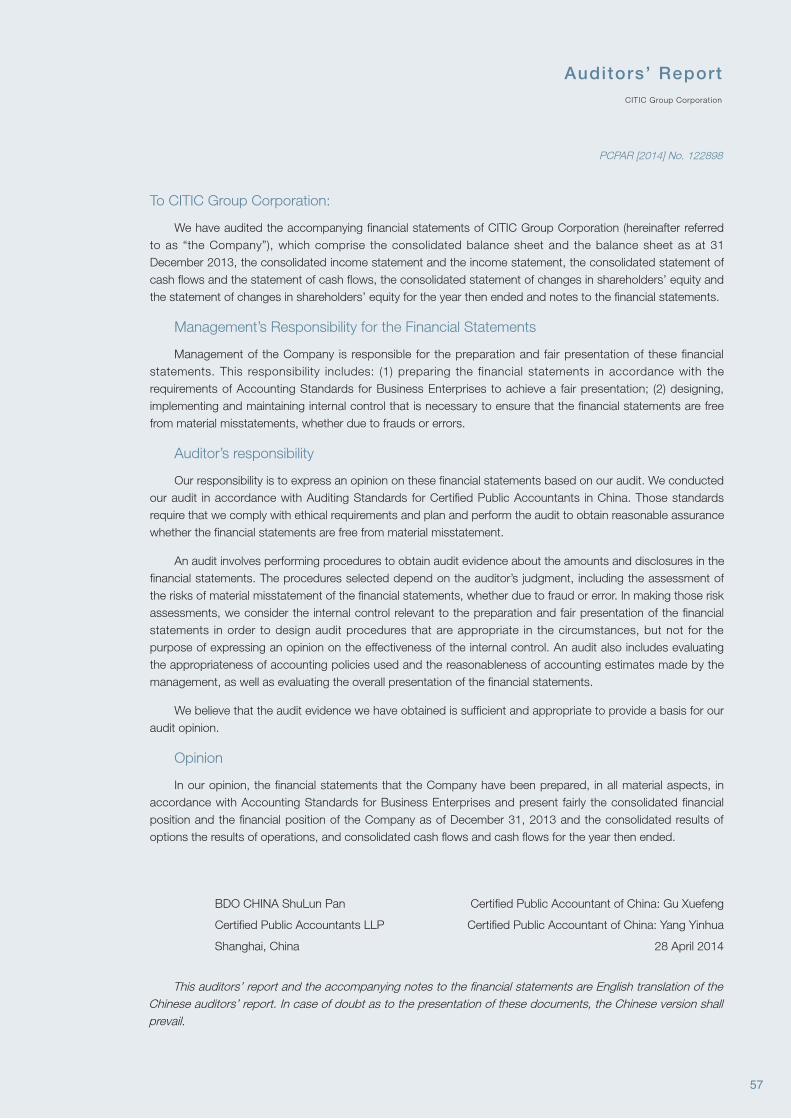
CITIC Group Corporation
Auditors’ Report
PCPAR [2014] No. 122898
To CITIC Group Corporation:
We have audited the accompanying fi nancial statements of CITIC Group Corporation (hereinafter referred to as “the Company”), which comprise the consolidated balance sheet and the balance sheet as at 31 December 2013, the consolidated income statement and the income statement, the consolidated statement of cash fl ows and the statement of cash fl ows, the consolidated statement of changes in shareholders’ equity and the statement of changes in shareholders’ equity for the year then ended and notes to the fi nancial statements.
Management’s Responsibility for the Financial Statements
Management of the Company is responsible for the preparation and fair presentation of these financial statements. This responsibility includes: (1) preparing the financial statements in accordance with the requirements of Accounting Standards for Business Enterprises to achieve a fair presentation; (2) designing, implementing and maintaining internal control that is necessary to ensure that the fi nancial statements are free from material misstatements, whether due to frauds or errors.
Auditor’s responsibility
Our responsibility is to express an opinion on these fi nancial statements based on our audit. We conducted our audit in accordance with Auditing Standards for Certifi ed Public Accountants in China. Those standards require that we comply with ethical requirements and plan and perform the audit to obtain reasonable assurance whether the fi nancial statements are free from material misstatement.
An audit involves performing procedures to obtain audit evidence about the amounts and disclosures in the fi nancial statements. The procedures selected depend on the auditor’s judgment, including the assessment of the risks of material misstatement of the fi nancial statements, whether due to fraud or error. In making those risk assessments, we consider the internal control relevant to the preparation and fair presentation of the fi nancial statements in order to design audit procedures that are appropriate in the circumstances, but not for the purpose of expressing an opinion on the effectiveness of the internal control. An audit also includes evaluating the appropriateness of accounting policies used and the reasonableness of accounting estimates made by the management, as well as evaluating the overall presentation of the fi nancial statements.
We believe that the audit evidence we have obtained is suffi cient and appropriate to provide a basis for our audit opinion.
Opinion
In our opinion, the fi nancial statements that the Company have been prepared, in all material aspects, in accordance with Accounting Standards for Business Enterprises and present fairly the consolidated fi nancial position and the fi nancial position of the Company as of December 31, 2013 and the consolidated results of options the results of operations, and consolidated cash fl ows and cash fl ows for the year then ended.
This auditors’ report and the accompanying notes to the fi nancial statements are English translation of the Chinese auditors’ report. In case of doubt as to the presentation of these documents, the Chinese version shall prevail.
BDO CHINA ShuLun Pan
Certifi ed Public Accountants LLP
Shanghai, China
Certifi ed Public Accountant of China: Gu Xuefeng
Certifi ed Public Accountant of China: Yang Yinhua
28 April 2014
57
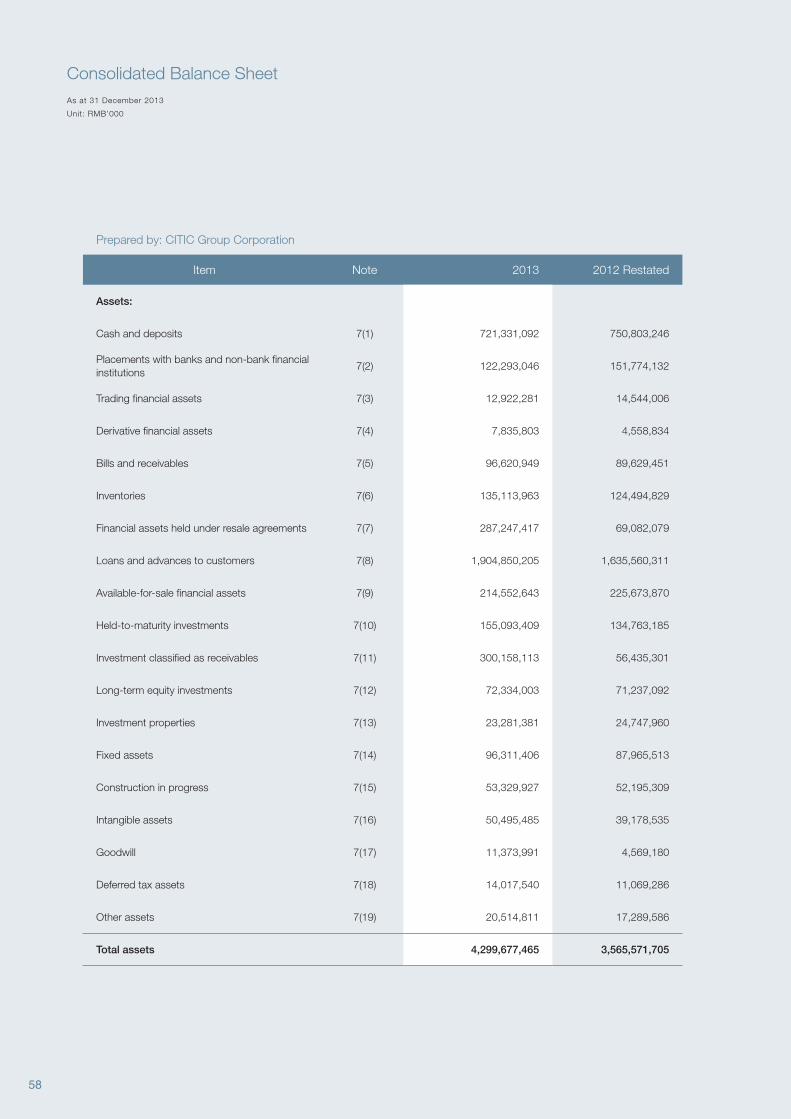
58
Prepared by: CITIC Group Corporation
Item Note 2013 2012 Restated
Assets:
Cash and deposits 7(1) 721,331,092 750,803,246
Placements with banks and non-bank financial institutions
7(2) 122,293,046 151,774,132
Trading financial assets 7(3) 12,922,281 14,544,006
Derivative financial assets 7(4) 7,835,803 4,558,834
Bills and receivables 7(5) 96,620,949 89,629,451
Inventories 7(6) 135,113,963 124,494,829
Financial assets held under resale agreements 7(7) 287,247,417 69,082,079
Loans and advances to customers 7(8) 1,904,850,205 1,635,560,311
Available-for-sale financial assets 7(9) 214,552,643 225,673,870
Held-to-maturity investments 7(10) 155,093,409 134,763,185
Investment classified as receivables 7(11) 300,158,113 56,435,301
Long-term equity investments 7(12) 72,334,003 71,237,092
Investment properties 7(13) 23,281,381 24,747,960
Fixed assets 7(14) 96,311,406 87,965,513
Construction in progress 7(15) 53,329,927 52,195,309
Intangible assets 7(16) 50,495,485 39,178,535
Goodwill 7(17) 11,373,991 4,569,180
Deferred tax assets 7(18) 14,017,540 11,069,286
Other assets 7(19) 20,514,811 17,289,586
Total assets 4,299,677,465 3,565,571,705
As at 31 December 2013
Unit: RMB’000
Consolidated Balance Sheet
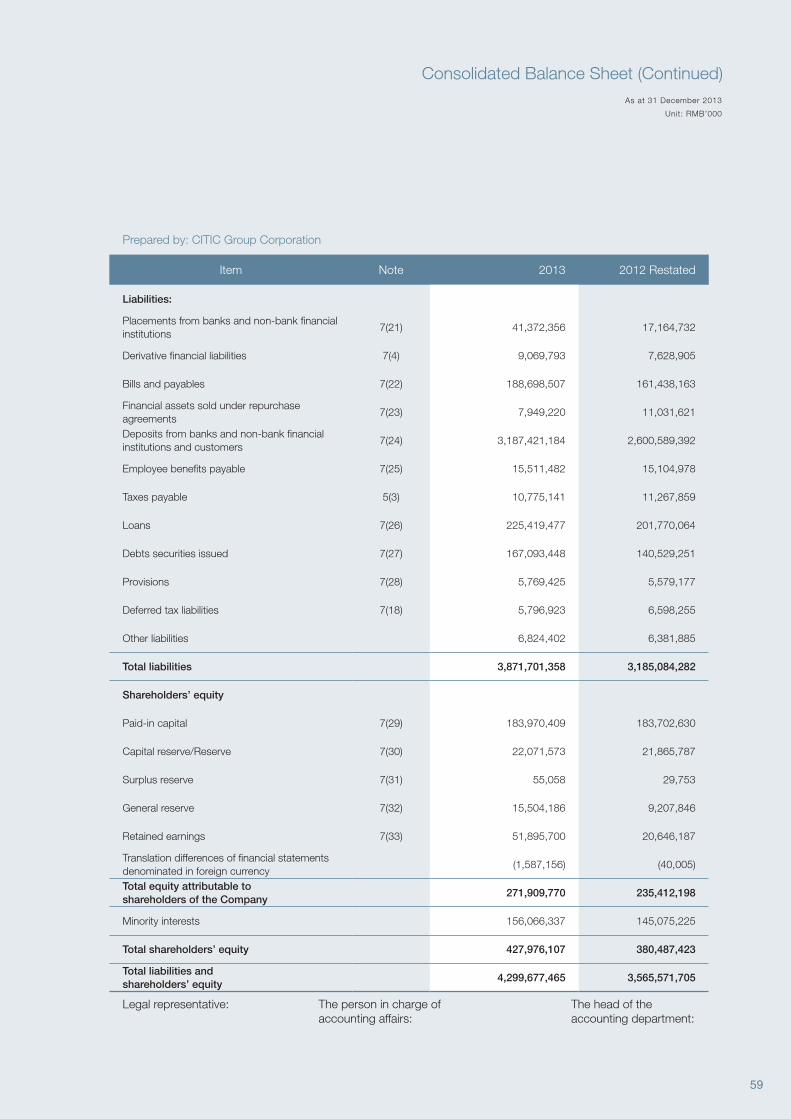
59
Prepared by: CITIC Group Corporation
Item Note 2013 2012 Restated
Liabilities:
Placements from banks and non-bank financial institutions
7(21) 41,372,356 17,164,732
Derivative financial liabilities 7(4) 9,069,793 7,628,905
Bills and payables 7(22) 188,698,507 161,438,163
Financial assets sold under repurchase agreements
7(23) 7,949,220 11,031,621
Deposits from banks and non-bank financial institutions and customers
7(24) 3,187,421,184 2,600,589,392
Employee benefits payable 7(25) 15,511,482 15,104,978
Taxes payable 5(3) 10,775,141 11,267,859
Loans 7(26) 225,419,477 201,770,064
Debts securities issued 7(27) 167,093,448 140,529,251
Provisions 7(28) 5,769,425 5,579,177
Deferred tax liabilities 7(18) 5,796,923 6,598,255
Other liabilities 6,824,402 6,381,885
Total liabilities 3,871,701,358 3,185,084,282
Shareholders’ equity
Paid-in capital 7(29) 183,970,409 183,702,630
Capital reserve/Reserve 7(30) 22,071,573 21,865,787
Surplus reserve 7(31) 55,058 29,753
General reserve 7(32) 15,504,186 9,207,846
Retained earnings 7(33) 51,895,700 20,646,187
Translation differences of financial statements denominated in foreign currency
(1,587,156) (40,005)
Total equity attributable to shareholders of the Company
271,909,770 235,412,198
Minority interests 156,066,337 145,075,225
Total shareholders’ equity 427,976,107 380,487,423
Total liabilities and shareholders’ equity
4,299,677,465 3,565,571,705
Legal representative: The person in charge of accounting affairs:
The head of the accounting department:
As at 31 December 2013
Unit: RMB’000
Consolidated Balance Sheet (Continued)
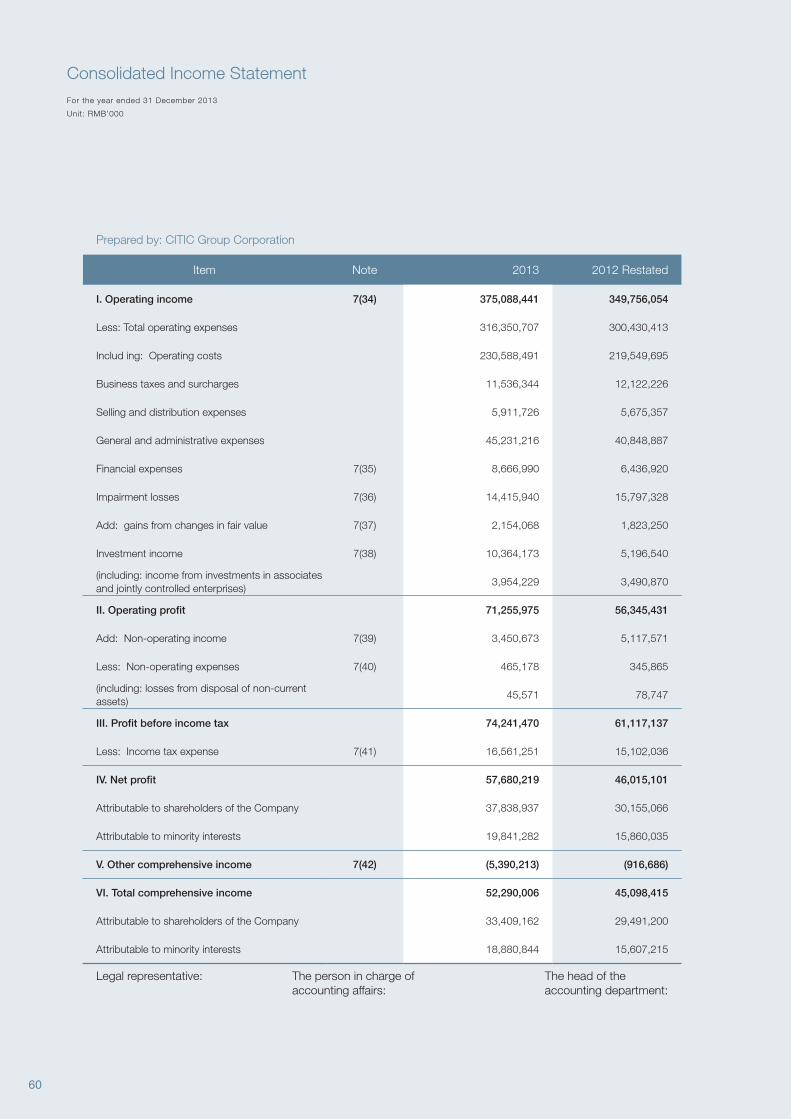
60
Prepared by: CITIC Group Corporation
Item Note 2013 2012 Restated
I. Operating income 7(34) 375,088,441 349,756,054
Less: Total operating expenses 316,350,707 300,430,413
Includ ing: Operating costs 230,588,491 219,549,695
Business taxes and surcharges 11,536,344 12,122,226
Selling and distribution expenses 5,911,726 5,675,357
General and administrative expenses 45,231,216 40,848,887
Financial expenses 7(35) 8,666,990 6,436,920
Impairment losses 7(36) 14,415,940 15,797,328
Add: gains from changes in fair value 7(37) 2,154,068 1,823,250
Investment income 7(38) 10,364,173 5,196,540
(including: income from investments in associates and jointly controlled enterprises)
3,954,229 3,490,870
II. Operating profit 71,255,975 56,345,431
Add: Non-operating income 7(39) 3,450,673 5,117,571
Less: Non-operating expenses 7(40) 465,178 345,865
(including: losses from disposal of non-current assets)
45,571 78,747
III. Profit before income tax 74,241,470 61,117,137
Less: Income tax expense 7(41) 16,561,251 15,102,036
IV. Net profit 57,680,219 46,015,101
Attributable to shareholders of the Company 37,838,937 30,155,066
Attributable to minority interests 19,841,282 15,860,035
V. Other comprehensive income 7(42) (5,390,213) (916,686)
VI. Total comprehensive income 52,290,006 45,098,415
Attributable to shareholders of the Company 33,409,162 29,491,200
Attributable to minority interests 18,880,844 15,607,215
Legal representative: The person in charge of accounting affairs:
The head of the accounting department:
For the year ended 31 December 2013
Unit: RMB’000
Consolidated Income Statement
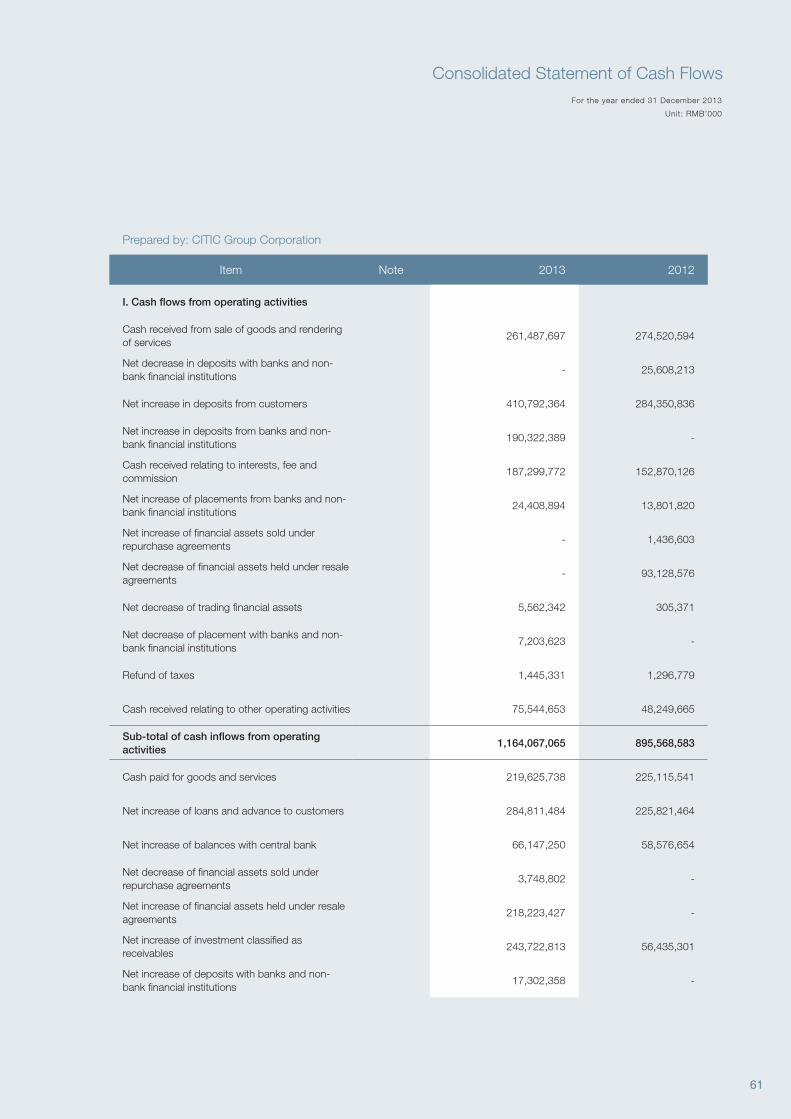
61
Prepared by: CITIC Group Corporation
Item Note 2013 2012
I. Cash flows from operating activities
Cash received from sale of goods and rendering of services
261,487,697 274,520,594
Net decrease in deposits with banks and non-bank financial institutions
- 25,608,213
Net increase in deposits from customers 410,792,364 284,350,836
Net increase in deposits from banks and non-bank financial institutions
190,322,389 -
Cash received relating to interests, fee and commission
187,299,772 152,870,126
Net increase of placements from banks and non-bank financial institutions
24,408,894 13,801,820
Net increase of financial assets sold under repurchase agreements
- 1,436,603
Net decrease of financial assets held under resale agreements
- 93,128,576
Net decrease of trading financial assets 5,562,342 305,371
Net decrease of placement with banks and non-bank financial institutions
7,203,623 -
Refund of taxes 1,445,331 1,296,779
Cash received relating to other operating activities 75,544,653 48,249,665
Sub-total of cash inflows from operating activities
1,164,067,065 895,568,583
Cash paid for goods and services 219,625,738 225,115,541
Net increase of loans and advance to customers 284,811,484 225,821,464
Net increase of balances with central bank 66,147,250 58,576,654
Net decrease of financial assets sold under repurchase agreements
3,748,802 -
Net increase of financial assets held under resale agreements
218,223,427 -
Net increase of investment classified as receivables
243,722,813 56,435,301
Net increase of deposits with banks and non-bank financial institutions
17,302,358 -
For the year ended 31 December 2013
Unit: RMB’000
Consolidated Statement of Cash Flows
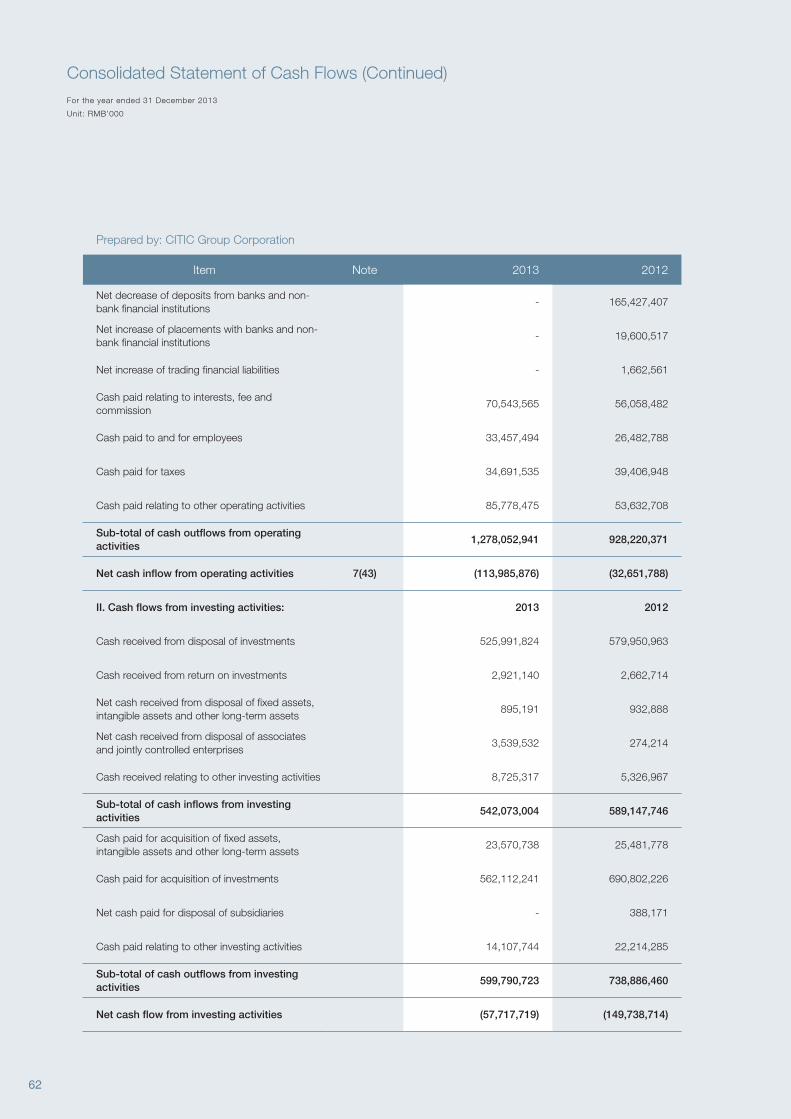
62
Prepared by: CITIC Group Corporation
Item Note 2013 2012
Net decrease of deposits from banks and non-bank financial institutions
- 165,427,407
Net increase of placements with banks and non-bank financial institutions
- 19,600,517
Net increase of trading financial liabilities - 1,662,561
Cash paid relating to interests, fee and commission
70,543,565 56,058,482
Cash paid to and for employees 33,457,494 26,482,788
Cash paid for taxes 34,691,535 39,406,948
Cash paid relating to other operating activities 85,778,475 53,632,708
Sub-total of cash outflows from operating activities
1,278,052,941 928,220,371
Net cash inflow from operating activities 7(43) (113,985,876) (32,651,788)
II. Cash flows from investing activities: 2013 2012
Cash received from disposal of investments 525,991,824 579,950,963
Cash received from return on investments 2,921,140 2,662,714
Net cash received from disposal of fixed assets, intangible assets and other long-term assets
895,191 932,888
Net cash received from disposal of associates and jointly controlled enterprises
3,539,532 274,214
Cash received relating to other investing activities 8,725,317 5,326,967
Sub-total of cash inflows from investing activities
542,073,004 589,147,746
Cash paid for acquisition of fixed assets, intangible assets and other long-term assets
23,570,738 25,481,778
Cash paid for acquisition of investments 562,112,241 690,802,226
Net cash paid for disposal of subsidiaries - 388,171
Cash paid relating to other investing activities 14,107,744 22,214,285
Sub-total of cash outflows from investing activities
599,790,723 738,886,460
Net cash flow from investing activities (57,717,719) (149,738,714)
For the year ended 31 December 2013
Unit: RMB’000
Consolidated Statement of Cash Flows (Continued)
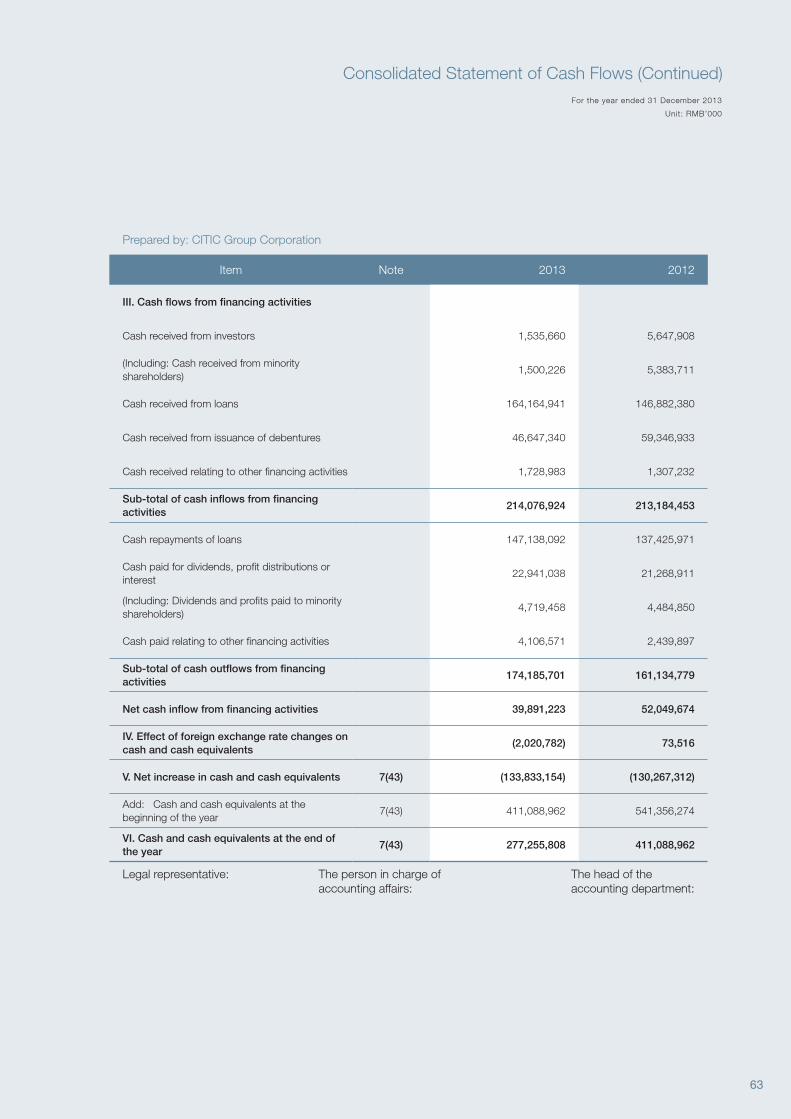
63
Prepared by: CITIC Group Corporation
Item Note 2013 2012
III. Cash flows from financing activities
Cash received from investors 1,535,660 5,647,908
(Including: Cash received from minority shareholders)
1,500,226 5,383,711
Cash received from loans 164,164,941 146,882,380
Cash received from issuance of debentures 46,647,340 59,346,933
Cash received relating to other financing activities 1,728,983 1,307,232
Sub-total of cash inflows from financing activities
214,076,924 213,184,453
Cash repayments of loans 147,138,092 137,425,971
Cash paid for dividends, profit distributions or interest
22,941,038 21,268,911
(Including: Dividends and profits paid to minority shareholders)
4,719,458 4,484,850
Cash paid relating to other financing activities 4,106,571 2,439,897
Sub-total of cash outflows from financing activities
174,185,701 161,134,779
Net cash inflow from financing activities 39,891,223 52,049,674
IV. Effect of foreign exchange rate changes on cash and cash equivalents
(2,020,782) 73,516
V. Net increase in cash and cash equivalents 7(43) (133,833,154) (130,267,312)
Add: Cash and cash equivalents at the beginning of the year
7(43) 411,088,962 541,356,274
VI. Cash and cash equivalents at the end of the year
7(43) 277,255,808 411,088,962
Legal representative: The person in charge of accounting affairs:
The head of the accounting department:
For the year ended 31 December 2013
Unit: RMB’000
Consolidated Statement of Cash Flows (Continued)
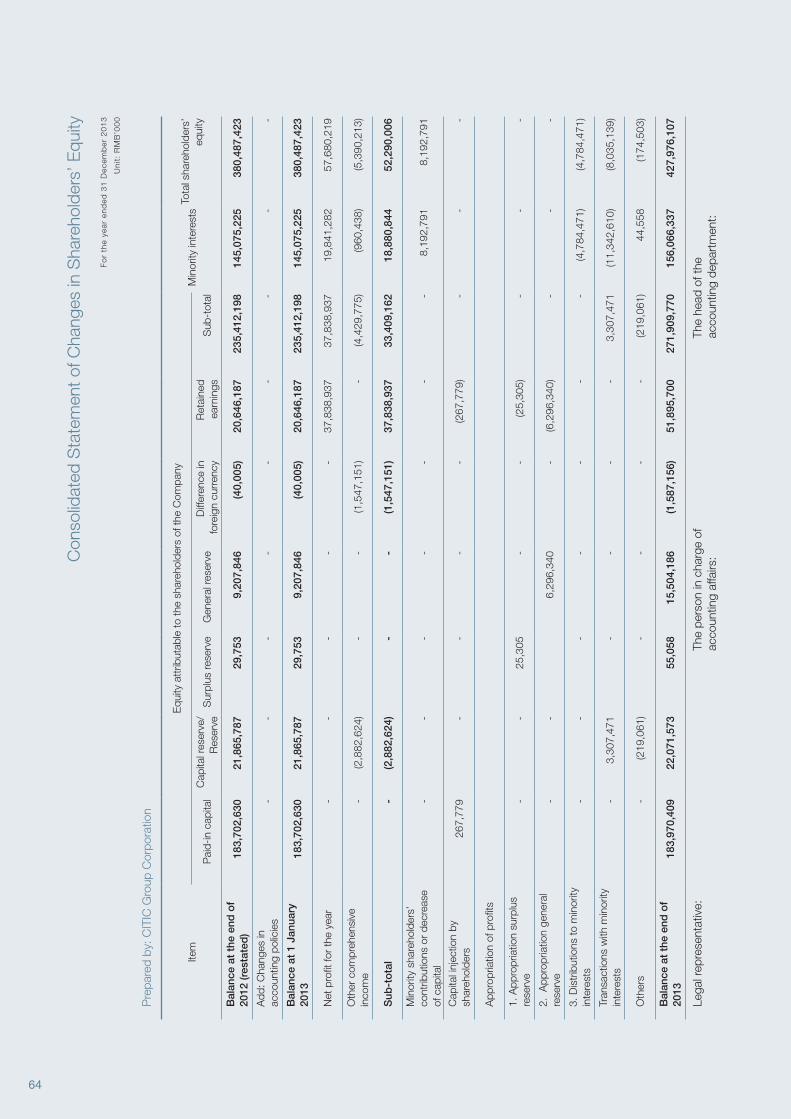
64
Pre
pare
d by
: CIT
IC G
roup
Cor
pora
tion
Item
Equ
ity a
ttrib
utab
le to
the
shar
ehol
ders
of t
he C
ompa
nyM
inor
ity in
tere
sts
Tota
l sha
reho
lder
s’
equi
tyP
aid-
in c
apita
lC
apita
l res
erve
/R
eser
veS
urpl
us re
serv
eG
ener
al re
serv
eD
iffer
ence
in
fore
ign
curr
ency
Ret
aine
d ea
rnin
gsS
ub-t
otal
Bal
ance
at
the
end
of
2012
(res
tate
d)
183,
702,
630
21,8
65,7
8729
,753
9,20
7,84
6(4
0,00
5)20
,646
,187
235,
412,
198
145,
075,
225
380,
487,
423
Add
: Cha
nges
in
acco
untin
g po
licie
s-
--
--
--
--
Bal
ance
at
1 Ja
nuar
y 20
1318
3,70
2,63
021
,865
,787
29,7
539,
207,
846
(40,
005)
20,6
46,1
8723
5,41
2,19
814
5,07
5,22
538
0,48
7,42
3
Net
pro
fit fo
r th
e ye
ar-
--
--
37,8
38,9
3737
,838
,937
19,8
41,2
8257
,680
,219
Oth
er c
ompr
ehen
sive
in
com
e-
(2,8
82,6
24)
--
(1,5
47,1
51)
- (4
,429
,775
) (9
60,4
38)
(5,3
90,2
13)
Sub
-to
tal
- (2
,882
,624
) -
-
(1
,547
,151
) 3
7,83
8,93
7 3
3,40
9,16
2 1
8,88
0,84
4 5
2,29
0,00
6
Min
ority
sha
reho
lder
s’
cont
ribut
ions
or
decr
ease
of
cap
ital
--
--
--
-8,
192,
791
8,19
2,79
1
Cap
ital i
njec
tion
by
shar
ehol
ders
267,
779
--
--
(267
,779
)-
--
App
ropr
iatio
n of
pro
fits
1. A
ppro
pria
tion
surp
lus
rese
rve
--
25,3
05-
-(2
5,30
5)-
--
2. A
ppro
pria
tion
gene
ral
rese
rve
--
6,29
6,34
0-
(6,2
96,3
40)
--
-
3. D
istr
ibut
ions
to m
inor
ity
inte
rest
s-
--
--
--
(4,7
84,4
71)
(4,7
84,4
71)
Tran
sact
ions
with
min
ority
in
tere
sts
-3,
307,
471
--
--
3,30
7,47
1(1
1,34
2,61
0)(8
,035
,139
)
Oth
ers
- (2
19,0
61)
--
--
(219
,061
) 44
,558
(1
74,5
03)
Bal
ance
at
the
end
of
2013
183,
970,
409
22,0
71,5
7355
,058
15,5
04,1
86(1
,587
,156
)51
,895
,700
271,
909,
770
156,
066,
337
427,
976,
107
Lega
l rep
rese
ntat
ive:
The
pers
on in
cha
rge
of
acco
untin
g af
fairs
:Th
e he
ad o
f the
ac
coun
ting
depa
rtm
ent:
Fo
r th
e ye
ar e
nd
ed 3
1 D
ecem
ber
20
13
Un
it:
RM
B’0
00
Con
solid
ated
Sta
tem
ent o
f Cha
nges
in S
hare
hold
ers’
Equ
ity
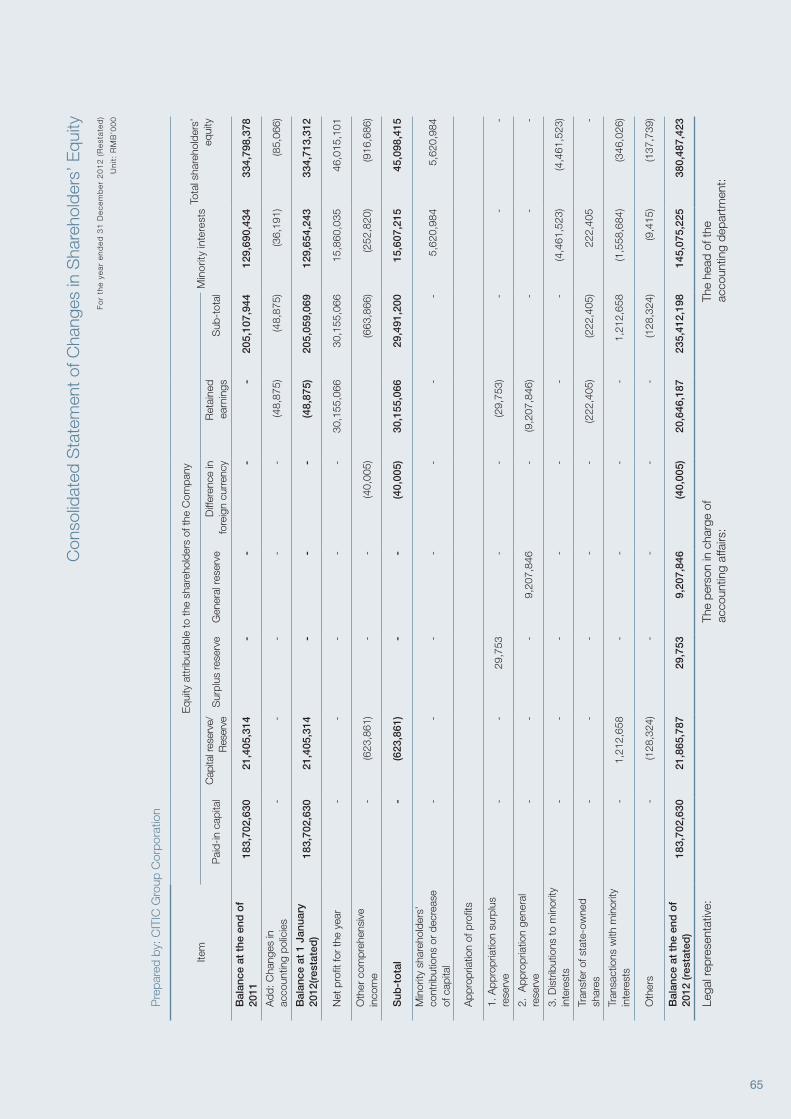
65
Pre
pare
d by
: CIT
IC G
roup
Cor
pora
tion
Item
Equ
ity a
ttrib
utab
le to
the
shar
ehol
ders
of t
he C
ompa
nyM
inor
ity in
tere
sts
Tota
l sha
reho
lder
s’
equi
tyP
aid-
in c
apita
lC
apita
l res
erve
/R
eser
veS
urpl
us re
serv
eG
ener
al re
serv
eD
iffer
ence
in
fore
ign
curr
ency
Ret
aine
d ea
rnin
gsS
ub-t
otal
Bal
ance
at
the
end
of
2011
183,
702,
630
21,4
05,3
14-
--
-20
5,10
7,94
412
9,69
0,43
433
4,79
8,37
8
Add
: Cha
nges
in
acco
untin
g po
licie
s-
--
--
(48,
875)
(48,
875)
(36,
191)
(85,
066)
Bal
ance
at
1 Ja
nuar
y 20
12(r
esta
ted
)18
3,70
2,63
021
,405
,314
--
-(4
8,87
5)20
5,05
9,06
912
9,65
4,24
333
4,71
3,31
2
Net
pro
fit fo
r th
e ye
ar-
--
--
30,1
55,0
66
30,1
55,0
66
15,8
60,0
35
46,0
15,1
01
Oth
er c
ompr
ehen
sive
in
com
e-
(623
,861
)-
-(4
0,00
5)
(663
,866
)(2
52,8
20)
(916
,686
)
Sub
-to
tal
-(6
23,8
61)
--
(40,
005)
30,1
55,0
66
29,4
91,2
00
15,6
07,2
15
45,0
98,4
15
Min
ority
sha
reho
lder
s’
cont
ribut
ions
or
decr
ease
of
cap
ital
--
--
--
-5,
620,
984
5,62
0,98
4
App
ropr
iatio
n of
pro
fits
1. A
ppro
pria
tion
surp
lus
rese
rve
--
29,7
53-
-(2
9,75
3)-
--
2. A
ppro
pria
tion
gene
ral
rese
rve
--
-9,
207,
846
-(9
,207
,846
)-
--
3. D
istr
ibut
ions
to m
inor
ity
inte
rest
s-
--
--
--
(4,4
61,5
23)
(4,4
61,5
23)
Tran
sfer
of s
tate
-ow
ned
shar
es-
--
--
(222
,405
)(2
22,4
05)
222,
405
-
Tran
sact
ions
with
min
ority
in
tere
sts
-1,
212,
658
--
--
1,21
2,65
8(1
,558
,684
)(3
46,0
26)
Oth
ers
-(1
28,3
24)
--
--
(128
,324
)(9
,415
)(1
37,7
39)
Bal
ance
at
the
end
of
2012
(res
tate
d)
183,
702,
630
21,8
65,7
8729
,753
9,20
7,84
6(4
0,00
5)20
,646
,187
235,
412,
198
145,
075,
225
380,
487,
423
Lega
l rep
rese
ntat
ive:
The
pers
on in
cha
rge
of
acco
untin
g af
fairs
:Th
e he
ad o
f the
ac
coun
ting
depa
rtm
ent:
Fo
r th
e ye
ar e
nd
ed 3
1 D
ecem
ber
20
12
(R
esta
ted
)
Un
it:
RM
B’0
00
Con
solid
ated
Sta
tem
ent o
f Cha
nges
in S
hare
hold
ers’
Equ
ity
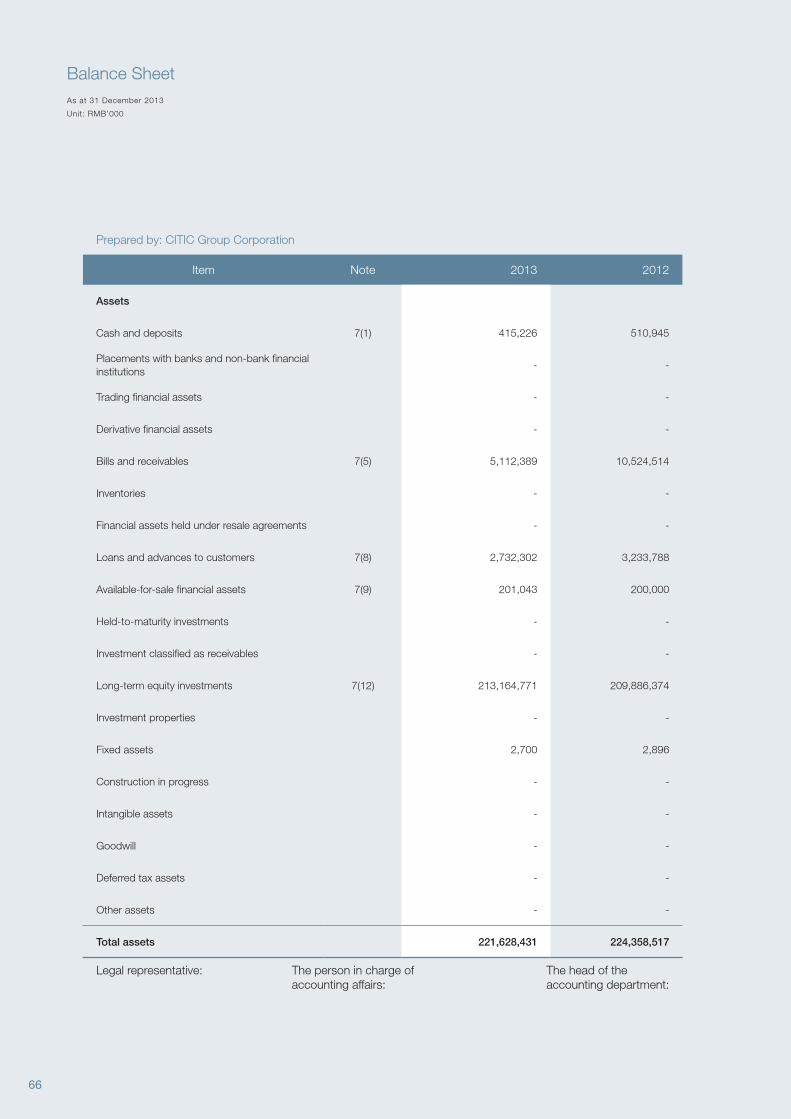
66
Prepared by: CITIC Group Corporation
Item Note 2013 2012
Assets
Cash and deposits 7(1) 415,226 510,945
Placements with banks and non-bank financial institutions
- -
Trading financial assets - -
Derivative financial assets - -
Bills and receivables 7(5) 5,112,389 10,524,514
Inventories - -
Financial assets held under resale agreements - -
Loans and advances to customers 7(8) 2,732,302 3,233,788
Available-for-sale financial assets 7(9) 201,043 200,000
Held-to-maturity investments - -
Investment classified as receivables - -
Long-term equity investments 7(12) 213,164,771 209,886,374
Investment properties - -
Fixed assets 2,700 2,896
Construction in progress - -
Intangible assets - -
Goodwill - -
Deferred tax assets - -
Other assets - -
Total assets 221,628,431 224,358,517
Legal representative: The person in charge of accounting affairs:
The head of the accounting department:
As at 31 December 2013
Unit: RMB’000
Balance Sheet
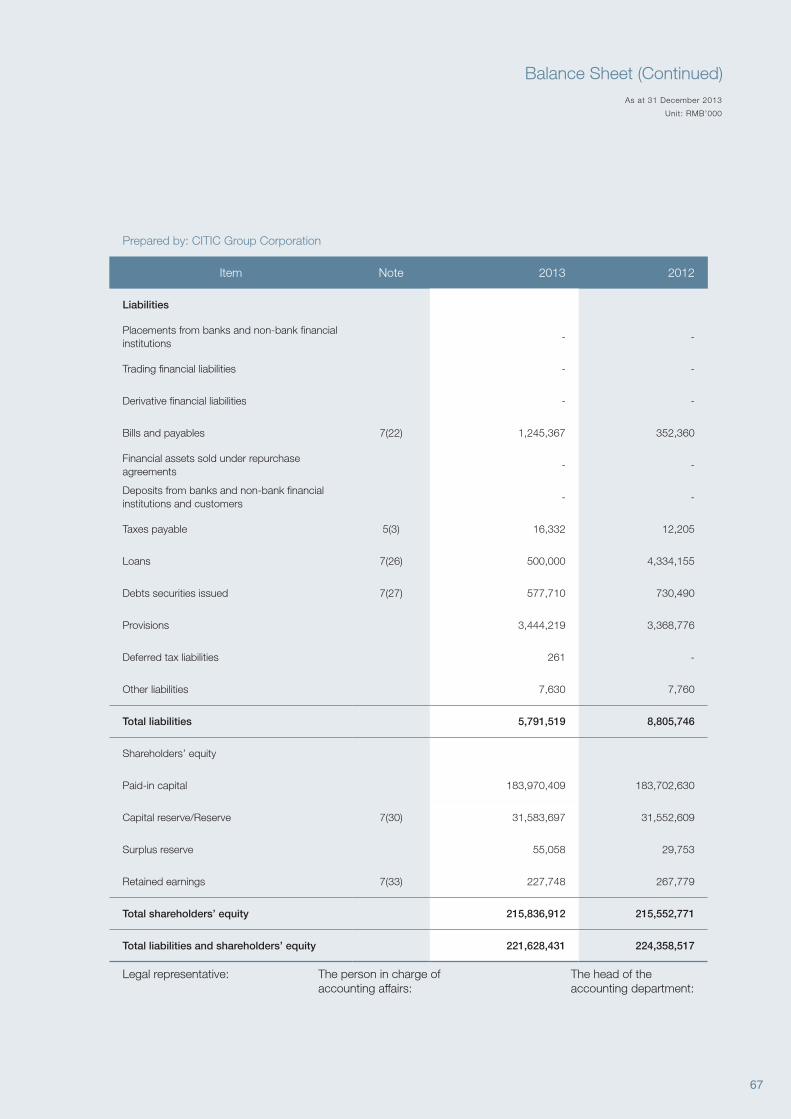
67
Prepared by: CITIC Group Corporation
Item Note 2013 2012
Liabilities
Placements from banks and non-bank financial institutions
- -
Trading financial liabilities - -
Derivative financial liabilities - -
Bills and payables 7(22) 1,245,367 352,360
Financial assets sold under repurchase agreements
- -
Deposits from banks and non-bank financial institutions and customers
- -
Taxes payable 5(3) 16,332 12,205
Loans 7(26) 500,000 4,334,155
Debts securities issued 7(27) 577,710 730,490
Provisions 3,444,219 3,368,776
Deferred tax liabilities 261 -
Other liabilities 7,630 7,760
Total liabilities 5,791,519 8,805,746
Shareholders’ equity
Paid-in capital 183,970,409 183,702,630
Capital reserve/Reserve 7(30) 31,583,697 31,552,609
Surplus reserve 55,058 29,753
Retained earnings 7(33) 227,748 267,779
Total shareholders’ equity 215,836,912 215,552,771
Total liabilities and shareholders’ equity 221,628,431 224,358,517
Legal representative: The person in charge of accounting affairs:
The head of the accounting department:
As at 31 December 2013
Unit: RMB’000
Balance Sheet (Continued)
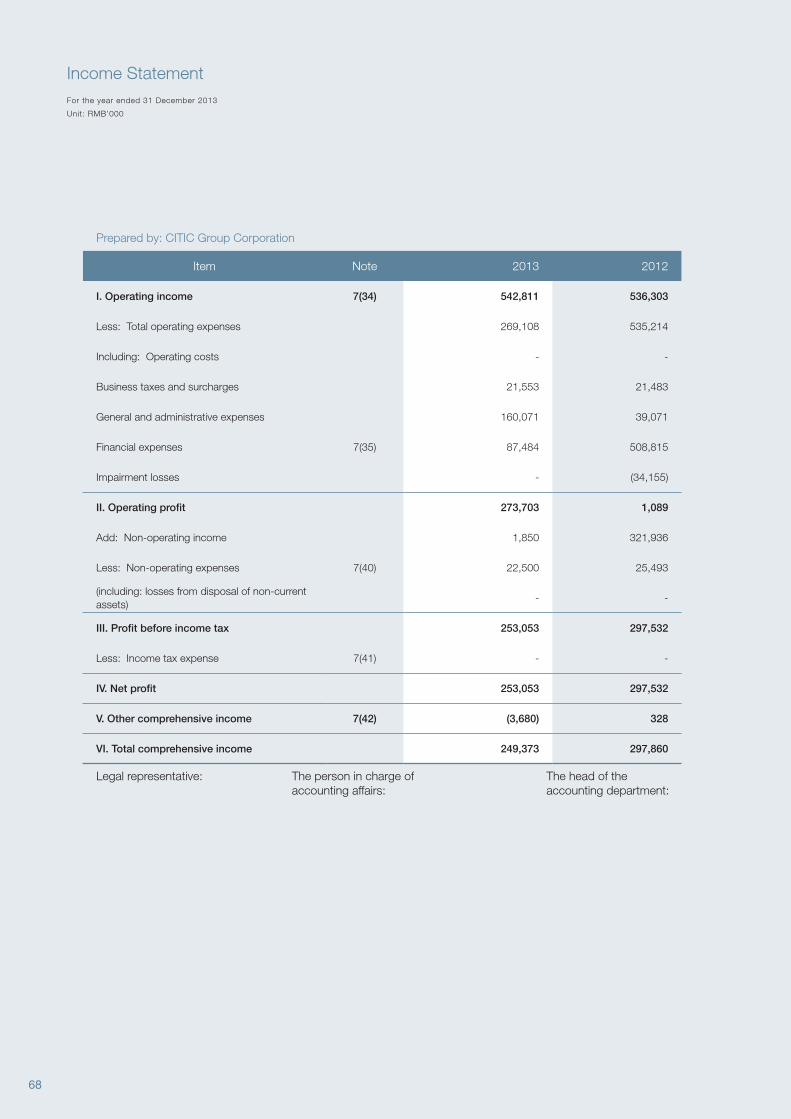
68
Prepared by: CITIC Group Corporation
Item Note 2013 2012
I. Operating income 7(34) 542,811 536,303
Less: Total operating expenses 269,108 535,214
Including: Operating costs - -
Business taxes and surcharges 21,553 21,483
General and administrative expenses 160,071 39,071
Financial expenses 7(35) 87,484 508,815
Impairment losses - (34,155)
II. Operating profit 273,703 1,089
Add: Non-operating income 1,850 321,936
Less: Non-operating expenses 7(40) 22,500 25,493
(including: losses from disposal of non-current assets)
- -
III. Profit before income tax 253,053 297,532
Less: Income tax expense 7(41) - -
IV. Net profit 253,053 297,532
V. Other comprehensive income 7(42) (3,680) 328
VI. Total comprehensive income 249,373 297,860
Legal representative: The person in charge of accounting affairs:
The head of the accounting department:
For the year ended 31 December 2013
Unit: RMB’000
Income Statement
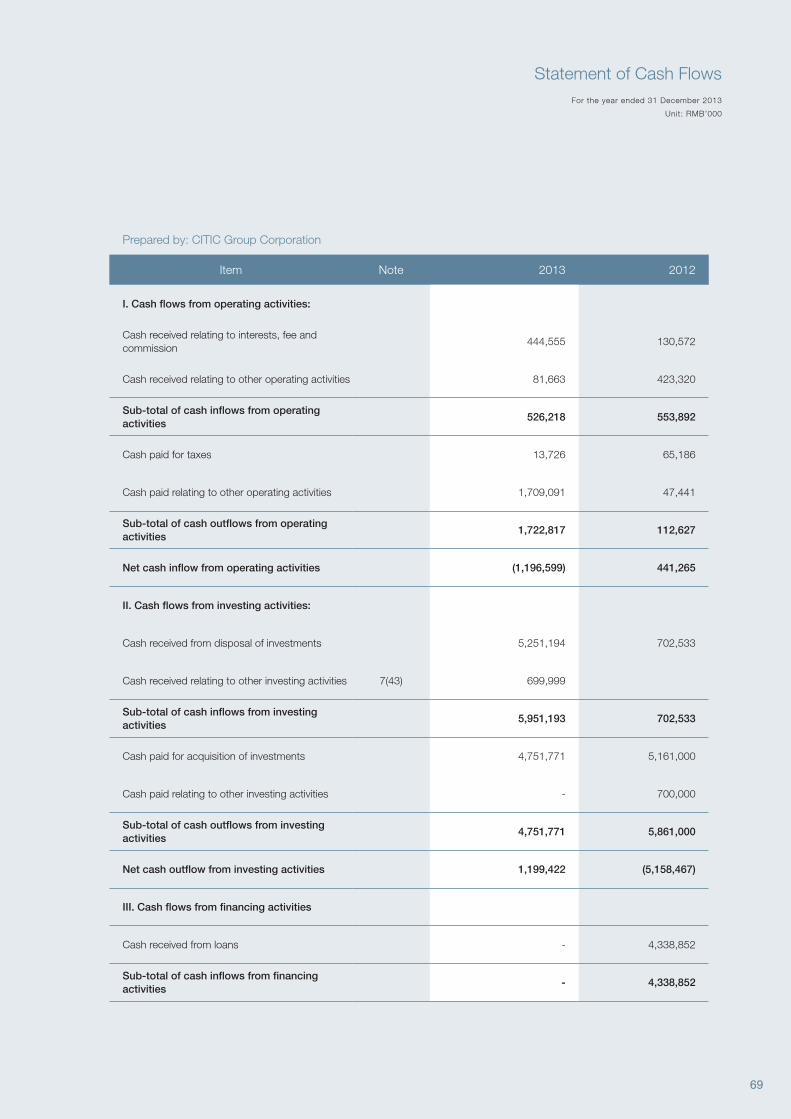
69
Prepared by: CITIC Group Corporation
Item Note 2013 2012
I. Cash flows from operating activities:
Cash received relating to interests, fee and commission
444,555 130,572
Cash received relating to other operating activities 81,663 423,320
Sub-total of cash inflows from operating activities
526,218 553,892
Cash paid for taxes 13,726 65,186
Cash paid relating to other operating activities 1,709,091 47,441
Sub-total of cash outflows from operating activities
1,722,817 112,627
Net cash inflow from operating activities (1,196,599) 441,265
II. Cash flows from investing activities:
Cash received from disposal of investments 5,251,194 702,533
Cash received relating to other investing activities 7(43) 699,999
Sub-total of cash inflows from investing activities
5,951,193 702,533
Cash paid for acquisition of investments 4,751,771 5,161,000
Cash paid relating to other investing activities - 700,000
Sub-total of cash outflows from investing activities
4,751,771 5,861,000
Net cash outflow from investing activities 1,199,422 (5,158,467)
III. Cash flows from financing activities
Cash received from loans - 4,338,852
Sub-total of cash inflows from financing activities
- 4,338,852
For the year ended 31 December 2013
Unit: RMB’000
Statement of Cash Flows
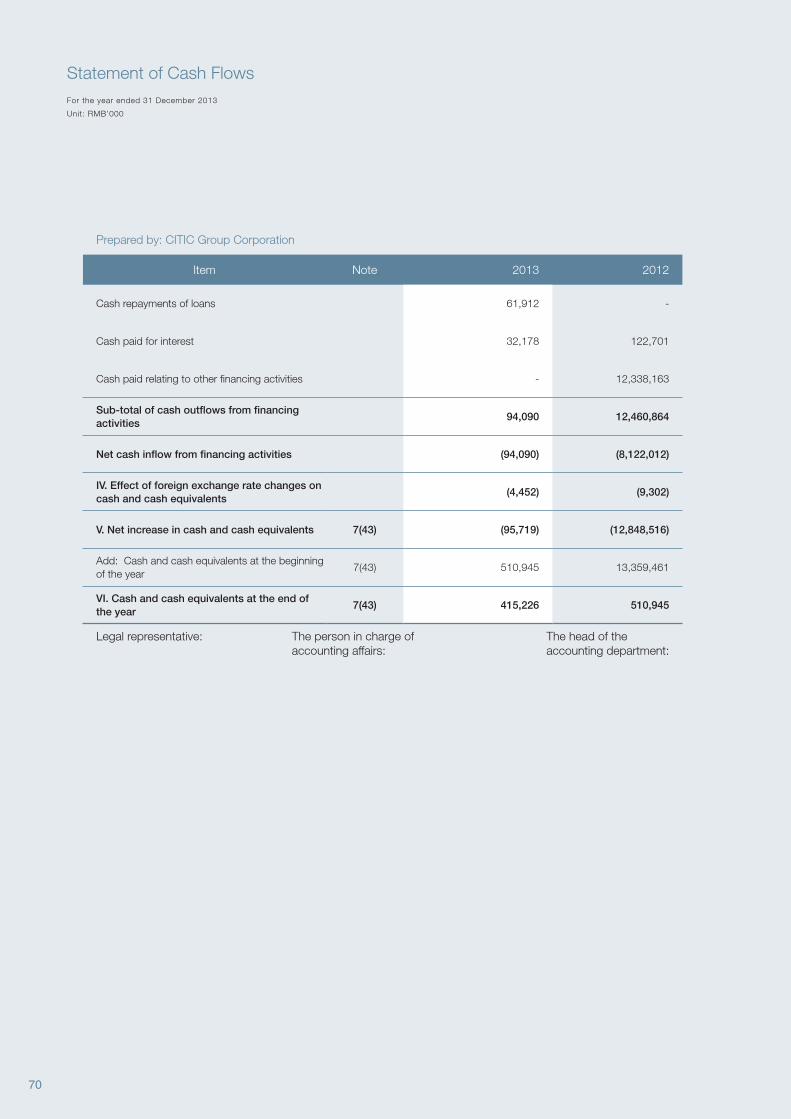
70
Prepared by: CITIC Group Corporation
Item Note 2013 2012
Cash repayments of loans 61,912 -
Cash paid for interest 32,178 122,701
Cash paid relating to other financing activities - 12,338,163
Sub-total of cash outflows from financing activities
94,090 12,460,864
Net cash inflow from financing activities (94,090) (8,122,012)
IV. Effect of foreign exchange rate changes on cash and cash equivalents
(4,452) (9,302)
V. Net increase in cash and cash equivalents 7(43) (95,719) (12,848,516)
Add: Cash and cash equivalents at the beginning of the year
7(43) 510,945 13,359,461
VI. Cash and cash equivalents at the end of the year
7(43) 415,226 510,945
Legal representative: The person in charge of accounting affairs:
The head of the accounting department:
For the year ended 31 December 2013
Unit: RMB’000
Statement of Cash Flows
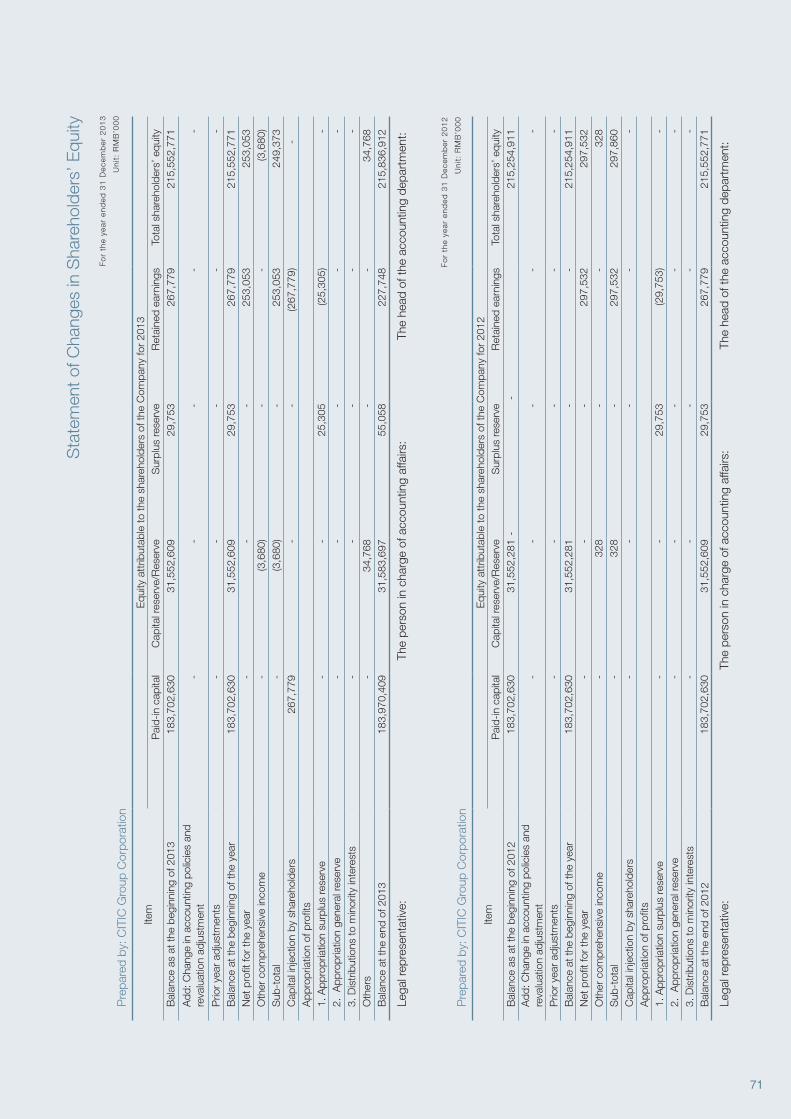
71
Pre
pare
d by
: CIT
IC G
roup
Cor
pora
tion
Item
Equ
ity a
ttrib
utab
le to
the
shar
ehol
ders
of t
he C
ompa
ny fo
r 20
13P
aid-
in c
apita
lC
apita
l res
erve
/Res
erve
Sur
plus
rese
rve
Ret
aine
d ea
rnin
gsTo
tal s
hare
hold
ers’
equ
ityB
alan
ce a
s at
the
begi
nnin
g of
201
318
3,70
2,63
031
,552
,609
29,7
5326
7,77
921
5,55
2,77
1
Add
: Cha
nge
in a
ccou
ntin
g po
licie
s an
d re
valu
atio
n ad
just
men
t-
--
--
Prio
r ye
ar a
djus
tmen
ts-
--
--
Bal
ance
at t
he b
egin
ning
of t
he y
ear
183,
702,
630
31,5
52,6
0929
,753
267,
779
215,
552,
771
Net
pro
fit fo
r th
e ye
ar-
--
253,
053
253,
053
Oth
er c
ompr
ehen
sive
inco
me
-(3
,680
)-
-(3
,680
)S
ub-t
otal
-(3
,680
)-
253,
053
249,
373
Cap
ital i
njec
tion
by s
hare
hold
ers
267,
779
--
(267
,779
)-
App
ropr
iatio
n of
pro
fits
1. A
ppro
pria
tion
surp
lus
rese
rve
--
25,3
05(2
5,30
5)-
2. A
ppro
pria
tion
gene
ral r
eser
ve-
--
--
3. D
istr
ibut
ions
to m
inor
ity in
tere
sts
--
--
-O
ther
s-
34,7
68-
-34
,768
Bal
ance
at t
he e
nd o
f 201
318
3,97
0,40
931
,583
,697
55,0
5822
7,74
821
5,83
6,91
2
Lega
l rep
rese
ntat
ive:
The
pers
on in
cha
rge
of a
ccou
ntin
g af
fairs
:Th
e he
ad o
f the
acc
ount
ing
depa
rtm
ent:
Pre
pare
d by
: CIT
IC G
roup
Cor
pora
tion
Item
Equ
ity a
ttrib
utab
le to
the
shar
ehol
ders
of t
he C
ompa
ny fo
r 20
12P
aid-
in c
apita
lC
apita
l res
erve
/Res
erve
Sur
plus
rese
rve
Ret
aine
d ea
rnin
gsTo
tal s
hare
hold
ers’
equ
ityB
alan
ce a
s at
the
begi
nnin
g of
201
218
3,70
2,63
031
,552
,281
--
215,
254,
911
Add
: Cha
nge
in a
ccou
ntin
g po
licie
s an
d re
valu
atio
n ad
just
men
t-
--
--
Prio
r ye
ar a
djus
tmen
ts-
--
--
Bal
ance
at t
he b
egin
ning
of t
he y
ear
183,
702,
630
31,5
52,2
81-
-21
5,25
4,91
1N
et p
rofit
for
the
year
--
-29
7,53
229
7,53
2O
ther
com
preh
ensi
ve in
com
e-
328
--
328
Sub
-tot
al-
328
-29
7,53
229
7,86
0C
apita
l inj
ectio
n by
sha
reho
lder
s-
--
--
App
ropr
iatio
n of
pro
fits
1. A
ppro
pria
tion
surp
lus
rese
rve
--
29,7
53(2
9,75
3)-
2. A
ppro
pria
tion
gene
ral r
eser
ve-
--
--
3. D
istr
ibut
ions
to m
inor
ity in
tere
sts
--
--
-B
alan
ce a
t the
end
of 2
012
183,
702,
630
31,5
52,6
0929
,753
267,
779
215,
552,
771
Lega
l rep
rese
ntat
ive:
The
pers
on in
cha
rge
of a
ccou
ntin
g af
fairs
:Th
e he
ad o
f the
acc
ount
ing
depa
rtm
ent:
Fo
r th
e ye
ar e
nd
ed 3
1 D
ecem
ber
20
13
Un
it:
RM
B’0
00
Fo
r th
e ye
ar e
nd
ed 3
1 D
ecem
ber
20
12
Un
it:
RM
B’0
00
Sta
tem
ent o
f Cha
nges
in S
hare
hold
ers’
Equ
ity
72
CITIC Group CorporationNotes to the Financial Statements
(Expressed in Renminbi’000 unless otherwise stated)
1. Company profile
CITIC Group is a multi-business group company, established upon the approval of the State Council of the
People’s Republic of China (“PRC”). In 2011, CITIC Group was wholly restructured and renamed as CITIC Group
Corporation (“the Company”). On behalf of the State Council, the Ministry of Finance (“MOF”) of PRC took the
responsibilities of investor and is the sole shareholder of the Company. On 27 December 2011, the Company
obtained the new business license (No.100000000000895 (4-4)) and its registered address is 6 Xinyuannanlu,
Chaoyang District, Beijing.
According to the resolution of the fifth meeting of the first session of the Board of Directors of the Company
and the Approval of MOF on Issues Concerning the Appropriation of profits of CITIC Group Corporation for
2012 (Cai Jin Han [2013] No. 42), the Company transferred retained profit of RMB 267,778,771.84 into paid-
up capital, the basis date of which was 23 May 2013. The above-mentioned transfer was verified by Zhongjia
Youyi Accounting Firm Co., Ltd. with a capital verification report (Zhong Jia You Yi Yan Zi [2013] No. 10)
issued on 19 June 2013. The accumulated paid-up capital of the Company after such transfer was RMB
183,970,408,771.84.
The principal activities of the Company and its subsidiaries (together referred to as “the Group”) are financial
services, real estate and infrastructure, engineering contracting, resources and energy, manufacturing and other
services.
2. Basis of preparation
The financial statements have been prepared in accordance with the requirements of Accounting Standards for
Business Enterprises – Basic Standard and 38 Special Standards issued by the MOF of the PRC on 15 February
2006, and application guidance, interpretation and other relevant accounting regulations issued subsequently
(collectively referred to as “Accounting Standards for Business Enterprises”).
3. Statement of compliance with Accounting Standards for Business Enterprises
The financial statements have been prepared in accordance with the requirements of Accounting Standards for
Business Enterprises, and truly and completely reflect the consolidated financial position and the financial position of
the Group on 31 December 2013 and the consolidated results of options the results of operations, the consolidated
cash flows and the cash flows for the year then ended.
4. Principal accounting policies and estimates
(1) Accounting year
Thee accounting year of the Group is from 1 January to 31 December in calendar year.
(2) Measurement basis
FOR THE YEAR ENDED 31 DECEMBER 2013
EXPRESSED IN RENMINBI’ 000
NOTES TO THE FINANCIAL STATEMENTSOF CITIC GROUP CORPORATION
73
The measurement basis used in the preparation of the financial statements is the historical cost basis, except
for the assets and liabilities set out below:
-- Financial assets and financial liabilities designated at fair value through profit or loss (including trading financial
assets or trading financial liabilities)(see Note 4(15))
-- Available-for-sale financial assets (see Note 4(15))
-- Investment properties (see Note 4(9))
(3) Functional currency and presentation currency
The Company’s functional currency is Renminbi and these financial statements are presented in Renminbi.
Functional currency is determined by the Company and its subsidiaries on the basis of the currency in which major
income and costs are denominated and settled. The Company translates the financial statements of subsidiaries
from their respective functional currencies into the Company’s functional currency (see Note4 (5)) if the subsidiaries’
functional currencies are not the same as that of the Company.
(4) Business combinations and consolidated financial statements
(a) Business combinations under common control
A business combination under common control is a business combination in which all of the combining
enterprises are ultimately controlled by the same party or parties both before and after the business combination,
and that control is not transitory. The assets and liabilities obtained are measured at the carrying amounts as
recorded by the enterprise being combined on the combination date. The difference between the carrying amount
of the net assets obtained and the carrying amount of consideration paid for the combination (or the total face value
of shares issued) is adjusted to the capital premium in the capital reserve. If the balance of the capital premium is
insufficient, any excess is adjusted to retained earnings. Any costs directly attributable to the combination shall be
recognized in profit or loss for the current period when occurred. The e combination date is the date on which one
combining enterprise effectively obtains control of the other combining enterprises.
(b) Business combinations not under common control
A business combination not under common control is a business combination in which all of the combining
enterprises are not ultimately controlled by the same party or parties both before and after the business combination.
Where 1) the aggregate of the fair value on the acquisition date of assets transferred (including the acquirer’s
previously held equity interest in the acquiree), liabilities incurred or assumed, and equity securities issued by the
acquirer, in exchange for control of the acquiree, exceeds 2) the acquirer’s interest in the fair value on the acquisition
date of the acquiree’s identifiable net assets, the difference is recognized as goodwill. Where 1) is less than 2), the
difference is recognized in profit or loss for the current period. The costs of the issuance of equity or debt securities
as a part of the consideration paid for the acquisition are included as a part of initial recognition amount of the equity
or debt securities. Other acquisition-related costs arising from the business combination are recognized as expenses
in the periods in which the costs are incurred. The difference between the fair value and the carrying amount of the
assets transferred is recognized in profit or loss. The acquiree’s identifiable asset, liabilities and contingent liabilities,
FOR THE YEAR ENDED 31 DECEMBER 2013
EXPRESSED IN RENMINBI’ 000
NOTES TO THE FINANCIAL STATEMENTSOF CITIC GROUP CORPORATION
74
if satisfying the recognition criteria, are recognized by the Group at their fair value on the acquisition date. The
acquisition date is the date on which the acquirer effectively obtains control of the acquiree.
(c) Consolidated financial statements
The scope of consolidated financial statements is based on control and the consolidated financial statements
comprise the Company and its subsidiaries. Control is the power to govern the financial and operating policies of an
enterprise so as to obtain benefits from its operating activities. In assessing control, potential voting rights, such as
warrants and convertible bonds, which are currently exercisable or convertible, are taken into account. The financial
position, financial performance and cash flows of subsidiaries are included in the consolidated financial statements
from the date that control commences until the date that control ceases.
Where a subsidiary was acquired during the reporting period, through a business combination under common
control, the financial statements of the subsidiary are included in the consolidated financial statements as if the
combination had occurred on the date that the ultimate controlling party first obtained control. The opening balances
and the comparative Figures of the consolidated financial statements are also restated. In the preparation of the
consolidated financial statements, the subsidiary’s assets and liabilities based on their carrying amounts are included
in the consolidated balance sheet, and financial performance is included in the consolidated income statement,
respectively, from the date that the ultimate parent company of the Company obtains the control of the subsidiary to
be consolidated.
Where a subsidiary was acquired during the reporting period, through a business combination not under
common control, the identifiable assets and liabilities of the acquired subsidiaries are included in the scope of
consolidation from the date that control commences, based on the fair value of those identifiable assets and liabilities
on the acquisition date. For a business combination not under common control and achieved in stages, the Group
re-measures its previously-held equity interest in the acquiree to its fair value on the acquisition date. The difference
between the fair value and the carrying amount is recognized as investment income for the current period; the
amount recognized in other comprehensive income relating to the previously-held equity interest in the acquiree is
reclassified as investment income for the current period.
Minority interest is presented separately in the consolidated balance sheet within shareholders’ equity. Net profit
or loss attributable to minority shareholders is presented separately in the consolidated income statement under
the net profit line item. Comprehensive income attributable to minority shareholders is presented separately in the
consolidated income statement under the total comprehensive income line item.
When the amount of loss for the current period attributable to the minority shareholders of a subsidiary exceeds
the minority shareholders’ portion of the opening balance of shareholders’ equity of the subsidiary, the excess is
allocated against the minority interests.
When the accounting period or accounting policies of a subsidiary are different from those of the Company, the
Company makes necessary adjustments to the financial statements of the subsidiary based on the Company’s own
accounting period or accounting policies. Intra-group balances and transactions, and any unrealized profit or loss
arising from intra-group transactions, are eliminated in preparing the consolidated financial statements. Unrealized
FOR THE YEAR ENDED 31 DECEMBER 2013
EXPRESSED IN RENMINBI’ 000
NOTES TO THE FINANCIAL STATEMENTSOF CITIC GROUP CORPORATION
75
losses resulting from intra-group transactions are eliminated in the same way as unrealized gains, but only to the
extent that there is no evidence of impairment.
(5) Translation of foreign currencies
The foreign currency transactions of Group are, on initial recognition, translated to Renminbi at the spot
exchange rates the dates of the transactions. A spot exchange rate is an exchange rate quoted by the People’s
Bank of China.
Monetary items denominated in foreign currencies are translated to Renminbi at the spot exchange rate on the
balance sheet date. The resulting exchange differences, except for those arising from the principal and interest of
specific foreign currency borrowings for the purpose of acquisition, construction or production of qualifying assets
(see Note 4(21)), are recognized in profit or loss. Nonmonetary items denominated in foreign currencies that are
measured at historical cost are translated to Renminbi using the foreign exchange rate on the transaction date. Non-
monetary items denominated in foreign currencies that are measured at fair value are translated using the foreign
exchange rate on the date the fair value is determined; the resulting exchange differences are recognized in profit or
loss, except for the differences arising from the translation of available-for-sale financial assets, which are recognized
as other comprehensive income in capital reserve.
The assets and liabilities of foreign operations are translated to Renminbi at the spot exchange rate on the
balance sheet date. The equity items, excluding “Retained earnings”, are translated to Renminbi at the spot
exchange rates on the transaction dates. The income and expenses of foreign operations are translated to
Renminbi at the spot exchange rates on the transaction dates. The resulting translation differences are recognized
in shareholders’ equity. Upon disposal of a foreign operation, the cumulative amount of the translation differences
recognized in shareholders’ equity which relates to that foreign operation is transferred to profit or loss in the period
in which the disposal occurs.
(6) Cash and cash equivalents
Cash and cash equivalents comprise cash on hand, demand deposits, and short-term, highly liquid investments,
which are readily convertible into known amounts of cash and are subject to an insignificant risk of change in value.
(7) Inventories
Inventories are initially measured at cost. Cost of inventories comprises all costs of purchase, costs of
conversion and other expenditures incurred in bringing the inventories to their present location and condition.
Borrowing costs directly related to the production of qualifying inventories are also included in the cost of inventories
(see Note 4(21)). Cost of inventories is calculated using appropriate method according to actual situation. In addition
to the purchasing cost of raw materials, work in progress and finished goods include direct labor costs and an
appropriate allocation of production overheads.
On the balance sheet date, inventories are carried at the lower of cost and net realizable value.
Any excess of the cost over the net realizable value of each item of inventories is recognized as a provision for
diminution in the value of inventories. Net realizable value is the estimated selling price in the ordinary course of business
less the estimated costs of completion and the estimated costs necessary to make the sale and relevant taxes.
FOR THE YEAR ENDED 31 DECEMBER 2013
EXPRESSED IN RENMINBI’ 000
NOTES TO THE FINANCIAL STATEMENTSOF CITIC GROUP CORPORATION
76
(8) Long-term equity investments
(a) Investments in subsidiaries
In the Group’s consolidated financial statements, investments in subsidiaries are accounted for in accordance
with the principles described in Note 4(4)(c).
In the Company’s separate financial statements, investments in subsidiaries are measured as follows:
-- The initial investment cost of a long-term equity investment obtained through a business combination under
common control is the Company’s share of the carrying amount of the subsidiary’s equity on the combination date.
The difference between the initial investment cost and the carrying amounts of the consideration given is adjusted to
the capital premium in capital reserve. If the balance of the capital premium is insufficient, any excess is adjusted to
retained earnings.
-- For a long-term equity investment obtained through a business combination not under common control, the
initial investment cost comprises the aggregate of the fair value of assets transferred, liabilities incurred or assumed,
and equity securities issued by the Company, in exchange for control of the acquiree. If it is achieved in stages, the
initial cost comprises the carrying value of previously-held equity investment in the acquiree immediately before the
acquisition date, and the additional investment cost on the acquisition date.
-- An investment in a subsidiary acquired otherwise than through a business combination is initially recognized
in accordance with the principles described in Note 4 (8) (b).
In the Company’s separate financial statements, long-term equity investments in subsidiaries are accounted
for using the cost method. Except for cash dividends or appropriation of profits declared but not yet distributed
that have been included in the price or consideration paid in obtaining the investments, the Company recognizes its
share of the cash dividends or appropriation of profits declared by the investee as investment income irrespective
of whether these represent the net profit realized by the investee before or after the investment. The investments in
subsidiaries are stated in the balance sheet at cost less impairment losses (see Note 4 (16) (c)).
(b) Investment in jointly controlled enterprises and associates
A jointly controlled enterprise is an enterprise which operates under joint control in accordance with a
contractual agreement between the Group and other parties.
An associate is an enterprise over which the Group has significant influence.
An investment in a jointly controlled enterprise or an associate is initially recognized in accordance with the
following principles: at the actual consideration paid if the Group acquires the investment by cash, or at the fair value
of the equity securities issued if an investment is acquired by issuing equity securities, or at the value stipulated in the
investment contract or agreement if an investment is contributed by an investor.
An investment in a jointly controlled enterprise or an associate is accounted for using the equity method, unless
the investment is classified as held for sale (see Note 4(14)).
The Group makes the following accounting treatments when using the equity method:
-- Where the initial investment cost of a long-term equity investment exceeds the Company’s interest in the
fair value of the investee’s identifiable net assets on the date of acquisition, the investment is initially recognized at
FOR THE YEAR ENDED 31 DECEMBER 2013
EXPRESSED IN RENMINBI’ 000
NOTES TO THE FINANCIAL STATEMENTSOF CITIC GROUP CORPORATION
77
the initial investment cost. Where the initial investment cost is less than the Company’s interest in the fair value of
the investee’s identifiable net assets on the date of acquisition, the investment is initially recognized at the investor’s
share of the fair value of the investee’s identifiable net assets, and the difference is charged to profit or loss.
-- After the acquisition of the investment, the Group recognizes its share of the investee’s profit or loss after
deducting the amortization of the debit balance of the equity investment difference, which was recognized by the
Group before the first-time adoption of CAS, as investment income or losses, and adjusts the carrying amount of
the investment accordingly. The debit balance of the equity investment difference is amortized using the straight-line
method over the period which is determined in accordance with previous accounting standards. Once the investee
declares any cash dividends or appropriation of profits, the carrying amount of the investment is reduced by that
amount attributable to the Group.
The Group recognizes its share of the investee’s net profits or losses after making appropriate adjustments to
align the accounting policies or accounting periods with those of the Group based on the fair value of the investee’s
identifiable net assets on the date of acquisition. Unrealized profits and losses resulting from transactions between
the Group and its associates or jointly controlled enterprises are eliminated to the extent of the Group’s interest in the
associates or jointly controlled enterprises. Unrealized losses resulting from transactions between the Group and its
associates or jointly controlled enterprises are eliminated in the same way as unrealized gains but only to the extent
that there is no evidence of impairment.
-- The Group discontinues recognizing its share of net losses of the investee after the carrying amount of the
long-term equity investment and any long-term interest that in substance forms part of the Group’s net investment
in the associate or the jointly controlled enterprise is reduced to zero, except to the extent that the Group has an
obligation to assume additional losses. Where net profits are subsequently made by the associate or jointly controlled
enterprise, the Group resumes recognizing its share of those profits only after its share of the profits equals the share
of losses not recognized.
-- The Group adjusts the carrying amount of the long-term equity investment for changes in shareholders’ equity
of the investee other than those arising from net profits or losses, and recognizes the corresponding adjustment in
equity.
At year-end, the Group makes provision for impairment of investments in jointly controlled enterprises and
associates in accordance with the principles described in Note 4(16)(c).
(c) Other long-term equity investments
Other long-term equity investments refer to investments where the Group does not have control, joint control or
significant influence over the investees, and the investments are not quoted in an active market and their fair value
cannot be reliably measured.
Such investments are initially recognized at the cost determined in accordance with the same principles as
those for jointly controlled enterprises and associates, and then accounted for using the cost method (see Note 4(8)
(a)). At year-end the Group makes provision for impairment of such investments in accordance with the principles
described in Note 4(16)(b).
FOR THE YEAR ENDED 31 DECEMBER 2013
EXPRESSED IN RENMINBI’ 000
NOTES TO THE FINANCIAL STATEMENTSOF CITIC GROUP CORPORATION
78
(9) Investment properties
Investment properties are properties held either to earn rental income or for capital appreciation or for both.
Investment properties are accounted for using the fair value model. No depreciation or amortization is provided
for an investment property. The carrying amount of the investment property is adjusted to its fair value on the balance
sheet date. The difference between the fair value and the original carrying amount is recognized in profit or loss.
The fair value of the investment properties is estimated based on the market price and other relevant information
regarding the same or similar types of properties from the active property market in the location in which the
investment properties are situated.
(10) Fixed assets and construction in progress
Fixed assets represent the tangible assets held by the Company for use in the production of goods, supply of
services, for rental to others or for administrative purposes with useful lives over one year.
Fixed assets are stated in the balance sheet at cost less accumulated depreciation and impairment losses (see
Note 4(16)(c)). Construction in progress is stated in the balance sheet at cost less impairment losses (see Note 4(16)(c)).
The cost of a purchased fixed asset comprises the purchase price, related taxes, and any directly attributable
expenditure for bringing the asset to working condition for its intended use. The cost of self-constructed assets
includes the cost of materials, direct labor, capitalized borrowing costs (see Note 4(21)), and any other costs directly
attributable to bringing the asset to working condition for its intended use. Costs of environmental protection and
ecological restoration arising from obligations incurred when fixed assets are disposed of are included in the initial
cost of fixed assets.
Construction in progress is transferred to fixed assets when it is ready for its intended use. No depreciation is
provided against construction in progress.
Where the parts of an item of fixed assets have different useful lives or provide benefits to the Company in a
different pattern, thus necessitating use of different depreciation rates or methods, each part is recognized as a
separate fixed asset.
The subsequent costs including the cost of replacing part of an item of fixed assets are recognized in the carrying
amount of the item if the criteria to recognize fixed assets are satisfied, and the carrying amount of the replaced part is
derecognized. The costs of the day-to-day servicing of fixed assets are recognized in profit or loss as incurred.
Gains or losses arising from the retirement or disposal of an item of fixed asset are determined as the difference
between the net disposal proceeds and the carrying amount of the item and are recognized in profit or loss on the
date of retirement or disposal. The cost of fixed asset, less its estimated residual value and accumulated impairment
losses, is depreciated using the straight-line method over their estimated useful lives, unless the fixed asset is
classified as held for sale (see Note 4(14)). The estimated useful lives, residual value and depreciation rates of each
class of fixed assets are as follows:
FOR THE YEAR ENDED 31 DECEMBER 2013
EXPRESSED IN RENMINBI’ 000
NOTES TO THE FINANCIAL STATEMENTSOF CITIC GROUP CORPORATION
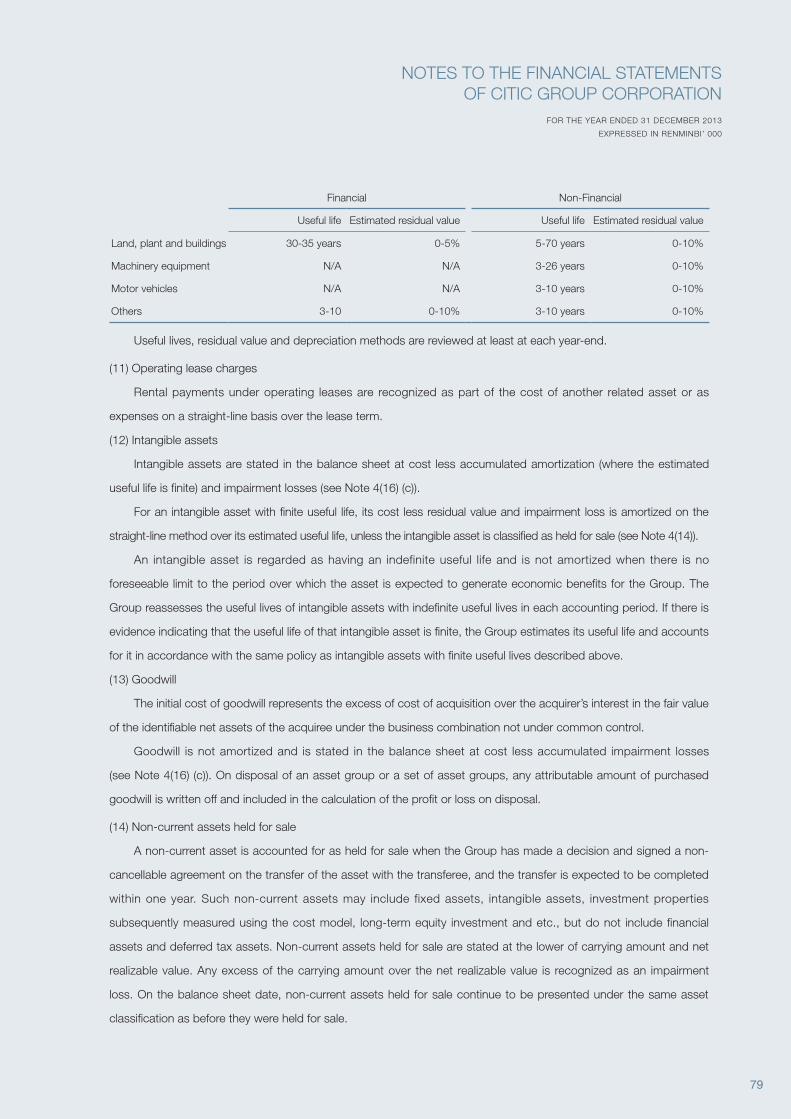
79
Financial Non-Financial
Useful life Estimated residual value Useful life Estimated residual value
Land, plant and buildings 30-35 years 0-5% 5-70 years 0-10%
Machinery equipment N/A N/A 3-26 years 0-10%
Motor vehicles N/A N/A 3-10 years 0-10%
Others 3-10 0-10% 3-10 years 0-10%
Useful lives, residual value and depreciation methods are reviewed at least at each year-end.
(11) Operating lease charges
Rental payments under operating leases are recognized as part of the cost of another related asset or as
expenses on a straight-line basis over the lease term.
(12) Intangible assets
Intangible assets are stated in the balance sheet at cost less accumulated amortization (where the estimated
useful life is finite) and impairment losses (see Note 4(16) (c)).
For an intangible asset with finite useful life, its cost less residual value and impairment loss is amortized on the
straight-line method over its estimated useful life, unless the intangible asset is classified as held for sale (see Note 4(14)).
An intangible asset is regarded as having an indefinite useful life and is not amortized when there is no
foreseeable limit to the period over which the asset is expected to generate economic benefits for the Group. The
Group reassesses the useful lives of intangible assets with indefinite useful lives in each accounting period. If there is
evidence indicating that the useful life of that intangible asset is finite, the Group estimates its useful life and accounts
for it in accordance with the same policy as intangible assets with finite useful lives described above.
(13) Goodwill
The initial cost of goodwill represents the excess of cost of acquisition over the acquirer’s interest in the fair value
of the identifiable net assets of the acquiree under the business combination not under common control.
Goodwill is not amortized and is stated in the balance sheet at cost less accumulated impairment losses
(see Note 4(16) (c)). On disposal of an asset group or a set of asset groups, any attributable amount of purchased
goodwill is written off and included in the calculation of the profit or loss on disposal.
(14) Non-current assets held for sale
A non-current asset is accounted for as held for sale when the Group has made a decision and signed a non-
cancellable agreement on the transfer of the asset with the transferee, and the transfer is expected to be completed
within one year. Such non-current assets may include fixed assets, intangible assets, investment properties
subsequently measured using the cost model, long-term equity investment and etc., but do not include financial
assets and deferred tax assets. Non-current assets held for sale are stated at the lower of carrying amount and net
realizable value. Any excess of the carrying amount over the net realizable value is recognized as an impairment
loss. On the balance sheet date, non-current assets held for sale continue to be presented under the same asset
classification as before they were held for sale.
FOR THE YEAR ENDED 31 DECEMBER 2013
EXPRESSED IN RENMINBI’ 000
NOTES TO THE FINANCIAL STATEMENTSOF CITIC GROUP CORPORATION
80
(15) Financial instruments
Financial instruments include cash at bank and on hand, investments in debt and equity securities other than
long-term equity investments (see Note 4(8)), loans and receivables, payables, borrowings, debts securities issued
and paid-in capital.
(a) Recognition and measurement of financial assets and financial liabilities
A financial asset or financial liability is recognized in the balance sheet when the Group becomes a party to the
contractual provisions of a financial instrument.
The Group classifies financial assets and liabilities into different categories at initial recognition based on the
purpose of acquiring assets or assuming liabilities: financial assets and financial liabilities designated at fair value
through profit or loss, loans and receivables, held-to-maturity investments, available-for-sale financial assets and
other financial liabilities.
Financial assets and financial liabilities are measured initially at fair value. For financial assets and financial
liabilities designated at fair value through profit or loss, any related directly attributable transaction costs are charged
to profit or loss; for other categories of financial assets and financial liabilities, any related directly attributable
transaction costs are included in their initial costs. Subsequent to initial recognition, financial assets and liabilities are
measured as follows:
-- Financial assets and financial liabilities designated at fair value through profit or loss (including financial assets
or financial liabilities held for trading)
A financial asset or financial liability is classified as at fair value through profit or loss if it is acquired or incurred
principally for the purpose of selling or repurchasing in the near term or if it is a derivative, unless the derivative is a
designated and effective hedging instrument, or a financial guarantee contract, or a derivative that is linked to and
must be settled by delivery of an unquoted equity instrument (without a quoted price from an active market) whose
fair value cannot be reliably measured.
Subsequent to initial recognition, financial assets and financial liabilities designated at fair value through profit or
loss are measured at fair value, and changes therein are recognized in profit or loss.
-- Loans and receivables
Loans and receivables are non-derivative financial assets with fixed or determinable payments that are not
quoted in an active market, other than: (i) those that the Group intends to sell immediately or in the near term, which
will be classified as held for trading; (ii) those that the Group, upon initial recognition, designates as at fair value
through the profit or loss or as available-for-sale; or (iii) those where the Group may not recover substantially all of its
initial investment, other than because of credit deterioration, which will be classified as available-for-sale.
The Group’s loans and receivables mainly include deposits with banks and non-bank financial institutions,
placements with banks and non-bank financial institutions, parts of bills and receivables, financial assets held under
resale agreements (see Note 4(15)(g)), loans and advances to customers etc.
Subsequent to initial recognition, loans and receivables are measured at amortized cost using the effective
interest method.
FOR THE YEAR ENDED 31 DECEMBER 2013
EXPRESSED IN RENMINBI’ 000
NOTES TO THE FINANCIAL STATEMENTSOF CITIC GROUP CORPORATION
81
-- Held-to-maturity investments
Held-to-maturity investments are non-derivative financial assets with fixed or determinable payments and fixed
maturity that the Group has the positive intention and ability to hold to maturity.
Subsequent to initial recognition, held-to-maturity investments are measured at amortized cost using the
effective interest method.
-- Available-for-sale financial assets
Available-for-sale financial assets include non-derivative financial assets that are designated upon initial
recognition as available for sale and other financial assets which do not fall into any of the above categories.
Equity instruments investment whose fair value cannot be measured reliably are measured at cost subsequent
to initial recognition. Other available-for-sale financial assets are measured at fair value subsequent to initial
recognition and
changes therein, except for impairment losses and foreign exchange gains and losses from monetary financial
assets which are recognized directly in profit or loss, are recognized as other comprehensive income in capital
reserve. When an investment is derecognized, the cumulative gain or loss is reclassified from equity to profit or
loss. Dividend income from the available-for-sale equity instruments is recognized in profit or loss when the investee
declares the dividends. Interest on available-for-sale financial assets calculated using the effective interest method is
recognized in profit or loss (see Note 4(20)(a)).
-- Other financial liabilities
Financial liabilities other than the financial liabilities designated at fair value through profit or loss are classified as
other financial liabilities.
Other financial liabilities mainly include placements from banks and non-bank financial institutions, parts of bills
and payables, financial assets sold under repurchase agreements (see note 4(15)(g)), deposits from banks and non-
bank financial institutions and customers, parts of employee benefits payable, borrowings, debts securities issued
and provisions etc.
Financial guarantees are contracts that require the Group (i.e. the guarantor) to make specified payments
to reimburse the beneficiary of the guarantee (the holder) for a loss the holder incurs because a specified debtor
fails to make payment when due in accordance with the terms of a debt instrument. Where the Group issues a
financial guarantee, subsequent to initial recognition, the guarantee is measured at the higher of the amount initially
recognized less accumulated amortization and the amount of a provision determined in accordance with the
principles of contingencies (see Note 4(19)).
Except for the liabilities arising from financial guarantee contracts described above, subsequent to initial
recognition, other financial liabilities are measured at amortized cost using the effective interest method.
(b) Derivatives and embedded derivatives
Derivatives mainly include forward and swap contracts performed in foreign currency market and interest rate
market. The Group uses derivatives to hedge its exposure on foreign exchange and interest rate risks. The Group
adopts hedge accounting in accordance with Note 4(22) for derivatives designated as hedging instruments if the
FOR THE YEAR ENDED 31 DECEMBER 2013
EXPRESSED IN RENMINBI’ 000
NOTES TO THE FINANCIAL STATEMENTSOF CITIC GROUP CORPORATION
82
hedge is effective. Other derivatives are accounted for as trading financial assets or financial liabilities. Derivatives are
recognized at fair value upon initial recognition. The positive fair value is recognized as assets while the negative fair
value is recognized as liabilities. The gain or loss on re-measurement to fair value is recognized immediately in profit
or loss.
Certain derivative is embedded into a non-derivative instrument (the host contract). The embedded derivatives
are separated from the host contract and accounted for as a derivative when (i) the economic characteristics and
risks of the embedded derivative are not closely related to the host contract; (ii) a separate instrument with the same
terms as the embedded derivative would meet the definition of a derivative; and (iii) the hybrid (combined) instrument
is not measured at fair value with changes in fair value recognized in profit or loss. When the embedded derivative is
separated, the host contract is accounted for in accordance with Note 4(15)(a).
(c) Offsetting a financial asset against a financial liability
Financial assets and financial liabilities are presented separately in the balance sheet and are not offset.
However, a financial asset and a financial liability are offset and the
net amount is presented in the balance sheet when both of the following conditions are satisfied:
-- The Group has a legal right to set off the recognized amounts and the legal right is currently enforceable; and
-- The Group intends either to settle on a net basis, or to realize the financial asset and settle the financial liability
simultaneously.
(d) Determination of fair value
If there is an active market for a financial asset or financial liability, the quoted price in the active market is used
to establish the fair value of the financial asset or financial liability. If no active market exists for a financial instrument,
a valuation technique is used to establish the fair value. Valuation techniques include using recent arm’s length
market transactions between knowledgeable, willing parties, reference to the current fair value of another instrument
that is substantially the same, discounted cash flow analysis, and option pricing models. The Group calibrates the
valuation technique and tests it for validity periodically.
(e) De-recognition of financial assets and financial liabilities
A financial asset is derecognized if the Group’s contractual rights to the cash flows from the financial asset
expire or if the Group transfers substantially all the risks and rewards of ownership of the financial asset to another
party.
Where a transfer of a financial asset in its entirety meets the criteria for de-recognition, the difference between
the two amounts below is recognized in profit or loss:
-- The carrying amount of the financial asset transferred
-- The sum of the consideration received from the transfer and any cumulative gain or loss that has been
recognized directly in equity.
The Group derecognizes a financial liability (or part of it) only when the underlying present obligation (or part of it)
is discharged, cancelled or expires.
(f) Equity instrument
FOR THE YEAR ENDED 31 DECEMBER 2013
EXPRESSED IN RENMINBI’ 000
NOTES TO THE FINANCIAL STATEMENTSOF CITIC GROUP CORPORATION
83
An equity instrument is a contract that proves the ownership interest of the assets after deducting all liabilities in
the Company.
The consideration received from the issuance of equity instruments net of transaction costs is recognized in
shareholders’ equity. Consideration and transaction costs paid by the Company for repurchasing self-issued equity
instruments are deducted from shareholders’ equity.
(g) Financial assets held under resale and financial assets sold under repurchase agreements
Financial assets held under resale agreements are transactions which the Group acquires financial assets
which will be resold at a predetermined price in the future date under resale agreements. Financial assets sold
under repurchase agreements are transactions which the Group sells financial assets which will be repurchased at a
predetermined price in the future date under repurchase agreements.
The cash advanced or received is recognized as amounts held under resale and repurchase agreements on
the statement of financial position. Assets held under resale agreements are recorded in memorandum accounts
as off-balance sheet items. Assets sold under repurchase agreements continue to be recognized in the financial
statements.
The difference between the sale and repurchase consideration, and that between the purchase and resale
consideration, are amortized over the period of the respective transaction using the effective interest method and are
included in interest income and interest expense respectively.
(16) Impairment of Assets
Except for impairment of assets in Note 4(7), impairment of assets is accounted for using the following
principles:
(a) Impairment of financial assets
The carrying amounts of financial assets (other than those at fair value through profit or loss) are reviewed on
each balance sheet date to determine whether there is objective evidence of impairment. If any such evidence exists,
an impairment loss is recognized.
-- Loans and receivables and held-to-maturity investments
Held-to-maturity investments, loans and receivables are assessed for impairment both on an individual basis
and on a collective group basis.
Where impairment is assessed on an individual basis, an impairment loss in respect of a loan, receivable or
held-to-maturity investment is calculated as the excess of its carrying amount over the present value of the estimated
future cash flows (exclusive of future credit losses that have not been incurred) discounted at the original effective
interest rate. All impairment losses are recognized in profit or loss.
The assessment is made collectively where loans, receivables and held-to-maturity investments share similar
credit risk characteristics (including those having not been individually assessed as impaired), based on their
historical loss experiences, and adjusted by the observable factors reflecting present economic conditions.
If, after an impairment loss has been recognized on loans, receivables or held-to-maturity investments, there is
objective evidence of a recovery in value of the financial asset which can be related objectively to an event occurring
FOR THE YEAR ENDED 31 DECEMBER 2013
EXPRESSED IN RENMINBI’ 000
NOTES TO THE FINANCIAL STATEMENTSOF CITIC GROUP CORPORATION
84
after the impairment was recognized, the previously recognized impairment loss is reversed through profit or loss. A
reversal of an impairment loss will not result in the asset’s carrying amount exceeding what the amortized cost would
have been had no impairment loss been recognized in prior years.
-- Available-for-sale financial assets
Available-for-sale financial assets are assessed for impairment on an individual basis.
When an available-for-sale financial asset is impaired, the cumulative loss arising from decline in fair value that
has been recognized directly in equity is reclassified to profit or loss even though the financial asset has not been
derecognized.
If, after an impairment loss has been recognized on an available-for-sale debt instrument, the fair value of the
debt instrument increases in a subsequent period and the increase can be objectively related to an event occurring
after the impairment loss was recognized, the impairment loss is reversed through profit or loss. An impairment loss
recognized for an investment in an equity instrument classified as available-for-sale is not reversed through profit or
loss.
(b) Impairment of other long-term equity investments
Other long-term equity investments (see Note 4(8)(c)) are assessed for impairment on an individual basis.
For other long-term equity investments, the amount of the impairment loss is measured as the difference
between the carrying amount of the investment and the present value of estimated future cash flows discounted at
the current market rate of return for a similar financial asset. Such impairment loss is not reversed.
(c) Impairment of other assets
The carrying amounts of the following assets are reviewed on each balance sheet date based on the internal
and external sources of information to determine whether there is any indication of impairment:
-- fixed assets
-- construction in progress
-- intangible assets
-- goodwill
-- long-term equity investments in subsidiaries, associates and jointly controlled enterprises
If any indication exists that an asset may be impaired, the recoverable amount of the asset is estimated. In
addition, the Group estimates the recoverable amount of intangible assets not ready for use at least once during
each year and the recoverable amounts of goodwill at each year-end, irrespective of whether there is any indication
of impairment. Goodwill is allocated to each asset group, or set of asset groups, that is expected to benefit from the
synergies of the combination for the purpose of impairment testing.
An asset group is the smallest identifiable group of assets that generates cash inflows that are largely
independent of the cash inflows from other assets or asset groups. An asset group is composed of assets directly
relating to cash-generation. Identification of an asset group is based on whether major cash inflows generated by
the asset group are largely independent of the cash inflows from other assets or asset groups. In identifying an asset
group, the Group also considers how management monitors the Group’s operations and how management makes
FOR THE YEAR ENDED 31 DECEMBER 2013
EXPRESSED IN RENMINBI’ 000
NOTES TO THE FINANCIAL STATEMENTSOF CITIC GROUP CORPORATION
85
decisions about continuing or disposing of the Group’s assets.
The recoverable amount of an asset (asset group or set of asset groups, same as follows) is the higher of its fair
value less costs to sell and its present value of expected future cash flows.
An asset’s fair value less costs to sell is the amount determined by the price of a sale agreement in an arm’s
length transaction, less the costs that are directly attributable to the disposal of the asset. The present value of
expected future cash flows of an asset is determined by discounting the future cash flows, estimated to be derived
from continuing use of the asset and from its ultimate disposal, to their present value using an appropriate pre-tax
discount rate.
If the result of the recoverable amount calculation indicates the recoverable amount of an asset is less than its
carrying amount, the carrying amount of the asset is reduced to its recoverable amount. That reduction is recognized
as an impairment loss and
charged to profit or loss for the current period. A provision for impairment of the asset is recognized accordingly.
For impairment losses related to an asset group or a set of asset groups, first reduce the carrying amount of any
goodwill allocated to the asset group or set of asset groups, and then reduce the carrying amount of the other assets
in the asset group or set of asset groups on a pro rata basis. However, the carrying amount of an impaired asset will
not be lower than the greatest amount of its individual fair value less costs to sell (if determinable), the present value
of expected future cash flows (if determinable) and zero.
Once an impairment loss is recognized, it is not reversed in a subsequent period.
(17) Employee benefits
Employee benefits are all forms of consideration given and other relevant expenditures incurred in exchange for
services rendered by employees. Except for termination benefits, employee benefits are recognized as a liability in
the period in which the associated services are rendered by employees, with a corresponding increase in the cost of
relevant assets or expenses in the current period.
(a) Social insurance and housing fund
Pursuant to the relevant laws and regulations of the PRC, employees of the Group participate in the social
insurance system established and managed by government organizations. The Group makes social insurance
contributions - including contributions to basic pension insurance, basic medical insurance, unemployment
insurance, work-related injury insurance, maternity insurance and etc. - as well as contributions to housing fund,
at the applicable benchmarks and rates stipulated by the government for the benefit of its employees. The social
insurance and housing fund contributions are recognized as part of the cost of assets or charged to profit or loss on
an accrual basis.
(b) Supplementary retirement benefit
The Group’s obligations in respect of supplementary retirement benefits are calculated by estimating the
amount of future benefits that the Group is committed to pay to the employees after their retirement using actuarial
techniques. Such benefits are discounted to determine its present values. When calculating the Group’s obligations,
if any cumulative unrecognized gains or losses are larger than 10% of the present value of the obligation, the
FOR THE YEAR ENDED 31 DECEMBER 2013
EXPRESSED IN RENMINBI’ 000
NOTES TO THE FINANCIAL STATEMENTSOF CITIC GROUP CORPORATION
86
difference is recognized in profit or loss for the current period, otherwise no profit or loss is recognized.
(c) Termination benefits
When the Group terminates the employment relationship with employees before the employment contracts
expire, or provides compensation as an offer to encourage employees to accept voluntary redundancy, a provision
for the termination benefits to be provided is recognized in profit or loss when both of the following conditions are
satisfied:
-- The Group has a formal plan for the termination of employment or has made an offer to employees for
voluntary redundancy, which will be implemented shortly;
-- The Group is not allowed to withdraw from termination plan or redundancy offer unilaterally.
(18) Income tax
Current tax and deferred tax are recognized in profit or loss except to the extent that they relate to items
recognized directly in equity, in which case they are recognized in equity.
Current tax is the expected tax payable calculated at the applicable tax rate on taxable income for the year, plus
any adjustment to tax payable in respect of previous years.
On the balance sheet date, current tax assets and liabilities are offset if the Group has a legally enforceable
right to set them off and also intends either to settle on a net basis or to realize the asset and settle the liability
simultaneously.
Deferred tax assets and liabilities arise from deductible and taxable temporary differences respectively, being the
differences between the carrying amounts of assets and liabilities for financial reporting purposes and their tax bases,
which include the deductible losses and tax credits carried forward to subsequent periods. Deferred tax assets
are recognized to the extent that it is probable that future taxable profits will be available against which deductible
temporary differences can be utilized.
Deferred tax is not recognized for the temporary differences arising from the initial recognition of assets or
liabilities in a transaction that is not a business combination and that affects neither accounting profit nor taxable
profit (or tax loss). Deferred tax is not recognized for taxable temporary differences arising from the initial recognition
of goodwill.
On the balance sheet date, the amount of deferred tax recognized is measured based on the expected manner
of recovery or settlement of the carrying amount of the assets and liabilities, using tax rates that are expected to be
applied in the period when the asset is recovered or the liability is settled in accordance with tax laws.
The carrying amount of a deferred tax asset is reviewed on each balance sheet date. The carrying amount of a
deferred tax asset is reduced to the extent that it is no longer probable that sufficient taxable profits will be available
to allow the benefit of the deferred tax asset to be utilized. Such reduction is reversed to the extent that it becomes
probable that sufficient taxable profits will be available.
On the balance sheet date, deferred tax assets and liabilities are offset if all the following conditions are met:
-- The taxable entity has a legally enforceable right to offset current tax liabilities and assets;
-- They relate to income taxes levied by the same tax authority on the same taxable entity; or different taxable
FOR THE YEAR ENDED 31 DECEMBER 2013
EXPRESSED IN RENMINBI’ 000
NOTES TO THE FINANCIAL STATEMENTSOF CITIC GROUP CORPORATION
87
entities which intend either to settle the current tax liabilities and assets on a net basis, or to realize the assets and
settle the liabilities simultaneously, in each future period in which significant amounts of deferred tax liabilities or
assets are expected to be settled or recovered.
(19) Provisions and contingent liabilities
A provision is recognized for an obligation related to a contingency if the Group has a present obligation that can
be estimated reliably, and it is probable that an outflow of economic benefits will be required to settle the obligation.
Where the effect of time value of money is material, provisions are determined by discounting the expected future
cash flows.
In terms of a possible obligation resulting from a past transaction or event, whose existence will only be
confirmed by the occurrence or non-occurrence of uncertain future events or a present obligation resulting from a
past transaction or event, where it is not probable that the settlement of the above obligation will cause an outflow
of economic benefits, or the amount of the outflow cannot be estimated reliably, the possible or present obligation is
disclosed as a contingent liability
(20) Revenue recognition
Revenue is the gross inflow of economic benefit arising in the course of the Group’s ordinary activities when
those inflows result in increases in equity, other than increases relating to contributions from shareholders. Revenue
is recognized in profit or loss when it is probable that the economic benefits will flow to the Group, the revenue and
costs can be measured reliably and the following respective conditions are met:
(a) Interest income
Interest income of financial assets is recognized in income statement based on the duration and the effective
interest rate. Interest income includes the amortization of any discount or premium or other differences between the
initial carrying amount of an interest-bearing instrument and its amount at maturity calculated on an effective interest
rate basis.
The effective interest method is a method of calculating the amortized cost of financial assets and liabilities
and of allocating the interest income and interest expense over the relevant period. The effective interest rate is the
rate that exactly discounts estimated future cash payments or receipts through the expected life of the financial
instrument or, when appropriate, a shorter period to the net carrying amount of the financial instrument. When
calculating the effective interest rate, the Group estimates cash flows considering all contractual terms of the financial
instrument (for example, prepayment, call and similar options). The calculation includes all fees and points paid or
received between parties to the contract that are an integral part of the effective interest rate, transaction costs and
all other premiums or discounts.
Interest on the impaired financial assets is recognized using the rate of interest used to discount future cash
flows (“unwinding of discount”) for the purpose of measuring the related impairment loss.
(b) Fee and commission income
Fee and commission income is recognized in profit or loss when the corresponding service is provided.
Origination or commitment fees received by the Group which result in the creation or acquisition of a financial asset
FOR THE YEAR ENDED 31 DECEMBER 2013
EXPRESSED IN RENMINBI’ 000
NOTES TO THE FINANCIAL STATEMENTSOF CITIC GROUP CORPORATION
88
are deferred and recognized as an adjustment to the effective interest rate. If the commitment expires without the
Group making a loan, the fee is recognized as revenue on expiry.
(c) Sale of goods
Revenue from sale of goods is recognized when all of the general conditions stated above and following
conditions are satisfied:
-- The significant risks and rewards of shareholdership of goods have been transferred to the buyer;
-- The Group retains neither continuing managerial involvement to the degree usually associated with
shareholdership nor effective control over the goods sold.
Revenue from the sale of goods is measured at the fair value of the consideration received or receivable under
the sales contract or agreement.
Revenue from sales of properties is recognized when the construction of the relevant properties have been
completed and accepted, the sales contract is signed, and there is a proof of payment (usually the advance deposits
on certain percent of contract amount or more, or a confirmed arrangement of the remaining unpaid amount)
provided by the buyer pursuant to the sales contract.
(d) Revenue from construction contracts
On the balance sheet date, where the outcome of a construction contract can be estimated reliably, contract
revenue and contract expenses associated with the construction contract are recognized using the percentage of
completion method.
The stage of completion of a contract is determined based on the proportion of contract costs incurred for work
performed to date to the estimated total contact costs.
When the outcome of a construction contract cannot be estimated reliably:
-- If the contract costs can be recovered, revenue is recognized to the extent of contract costs incurred that can
be recovered, and the contract costs are recognized as contract expenses when incurred;
-- If the contract costs cannot be recovered, the contract costs are recognized as contract expenses
immediately when incurred, and no contract revenue is recognized.
(21) Borrowing costs
Borrowing costs incurred directly attributable to the acquisition, construction or production of a qualifying asset
are capitalized as part of the cost of the asset.
Except for the above, other borrowing costs are recognized as financial expenses in the income statement
when incurred.
During the capitalization period, the amount of interest (including amortization of any discount or premium on
borrowing) to be capitalized in each accounting period is determined as follows:
-- Where funds are borrowed specifically for the acquisition, construction or production of a qualifying asset, the
amount of interest to be capitalized is the interest expense calculated using effective interest rates during the period
less any interest income earned from depositing the borrowed funds or any investment income on the temporary
investment of those funds before being used on the asset.
FOR THE YEAR ENDED 31 DECEMBER 2013
EXPRESSED IN RENMINBI’ 000
NOTES TO THE FINANCIAL STATEMENTSOF CITIC GROUP CORPORATION
89
-- Where funds are borrowed generally and used for the acquisition, construction or production of a qualifying
asset, the amount of interest to be capitalized on such borrowings is determined by applying a capitalization rate to
the weighted average of the excess amounts of cumulative expenditures on the asset over the above amounts of
specific borrowings. The capitalization rate is the weighted average of the interest rates applicable to the general-
purpose borrowings.
The effective interest rate is determined as the rate that exactly discounts estimated future cash flow through
the expected life of the borrowing or, when appropriate, a shorter period to the initially recognized amount of the
borrowings.
During the capitalization period, exchange differences related to the principal and interest on a specific-purpose
borrowing denominated in foreign currency are capitalized as part of the cost of the qualifying asset. The exchange
differences related to the principal and interest on foreign currency borrowings other than a specific-purpose
borrowing are recognized as a financial expense in the period in which they are incurred.
The capitalization period is the period from the date of commencement of capitalization of borrowing costs to
the date of cessation of capitalization, excluding any period over which capitalization is suspended. Capitalization of
borrowing costs commences when expenditure for the asset is being incurred, borrowing costs are being incurred
and activities of acquisition, construction or production that are necessary to prepare the asset for its intended use
or sale are in progress, and ceases when the assets become ready for their intended use or sale. Capitalization of
borrowing costs is suspended when the acquisition, construction or production activities are interrupted abnormally
and the interruption lasts for more than three months.
(22) Hedge Accounting
Hedge accounting is a method which recognizes the offsetting effects on profit or loss of changes in the fair
values of the hedging instrument and the hedged item in the same accounting period.
Hedged items are the items that expose the Group to risks of changes in fair value and that are designated as
being hedged.
A hedging instrument is a designated derivative whose changes in fair value are expected to offset changes in
the fair value of the hedged item.
The hedge is assessed by the Group for effectiveness on an ongoing basis and determined to have been
highly effective throughout the accounting periods for which the hedging relationship was designated. The hedge
is considered to be highly effective if the hedging instrument must be expected to be highly effective in achieving
offsetting changes in fair value or cash flow attributive to the hedged risk during the period for which the hedge is
designated.
(a) Cash flow hedges
A cash flow hedge is a hedge of the exposure to variability in cash flow. The effective part of any unrealized gain
or loss on the instrument is recognized directly in hedging reserve. The amount of an effective part would be the
lower of:
-- The accumulative gain or loss on the instrument from the beginning of the hedging period;
FOR THE YEAR ENDED 31 DECEMBER 2013
EXPRESSED IN RENMINBI’ 000
NOTES TO THE FINANCIAL STATEMENTSOF CITIC GROUP CORPORATION

90
-- The accumulative movement of the projected future cash flow of the hedged items from the beginning of the
hedging period.
The ineffective part of the unrealized gain or loss on the instrument would be recognized in the profit and loss.
When the forecast transaction that is hedged results in the recognition of a non-financial asset or a non-financial
liability, the gains and losses previously recognized directly in shareholders’ equity are transferred from equity and
included in the initial measurement of the cost of the non-financial asset or non-financial liability.
When the forecast transaction that is hedged results in the recognition of a financial asset or a liability, the
associated gain or loss recorded in shareholders’ equity will be reclassified into profit or loss in the same period
during which the transaction it hedges is recognized in the profit or loss. However, if the Group expects that all or a
portion of a net loss recognized directly in shareholder’s equity will not be recovered in future accounting periods, the
Group will reclassify the amount that is not expected to be recovered into profit or loss.
For cash flow hedges other than those covered above, gain or loss of the hedging instruments that had been
recognized directly in shareholders’ equity shall be reclassified into profit or loss in the same period during which the
hedged forecast transaction it hedges is recognized in the profit or loss.
When a hedging instrument expires or is sold, terminated or exercised, or no longer meets the criteria for hedge
accounting, the Group discontinues prospectively the
hedge accounting treatments and the cumulative gain or loss recognized directly in shareholders’ equity in the
effective hedging period will not be transferred out until the transaction occurs and it is recognized in accordance
with the above policy. If the hedged transaction is no longer expected to take place, the cumulative unrealized gain
or loss is reclassified from equity to profit or loss immediately.
(b) Fair value hedges
A fair value hedge is a hedge of the exposure to changes in fair value of a recognized asset or liability or
an unrecognized firm commitment, or an identified portion of such an asset, liability or firm commitment, that is
attributable to a particular risk and could affect profit or loss.
The gain or loss from re-measuring the hedging instrument at fair value is recognized in profit or loss. The gain
or loss on the hedged item attributable to the hedged risk adjusts the carrying amount of the hedged item and is
recognized in profit or loss.
When a hedging instrument expires or is sold, terminated or exercised, or no longer meets the criteria for hedge
accounting, the Group discontinues prospectively the hedge accounting treatments. If the hedged item is a financial
instrument measured at amortized cost, any adjustment to the carrying amount of the hedged item is amortized
to profit or loss from the adjustment date to the maturity date using the recalculated effective interest rate on the
adjustment date.
(23) Fiduciary activities
The Group acts in a fiduciary capacity as a custodian, trustee, or an agent for customers. Assets held by the
Group and the related undertakings to return such assets to customers are excluded from the financial statement as
the risks and rewards of the assets reside with the customers.
FOR THE YEAR ENDED 31 DECEMBER 2013
EXPRESSED IN RENMINBI’ 000
NOTES TO THE FINANCIAL STATEMENTSOF CITIC GROUP CORPORATION
91
Entrusted lending is the business where the Group enters into entrusted loan agreements with customers,
whereby the customers provide funding (the “entrusted funds”) to the Group, and the Group grants loans to third
parties (the “entrusted loans”) at the instruction of the customers. As the Group does not assume the risks and
rewards of the entrusted loans and the corresponding entrusted funds, entrusted loans and funds are recorded as
off-balance sheet items at their principal amounts and no impairment assessments are made for these entrusted
loans.
(24) Appropriation of profits
Distributions of profit proposed in the profit appropriation plan to be authorized and declared after the balance
sheet date are not recognized as a liability on the balance sheet date but disclosed in the notes separately.
(25) Related parties
If a party has the power to control, jointly control or exercise significant influence over another party, or vice
versa, or where two or more parties are subject to common control or joint control from another party, they are
considered to be related parties. Related parties may be individuals or enterprises. Enterprises with which the
Company is under common control only from the State and that have no other related party relationships are not
regarded as related parties of the Group.
Related parties of the Group and the Company include, but are not limited to:
(a) The Company’s parent;
(b) The Company’s subsidiaries;
(c) Enterprises that are controlled by the Company’s parent;
(d) Investors that have joint control or exercise significant influence over the Group;
(e) Enterprises or individuals if a party has control or joint control over both the enterprises or individuals and the
Group;
( f ) Jointly controlled enterprises of the Group, including subsidiaries of jointly controlled enterprises;
(g) Associates of the Group, including subsidiaries of associates;
(h) Principal individual investors and close family members of such individuals;
( i ) Key management personnel of the Group and close family members of such individuals;
( j ) Key management personnel of the Company’s parent and close family members of such individuals; and
(k) Other enterprises that are controlled or jointly controlled by principal individual investors, key management
personnel of the Group, or close family members of such individuals.
(26) Segment reporting
Reportable segments are identified based on operating segments which are determined based on the structure
of the Group’s internal organization, management requirements and internal reporting system. An operating segment
is a component of the Group that satisfies the following conditions:
-- The component engages in business activities from which it may earn revenues and incur expenses;
-- The Group’s management could regularly review the component’s financial performance to make decisions
about resource to be allocated to the segment and assess its performance;
FOR THE YEAR ENDED 31 DECEMBER 2013
EXPRESSED IN RENMINBI’ 000
NOTES TO THE FINANCIAL STATEMENTSOF CITIC GROUP CORPORATION
92
-- The Group could obtain financial information of the component regarding financial position, financial
performance and cash flows.
Two or more operating segments may be aggregated into a single operating segment if the segments have the
following same or similar economic characteristics in respect of:
-- The nature of each products and service;
-- The nature of production processes;
-- The type or class of customers for products and services;
-- The methods used to distribute products or provide services;
-- The nature of the regulatory environment.
In the preparation of the Group’s segment reporting, inter-segment revenues are measured on the basis of
actual transaction price for such transactions for segment reporting, and segment accounting policies are consistent
with those for the Group’s financial statements.
(27) Significant accounting estimates and judgments
The preparation of financial statements requires management to make estimates and assumptions that affect
the application of accounting policies and the reported amounts of assets, liabilities, income and expenses. Actual
results may differ from these estimates. Estimates and underlying assumptions are reviewed on an ongoing basis.
Revisions to accounting estimates are recognized in the period in which the estimate is revised and in any future
periods affected.
Except that the notes containing information about the assumptions and their risk factors relating to valuation of
investment properties measured using fair value model, impairment of goodwill, termination benefits, and fair value of
financial instruments, other key sources of estimation uncertainty are as follows:
(a) Impairment of loans and receivables
As described in Note 4(16)(a), loans and receivables that are measured at amortized cost are reviewed on each
balance sheet date to determine whether there is objective evidence of impairment. If any such evidence exists, an
impairment loss is recognized. Objective evidence of impairment includes observable data that comes to the attention
of the Group about loss events such as a significant decline in the estimated future cash flow of an individual debtor or
the portfolio of debtors, and significant changes in the financial condition that have an adverse effect on the debtor. If
there has been a change in the factors used to determine the provision for impairment which indicates that the value of
the loan or receivable has recovered, the impairment loss recognized in prior years is reversed.
(b) Provision for diminution in value of inventories
As described in Note 4(7), the net realizable value of inventories is under management’s regular review, and as
a result, provision for diminution in value of inventories is recognized for the excess of inventories’ carrying amounts
over their net realizable value. When making estimates of net realizable value, the Group takes into consideration the
use of inventories held on hand and other information available to form the underlying assumptions, including the
inventories’ market prices and the Group’s historical operating costs. The actual selling price, the costs of completion
and the costs necessary to make the sale and relevant taxes may vary based on the changes in market conditions
FOR THE YEAR ENDED 31 DECEMBER 2013
EXPRESSED IN RENMINBI’ 000
NOTES TO THE FINANCIAL STATEMENTSOF CITIC GROUP CORPORATION
93
and product saleability, manufacturing technology, and the actual use of the inventories, resulting in the changes in
provision for diminution in value of inventories. The net profit or loss may then be affected in the period when the
provision for diminution in value of inventories is adjusted.
(c) Impairment of assets such as fixed assets and intangible assets
As described in Note 4(16)(c), assets such as fixed assets and intangible assets are reviewed on each balance
sheet date to determine whether the carrying amount exceeds the recoverable amount of the assets. If any such
indication exists, an impairment loss is recognized.
The recoverable amount of an asset (asset group) is the greater of its fair value less costs to sell and its present
value of expected future cash flows. Since a market price of the asset (the asset group) cannot be obtained reliably, the
fair value of the asset cannot be estimated reliably. In assessing value in use, significant judgments are exercised over
the asset’s production, selling price, related operating expenses and discount rate to calculate the present value. All
relevant materials which can be obtained are used for estimation of the recoverable amount, including the estimation of
the production, selling price and related operating expenses based on reasonable and supportable assumptions.
(d) Depreciation and amortization of fixed assets and intangible assets
As described in Note 4(10) and (12), fixed assets and intangible assets are depreciated and amortized over
their useful lives after taking into account residual value. The useful lives of the assets are regularly reviewed to
determine the depreciation and amortization costs charged in each reporting period. The useful lives of the assets
are determined based on historical experience of similar assets and the estimated technical changes. If there have
been significant changes in the factors used to determine the depreciation or amortization, the rate of depreciation or
amortization is revised prospectively.
(e) Income taxes
Determining income tax provisions involves judgment on the future tax treatment of certain transactions. The
Group carefully evaluates the tax implications of transactions and tax provisions are set up accordingly. The tax
treatment of such transactions is reconsidered periodically to take into account all changes in tax legislations.
Deferred tax assets are recognized for tax losses not yet used and temporary deductible differences. As those
deferred tax assets can only be recognized to the extent that it is probable that future taxable profits will be available
against which the unused tax credits can be utilized, management’s judgment is required to assess the probability
of future taxable profits. Management’s assessment is constantly reviewed and additional deferred tax assets are
recognized if it becomes probable that future taxable profits will allow the deferred tax assets to be recovered.
( f ) Retirement benefit obligations
The Group has established liabilities in connection with supplementary retirement benefits. The amounts of
employee benefit expense and these liabilities are dependent on assumptions used in calculating such amounts.
These assumptions include discount rates, pension benefit inflation rates, medical benefit inflation rates, and other
factors. Actual results that differ from the assumptions are recognized the Group’s profit and loss at the end of each
reporting period. While management believes that its assumptions are appropriate, differences in actual experience
or changes in assumptions may affect the Group’s expense related to its employee retirement benefit obligations.
FOR THE YEAR ENDED 31 DECEMBER 2013
EXPRESSED IN RENMINBI’ 000
NOTES TO THE FINANCIAL STATEMENTSOF CITIC GROUP CORPORATION
94
5. Taxation
(1) The types of taxes applicable to the Group’s sale of goods and rendering of services include business tax, value
added tax (VAT), land appreciation tax and etc.
Tax Name Tax basis
Business tax 3% or 5% of taxable revenue
VATOutput VAT is 3% - 17% of product sales and taxable services revenue, based on tax laws. The remaining balance of output VAT, after subtracting the deductible input VAT of the period, is VAT payable
Land appreciation tax Appreciation amount in transferring property and applicable tax rate
(2) Income tax
The statutory income tax rate of the Company is 25%. The applicable income tax rate for the year is the
statutory rate (2012: 25%).
The Group’s subsidiaries have paid income tax in accordance with the local tax regulations.
(3) Taxes payable
The Group
Item 2013 2012
Income tax payable 6,303,030 6,374,410
Business tax payable 2,569,666 2,480,045
VAT payable 525,286 643,870
Land appreciation tax payable 680,793 767,263
Others 696,366 1,002,271
Total 10,775,141 11,267,859
The Company
Item 2013 2012
Business tax payable 353 10,618
Urban construction tax 25 743
Educational surcharge payable 11 319
Local educational surcharge payable 7 213
Others 15,936 312
Total 16,332 12,205
FOR THE YEAR ENDED 31 DECEMBER 2013
EXPRESSED IN RENMINBI’ 000
NOTES TO THE FINANCIAL STATEMENTSOF CITIC GROUP CORPORATION
95
6. Business combinations and the consolidated financial statements
(1) As at 31 December 2013, major subsidiaries included in the Company’s consolidated financial statements are as
follows:
Name Registered place Business natureRegistered capital
(’000)Currency
Shareholdingpercentage
direct/indirect
CITIC Limited (note 2) Mainland ChinaInvestment
holding128,000,000 RMB 100%
CITIC Guoan Group Mainland ChinaInvestment
holding1,500,000 RMB 100%
CITIC Asset Management Corporation Ltd
Mainland China Financial services 1,480,000 RMB 100%
CITIC International Co., Ltd. Mainland China Services 15,000 RMB 100%
CITIC International Cooperation Co., Ltd.
Mainland ChinaEngineering contracting
160,000 RMB 100%
CITIC Networks Co., Ltd. Mainland China Information 4,400,000 RMB 100%
CITIC Medical & Health Group Co., Ltd.
Mainland China Services 55,600 RMB 100%
CITIC Mining Technology Development Co., Ltd.
Mainland ChinaEnergy and
resources300,000 RMB 81.70%
Beijing CITIC Enterprise Management Co., Ltd.
Mainland China Services 200,000 RMB 100%
CITIC Bohai Aluminium Industries Holding Company Ltd.
Mainland China Manufacturing 1,050,000 RMB 100%
CITIC Machinery Manufacturing Co., Ltd.
Mainland China Manufacturing 681,512 RMB 100%
CITIC Heavy Machinery Co., Ltd. Mainland China Services 62,000 RMB 100%
(2) Business combinations not involving enterprises under common control during the year
CITIC Telecom International Holdings Limited (“Telecom International”), a controlling subsidiary of CITIC Limited
(the subsidiary of the Company), acquired 79% equity interest of Companhia de Telecomunicacoes de Macau,
S.A.R.L. (“CTM”) by paying USD 1,250 million (RMB 7,755 million) in cash. After the acquisition, Telecom International
held 99% equity interest of CTM, and CTM became a subsidiary of Telecom International.
7. Interpretation for Important Accounts of the Financial Statements
Unless otherwise stated, in the following notes (including the notes to the main items of the financial statements
of the Company), 2013 refers to 31 December 2013, and 2012 refers to 31 December 2012. The “current year”
refers to year 2013, and the “last year” refers to year 2012.
FOR THE YEAR ENDED 31 DECEMBER 2013
EXPRESSED IN RENMINBI’ 000
NOTES TO THE FINANCIAL STATEMENTSOF CITIC GROUP CORPORATION
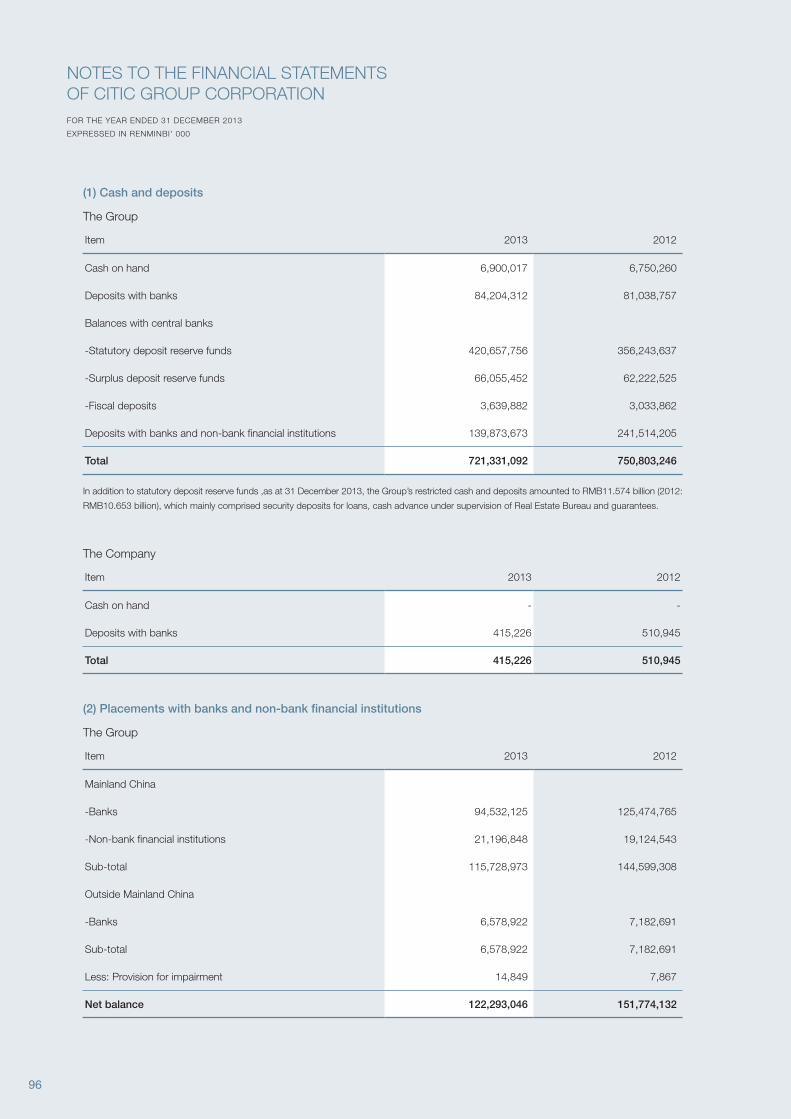
96
(1) Cash and deposits
The Group
Item 2013 2012
Cash on hand 6,900,017 6,750,260
Deposits with banks 84,204,312 81,038,757
Balances with central banks
-Statutory deposit reserve funds 420,657,756 356,243,637
-Surplus deposit reserve funds 66,055,452 62,222,525
-Fiscal deposits 3,639,882 3,033,862
Deposits with banks and non-bank financial institutions 139,873,673 241,514,205
Total 721,331,092 750,803,246
In addition to statutory deposit reserve funds ,as at 31 December 2013, the Group’s restricted cash and deposits amounted to RMB11.574 billion (2012:
RMB10.653 billion), which mainly comprised security deposits for loans, cash advance under supervision of Real Estate Bureau and guarantees.
The Company
Item 2013 2012
Cash on hand - -
Deposits with banks 415,226 510,945
Total 415,226 510,945
(2) Placements with banks and non-bank financial institutions
The Group
Item 2013 2012
Mainland China
-Banks 94,532,125 125,474,765
-Non-bank financial institutions 21,196,848 19,124,543
Sub-total 115,728,973 144,599,308
Outside Mainland China
-Banks 6,578,922 7,182,691
Sub-total 6,578,922 7,182,691
Less: Provision for impairment 14,849 7,867
Net balance 122,293,046 151,774,132
FOR THE YEAR ENDED 31 DECEMBER 2013
EXPRESSED IN RENMINBI’ 000
NOTES TO THE FINANCIAL STATEMENTSOF CITIC GROUP CORPORATION
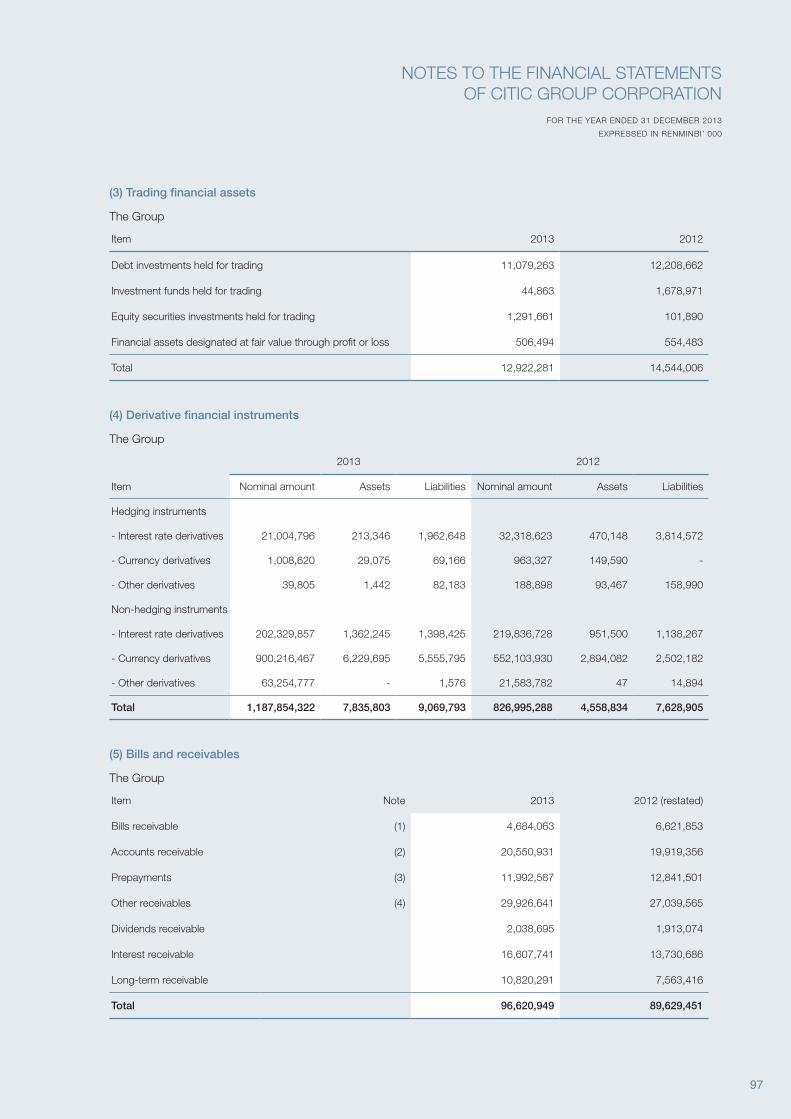
97
(3) Trading financial assets
The Group
Item 2013 2012
Debt investments held for trading 11,079,263 12,208,662
Investment funds held for trading 44,863 1,678,971
Equity securities investments held for trading 1,291,661 101,890
Financial assets designated at fair value through profit or loss 506,494 554,483
Total 12,922,281 14,544,006
(4) Derivative financial instruments
The Group
2013 2012
Item Nominal amount Assets Liabilities Nominal amount Assets Liabilities
Hedging instruments
- Interest rate derivatives 21,004,796 213,346 1,962,648 32,318,623 470,148 3,814,572
- Currency derivatives 1,008,620 29,075 69,166 963,327 149,590 -
- Other derivatives 39,805 1,442 82,183 188,898 93,467 158,990
Non-hedging instruments
- Interest rate derivatives 202,329,857 1,362,245 1,398,425 219,836,728 951,500 1,138,267
- Currency derivatives 900,216,467 6,229,695 5,555,795 552,103,930 2,894,082 2,502,182
- Other derivatives 63,254,777 - 1,576 21,583,782 47 14,894
Total 1,187,854,322 7,835,803 9,069,793 826,995,288 4,558,834 7,628,905
(5) Bills and receivables
The Group
Item Note 2013 2012 (restated)
Bills receivable (1) 4,684,063 6,621,853
Accounts receivable (2) 20,550,931 19,919,356
Prepayments (3) 11,992,587 12,841,501
Other receivables (4) 29,926,641 27,039,565
Dividends receivable 2,038,695 1,913,074
Interest receivable 16,607,741 13,730,686
Long-term receivable 10,820,291 7,563,416
Total 96,620,949 89,629,451
FOR THE YEAR ENDED 31 DECEMBER 2013
EXPRESSED IN RENMINBI’ 000
NOTES TO THE FINANCIAL STATEMENTSOF CITIC GROUP CORPORATION
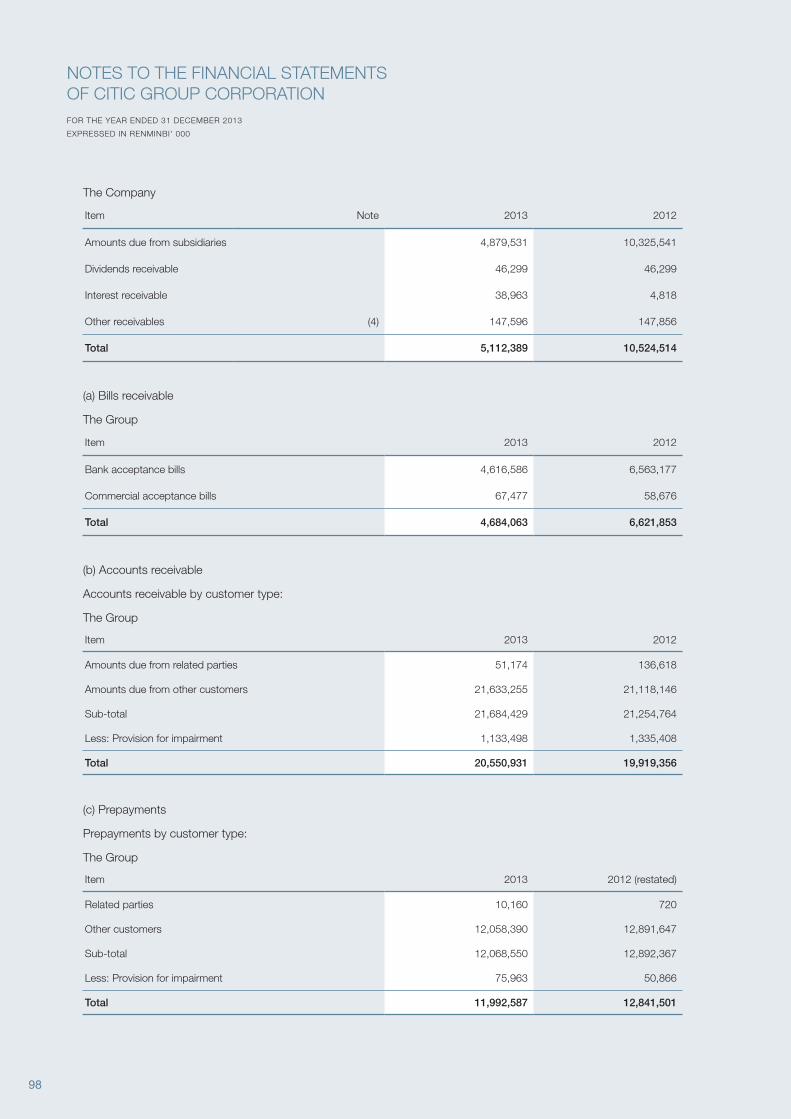
98
The Company
Item Note 2013 2012
Amounts due from subsidiaries 4,879,531 10,325,541
Dividends receivable 46,299 46,299
Interest receivable 38,963 4,818
Other receivables (4) 147,596 147,856
Total 5,112,389 10,524,514
(a) Bills receivable
The Group
Item 2013 2012
Bank acceptance bills 4,616,586 6,563,177
Commercial acceptance bills 67,477 58,676
Total 4,684,063 6,621,853
(b) Accounts receivable
Accounts receivable by customer type:
The Group
Item 2013 2012
Amounts due from related parties 51,174 136,618
Amounts due from other customers 21,633,255 21,118,146
Sub-total 21,684,429 21,254,764
Less: Provision for impairment 1,133,498 1,335,408
Total 20,550,931 19,919,356
(c) Prepayments
Prepayments by customer type:
The Group
Item 2013 2012 (restated)
Related parties 10,160 720
Other customers 12,058,390 12,891,647
Sub-total 12,068,550 12,892,367
Less: Provision for impairment 75,963 50,866
Total 11,992,587 12,841,501
FOR THE YEAR ENDED 31 DECEMBER 2013
EXPRESSED IN RENMINBI’ 000
NOTES TO THE FINANCIAL STATEMENTSOF CITIC GROUP CORPORATION
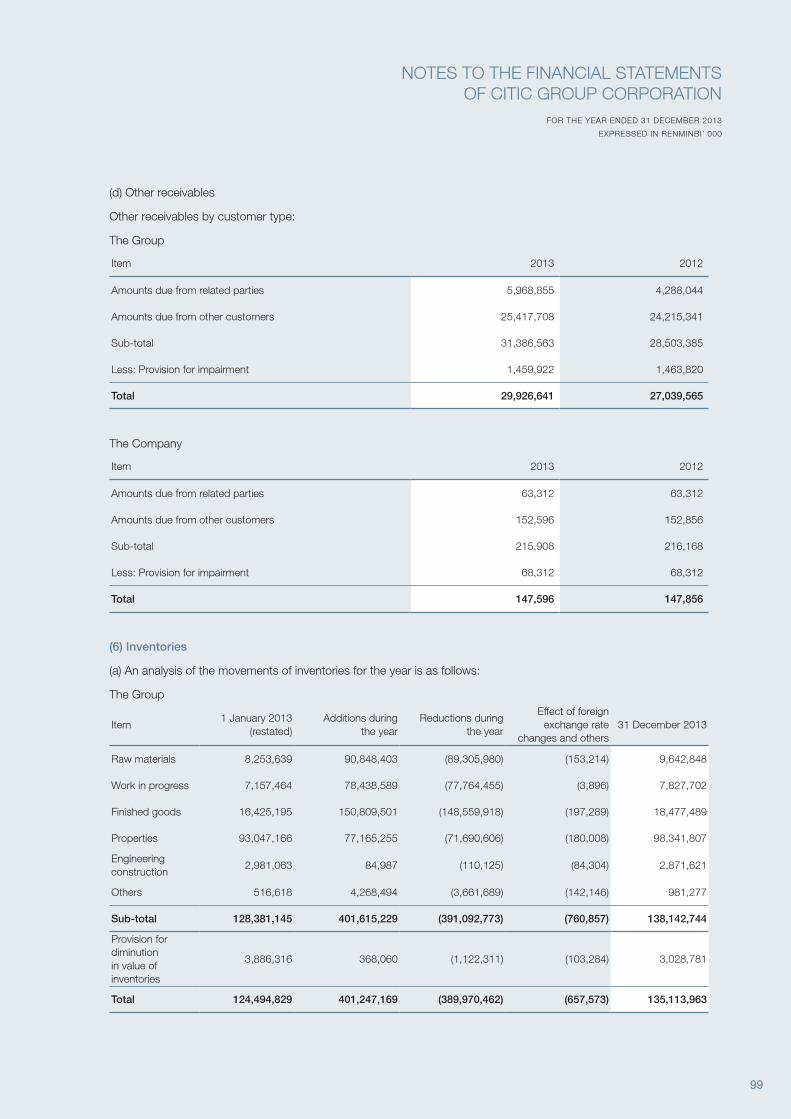
99
(d) Other receivables
Other receivables by customer type:
The Group
Item 2013 2012
Amounts due from related parties 5,968,855 4,288,044
Amounts due from other customers 25,417,708 24,215,341
Sub-total 31,386,563 28,503,385
Less: Provision for impairment 1,459,922 1,463,820
Total 29,926,641 27,039,565
The Company
Item 2013 2012
Amounts due from related parties 63,312 63,312
Amounts due from other customers 152,596 152,856
Sub-total 215,908 216,168
Less: Provision for impairment 68,312 68,312
Total 147,596 147,856
(6) Inventories
(a) An analysis of the movements of inventories for the year is as follows:
The Group
Item1 January 2013
(restated)Additions during
the yearReductions during
the year
Effect of foreign exchange rate
changes and others31 December 2013
Raw materials 8,253,639 90,848,403 (89,305,980) (153,214) 9,642,848
Work in progress 7,157,464 78,438,589 (77,764,455) (3,896) 7,827,702
Finished goods 16,425,195 150,809,501 (148,559,918) (197,289) 18,477,489
Properties 93,047,166 77,165,255 (71,690,606) (180,008) 98,341,807
Engineering construction
2,981,063 84,987 (110,125) (84,304) 2,871,621
Others 516,618 4,268,494 (3,661,689) (142,146) 981,277
Sub-total 128,381,145 401,615,229 (391,092,773) (760,857) 138,142,744
Provision for diminutionin value of inventories
3,886,316 368,060 (1,122,311) (103,284) 3,028,781
Total 124,494,829 401,247,169 (389,970,462) (657,573) 135,113,963
FOR THE YEAR ENDED 31 DECEMBER 2013
EXPRESSED IN RENMINBI’ 000
NOTES TO THE FINANCIAL STATEMENTSOF CITIC GROUP CORPORATION
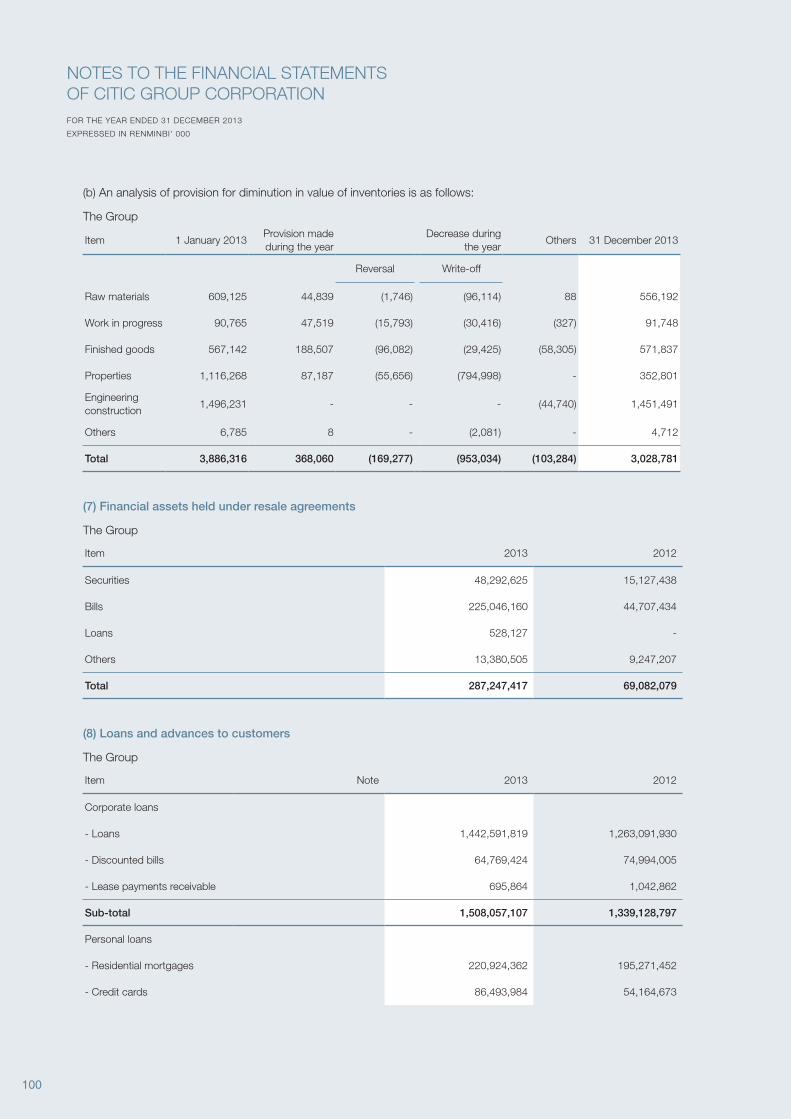
100
(b) An analysis of provision for diminution in value of inventories is as follows:
The Group
Item 1 January 2013Provision made during the year
Decrease during the year
Others 31 December 2013
Reversal Write-off
Raw materials 609,125 44,839 (1,746) (96,114) 88 556,192
Work in progress 90,765 47,519 (15,793) (30,416) (327) 91,748
Finished goods 567,142 188,507 (96,082) (29,425) (58,305) 571,837
Properties 1,116,268 87,187 (55,656) (794,998) - 352,801
Engineering construction
1,496,231 - - - (44,740) 1,451,491
Others 6,785 8 - (2,081) - 4,712
Total 3,886,316 368,060 (169,277) (953,034) (103,284) 3,028,781
(7) Financial assets held under resale agreements
The Group
Item 2013 2012
Securities 48,292,625 15,127,438
Bills 225,046,160 44,707,434
Loans 528,127 -
Others 13,380,505 9,247,207
Total 287,247,417 69,082,079
(8) Loans and advances to customers
The Group
Item Note 2013 2012
Corporate loans
- Loans 1,442,591,819 1,263,091,930
- Discounted bills 64,769,424 74,994,005
- Lease payments receivable 695,864 1,042,862
Sub-total 1,508,057,107 1,339,128,797
Personal loans
- Residential mortgages 220,924,362 195,271,452
- Credit cards 86,493,984 54,164,673
FOR THE YEAR ENDED 31 DECEMBER 2013
EXPRESSED IN RENMINBI’ 000
NOTES TO THE FINANCIAL STATEMENTSOF CITIC GROUP CORPORATION
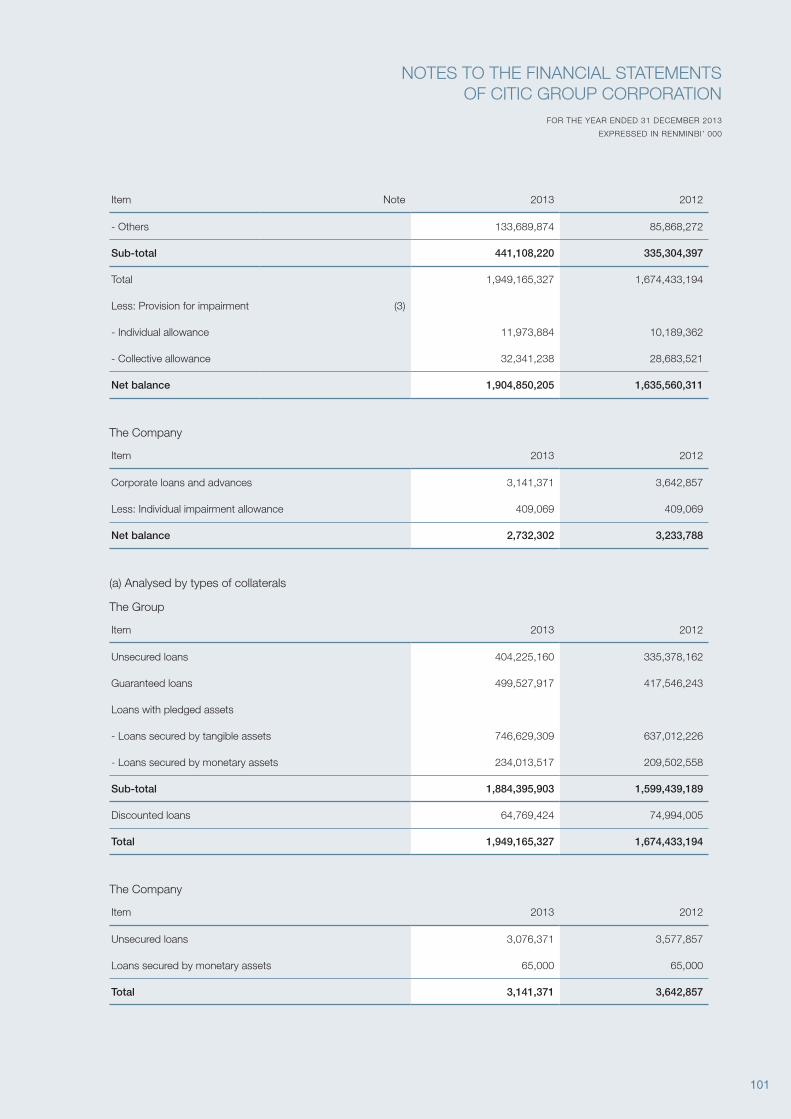
101
Item Note 2013 2012
- Others 133,689,874 85,868,272
Sub-total 441,108,220 335,304,397
Total 1,949,165,327 1,674,433,194
Less: Provision for impairment (3)
- Individual allowance 11,973,884 10,189,362
- Collective allowance 32,341,238 28,683,521
Net balance 1,904,850,205 1,635,560,311
The Company
Item 2013 2012
Corporate loans and advances 3,141,371 3,642,857
Less: Individual impairment allowance 409,069 409,069
Net balance 2,732,302 3,233,788
(a) Analysed by types of collaterals
The Group
Item 2013 2012
Unsecured loans 404,225,160 335,378,162
Guaranteed loans 499,527,917 417,546,243
Loans with pledged assets
- Loans secured by tangible assets 746,629,309 637,012,226
- Loans secured by monetary assets 234,013,517 209,502,558
Sub-total 1,884,395,903 1,599,439,189
Discounted loans 64,769,424 74,994,005
Total 1,949,165,327 1,674,433,194
The Company
Item 2013 2012
Unsecured loans 3,076,371 3,577,857
Loans secured by monetary assets 65,000 65,000
Total 3,141,371 3,642,857
FOR THE YEAR ENDED 31 DECEMBER 2013
EXPRESSED IN RENMINBI’ 000
NOTES TO THE FINANCIAL STATEMENTSOF CITIC GROUP CORPORATION

102
(b) Analysed by assessment method of allowance for impairment losses
The Group
Impaired loans and advances (ii)
Item
Loans and advances for which allowances
are collectively assessed(i)
for which allowances
are collectively assessed
for which allowances
are individually assessed
Total
Gross impaired loans and advances as a
% of gross total loans and advances
2013
Gross loans and advances
1,920,876,172 6,438,764 21,850,391 1,949,165,327 1.45%
Less: Impairment allowance against loans and advances
29,629,580 2,711,658 11,973,884 44,315,122
Total 1,891,246,592 3,727,106 9,876,507 1,904,850,205
2012
Gross loans and advances
1,655,264,644 1,296,137 17,872,413 1,674,433,194 1.14%
Less: Impairment allowance against loans
27,700,330 983,191 10,189,362 38,872,883
Total 1,627,564,314 312,946 7,683,051 1,635,560,311
( i ) Compared to the total amount of loans and advances, the amount of impaired loans and advances for which allowances are collectively assessed is not significant.(ii) Impaired loans and advances to customers include loans and advances for which objective evidence of impairment exists. These loans and advances include loans and advances for which loss provisions have been assessed- Individually, or
- collectively, represent portfolio of homogeneous loans and advances.
As at 31 December 2013, the loans and advances of the Group for which the impairment allowances were
individually assessed amounted to RMB 21,850 million (2012: RMB 17,872 million). The covered portion and
uncovered portion of these loans and advances were RMB 6,162 million (2012: RMB 6,308 million) and RMB 15,437
million (2012: RMB 11,313 million) respectively. The fair value of collaterals held against these loans and advances
amounted to RMB 13,157 million (2012: RMB
12,387 million). The individual impairment allowances made against these loans and advances were RMB
11,974 million (2012: RMB 10,189 million).
The fair value of collaterals was estimated by management based on the latest available external valuations
adjusted by taking into account the current realization experience as well as market situation.
FOR THE YEAR ENDED 31 DECEMBER 2013
EXPRESSED IN RENMINBI’ 000
NOTES TO THE FINANCIAL STATEMENTSOF CITIC GROUP CORPORATION
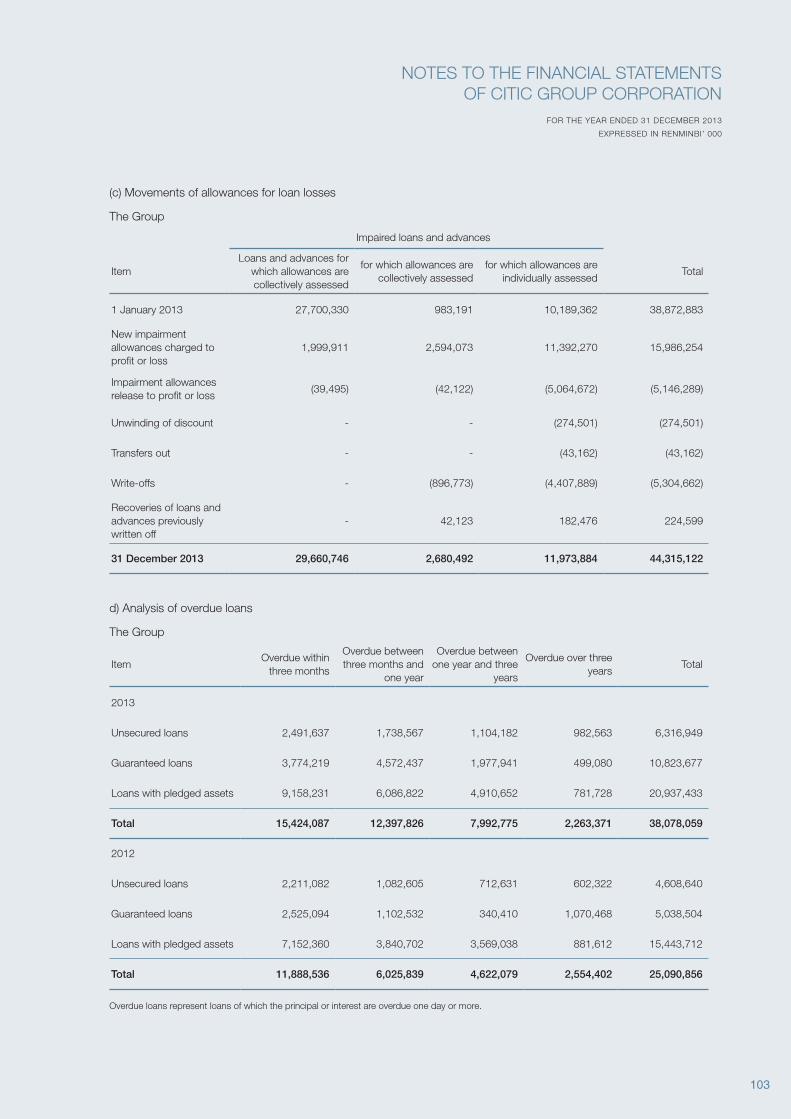
103
(c) Movements of allowances for loan losses
The Group
Impaired loans and advances
ItemLoans and advances for
which allowances are collectively assessed
for which allowances are collectively assessed
for which allowances are individually assessed
Total
1 January 2013 27,700,330 983,191 10,189,362 38,872,883
New impairment allowances charged to profit or loss
1,999,911 2,594,073 11,392,270 15,986,254
Impairment allowances release to profit or loss
(39,495) (42,122) (5,064,672) (5,146,289)
Unwinding of discount - - (274,501) (274,501)
Transfers out - - (43,162) (43,162)
Write-offs - (896,773) (4,407,889) (5,304,662)
Recoveries of loans and advances previously written off
- 42,123 182,476 224,599
31 December 2013 29,660,746 2,680,492 11,973,884 44,315,122
d) Analysis of overdue loans
The Group
Item Overdue within
three months
Overdue between three months and
one year
Overdue between one year and three
years
Overdue over three years
Total
2013
Unsecured loans 2,491,637 1,738,567 1,104,182 982,563 6,316,949
Guaranteed loans 3,774,219 4,572,437 1,977,941 499,080 10,823,677
Loans with pledged assets 9,158,231 6,086,822 4,910,652 781,728 20,937,433
Total 15,424,087 12,397,826 7,992,775 2,263,371 38,078,059
2012
Unsecured loans 2,211,082 1,082,605 712,631 602,322 4,608,640
Guaranteed loans 2,525,094 1,102,532 340,410 1,070,468 5,038,504
Loans with pledged assets 7,152,360 3,840,702 3,569,038 881,612 15,443,712
Total 11,888,536 6,025,839 4,622,079 2,554,402 25,090,856
Overdue loans represent loans of which the principal or interest are overdue one day or more.
FOR THE YEAR ENDED 31 DECEMBER 2013
EXPRESSED IN RENMINBI’ 000
NOTES TO THE FINANCIAL STATEMENTSOF CITIC GROUP CORPORATION
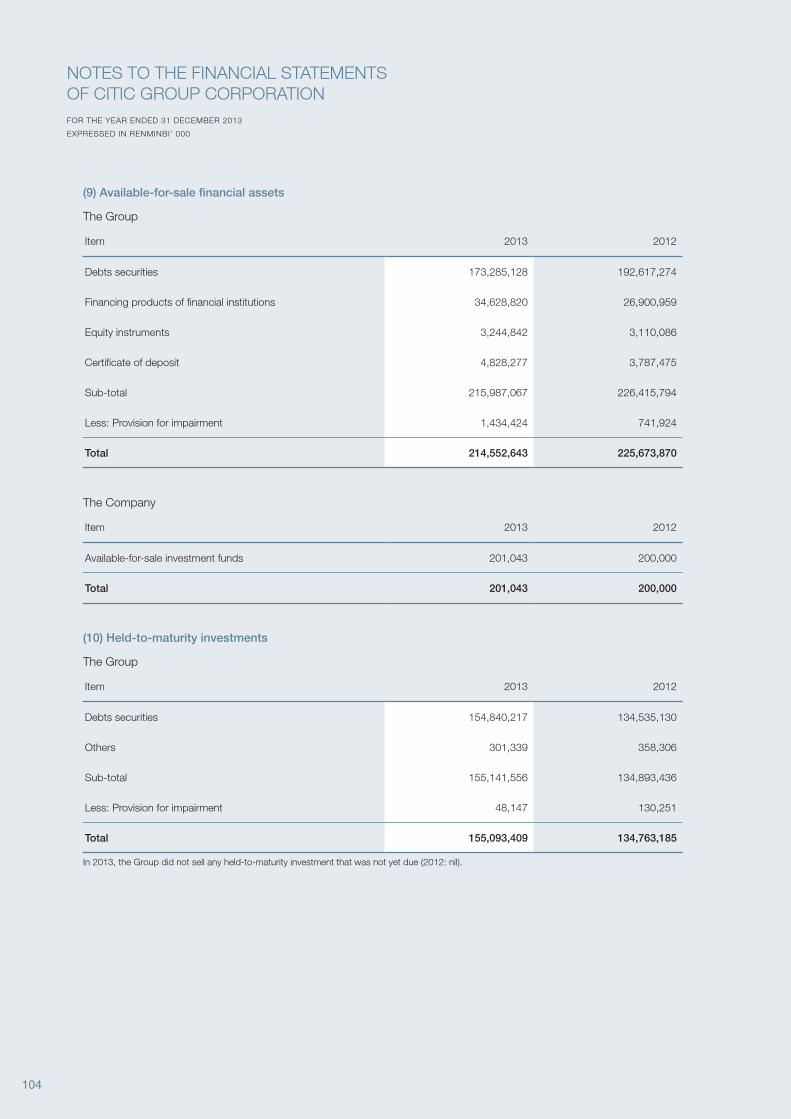
104
(9) Available-for-sale financial assets
The Group
Item 2013 2012
Debts securities 173,285,128 192,617,274
Financing products of financial institutions 34,628,820 26,900,959
Equity instruments 3,244,842 3,110,086
Certificate of deposit 4,828,277 3,787,475
Sub-total 215,987,067 226,415,794
Less: Provision for impairment 1,434,424 741,924
Total 214,552,643 225,673,870
The Company
Item 2013 2012
Available-for-sale investment funds 201,043 200,000
Total 201,043 200,000
(10) Held-to-maturity investments
The Group
Item 2013 2012
Debts securities 154,840,217 134,535,130
Others 301,339 358,306
Sub-total 155,141,556 134,893,436
Less: Provision for impairment 48,147 130,251
Total 155,093,409 134,763,185
In 2013, the Group did not sell any held-to-maturity investment that was not yet due (2012: nil).
FOR THE YEAR ENDED 31 DECEMBER 2013
EXPRESSED IN RENMINBI’ 000
NOTES TO THE FINANCIAL STATEMENTSOF CITIC GROUP CORPORATION
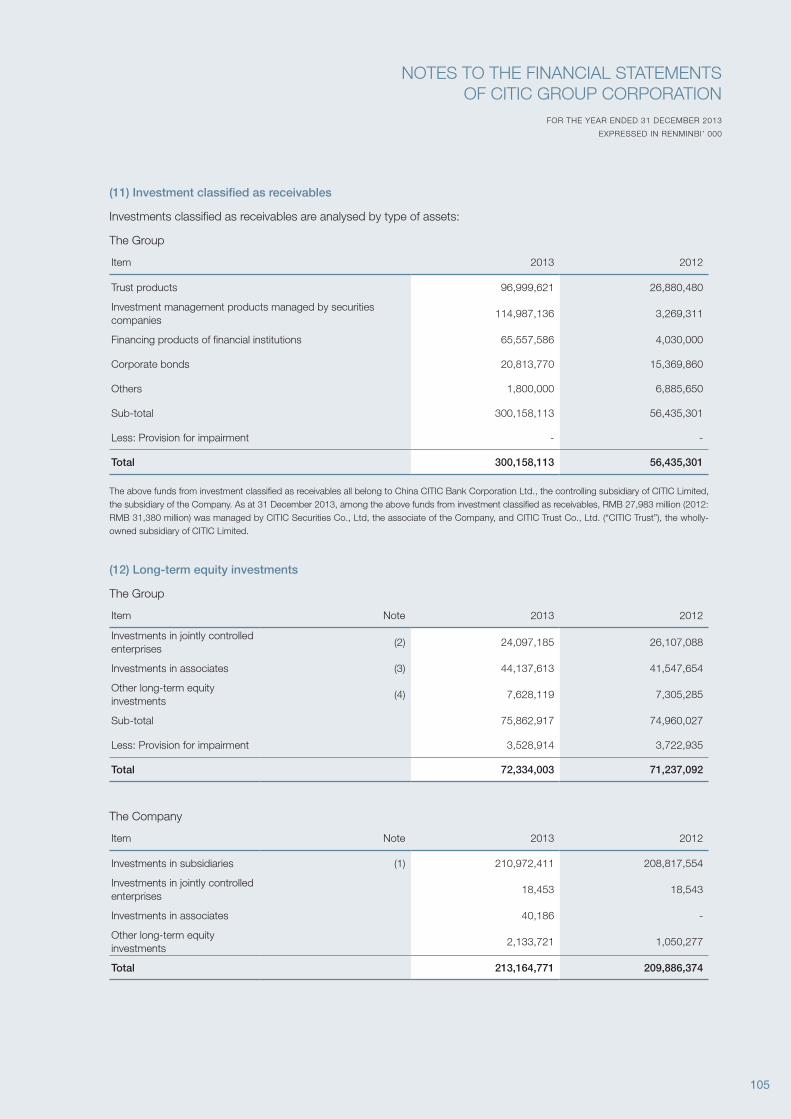
105
(11) Investment classified as receivables
Investments classified as receivables are analysed by type of assets:
The Group
Item 2013 2012
Trust products 96,999,621 26,880,480
Investment management products managed by securities companies
114,987,136 3,269,311
Financing products of financial institutions 65,557,586 4,030,000
Corporate bonds 20,813,770 15,369,860
Others 1,800,000 6,885,650
Sub-total 300,158,113 56,435,301
Less: Provision for impairment - -
Total 300,158,113 56,435,301
The above funds from investment classified as receivables all belong to China CITIC Bank Corporation Ltd., the controlling subsidiary of CITIC Limited, the subsidiary of the Company. As at 31 December 2013, among the above funds from investment classified as receivables, RMB 27,983 million (2012: RMB 31,380 million) was managed by CITIC Securities Co., Ltd, the associate of the Company, and CITIC Trust Co., Ltd. (“CITIC Trust”), the wholly-owned subsidiary of CITIC Limited.
(12) Long-term equity investments
The Group
Item Note 2013 2012
Investments in jointly controlled enterprises
(2) 24,097,185 26,107,088
Investments in associates (3) 44,137,613 41,547,654
Other long-term equity investments
(4) 7,628,119 7,305,285
Sub-total 75,862,917 74,960,027
Less: Provision for impairment 3,528,914 3,722,935
Total 72,334,003 71,237,092
The Company
Item Note 2013 2012
Investments in subsidiaries (1) 210,972,411 208,817,554
Investments in jointly controlled enterprises
18,453 18,543
Investments in associates 40,186 -
Other long-term equity investments
2,133,721 1,050,277
Total 213,164,771 209,886,374
FOR THE YEAR ENDED 31 DECEMBER 2013
EXPRESSED IN RENMINBI’ 000
NOTES TO THE FINANCIAL STATEMENTSOF CITIC GROUP CORPORATION

106
(a) The Company’s investments in major subsidiaries are as follows:
Item 2013 2012
CITIC Limited 204,273,622 204,273,622
Others 6,698,789 4,543,932
Total 210,972,411 208,817,554
See Note 6 (1) for details of the subsidiaries.
(b) Investments in major jointly controlled enterprises are as follows:
The Group
Item 2013 2012
CITIC Capital Holding Limited 2,637,132 2,525,954
CITIC-Prudential Life Insurance Co., Ltd 2,365,872 2,262,128
Bowenvale Limited 2,262,027 2,338,311
Shandong Xinjulong Energy Co., Ltd. 2,061,638 2,054,552
Silver Wings Enterprises Inc. - 2,323,903
Others 14,770,516 14,602,240
Sub-total 24,097,185 26,107,088
Less: Provision for impairment 72,297 107,968
Total 24,024,888 25,999,120
FOR THE YEAR ENDED 31 DECEMBER 2013
EXPRESSED IN RENMINBI’ 000
NOTES TO THE FINANCIAL STATEMENTSOF CITIC GROUP CORPORATION
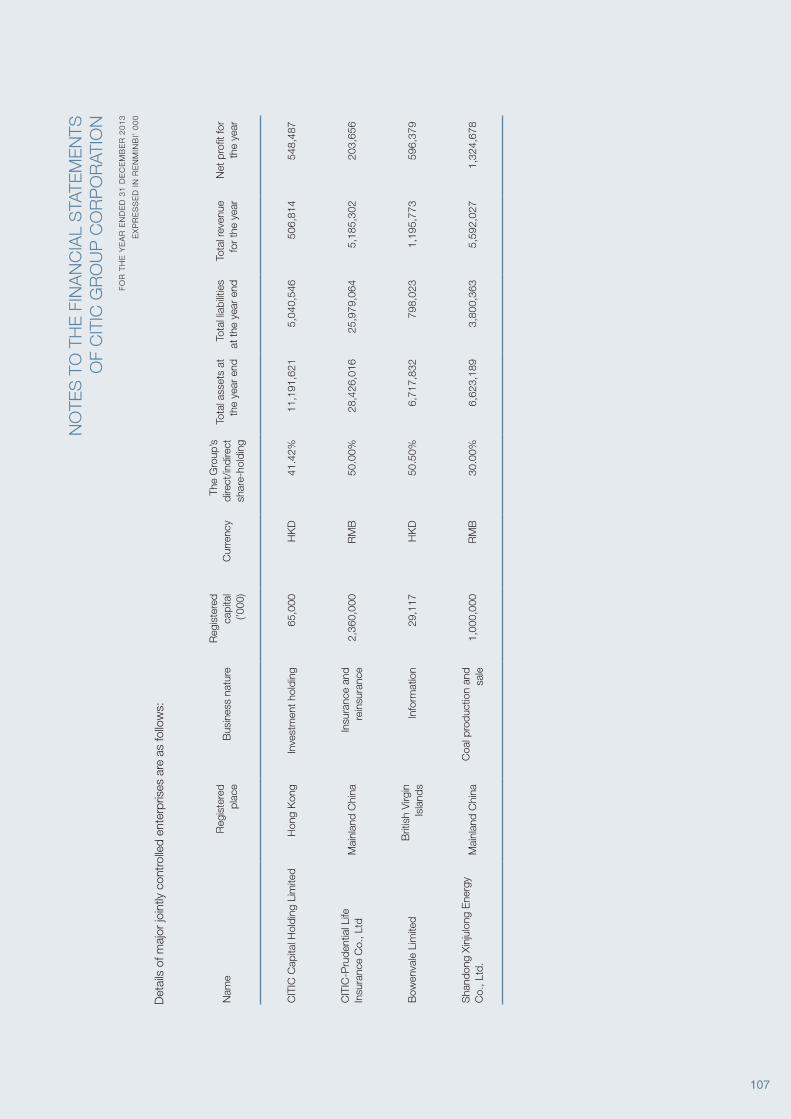
107
Det
ails
of m
ajor
join
tly c
ontr
olle
d en
terp
rises
are
as
follo
ws:
Nam
eR
egis
tere
d pl
ace
Bus
ines
s na
ture
Reg
iste
red
capi
tal
(’000
)C
urre
ncy
The
Gro
up’s
di
rect
/indi
rect
sh
are-
hold
ing
Tota
l ass
ets
at
the
year
end
Tota
l lia
bilit
ies
at th
e ye
ar e
ndTo
tal r
even
ue
for
the
year
Net
pro
fit fo
r th
e ye
ar
CIT
IC C
apita
l Hol
ding
Lim
ited
Hon
g K
ong
Inve
stm
ent h
oldi
ng65
,000
HK
D41
.42%
11,1
91,6
215,
040,
546
506,
814
548,
487
CIT
IC-P
rude
ntia
l Life
In
sura
nce
Co.
, Ltd
Mai
nlan
d C
hina
Insu
ranc
e an
d re
insu
ranc
e2,
360,
000
RM
B50
.00%
28,4
26,0
1625
,979
,064
5,18
5,30
220
3,65
6
Bow
enva
le L
imite
dB
ritis
h V
irgin
Is
land
sIn
form
atio
n29
,117
HK
D50
.50%
6,71
7,83
279
8,02
31,
195,
773
596,
379
Sha
ndon
g Xi
njul
ong
Ene
rgy
Co.
, Ltd
.M
ainl
and
Chi
naC
oal p
rodu
ctio
n an
d sa
le1,
000,
000
RM
B30
.00%
6,62
3,18
93,
800,
363
5,59
2,02
71,
324,
678
FO
R T
HE
YE
AR
EN
DE
D 3
1 D
EC
EM
BE
R 2
01
3
EX
PR
ES
SE
D I
N R
EN
MIN
BI’
00
0
NO
TES
TO
TH
E F
INA
NC
IAL
STA
TEM
EN
TSO
F C
ITIC
GR
OU
P C
OR
PO
RAT
ION

108
(c) Investments in major associates are as follows:
The Group
Item 2013 2012
CITIC Securities Company Limited 19,368,699 19,111,836
Hong Kong Resort Company Limited 3,610,089 3,686,363
CITIC Dameng Holdings Limited 3,312,754 3,437,009
Alumina Limited 2,894,576 -
Shenyang Coking Coal Company Limited 2,720,063 2,860,013
Sinopec Yizheng Chemical Fibre Company Limited 1,343,213 1,554,774
Others 10,888,219 10,897,659
Sub-total 44,137,613 41,547,654
Less: Provision for impairment 2,866,476 2,731,600
Total 41,271,137 38,816,054
FOR THE YEAR ENDED 31 DECEMBER 2013
EXPRESSED IN RENMINBI’ 000
NOTES TO THE FINANCIAL STATEMENTSOF CITIC GROUP CORPORATION

109
Det
ails
of t
he G
roup
’s m
ajor
ass
ocia
tes
are
as fo
llow
s:
Nam
eR
egis
tere
d pl
ace
Bus
ines
s na
ture
Reg
iste
red
capi
tal(’
000)
Cur
renc
yTh
e G
roup
’s
dire
ct/in
dire
ctsh
are-
hold
ing
Tota
l ass
ets
at
the
year
end
Tota
l lia
bilit
ies
at th
e ye
ar e
ndTo
tal r
even
ue
for
the
year
Net
pro
fit/(l
oss)
fo
r th
e ye
ar
CIT
IC S
ecur
ities
Com
pany
Li
mite
dM
ainl
and
Chi
naFi
nanc
ial s
ervi
ces
11,0
16,9
08R
MB
20.8
8%27
1,35
4,24
918
1,95
2,15
416
,115
,272
5,30
8,04
7
Hon
g K
ong
Res
ort C
ompa
ny
Lim
ited
Hon
g K
ong
Pro
pert
y de
velo
pmen
t23
7,50
0H
KD
50.0
0%4,
767,
830
2,15
4,72
692
2,21
710
4,42
4
CIT
IC D
amen
g H
oldi
ngs
Lim
ited
Ber
mud
aE
nerg
y an
d re
sour
ces
302,
480
HK
D49
.26%
7,28
2,41
94,
389,
734
2,32
6,51
1(2
53,4
87)
Alu
min
a Li
mite
dA
ustr
alia
Ene
rgy
and
reso
urce
s2,
620,
000
US
D13
.62%
18,0
71,2
121,
040,
131
1,85
73,
095
She
nyan
g C
okin
g C
oal
Com
pany
Lim
ited
Mai
nlan
d C
hina
Ene
rgy
and
reso
urce
s3,
000,
000
RM
B21
.86%
15,0
88,9
1710
,751
,516
7,07
8,19
653
,710
Sin
opec
Yiz
heng
Che
mic
al
Fibr
e C
ompa
ny L
imite
dM
ainl
and
Chi
naM
anuf
actu
ring
4,00
0,00
0R
MB
17.2
5%10
,629
,304
3,53
2,81
617
,677
,171
(1,4
54,2
17)
FO
R T
HE
YE
AR
EN
DE
D 3
1 D
EC
EM
BE
R 2
01
3
EX
PR
ES
SE
D I
N R
EN
MIN
BI’
00
0
NO
TES
TO
TH
E F
INA
NC
IAL
STA
TEM
EN
TSO
F C
ITIC
GR
OU
P C
OR
PO
RAT
ION
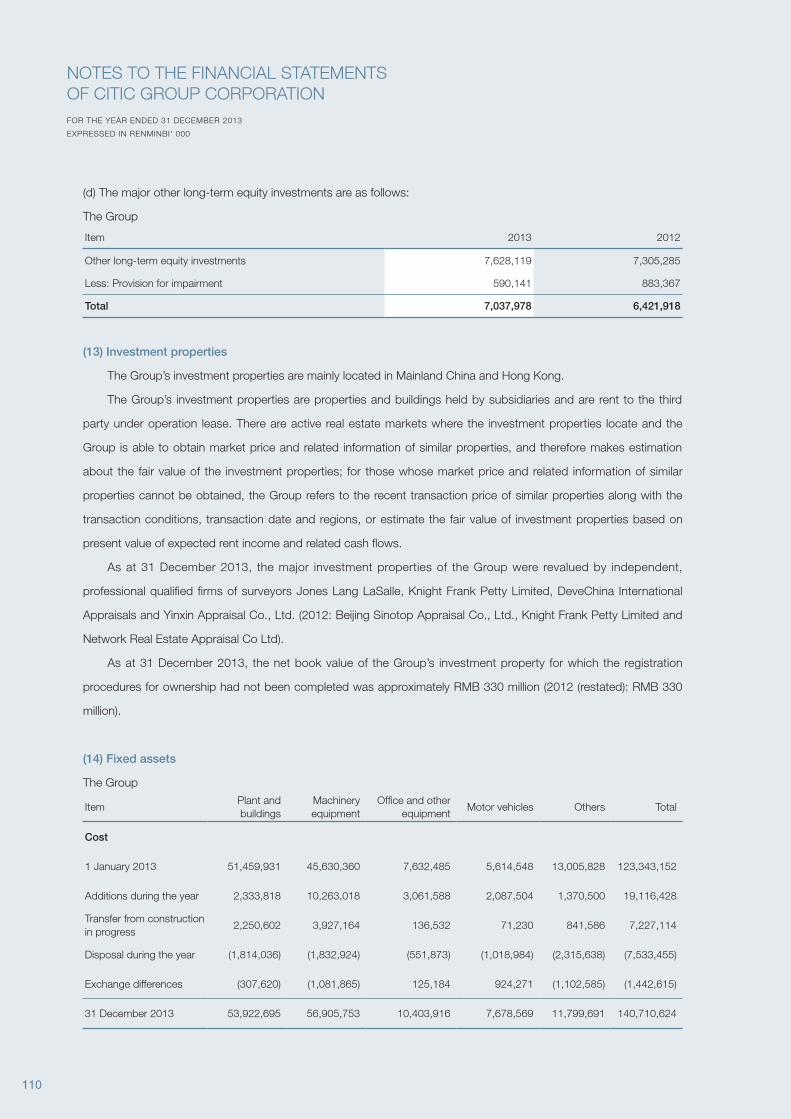
110
(d) The major other long-term equity investments are as follows:
The Group
Item 2013 2012
Other long-term equity investments 7,628,119 7,305,285
Less: Provision for impairment 590,141 883,367
Total 7,037,978 6,421,918
(13) Investment properties
The Group’s investment properties are mainly located in Mainland China and Hong Kong.
The Group’s investment properties are properties and buildings held by subsidiaries and are rent to the third
party under operation lease. There are active real estate markets where the investment properties locate and the
Group is able to obtain market price and related information of similar properties, and therefore makes estimation
about the fair value of the investment properties; for those whose market price and related information of similar
properties cannot be obtained, the Group refers to the recent transaction price of similar properties along with the
transaction conditions, transaction date and regions, or estimate the fair value of investment properties based on
present value of expected rent income and related cash flows.
As at 31 December 2013, the major investment properties of the Group were revalued by independent,
professional qualified firms of surveyors Jones Lang LaSalle, Knight Frank Petty Limited, DeveChina International
Appraisals and Yinxin Appraisal Co., Ltd. (2012: Beijing Sinotop Appraisal Co., Ltd., Knight Frank Petty Limited and
Network Real Estate Appraisal Co Ltd).
As at 31 December 2013, the net book value of the Group’s investment property for which the registration
procedures for ownership had not been completed was approximately RMB 330 million (2012 (restated): RMB 330
million).
(14) Fixed assets
The Group
ItemPlant and buildings
Machinery equipment
Office and other equipment
Motor vehicles Others Total
Cost
1 January 2013 51,459,931 45,630,360 7,632,485 5,614,548 13,005,828 123,343,152
Additions during the year 2,333,818 10,263,018 3,061,588 2,087,504 1,370,500 19,116,428
Transfer from construction in progress
2,250,602 3,927,164 136,532 71,230 841,586 7,227,114
Disposal during the year (1,814,036) (1,832,924) (551,873) (1,018,984) (2,315,638) (7,533,455)
Exchange differences (307,620) (1,081,865) 125,184 924,271 (1,102,585) (1,442,615)
31 December 2013 53,922,695 56,905,753 10,403,916 7,678,569 11,799,691 140,710,624
FOR THE YEAR ENDED 31 DECEMBER 2013
EXPRESSED IN RENMINBI’ 000
NOTES TO THE FINANCIAL STATEMENTSOF CITIC GROUP CORPORATION
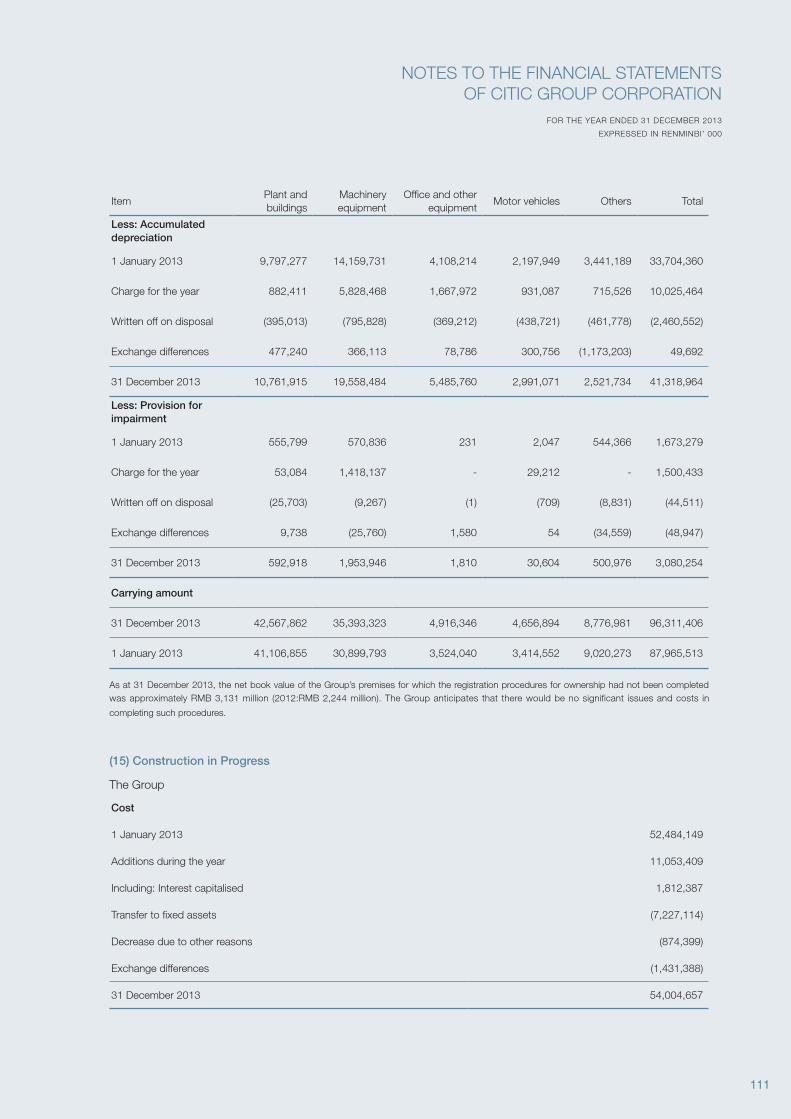
111
ItemPlant and buildings
Machinery equipment
Office and other equipment
Motor vehicles Others Total
Less: Accumulated depreciation
1 January 2013 9,797,277 14,159,731 4,108,214 2,197,949 3,441,189 33,704,360
Charge for the year 882,411 5,828,468 1,667,972 931,087 715,526 10,025,464
Written off on disposal (395,013) (795,828) (369,212) (438,721) (461,778) (2,460,552)
Exchange differences 477,240 366,113 78,786 300,756 (1,173,203) 49,692
31 December 2013 10,761,915 19,558,484 5,485,760 2,991,071 2,521,734 41,318,964
Less: Provision for impairment
1 January 2013 555,799 570,836 231 2,047 544,366 1,673,279
Charge for the year 53,084 1,418,137 - 29,212 - 1,500,433
Written off on disposal (25,703) (9,267) (1) (709) (8,831) (44,511)
Exchange differences 9,738 (25,760) 1,580 54 (34,559) (48,947)
31 December 2013 592,918 1,953,946 1,810 30,604 500,976 3,080,254
Carrying amount
31 December 2013 42,567,862 35,393,323 4,916,346 4,656,894 8,776,981 96,311,406
1 January 2013 41,106,855 30,899,793 3,524,040 3,414,552 9,020,273 87,965,513
As at 31 December 2013, the net book value of the Group’s premises for which the registration procedures for ownership had not been completed was approximately RMB 3,131 million (2012:RMB 2,244 million). The Group anticipates that there would be no significant issues and costs in
completing such procedures.
(15) Construction in Progress
The Group
Cost
1 January 2013 52,484,149
Additions during the year 11,053,409
Including: Interest capitalised 1,812,387
Transfer to fixed assets (7,227,114)
Decrease due to other reasons (874,399)
Exchange differences (1,431,388)
31 December 2013 54,004,657
FOR THE YEAR ENDED 31 DECEMBER 2013
EXPRESSED IN RENMINBI’ 000
NOTES TO THE FINANCIAL STATEMENTSOF CITIC GROUP CORPORATION
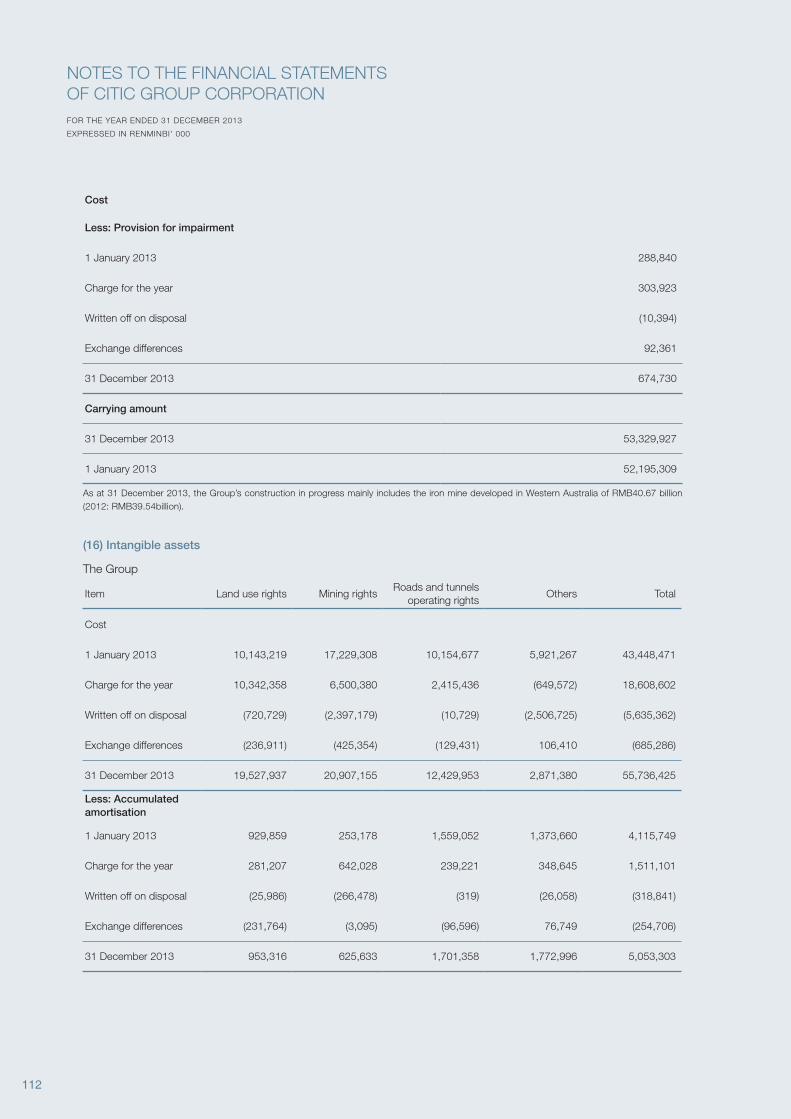
112
Cost
Less: Provision for impairment
1 January 2013 288,840
Charge for the year 303,923
Written off on disposal (10,394)
Exchange differences 92,361
31 December 2013 674,730
Carrying amount
31 December 2013 53,329,927
1 January 2013 52,195,309
As at 31 December 2013, the Group’s construction in progress mainly includes the iron mine developed in Western Australia of RMB40.67 billion (2012: RMB39.54billion).
(16) Intangible assets
The Group
Item Land use rights Mining rightsRoads and tunnels
operating rightsOthers Total
Cost
1 January 2013 10,143,219 17,229,308 10,154,677 5,921,267 43,448,471
Charge for the year 10,342,358 6,500,380 2,415,436 (649,572) 18,608,602
Written off on disposal (720,729) (2,397,179) (10,729) (2,506,725) (5,635,362)
Exchange differences (236,911) (425,354) (129,431) 106,410 (685,286)
31 December 2013 19,527,937 20,907,155 12,429,953 2,871,380 55,736,425
Less: Accumulated amortisation
1 January 2013 929,859 253,178 1,559,052 1,373,660 4,115,749
Charge for the year 281,207 642,028 239,221 348,645 1,511,101
Written off on disposal (25,986) (266,478) (319) (26,058) (318,841)
Exchange differences (231,764) (3,095) (96,596) 76,749 (254,706)
31 December 2013 953,316 625,633 1,701,358 1,772,996 5,053,303
FOR THE YEAR ENDED 31 DECEMBER 2013
EXPRESSED IN RENMINBI’ 000
NOTES TO THE FINANCIAL STATEMENTSOF CITIC GROUP CORPORATION
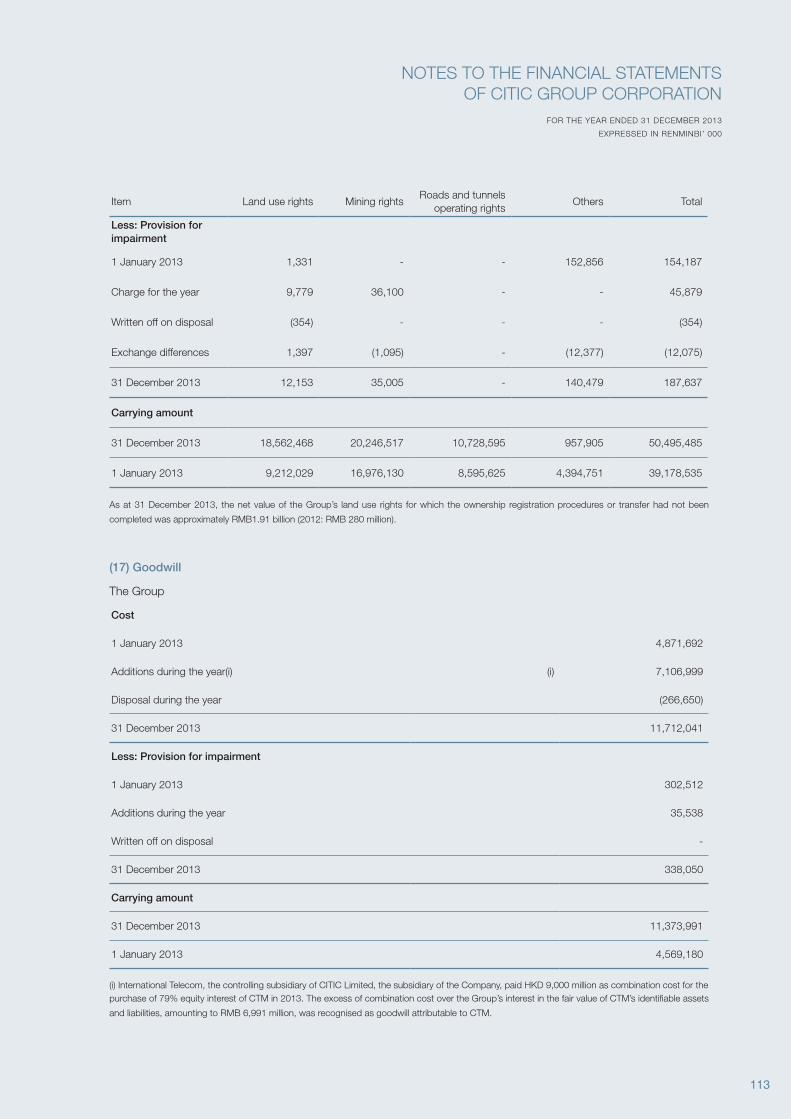
113
Item Land use rights Mining rightsRoads and tunnels
operating rightsOthers Total
Less: Provision for impairment
1 January 2013 1,331 - - 152,856 154,187
Charge for the year 9,779 36,100 - - 45,879
Written off on disposal (354) - - - (354)
Exchange differences 1,397 (1,095) - (12,377) (12,075)
31 December 2013 12,153 35,005 - 140,479 187,637
Carrying amount
31 December 2013 18,562,468 20,246,517 10,728,595 957,905 50,495,485
1 January 2013 9,212,029 16,976,130 8,595,625 4,394,751 39,178,535
As at 31 December 2013, the net value of the Group’s land use rights for which the ownership registration procedures or transfer had not been
completed was approximately RMB1.91 billion (2012: RMB 280 million).
(17) Goodwill
The Group
Cost
1 January 2013 4,871,692
Additions during the year(i) (i) 7,106,999
Disposal during the year (266,650)
31 December 2013 11,712,041
Less: Provision for impairment
1 January 2013 302,512
Additions during the year 35,538
Written off on disposal -
31 December 2013 338,050
Carrying amount
31 December 2013 11,373,991
1 January 2013 4,569,180
(i) International Telecom, the controlling subsidiary of CITIC Limited, the subsidiary of the Company, paid HKD 9,000 million as combination cost for the purchase of 79% equity interest of CTM in 2013. The excess of combination cost over the Group’s interest in the fair value of CTM’s identifiable assets
and liabilities, amounting to RMB 6,991 million, was recognised as goodwill attributable to CTM.
FOR THE YEAR ENDED 31 DECEMBER 2013
EXPRESSED IN RENMINBI’ 000
NOTES TO THE FINANCIAL STATEMENTSOF CITIC GROUP CORPORATION
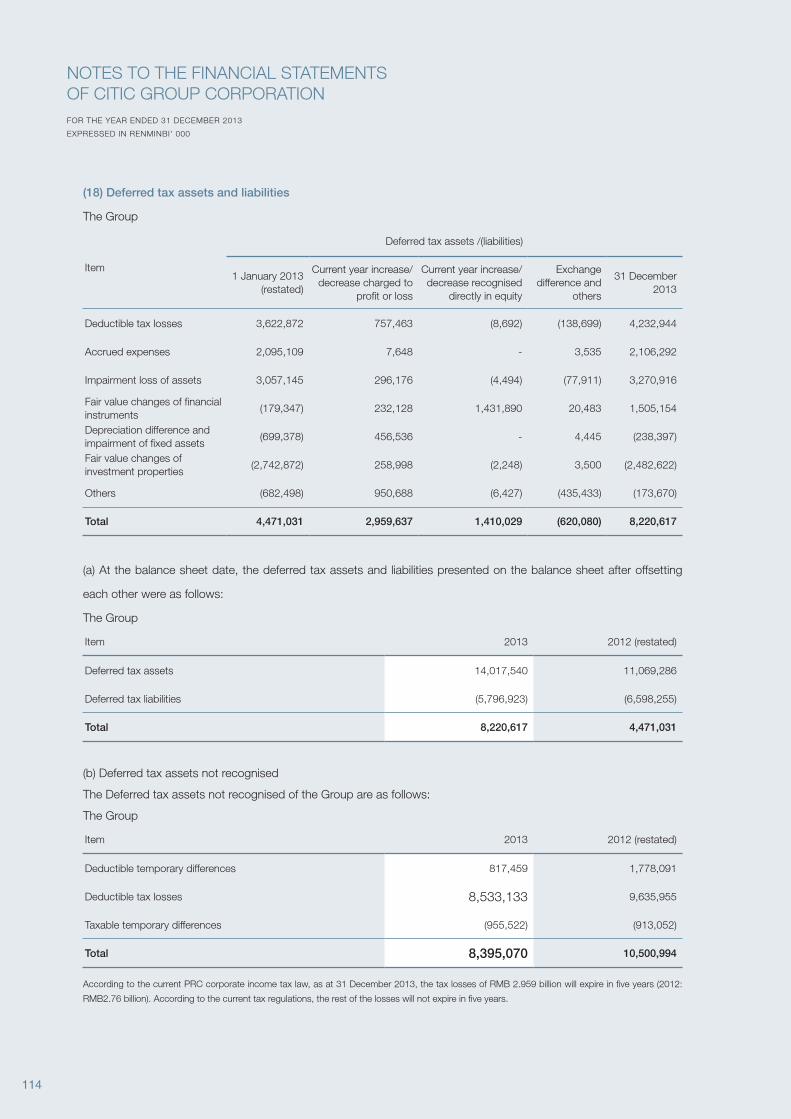
114
(18) Deferred tax assets and liabilities
The Group
Item
Deferred tax assets /(liabilities)
1 January 2013(restated)
Current year increase/decrease charged to
profit or loss
Current year increase/decrease recognised
directly in equity
Exchange difference and
others
31 December 2013
Deductible tax losses 3,622,872 757,463 (8,692) (138,699) 4,232,944
Accrued expenses 2,095,109 7,648 - 3,535 2,106,292
Impairment loss of assets 3,057,145 296,176 (4,494) (77,911) 3,270,916
Fair value changes of financial instruments
(179,347) 232,128 1,431,890 20,483 1,505,154
Depreciation difference and impairment of fixed assets
(699,378) 456,536 - 4,445 (238,397)
Fair value changes of investment properties
(2,742,872) 258,998 (2,248) 3,500 (2,482,622)
Others (682,498) 950,688 (6,427) (435,433) (173,670)
Total 4,471,031 2,959,637 1,410,029 (620,080) 8,220,617
(a) At the balance sheet date, the deferred tax assets and liabilities presented on the balance sheet after offsetting
each other were as follows:
The Group
Item 2013 2012 (restated)
Deferred tax assets 14,017,540 11,069,286
Deferred tax liabilities (5,796,923) (6,598,255)
Total 8,220,617 4,471,031
(b) Deferred tax assets not recognised
The Deferred tax assets not recognised of the Group are as follows:
The Group
Item 2013 2012 (restated)
Deductible temporary differences 817,459 1,778,091
Deductible tax losses 8,533,133 9,635,955
Taxable temporary differences (955,522) (913,052)
Total 8,395,070 10,500,994
According to the current PRC corporate income tax law, as at 31 December 2013, the tax losses of RMB 2.959 billion will expire in five years (2012:
RMB2.76 billion). According to the current tax regulations, the rest of the losses will not expire in five years.
FOR THE YEAR ENDED 31 DECEMBER 2013
EXPRESSED IN RENMINBI’ 000
NOTES TO THE FINANCIAL STATEMENTSOF CITIC GROUP CORPORATION
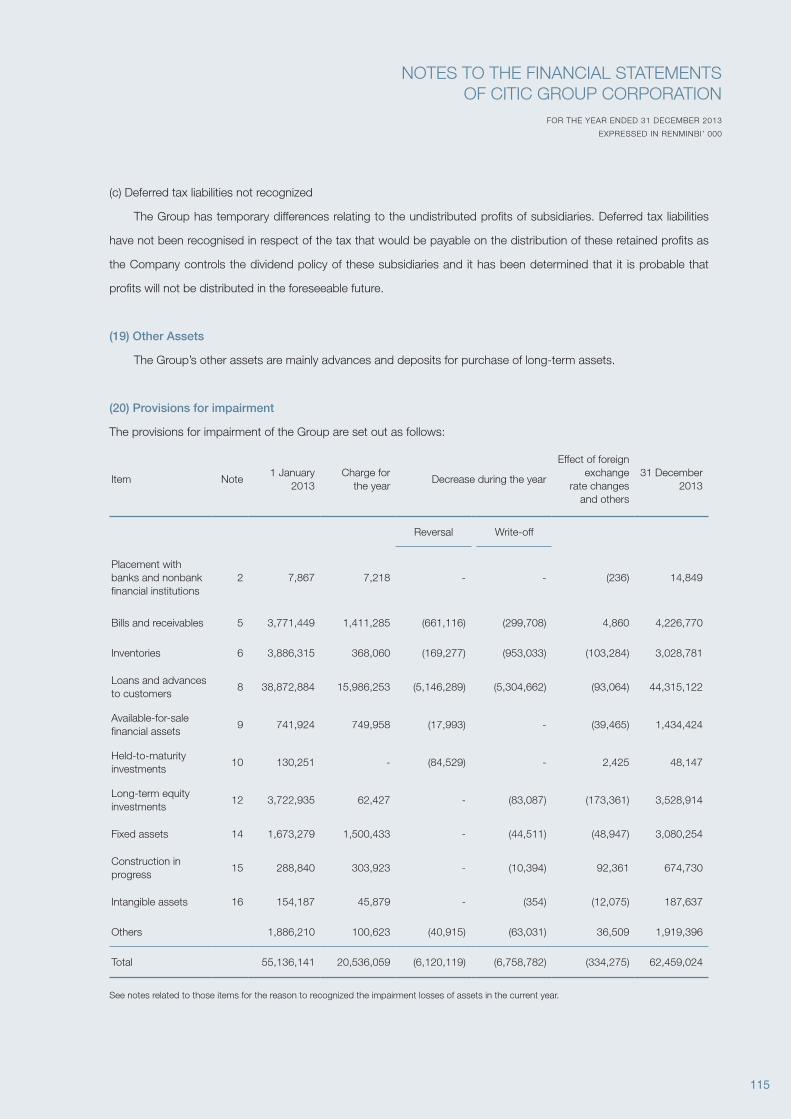
115
(c) Deferred tax liabilities not recognized
The Group has temporary differences relating to the undistributed profits of subsidiaries. Deferred tax liabilities
have not been recognised in respect of the tax that would be payable on the distribution of these retained profits as
the Company controls the dividend policy of these subsidiaries and it has been determined that it is probable that
profits will not be distributed in the foreseeable future.
(19) Other Assets
The Group’s other assets are mainly advances and deposits for purchase of long-term assets.
(20) Provisions for impairment
The provisions for impairment of the Group are set out as follows:
Item Note1 January
2013Charge for
the yearDecrease during the year
Effect of foreign exchange
rate changes and others
31 December 2013
Reversal Write-off
Placement with banks and nonbank financial institutions
2 7,867 7,218 - - (236) 14,849
Bills and receivables 5 3,771,449 1,411,285 (661,116) (299,708) 4,860 4,226,770
Inventories 6 3,886,315 368,060 (169,277) (953,033) (103,284) 3,028,781
Loans and advances to customers
8 38,872,884 15,986,253 (5,146,289) (5,304,662) (93,064) 44,315,122
Available-for-sale financial assets
9 741,924 749,958 (17,993) - (39,465) 1,434,424
Held-to-maturity investments
10 130,251 - (84,529) - 2,425 48,147
Long-term equity investments
12 3,722,935 62,427 - (83,087) (173,361) 3,528,914
Fixed assets 14 1,673,279 1,500,433 - (44,511) (48,947) 3,080,254
Construction in progress
15 288,840 303,923 - (10,394) 92,361 674,730
Intangible assets 16 154,187 45,879 - (354) (12,075) 187,637
Others 1,886,210 100,623 (40,915) (63,031) 36,509 1,919,396
Total 55,136,141 20,536,059 (6,120,119) (6,758,782) (334,275) 62,459,024
See notes related to those items for the reason to recognized the impairment losses of assets in the current year.
FOR THE YEAR ENDED 31 DECEMBER 2013
EXPRESSED IN RENMINBI’ 000
NOTES TO THE FINANCIAL STATEMENTSOF CITIC GROUP CORPORATION
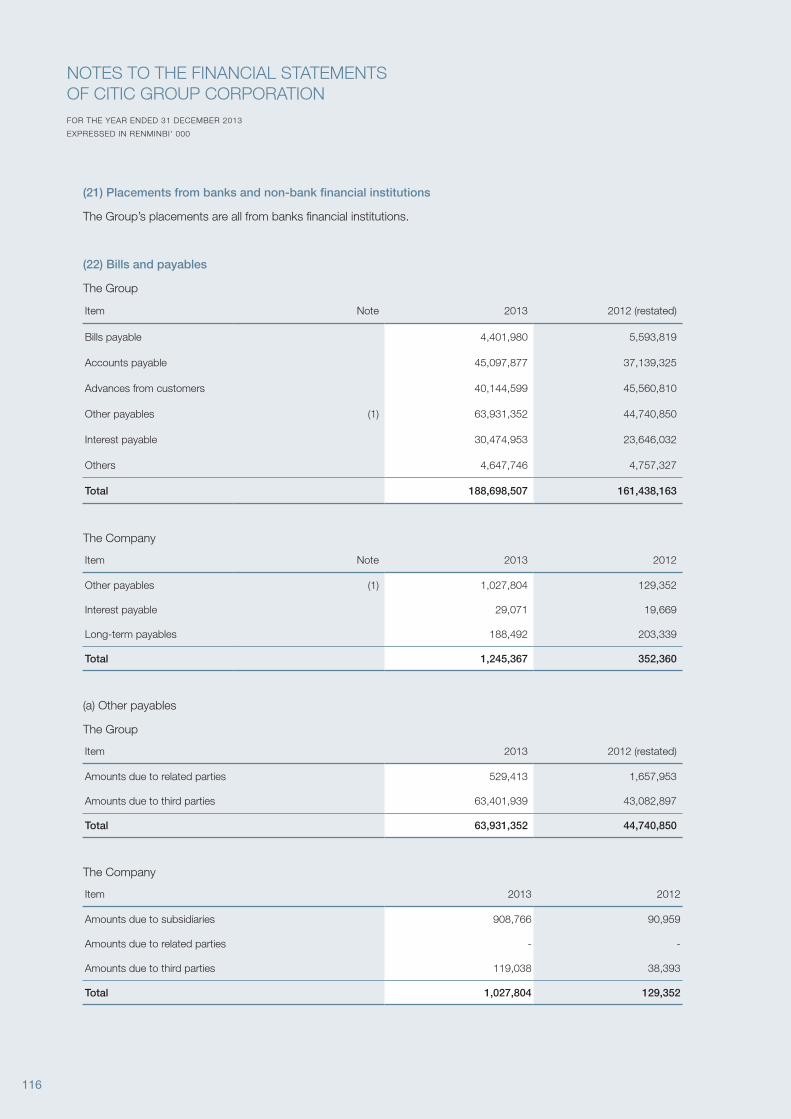
116
(21) Placements from banks and non-bank financial institutions
The Group’s placements are all from banks financial institutions.
(22) Bills and payables
The Group
Item Note 2013 2012 (restated)
Bills payable 4,401,980 5,593,819
Accounts payable 45,097,877 37,139,325
Advances from customers 40,144,599 45,560,810
Other payables (1) 63,931,352 44,740,850
Interest payable 30,474,953 23,646,032
Others 4,647,746 4,757,327
Total 188,698,507 161,438,163
The Company
Item Note 2013 2012
Other payables (1) 1,027,804 129,352
Interest payable 29,071 19,669
Long-term payables 188,492 203,339
Total 1,245,367 352,360
(a) Other payables
The Group
Item 2013 2012 (restated)
Amounts due to related parties 529,413 1,657,953
Amounts due to third parties 63,401,939 43,082,897
Total 63,931,352 44,740,850
The Company
Item 2013 2012
Amounts due to subsidiaries 908,766 90,959
Amounts due to related parties - -
Amounts due to third parties 119,038 38,393
Total 1,027,804 129,352
FOR THE YEAR ENDED 31 DECEMBER 2013
EXPRESSED IN RENMINBI’ 000
NOTES TO THE FINANCIAL STATEMENTSOF CITIC GROUP CORPORATION
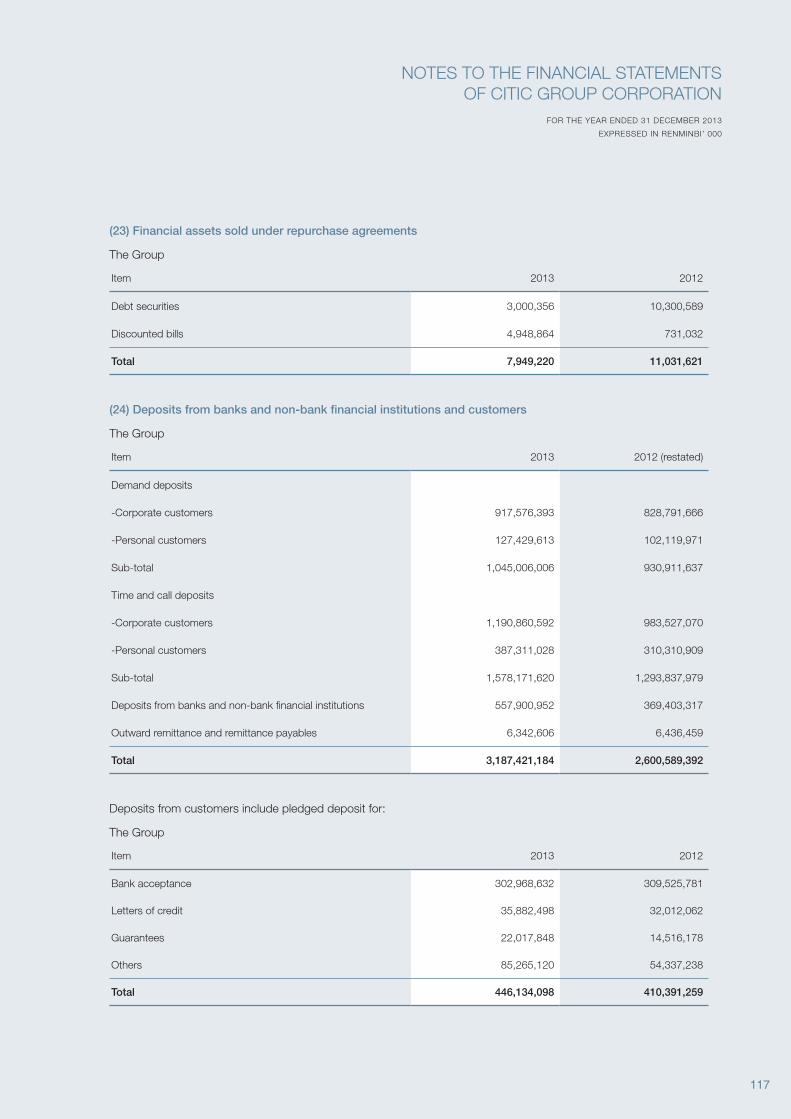
117
(23) Financial assets sold under repurchase agreements
The Group
Item 2013 2012
Debt securities 3,000,356 10,300,589
Discounted bills 4,948,864 731,032
Total 7,949,220 11,031,621
(24) Deposits from banks and non-bank financial institutions and customers
The Group
Item 2013 2012 (restated)
Demand deposits
-Corporate customers 917,576,393 828,791,666
-Personal customers 127,429,613 102,119,971
Sub-total 1,045,006,006 930,911,637
Time and call deposits
-Corporate customers 1,190,860,592 983,527,070
-Personal customers 387,311,028 310,310,909
Sub-total 1,578,171,620 1,293,837,979
Deposits from banks and non-bank financial institutions 557,900,952 369,403,317
Outward remittance and remittance payables 6,342,606 6,436,459
Total 3,187,421,184 2,600,589,392
Deposits from customers include pledged deposit for:
The Group
Item 2013 2012
Bank acceptance 302,968,632 309,525,781
Letters of credit 35,882,498 32,012,062
Guarantees 22,017,848 14,516,178
Others 85,265,120 54,337,238
Total 446,134,098 410,391,259
FOR THE YEAR ENDED 31 DECEMBER 2013
EXPRESSED IN RENMINBI’ 000
NOTES TO THE FINANCIAL STATEMENTSOF CITIC GROUP CORPORATION
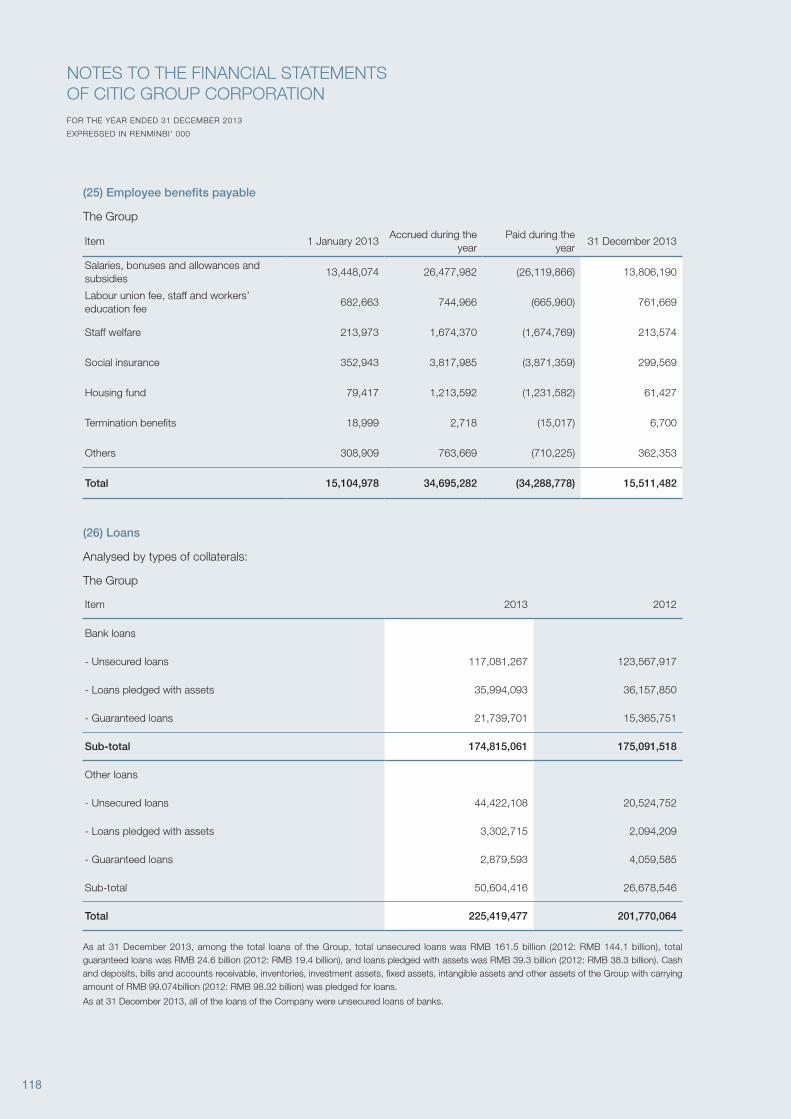
118
(25) Employee benefits payable
The Group
Item 1 January 2013Accrued during the
yearPaid during the
year31 December 2013
Salaries, bonuses and allowances and subsidies
13,448,074 26,477,982 (26,119,866) 13,806,190
Labour union fee, staff and workers’ education fee
682,663 744,966 (665,960) 761,669
Staff welfare 213,973 1,674,370 (1,674,769) 213,574
Social insurance 352,943 3,817,985 (3,871,359) 299,569
Housing fund 79,417 1,213,592 (1,231,582) 61,427
Termination benefits 18,999 2,718 (15,017) 6,700
Others 308,909 763,669 (710,225) 362,353
Total 15,104,978 34,695,282 (34,288,778) 15,511,482
(26) Loans
Analysed by types of collaterals:
The Group
Item 2013 2012
Bank loans
- Unsecured loans 117,081,267 123,567,917
- Loans pledged with assets 35,994,093 36,157,850
- Guaranteed loans 21,739,701 15,365,751
Sub-total 174,815,061 175,091,518
Other loans
- Unsecured loans 44,422,108 20,524,752
- Loans pledged with assets 3,302,715 2,094,209
- Guaranteed loans 2,879,593 4,059,585
Sub-total 50,604,416 26,678,546
Total 225,419,477 201,770,064
As at 31 December 2013, among the total loans of the Group, total unsecured loans was RMB 161.5 billion (2012: RMB 144.1 billion), total guaranteed loans was RMB 24.6 billion (2012: RMB 19.4 billion), and loans pledged with assets was RMB 39.3 billion (2012: RMB 38.3 billion). Cash and deposits, bills and accounts receivable, inventories, investment assets, fixed assets, intangible assets and other assets of the Group with carrying amount of RMB 99.074billion (2012: RMB 98.32 billion) was pledged for loans.
As at 31 December 2013, all of the loans of the Company were unsecured loans of banks.
FOR THE YEAR ENDED 31 DECEMBER 2013
EXPRESSED IN RENMINBI’ 000
NOTES TO THE FINANCIAL STATEMENTSOF CITIC GROUP CORPORATION

119
Analysed by currencies:
The Group
Item 2013 2012
Loans in RMB 111,671,688 104,652,985
Loans in USD 89,200,711 73,426,872
Loans in HKD 19,412,575 20,446,311
Loans in other currencies 5,134,503 3,243,896
Total 225,419,477 201,770,064
The Company
Item 2013 2012
Loans in RMB 500,000 500,000
Loans in USD - 3,834,155
Total 500,000 4,334,155
As at 31 December 2013, the Group’s total loans in foreign currency was RMB 113.7 billion (2012: equivalent to RMB 97.1 billion), among which loans in USD was RMB 89.2 billion (2012: RMB 73.4 billion), loans in HKD was RMB19.4 billion (2012: RMB 20.4 billion), and loans in other currencies was RMB 5.1 billion (2012: RMB3.2 billion).
The maturity analysis of loans is as follows:
The Group
Item 2013 2012
Due within 1 year (inclusive) 89,518,198 73,886,422
Due after 1 year but within 5 years (inclusive) 107,390,201 94,763,666
Due after 5 years 28,511,078 33,119,976
Total 225,419,477 201,770,064
The Company
Item 2013 2012
Due within 1 year (inclusive) 500,000 125,710
Due after 1 year but within 5 years (inclusive) - 4,208,445
Due after 5 years - -
Total 500,000 4,334,155
As at 31 December 2013, the fixed interest rates per annum for the Group’s loans range from 0.6% to 14.4% (2012: 0% to 14.4%), and the floating interests rates per annum for the Group’s loans are based on domestic and overseas inter-bank offered rates plus an interest margin. As at 31 December 2013, the interest rates for the Group’s loans range from 1.0% to 7.6% (2012: 0.7% to 5.0%).As at 31 December 2013, the interest rate for the Company’s long-term loans (RMB) based on 3-year PBOC benchmark interest rate was 6.15% on the last interest payment date of the year.
(27) Debts securities issued
FOR THE YEAR ENDED 31 DECEMBER 2013
EXPRESSED IN RENMINBI’ 000
NOTES TO THE FINANCIAL STATEMENTSOF CITIC GROUP CORPORATION

120
The Group
Item 2013 2012
Corporate bonds issued 60,323,147 54,218,320
Notes issued 29,678,738 29,416,723
Subordinated debts issued 45,279,432 43,901,395
Certificates of deposit issued 12,717,736 11,592,799
Debt securities issued 15,903,658 907,917
Convertible bonds issued 222,757 492,097
Certificates of interbank deposit issued 2,967,980 -
Total 167,093,448 140,529,251
The Company
Item 2013 2012
Corporate bonds issued 577,710 730,490
Notes issued - -
Total 577,710 730,490
The maturity analysis of debts securities issued is as follows:
The Group
Item 2013 2012
Due within 1 year (inclusive) 28,843,272 15,845,544
Due after 1 year but within 5 years (inclusive) 45,659,198 29,095,620
Due after 5 years 92,590,978 95,588,087
Total 167,093,448 140,529,251
The Company
Item 2013 2012
Due within 1 year (inclusive) - -
Due after 1 year but within 5 years (inclusive) 577,710 730,490
Due after 5 years - -
Total 577,710 730,490
As at 31 December 2013 and 2012, the fixed interest rates per annum for the Group’s debt securities range from 0.5%-6.9%, and the floating interests rates per annum for the Group’s debt securities based on Interbank Offered rates of different region plus-margins of bank from different
districts.
FOR THE YEAR ENDED 31 DECEMBER 2013
EXPRESSED IN RENMINBI’ 000
NOTES TO THE FINANCIAL STATEMENTSOF CITIC GROUP CORPORATION
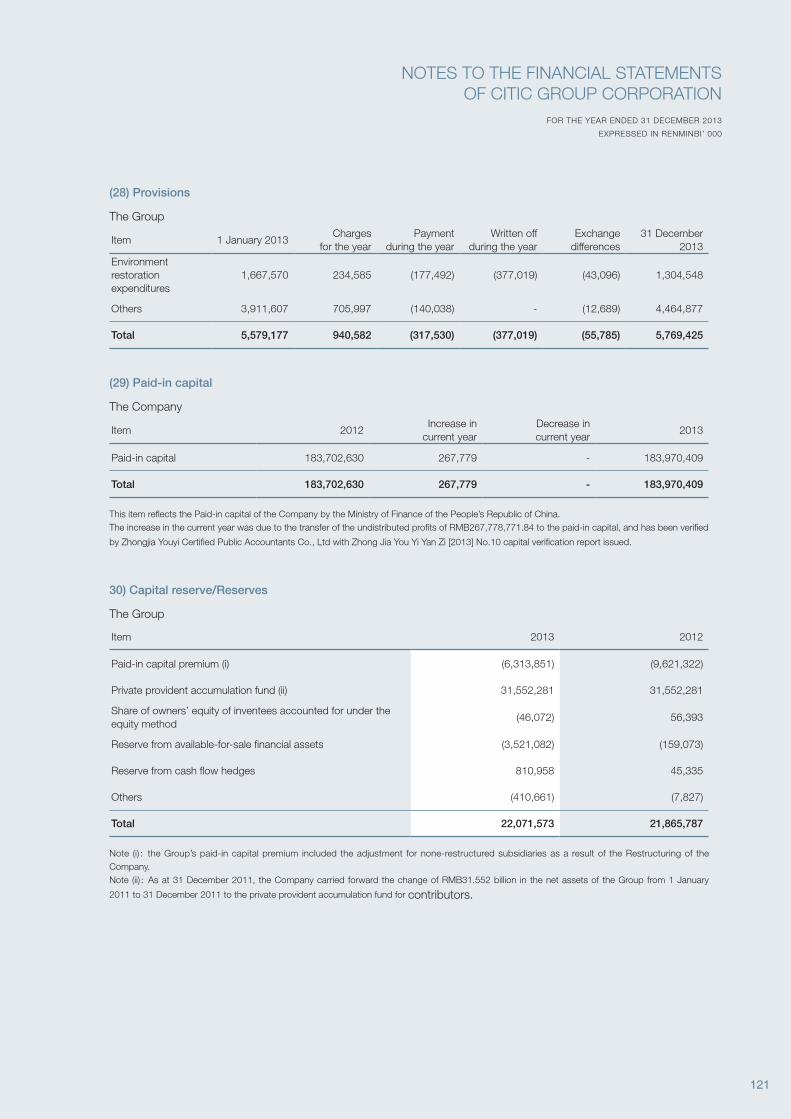
121
(28) Provisions
The Group
Item 1 January 2013Charges
for the yearPayment
during the yearWritten off
during the yearExchange
differences31 December
2013Environmentrestorationexpenditures
1,667,570 234,585 (177,492) (377,019) (43,096) 1,304,548
Others 3,911,607 705,997 (140,038) - (12,689) 4,464,877
Total 5,579,177 940,582 (317,530) (377,019) (55,785) 5,769,425
(29) Paid-in capital
The Company
Item 2012Increase in
current yearDecrease in current year
2013
Paid-in capital 183,702,630 267,779 - 183,970,409
Total 183,702,630 267,779 - 183,970,409
This item reflects the Paid-in capital of the Company by the Ministry of Finance of the People’s Republic of China. The increase in the current year was due to the transfer of the undistributed profits of RMB267,778,771.84 to the paid-in capital, and has been verified
by Zhongjia Youyi Certified Public Accountants Co., Ltd with Zhong Jia You Yi Yan Zi [2013] No.10 capital verification report issued.
30) Capital reserve/Reserves
The Group
Item 2013 2012
Paid-in capital premium (i) (6,313,851) (9,621,322)
Private provident accumulation fund (ii) 31,552,281 31,552,281
Share of owners’ equity of inventees accounted for under the equity method
(46,072) 56,393
Reserve from available-for-sale financial assets (3,521,082) (159,073)
Reserve from cash flow hedges 810,958 45,335
Others (410,661) (7,827)
Total 22,071,573 21,865,787
Note (i): the Group’s paid-in capital premium included the adjustment for none-restructured subsidiaries as a result of the Restructuring of the Company.Note (ii): As at 31 December 2011, the Company carried forward the change of RMB31.552 billion in the net assets of the Group from 1 January
2011 to 31 December 2011 to the private provident accumulation fund for contributors.
FOR THE YEAR ENDED 31 DECEMBER 2013
EXPRESSED IN RENMINBI’ 000
NOTES TO THE FINANCIAL STATEMENTSOF CITIC GROUP CORPORATION

122
The Company
Item 2013 2012
Private provident accumulation fund 31,552,280 31,552,280
Share of owners’ equity of inventees accounted for under the equity method
(4,133) 328
Paid-in capital premium 1 1
Available-for-sale financial assets 782 -
Other capital reserves 34,767 -
Total 31,583,697 31,552,609
(31) Surplus reserve
The Group and the Company
Item 1 January 2013 Additions 31 December 2013
Statutory surplus reserve 33(1) 29,753 25,305 55,058
(32) General reserve
The Group
Item 1 January 2013 Additions 31 December 2013
General reserve 9,207,846 6,296,340 15,504,186
(33) Appropriation of profits and retained earnings at the end of the year
(a) Appropriation to statutory surplus reserve
In accordance with the Articles of Association and relevant laws and regulations, the Company made
appropriations to statutory surplus reserve of 10% of net profit for 2013.
(b) Appropriation to general reserve
Pursuant to relevant MOF notices, financial institutions in Mainland China are required to set aside a general
reserve to cover potential losses against their assets. The minimum general reserve balance should be not less than
1.5% of the ending balance of gross risk-bearing assets.
(c) Retained earnings at the end of the year
Statutory surplus reserve of RMB4.536 billion attributable to the Company was made by the subsidiaries in
2013.
On 28 April 2014, the thirteenth meeting of the first session of the Board of directors of the Company approves
the 2013 profit appropriation plan. In accordance with the plan, after the appropriations to statutory surplus reserve,
the Company’s remaining distributable profit amounting to RMB227,748,087.19 will be converted to CITIC Group
Corporation’s state-owned capital.
FOR THE YEAR ENDED 31 DECEMBER 2013
EXPRESSED IN RENMINBI’ 000
NOTES TO THE FINANCIAL STATEMENTSOF CITIC GROUP CORPORATION
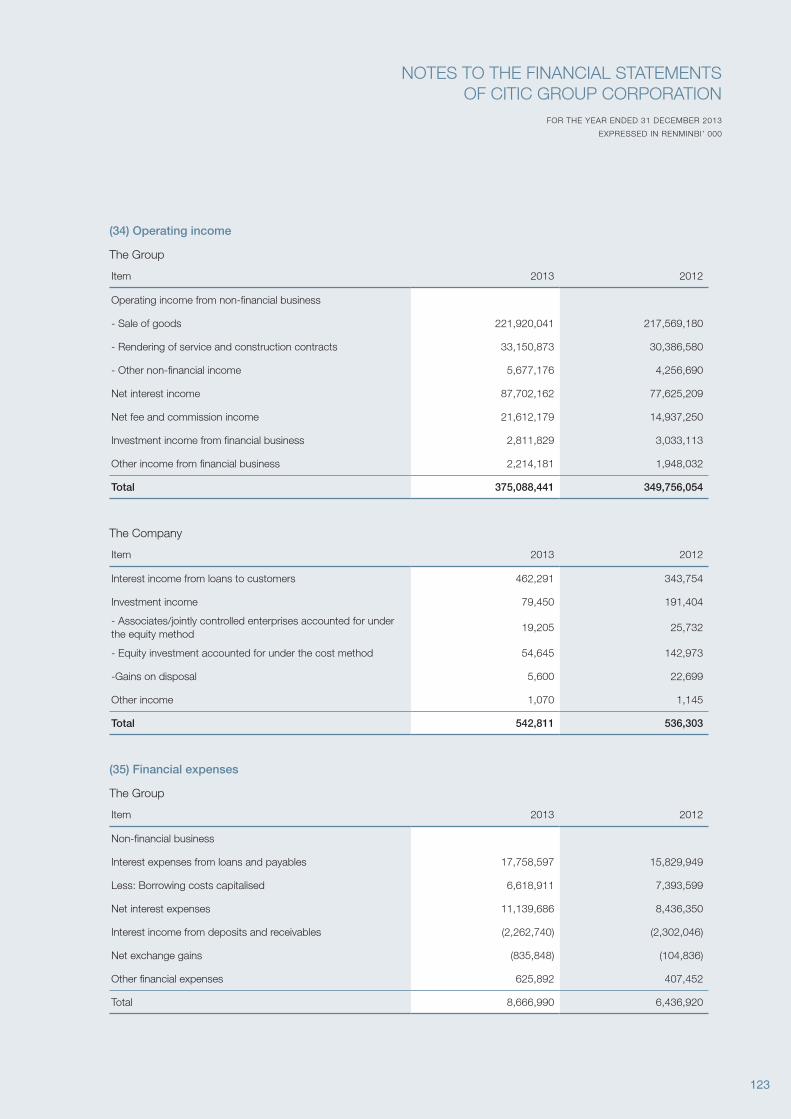
123
(34) Operating income
The Group
Item 2013 2012
Operating income from non-financial business
- Sale of goods 221,920,041 217,569,180
- Rendering of service and construction contracts 33,150,873 30,386,580
- Other non-financial income 5,677,176 4,256,690
Net interest income 87,702,162 77,625,209
Net fee and commission income 21,612,179 14,937,250
Investment income from financial business 2,811,829 3,033,113
Other income from financial business 2,214,181 1,948,032
Total 375,088,441 349,756,054
The Company
Item 2013 2012
Interest income from loans to customers 462,291 343,754
Investment income 79,450 191,404
- Associates/jointly controlled enterprises accounted for under the equity method
19,205 25,732
- Equity investment accounted for under the cost method 54,645 142,973
-Gains on disposal 5,600 22,699
Other income 1,070 1,145
Total 542,811 536,303
(35) Financial expenses
The Group
Item 2013 2012
Non-financial business
Interest expenses from loans and payables 17,758,597 15,829,949
Less: Borrowing costs capitalised 6,618,911 7,393,599
Net interest expenses 11,139,686 8,436,350
Interest income from deposits and receivables (2,262,740) (2,302,046)
Net exchange gains (835,848) (104,836)
Other financial expenses 625,892 407,452
Total 8,666,990 6,436,920
FOR THE YEAR ENDED 31 DECEMBER 2013
EXPRESSED IN RENMINBI’ 000
NOTES TO THE FINANCIAL STATEMENTSOF CITIC GROUP CORPORATION
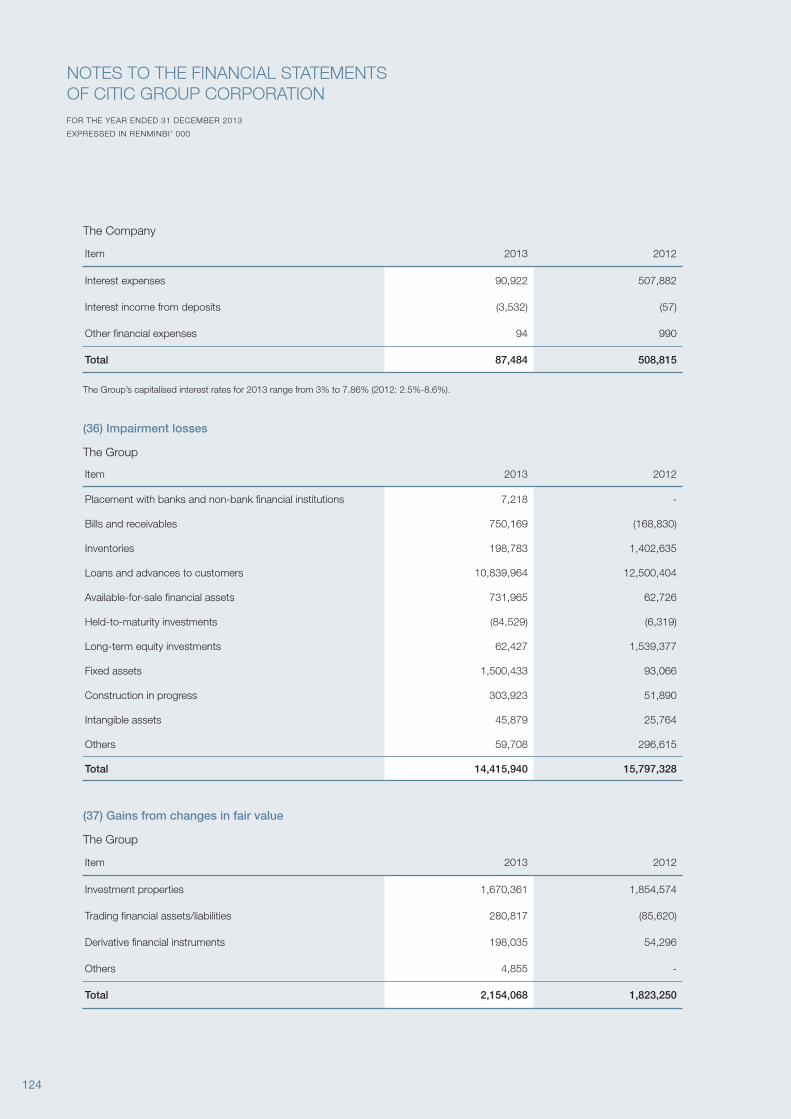
124
The Company
Item 2013 2012
Interest expenses 90,922 507,882
Interest income from deposits (3,532) (57)
Other financial expenses 94 990
Total 87,484 508,815
The Group’s capitalised interest rates for 2013 range from 3% to 7.86% (2012: 2.5%-8.6%).
(36) Impairment losses
The Group
Item 2013 2012
Placement with banks and non-bank financial institutions 7,218 -
Bills and receivables 750,169 (168,830)
Inventories 198,783 1,402,635
Loans and advances to customers 10,839,964 12,500,404
Available-for-sale financial assets 731,965 62,726
Held-to-maturity investments (84,529) (6,319)
Long-term equity investments 62,427 1,539,377
Fixed assets 1,500,433 93,066
Construction in progress 303,923 51,890
Intangible assets 45,879 25,764
Others 59,708 296,615
Total 14,415,940 15,797,328
(37) Gains from changes in fair value
The Group
Item 2013 2012
Investment properties 1,670,361 1,854,574
Trading financial assets/liabilities 280,817 (85,620)
Derivative financial instruments 198,035 54,296
Others 4,855 -
Total 2,154,068 1,823,250
FOR THE YEAR ENDED 31 DECEMBER 2013
EXPRESSED IN RENMINBI’ 000
NOTES TO THE FINANCIAL STATEMENTSOF CITIC GROUP CORPORATION
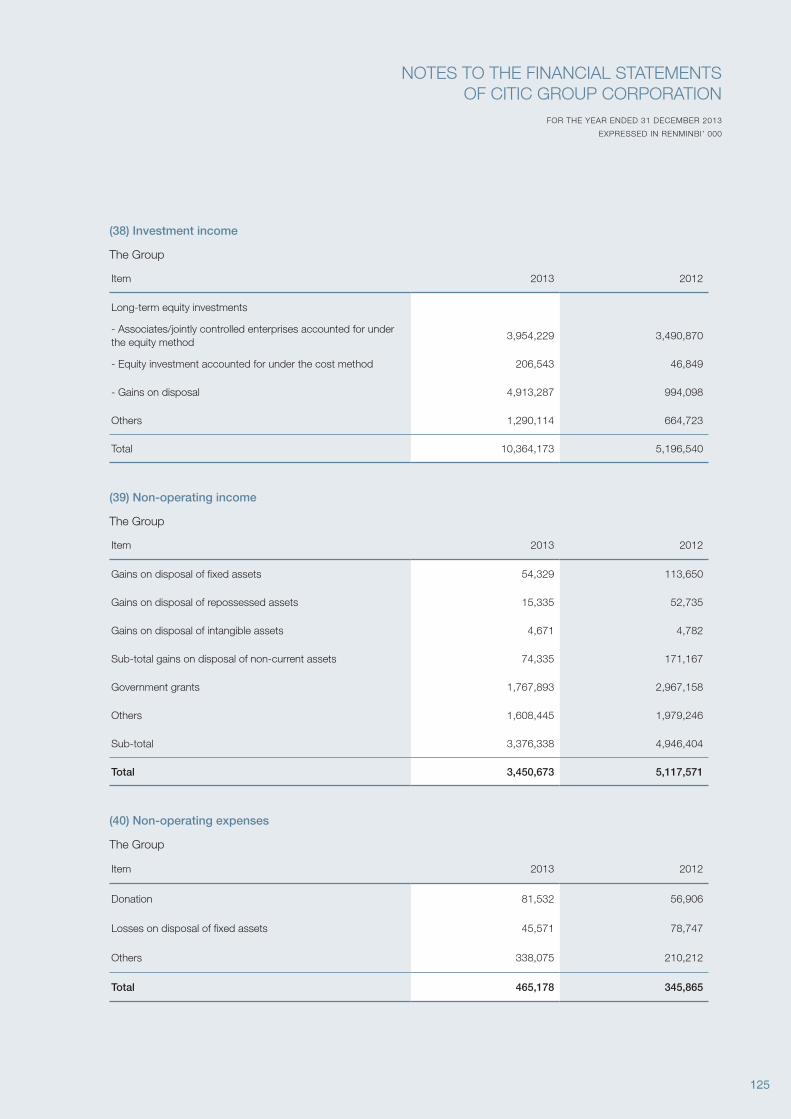
125
(38) Investment income
The Group
Item 2013 2012
Long-term equity investments
- Associates/jointly controlled enterprises accounted for under the equity method
3,954,229 3,490,870
- Equity investment accounted for under the cost method 206,543 46,849
- Gains on disposal 4,913,287 994,098
Others 1,290,114 664,723
Total 10,364,173 5,196,540
(39) Non-operating income
The Group
Item 2013 2012
Gains on disposal of fixed assets 54,329 113,650
Gains on disposal of repossessed assets 15,335 52,735
Gains on disposal of intangible assets 4,671 4,782
Sub-total gains on disposal of non-current assets 74,335 171,167
Government grants 1,767,893 2,967,158
Others 1,608,445 1,979,246
Sub-total 3,376,338 4,946,404
Total 3,450,673 5,117,571
(40) Non-operating expenses
The Group
Item 2013 2012
Donation 81,532 56,906
Losses on disposal of fixed assets 45,571 78,747
Others 338,075 210,212
Total 465,178 345,865
FOR THE YEAR ENDED 31 DECEMBER 2013
EXPRESSED IN RENMINBI’ 000
NOTES TO THE FINANCIAL STATEMENTSOF CITIC GROUP CORPORATION

126
The Company
Item 2013 2012
Donation 21,887 650
Losses on disposal of fixed assets - -
Others 613 24,843
Total 22,500 25,493
(41) Income tax
(a) Income tax expense for the year represents:
The Group
Item 2013 2012
Current tax expense for the year 19,051,289 18,010,056
Deferred income tax (2,490,038) (2,908,020)
Total 16,561,251 15,102,036
(b) Reconciliation between income tax expense and accounting profit is as follows:
The Group
Item 2013 2012 (restated)
Profits before taxation 74,241,469 61,114,774
Expected income tax expense at tax rate of 25% 18,560,367 15,278,694
Effect of different tax rates applied by subsidiaries (759,814) (575,428)
Tax effect of non-deductible expenses 1,743,019 2,183,425
Tax effect of results from associates and jointly controlled enterprises
(1,181,877) (979,046)
Other non-taxable income (2,239,336) (1,806,394)
Unrecognised tax losses 171,447 454,781
Others 267,445 546,004
Total 16,561,251 15,102,036
FOR THE YEAR ENDED 31 DECEMBER 2013
EXPRESSED IN RENMINBI’ 000
NOTES TO THE FINANCIAL STATEMENTSOF CITIC GROUP CORPORATION
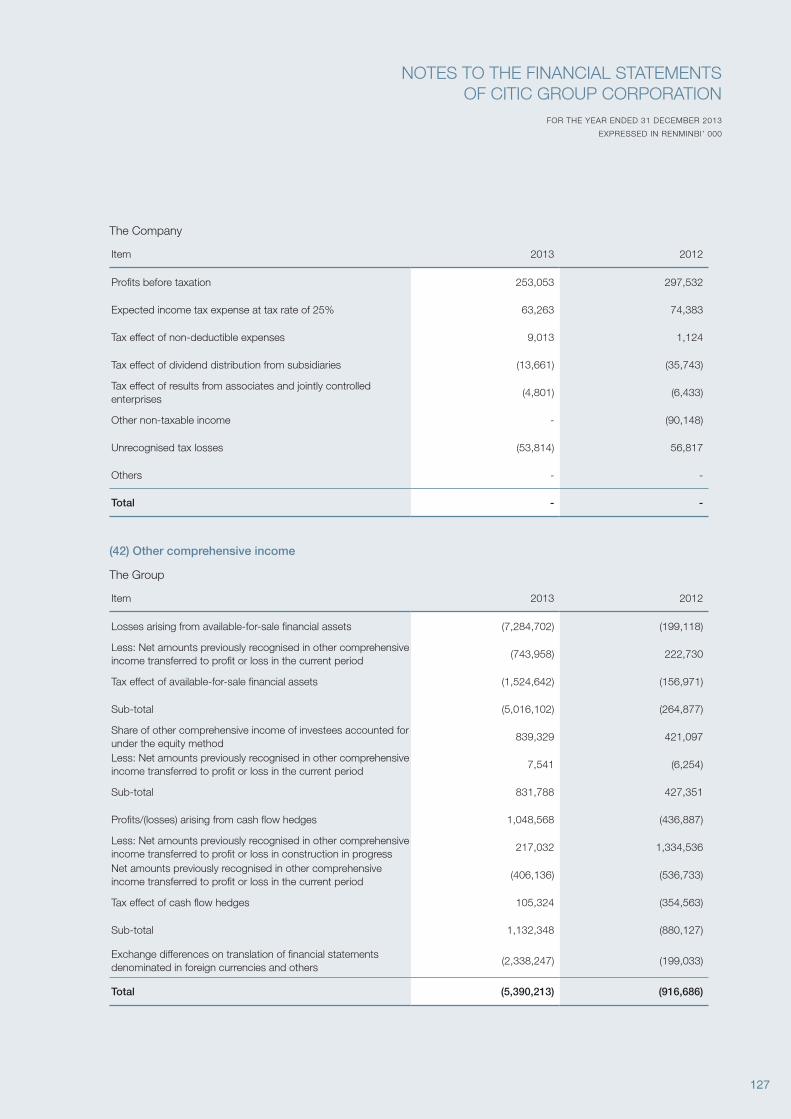
127
The Company
Item 2013 2012
Profits before taxation 253,053 297,532
Expected income tax expense at tax rate of 25% 63,263 74,383
Tax effect of non-deductible expenses 9,013 1,124
Tax effect of dividend distribution from subsidiaries (13,661) (35,743)
Tax effect of results from associates and jointly controlled enterprises
(4,801) (6,433)
Other non-taxable income - (90,148)
Unrecognised tax losses (53,814) 56,817
Others - -
Total - -
(42) Other comprehensive income
The Group
Item 2013 2012
Losses arising from available-for-sale financial assets (7,284,702) (199,118)
Less: Net amounts previously recognised in other comprehensive income transferred to profit or loss in the current period
(743,958) 222,730
Tax effect of available-for-sale financial assets (1,524,642) (156,971)
Sub-total (5,016,102) (264,877)
Share of other comprehensive income of investees accounted for under the equity method
839,329 421,097
Less: Net amounts previously recognised in other comprehensive income transferred to profit or loss in the current period
7,541 (6,254)
Sub-total 831,788 427,351
Profits/(losses) arising from cash flow hedges 1,048,568 (436,887)
Less: Net amounts previously recognised in other comprehensive income transferred to profit or loss in construction in progress
217,032 1,334,536
Net amounts previously recognised in other comprehensive income transferred to profit or loss in the current period
(406,136) (536,733)
Tax effect of cash flow hedges 105,324 (354,563)
Sub-total 1,132,348 (880,127)
Exchange differences on translation of financial statements denominated in foreign currencies and others
(2,338,247) (199,033)
Total (5,390,213) (916,686)
FOR THE YEAR ENDED 31 DECEMBER 2013
EXPRESSED IN RENMINBI’ 000
NOTES TO THE FINANCIAL STATEMENTSOF CITIC GROUP CORPORATION
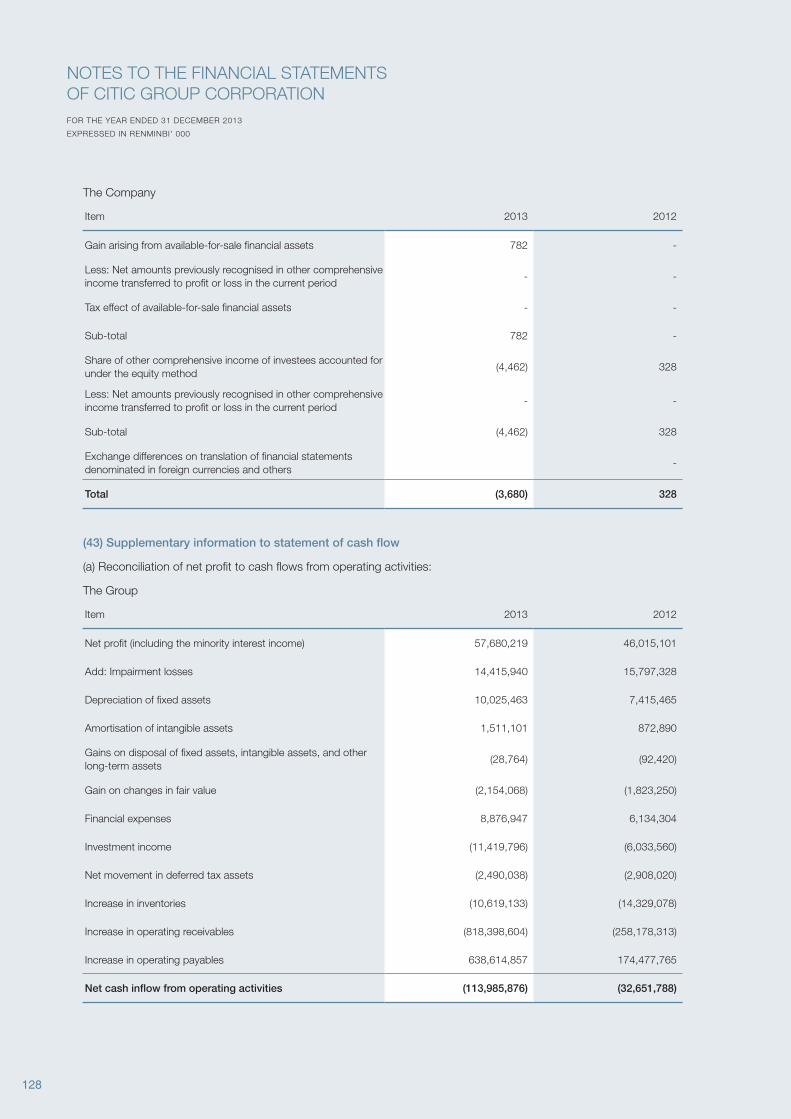
128
The Company
Item 2013 2012
Gain arising from available-for-sale financial assets 782 -
Less: Net amounts previously recognised in other comprehensive income transferred to profit or loss in the current period
- -
Tax effect of available-for-sale financial assets - -
Sub-total 782 -
Share of other comprehensive income of investees accounted for under the equity method
(4,462) 328
Less: Net amounts previously recognised in other comprehensive income transferred to profit or loss in the current period
- -
Sub-total (4,462) 328
Exchange differences on translation of financial statements denominated in foreign currencies and others
-
Total (3,680) 328
(43) Supplementary information to statement of cash flow
(a) Reconciliation of net profit to cash flows from operating activities:
The Group
Item 2013 2012
Net profit (including the minority interest income) 57,680,219 46,015,101
Add: Impairment losses 14,415,940 15,797,328
Depreciation of fixed assets 10,025,463 7,415,465
Amortisation of intangible assets 1,511,101 872,890
Gains on disposal of fixed assets, intangible assets, and other long-term assets
(28,764) (92,420)
Gain on changes in fair value (2,154,068) (1,823,250)
Financial expenses 8,876,947 6,134,304
Investment income (11,419,796) (6,033,560)
Net movement in deferred tax assets (2,490,038) (2,908,020)
Increase in inventories (10,619,133) (14,329,078)
Increase in operating receivables (818,398,604) (258,178,313)
Increase in operating payables 638,614,857 174,477,765
Net cash inflow from operating activities (113,985,876) (32,651,788)
FOR THE YEAR ENDED 31 DECEMBER 2013
EXPRESSED IN RENMINBI’ 000
NOTES TO THE FINANCIAL STATEMENTSOF CITIC GROUP CORPORATION
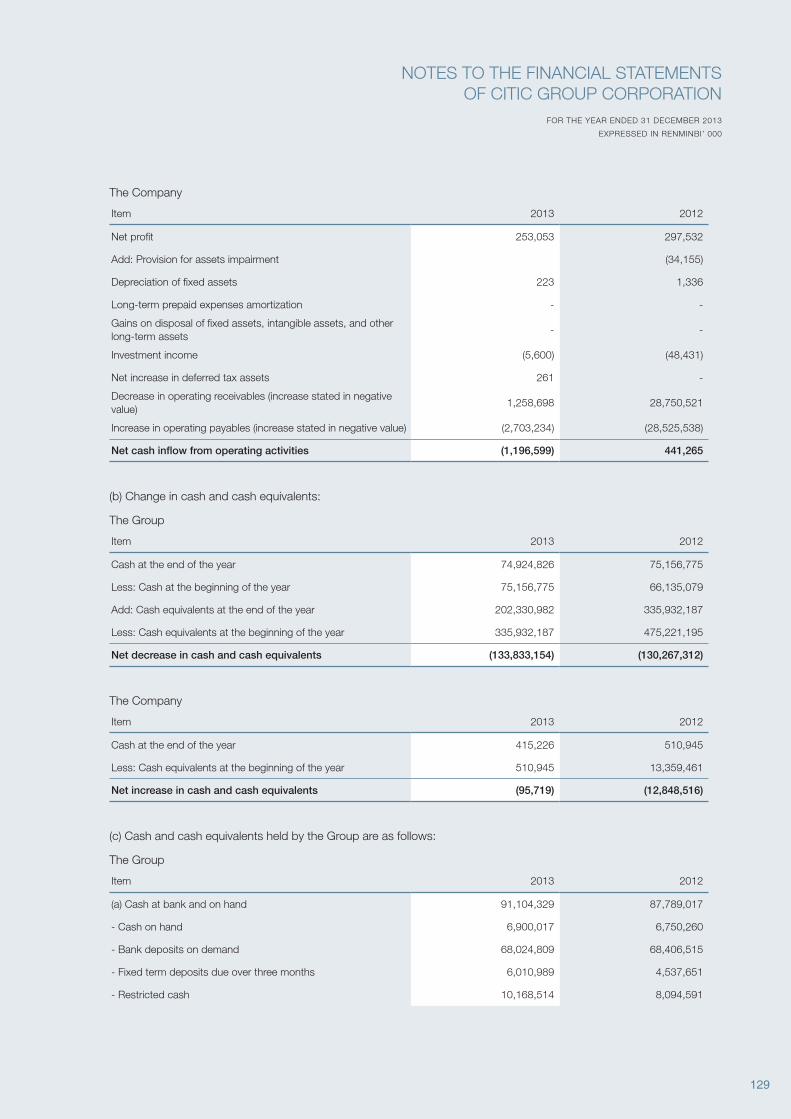
129
The Company
Item 2013 2012
Net profit 253,053 297,532
Add: Provision for assets impairment (34,155)
Depreciation of fixed assets 223 1,336
Long-term prepaid expenses amortization - -
Gains on disposal of fixed assets, intangible assets, and other long-term assets
- -
Investment income (5,600) (48,431)
Net increase in deferred tax assets 261 -
Decrease in operating receivables (increase stated in negative value)
1,258,698 28,750,521
Increase in operating payables (increase stated in negative value) (2,703,234) (28,525,538)
Net cash inflow from operating activities (1,196,599) 441,265
(b) Change in cash and cash equivalents:
The Group
Item 2013 2012
Cash at the end of the year 74,924,826 75,156,775
Less: Cash at the beginning of the year 75,156,775 66,135,079
Add: Cash equivalents at the end of the year 202,330,982 335,932,187
Less: Cash equivalents at the beginning of the year 335,932,187 475,221,195
Net decrease in cash and cash equivalents (133,833,154) (130,267,312)
The Company
Item 2013 2012
Cash at the end of the year 415,226 510,945
Less: Cash equivalents at the beginning of the year 510,945 13,359,461
Net increase in cash and cash equivalents (95,719) (12,848,516)
(c) Cash and cash equivalents held by the Group are as follows:
The Group
Item 2013 2012
(a) Cash at bank and on hand 91,104,329 87,789,017
- Cash on hand 6,900,017 6,750,260
- Bank deposits on demand 68,024,809 68,406,515
- Fixed term deposits due over three months 6,010,989 4,537,651
- Restricted cash 10,168,514 8,094,591
FOR THE YEAR ENDED 31 DECEMBER 2013
EXPRESSED IN RENMINBI’ 000
NOTES TO THE FINANCIAL STATEMENTSOF CITIC GROUP CORPORATION
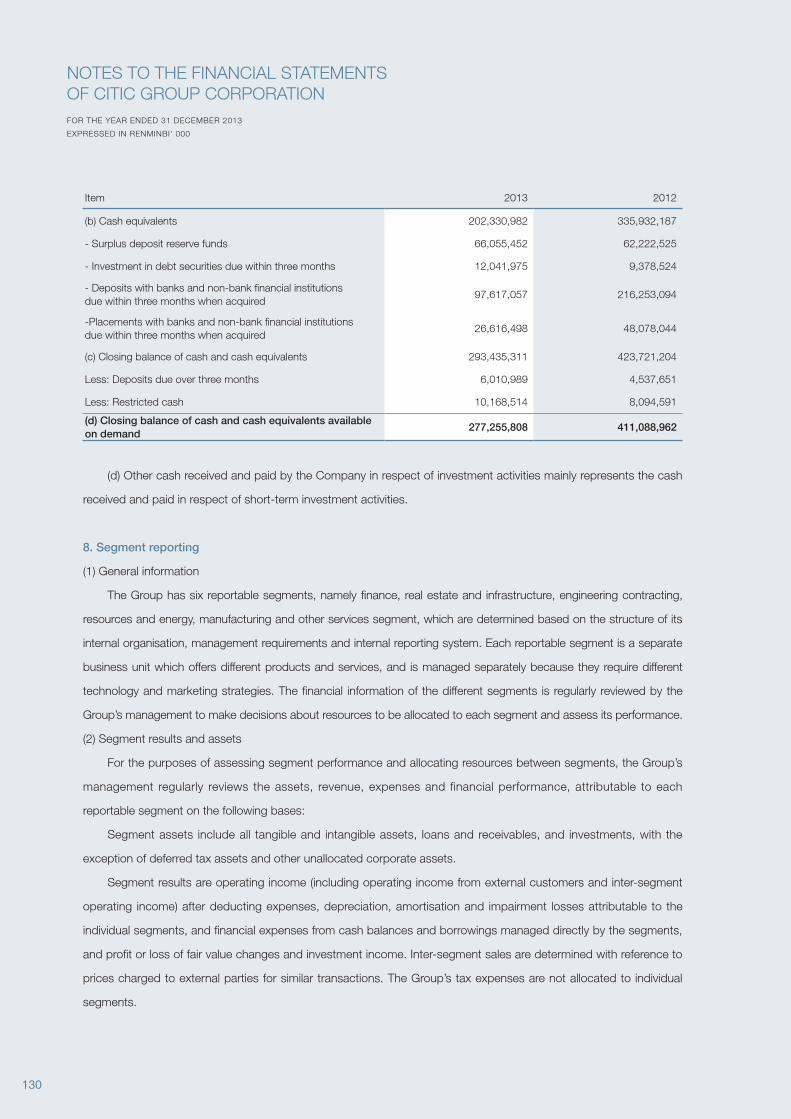
130
Item 2013 2012
(b) Cash equivalents 202,330,982 335,932,187
- Surplus deposit reserve funds 66,055,452 62,222,525
- Investment in debt securities due within three months 12,041,975 9,378,524
- Deposits with banks and non-bank financial institutionsdue within three months when acquired
97,617,057 216,253,094
-Placements with banks and non-bank financial institutionsdue within three months when acquired
26,616,498 48,078,044
(c) Closing balance of cash and cash equivalents 293,435,311 423,721,204
Less: Deposits due over three months 6,010,989 4,537,651
Less: Restricted cash 10,168,514 8,094,591
(d) Closing balance of cash and cash equivalents available on demand
277,255,808 411,088,962
(d) Other cash received and paid by the Company in respect of investment activities mainly represents the cash
received and paid in respect of short-term investment activities.
8. Segment reporting
(1) General information
The Group has six reportable segments, namely finance, real estate and infrastructure, engineering contracting,
resources and energy, manufacturing and other services segment, which are determined based on the structure of its
internal organisation, management requirements and internal reporting system. Each reportable segment is a separate
business unit which offers different products and services, and is managed separately because they require different
technology and marketing strategies. The financial information of the different segments is regularly reviewed by the
Group’s management to make decisions about resources to be allocated to each segment and assess its performance.
(2) Segment results and assets
For the purposes of assessing segment performance and allocating resources between segments, the Group’s
management regularly reviews the assets, revenue, expenses and financial performance, attributable to each
reportable segment on the following bases:
Segment assets include all tangible and intangible assets, loans and receivables, and investments, with the
exception of deferred tax assets and other unallocated corporate assets.
Segment results are operating income (including operating income from external customers and inter-segment
operating income) after deducting expenses, depreciation, amortisation and impairment losses attributable to the
individual segments, and financial expenses from cash balances and borrowings managed directly by the segments,
and profit or loss of fair value changes and investment income. Inter-segment sales are determined with reference to
prices charged to external parties for similar transactions. The Group’s tax expenses are not allocated to individual
segments.
FOR THE YEAR ENDED 31 DECEMBER 2013
EXPRESSED IN RENMINBI’ 000
NOTES TO THE FINANCIAL STATEMENTSOF CITIC GROUP CORPORATION
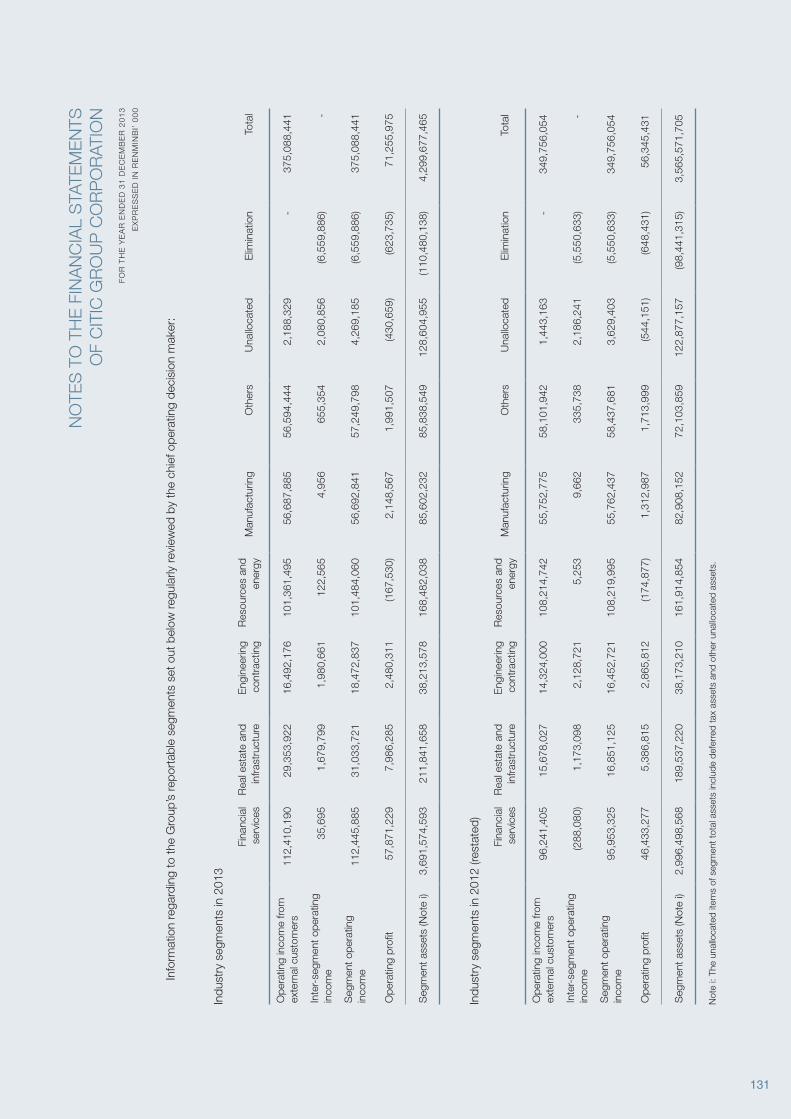
131
Info
rmat
ion
rega
rdin
g to
the
Gro
up’s
repo
rtab
le s
egm
ents
set
out
bel
ow re
gula
rly re
view
ed b
y th
e ch
ief o
pera
ting
deci
sion
mak
er:
Indu
stry
seg
men
ts in
201
3
Fina
ncia
l se
rvic
esR
eal e
stat
e an
d in
frast
ruct
ure
Eng
inee
ring
cont
ract
ing
Res
ourc
es a
nd
ener
gyM
anuf
actu
ring
Oth
ers
Una
lloca
ted
Elim
inat
ion
Tota
l
Ope
ratin
g in
com
e fro
m
exte
rnal
cus
tom
ers
112,
410,
190
29,3
53,9
2216
,492
,176
101,
361,
495
56,6
87,8
8556
,594
,444
2,18
8,32
9-
375,
088,
441
Inte
r-se
gmen
t ope
ratin
g in
com
e35
,695
1,67
9,79
91,
980,
661
122,
565
4,95
665
5,35
42,
080,
856
(6,5
59,8
86)
-
Seg
men
t ope
ratin
g in
com
e11
2,44
5,88
531
,033
,721
18,4
72,8
3710
1,48
4,06
056
,692
,841
57,2
49,7
984,
269,
185
(6,5
59,8
86)
375,
088,
441
Ope
ratin
g pr
ofit
57,8
71,2
297,
986,
285
2,48
0,31
1(1
67,5
30)
2,14
8,56
71,
991,
507
(430
,659
)(6
23,7
35)
71,2
55,9
75
Seg
men
t ass
ets
(Not
e i)
3,69
1,57
4,59
321
1,84
1,65
838
,213
,578
168,
482,
038
85,6
02,2
3285
,838
,549
128,
604,
955
(110
,480
,138
)4,
299,
677,
465
Indu
stry
seg
men
ts in
201
2 (re
stat
ed)
Fina
ncia
l se
rvic
esR
eal e
stat
e an
d in
frast
ruct
ure
Eng
inee
ring
cont
ract
ing
Res
ourc
es a
nd
ener
gyM
anuf
actu
ring
Oth
ers
Una
lloca
ted
Elim
inat
ion
Tota
l
Ope
ratin
g in
com
e fro
m
exte
rnal
cus
tom
ers
96,2
41,4
0515
,678
,027
14,3
24,0
0010
8,21
4,74
255
,752
,775
58,1
01,9
421,
443,
163
-34
9,75
6,05
4
Inte
r-se
gmen
t ope
ratin
g in
com
e(2
88,0
80)
1,17
3,09
82,
128,
721
5,25
39,
662
335,
738
2,18
6,24
1(5
,550
,633
)-
Seg
men
t ope
ratin
g in
com
e95
,953
,325
16,8
51,1
2516
,452
,721
108,
219,
995
55,7
62,4
3758
,437
,681
3,62
9,40
3(5
,550
,633
)34
9,75
6,05
4
Ope
ratin
g pr
ofit
46,4
33,2
775,
386,
815
2,86
5,81
2(1
74,8
77)
1,31
2,98
71,
713,
999
(544
,151
)(6
48,4
31)
56,3
45,4
31
Seg
men
t ass
ets
(Not
e i)
2,99
6,49
8,56
818
9,53
7,22
038
,173
,210
161,
914,
854
82,9
08,1
5272
,103
,859
122,
877,
157
(98,
441,
315)
3,56
5,57
1,70
5
Not
e i:
The
unal
loca
ted
item
s of
seg
men
t tot
al a
sset
s in
clud
e de
ferr
ed ta
x as
sets
and
oth
er u
nallo
cate
d as
sets
.
FO
R T
HE
YE
AR
EN
DE
D 3
1 D
EC
EM
BE
R 2
01
3
EX
PR
ES
SE
D I
N R
EN
MIN
BI’
00
0
NO
TES
TO
TH
E F
INA
NC
IAL
STA
TEM
EN
TSO
F C
ITIC
GR
OU
P C
OR
PO
RAT
ION
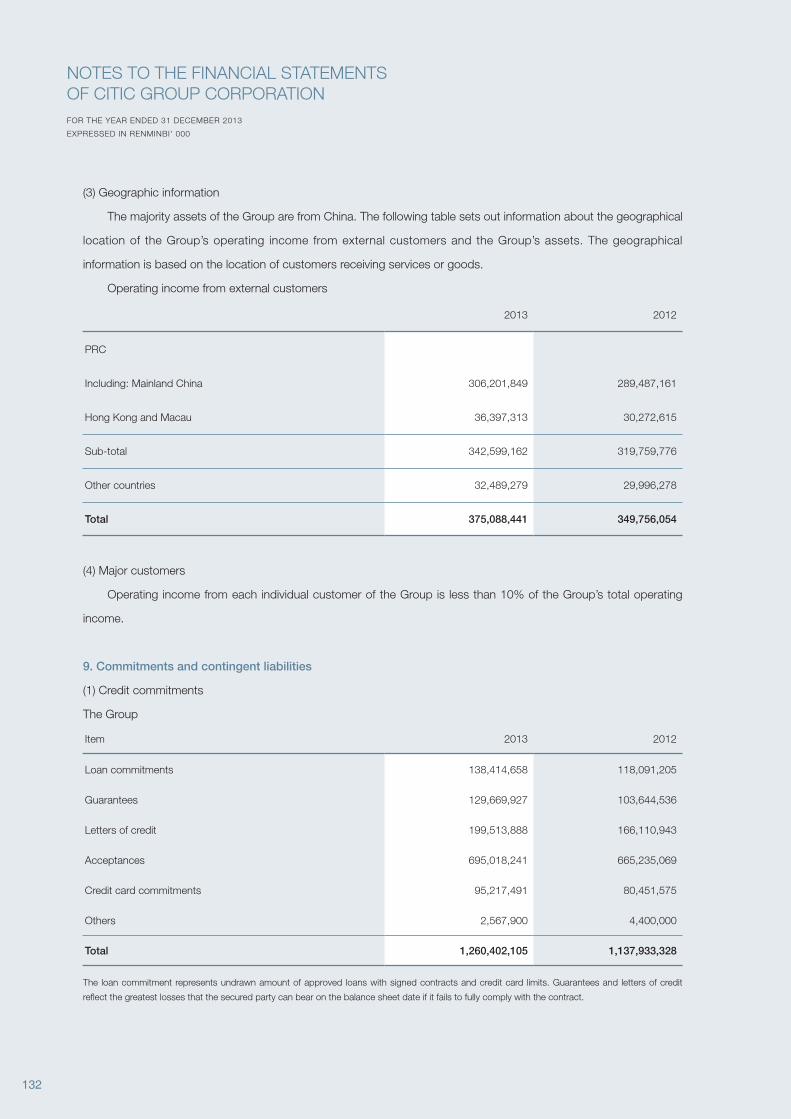
132
(3) Geographic information
The majority assets of the Group are from China. The following table sets out information about the geographical
location of the Group’s operating income from external customers and the Group’s assets. The geographical
information is based on the location of customers receiving services or goods.
Operating income from external customers
2013 2012
PRC
Including: Mainland China 306,201,849 289,487,161
Hong Kong and Macau 36,397,313 30,272,615
Sub-total 342,599,162 319,759,776
Other countries 32,489,279 29,996,278
Total 375,088,441 349,756,054
(4) Major customers
Operating income from each individual customer of the Group is less than 10% of the Group’s total operating
income.
9. Commitments and contingent liabilities
(1) Credit commitments
The Group
Item 2013 2012
Loan commitments 138,414,658 118,091,205
Guarantees 129,669,927 103,644,536
Letters of credit 199,513,888 166,110,943
Acceptances 695,018,241 665,235,069
Credit card commitments 95,217,491 80,451,575
Others 2,567,900 4,400,000
Total 1,260,402,105 1,137,933,328
The loan commitment represents undrawn amount of approved loans with signed contracts and credit card limits. Guarantees and letters of credit
reflect the greatest losses that the secured party can bear on the balance sheet date if it fails to fully comply with the contract.
FOR THE YEAR ENDED 31 DECEMBER 2013
EXPRESSED IN RENMINBI’ 000
NOTES TO THE FINANCIAL STATEMENTSOF CITIC GROUP CORPORATION
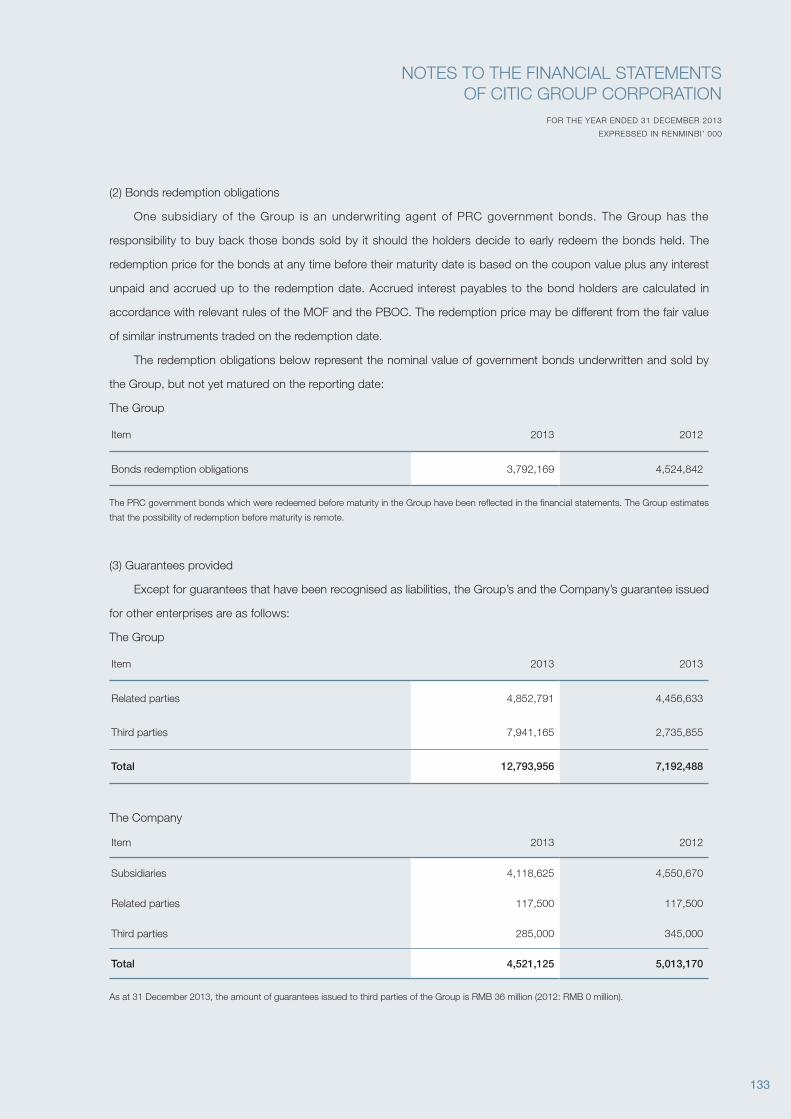
133
(2) Bonds redemption obligations
One subsidiary of the Group is an underwriting agent of PRC government bonds. The Group has the
responsibility to buy back those bonds sold by it should the holders decide to early redeem the bonds held. The
redemption price for the bonds at any time before their maturity date is based on the coupon value plus any interest
unpaid and accrued up to the redemption date. Accrued interest payables to the bond holders are calculated in
accordance with relevant rules of the MOF and the PBOC. The redemption price may be different from the fair value
of similar instruments traded on the redemption date.
The redemption obligations below represent the nominal value of government bonds underwritten and sold by
the Group, but not yet matured on the reporting date:
The Group
Item 2013 2012
Bonds redemption obligations 3,792,169 4,524,842
The PRC government bonds which were redeemed before maturity in the Group have been reflected in the financial statements. The Group estimates
that the possibility of redemption before maturity is remote.
(3) Guarantees provided
Except for guarantees that have been recognised as liabilities, the Group’s and the Company’s guarantee issued
for other enterprises are as follows:
The Group
Item 2013 2013
Related parties 4,852,791 4,456,633
Third parties 7,941,165 2,735,855
Total 12,793,956 7,192,488
The Company
Item 2013 2012
Subsidiaries 4,118,625 4,550,670
Related parties 117,500 117,500
Third parties 285,000 345,000
Total 4,521,125 5,013,170
As at 31 December 2013, the amount of guarantees issued to third parties of the Group is RMB 36 million (2012: RMB 0 million).
FOR THE YEAR ENDED 31 DECEMBER 2013
EXPRESSED IN RENMINBI’ 000
NOTES TO THE FINANCIAL STATEMENTSOF CITIC GROUP CORPORATION

134
(4) Capital commitments
As at 31 December, the Group’s total capital commitments are as follows:
The Group
2013 2012 (restated)
Contracted for 23,592,248 27,149,481
Authorized but not contracted for 1,720,348 1,933,456
Total 25,312,596 29,082,937
(5) Operating lease commitments
As of 31 December 2012, the total future minimum lease payments under non-cancellable operating leases of
properties, fixed assets and so on were payable as follows:
The Group
Item 2013 2012
Within 1 year 3,281,953 2,610,794
After 1 year but within 2 years (inclusive) 2,932,304 2,217,430
After 2 years but within 3 years (inclusive) 2,604,591 1,985,813
After 3 years 9,070,528 6,850,342
Total 17,889,376 13,664,379
(6) Outstanding litigations and arbitration
The Group is involved in certain pending litigations as defendant. Based on the opinion of internal and external
legal counsels of the Group, the Group made provisions in the consolidated balance sheet for those litigations of
which outflow of economic benefits are probable and the outflow can be estimated reliably. The Group believes that
these accruals are reasonable and adequate. Management believes any liabilities result from those litigation of which
outcome cannot be reliably estimated will not have significant negative impact on the Group’s financial status or
operating results.
FOR THE YEAR ENDED 31 DECEMBER 2013
EXPRESSED IN RENMINBI’ 000
NOTES TO THE FINANCIAL STATEMENTSOF CITIC GROUP CORPORATION
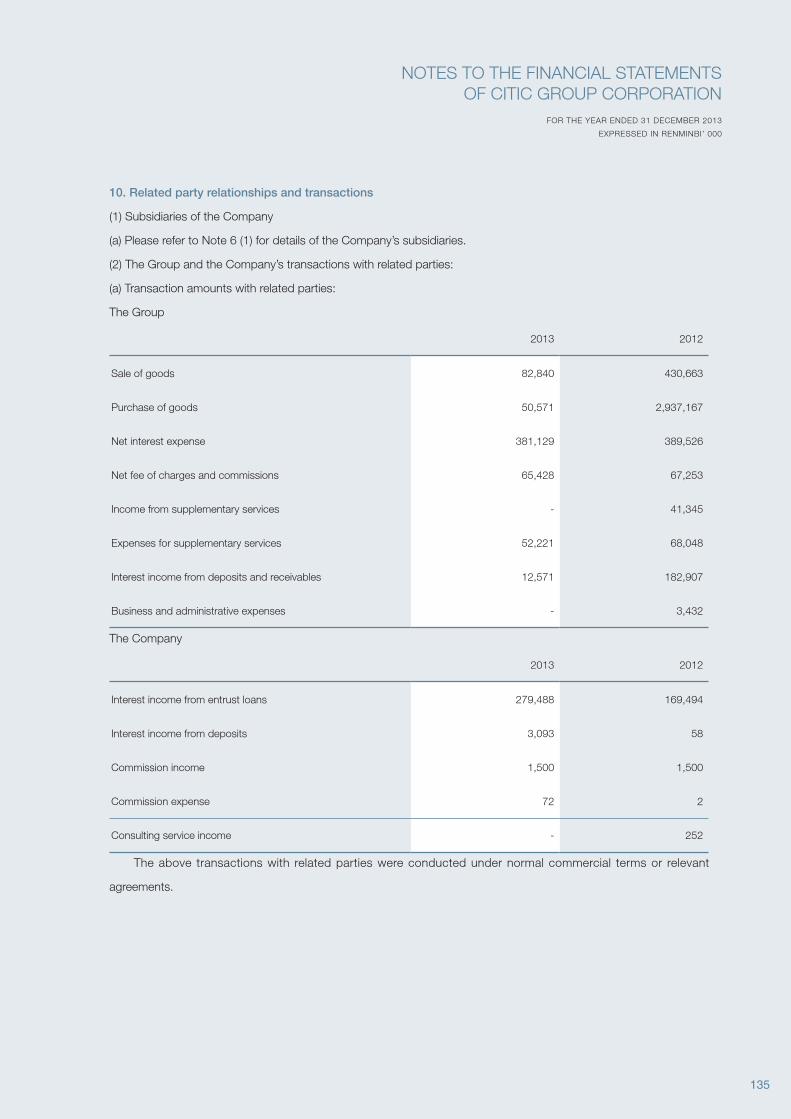
135
10. Related party relationships and transactions
(1) Subsidiaries of the Company
(a) Please refer to Note 6 (1) for details of the Company’s subsidiaries.
(2) The Group and the Company’s transactions with related parties:
(a) Transaction amounts with related parties:
The Group
2013 2012
Sale of goods 82,840 430,663
Purchase of goods 50,571 2,937,167
Net interest expense 381,129 389,526
Net fee of charges and commissions 65,428 67,253
Income from supplementary services - 41,345
Expenses for supplementary services 52,221 68,048
Interest income from deposits and receivables 12,571 182,907
Business and administrative expenses - 3,432
The Company
2013 2012
Interest income from entrust loans 279,488 169,494
Interest income from deposits 3,093 58
Commission income 1,500 1,500
Commission expense 72 2
Consulting service income - 252
The above transactions with related parties were conducted under normal commercial terms or relevant
agreements.
FOR THE YEAR ENDED 31 DECEMBER 2013
EXPRESSED IN RENMINBI’ 000
NOTES TO THE FINANCIAL STATEMENTSOF CITIC GROUP CORPORATION
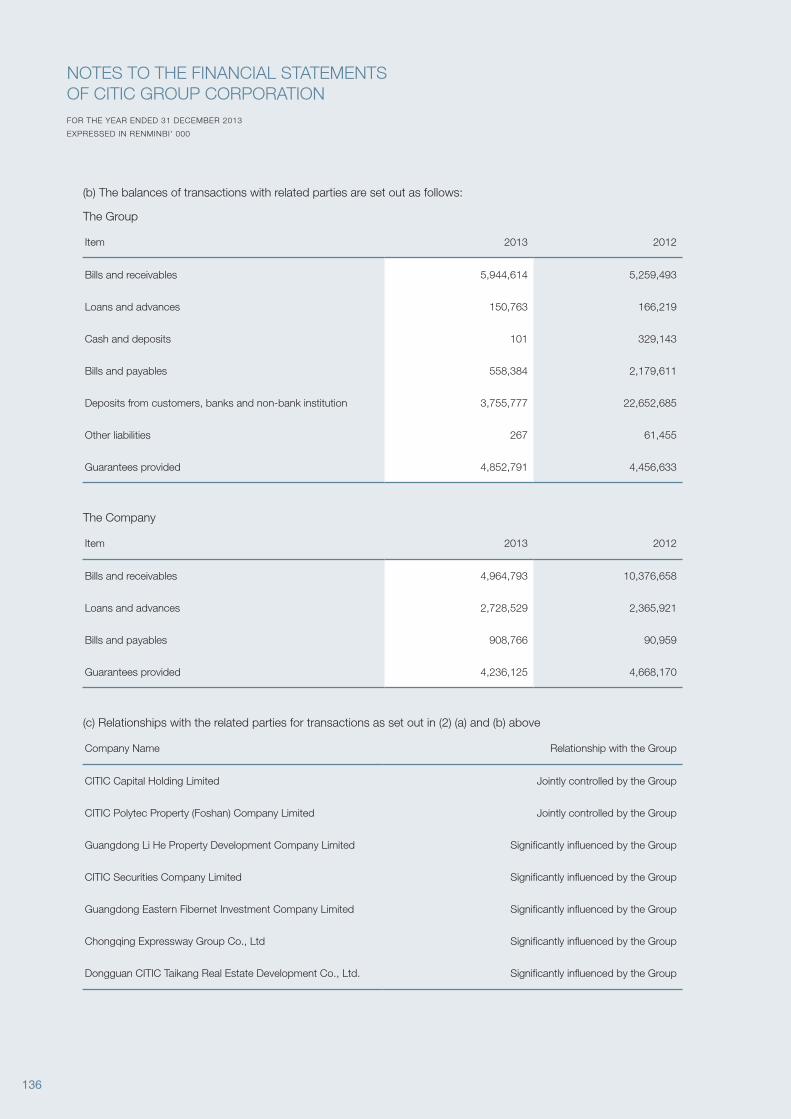
136
(b) The balances of transactions with related parties are set out as follows:
The Group
Item 2013 2012
Bills and receivables 5,944,614 5,259,493
Loans and advances 150,763 166,219
Cash and deposits 101 329,143
Bills and payables 558,384 2,179,611
Deposits from customers, banks and non-bank institution 3,755,777 22,652,685
Other liabilities 267 61,455
Guarantees provided 4,852,791 4,456,633
The Company
Item 2013 2012
Bills and receivables 4,964,793 10,376,658
Loans and advances 2,728,529 2,365,921
Bills and payables 908,766 90,959
Guarantees provided 4,236,125 4,668,170
(c) Relationships with the related parties for transactions as set out in (2) (a) and (b) above
Company Name Relationship with the Group
CITIC Capital Holding Limited Jointly controlled by the Group
CITIC Polytec Property (Foshan) Company Limited Jointly controlled by the Group
Guangdong Li He Property Development Company Limited Significantly influenced by the Group
CITIC Securities Company Limited Significantly influenced by the Group
Guangdong Eastern Fibernet Investment Company Limited Significantly influenced by the Group
Chongqing Expressway Group Co., Ltd Significantly influenced by the Group
Dongguan CITIC Taikang Real Estate Development Co., Ltd. Significantly influenced by the Group
FOR THE YEAR ENDED 31 DECEMBER 2013
EXPRESSED IN RENMINBI’ 000
NOTES TO THE FINANCIAL STATEMENTSOF CITIC GROUP CORPORATION
137
11. Post Balance Sheet Events
(1) The description of the appropriation of profits for the post balance sheet events:
On 28 April 2014, the thirteenth meeting of the first session of the Board of directors of the Company approves
the 2013 profit appropriation plan. In accordance with the plan, after the appropriations to statutory surplus reserve,
the Company’s remaining distributable profit amounting to RMB 227,748,087.19 will be converted to CITIC Group
Corporation’s state-owned capital.
(2) Shares transfer
The overseas wholly-owned subsidiaries of CITIC Limited (a subsidiary of the Company) which hold the shares
of CITIC Pacific Limited (hereinafter referred to as “CITIC Pacific”) will transfer such shares of CITIC Pacific to one or
more overseas wholly-owned subsidiaries of the Company for their respective business needs. The relevant parties
entered into framework agreements in March 2014 to transfer such shares of CITIC Pacific, the completion of which
is subject to consent of the relevant third parties and regulatory authorities. As at the issuance date of these financial
statements, the underlying transfer has not been completed.
(3) Acquisition
According to the announcement of CITIC Pacific dated 16 April 2014, CITIC Pacific entered into a share transfer
agreement, under which CITIC Pacific agreed to acquire 100% of the total issued shares of CITIC Limited from the
Company and Beijing CITIC Enterprise Management Company Limited (hereinafter referred to as “CITIC Enterprise
Management”). The acquisition is subject to a number of conditions precedent including approvals from relevant
regulatory bodies.
FOR THE YEAR ENDED 31 DECEMBER 2013
EXPRESSED IN RENMINBI’ 000
NOTES TO THE FINANCIAL STATEMENTSOF CITIC GROUP CORPORATION

138
P139 P140CITIC Group Corporation CITIC Limited
Contact us
139
CITIC LimitedTelephone: 86-10-64660088
Fax: 86-10-64661186
Address: Capital Mansion, 6 Xinyuannanlu, Chaoyang District,
Beijing 100004, China
Website: http://www.citic.com
Beijing CITIC Enterprise Management Co., Ltd.Telephone: 86-10-59668666
Fax: 86-10-59660666
Address: Room 615, Capital Mansion, 6 Xinyuannanlu,
Chaoyang District, Beijing 100004, China
CITIC Guoan GroupTelephone: 86-10-65007700
Fax: 86-10-65010854
Address: 4/F, Guoan Mansion, 1 Guandongdianbeijie,
Chaoyang District, Beijing 100020, China
Website: http://www.¬guoan.¬citic.¬com
CITIC Asset Management Corporation Ltd.Telephone: 86-10-64196666
Fax: 86-10-64196519
Address: 3/F,Office Tower A,Donghuan Plaza,9 Dongzhongjie,
Dongcheng District, Beijing 100027, China
Website: http:// amc.ecitic.com
CITIC Networks Co., Ltd.Telephone: 86-10-84868800
Fax: 86-10-84868080
Address: 1/F, Capital Mansion, 6 Xinyuannanlu, Chaoyang
District, Beijing 100004, China
Website: http://www.networks.citic.com
CITIC Machinery Manufacturing Inc., Ltd.Telephone: 86-357-4083008
Fax: 86-357-4083007
Address: 85 Fangzhidongxiang, Huibinjie, Houma, Shanxi
Province 043001, China
Website: http://www.machine.citic.com
CITIC Bohai Aluminium Industries Holding Company Ltd.Telephone: 86-335-3850667
Fax: 86-335-3850687
Address: 95 Beihuanlu, Haigang District, Qinhuangdao, Hebei
Province 066003, China
Website: http://www.bohai.citic.com
CITIC Group CorporationTelephone: 86-10-64660088
Fax: 86-10-64661186
Address: Capital Mansion, 6 Xinyuannanlu, Chaoyang District,
Beijing 100004, China
Website: http://www.citicgroup.com.cn
CITIC Medical & Health Group Co., Ltd.Telephone: 86-10-59661196
Fax: 86-10-84865699
Address: 23/F, Borui PLAZA, 26A, Dongsanhuanbeilu,
Chaoyang District, Beijing 100026, China
Website: http://www.citic-health. com
CITIC Ningbo GroupTelephone: 86-574-56156077
Fax: 86-574-56156006
Address: 29 Jiangdongbeilu, Ningbo, Zhejiang Province
315040, China
CITIC Heavy Machinery Co., Ltd.Telephone: 86-379-64088888
Fax: 86-379-64214680
Address: 206 Jianshelu, Luoyang, Henan Province 471039,
China
Website: http://www.citichmc.com
CITIC International Cooperation Co., Ltd.Telephone: 86-10-59660133
Fax: 86-10-84861799, 84417396
Address: 22/F, Tower A, TYG Center, C2 Dongsanhuanbeilu,
Chaoyang District, Beijing 100027, China
Website: http://www.icc.citic.com
CITIC International Co., Ltd.Telephone: 86-10-84862288
Fax: 86-10-84862255
Address: 45 /F, Capital Mansion, 6 Xinyuannanlu, Chaoyang
District, Beijing 100004, China
Website: http://www.intl.citic.com
CITIC Mining Technology Development Co., Ltd.Telephone: 86-10-85261246
Fax: 86-10-65927167
Address: 26/F, CITIC Building, 19 Jianguomenwaidajie,
Beijing 100004, China
140
CITIC LimitedTelephone: 86-10-64660088
Fax: 86-10-64661186
Address: Capital Mansion, 6 Xinyuannanlu, Chaoyang District,
Beijing 100004, China
Website: http://www.citic.com
CITIC HoldingsTelephone: 86-10-59661838
Fax: 86-10-84861342
Address: Capital Mansion, 6 Xinyuannanlu, Chaoyang District,
Beijing 100004, China
Website: http://www.ecitic.com
China CITIC Bank Corporation Limited (listed company)
Telephone: 86-10-65558888
Fax: 86-10-65550801
Address: C Block, Fuhua Mansion, 8 Chaoyangmenbeidajie,
Dongcheng District, Beijing 100027, China
Website: http://bank.ecitic.com
CITIC International Financial Holdings LimitedTelephone: 852-36073000
Fax: 852-25253303
Address: Suites 2701-9, 27 /F, CITIC Tower, 1 Tim Mei
Avenue, Central, Hong Kong
Website: http://www.citicfh.com
CITIC Securities Co., Ltd. (listed company)
Telephone: 86-755-23835888 86-10-60838888
Address: CITIC Securities Mansion, 8 Zhongxinsanlu, Futian
District, Shenzhen, Guangdong Province 518048,
China
CITIC Securities Mansion, 48 Liangmaqiaolu,
Chaoyang District, Beijing 100125, China
Website: http://www.cs.ecitic.com http://www.citics.com
CITIC Securities (Zhejiang) Co., Ltd.Telephone: 86-571-85783737
Address: 19-20/F, Hengxin Tower, 588 Jiangnandadao,
Binj iang Distr ict, Hangzhou, Zhej iang
Province 310052, China
Website: http://www.bigsun.com.cn
CITIC Wantong Securities Co., Ltd.Customer Service Line: 95548
Address: 20/F, Building 1,Qingdao International
Financial Square, 222 Shenzhenlu, Laoshan
District, Qingdao, Shandong Province
266061, China
Website: www.zxwt.com.cn
CITIC Securities International Co., Ltd.Customer Service Line: 00852-22379338
Overseas call: 400-818-0338
Address: 26/F CITIC Tower, 1 Tim Mei Avenue,
Central, Hong Kong
Website: www.citics.com.hk
China Asset Management Co., Ltd.Telephone: 010-88066688
Customer Service Line: 400-818-6666
Address: 12/F Tower B Tongtai Plaza, 33 Jinrongdajie,
Xicheng District, Beijing 100033, China
Website: http://www.chinaamc.com
CITIC Trust Co., Ltd.Telephone: 86-10-84861327
Fax: 86-10-84861380
Address: Capital Mansion, 6 Xinyuannanlu, Chaoyang District,
Beijing 100004, China
Website: http://trust.ecitic.com
CITIC-Prudential Life Insurance Co., Ltd.Telephone: 010-8587899
Fax: 010-85878577
Address: Room 01-10, E16/F, World Financial Centre, 1
Dongsanhuanzhonglu, Chaoyang District, Beijing
100020, China
Website: http://www.citic-prudential.com.cn
CITIC Finance Company LimitedTelephone: 010-59668280
Fax: 010-84861879
Address: Capital Mansion B, 6 Xinyuannanlu, Chaoyang
District, Beijing 100004, China
CITIC Pacific Ltd. (listed company)
Telephone: 852-28202111
Fax: 852-28772771
Address: 32/F CITIC Tower, 1 Tim Mei Avenue, Central, Hong Kong
Website: http://www.citicpacific.com
CITIC Pacific Special Steel HoldingsTelephone: 86-21-61713366
Fax: 86-21-61710111
Address: CITIC Square 15/F, 1168 Nanjingxilu,
Shanghai 200041, China
CITIC Pacific Mining Management Pty Ltd.Telephone: 61-8-92268888
Fax: 61-8-92268899
Address: Level 13, 99 St Georges Terrace Perth 6000,
Australia
Website: http://www.citicpacificmining.com
CITIC Pacific China Holding LimitedTelephone: 86-21-62156215
Fax: 86-21-52984330
Address: CITIC Square 45/F, 1168 Nanjingxilu,
Shanghai 200041, China
Sunburst Energy Development Co., Ltd.Telephone: 86-10-65910166
Fax: 86-10-65004005
Address: 17 /F, CITIC Building, 19 Jianguomenwaidajie.,
Beijing 100004, China
CITIC Real Estate Co., Ltd.Telephone: 86-10-84868966
Fax: 86-10-84868918
Address: Capital Mansion, 6 Xinyuannanlu, Chaoyang District,
Beijing 100004, China
Website: http://www.realestate.citic.com
CITIC Heye Investment (Beijing) Co., Ltd.Telephone: 86-10-84868966
Fax: 86-10-84868583
Address: Room 3401, Capital Mansion, 6 Xinyuannanlu,
Chaoyang District, Beijing 100004, China
Website: http://www.realestate.citic.com
CITIC Industrial Investment Group Corp., Ltd.Telephone: 86-21-26019900
Fax: 86-21-26019990
Address: 55/F, CITIC Plaza, 859 Sichuanbeilu, Shanghai
200085, China
Website: http://www.east.citic.com
CITIC Port Investment Co., Ltd.Telephone: 86-574-86750001
Fax: 86-574-86750001
Address: 9/F, West Building of CITIC Plaza, Ningbo
Daxie Development Zone, Zhejiang Province
315812, China
141
CITIC Infrastructure Investment Co., Ltd.Telephone: 86-21-26019900
Fax: 86-21-26019990
Address: 55/F, CITIC Plaza, 859, Sichuanbeilu,
Shanghai 200085, China
CITIC Industrial Investment Ningbo Co., Ltd. Telephone: 86-574-86766600
Fax: 86-574-86766366
Address: 8/F, West Building, CITIC Plaza, Ningbo
Daxie Development Zone, Zhej iang
Province 315812, China
CITIC Construction Co., Ltd.Telephone: 86-10-59660133
Fax: 86-10-84861799, 84417396
Address: 22/F, Tower A, TYG Center, C2 Dongsanhuanbeilu,
Chaoyang District, Beijing 100027, China
Website: http://www.ccc.citic.com
CITIC International Contracting Co., Ltd.Telephone: 86-10-59660133
Fax: 86-10-84861799, 84417396
Address : 22/F, Tower A, TYG Center, C2
Dongsanhuanbeilu, Chaoyang District,
Beijing 100027, China
Website: http://www.cici.citic.com
CITIC Engineering Design & Construction Co., Ltd.Telephone: 86-27-82731196
Fax: 86-27-82726178
Address: 8 Siweilu, Wuhan, Hubei Province 430014, China
Central and Southern China Municipal Engineering Design & Research Institute Co., Ltd.Telephone: 86-27-82865081
Fax: 86-27-82426679
Address: 41 Liberation-park Road, Jiang’an District,
Wuhan, Hubei Province 430010, China
Website: http://www.znszy. com.cn
CITIC General Institute of Architectural Design and Research Co., Ltd.Telephone: 86-27-82732804
Fax: 86-27-82726178
Address: 8 Siweilu, Wuhan, Hubei Province 430014, China
Website: http://www.whadi.citic.com
CITIC Resources Holdings Limited(listed company)
Telephone: 852-28998200
Fax: 852-28159723
Address: Suites 3001-3006, 30/F, Building A, Pacific Place
88 Queensway, Hong Kong
Website: http://www.citicresources.com
Joint Stock Company KARAZHANBASMUNAITelephone: 7-729-2433600
Fax: 7-729-2435062
Address: 8 build., 15 microdistrict 130000, Aktau,
Mangistau region, Republic of Kazakhstan
CITIC Resources Australia Pty Ltd.Telephone: 61-3-96148000
Fax: 61-3-96148800
Address: Level 7, CITIC House 99/King Street,
Melbourne, Victoria 3000, Australia
CITIC Dameng Mining Industries Ltd.(listed company)
Telephone: 86-771-5556555
Fax: 86-771-5556558
Address: CITIC Dameng Building, 18 Zhujinlu,
Nanning, Guangxi Zhuang Autonomous
Region 530029, China
Website: http://www.citicdameng.com
CITIC United Asia Investments Ltd.Telephone: 852-28612727
Fax: 852-28611901
Address: Rm.2118 Hutchison House, 10 Harcourt Road,
Hong Kong
Website: http://www.citicua.com
CITIC Jinzhou Metal Co., Ltd.Telephone: 86-416-7186666
Fax: 86-416-7186666
Address: 59 Hejinli, Taihe District, Jinzhou, Liaoning
Province 121005, China
Website: http://www.jzthj.com.cn
China Platinum CompanyTelephone: 86-10-88469559
Fax: 86-10-96096680
Address: 15F-A, Tower C, Empark Grand Hotel, 69
Banjinglu, Haidian District,Beijing 100097,
China
CITIC Metal Co., Ltd.Telephone: 86-10-59661921
Fax: 86-10-59661919
Address: Room 1903, Capital Mansion, 6 Xinyuannanlu,
Chaoyang District, Beijing 100004, China
Website: http://www.metal.citic.com
CITIC Metal Hong Kong Investment LimitedTelephone: 852-25988776
Fax: 852-25988909
Address: Unit 1105, 11/F, Tower 1, Lippo Centre, No.89
Queensway, Admiralty, Hong Kong, China
Website: http://www.metal.citic.com
Tianjin Precious Metals Exchange Co., Ltd.Telephone: 86-022-58678686
Fax: 86-022-58678180
Address: 28-1-101, Airport Business Park, Airport
Economic Area, Tianjin 300300, China
Website: http://www.tjpme.com
CITIC Australia Pty. Ltd.Telephone: 61-3-96148000
Fax: 61-3-96148000
Address: CITIC House 99/King Street, Melbourne, Victoria
3000, Australia
CITIC Kazakhstan Limited Liability PartnershipTelephone: 7-727-3201960
Fax: 7-727-3201967
Address: b-n 1, Building 4/2, the Vil lage Karaotkel 3,
Kurgaldzhin Road, Esil District, Astana, Republic of
Kazakhstan
CITIC Heavy Industries Co., Ltd. (listed company)
Telephone: 86-379-64088888
Fax: 86-379-64214680
Address: 206 Jianshelu, Luoyang, Henan Province 471039, China
Website: http://www.citichmc.com
CITIC Investment Holdings Ltd.Telephone: 86-10-84865526
Fax: 86-10-84865250
Address: 15 /F, Capital Mansion, 6 Xinyuannanlu, Chaoyang
District, Beijing 100004, China
Website: http://www.invest.citic.com
CITIC Dicastal Co., Ltd.Telephone: 86-335-5358888
Fax: 86-335-5359999
Address: 185 Longhaidao, Qinhuangdao Economic and
Technical Development Zone, Hebei Province
066011, China
Website: http://www.dicastal.com
Asia Satellite Telecommunications Holding Co., Ltd. (Listed company)
Telephone: 852-25000888
Fax: 852-25764111
Address: 19/F, Sunning Plaza, 10 Hysan Avenue, Causeway
Bay, Hong Kong
Website: http://www.asiasat.com.cn
CITIC Telecom International Holdings Limited (Listed company)
Telephone: 852-23778888
Fax: 852-23762063
Address: 25/F CITIC Telecom Tower, Kwai Fuk Road, Kwai
Chung, Hong Kong
Website: http://www.citictel.com
142
Companhia de Telecomunicaҫões de Macau S.A.R.L.Telephone: 853-28833833
Fax: 853-88913210
Address: Rua de Lagos, Telecentro, Taipa, Macau
Website: http:// www.ctm.net
CITIC Press GroupTelephone: 86-10-84849555
Fax: 86-10-84849000
Address: 8 -10/F, 2 Fusheng Tower, 4 Huixindongjie,
Chaoyang District, Beijing 100029, China
Website: http://www.publish.citic.com
CITIC Tianjin Investment Holding Co., Ltd.Telephone: 86-22-66233996
Fax: 86-22-66233988
Address: 249 Huanghailu, Tianjin Economic-technological
Development Area, Tianjin 300457, China
Website: http://www.tianjin.citic.com
CITIC Zhonghaizhi CorporationTelephone: 86-755-25589393
Fax: 86-755-25588810
Address: 20/F, Building A, Constructing Group Mansion,
2118 Honglingzhonglu, Luohu District, Shenzhen,
Guangdong Province 518028, China
China Offshore Helicopter Co., Ltd. (listed company)
Telephone: 86-755-26971826
Fax: 86-755-26971617
Address: Airport of Helicopters, Nanhaidadao,
Nanshan District, Shenzhen, Guangdong
Province 518052, China
Website: http://www.china-cohc.com
CITIC Tourism Group Co., Ltd.Telephone: 86-10-85263636
Fax: 86-10-85263737
Address: 7 /F, #2 BLD, CITIC Building, 19 Jianguomenwaiadajie,
Beijing 100004, China
Website: http://www.travel.citic.com
CITIC Automobile Co., Ltd.Telephone: 86-10-64929880
Fax: 86-10-64929680
Address: 14/F, Poly Plaza, 14 Dongzhimennandajie,
DongCheng District, Beijing 100027, China
Website: http://www.auto.citic.com
CITIC USA Holding Inc.Telephone: 1-212-5887000
Fax: 1-212-7913857
Address: 410 Park Avenue, 18/F, New York, NY 10022, USA
CITIC Representative Office in JapanTelephone: 81-3-35842635
Fax: 81-3-35056235
Address: 1-14-5, Akasaka, Minatuku, Tokyo, Tu, Japan
CITIC Representative Office in New YorkTelephone: 1-212-5887000
Fax: 1-212-7913857
Address: 410 Park Avenue, 18/F, New York, NY 10022, USA
CITIC Representative Office in KazakhstanTelephone: 7-727-3201960
Fax: 7-727-3201967
Address: 5th Floor, 135 Abylaikhan Avenue, Almaty, Republic
of Kazakhstan, 050000
OVERSEAS OFFFICESCITIC Capital Mansion Co., Ltd.Telephone: 86-10-64660088
Fax: 86-10-84868135
Address: Capital Mansion, 6 Xinyuannanlu, Chaoyang District,
Beijing 100004, China
Website: http://www.citiccm.com.cn
CITIC Building Management Co., Ltd.Telephone: 86-10-85263348
Fax: 86-10-85263344
Address: 19 Jianguomenwaidajie, Beijing 100004, China
Website: http://www.citic-bld.com.cn
China International Economic Consultants Co., Ltd. (CIEC)
Telephone: 86-10-84861310
Fax: 86-10-84865509
Address: Capital Mansion, 6 Xinyuannanlu, Chaoyang District,
Beijing 100004, China
Website: http://www.ciecworld.com
Beijing Guoan Football Club Co., Ltd.Telephone: 86-10-65527930
Fax: 86-10-65527932
Address: Stand No.18, Beijing Workers’ Stadium, Chaoyang
District, Beijing 100027, China
Website: http://www.fcguoan.com


