This is water policy analysis prepared for San Antonio and Fair Oaks Ranch by theTexas A&M Institute of Renewable Natural ResourcesTexas Water Resources Institute. It addresses future water needs for the region, including analysis of the planned Vista Ridge Pipeline.
FINAL REPORT Cities of San Antonio and Fair Oaks Ranch Water Policy Analysis Prepared for: The City of San Antonio and the City of Fair Oaks Ranch Texas A&M Institute of Renewable Natural Resources Texas Water Resources Institute November 2015
Transcript
1
FINAL REPORT
Cities of San Antonio and Fair Oaks Ranch
Water Policy Analysis
Prepared for:
The City of San Antonio and the City of Fair Oaks Ranch
Texas A&M Institute of Renewable Natural Resources Texas Water Resources Institute
LIST OF FIGURES ................................................................................................................................................... 9
LIST OF TABLES ................................................................................................................................................... 10
LIST OF COMMENTS ........................................................................................................................................... 10
LIST OF ACRONYMS ............................................................................................................................................ 11
REPORT HISTORY ........................................................................................................................................................ 13
RISK ANALYSES – WATER RESOURCES ............................................................................................................................. 17
GRADE ASSESSMENT – WATER ISSUES ............................................................................................................................ 21
RESULTS AND DISCUSSION ................................................................................................................................. 23
CITY OF SAN ANTONIO – WATER RESOURCES .................................................................................................... 23
SAWS Recycled Water ....................................................................................................................................... 28
SAWS Twin Oaks Aquifer Storage and Recovery (ASR) ..................................................................................... 32
Vista Ridge Water ............................................................................................................................................. 35
Medina Lake ...................................................................................................................................................... 44
Water Conservation .......................................................................................................................................... 48
Western Canyon Water ..................................................................................................................................... 51
Lake Dunlap Wells/Wells Ranch ........................................................................................................................ 55
CITY OF SAN ANTONIO – WATER ISSUES ............................................................................................................. 57
Water Planning ................................................................................................................................................. 59 Population Estimates ...................................................................................................................................................... 59 GPCD (Demand Management) ....................................................................................................................................... 62 Public Input and Communication ................................................................................................................................... 64 Climate Change .............................................................................................................................................................. 66 Water Shortage, 2060-2070 ........................................................................................................................................... 67
Water Management.......................................................................................................................................... 69 Drought Management .................................................................................................................................................... 69 Lost Water/Non-revenue Water .................................................................................................................................... 71 Edwards Aquifer Habitat Conservation Plan .................................................................................................................. 74 Bexar Metropolitan Water District Integration (Bexar Met) .......................................................................................... 76
3
San Antonio as a Water Neighbor .................................................................................................................................. 78 Water Quality .................................................................................................................................................... 79
Edwards Aquifer Conservation Easements ..................................................................................................................... 79 EARZ and Contributing Zone Protections ....................................................................................................................... 82 Contamination Threat .................................................................................................................................................... 85 Low Impact Development (LID) ...................................................................................................................................... 87 Coal Tar Sealant .............................................................................................................................................................. 89 Annexation of Unincorporated Areas............................................................................................................................. 91
Regulatory Agencies .......................................................................................................................................... 92 Texas Water Development Board (TWDB) ..................................................................................................................... 92 Texas Commission on Environmental Quality (TCEQ) and Environmental Protection Agency (EPA) ............................. 94 Edwards Aquifer Authority (EAA) ................................................................................................................................... 97 Local Groundwater Districts ........................................................................................................................................... 99
Water Cost ...................................................................................................................................................... 100 Water Project Costs ...................................................................................................................................................... 100 Residential Water Rates ............................................................................................................................................... 102 Commercial and Industrial Rates.................................................................................................................................. 108 Impact Fees .................................................................................................................................................................. 111
CITY OF FAIR OAKS RANCH – WATER RESOURCES .......................................................................................... 115
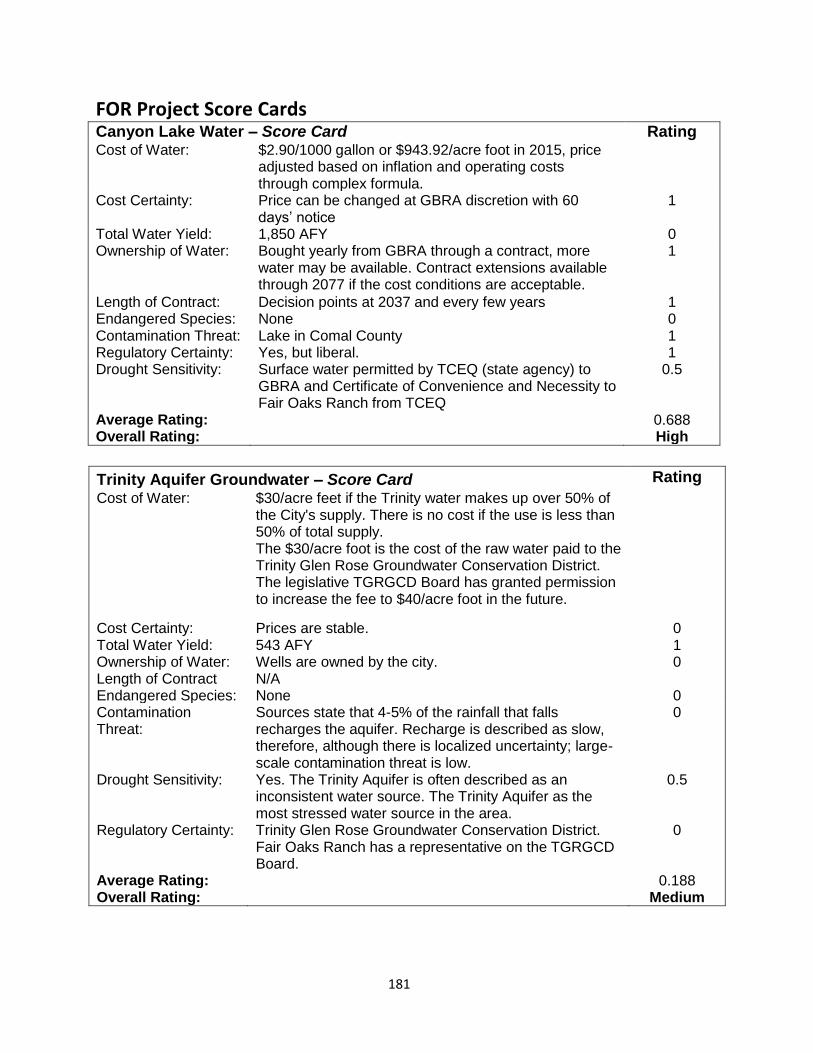
Canyon Lake Water ......................................................................................................................................... 119
Fair Oaks Ranch Recycled Water Program ...................................................................................................... 121
CITY OF FAIR OAKS RANCH – WATER ISSUES ................................................................................................... 123
Water Planning ............................................................................................................................................... 124 Population Estimates .................................................................................................................................................... 124 Drought-of-Record Conditions ..................................................................................................................................... 127 Climate Change ............................................................................................................................................................ 129
Water Management........................................................................................................................................ 130 Water Conservation ..................................................................................................................................................... 130 Drought Management .................................................................................................................................................. 135 Lost/Non-revenue Water ............................................................................................................................................. 138
Water Quality .................................................................................................................................................. 140 Relationships with Neighboring Communities ............................................................................................................. 140
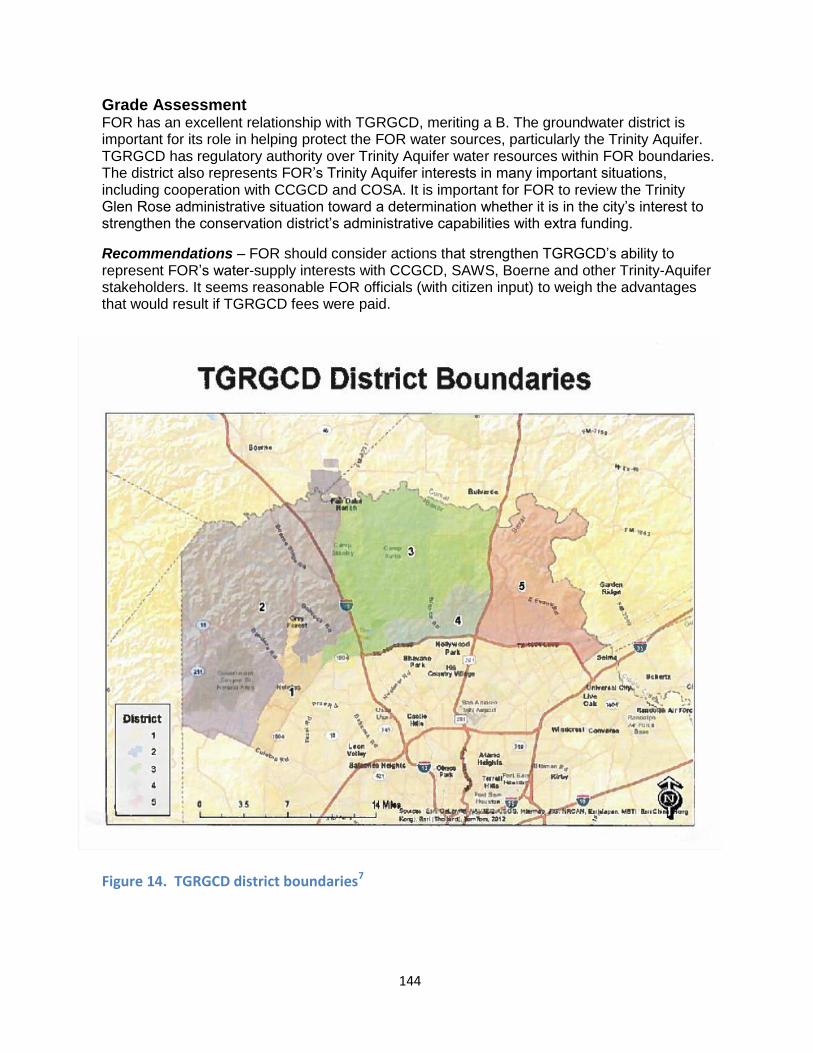
Regulatory Agencies ........................................................................................................................................ 143 Trinity Glen Rose Groundwater Conservation District ................................................................................................. 143 Texas Water Development Board ................................................................................................................................ 145 Texas Commission on Environmental Quality (TCEQ) and Environmental Protection Agency (EPA) ........................... 147
Water Cost ...................................................................................................................................................... 149 Rates and Impact Fees.................................................................................................................................................. 149
OTHER CONSIDERATIONS ................................................................................................................................... 153
Water Supply and Demand, 2015-2060 .......................................................................................................... 153
Legislative and Ordinance Opportunities ........................................................................................................ 156
APPENDIX B: SRP PROJECT RATINGS BASED ON IMPROVED METRICS AND UNCERTAINTY ANALYSIS .......... 169
APPENDIX C: SUPPLEMENTAL WATER ISSUE GRADING .................................................................................... 183
APPENDIX D: ALTERNATIVE PROJECT ASSESSMENT FRAMEWORK .................................................................. 185
4
Executive Summary The overarching goal of this technical report was to review and assess factors relevant to implementing water policies in both the City of San Antonio (COSA) and the City of Fair Oaks Ranch (FOR), along with providing a tool for decision-making regarding water-resource projects and the integration of city planning strategies in addressing key water management issues. Analyses were based on readily available data on city policies, regulations, and initiatives, to include costs and water reliability/supply for the 2015-2060 period.
Report History and Approach.—This final technical report is based on the contributions of many (e.g., original authors, institute staff, sponsors, and a science review panel), and captures the best available scientific approach given limitations (e.g., available data, time constraints, draft work). The original authors (Dr. Calvin Finch, Principal Investigator) conducted the assessment for both cities. Discrepancies between Dr. Finch, the sponsors, and San Antonio Water System (SAWS), with respect to relevant data, their availability and general revision completion, coupled with Dr. Finch’s subsequent retirement, and a media leak of a preliminary draft, delayed completion of the report. In the preliminary drafts, the original authors identified nine water project evaluation factors and assigned a plus or minus scale to assess project “risk”. They summed the number of pluses or minuses in order to develop a project risk range from low, medium, and high (see Table A). In a separate section, the authors were asked to review agency performance on water issues related to water planning, water management, water quality, regulatory agencies, and water costs and assign them a letter grade (i.e., A, B, C, D). The assignment of water grades served to provide insight into the discussion of whether the communities are prepared in terms of water-supply issues and how to improve that preparation (see Table B). For application purposes, the suggested interpretation for A and B grades is “continue efforts in this direction” and for C and D grades is “areas of improvement or potential gain”.
Science Review Panel.—A Science Review Panel (SRP) provided an independent assessment of the draft report and ensured report integrity and scientific soundness. Due to time constraints to complete the report, not all of the SRP recommendations could be incorporated into the final version. Instead, SRP comments are provided throughout the report via yellow comment text boxes in key sections of the report to offer the reader a broader perspective. The SRP findings and recommendations are summarized in Appendix A and were used to make improvements to the final report.
The independent SRP, comprised of five water experts each with over 20+ years of experience and extensive scientific publishing experience, evaluated this report. From the draft submitted by the authors, the SRP evaluated the original authors’ methodology, findings, and conclusions and offered additional items for consideration. The SRP suggested five general areas of improvement in the revision of the report: (1) Data Sources, (2) Methodology Explanation, (3) Risk Analysis Metrics, (4) Water Grades, and (5) Vista Ridge Project considerations. The SRP recommendations are included in Appendices A-D, and the majority of recommendations were used to enhance the final report. Given restrictive time limitations, the SRP did not alter the original risk assessments. Rather the SRP illustrated these limitations by conducting a supplemental supply “uncertainty” analysis based on (1) new measures that were more informative for decision-makers, and (2) refined numerical risk values that removed inherent biases. Ranking criteria used in the SRP water project assessment were limited due to time constraints and readily available data (see Appendix B, Figure B-1); however, this serves to underscore the concerns of the SRP in using “score cards” that accurately assess and value water projects.
5
Findings and Recommendations.—Recommendations from the SRP enhanced the report’s technical value throughout the revision process. Furthermore, SRP findings served to offer a broader view of considerations with water projects and issues. Appendix A contains detailed comments of SRP findings and recommendations.
Appendix B contains a detailed description of the SRP metrics and rating scales used in the supplemental water supply “uncertainty” assessment. For comparison purposes, water project risk ratings by the original authors are listed in Table A and the risk ratings from the SRP are listed in Table C. The risk ratings from the SRP reflect improvements to the limitations in the original authors’ work. SRP ratings serve to underscore the concerns in having assessment “score cards” that are properly developed to avoid over penalizing or under valuing water projects.
Table A. Original risk ratings for COSA and FOR water resources (from high to low).
Projects Low Risk
(-) High Risk
(+) Overall
Risk Value Risk Label
City of San Antonio
Medina Lake -2 7 5 High
Vista Ridge Water Project -3 7 4 High
Western Canyon -2 5 3 High
CRWA Lake Dunlap/Wells Ranch -2 5 3 High
Gonzales Carrizo -3 5 2 High
Trinity Oliver Ranch Water -3 4 1 Medium
Edwards Aquifer Groundwater -4 3 -1 Low
Brackish Water Desalination -4 3 -1 Low
SAWS Twin Oaks ASR -5 2 -3 Low
Local Carrizo (Bexar County) -4 1 -3 Low
SAWS Recycled Water -5 1 -4 Low
Water Conservation -6 2 -4 Low
City of Fair Oaks Ranch
Canyon Lake Water -1 5 4 High
Trinity Aquifer Water -6 3 -3 Low
Fair Oaks Ranch Recycled Water -4 1 -3 Low
6
Table B. Overview of water issues by grade rank for Cities of San Antonio (n=24) and Fair Oaks Ranch (n=11) Water Issue Original
Grade SRP
Grade*
City of San Antonio Public Input A Drought Management A Edwards Aquifer Habitat Conservation Plan A Bexar Metropolitan Integration A Edwards Aquifer Conservation Easements A City of San Antonio as a Water Neighbor B Contamination Threat B Coal-Tar Sealant B n/a** Texas Water Development Board (TWDB) B Edwards Aquifer Authority (EAA) B Water Project Costs B Residential Water Rate Structures B Commercial and Industrial Water Rate Structures B Impact Fees B Gallons Per Capita per Day (GPCD) Demand Management C Water Shortage (2060-2070) C Regulation of Development Activities over EARZ/ Contributing Zones C Low-Impact Development (LID) C Annexation and Extension of Water Infrastructure C Local Regulatory Agencies (Groundwater Districts) C Population Estimates D B Climate Change D n/a Lost/Non-revenue Water D B Texas Commission on Environmental Quality (TCEQ) and Environmental Protection Agency (EPA)
D n/a
City of Fair Oaks Ranch Population Estimates A Climate Change A Lost/Non-revenue Water A Drought-of-Record Conditions B Trinity Glen Rose Groundwater Conservation District (TGRGCD) B Texas Water Development Board (TWDB) B Texas Commission on Environmental Quality (TCEQ) and Environmental Protection Agency (EPA)
B n/a
Drought Management C Relationships with Neighboring Communities C Residential and Commercial Rates and Impact Fees C Water Conservation D *Some of the water issues grades were adjusted based on SRP recommendations (see Appendix C for details on process). See each individual section for details. Blank cells represent grade is reasonable within one letter grade variance. **The SRP felt there was not enough history or information was not available to allow a grade assignment. n/a = not applicable.
7
Table C. Supplemental assessment conducted by Science Review Panel evaluating uncertainty ratings for water resources (from high to low).
Appendix C outlines SRP comments and suggestions regarding water issue grading performance. With respect to water planning, water management, water quality, regulatory agencies, and water costs issues, the SRP noted subjectivity in issue selection and grading, and offered considerations for corrective measures to ensure more objective, equal, and less subjective metric application. During the review process, the SRP also conducted a rapid grade assessment of originally assigned grades. In a few cases (n=2, 5% of all water issues), additional or new information obtained during the review process warranted a re-evaluation. Yellow comment text boxes were included with water issue grades, outlining the results of this process for all issues. Of the 35 water issues evaluated for both COSA and FOR, two water grades were adjusted and four water issues were given “not applicable” ratings due to the limited data available to the panel from the original draft report or due to the nature of the issue not appearing to have much history within the written portion of the report.
Appendix D provides an alternative metric and risk performance framework that could be used in evaluating future water projects. The framework illustrates the need to consider many variables in project evaluation rather than a singular approach relying on a single value.
Projects Average Rating Ranking Category
City of San Antonio
Western Canyon 0.813 12 High
CRWA Lake Dunlap/Wells Ranch 0.750 11 High
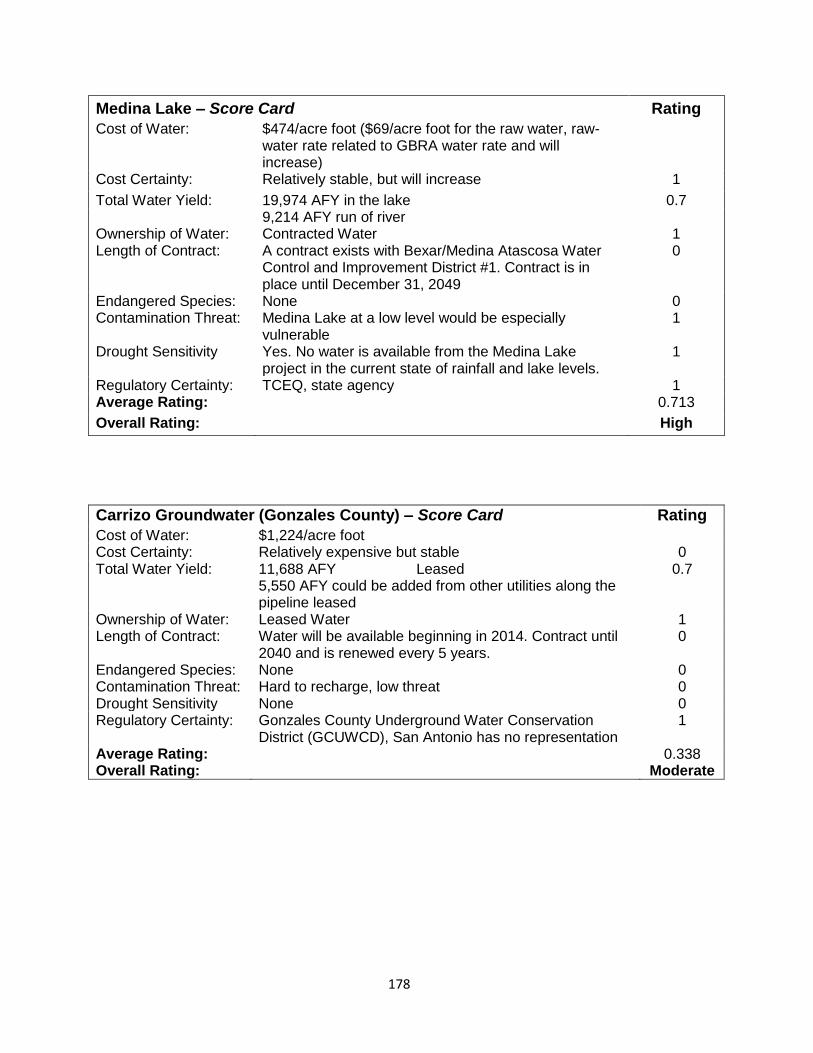
Medina Lake 0.713 10 High
Trinity Oliver Ranch Water 0.688 9 High
Edwards Aquifer Groundwater 0.563 8 Medium
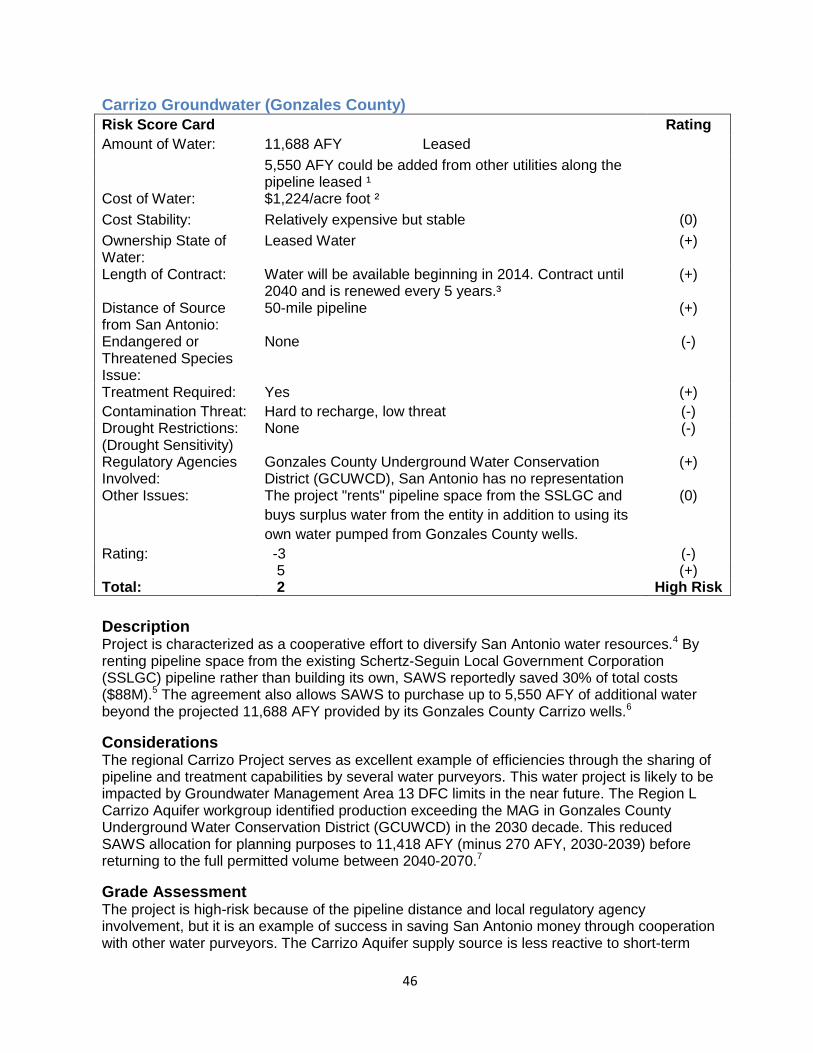
Gonzales Carrizo 0.338 7 Medium
Vista Ridge Water Project 0.288 6 Medium
SAWS Twin Oaks ASR 0.188 5 Medium
Brackish Water Desalination 0.163 3.5 Low
Local Carrizo (Bexar County) 0.163 3.5 Low
SAWS Recycled Water 0.125 2 Low
Water Conservation 0.088 1 Low
City of Fair Oaks Ranch
Canyon Lake Water 0.688 3 High
Fair Oaks Ranch Recycled Water 0.250 2 Medium
Trinity Aquifer Water 0.188 1 Low
8
Report Use.—Engagement of the SRP was beneficial in enhancing the final report in many ways. First, the suggested reformatting of the report served to improve the readability and use of the report as a comprehensive reference document for key water projects and issues influencing city water planning. Use of the score card format provided descriptions, considerations, grade or risk value assignments, and recommendations/actions for use in decision-making. Second, the supplemental water supply “uncertainty” assessment illustrated limitations in the original “risk” analyses and offered improvements to include: (1) a supply uncertainty assessment (i.e., on single value tied to water supply reliability) applying SRP recommendations to improve metric score cards (see Appendix B), and (2) a comprehensive project evaluation framework for consideration in future water policy studies (see Appendix D). Third, the supplemental grade assessment for water issues (see Appendix C) offered a validation for assigned values from the original assessment and/or further considerations or caveats for review by decision-makers. In summary, the report provides:
Broad descriptions of both water projects and water issues Validation and improvements to water project “risk” assessments Validation and improvements to water issue grading Recommendations and considerations from a diverse panel of water experts
The water report and separate question and answer document are available on Institutes websites – http://irnr.tamu.edu or http://twri.tamu.edu. We would like to especially thank the SRP for their insights and timely efforts in finalizing the report for the COSA and FOR.
9
List of Figures Figure 1. San Antonio population projects by planning estimate ............................................................ 61
Figure 2. Per capita water use by data source ......................................................................................... 63
Figure 3. Potential supply gaps by source over long term4 ...................................................................... 68
Figure 4. Unaccounted water (%) ............................................................................................................. 72
Figure 5. Map of conservation easement program Edwards Aquifer Protection .................................... 81
Figure 6. Edwards Aquifer Contributing Zone .......................................................................................... 83
Figure 7. Annual cost per acre foot by project ....................................................................................... 101
Figure 8. Residential volumetric water rates for four Texas cities ......................................................... 105
Figure 9. Residential volumetric water and sewer rates for four Texas cities ....................................... 106
Figure 10. Example of two uniform water rates (dashed lines) and one increasing block rate structure
Table 5. San Antonio water resources (both current and future) in order of water production............. 23
Table 6. Risk ratings for San Antonio water resources (from high to low) .............................................. 24
Table 7. Recycled water contract volumes, December 23, 2014 ............................................................. 30
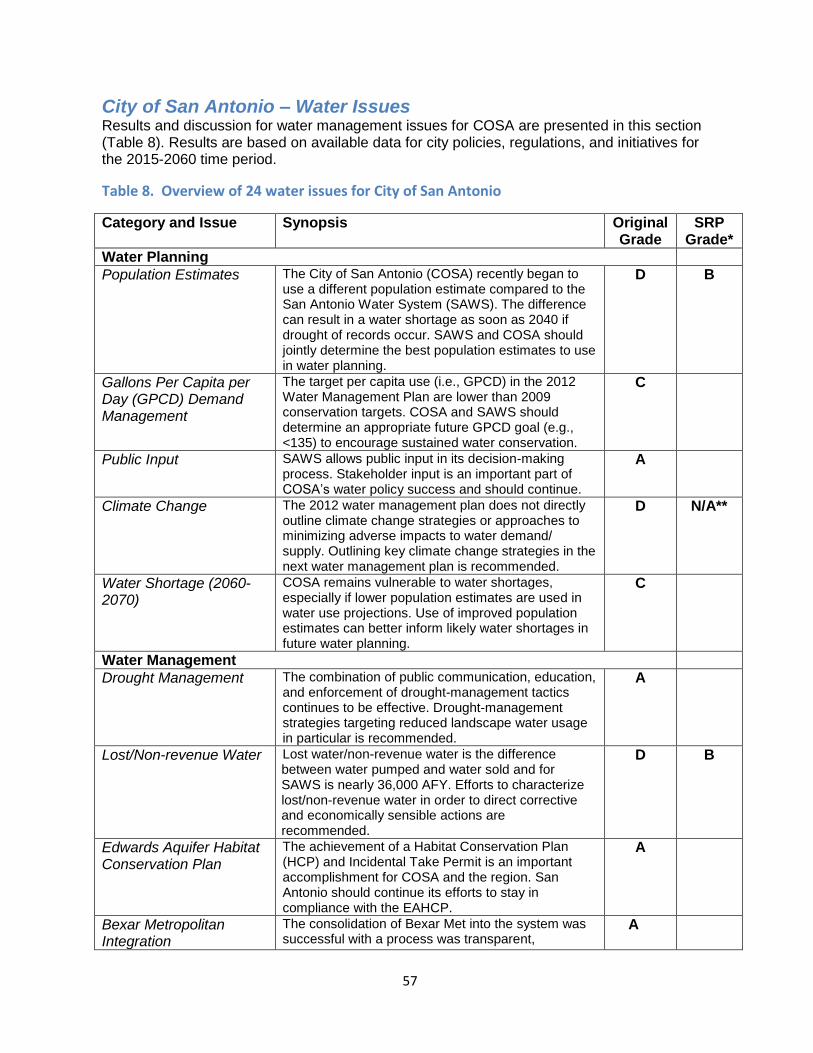
Table 8. Overview of 24 water issues for City of San Antonio ................................................................. 57
Table 9. SAWS annual pumpage versus accounted and unaccounted water .......................................... 72
Table 10. Edwards Aquifer Protection Program conservation easements .............................................. 80
Table 11. Residential fixed monthly service charge for four Texas cities .............................................. 104
Table 12. Commercial fixed monthly service charge ($) for four Texas cities ....................................... 110
Table 13. Current impact fees for City of San Antonio ........................................................................... 113
Table 14. Fair Oaks Ranch water resources (both current and future) in order of water production .. 115
Table 15. Risk ratings for Fair Oaks Ranch water resources (from high to low) .................................... 115
Table 16. Overview of 11 water issues for City of Fair Oaks Ranch ....................................................... 123
Table 17. Drought of record, climate change and other factors for Fair Oaks Ranch water balance (all
volumes are per year) ............................................................................................................................. 128
Table 18. Fixed monthly service charge ($) for Fair Oaks Ranch ............................................................ 151
Table 19. Fair Oaks Ranch impact fees per service unit/living unit equivalent ..................................... 151
List of Comments Comment 1. Purpose of Science Review Panel and report comment boxes ........................................... 15
Comment 2. Methodology used in policy assessment ............................................................................. 16
Comment 3. Risk analysis metrics used ................................................................................................... 20
Comment 4. Water grade rubric limitations ............................................................................................ 21
Comment 5. Data used to support conclusions ....................................................................................... 31
Comment 6. Vista Ridge project considerations ...................................................................................... 38
11
List of Acronyms Acronym Definition
AF Acre Feet
ACRE FOOT 325,851 gallons
AFY Acre Feet Per Year
AMR
Automatic Meter Reading
AECOM An International Professional Technical Services Firm
ASR
Aquifer Storage and Recovery
Bexar Met
Bexar Metropolitan Water District
BMA
Bexar-Medina-Atascosa Counties Water Control and Improvement District #1
BMP Best Management Practice
CAP Citizens Advisory Panel
CCC
Community Conservation Committee
CCGCD Cow Creek Groundwater Conservation District
CCN
Certificates of Convenience and Necessity
CECs
Contaminants of Emerging Concern
COSA
City of San Antonio
CPS CPS Energy
CRWA
Canyon Regional Water Authority
CWA
Clean Water Act
DFC Desired Future Condition
DSP District Special Project
EAA
Edwards Aquifer Authority
EAHCP
Edwards Aquifer Habitat Conservation Plan
EARIP
Edwards Aquifer Recovery Implementation Program
EARWCP
Edwards Aquifer Regional Water Conservation Program
EACZ
Edwards Aquifer Contributing Zone
EARZ
Edwards Aquifer Recharge Zone
EDSP
Endocrine Disrupter Screening Program
EDU Equivalent Dwelling Unit
EPA Environmental Protection Agency, see US EPA below
ETJ
Extraterritorial Jurisdiction
EUWCD
Evergreen Underground Water Conservation District
FOR
Fair Oaks Ranch
GPCD
Gallons Per Capita per Day
GPD
Gallons Per Day
GIA Green Industry Alliance
GCUWCD Gonzales County Underground Water Conservation District
GCD Groundwater Conservation District
GMA Groundwater Management Area
GBRA
Guadalupe-Blanco River Authority
GCGCD Guadalupe County Groundwater Conservation District
12
HCP Habitat Conservation Plan
IRNR Texas A&M Institute of Renewable Natural Resources
LID Low-Impact Development
LULAC League of Latin American Citizens
MAG
Modeled Available Groundwater
MPO Metropolitan Planning Organization
MSL
Mean Sea Level
PAH Polycyclic Aromatic Hydrocarbons
POSGCD Post Oak Savannah Groundwater Conservation District
RAC Rate Advisory Committee
SAIA San Antonio Irrigation Association
SARA San Antonio River Authority
SAWS
San Antonio Water System
SRP Science Review Panel
SDWA
Safe Drinking Water Act
SSLGC Schertz-Seguin Local Government Corporation
SB 3 Senate Bill 3
SCTRWP South Central Texas Regional Water Planning
SUD
Special Utility District
SWIFT
State Water Implementation Fund for Texas
TCEQ
Texas Commission on Environmental Quality
TNLA Texas Nursery Landscape Association
TDS
Total Dissolved Solids
TGRGCD
Trinity Glen Rose Groundwater Conservation District
TWDB Texas Water Development Board
TWRI Texas Water Resources Institute, Texas A&M University
TxDOT Texas Department of Transportation
UDC Unified Development Code
US EPA
United States Environmental Protection Agency
VISPO
Voluntary Irrigation Suspension Program Option
WECo
Water Exploration Co.
WRIP Water Resources Integration Program
WSP Water Systems Optimization
WSC
Water Supply Corporation
13
Introduction Overview The Cities of San Antonio and Fair Oaks Ranch Water Policy Analysis reviews and assesses factors relevant to implementing water policies. The purpose of this technical report is to provide the City of San Antonio (COSA) and the City of Fair Oaks Ranch (FOR) (hereafter the Sponsor) with a tool for decision-making regarding water resources/projects to pursue and for the integration of city planning strategies in addressing key water management issues. The report is divided into four sections: Introduction, Methods, Results/Discussion, and Appendix. Results for the analyses are discussed separately for each city.
The policy assessment reviews (1) water resources/projects and (2) water management issues for each city. Water resources or projects are assigned a numeric “risk” value based on a risk analyses “score card.” Some example water resources evaluated include Edwards Aquifer groundwater (current resource), brackish water desalination (developing resource), and Vista Ridge water project (proposed resource), to name a few. Conversely, water management issues were evaluated and assigned a letter grade (e.g., A, B, C, D, and F) in the report. Various water management issues were evaluated for Sponsor consideration in water planning efforts. Examples of water management issues include population estimates to use in water planning, mitigation strategies for addressing climate change impacts, and Edwards Aquifer protection program, among others.
For COSA, 12 water-supply resources were evaluated and a numeric “risk” value assigned. Furthermore, 24 water management/planning issues were evaluated, graded, and discussed with respect to water management and planning performance. For FOR, three water-supply resources were evaluated and graded in a similar fashion, along with 11 water management/planning issues. The water policy assessment was based on available data on city policies, regulations, and initiatives, to include cost, quantity, and quality, for the 2015-2060 period.
The original authors (Dr. Calvin Finch, Principal Investigator) conducted the assessment for both cities. From the final draft submitted by the authors, an independent Science Panel evaluated the original authors’ methodology, findings, and conclusions, and offered additional items for consideration. The Science Panel’s comments are provided to offer a broader and independent assessment of the original work. Science Panel considerations are integrated into the report in key sections as clearly denoted via text boxes.
Disclaimer: This technical report is not a decision but rather serves as a tool for use in decision-making processes. The report was reformatted from its original form as a final draft for clarity, objectivity, and scientific integrity; however, the essence of the original authors’ work is maintained (e.g., none of the risk assessments or grades were changed). Due to changes in wording and formatting and based on comments from the Science Review Panel, this report may not represent the views of the original authors. This final report serves to offer perspectives based upon the original authors’ work, which enhances the Sponsor’s decision-making process.
Report History In 2014, Dr. Calvin Finch, then Director of the Water Conservation Technology Center (Texas Water Resources Institute, TWRI), procured funding to provide COSA and FOR, and their Extraterritorial Jurisdiction, to the extent located in Bexar, Western Comal, and Southern Kendall counties, a Water Policy Study that assessed water resources (actual and planned) and water issues relevant to future city decisions. The technical report was to draw from
14
existing data (e.g., city policies, regulations and initiatives, and other sources of information) for the period 2015-2060 as part of the analysis. Dr. Finch stepped down as Director of the Water Conservation and Technology Center (Fall 2014), and, to complete contractual obligations, transferred to the Texas A&M Institute of Renewable Natural Resources (IRNR). Dr. Finch sought a project extension from February 2015 to May 2015, the latter date being Dr. Finch’s retirement. Discrepancies between Dr. Finch, the Sponsor, and San Antonio Water System (SAWS), with respect to relevant data, their availability and general revision completion, delayed the report. During the review and revision phase, one of Dr. Finch’s draft reports (the July 2015 version) was leaked to the press in September 2015. Following the leaked draft of the report, and, in order to ensure a scientifically sound and objective report, the Institutes identified a 3-step process to finalize the report:
Step 1 - Obtain the latest draft report from Dr. Calvin Finch.
Step 2 - Submit the draft water report through a scientific peer-review process and address comments and suggestions from reviewers and sponsors in a new draft version. Given the significant policy implications of the water report, the IRNR/TWRI Director elected to add the second step as an added measure of quality assurance and scientific soundness.
Step 3 - Release the final peer-reviewed report to the Sponsor for final comments and submission.
On September 28, 2015, Dr. Finch and co-authors submitted their fourth draft report (Step 1, October 1, 2015 cover page). IRNR/TWRI then obtained peer reviews of the report (Step 2, October 12-29, 2015) to facilitate the completion of the report, including validation of data/values being used by the Sponsor, both of these steps were to assure quality assurance. The latter is not unusual for the Institutes, which has employed the peer-review process as a measure of quality assurance for past projects (e.g., golden cheeked warbler report, peer-reviewed by The Wildlife Society). A final draft of the document (Step 3) was submitted to the sponsor in November 2015.
Contributors Report Contact. Dr. Roel Lopez, Director of Texas Water Resources Institute and Texas A&M Institute of Renewable Natural Resources.
Report Authors (Early Draft). Dr. Calvin Finch (retired), Dr. James Mjelde (Texas A&M University, Agricultural Economics), Dr. Kelly Brumbelow (Texas A&M University, Civil Engineering), and Ms. Amy Truong (Texas A&M Institute of Renewable Natural Resources).
Technical Editors. Contributions from various IRNR and TWRI staff are acknowledged for their reviews and technical editing throughout the completion of the final report.
Science Panel. Five water research scientists also are acknowledge for their peer-review efforts to include scientific recommendations for further consideration within the final report.
Science Panel Review The Scientific Peer-Review is commonly used to ensure the integrity of work published in journals used by various scientists who wish to share findings, knowledge, and information within a science community. The Scientific Peer-Review process is followed by the vast majority of peer-reviewed science journals in all academic fields ranging from mathematics, physics and engineering, to the natural sciences and liberal arts fields. In general terms, the Scientific Peer-Review process involves submitting a body of work to a group of qualified
15
scientists who objectively (neutrally) examine the work’s objectives, methodology, findings, conclusions, and recommendations for scientific correctness within their professional field.
There are several types of peer-review processes. The “blind” review is the most common type of review used by professional scientific journals. It is called a blind review because the reviewer’s identity is not revealed. The blind review panel objectively critiques the work and offers their professional opinion as to considerations, areas of improvement, or revision. Ultimately, the panel decides whether the work has scientific merit and whether it should be accepted for publication in a professional journal. The blind review allows for candor and objectivity towards the work.
For the Cities of San Antonio and Fair Oaks Ranch Water Policy Analysis, a blind peer-review process was used to review this technical report, as a commitment to ensure scientific integrity and objectivity. The Science Panel was comprised of well-respected individuals in the water field. Each has more than 20 years of experience in their respective fields (e.g., water economics, water policy, water engineering) and a strong publication record (e.g., >50 peer-reviewed journal articles). The Science Panel’s review results are provided in this report as comment boxes and offer an additional perspective for decision-making. Their review serves to better allow the Sponsor to use this report as a tool for making decisions.
The purpose of the Science Review Panel (SRP) was to validate values, assumptions, and methodologies used in the original draft report, and offer recommendations so the Sponsor may have a more balanced and objective assessment to use in decision-making. SRP comments are provided to offer the reader a broader perspective, and summarized both in Appendix A in addition to yellow text boxes like this one throughout the report.
Comment 1. Purpose of Science Review Panel and report comment boxes
16
Methods Objectives The overarching goal of the study was to assess water resources (actual and planned) and water issues relevant to future Sponsor policy decisions regarding COSA and FOR, and their Extraterritorial Jurisdiction (ETJ), for the period of 2015-2060. The water assessment used existing data on city policies, regulations, initiatives involving cost, quantity, and quality of water from the Edwards and Trinity Aquifers plus Canyon Lake/Guadalupe-Blanco River Authority (GBRA) and other resources. Specific contract tasks included:
Contract Tasks:
1. Work with COSA, FOR, FOR Utilities, SAWS and other participants to integrate findings for various parts of project.
2. Describe each of SAWS water resources (actual and planned) to include amount of water produced, cost of water produced, environmental characteristics, regulatory status, sustainability of the source, regulatory agencies involved, relationship to the distribution system, and relationship to drought.
3. Describe FOR and its ETJ water resources (actual and planned) to include the amount of water produced, environmental characteristics, regulatory status, sustainability of the source, regulatory agencies involved, relationship to the distribution system, and relationship to drought.
4. Describe special characteristics of COSA and FOR water security including drought management, distribution system, dependence on the Edwards and Trinity Aquifers and GBRA regional status, relationship to municipal utility districts, former Bexar Metropolitan Water District (Bexar Met), water treatment, geography, and water conservation.
5. Assign numerical risk value to each water source based on its comparison to obtaining water from the Edwards and Trinity Aquifers and GBRA.
6. Describe and provide a letter grade for each of a number of organization and management characteristics for SAWS, FOR, the Edwards Aquifer Authority (EAA), the Trinity Glen Rose Groundwater Conservation District (TGRGCD), and other state, regional or local entities granted water regulatory authority.
The SRP noted limitations with the methodology used in the analyses, which impacted data, findings, and conclusions. For example, items of report significance were missing from the draft, such as a methodology section describing the assessment process and a description of how values and grades were determined. A methodology section was added to the report as a corrective measure. Other SRP findings include: metrics used in the assessment did not measure factors correctly, evenly, overly favored or penalized projects, and in some cases were not uniformly applied; metrics included factors that were not relevant to the study; disparities between risk and uncertainty; and subjectivity in study design and conclusions. The SRP suggested corrective measures within the report and in the Appendices. See Appendix A, Methodology Used in Assessment, for further details.
Comment 2. Methodology used in policy assessment
17
Risk Analyses – Water Resources The water report reviews 12 water-supply resources or projects for COSA and three water-supply resources or projects for FOR identified in the SAWS 2012 Water Management Plan (Table 1).
Table 1. Water Resources evaluated for Cities of San Antonio and Fair Oaks Ranch
City of San Antonio 1. Edwards Aquifer Groundwater 2. San Antonio Water System (SAWS) Recycled Water 3. Vista Ridge Water Project 4. Brackish Water Desalination 5. SAWS Twin Oaks Aquifer Storage and Recovery 6. Local Carrizo (Bexar County) 7. Medina Lake 8. Carrizo Water (Gonzales County) 9. Water Conservation 10. Western Canyon 11. Trinity Oliver Ranch Aquifer Water 12. Lake Dunlap/Wells Ranch (Canyon Regional Water Authority)
City of Fair Oaks Ranch 1. Trinity Aquifer Water 2. Canyon Lake Water 3. Fair Oaks Ranch Recycled Water
In this report, risk is defined as characteristics of water-supply resources that expose the supply to some degree of unreliability, threat, or challenge. Assigning a numerical “risk” value reflects the estimated degree of unreliability, threat, or challenge for that water resource (Table 2). Each water resource assessment includes a (1) risk analysis “score card,” (2) project overview or description, (3) project considerations, (3) grade assessment (to include suggested recommendations and actions), and (4) source references.
The basic risk factors evaluated for each water resource attempt to capture variability and/or unpredictability of that water resource (Table 2). Risk characteristics viewed as “low risk” are assigned a negative value (-); those with a “medium risk” are assigned a 0; and those viewed as “high risk” are assigned a positive value (+). The summation of -, 0, and + results in a total “risk” value. Projects with an overall negative value are considered low risk. Projects with a 0-1 value are considered medium-risk resources. And finally, projects with a positive value >1 are considered high-risk resources. Clearly, these assigned values for risk involve a measure of subjectivity.
Risk Factors Total Water – Total water is not a risk factor but is an important characteristic of the water project. The amount of water provided by the project (sometimes under various conditions) is included on the risk-factor score card for every project.
Cost of Water – Cost in itself, even a high cost, is not deemed a risk factor as long as it is a stable cost. Water costs uncertain or subject to change due to price changes or other factors will rate a (+) risk point.
18
Ownership of Water – Some of the water-supply resources include both owned and leased water. More risk points were assigned to leased water. Owned water is rated as a (-) risk factor. Leased water adds risk to the project’s reliability so it merits a (+) risk point. Projects that include a nearly equal mix of owned or leased water may receive a (0) risk score.
Length of the Contract – Water supplies that are contracted for periods shorter than the 45 years through 2060 merit a risk point (+) because they will have to be renegotiated or replaced.
Distance from San Antonio or Fair Oaks Ranch – A long pipeline to transport water from its source to San Antonio or FOR is deemed a risk. A water source that originates under the boundaries of the subject city reduces risk by a point (-). A water source that involves a pipeline less than 30 miles does not receive a risk point (0). Pipelines between 30 miles and 100 miles are determined to be at risk for one point (+). Over 100 miles are assigned 2 risk points (++).
Endangered Species – Water projects or a project’s pipelines near endangered or threatened species are considered at risk and receive a point (+). If there are no endangered species or if the issue has been addressed with the completion of an Incidental Take Permit, the project may merit a negative risk point (-) rather than the addition of a point.
Treatment Required – Supply projects requiring significant treatment are deemed more vulnerable to accidents and/or purposeful actions and are rated as more risky (+). Water sources that do not need treatment face less risk (0).
Contamination Threat – Water sources are subject to more or less risk of contamination based on their nature. Surface water sources are deemed more vulnerable and receive a (+). Groundwater sources that recharge quickly are deemed more threatened and receive a (+). Groundwater sources slow to recharge are deemed to be less vulnerable and receive a (-). A water-supply project that includes several sources of varying vulnerability may receive a risk rating of (0).
Sensitivity to Drought – Some water-resource projects are not affected by the drought situation in the region. They receive a minus risk credit (-). Projects that move into drought restriction situations in times of drought are assigned a risk point (+). Projects that provide no or very little water in a severe drought situation may be assigned 2 risk points (++).
Regulatory Agencies – The number and characteristics of the regulatory agencies involved with a particular water supply are an important risk factor. If there are no local regulatory entities involved or a local agency with San Antonio representation, the project merits a minus risk point (-). If the regulatory agency is a state agency, the situation is assigned no risk points (0). A local regulatory agency without any representation from San Antonio or FOR is deemed a risk and receives a point (+).
Other Issues – Among the issues that may result in a risk point being added to include the financial state of a water supplier.
Overall Risk Rating – Risk analysis was subjective. Via summation, the original authors of this paper related an overall risk rating to the number of negative and positive risk points assigned. A supply project with more minus (-) risk points than positive (+) risk points was rated as a “low-risk” water-supply project. Projects with an equal number of pluses (+) and minuses (-) or with one more plus (+), were designated as “medium-risk” projects. Projects with 2 or more pluses (+) than minuses (-) were rated “high-risk” projects.
19
Table 2. Risk score card metrics used in analyses
Risk Score Card Rating
Amount of Water: Cost of Water: Cost Stability: Unstable (+) Ownership State of Water: Owned (-)
Combination (0) Leased or Contract (+) Length of Contract: Shorter than 45 Years (+) Distance of Source from San Antonio or Fair Oaks Ranch:
On Site (-) Less than 30 Miles (0) 30-100 Miles (+)
Over 100 Miles (++) Endangered or Threatened Species Issue:
Regulatory Agencies Involved: None or One Local with Representation
(-)
One or More, No Representative (+)
State Agency (0)
Other Issues: No (-) Consider (0) Yes (+) Total Score: Minus Risk Plus Risk Rating: Low Risk (More minuses than pluses) Medium Risk (Same number or one
more plus)
High Risk (2 or more pluses than minuses)
Total Minuses (-)
Total Pluses (+)
Total Summation/Rating ∑ of risk values Rating
20
The SRP found limitations with the risk analysis metric and suggested improvements. Some issues included subjectivity (i.e., risk vs. uncertainty) and incompleteness in both leaving key information out of the analyses (i.e., reliability of supply and regulatory certainty) and incorporating factors of marginal relevance (i.e., distance from source, contamination threat, and number of regulatory agencies as an indicator of regulatory certainty). The risk rating scale itself was not only considered a little unusual for this type of analysis but also inadvertently introduced bias to the analysis where factors were applied unevenly across projects resulting in projects being overly penalized, overly favored or mathematically not weighted in the analysis. The SRP recommendations included: revising the risk analysis metric to better measure uncertainty, as well as consistency in applying methodology to all projects. The SRP developed a supplemental assessment to better measure uncertainty and offered questions for Sponsor consideration in future decision-making. For further details, see Appendix A, 1 Risk Analyses Metrics.
Comment 3. Risk analysis metrics used
21
Grade Assessment – Water Issues As part of the project, COSA and FOR requested assignment of letter grades for water management activities or issues within their communities (Table 3). The original authors assessed water management activities/issues within five broad categories: water planning, water management, water quality, regulatory agencies, and water costs (Table 4). The grade assignment served to provide insight into the discussion of whether the communities are prepared in terms of water supply and where issues may exist to improve that preparation. The grade assignments are largely opinions of the authors and based, in some cases, on a limited amount of information.
Table 3. Water grade descriptions
Grade Description
A Exemplary, recognized as a leading example, and accomplishing the goals for the effort
B Effective, generally accomplishes goals for the effort, but not be exemplary, lacking in one area
C Seems to be accepted by local ratepayers without any special recognition outside. Meets goals but not exemplary
D Does not meet goals and effort to correct not adequate F Failure to meet goals without much effort to address or correct
The SRP found limitations in both water issue selection and grading, particularly with respect to subjectivity. The SRP determined certain issues should not have been included in the analyses because there was no apparent historical measure based on data provided from which to determine a grade (i.e., coal tar sealant, climate change). They found the overall grading methodology subjective, based on limited information, and admittedly opinions of the draft authors. Examples discussed include population estimates, lost/non-revenue water, water shortages, and Edwards Aquifer conservation easements. The SRP also determined the grades themselves did not offer translatable actions, and instead suggested that grades of A or B should be considered items to “maintain” and C or D should be viewed as “opportunities for improvement or areas of potential gain.” The SRP developed a supplemental grading metric for consideration and independently assessed each water grade assignment based on available data in the report. See Appendix A, Water Grades for further information.
Comment 4. Water grade rubric limitations
22
Table 4. Overview of water issues evaluated for the Cities of San Antonio and Fair Oaks Ranch by category
City of San Antonio City of Fair Oaks Ranch
Water Planning
Population Estimates Population Estimates Gallons Per Capita Per Day Demand Management
Drought-of-Record Conditions
Public Input Climate Change Climate Change Water Shortage (2060-2070)
Water Management Drought Management Water Conservation Lost/Non-revenue Water Drought Management Edwards Aquifer Habitat Conservation Plan
Lost/Non-revenue Water
Bexar Metropolitan Integration City of San Antonio as a Water Neighbor
Water Quality Edwards Aquifer Protection Program
Relationships with Neighboring Communities
Regulation of Development Activities over Edwards Aquifer Recharge Zones and Contributing Zones
Contamination Threat Low-Impact Development Coal-Tar Sealant Annexation and Extension of Water
Infrastructure
Regulatory Agencies Texas Water Development Board (TWDB)
Trinity Glen Rose Groundwater Conservation District
Texas Commission on Environmental Quality (TCEQ) and Environmental Protection Agency (EPA)
TWDB
Edwards Aquifer Authority TCEQ and EPA Local Regulatory Agencies
Water Costs Water Project Costs Residential/Commercial Rates Residential Water Rate Structures Impact Fees Commercial and Industrial Water Rate Structures
Impact Fees
23
Results and Discussion Results for the water analyses are discussed separately for each city. The discussion includes both water resources/supply and water management activities or issues.
Disclaimer: Data access and availability impacted the report’s assumptions and ultimately the final assessment. Initially, the assessment primarily used data from the 2012 SAWS Water Management Plan. Early feedback from COSA and SAWS suggested it would be better to access updated values or assumptions from the 2015 SAWS Water Management Plan, which at the time was not available to incorporate into the report. Communication with COSA and SAWS served to facilitate the updating of some but not all values. As a result, values used for the assessment are a mix of both 2012 (published) and 2015 (unpublished) data, which creates inconsistencies in data values used for the report’s assessment. Ideally, use of consistent data throughout the report (all 2012 or all 2015) would provide improve the assessment and comparison of projects and issues. This final report used the best available data (2012 and 2015) provided to the Institutes for its water resource and policy assessment.
City of San Antonio – Water Resources Twelve water resources for COSA were evaluated and assigned a risk rating using the risk grading “score card” described in the methods section of the report (Table 2). The following section describes each of the projects, considerations, and an assessment summary, which includes recommendations and actions, in order of water resource contribution (Table 5). An assignment of a “high risk” label translates into projects with more positive values than negatives. An assignment of a “medium risk” value equates to an equal number of positives and negatives. Finally, an assignment of “low risk” label equates to a higher number of negative values compared to positives. The analyses found an equal number of “high/medium risk” or challenging water resources (6) compared to “low risk” or less challenging water resources (6) to use (Table 6).
Table 5. San Antonio water resources (both current and future) in order of water production
Project Water Amount (acre feet/year)
Ranking
Edwards Aquifer Groundwater 294,530 1
SAWS Recycled Water 125,000 2
SAWS Twin Oaks Aquifer Storage and Recovery 68,000 3
Vista Ridge Water Project 50,000 4
Local Carrizo (Bexar County) 34,400 5
Brackish Water Desalination 33,600 6
Medina Lake 29,188 7
Gonzales Carrizo 17,238 8
Water Conservation 16,500 9
Western Canyon 13,000 10
Trinity Oliver Ranch Water 8,800 11
CRWA Lake Dunlap/Wells Ranch 6,800 12
Source: 2012 SAWS Water Management Plan.
24
Table 6. Risk ratings for San Antonio water resources (from high to low)
Project Low Risk (-)
High Risk (+)
Overall Risk Value
Risk Label
Medina Lake -2 7 5 High
Vista Ridge Water Project -3 7 4 High
Western Canyon -2 5 3 High
CRWA Lake Dunlap/Wells Ranch -2 5 3 High
Gonzales Carrizo -3 5 2 High
Trinity Oliver Ranch Water -3 4 1 Medium
Edwards Aquifer Groundwater -4 3 -1 Low
Brackish Water Desalination -4 3 -1 Low
SAWS Twin Oaks Aquifer Storage and Recovery
-5 2 -3 Low
Local Carrizo (Bexar County) -4 1 -3 Low
SAWS Recycled Water -5 1 -4 Low
Water Conservation -6 2 -4 Low
25
Edwards Aquifer Risk Score Card Rating
Amount of Water: 294,530 acre feet/year (AFY)
Cost of Water: $331/acre foot (with no restrictions)
$541/acre foot (during drought management) 1 Cost Stability: Active water market (0) Ownership State of Water:
85% permanent, 15% leased (-)
Length of Contract: Varies 1-10 years (0)
Distance of Source from San Antonio:
Confined zone where wells are located; is in San Antonio (-)
Endangered or Threatened Species Issue:
8 species at Comal and San Marcos Springs are addressed with the Edwards Aquifer Habitat Conservation Plan
(+)
Whooping crane habitat is related to environmental flows down Guadalupe and San Antonio Rivers
At least 3 mussels are listed as endangered or threatened in the Guadalupe River
3 beetles exist in karst formations in Bexar County and surrounding areas
Treatment Required: Only chlorine and fluoride (-) Contamination Threat:
Development over the Edwards Aquifer Recharge Zone, and Edwards is a fast-recharge aquifer.
(+)
Drought Restrictions: (Drought Sensitivity)
Yes, 5 stages up to 44% reduction based on aquifer level at Monitoring Well 17 and spring-flow rates at Comal and San Marcos Springs.
(+)
Regulatory Agencies Involved:
EAA; San Antonio is represented on the EAA Board. (-)
Other Issues: Dependence on the Edwards Aquifer as the primary source of water
(0)
Rating: -4 (-) 3 (+) Total: -1 Low Risk
Description According to the 2012 SAWS Water Management Plan, modelled efforts of the Edwards Aquifer estimate approximately 46% of the SAWS supply (2012) and 33% of the SAWS supply (2040), assuming both years are repeats of the drought of record). 2 In 2012, the actual use of Edwards Aquifer water was 86% of SAWS potable water production, illustrating the variability in water dependence on the aquifer based on climatic conditions. Much of this variability is primarily due to SAWS’ approach in diversifying water resources in response to availability. Water from the aquifer is pumped from 92 wells within the San Antonio city limits with an average depth of 1,500 feet and pumping capability of 16,000 gallons/minute.3
Edwards Aquifer water is potable as pumped with the only treatment required being the addition of chlorine and fluoride. The aquifer is a karst (limestone) structure, so the water has high levels of calcium, magnesium, and other minerals (averages 250-350 total dissolved solids [TDS]). The pH is approximately 7.3.4 Recharge of the Edwards Aquifer occurs quickly in
26
response to rainfall due to features that are open at the surface and carry water into the aquifer. The average recharge from 1934 through 2011 was 676,000 acre feet/year (AFY).5
The water in the Edwards Aquifer generally flows from the west to the northeast.6 Aquifer levels above certain mean sea levels (MSL) result in spring flow at Comal Springs (623 MSL) in New Braunfels and San Marcos Springs (574 MSL) in San Marcos.7 The Comal and San Marcos Springs are an important features to the Edwards Aquifer as a water source, though protection of endangered species unique to the springs may limit available water use. Flow from the springs into the Guadalupe River also is an important water source for downstream agriculture and communities such as Victoria. The Guadalupe River provides, for example, habitat for endangered freshwater mussels and inflows supporting habitat for the endangered whooping crane. The Edwards Aquifer Habitat Conservation Plan (EAHCP) addresses protection of the species at Comal and San Marcos Springs, but the protection of the other species is still unresolved. In June 2014, a decision on a lawsuit brought by the Aransas Project determined the level of water represented by water rights in the Guadalupe River did not threaten the whooping cranes. The decision obviously affects COSA water supplies due to requirement of environmental flows for endangered species.8
EAA is charged with the regulation of water use from the Edwards Aquifer. Senate Bill 3 established that 572,000 AFY of permits would be available from the aquifer. In 2000, seven counties within the EAA jurisdiction were divided between agriculture, municipalities, and industry in the proportion of 40%, 49%, and 11%, respectively. In 2014, the proportion distributions changed to 30% (agriculture), 62% (municipal use), and 8% (industrial use). SAWS is the largest pumper, with 294,530 AFY of permits (249,254 AFY owned and 45,250 AFY leased).9 San Antonio increased its Edwards’ water holdings through purchases and leases obtained in the active Edwards Aquifer water market. According to the 2012 Water Management Plan, SAWS’ goal is eventually to achieve ownership of 10,900 more AFY of Edwards water. Once those amounts are reached, pursuit of further Edwards’ water will end and the diversification of SAWS water resources will accelerate.10
Considerations There are a number of considerations with the use of the Edwards Aquifer as a water source. First, COSA is dependent on the Edwards Aquifer as its main source of water, particularly during “normal” years. An objective of SAWS is to diversify its dependence of Edwards’ water through alternative water resources. Second, Edwards Aquifer levels continue to fluctuate and/or are dynamic. The aquifer levels affect spring flow in the Comal and San Marcos Springs, of which a number of endangered species rely, and can impact as much as 44% of pumping efforts. Finally, there is significant development pressure over the Edwards Aquifer Recharge Zone (EARZ), which increases the contamination risks and infiltration rates. San Antonio residents have supported use of tax dollars for conservation easements and/or purchase of development restrictions. A consideration for Edwards’ water users may include extending these EARZ restrictions to Shavano Park, Helotes, Hollywood Park, and other jurisdictions not currently regulated.
Grade Assessment The Edwards Aquifer is graded as low-risk water resource because of its important role (current) in COSA water supply. Despite its challenges described above, it is likely to continue to be an important part of the SAWS water portfolio in the future. Recommendation — The 2012 SAWS Water Management Plan outlines efforts to reduce the Edwards portion of the total supply for future years but, in practical terms, the plan also relates
27
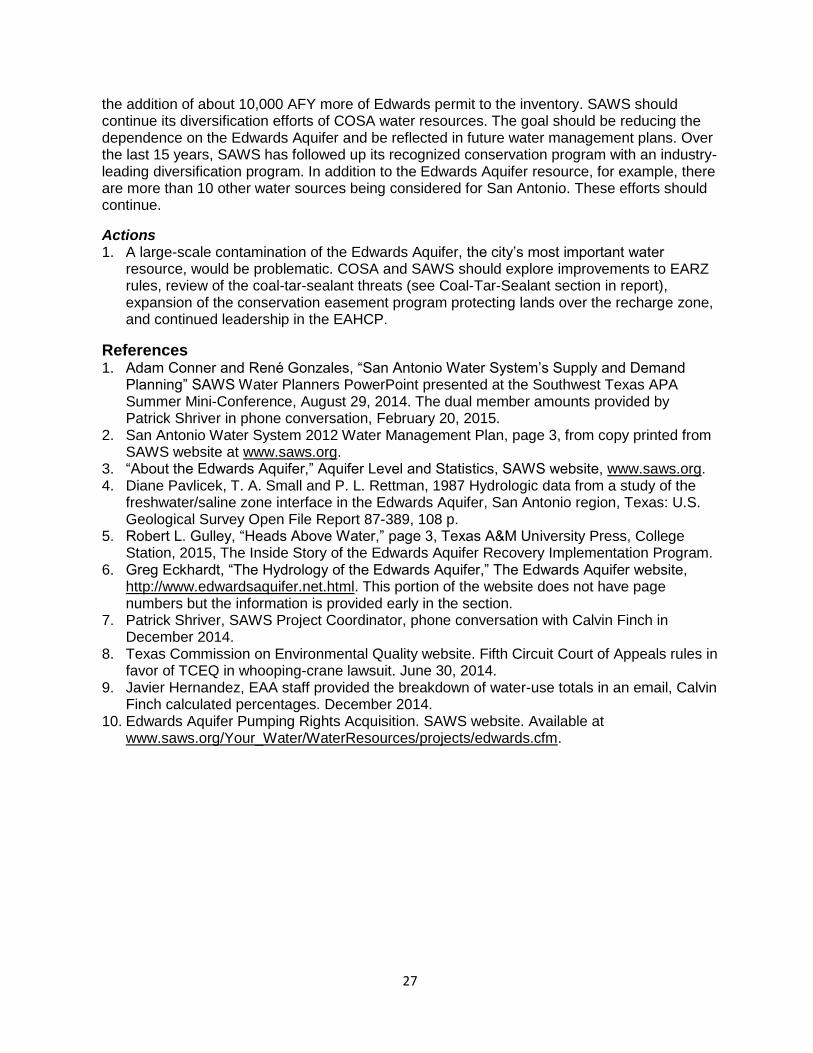
the addition of about 10,000 AFY more of Edwards permit to the inventory. SAWS should continue its diversification efforts of COSA water resources. The goal should be reducing the dependence on the Edwards Aquifer and be reflected in future water management plans. Over the last 15 years, SAWS has followed up its recognized conservation program with an industry-leading diversification program. In addition to the Edwards Aquifer resource, for example, there are more than 10 other water sources being considered for San Antonio. These efforts should continue.
Actions 1. A large-scale contamination of the Edwards Aquifer, the city’s most important water
resource, would be problematic. COSA and SAWS should explore improvements to EARZ rules, review of the coal-tar-sealant threats (see Coal-Tar-Sealant section in report), expansion of the conservation easement program protecting lands over the recharge zone, and continued leadership in the EAHCP.
References 1. Adam Conner and René Gonzales, “San Antonio Water System’s Supply and Demand
Planning” SAWS Water Planners PowerPoint presented at the Southwest Texas APA Summer Mini-Conference, August 29, 2014. The dual member amounts provided by Patrick Shriver in phone conversation, February 20, 2015.
2. San Antonio Water System 2012 Water Management Plan, page 3, from copy printed from SAWS website at www.saws.org.
3. “About the Edwards Aquifer,” Aquifer Level and Statistics, SAWS website, www.saws.org. 4. Diane Pavlicek, T. A. Small and P. L. Rettman, 1987 Hydrologic data from a study of the
freshwater/saline zone interface in the Edwards Aquifer, San Antonio region, Texas: U.S. Geological Survey Open File Report 87-389, 108 p.
5. Robert L. Gulley, “Heads Above Water,” page 3, Texas A&M University Press, College Station, 2015, The Inside Story of the Edwards Aquifer Recovery Implementation Program.
6. Greg Eckhardt, “The Hydrology of the Edwards Aquifer,” The Edwards Aquifer website, http://www.edwardsaquifer.net.html. This portion of the website does not have page numbers but the information is provided early in the section.
7. Patrick Shriver, SAWS Project Coordinator, phone conversation with Calvin Finch in December 2014.
8. Texas Commission on Environmental Quality website. Fifth Circuit Court of Appeals rules in favor of TCEQ in whooping-crane lawsuit. June 30, 2014.
9. Javier Hernandez, EAA staff provided the breakdown of water-use totals in an email, Calvin Finch calculated percentages. December 2014.
10. Edwards Aquifer Pumping Rights Acquisition. SAWS website. Available at www.saws.org/Your_Water/WaterResources/projects/edwards.cfm.
Cost Stability: Internal costs and power costs (-)
Ownership State of Water:
Direct Reuse, Owned (-)
Length of Contract: Contracts with recycled water users (0)
Distance of Source from San Antonio:
The treatment plant is 22 miles* south of San Antonio. There is a complete ring (130 miles) of purple pipe for distribution.³
(0)
Endangered or Threatened Species Issue:
None (-)
Treatment Required: Primary, secondary and chlorine (+)
Contamination Threat: Very secure, no storage (-)
Drought Restrictions: (Drought Sensitivity)
Steady source because it relies on indoor and commercial water use
(-)
Regulatory Agencies Involved:
TCEQ, COSA input to regulatory agency (TCEQ is a state agency).
(0)
Other Issues: Public aversion to using the water over the recharge zone is limiting
(0)
Peak use on landscapes is an inefficiency
Environmental flows for San Antonio River
Rating: -5 (-) 1 (+) Total: -4 Low Risk
*Some recycling centers can exceed >30 miles to treatment plan. Though an assignment of “0” is given here, a “+” can also be considered depending on which recycling center is used. This can affect the overall risk value given.
Description COSA Recycled Water Program is the largest direct-recycled program in the United States.4 Direct recycling means that untreated and treated water never leaves a SAWS pipeline or treatment plant until provided to the end user. In contrast, indirect-reuse water is water transported or stored in surface water, rivers, or lakes.
SAWS effluent flows have averaged 140,425 AFY for over 10 years with no significant increase during that period.1 Current minimum planning yield is 125,000 AFY.1 with this water being available for reuse during a dry year. The majority of recycled water is used for environmental flows in the San Antonio River (50,000 AFY) and CPS Energy (CPS) power production (50,000 AFY). The remaining recycled water (approximately 10%) is contracted for use on golf courses, institution landscapes, and manufacturing (Table 7) or available for other similar uses.
The SAWS Recycled Water Program is not a simple water-supply source to analyze. Because recycled water is viewed as conserved water rather than potable water, it is not calculated as part of the gallons/capita/day (GPCD) though it saves a significant amount of potable water. If the 12,999 AFY used by ratepayers is counted, for example, it reduces the average GPCD
29
approximately 6.5% (assumes total water use equals 200,000 AFY). CPS uses recycled water in its power production as industrial water, and the reduction of GPCD due to recycled water use is over 20% (38,089 AFY). In 2011, CPS used 51,145 AF. The environmental flow water is not calculated as part of GPCD estimates.5 CPS’s use of recycled water in its electric-generation cooling was good for CPS, SAWS, and ratepayers of both organizations. As CPS closes coal-burning plants in favor of natural gas plants that use less water, its recycled water needs may change and would need to be reassesed.6
Initially, the recycled water program was a hard sell to encourage customers to replace potable water with recycled water. As a result, pioneer customers benefitted the most with low rates and flexible contracts. CPS saw this as an opportunity to increase its access to the water source7 and made a financial commitment to support the use of recycled water in San Antonio nearly 10 years ago. Although CPS pays the lowest acre-foot charge of any recycled water customer, this allows CPS to maintain its low electrical rates. Funds from the recycled water program also have been used to develop other recycled water customers. Collectively, these efforts were foundational in the development of the recycled water system that exists today. In recent years, customers have recognized the advantages of access to reuse water in terms of low cost and with the avoidance of drought restrictions. In addition to the price advantages and less restrictive drought restrictions, SAWS provided many contracted customers a cost-share rebate of $500/acre foot for every acre foot of potable water that was replaced for over 10 years. SAWS no longer subsidizes the conversion to reuse water likely due to sustained demand8 but does give preference to water customers using a steady amount of reuse water versus those using water only in the summer for landscapes.
Considerations SAWS and its customers have reassessed the value of reuse water. In addition to the policy changes concerning its distribution, in 2014 SAWS made a major statement in recognition of the value of reuse water when it applied for a bed-and-banks authorization from the Texas Commission on Environmental Quality (TCEQ) to convey and reuse return flows derived from privately-owned groundwater (authorized in Section 11.042(b) of the Texas Water Code). SAWS intends to reuse 50,000 AFY of its bed-and-banks authorized return flows, less carriage losses, solely for instream use between San Antonio and the proposed diversion point near the mouth of the Guadalupe River on the Texas coast. SAWS also intends to use the remainder of its authorized bed-and-banks return flows (up to 211,000 AFY) for municipal, agricultural, industrial, mining, and instream use in Bexar, Wilson, Karnes, Goliad, Victoria, Refugio and Calhoun counties. The authorization would ensure that SAWS’ privately-owned groundwater-based return flows in excess of 50,000 AFY for instream use are protected for the future benefit of SAWS customers.9 The request was supported by the San Antonio River Authority (SARA) in recognition that it supports instream flows in compliance with the recommendations of the 1988 City of San Antonio Regional Water Resources Plan.9 GBRA, however, opposes the SAWS bed-and-banks application. GBRA contends that its state-issued surface water rights authorize it to divert and sell SAWS privately-owned groundwater-based effluent for the benefit of GBRA and its downstream customers and prevent SAWS from getting a bed-and-banks authorization to reuse its return flows.9 As of now, the SAWS application for a bed-and-banks authorization is under review by TCEQ.
30
Table 7. Recycled water contract volumes, December 23, 2014
Effluent flows have not increased in more than 20 years.
10-year average flow = 140,425 acre feet per year (AFY)
Current minimum planning yield = 125,000 AFY
Water Balance
Recycled water program supply 25,000 AFY
Distribution capacity 35,000 AFY
Downstream releases 50,000 AFY
CPS Energy contracted volume 50,000 AFY Total from water recycling centers – program water balance 125,000 AFY
Recycled Water Customers
Recycled water program supply 25,000 AFY Contract Volumes AFY
Recycled water customers 12,999 AFY
Golf courses 3,166 AFY1
Irrigation & landscape 3,517 AFY
Industrial & mixed use 6,316 AFY
River Walk & Salado Creek * 5,823 AFY *River Walk & Salado Creek - Note this flow is considered part of the downstream release and occupies capacity in the distribution system but is available for contracted consumptive use.
(5,823 AFY)
Available volume
12,001 AFY
Recycled water program supply 25,000 AFY
Source – Thompson, 20141
Grade Assessment The recycled water program is a low-risk water project for SAWS and plays an important role in reducing the need for potable water. It is difficult to determine the exact amount of recycled water use and equally difficult to determine its availability. The program also is somewhat limited by landscape use of recycled water, with the result that supplies in the winter are not fully utilized.
Recommendation — SAWS should consider an effort to better characterize the availability and use of recycled water. There appears to be approximately 12,000 AFY of recycled water not assigned (Table 7), though CPS and landscape water use may need to be analyzed in terms of temporary or emergency use. A detailed plan for greater use of recycled water would be advantageous, and potentially provide additional water supplies for the COSA.
31
Actions 1. Prepare a revised plan for the recycled water program, to include improved estimates in
amounts of available and/or underutilized. The plan would describe how and when potential available water could be incorporated into the water-use total. It is important to note that SAWS works to market available water but this can sometimes be challenging due to limited demand, e.g., winter months). Plan actions can describe when new recycled water will be available and how to best distribute or market.
References 1. Darren Thompson, SAWS Water Resources Director, email response provided the 125,000
acre feet (AF) figure in a response to a request from Calvin Finch for the information. December 19, 2014. Thompson also reported there were about 140,000 AF of wastewater produced each year.
2. Patrick Shriver, SAWS Water Resources Coordinator, phone conversation on February 20, 2015 with Calvin Finch. The $319 figure is being used but is probably actually low.
3. Questions and responses provided by Darren Thompson on December 18, 2014 in response to request for data on the Recycled Water Program. Electronic Communications. 4. Irrigational and Industrial Recycled Water, SAWS website. Available at
http://www.saws.org/Your_Water/WaterResources/Projects/recycled.cfm 5. Darren Thompson provided the numbers in electronic communication with Calvin Finch,
who made the calculations based on his knowledge of GPCD calculations. 6. Taylor Thompson, “Water Savings to be Part of Cut in Emissions,” San Antonio Express-
News, November 29, 2014. 7. Based on Calvin Finch’s involvement as Conservation Director and Water Resources
Director at SAWS in the decade of the 2000s. 8. Robert Puente, SAWS CEO, information provided in discussion with Texas A&M San
Antonio President Maria Ferrier during meeting to seek SAWS rebate assistance for recycled connection by Texas A&M. Calvin Finch was present for the discussion.
9. Neena Satija, “San Antonio Seeks Ownership of its Wastewater,” Texas Tribune, August 20, 2012.
The SRP determined areas for improvement within the report regarding data used to support conclusions. Some examples include overstatements based on available data on per capita water use and misrepresentation of population estimate data. Conclusions drawn from data must directly be supported by validated data. Other limiting items in the draft included use of non-peer-reviewed literature and self-citations as illustrated above. See Appendix A, Data Used to Support Conclusions, for further details.
Cost of Water: Edwards Water Costs of≈$400/acre foot for the water and an extra $110/acre foot net recovery costs
Current $510²
Cost Stability: Relatively stable (-)
Ownership State of Water:
Permanent (-)
Length of Contract: N/A Distance of Source from San Antonio:
Confined zone where Edwards Aquifer wells are located is in San Antonio. Injection wells are 22 miles south of the city
(-)
Endangered or Threatened Species Issue:
None (-)
Treatment Required: Only chlorine and fluoride (-) Contamination Threat: Limited (0) Drought Restrictions: (Drought Sensitivity)
The current supplies are available in a drought, but it is more difficult to refill ASR in drought.
(0)
Regulatory Agencies Involved:
Agreement with Evergreen Underground Water Conservation District, permit with TCEQ
(0)
No representation on Evergreen, but it does not have jurisdiction in ASR area
Other Issues: ASR is an underground storage facility not an original source.
The ASR must be filled in times of low demand from Edwards to be used in times of high demand.
(+)
At the present there is only a single pipeline that must be used for both directions.
(+)
Rating: -5 (-)
2 (+)
Total: -3 Low Risk
Description SAWS’ Twin Oaks Aquifer Storage and Recovery (ASR) facility is located in the far southern tip of Bexar County. The basic operation is to inject chlorinated water from the Edwards Aquifer (when demand is low) for storage into the Carrizo Aquifer. Water can then be recovered from the same 29 injection wells when demand is high.3 Conditions that make the Twin Oaks ASR an important water management tool for COSA include:
Edwards Aquifer water is bought, leased, and sold through an active water market. The permitted water is available for use in the current calendar year only, with no “carry over” of unused water across calendar years.
Edwards Aquifer water is subject to regulations that impose restrictions reducing access to as much as 44% of permit capacity based on levels of the aquifer measured at the J-17 test well and/or spring flow at the Comal and San Marcos Springs.
33
The use of ASR technology allows SAWS to store permitted Edwards water for use in high-demand periods rather than lose access to the water as the calendar year passes. In practical terms, it means that San Antonio ratepayers are not always subjected to severe drought regulations because SAWS can fulfill the required cutbacks by using ASR water instead of newly pumped Edwards water. The original concept identified an expected capacity of 22,000 acre feet (AF) of storage that would fit the use of the ASR as a seasonal or peak-demand facility.4 SAWS has had as much as 96,000 AF in storage, and the 2012 Water Management Plan listed the official capacity as 120,000 AF. A study completed in 2014 sets the ASR capacity at 240,000 AF, though SAWS is using 200,000 AF for planning purposes.5
Increased storage capacity and several years of successful operation of ASR have resulted in the Twin Oaks ASR identified as the major water management activity of the EAHCP. SAWS will continue to use ASR as a seasonal and drought tool but also hold water reserved for drought-of-record conditions. This water will be owned by the region and administered by SAWS to maintain spring flow during severe drought conditions at Comal and San Marcos Springs.6 This role as the primary spring-flow protection activity adds several more positive impacts to the balance sheet for ASR. First, the role of ASR as EAHCP spring-flow-management activity saves COSA and the region millions of dollars because a new ASR or other water-resource project did not have to be built.6 Second, the availability of the Twin Oaks ASR for a regional role in a drought-of-record situation also is an important contribution to counter any perceived reputation for avoiding regional cooperation.
Considerations The Twin Oaks ASR has proven its value in maximizing the value of owning Edwards Aquifer water, and as a drought-management tool with regional significance. There are some factors, which could serve to improve its potential even more.
Pipeline Capacity — There is only a single pipeline between SAWS Edwards Aquifer production wells and the Twin Oaks injection and recovery wells. Water can only flow one way, and changing the flow direction can have major implications for water distribution. Fortunately, the limitation of the one-way pipeline is currently being addressed through the Water Resources Integration Program (WRIP), which is the infrastructure that will allow SAWS to move water to its western service areas. The project is under construction and on time.6
Capacity Uncertainty — There is uncertainty regarding the total capacity of the Twin Oaks ASR due to limited capacity estimates7, and uncertainty of the system’s capacity to move/draw water into the Twin Oaks ASR (e.g., 40 million gallons/day versus 60 million gallons/day).6 Another item for consideration also includes upgrading the retrieval and pumping capacity.
Brackish Groundwater Treatment — Pursuit of a policy to allow treated brackish groundwater to be stored in the Twin Oaks ASR so the treatment plant can operate at the most efficient continuous state (see Brackish Groundwater Desalination section).
Grade Assessment This project is unique among the 12 described water-supply projects for COSA because it is a storage system rather than a source of new water. Its low-risk nature and its importance to the Edwards Aquifer water value make it worthy of identification as a water-resource project.
Recommendation — Because the Twin Oaks ASR program serves to expand SAWS’ water portfolio, continuous improvements related to storage capacity and distribution should continue to be pursued.
34
Actions 1. The recently completed engineering study to determine the storage capacity of the Twin
Oaks ASR at 200,000 AF, which addresses one of the outlined issues. A proposed action is to integrate the new capacity estimates into the next water management plan as San Antonio seeks additional water resources.
2. Conduct a study (focused on the transport side) to clarify the Twin Oaks ASR capability to inject and recover water. New estimates should account for WRIP improvements.
References 1. Charles Ahrens, SAWS VP for Water Resources and Conservation, in report given to the
Edwards Aquifer Habitat Conservation Program Implementing Group January 15, 2015. 2. Patrick Shriver, electronic communication on February 24, 2015 after a phone conversation
on February 21, 2015. Calculation for the Edwards Aquifer Habitat Conservation Program. 3. “Twin Oaks-Aquifer Storage and Recovery.” SAWS website. Available at
http://www.saws.org/Your_Water/WaterResources/projects/asr.cfm 4. Phillip Cook, SAWS Engineer, “Twin Oaks ASR Operations” PowerPoint presentation to the
Edwards Aquifer Habitat Conservation Project Science Committee on April 13, 2009, Slides 10 and 11.
5. Scott Huddleston, “Hope for end to drought buoyed,” San Antonio Express-News, February 2, 2015.
6. Information offered by Calvin Finch based on his role as SAWS Water Conservation District and SAWS representative in the negotiations to develop the Edwards Aquifer Habitat Conservation Plan.
7. SAWS website, Aquifer Storage and Recovery, 2009 Water Management Plan Adjustments at http://www.saws.org/your_water/waterresources/2011_update/ discusses the changing
estimate of capacity. Calvin Finch projects impact of changing that estimate several times through the years.
Risk Score Card Rating Amount of Water: Up to 50,000 AFY (delivery begins 2020) Cost of Water: $2,300/acre foot for first 30 years, decreases after
end of term
Cost Stability: High costs but stable¹ (0) Ownership State of Water: Contracted water (+) Length of Contract: Length of agreement 30 years and then SAWS
assumes ownership of assets/infrastructure²* (+)
Distance of Source from San Antonio:
142 miles, Carrizo Aquifer in Burleson County and Simsboro Aquifer
(++)
Endangered or Threatened Species Issue:
The pipeline route will pass through some karst caves area, but endangered species will not be a major issue.
(-)
Treatment Required: Yes, treated by contractor (+)
Contamination Threat: Slow to recharge Carrizo Aquifer (-)
Drought Restrictions: (Drought Sensitivity)
No (-)
Regulatory Agencies Involved:
Local groundwater districts without San Antonio representation
(+)
Other Issues: Weak bond status of Abengoa Vista Ridge LCC (main contractor) adds risk³**
(+)
Using rural water source may encourage belief that San Antonio is not a good regional partner.
0
Rating: -3 (-)
7 (+)
Total: +4 High Risk
*The length of the contract beyond 30 years could not be verified prior to the completion of the report though SAWS has reported the contract with Abengoa Vista Ridge/Blue Water Systems has the option to continue for total contract length of 60 years. This extended time period provides greater value to the project. **Parent company of the contract has a price cap on the water SAWS will purchase, and bonds to be sold will be reliant upon the contract and not the credit quality of Abengoa. SAWS credit quality is likely to be more important to potential investors.
Description The Vista Ridge Water Project is an atypical SAWS water project. The project was identified through a request-for-proposal process that sought a turnkey water resource solution. SAWS pays only for the water delivered to its border as outlined in the negotiated specifications.3 Water leasing, permitting, treatment, and pipeline construction is the responsibility of the contractor, Abengoa Vista Ridge3, with project completion/water delivery projected to begin in 2020. Groundwater leases in Burleson County (i.e., approximately 3,400 leases with landowners) are included as part of the project and managed by Blue Water Systems. The project will require SAWS to increase water rates up to 16% to provide project funding.4 At the end of the 30-year term of the initial Water Transmission and Purchase Agreement SAWS will own the infrastructure (i.e., pipeline, treatment plant, etc.) and will have an agreement in place with Blue Water Systems to continue to provide groundwater for an additional 30 years (see Table note above**). The project initiation date of 2020 also appears to coincide with a period of surplus water. Some raised concerns with the project include reliability of water supply (i.e., groundwater leases) beyond 2050 and reduction of SAWS water-conservation efforts. Supporters of the Vista Ridge Project state these concerns will be
36
addressed, and water availability will encourage economic and population expansion in the city. Opportunity to sell excess water, for example, along the pipeline route to local communities is one regional benefit of the project.5 Furthermore, SAWS leadership have committed to the continued support of water-conservation efforts as an important component of the SAWS water portfolio.6 Critics of the project question if SAWS ratepayers will understand a 16%+ rate increase to include having unsold water resulting from conservation efforts by SAWS ratepayers, especially when conservation efforts also requires funding.3 Other criticism includes the potential for strained regional relationships due to the “insensitivity” of SAWS and COSA (i.e., “water grab”). Finally, the Vista Ridge project could have adverse impacts on the future water supply for the Burleson County/Lee County area7, requiring the local Groundwater District to have a plan in place to mitigate the potential adverse impacts.
Considerations There is always risk in water-project development and implementation. The Vista Ridge project is considered different because, in this case, the SAWS does not assume all of the risk.8 Other considerations in evaluating the Vista Ridge project include:
Selling Water along the Vista Ridge Pipeline — The proposed route of the Vista Ridge pipeline bisects one of the most desirable areas to sell excess water supply (i.e., I-35 corridor). It roughly follows Interstate 35 between Georgetown and San Antonio to include Round Rock, Austin, Kyle, San Marcos, and New Braunfels — one of the highest-growth areas in Texas. The Region L and Region K Regional Water Plans identify growing water demand.9 Potential buyers of surplus water along the I-35 corridor are likely and a reasonable strategy if selling excess water is a project goal.10
Funding Both Water Conservation and Vista Ridge Project —The Vista Ridge project calls for simultaneous aggressive water conservation and Vista Ridge project funding, which may be a challenge to justify to ratepayers. Water-conservation targets (i.e., GPCD water use) in the 2012 SAWS Water Management Plan were lower (e.g., 135 GPCD, dry year) than previous years (e.g., 2009, 126 GPCD, dry year).11-12 This reduction in conservation targets may be warranted assuming sustained water-conservation efforts. From a funding perspective, financing for the Vista Ridge project will include $100M of Abengoa funds with the remaining $700M derived from bonds sold. Bond investors will be interested in SAWS’ outstanding credit rating and payments from actual water made available via O&M funds, in addition to long-term water availability.8
Abengoa Financial Standing — Advocates for the RFP process that resulted in selecting the proposal identified the contractor assuming the majority of risk as an important selling point. If any of the important parts of this project fails, the responsibility and cost falls to the contractor. The most desirable partner in this case would be a financially strong contractor capable of correcting failed parts, and refinancing, as necessary, with full confidence of creditors. Reports note that Abengoa is highly leveraged and carries a weak bond rating.1 SAWS is monitoring the financial status Abengoa; however, an alternative strategy if Abengoa failed to meet their financial obligations is needed.8 Provisions of the Vista Ridge agreement offer SAWS the option to take over the project. Depending on the amount of water available, takeover provisions may require equity costs that can include debt assumption.8 These issues collectively merit further evaluation for determining the merit of the project.
San Antonio Role in the Region — In Texas, local regulatory entities and market forces largely determine if water can be moved from areas of plenty, to areas of need. Local groundwater conservation districts regulate groundwater use and offer permits for that
37
application, and, landowners own the water under their land and may sell it. This is what happened in the case of Vista Ridge.8 The actual owners of the water have leased access to it for a period, and permits have been obtained for transport of that water. The reliability of supply from willing landowners beyond the project timeline is an important consideration for COSA and SAWS.
Grade Assessment The Vista Ridge project is a potential major contributor for long-term water supply. In our analysis, a “high risk” label was assigned due to several factors outlined in the risk “score card.” Despite this “high” risk value, the project is innovative, turnkey water-supply project that serves to diversify the SAWS water portfolio. Abengoa and Blue Water carry the primary financial risk for the project. In the short term, the project will require an initial cash investment of approximately $50-80M by Abengoa, an important factor to ensure that project success. In the long-term, since SAWS is paying for the actual water actually by the contractor, investors likely would be more interested in SAWS’ credit rating and water supply need than Abengoa’s financial standing.
Recommendation – COSA and SAWS should continue to address public concerns, especially project plans beyond the 30-year term, and the relationship of other SAWS activities, particularly the water-conservation program.
Actions 1. Develop a communication plan to inform the public on efforts to sell water (if that
opportunity occurs), as well as the details on the plan for water storage and distribution. Communication should include describing how conservation efforts will be sustained when Vista Ridge water becomes available.
References 1. Neena Satija. “Private Sector an Oasis for Thirsty San Antonio,” Texas Tribune, November
12, 2014. 2. Greg Jefferson, “More light on the 3.4 billion SAWS pipeline deal,” San Antonio Express-
News, December 23, 2014. The article discusses the Abengoa stressed financial status. 3. Michelle Gangnes, “Con-rural Texas could be next endangered species,” San Antonio
Express-News, October 26, 2014. 4. Joe Krier, “Pro-San Antonio needs the water to grow business,” San Antonio Express
News, October 26, 2014. 5. Vista Ridge Pipeline-Frequently Asked Questions available on the SAWS website-
www.saws.org. 6. Opinion offered by Calvin Finch based on his interpretation of the discussion on the topic
of, “Will the conservation effort continue now that Vista Ridge is in place?” 7. Opinion offered by Calvin Finch based on his work in water planning and familiarity with the
Region Land/Region K water plans. 8. Doug Evanson, SAWS Chief Financial Officer, Phone Interview, April 6, 2015. 9. Scott Huddleston, “SAWS vows to ‘respect’ water from Central Texas town,” San Antonio
Express-News, December 30, 2014. 10. SAWS 2012 Water Management Plan, Page 21, copy printed from SAWS website,
www.saws.org. 11. SAWS 2009 Water Management Plan. 12. SAWS 2012 Water Management Plan.
The SRP concluded the draft was limited in offering a balanced and broad view of the Vista Ridge project. Limitations arose from subjectivity, limited methodology, to include data and metric use, omission of relevant factors, inclusion of marginally important factors, and uneven metric application across factors. The SRP provides a supplemental rating metric, a project assessment, and a list of relevant questions for sponsor consideration. See Appendix A, Vista Ridge Project, Risk Analysis Metrics, and Methodology for further details.
Cost of Water: $590/acre foot² Cost Stability: Stable (0) Ownership State of Water:
Owned Water (-)
Length of Contract: N/A (0) Distance of Source from San Antonio:
29 miles³* (0)
Endangered or Threatened Species Issue:
None (-)
Treatment Required: Carrizo water must be treated to make it compatible to the Edwards water. Twin Oaks has a treatment capacity of 30 MGD or ≈ 33,632 AFY.4
(+)
Contamination Threat: Very Low (-) Drought Restrictions: (Drought Sensitivity)
N/A (0)
Regulatory Agencies Involved:
Evergreen Underground Water Conservation District does not have jurisdiction over the area but an agreement exists for 6,400 AFY but none for planned expansion.
(-)
Other Issues: A single one way at a time pipeline with a 60 MGD capacity exists in 2014.
(0)
A western pipeline to double the capacity to 120
MGD is scheduled for completion in 2016.5
Rating: -4 (-)
1 (+)
Total: -3 Low Risk
*The current pipeline used to integrate water coming from Twin Oaks is actually ≈40 miles long, and the new WRIP pipeline will be an additional 45 miles long.
Description The 2012 Water Management Plan indicates 6,400 AFY of water are available from the Carrizo Aquifer under land owned by SAWS at the Twin Oaks site. The plan also mentions another 1,000 AFY are available because of the integration with Bexar Met. The 6,400 AFY is outlined in an agreement between SAWS and the Evergreen Underground Water Conservation District (EUWCD) negotiated in 2002. The agreement was to prevent an election in Bexar County to expand EUWCD’s jurisdiction and to enlist its acceptance of the Twin Oaks ASR.6 The pumping of the 6,400 AFY is a factor in countering the natural subsurface drift of the stored Edwards water in the Twin Oaks ASR within the Carrizo Aquifer. The capacity to pump 1,000
40
AFY of Carrizo water through the Bexar Met integration is not outlined in the EUWCD agreement. Beyond the 7,400 AFY, the SAWS 2012 Water Management Plan describes an expansion for pumping Carrizo water in Bexar County in 7,000 AF increments until 21,000 AFY are available (target 2026). The plan indicates the expansion does not exceed the Desired Future Conditions (DFCs) identified by Groundwater Management Area (GMA) 13 for the Carrizo Aquifer. The 2012 Water Management Plan does not outline how efforts to seek agreement with EUWCD on the planned expansion would be accomplished.1 The expansion of water-supply activities with Twin Oaks ASR, brackish groundwater desalination, and the local Carrizo expansion make the western distribution pipeline important.7
Considerations Expansion of the local Carrizo production to 21,000 AFY will likely cause concerns from the EUWCD and Carrizo well pumpers in Bexar County and beyond. The 2012 Water Management Plan mentions the well-mitigation program will have to be revisited, suggesting that well levels of neighbors to the new SAWS pumping area may be affected.1 There appears to be some concern EUWCD and other area pumpers will reconsider the decision not to expand the EUWCD jurisdiction to cover southern Bexar County. Without the expansion, there may be delays in completing the western pipeline, influencing plans for ASR and brackish groundwater desalination activities.
Grade Assessment The project is rated as a low-risk water supply because SAWS owns considerable land in the area and the water source is close to San Antonio. At present, there is no local groundwater district but SAWS has an agreement with EUWCD to pump 2 AFY for each acre of land owned in the original Twin Oaks property. SAWS is planning to pump that water and an additional 21,000 AFY.
Recommendation – SAWS should continue to build relationships with EUWCD and support from local landowners, which can serve to help meet future demand. The effort should consider ensuring regulatory ability to pump additional water and ability of the Carrizo to handle increased pumping.
Actions 1. Prepare justification for use of additional Carrizo Aquifer water from Bexar County in terms
of District 13 DFC and the Modeled Available Groundwater (MAG). SAWS should then present the suggested recommendations to EUWCD, and, based on feedback, determine the next steps.
2. Consider linking Bexar County Carrizo water use, brackish groundwater desalination, and ASR actions to a single proposal to discuss with EUWCD.
References 1. San Antonio Water System 2012 Water Management Plan, “Expanded Carrizo Production,”
Page 31. Available on the SAWS website at www.saws.org. 2. Ibid. “Cost per Acre-Foot,” page 42. 3. Gregg Eckhardt, “Twin Oaks Aquifer Storage and Recovery”, “San Antonio Project
Development.” The Edwards Aquifer Website. Available at http://www.edwardsaquifer.net/ 4. Greg Eckhardt “Twin Oaks Storage and Recovery,” The Edwards Aquifer Website.
http://www.edwardsaquifer.net/ Calculation of AF completed by Calvin Finch. 5. SAWS website, “Pipeline Will Deliver Water Management Flexibility,” Available at
http://www.saws.org/latest_news/NewsDrill.cfm?news_id=2044 6. San Antonio Water System 2012 Water Management Plan, “The Water Resources
Cost of Water: After Phase 3 $1,138/acre foot Cost Stability: Power costs may fluctuate ² (0) Ownership State of Water:
Phase 1-2016
Phase 2-2021* Phase 3-2026*
Yes, Owned ³ (-)
Length of Contract: N/A
Distance of Source from San Antonio:
22 miles (0)
Endangered or Threatened Species Issue:
None (-)
Treatment Required: Reverse osmosis and high power requirements (+)
Contamination Threat: Not vulnerable (-)
Drought Restrictions: (Drought Sensitivity)
None (-)
Regulatory Agencies Involved:
TCEQ, Wilson County and EUWCD, San Antonio has no representation on the EUWCD. TCEQ is a state agency.
(+)
Other Issues: Need to dispose concentrate in environmentally appropriate manner. Disposal wells are planned in Wilson County for this purpose.4
(+)
Rating: -4 (-)
3 (+)
Total: -1 Low Risk
Description The Brackish Groundwater Desalination Program uses water between 1,300 and 1,500 mg/L TDS to produce potable water through use of a reverse osmosis treatment process. The technology uses large amounts of electricity to force the brackish water through filters that remove all but 150 mg/L TDS from new water. The process produces a concentrate equal to about 10% of the total water treated with a concentration of approximate 10,000 TDS water.5 The concentrate is then injected into the saline Edwards zone in Wilson County. Water in that zone of the aquifer is approximately 90,000 TDS.6
Among the advantages of using brackish groundwater is that large quantities are available in the area. Because of the depth of the wells and the technology required to use brackish water, brackish groundwater is not in high demand. SAWS is one of the few entities in the area with the financial capability to use this water source. Capital costs estimated to be $411M will be required to develop the infrastructure for the project.7 Early in the process, the expensive brackish groundwater project had supportive regulations from EUWCD. Concerns for water needs adjacent to big cities led to tighter restrictions from EUWCD for water use from rural areas.8
42
One of the management issues with brackish groundwater desalination is operations work best when production is relatively steady. The desalination plant at Twin Oaks must produce 1,018 AF/month (12,210 AFY) for maximum efficiency in Phase 1, and be able to distribute that amount to SAWS customers every month.9 There are several limiting factors to this requirement:
Winter demand is an issue. With various water supplies available, it will not always be easy to find users for all the water produced.
The 2012 SAWS Water Management Plan calls for a second pipeline from Twin Oaks, which is under construction and scheduled to be completed in 2016. The pipeline will give SAWS more flexibility in water distribution. In an extreme case, treated brackish groundwater could be pumped north for use while Edwards water could be pumped south for ASR storage.10
Considerations The brackish groundwater desalination project is important to COSA for many reasons: 1. It will eventually provide up to 33,600 AFY of new water for the city’s use. 2. Project uses a water supply that is large and likely not to be used by other water users. 3. Project is example of SAWS leading in the utilization of technology and diversification of
water supplies. With high amounts of brackish water supplies in the area, experience gained from this project would facilitate further expansion.
The completion of the western pipeline will help make the brackish water supply a more viable water project for San Antonio’s future needs. A second action that would contribute further to the importance of the treated brackish supply would be if this water could be stored in the Twin Oaks ASR along with Edwards Aquifer water. Treated brackish water could be stored when demand from SAWS ratepayers is low and available for use when demand is high.
Use of brackish groundwater is also identified in the state’s water plan as an important source of water for meeting the state’s future water needs. In 2015, several bills including HB 30 and HB 655 were adopted, addressing the use of ASR as a water storage facility for brackish water and identifying zones where brackish water appears to be a potential water source. Continued efforts to pass legislation related to brackish groundwater permitting and ASR would significantly contribute to the expansion of this important water source. TWDB has provided funds in developing the project.
Grade Assessment Brackish groundwater is assigned as a low-risk water resource. San Antonio will produce and treat 13,440 AFY of brackish water by 2016 and 30,525 AFY by 2026. The SAWS’ goal of 33,600 AFY would make this desalination project the largest inland desalination project in the United States.
Recommendation – Introducing brackish groundwater into the SAWS supply portfolio will reduce reliance on Edwards Aquifer groundwater, and potentially store more Edwards Aquifer groundwater.
Actions 1. Begin discussions at SAWS to prepare and pass legislation to allow treated brackish
groundwater to be stored in the ASR facility. 2. Discuss with EUWCD the concept of storing treated brackish water. 3. San Antonio should pursue legislation with other communities to designate brackish
groundwater as local resource, apart from freshwater, for the purpose of development and regulation.
43
References 1. San Antonio Water System 2012 Water Management Plan, Page 6. 2. Ibid. Page 42. 3. Ibid. Page 31. 4. MySanAntonio.com, “SAWS embarks on plant to get salt out of water,” December 16,
2014. Available at www.mysanantonio.com. 5. Desalination Plant, San Antonio, United States of America, February 23, 2015. Water and
Technology website. Available at www.water-technology.net. 6. From Calvin Finch based on information collected when he was SAWS Water Resources
Director. 7. SAWS website, “Brackish Groundwater Desalination.” Available at www.saws.org. 8. From Calvin Finch based on experiences as SAWS Water Resources Director pursuing the
development of the brackish groundwater desalination project. 9. Ibid. Information gathered and calculations made by Calvin Finch. 10. SAWS website, “Desalination Project Status.” Available at www.saws.org.
Cost of Water: $474/acre foot ($69/acre foot for the raw water, raw-water rate related to GBRA water rate and will increase)²
Cost Stability: Relatively Stable (0)
Ownership State of Water:
Contracted Water (+)
Length of Contract: A contract exists with Bexar/Medina Atascosa Water Control and Improvement District #1. Contract is in place until December 31, 2049 ³
(+)
Distance of Source from San Antonio:
On western edge of metropolitan area (-)
Endangered or Threatened Species Issue:
None (-)
Treatment Required: Treated downriver at surface water plant. (+) Contamination Threat: Medina Lake at a low level would be especially
vulnerable (+)
Drought Restrictions: (Drought Sensitivity)
Yes. No water is available from the Medina Lake project in the current state of rainfall and lake levels.4
(++)
Regulatory Agencies Involved:
TCEQ, state agency (0)
Other Issues: Treatment plant has a capacity of 13,000 AFY (+) Rating: -2 (-)
7 (+)
Total: +5 High Risk
Description Medina Lake Dam was built in 1913 by the forerunner to the Bexar-Medina-Atascosa Counties Water Improvement District #1 (BMA). At the time, Medina Dam was the largest in Texas and fourth largest in the United States with surface area of 6,066 acres and capacity of 254,823 AFY.1 After a long history of providing irrigation and recreation water, in 1991 the BMA and Bexar Met negotiated a water-supply project providing 19,974 AFY of lake water and 9,214 AFY of run-of-the-river water.5 Bexar Met built a water-treatment plant 9,214 AFY capacity.6 Unfortunately, during the drought/dry years of 2011-2014, Medina Lake capacity decreased significantly.7 The lake is important to aquifer recharge7, however, generous rainfall is need to refill the lake and recharge the aquifer.8
Considerations Medina Lake has a long history as an important water source in the area west of San Antonio. Unfortunately, there are a number of issues to address to improve its reliability. The most obvious is refilling the lake and recharging the aquifer. In 2002, when water levels were high, officials noted the need for major repairs to the dam. Although many repairs have been completed, questions remain about the dam’s state.9 The condition of the irrigation distribution
45
system also has been discussed, with follow-up actions including the replacement of irrigation ditches with pipes.10 The dam and irrigation channels are not SAWS’ responsibility, but they are important issues to consider if the Medina Lake water project is going to become a reliable, low-cost water source.
Grade Assessment Medina Lake is a high-risk water supply. The most obvious reason is the lake is sensitive to drought conditions. Continued evaluation to determine the reliability of this water supply is needed.
Recommendation – SAWS officials have a contract to fulfill, but beyond that, an assessment of value of this water source in relation to other available sources is needed.
Actions 1. Determine Medina Lake’s value in the San Antonio water-supply package. Determine the
water project’s future, and whether it be sold or abandoned or be part of a plan to expand and/or extend its status.
References 1. Texas Water Development Board, “Medina Lake.” Available at www.twdb.texas.gov. 2. San Antonio Water System 2012 Water Management Plan, page 42. 3. Amended and Restated Water Supply Agreement, Bexar-Medina-Atascosa Counties Water
Control and Improvement District 1 (BMA) to Bexar Metropolitan Water District, January 1, 2008.
4. Zeke MacCormack, “With Medina Lake empty, irrigation system gets make over,” San Antonio Express-News, April 6, 2014. Page 4. The SAWS website, “Medina Lake,” also states the likelihood of zero firm yield in drought. The website is www.saws.org.
5. Water Supply Agreement, January 1, 2008 6. Zeke McCormack, “Residents on edge as Medina Lake evaporates,” San Antonio Express-
News, January 6, 2013. Available at www.mysanantonio.com. 7. Nolan Hicks, “In Medina County, the drought begins to claim water wells,” San Antonio
Express-News, August 29, 2013. 8. Richard Oliver, “Running Dry: A four-part Series,” San Antonio Express-News. December
12, 2014. Available at www.expressnews.com. 9. Carolyn B. Edwards, “Gates closed at Medina Dam,” Bandera County Courier, December
18, 2014. 10. Zeke MacCormack, San Antonio Express-News, April 7, 2014
5,550 AFY could be added from other utilities along the pipeline leased ¹
Cost of Water: $1,224/acre foot ²
Cost Stability: Relatively expensive but stable (0)
Ownership State of Water:
Leased Water (+)
Length of Contract: Water will be available beginning in 2014. Contract until 2040 and is renewed every 5 years.³
(+)
Distance of Source from San Antonio:
50-mile pipeline (+)
Endangered or Threatened Species Issue:
None (-)
Treatment Required: Yes (+)
Contamination Threat: Hard to recharge, low threat (-) Drought Restrictions: (Drought Sensitivity)
None (-)
Regulatory Agencies Involved:
Gonzales County Underground Water Conservation District (GCUWCD), San Antonio has no representation
(+)
Other Issues: The project "rents" pipeline space from the SSLGC and
buys surplus water from the entity in addition to using its
own water pumped from Gonzales County wells.
(0)
Rating: -3 (-) 5 (+) Total: 2 High Risk
Description Project is characterized as a cooperative effort to diversify San Antonio water resources.4 By renting pipeline space from the existing Schertz-Seguin Local Government Corporation (SSLGC) pipeline rather than building its own, SAWS reportedly saved 30% of total costs ($88M).5 The agreement also allows SAWS to purchase up to 5,550 AFY of additional water beyond the projected 11,688 AFY provided by its Gonzales County Carrizo wells.6
Considerations The regional Carrizo Project serves as excellent example of efficiencies through the sharing of pipeline and treatment capabilities by several water purveyors. This water project is likely to be impacted by Groundwater Management Area 13 DFC limits in the near future. The Region L Carrizo Aquifer workgroup identified production exceeding the MAG in Gonzales County Underground Water Conservation District (GCUWCD) in the 2030 decade. This reduced SAWS allocation for planning purposes to 11,418 AFY (minus 270 AFY, 2030-2039) before returning to the full permitted volume between 2040-2070.7
Grade Assessment The project is high-risk because of the pipeline distance and local regulatory agency involvement, but it is an example of success in saving San Antonio money through cooperation with other water purveyors. The Carrizo Aquifer supply source is less reactive to short-term
47
droughts than the Edwards Aquifer, but its long-term future as a water source is unclear due to other water demands.
Recommendation – We recommend SAWS work closely with SSLGC and GCUWCD to maximize water use from the Carrizo Aquifer in Gonzales County.
Actions 1. Continue to collaborate with SSLGC and GCUWCD. Project risk will decrease if linked to
SSLGC supply.
References 1. SAWS website, “SAWS and Schertz-Seguin Finalize Largest Non-Edwards Regional Water
Project.” February 1, 2011. Available at www.saws.org. 2. San Antonio Water System 2012 Water Management Plan, page 42. Available at
www.saws.org. 3. Scott Huddleston, “Regional Carrizo, helping with drought,” San Antonio Express-News,
June 8, 2014. 4. SAWS website, “SAWS and Schertz/Seguin Finalize Largest non-Edwards…” Available at
www.saws.org. 5. SAWS website, “Carrizo Aquifer.” Available at www.saws.org. 6. Scott Huddleston, San Antonio Express-News, June 8, 2014. 7. Conclusion offered by Calvin Finch, based on discussions he participated in with Gonzales
Underground Water Conservation District in 2007-2010 as SAWS Water Resources Director.
Cost of Water: ≈$400/acre foot* at 10 years, $4,000/acre foot in first year of implementation.2*
Cost Stability: Costs are low and relatively steady (0)
Ownership State of Water:
Owned water (-)
Length of Contract: N/A (0)
Distance of Source from San Antonio:
In the city (-)
Endangered or Threatened Species Issue:
None (-)
Treatment Required: Technological and behavior changes are required. It requires a major and ongoing education program.
(+)
Contamination Threat: None (-)
Drought Restrictions: (Drought Sensitivity)
None (-)
Regulatory Agencies Involved:
None (-)
Other Issues: Requires that many ratepayers participate and continue to use best management practices
(+)
Rating: -6 (-)
2 (+)
Total: -4 Low Risk
*Some programs cost only $450 for first year implementation. Others have a long-term per capita investment higher than
$400/acre foot long-term. SAWS analyzes each conservation opportunity for its strategic importance and value to customers. The
SAWS Board of Trustees have authorized spending up to $1,100 per acre foot (over ten years) for conservation efforts that impact
peak demands.
Description Water conservation is an important part of the COSA water system. It was one of the water supply-creating activities that increased supply when drought, the courts, the legislature, and the city’s neighbors made it apparent San Antonio had to reduce its dependence on the Edwards Aquifer. San Antonio has evolved into a city that has implemented the most effective water-conservation program of any large city in the United States. COSA used the same amount of potable water in 2007 that it did in 1987 despite its population growing by 400,000.3 Several major infrastructure efforts have made significant contributions to that statistic (e.g., polybutylene pipe replacement in 1980, large recycled water program), but the downward trend in residential and commercial water use is well documented and a key factor (see GPCD management). Other activities include distribution of approximately 250,000 high-efficiency toilets and plumbing fixtures, and rebates for drought-tolerant landscaping3, to name a few.
The water-conservation programming is not static. Recently, the emphasis has changed from residential programming to landscape programming for homeowners because SAWS, with the input of its Community Conservation Committee (CCC), determined where high water-saving opportunities existed. SAWS treats water conservation as a water-resource project. The goal is to reduce GPCD from 143 (dry year) in 2011 to 135 (dry year) by 2020.4 If the goal is achieved,
49
1,644 AFY of new water would be available, for a total of 16,500 AFY by 2020.4 The 2012 Water Management Plan reflects that water-conservation efforts after 2020 will be required to maintain levels, but it does not expect GPCD to fall below 135 in a dry year.4 Some consider SAWS’ water-conservation performance one of the best in the United States and could argue that 135 GPCD is better than other cities and improving beyond that is not viable. Earlier water plans had a goal of 116 GPCD though SAWS planners report 116 GPCD was a normal-year number, not a dry-year number.4 There is also mention of inaccurate pumping data used in the years prior to 2012.4 A need to better understand an appropriate GPCD is further discussed (see GPCD section).
SAWS has analyzed the cost savings from wastewater treatment and postponement of new supplies due to water conservation. In 2002, BBC Researchers and Consultants analyzed water-conservation investments. It concluded that a $4-7 return was realized for every $1 invested in the effort.5 Treating water conservation as a supply project is an unusual approach for a water purveyor, as water conservation has traditionally been considered demand reduction (see GPCD discussion). Being treated as a water-supply project, however, allows water-conservation investments to be more easily defined by the cost of the water they produce (i.e., save).
Considerations Target goals for water conservation (i.e., GPCD) merits further evaluation (see GPCD section for further information). Water conservation has a cost of approximately $400/acre foot, the same as leased Edwards Aquifer water and very much less than the new SAWS water projects such as Carrizo (Schertz/Seguin), brackish groundwater, and Vista Ridge water.2 For example, if SAWS set a 126 GPCD goal, that would equate to an additional 14,996 AFY of water (1,644 AF for every 1 GPCD improvement) at a cost of approximately $400/AF.6 A review of water-conservation budgets for the last 10 years shows that SAWS water-conservation expenditures varied between $5-6M annually.7
Grade Assessment Water conservation is a low-risk water-supply project. The supply is created within the boundaries of the city, price is stable, water is locally-owned, no regulatory agencies are involved, and city has long history of water-conservation success. Water conservation is a mainstay of SAWS’ water-management efforts and the next version of the Water Management Plan should sustain these efforts.
Recommendation – Sustain activities of the SAWS water-conservation program. Set ambitious conservation goals for the program to include <135 GPCD. Actions 1. Consider water use reduction of 2 GPCD/year in the next SAWS Water Management Plan.
Propose strategies to achieve further reductions. Emphasize water conservation as a water-creation activity. Target outside watering, peak-water-use reduction, and irrigation.
2. Promote SAWS water-conservation success and leadership towards the goal of using that success to promote water-friendly policies and strategies via the legislature, state agencies, and the business sector.
References 1. San Antonio Water System 2012 Water Management Plan, Page 5. Available on the SAWS
2. Figures offered by Calvin Finch based on the water-conservation reports for the years he was Water Conservation Director at SAWS and PowerPoint presentations given by Karen Guz and Brandon Leister in 2008 and 2006.
3. Programming listed by Calvin Finch based on his experience as SAWS Water Conservation Director 2000-2005. Also reinforced by PowerPoint presentation by Karen Guz, “Conservation Planning,” September 5, 2014, and Brandon Leister, “Meeting Conservation Goals,” November 27, 2006.
4. San Antonio Water System 2012 Water Management Pan, page 5, Available at www.saws.org.
5. Calculation by Calvin Finch based on knowledge he has of high-efficiency toilet distribution as a conservation activity.
6. Calculated by Calvin Finch based on information from SAWS 2012 Water Management Plan and other sources noted.
7. Charles Ahrens, SAWS VP for Water Resources and Water Conservation, provided the data in an email to COSA Planning Director John Dugan, who passed the information to Calvin Finch by email.
Description The Western Canyon water-supply source is Canyon Lake. A contract between SAWS and GBRA to allow SAWS to buy surface water from Canyon Lake has been in place since 1998. Delivery of water, however, did not begin until 2006.3 The agreement includes approximately 7,100 AFY and was significant as the first surface water resource for SAWS and a significant step to the diversification of SAWS’ water supply.3 The Western Canyon Water Project is also significant because it involves cooperation with GBRA and a number of other area entities (e.g., Boerne, FOR, Bulverde, Johnson Ranch, Cordillera Ranch, Tapatio Springs/Kendall Co. Utility Co, Lerin MUD and Lomas subdivision). SAWS has agreed to purchase other entities’ annual water supplies that exceed what they need each year.3 The project agreement ends in 2037, but the 2012 SAWS Water Management Plan notes there are options to extend the agreement.4
Considerations The Western Canyon is a relatively small surface-supply project that represents close cooperation with a number of regional neighbors. It also is a water project that has been controversial over the years as SAWS tried to diversify its water supply.5
Risk Score Card Rating
Amount of Water: 4,000 AFY base amount guaranteed
9,000 AFY available, 7,100 AFY average¹ Cost of Water: $1,030/acre foot and is adjusted
Cost Stability: Cost is adjusted.² (+)
Ownership State of Water:
Leased from GBRA. The 4,000 AFY is the basic commitment, and SAWS must purchase additional water that is available from FOR and other contractors. Extension options exist.³
(+)
Length of Contract: Contract with GBRA to receive water until 2037. (+) Distance of Source from San Antonio:
The pipeline is short. Treated water is delivered by GBRA to either the Winwood water tank (Hwy 10 and Fair Oaks Parkway) or the Oliver Ranch tank (Hwy 281 and Bulverde Rd).
(-)
Endangered or Threatened Species Issue:
None (-)
Treatment Required: Treated by GBRA (+)
Contamination Threat: A lake is vulnerable. (+) Drought Restrictions: (Drought Sensitivity)
Yes, but limited. (0)
Regulatory Agencies Involved:
Surface water, TCEQ is a state agency (0)
Other Issues: None Rating: -2 (-)
5 (+) Total: 3 High Risk
52
Grade Assessment The Western Canyon water has been a relatively stable source of water for SAWS and the communities in northern Bexar, Comal, and Kendall counties. The project is a high-risk water-supply project because the lake is more susceptible to contamination than groundwater, the water price changes based on GBRA’s independent calculations, water requires treatment, and relatively short-term contracts are involved. SAWS also has a responsibility to purchase the water supplies not needed by smaller cities until the cities need them in the future.
Recommendation – SAWS should review the value of the Western Canyon water-supply project for its long-term needs. Being a close, reliable, surface water source as part of a cooperative arrangement with GBRA, FOR and other neighbors is desirable.
Actions 1. Determine a water-supply value index to rate water supplies not just in terms of risk but
also in terms of diversification issues (i.e., surface vs. groundwater), importance to San Antonio neighbors (dividends in legislature and other negotiations), and administrative demands.
2. Evaluate how the Western Canyon project contributes to San Antonio’s water security within the framework described above.
References 1. San Antonio Water System 2012 Water Management Plan, page 26. Source is a hard copy
printed from SAWS website. Available at www.saws.org. 2. Ibid. page 42. 3. SAWS website, “Canyon Lake.” Available at www.saws.org. 4. SAWS 2012 Water Management Plan, page 26. 5. Robert Gulley, “Heads Above Water,” Texas A&M University Press, College Station, 2015,
The Inside Story of the Edwards Aquifer Recovery Implementation Program. The opinion in the paragraph comes from Calvin Finch after considering the history of San Antonio water-supply issues described in “Heads Above Water.”
Oliver Ranch-15 years after 2010 with 10-year option, 3,000 AFY
Bulverde Snecker Ranch project 15 years, 1.5 month after 2006 with possible 6-year extension, 5,000 AFY
Water Exploration Company (WECo) -17,000 AFY, if available, 15-year lease with 2-5 year extensions
Massah Corporation -15 year contract as of 2010 with 10-year extension possible ²
Length of Contract: Shorter than 45 years (+) Distance of Source from San Antonio:
Very close to high-growth areas in Northeast San Antonio
(-)
Endangered or Threatened Species Issue:
None (-)
Treatment Required: None (-)
Contamination Threat:
Considerable development and wells but slow recharge³
(0)
Drought Restrictions: (Drought Sensitivity)
Yes, see amount of water above. (++)
Regulatory Agencies Involved:
Trinity Glen Rose Groundwater District, Bexar County representatives
(0)
Other Issues: None Rating: -3 (-) 4 (+) Total: 1 Medium Risk
Description The 2012 SAWS Water Management Plan notes the value of Trinity Aquifer water because of proximity to the high-growth areas of northeast San Antonio. The plan describes differing volumes of available water ranging from 8,800 AFY in normal rainfall years to only a 2,000 AFY firm yield.1 Other sources describe the various Trinity leases providing upwards of 20,500 AFY of water.1 The average cost assigned, $976/acre foot, is expensive. Parts of the Trinity supplies were through agreements between SAWS and Bexar Met.1 The Water Exploration Company (WECo) contract was controversial in terms of cost, water availability, and purchase requirements.4 SAWS is in the process of re-negotiating that contract.
Considerations Based on the various accounts of the Trinity Water resource, the water project/supply appears to be challenging. It is also relatively expensive and administratively demanding because of the
54
number of contracts involved and fluctuation in water availability. SAWS is also under considerable pressure from Trinity well owners (other than its suppliers) to reduce pumping during drought periods to relieve pressure on Trinity Aquifer levels. It appears that less than desirable contracts exist between SAWS and Trinity water suppliers, suggesting the value of Trinity water leases be re-examined and justified in terms of other supplies as the opportunity presents itself.
Grade Assessment The Trinity Aquifer is identified by state and regional sources as the most challenged water source in the area due to the unreliability of the Trinity Aquifer as a water source and the number and nature of the contracts involved. A number of San Antonio’s neighbors rely on Trinity Aquifer water. The city’s neighbors have benefited from SAWS’ control of a significant portion of the supplies and SAWS’ attitude toward the water source. With SAWS in charge, the Trinity Aquifer supplies available to San Antonio are managed to maintain the resource and allow other Trinity Aquifer pumpers’ access to the limited water available.
Recommendation – Despite its rating as a medium-risk project, the limited firm yield and contract situation suggest SAWS review the long-term desirability of the water supply in the next water-management plan.
Actions 1. Determine a water-supply value index to rate water supplies not just in terms of risk but
also in terms of diversification issues (i.e., surface vs. groundwater), importance to San Antonio neighbors (dividends in legislature and other negotiations), and administrative demands.
2. Evaluate how the Trinity Aquifer contributes to San Antonio’s water security within the framework described above.
References 1. San Antonio Water System 2012 Water Management Plan, page 25, hard copy printed
from the SAWS website. Available at www.saws.org. 2. Trinity Aquifer Project, SAWS website,
www.saws.org/Your_Water/WaterResources/projects/trinity_aquifer.cfm. 3. Gregg Eckhardt, “The Trinity Aquifer,” The Edwards Aquifer Website, page 1,
www.edwardsaquifer.net/trinity.html. 4. Colin McDonald, “SAWS ready to shut off pricey Bexar Met deal,” My SA website. July 9,
Lake Dunlap Wells/Wells Ranch Risk Score Card Rating
Amount of Water: Lake Dunlap 4,000 AFY, surface water Wells Ranch 2,800 AFY ¹
Cost of Water: $1,041/AF2
Cost Stability: Adjusted with GBRA water costs (+) Ownership State of Water:
Leased (+)
Length of Contract: Contracts are with the Canyon Regional Water Authority (CRWA), 500 AFY of the Lake Dunlap water is leased to City of Cibolo through 2018.3 GBRA is ultimate source of Lake Dunlap water.
(+)
Distance of Source from San Antonio:
Delivery points at Lake Dunlap near New Braunfels. Wells Ranch sources are Carrizo wells in Guadalupe and Gonzales counties, 30+miles
(+)
Endangered or Threatened Species Issue:
None (-)
Treatment Required: Treated by CRWA (+)
Contamination Threat: Surface water and groundwater (0)
Drought Restrictions: (Drought Sensitivity)
Limited potential for reductions (0)
Regulatory Agencies Involved:
CRWA, GBRA (-)
Other Issues: N/A Rating: -2 (-) 5 (+) Total: 3 High Risk
Description When SAWS inherited Bexar Met, SAWS received contracts with Canyon Regional Water Authority (CRWA) for 4,000 AFY of Lake Dunlap surface water and 2,800 AFY of Wells Ranch Carrizo Aquifer groundwater, for a total supply of 6,800 AFY. These contracts held a future commitment for CRWA to provide a total supply of 8,250 AFY to Bexar Met. Additionally, Bexar Met was participating in lease costs associated with an additional phase of the Wells Ranch project without any contractual obligation. As the water delivery requirements of Bexar Met are different from SAWS, in February 2015, SAWS amended the agreement to be relieved of any future obligation under the Agreement to fund development of or purchase water from CRWA in excess of a cumulative annual amount of 6,800 acre feet for delivery to SAWS.
The CRWA is a member-owned water wholesaler that operates treatment plants on Lake Dunlap (16.4 million gallons/day) and the Hays/Caldwell Plant east of San Marcos (6 million gallons/day). The plants treat raw water from Canyon Lake and Lake Dunlap. A third treatment plant on Leissner Road in Guadalupe County treats Carrizo Aquifer water (7.2 million gallons/day).4 Members of CRWA include the Cities of Cibolo, La Vernia and Marion; County Line Special Utility District (SUD); Crystal Clear Water Supply Corporation; Green Valley Special Utility District; Springs Hill Water Supply Corporation; East Central Special Utility District; Martindale Special Utility District; and Maxwell Water Supply Corporation. GBRA has
56
had disagreements with CRWA and has threatened to end the agreement with CRWA to supply water through Lake Dunlap.4
Considerations This water-supply project is one of several smaller projects that were originally part of the Bexar Met System. The fact that GBRA is a major factor in the reliability of the water complicates this water supply. Additionally, the CRWA member responsibilities and input are under scrutiny.5
Grade Assessment The project is rated as a high-risk water supply because of contract lengths, distance of sources from San Antonio and treatment required.
Recommendation – SAWS should assess water resource for the long-term reliability in comparison to the other water projects.
References 1. SAWS Website “Lake Dunlap/Wells Ranch,” Available at www.saws.org. 2. San Antonio Water System 2012 Water Management Plan, page 42. The plan is available
at the SAWS website, www.saws.org. 3. Ibid, “Canyon Regional Water Authority (CRWA),” page 27. 4. Canyon Regional Water Authority Website Available at
http://www.crwa.com/resources.html. 5. The issue of GBRA contract extension expectations came up several times in CRWA Board
Meetings in 2010 and 2011 attended by Calvin Finch. The major dispute resulted in a Texas Supreme Court Case in 2008, “Canyon Regional Water Authority v. Guadalupe-Blanco River Authority, No. 06-0873, Decided May 16, 2008. The Texas Supreme Court decided in CRWA’s favor but the relationship is still stressed.
City of San Antonio – Water Issues Results and discussion for water management issues for COSA are presented in this section (Table 8). Results are based on available data for city policies, regulations, and initiatives for the 2015-2060 time period.
Table 8. Overview of 24 water issues for City of San Antonio
Category and Issue Synopsis Original Grade
SRP Grade*
Water Planning
Population Estimates The City of San Antonio (COSA) recently began to use a different population estimate compared to the San Antonio Water System (SAWS). The difference can result in a water shortage as soon as 2040 if drought of records occur. SAWS and COSA should jointly determine the best population estimates to use in water planning.
D B
Gallons Per Capita per Day (GPCD) Demand Management
The target per capita use (i.e., GPCD) in the 2012 Water Management Plan are lower than 2009 conservation targets. COSA and SAWS should determine an appropriate future GPCD goal (e.g., <135) to encourage sustained water conservation.
C
Public Input SAWS allows public input in its decision-making process. Stakeholder input is an important part of COSA’s water policy success and should continue.
A
Climate Change The 2012 water management plan does not directly outline climate change strategies or approaches to minimizing adverse impacts to water demand/ supply. Outlining key climate change strategies in the next water management plan is recommended.
D N/A**
Water Shortage (2060-2070)
COSA remains vulnerable to water shortages, especially if lower population estimates are used in water use projections. Use of improved population estimates can better inform likely water shortages in future water planning.
C
Water Management
Drought Management The combination of public communication, education, and enforcement of drought-management tactics continues to be effective. Drought-management strategies targeting reduced landscape water usage in particular is recommended.
A
Lost/Non-revenue Water Lost water/non-revenue water is the difference between water pumped and water sold and for SAWS is nearly 36,000 AFY. Efforts to characterize lost/non-revenue water in order to direct corrective and economically sensible actions are recommended.
D B
Edwards Aquifer Habitat Conservation Plan
The achievement of a Habitat Conservation Plan (HCP) and Incidental Take Permit is an important accomplishment for COSA and the region. San Antonio should continue its efforts to stay in compliance with the EAHCP.
A
Bexar Metropolitan Integration
The consolidation of Bexar Met into the system was successful with a process was transparent,
A
58
encouraged public comment, and protected both Bexar Met and SAWS’ customer interests.
City of San Antonio as a Water Neighbor
SAWS’ reflects as a good water neighbor with projects such as the SSLGC shared pipeline, Canyon Lake agreement, reduced pumping of the Trinity Aquifer, and cooperation in the EAHCP. SAWS should pursue such collaborative efforts.
B
Water Quality
Edwards Aquifer Conservation Easements
The conservation easement program uses sales tax revenues to purchase land development rights over the Edwards Aquifer recharge zone. This program is highly effective and efforts to increase protection of the recharge zone be encouraged.
A
Regulation of Development Activities over EARZ and Contributing Zones
Rules for development over the Edwards Aquifer Recharge Zone are in place. As urban areas continue to expand, there should be a long-term plan in place to protect water quality for contributing-zone regions.
C
Contamination Threat SAWS’ Water Vulnerability Assessment and Emergency Response Plan should be reviewed with COSA to ensure measures are adequate and coordinated.
B
Low-Impact Development (LID)
There is an effort led by SARA with cooperation from SAWS and COSA to use LID to protect water quality. LID Best Management Practices (BMPs) should be considered in the Comprehensive Plan Implementation program in supporting water quality protection.
C
Coal-Tar Sealant Both sides have literature supporting their claims. Consideration in the City’s Sustainability Plan on a possible coal-tar sealant ban based on existing research should be evaluated.
B N/A
Annexation and Extension of Water Infrastructure
Territory in the ETJ is restricted to 15% impervious cover. Under annexation, this restriction would be relaxed to allow for single family (30%), multi-family (50%), and commercial uses (65%). A consistent policy of development rules across the entire recharge and contributing zone should be established and incorporated into the Comprehensive Plan.
C
Regulatory Agencies
Texas Water Development Board (TWDB)
SAWS is involved in TWDB programming and utilizes available resources for developing water-supply projects. SAWS officials should be involved and seek to promote beneficial TWDB policies whenever possible.
B
Texas Commission on Environmental Quality (TCEQ) and Environmental Protection Agency (EPA)
TCEQ is a state level delegate for EPA. SAWS should be proactive with programming such as organizing a Contaminants of Emerging Concern (CEC) effort that follows EPA guidelines.
D N/A
Edwards Aquifer Authority (EAA)
The EAA works closely with SAWS and other Edwards Aquifer pumpers (e.g., EAHCP). Efforts to negotiate an agreement with the pending League of Latin American Citizens (LULAC) lawsuit should be
B
59
pursued.
Local Regulatory Agencies (Groundwater Districts)
It has been difficult at times because of the inclination of the groundwater districts to oppose regional water sharing, but due to SAWS’ persistence, the results have been successful.
C
Water Costs
Water Project Costs The cost of a water projects varying based on project characteristics. An appendix in the next water plan can serve to explain assumptions behind the cost assignments of water projects.
B
Residential Water Rate Structures
As population continues to grow, SAWS will consider residential rate increases. The Rate Advisory Committee (RAC) should continue to review and discuss these changes on behalf of ratepayers.
B
Commercial and Industrial Water Rate Structures
To bolster economic development, the RAC should continue to review and discuss commercial and industrial water rate increases on behalf of ratepayers. They should identify optimal pricing strategies to best support the city’s growth.
B
Impact Fees Impact fees are not simple to delegate, however, SAWS performs these duties well and regularly reviews and revises them on a regular basis. There is a potential for impact fees to include increased water-quality protection for the Edwards Aquifer recharge and contributing zone.
B
*Some of the water issues grades were adjusted based on SRP recommendations (see Appendix C for details on process). See each individual section for details. Blank cells represent grade is reasonable within one letter grade variance. **The SRP felt there was not enough information available or history to allow a grade assignment. N/A = not applicable.
Water Planning Population Estimates Overview Grade COSA recently began to use a different population estimate compared to SAWS. The difference can result in a water shortage as soon as 2040 if drought of records occur. SAWS and COSA should jointly determine the best population estimates to use in water planning.
D
Description Projected water demands due to anticipated population growth is an important factor for COSA and SAWS to consider. In 2012, both SAWS and COSA were using the same population estimate for their water planning efforts. Recently, the COSA Planning and Community
SRP Grade Validation and Adjustment
☐ Grade is reasonable
within one letter grade variance
☒ New information was
provided and warrants adjustment of two or more letter grades
☐ Grading of issue is not
appropriate or not enough information is available to warrant grade assignment
B
Justification: The change in population estimate used by the COSA occurred post-2012 SAWS Water Plan (i.e., last year), and SAWS and COSA are in the process of determining appropriate estimates to use in the 2015 plan. The original assessment assumed differential use of population estimates since 2012, which was not the case following data validation.
60
Development Department began to use population estimates from the 1.0 Migration Scenario in the Metropolitan Transportation Plan Update for Bexar County (from Alamo Metropolitan Planning Organization, or MPO) as its population baseline prediction.1 That projection estimates population in the county to reach 2,817,067 in 2040. Projecting this data through 2060, the estimated population for Bexar County in 2060 would be 3,555,708. In 2010, SAWS/District Special Project (DSP) did a census-block analysis using 2010 census data that determined the SAWS/DSP was responsible for 92% of the Bexar County population (1.58 million of the 1.71 million).2 Based on the census-block analysis, SAWS’ water plan developed a demand curve based on 2,249,685 people in 2040 and 2,599,818 in 2060.3 In the Region L Water Plan, it is projected that Bexar County’s population in 2060 will be 2,904,319, or more than 650,000 less than the population projected from the MPO estimates. In 2040, Region L population estimates are 88% of the MPO estimates (2,468,254 vs 2,817,067).4 The 2012 SAWS Water Management Plan identifies the challenges in a universally accepted estimate, which is obviously important in evaluating water need compared to water project supply.5
Considerations As outlined above, differences in population numbers between the projected Alamo MPO, 2012 Water Management Plan, and Region L population estimates (Figure 1) require greater communication with key stakeholders to determine the best estimate to use in decision-making. The SAWS plan was relatively consistent with Region L population estimates. When compared to population estimates from the 2016 Region L Water Plan for Bexar County, the 2012 Water Management Plan makes provision for 97% of the Bexar County population in 2060.5 In comparing the 2012 Water Plan estimates to the MPO projections, demand for 87% and 80% of water users are reflected in 2040 and in 2060, respectively.5 In this example, using the water requirement needs of 1,644 AFY required for each 10,000 persons, the differences between the 2012 Water Management Plan estimate and the MPO estimate would involve 56,227 AFY of additional water in 2040 and 110,383 AFY of water in 2060.6 Furthermore, other issues, such as expected GPCD and supply surplus, also relate to this population estimate. This illustrates the need to continue to determine the best population estimate for use in water planning.
61
Figure 1. San Antonio population projects by planning estimate
Grade Assessment SAWS is currently using a population estimate for 2060 that is 20% lower than those projected using MPO population estimates, requiring 110,383 AFY more water. SAWS has begun efforts to update these estimates to be consistent with COSA and the Metropolitan Planning Organization in the next plan. Recommendation – It is recommended that SAWS continue its efforts to update its population estimate similar to what other area planning groups are using. This is likely to result in the need to identify additional water-supply sources to more confidently meet future demands. Actions 1. Review alternate population estimates available (Alamo Area MPO, Region L Water
Planning Region, and SAWS 2012 Water Management Plan Estimates). 2. Discuss the alternatives and reasoning provided for the specific development of the various
estimates with COSA Planning and Community Development Department. 3. Make a decision as to the estimate selected and justify it to pertinent policy boards such as
the SAWS Board and City of San Antonio City Council. 4. Use population data along with projected GPCD to develop water demand estimates.
References 1. Metropolitan Planning Organization. Potential Population and Employment Scenarios for
use in the Metropolitan Transportation Plan Update. Memorandum, November 25, 2012. 2. Adam Conner, SAWS Planner II, electronic communications, December 02, 2014.
62
3. San Antonio Water System 2012 Water Management Plan, page 18, Available at www.saws.org.
4. 2016 Regional Water Plan (Region L), County Population Projection for 2020-2070, page 14, available from the Texas Water Development website. http://www.twdb.texas.gov/
5. Calculated by Calvin Finch using MPO, SAWS 2012 Water Management Plan and Region L Data.
6. Data from SAWS 2012 Water Management Plan, page 21 used to calculate difference in water requirements by Calvin Finch.
GPCD (Demand Management) Overview Grade The target per capita use (i.e., GPCD) in the 2012 Water Management Plan are lower than 2009 conservation targets. COSA and SAWS should determine an appropriate future GPCD goal (e.g., <135) to encourage sustained water conservation.
C
Description Water demands can be expressed as amount of water needed by various population and economic units. SAWS expresses demand per unit of population (person) as gallons per person per day (GPCD). GPCD integrates commercial, industrial, and residential water use into a single metric linked to population. Such a water demand expression is appropriate if the relationship of economic activity to population remains consistent, which appears to be the case for COSA. In 2011, the driest and hottest year on record in San Antonio, the GPCD was 143. The 2012 SAWS Water Management Plan adopted that value as the dry-year base amount. From there, the water plan reflects a reduction in dry-year base of 1 GPCD each year to 135 GPCD by 2020.1 The SAWS plan reports that each reduction in 1 gallon of GPCD is approximately 1,644 AFY savings, enough annual water for 10,000 people.1
Considerations Conservation goals in the 2012 plan (135 GPCD, dry year, by 2020) are lower than the goals expressed in the 2009 plan. In the 2009 Water Management Plan, a goal of 126 GPCD (dry year), 116 GPCD (normal year), and 106 GPCD (wet or drought-restriction year) was targeted.1
The 2012 plan explains why the GPCD goals are different, noting the changes represent corrections due to adjustments in population/household figures, corrections in the amount of water pumped due to inaccurate meters, and the reality presented by 2011 when per-capita water use reached 143.1 The explanations provided for the lower conservation goals certainly should continue to be reviewed in preparing water-conservation goals for the next water plan. In reviewing the GPCD use from 1979-2014, a non-linear regression line (second order polynomial fit, R2 = 0.865, Figure 2) suggests GPCD use tapering in more recent years, as would be expected with an aggressive water-conservation program. Trend data suggests a GPCD goal of 126 approximates the level of stabilization in more recent years. The per-capita water use in 2012, 2013, and 2014 (estimated) were 128, 126 and 126 GPCD, respectively (Figure 2). Those years were not as severe in terms of low rainfall or high temperatures as 2011, but they were years where aquifer levels stayed low enough that San Antonio was under
SRP Grade Validation and Adjustment
☒ Grade is reasonable
within one letter grade variance
☐ New information was
provided and warrants adjustment of two or more letter grades
☐ Grading of issue is not
appropriate or not enough information is available to warrant grade assignment
drought restrictions for the entire period. We recommend a more formal assessment of target GPCD levels be conducted and adopted.
Figure 2. Per capita water use by data source
Grade Assessment Demand management goals presented in the SAWS 2012 Water Management Plan are lower than those in the 2009 plan. SAWS provides justification for changing the goals from a GPCD of 126 to 135, but examination of the GPCD levels achieved for 2012, 2013 and 2014, plus the fitted trend line supports consideration of a more aggressive goal (Figure 2). Recommendation – Evaluate establishment of a new GPCD goal in the next water management plan that recognizes historical trends and reductions that were achieved during the last drought as a basis for future consideration. Actions 1. Evaluate setting an aggressive GPCD goal for the next SAWS Water Management Plan
and implement programming to achieve that goal. 2. Continue funding for demand management that has been budgeted over recent years.
Adjust programming to reflect new ideas and public stakeholder input as long as the cost of water demand savings approximate the cost achieved by the programming.
References
1. San Antonio Water System 2012 Water Management Plan, page 21. Available at the SAWS website, www.saws.org.
Public Input and Communication Overview Grade SAWS allows public input in its decision-making process. Stakeholder input is an important part of City of San Antonio’s water policy success and should continue.
A
Description COSA is known for its water-conservation and drought-management success. One reason for that success, in part, is its citizens’ recognition of the climatic challenges the region faces, including erratic rainfall and high evaporation rates. Another reason is the leadership of elected officials who recognized the challenges and are willing to seek solutions for protecting endangered species and share Edwards Aquifer water with other stakeholders. These successes were achieved through a strong public communication effort and citizen input. The approach of seeking public input and stakeholder buy-in is an important part of COSA’s water policy success. Two important developments are the Committee on Water Policy and the Community Conservation Committee.
Citizens Committee on Water Policy – In response to the federal courts intervention in Edwards Aquifer water management and criticism from the state legislature, San Antonio Mayor Bill Thornton established the Citizens Committee on Water Policy to play a more important role in local water management. The group produced a set of recommendations refined by SAWS through 61 public meetings. In 1998, the San Antonio City Council approved a 50-year water plan. The plan included recommendations on water conservation, rate increases, ASR, recycled water, a Canyon Lake pipeline and reservoirs.1
Community Conservation Committee (CCC) – Established in 1997, the CCC is comprised of diverse group of stakeholders, including neighborhoods, landscapers, environmentalists, chambers of commerce, manufacturers, hotel and restaurant industry, and other groups. Among the group’s most memorable accomplishments was its recommendation to the SAWS Board for a dedicated conservation fund created from fourth-tier residential water users and from every commercial meter. The fund would be used exclusively for conservation programming. The CCC membership and its supporting stakeholders carried the resolutions to stakeholder organizations and to the SAWS Board.2
In 2003, the CCC membership developed a water-conservation and drought-management ordinance that passed the San Antonio City Council in August 2005 with a unanimous vote.3
Other noteworthy public-input vehicles used by SAWS to produce and promote successful water policy in San Antonio included:
Citizens Advisory Panel (CAP) – provides input and outreach on water-resource projects being considered and/or the nature of their implementation.
Rate Advisory Committee – regularly reviews the rate structure for SAWS water to balance operational, community, and financial needs.
Capital Improvements Advisory Committee – provides advice to the SAWS Board on Impact Fees to help recover costs created by new developments.
SRP Grade Validation and Adjustment
☒ Grade is reasonable
within one letter grade variance
☐ New information was
provided and warrants adjustment of two or more letter grades
☐ Grading of issue is not
appropriate or not enough information is available to warrant grade assignment
65
Bexar Met Integration Advisory Committee – a 16-member citizen committee that advised SAWS on accomplishing a smooth integration of Bexar Met services and infrastructure.4
Water policy outreach also has been beneficial to promoting. The San Antonio water policy experience has unique examples of this outreach.
Media, Social Media and Internet Communication – Water has been a top story in San Antonio media for at least the last 30 years. Media coverage continues to be balanced with considerable attention given to provide both sides of water policy issues. In recent years, SAWS also has initiated communication through social media and an effective website.
Volunteer Group Involvement – A unique and effective vehicle to develop and deliver water-conservation and drought-management programming to the public has been San Antonio’s alliance with volunteer groups such as the Bexar County Master Gardeners, Gardening Volunteers of South Texas, and Master Naturalists, to name a few. SAWS provides administrative funding for volunteer coordination and funds based on educational contacts. This dedicated corps of nearly 1,000 volunteers represents every neighborhood, economic, and ethnic group in the city.
Considerations It takes constant effort to enlarge, or even maintain, citizen support for a community’s water policy. San Antonio has been exceptionally skillful at this process. Two areas for current public communication/programming needs in San Antonio’s water policy development and implementation include (1) the Vista Ridge water project, and (2) the landscape industry on the role of irrigation in water-conservation programming. Advocates of the Vista Ridge project were conscientious in encouraging a public dialogue on the project. They were successful in receiving public support partially because they responded to the public’s demand that water-conservation efforts continue along with the project. The landscape industry in the San Antonio area has been a participant in the public discussion about water conservation for several years. Currently, the role of irrigation in water conservation is a primary discussion topic for SAWS staff. For example, SAWS recruited the President of the San Antonio Irrigation Association (SAIA) and leader within the Green Industry Alliance (GIA), and a second licensed irrigator to serve on the CCC. SAWS outdoor conservation programs also have been touted as a good example of cooperation between water utilities and the landscape industry during the state conference of the Texas Nursery Landscape Association (TNLA). SAWS staff regularly engage with SAIA, GIA, and TNLA.
Grade Assessment San Antonio’s exemplary water-conservation success is related to the outstanding public input process conducted by city leaders and SAWS concerning water policy. Recommendation – COSA should maintain its public input process on water policy issues by continuing to seek and use that input. SAWS should make a special point to keep the landscape industry on the water-conservation team, and an open discussion related to Vista Ridge Water Project should continue. Actions 1. Continue a robust public participation program through the CCC and the CAP that identifies
a diverse group of stakeholders with differing opinions to gain consensus on issues such as the role of irrigation in water use. Increase the number of stakeholders supporting the program.
66
2. Characterize issues that define the discussion about the Vista Ridge Water Project and respond to public input to continue the program or modify as needed to maintain public support.
References
1. Gregg Eckhardt, “Alternatives to the Edwards Aquifer,” The Edwards Aquifer Website. Available at www.edwardsaquifer.net/alternatives.html.
2. Karen Guz, San Antonio: “A Conservation Success Story,” PowerPoint Slide 25. Available on the Internet if San Antonio Landscape Ordinance is Googled.
3. Ibid. Slide 26. 4. SAWS Website “Community Involvement.” Available at www.saws.org
Climate Change Overview Grade The 2012 water management plan does not directly outline climate change strategies or approaches to minimizing adverse impacts to water demand/ supply. Outlining key climate change strategies in the next water management plan is recommended.
D
Description The Cities of Fair Oaks Ranch and San Antonio Water Policy Analysis is not designed to make a detailed analysis of the impact of climate change on water security, but it is an issue that should be considered. Chen et al. (2000) estimated climate change in the Edwards Aquifer area will increase municipal water demand and reduce aquifer recharge important to protecting endangered species.1 Other studies (e.g., Brakefield et al. 20152) focused on groundwater dynamics also have been conducted, offering a framework for integrating climate change mitigation strategies into COSA/SAWS water planning.
Considerations It is recommended that increased demands and reduced supplies resulting from climate change be assessed and evaluated in the next San Antonio and FOR water plans. It is especially significant for San Antonio, where a water-supply shortage may occur as early as 2040 if the region is subjected to drought-of-record conditions.
Grade Assessment The impact of climate change has been debated in recent years, and despite the position taken, it would be prudent to further evaluate in terms of water supplies and water demand. An outline of key climate change strategies within the water plan would be beneficial. Recommendation – If an analysis on the effect of climate change on San Antonio’s water security has not been completed, it is recommended that work be initiated so it would be
SRP Grade Validation and Adjustment
☒ Grade is reasonable
within one letter grade variance
☐ New information was
provided and warrants adjustment of two or more letter grades
☐ Grading of issue is not
appropriate or not enough information is available to warrant grade assignment
N/A
Justification: No specific historical efforts for city in addressing climate change were outlined in the report, which prevents a grade assignment based on previous performance.
available for consideration in the next water management planning process. A separate section with the water plan outlining key climate change strategies would be beneficial.
References 1. Chi-Chung Chen, Dhazn Gillig, and Bruce A. McCarl, Effects of Climatic Change on a
Water Dependent Regional Economy: A Study of the Texas Edwards Aquifer, National Assessment of Climate Change, Agricultural Focus Group supported by U.S. Global Climate Change Office, 2000.
2. Linzy K. Brakefield, Jeremy T. White, Natalie A. Houston, and Jonathan V. Thomas. 2015. Updated numerical model with uncertainty assessment of 1950-56 drought conditions on brackish-water movement within the Edwards aquifer, San Antonio, Texas. USGS Scientific Investigations Report 2015-5081.
Water Shortage, 2060-2070 Overview Grade COSA remains vulnerable to water shortages, especially if lower population estimates are used in water use projections. Use of improved population estimates can better inform likely water shortages in future water planning.
C
Description SAWS has continued to diversify its water portfolio through innovative projects. In the 2012 SAWS Water Management Plan, conceptual projects for the long term (2040-2070)1 included seawater desalination, expansion of brackish desalination, additional ASR capacity or ASR operations, new fee-line conservation paradigms, and other regional water projects. In the case of regional water projects, development of these efforts have occurred through a Request For Competitive Sealed Proposals,1 to address water-supply gaps in the period 2060-2068 if drought-of-record conditions occurred in that period (Figure 3).2 The supply gaps range from 38,790 AF in 2062 to 101,163 AF in 2067.2 One challenge in addressing water shortages is the difficulty with population projections and resulting water needs 55 years into the future The projections may not provide, for example, adequate firm yield to meet drought-of-record needs in 2062. In 2012, both SAWS and COSA were using the same population estimate for their water planning efforts. Recently, the COSA Planning and Community Development Department began to use population estimates from the 1.0 Migration Scenario in the Metropolitan Transportation Plan Update for Bexar County (from Alamo MPO) as its population baseline. As a result, SAWS is currently using a population estimate for 2060 that is 20% lower than those projected using MPO population estimates, underestimating water demand (see Population Estimates for more details). SAWS has begun efforts to update these estimates to be consistent with COSA and the Metropolitan Planning Organization in the next plan.
SRP Grade Validation and Adjustment
☒ Grade is reasonable
within one letter grade variance
☐ New information was
provided and warrants adjustment of two or more letter grades
☐ Grading of issue is not
appropriate or not enough information is available to warrant grade assignment
68
Figure 3. Potential supply gaps by source over long term4
Considerations Need to update population projections, along with possible water shortages for 2060-2070 (assuming a drought of record occurs), reinforces the need to integrate appropriate estimates in the next water plan. The relationship between water needs and population estimates raises a question as to whether a shortage may occur as early as the 2040-2050 period, if COSA’s MPO population estimates are accurate and a drought of record occurs (Figure 3).
Grade Assessment Identification of reliable and appropriate population projections is needed. Adoption of the MPO’s 2040 population projections in its 2015 Water Management Plan, for example, will likely necessitate an adjustment to diversify water sources. Recommendation – We recommend that SAWS and COSA Planning and Community Development Department continue to identify the most likely population scenario with the goal of ensuring population growth is not underestimated and adequate water supplies are included in the next version of the SAWS water management plan. Actions 1. Finalize population estimates with SAWS and COSA Planning and Community
Development Department.
69
2. Develop demand estimates by using population estimates and projected GPCD, incorporating special challenges, such as climate change and drought of record.
3. Water planning approaches should integrate water-supply and drought-management strategies. New water-resource projects, such as ocean desalination, can be included in the plan, but it may be more effective if extra supplies can come from advanced water conservation, reduced lost water, an enhanced recycled water program, an extended Vista Ridge project, and an improved ASR.
4. The drought-management plan also needs to be in place and evaluated to account for unexpected infrastructure failures, more severe drought, and other challenges.
References 1. San Antonio Water System 2012 Water Management Plan, Conceptual Projects for the
Long Term (2040-2070),” page 36. Available at SAWS Website www.saws.org. 2. Ibid. Page 37. 3. See section on Population in this paper. Calvin Finch is interpreting the possibility of
shortages in 2040 if MPO population estimates are correct and a drought of record occurs. 4. SAWS 2012 Water Management Plan. Figure 3 is duplicated from page 37 of the Plan.
Water Management Drought Management Overview Grade The combination of public communication, education, and enforcement of drought-management tactics continues to be effective. Drought-management strategies targeting reduced landscape water usage in particular is recommended.
A
Description Drought management has long been an effective tool for San Antonio when permitted Edwards Aquifer water can be reduced as much as 44% during drought periods. SAWS drought restrictions rely on reduced use of water for landscape irrigation. Necessary water use savings can be accomplished by increasingly reducing lawn watering as restrictions move from Stages I to IV. The restrictions were established with considerable stakeholder input, including that of the landscape industry and horticulturists. Evidence suggests necessary water savings are accomplished without reduced economic activity or economic cost. The only change in water use occurs in landscape watering where reduced water availability has only a temporary effect, and lawns and other landscape plants are temporarily stressed. The disruption to the landscape industry is matched by an increase in opportunities due to the growing market for more water efficient plants; more soil, mulch and compost; more efficient irrigation technology and other water efficiency products.1
Considerations The SAWS Conservation Department has done a good job of analyzing water savings possible through drought management. In 2009, SAWS determined that water use was reduced 30,000 AFY by implementing drought restrictions.2 Because of the availability of ASR (see ASR
SRP Grade Validation and Adjustment
☒ Grade is reasonable
within one letter grade variance
☐ New information was
provided and warrants adjustment of two or more letter grades
☐ Grading of issue is not
appropriate or not enough information is available to warrant grade assignment
section) and the compliance of San Antonio citizens with drought restrictions, SAWS has rarely had to implement restrictions beyond Stage II. If the 30,000 AFY were valued at $1,000/acre foot (low for a water-resource project), $30 million worth of water, at peak demand times, was saved at a cost of about $650,000.2 In the 2016 Region L Water Plan, the Regional Water Planning Group assigned costs to SAWS drought-management efforts of $357/acre foot for the 14,674 AF of water saved in the decade of 2020. The cost is increased to $896/acre foot in the decades of 2040 and later.3 These costs are calculated from data provided by TWDB, which are considered by some to be outdated and may not be justifiable in terms of the SAWS drought-management techniques. Re-examination of these costs may be warranted as the potential to support the addition of new water-resource projects compared to drought-management efforts. The willingness to comply with SAWS drought restrictions is the result of several factors:
SAWS citizens and stakeholders have had considerable input in the creation of the drought restrictions. The restrictions save the required water from peak demand and do not drastically affect quality of life, economic activity, or landscapes.
Education programs related to conservation and drought management are effective and ongoing. Education efforts include sympathetic and daily coverage in all forms of media.
Enforcement is a serious activity accomplished by regular police officers on special status for SAWS.
Grade Assessment COSA has demonstrated that drought management does not have to be viewed as a water planning failure but rather an efficient water management strategy that reduces peak water use at a low cost without hindering economic development or quality of life. Recommendation – COSA should formalize its recognition of drought management as an effective way to reduce peak demand in a measured way. COSA should further utilize its water policy education and public communication processes to further promote increased drought-management adoption. Actions 1. Identify drought management as a planned activity to reduce peak water use during a
drought or other water emergencies in the next water plan. 2. Utilize the CCC to include drought-management components in public outreach/education
efforts. Ensure San Antonio citizens understand the important and efficient role that drought management plays in San Antonio’s water security.
References 1. The paragraph offers a number of conclusions by Calvin Finch based on his experience as
SAWS Water Conservation Director and on the Texas Water Conservation Task Force. The opinions have been presented in numerous presentations to local and state audiences.
2. Karen Guz, “Drought Management” PowerPoint presented to the Recovery Implementation Program meeting in January 2010. Slide 7.
3. Brian Perkins of HDR in PowerPoint on Region L Drought Management, provided, March 2, 2015
71
Lost Water/Non-revenue Water Overview Grade Lost water/non-revenue water is the difference between water pumped and water sold and for SAWS is nearly 36,000 AFY. Efforts to characterize lost/non-revenue water in order to direct corrective and economically sensible actions are recommended.
D
Description
Lost water/non-revenue water is the difference between water pumped and water sold. It is important to note that not all non-revenue water is lost as categories of non-revenue water can include loss (e.g., leaks), theft, or meter inaccuracies. The key issue with lost water is that it is permitted, pumped, treated, and perhaps even distributed, but does not produce revenue for the water purveyor. Every water purveyor has some level of lost/non-revenue water. TWDB and EAA have given lost water recent attention, as it can potentially represent a large amount of water that may not be used beneficially. TWDB has a lost/non-revenue water analysis to determine if the amount and characteristics of the lost water require the water purveyor to use part of any TWDB funds to correct the situation prior to using the funds for other water sources. Based on this, TWDB has not placed San Antonio in an excessive lost/non-revenue water category.1 The state calls for a target Infrastructure Leak Index (ILI) of 1-3, which SAWS is within the allowed range with an ILI of 2.5. Since 2004, the lost/non-revenue total in the SAWS service area has increased (Figure 4, Table 9). In 2013, the reported rate was approximately 15% with a similar rate expected in 2014.2 As the national average is 13% for leaks (maximum target standard is 15%), SAWS should strive to better understand its lost water/non-revenue rate.3 In response, SAWS began efforts to address this issue with a contractor (Water Systems Optimization, WSO) to assist in characterizing its lost water/non-revenue total.4 A 15% lost/non-revenue water rate is significant as it represents an approximately 36,305 AFY of unaccounted water.5
SRP Grade Validation and Adjustment
☐ Grade is reasonable
within one letter grade variance
☒ New information was
provided and warrants adjustment of two or more letter grades
☐ Grading of issue is not
appropriate or not enough information is available to warrant grade assignment
B
Justification: SAWS reported that the exact nature of its lost/non-revenue water by volume is not currently known; however, in December 2014, it began working with a contractor (Water System Optimization) to assist in better understanding and correcting the situation.
72
Figure 4. Unaccounted water (%)
Table 9. SAWS annual pumpage versus accounted and unaccounted water
(2) 2013 data from TWDB Water Audit Report, SAWS & DSP combined data. (1) 2012 data do not include DSP
Source6
73
The first step in addressing lost/non-revenue water is to determine where the non-revenue water is going. Causes of non-revenue water vary and can include leaky distribution lines, inaccurate pumping data, firefighting water, stolen water, unmetered water, inaccurate consumer metering, line flushing, inaccurate bookkeeping, or forgiven water bills, to name a few. Only when the lost/non-revenue water factors and amounts are identified can the cost to reverse all or part of the losses be determined. In some cases, all or a portion of the lost water is tolerated because it may not be economically sensible to spend the money required to correct the situation. As previously mentioned, SAWS reported that the exact nature of its lost/non-revenue water by volume is not currently known; however, in December 2014, it began working with a contractor (WSO) to assist in better understanding the situation.4
Considerations SAWS water loss has approached the national average four of the last five years.6 The amount, approximately 36,305 AF in 2013, is as much water as would be provided by a large water-supply project. In terms of Edwards Aquifer water costs (assume $380/acre foot for illustrative purposes), the value of the water lost or unaccounted for in 2013 would be $13.8M. At an assumed cost of $1,000/AF (i.e., less than the Regional Carrizo Program, brackish groundwater and Vista Ridge projects), this lost water would have a value of $36.3M.7
Grade Assessment The complex issue of lost/non-revenue water confronts most major utilities. By industry standards, the level of non-revenue water (15.14% in 2013) is not high for a water purveyor as large and complex as SAWS.
Recommendation – Characterize lost/non-revenue water to direct actions to recapture portions of lost/non-revenue water that makes the most economic sense.
Action Step 1. Consider providing a report to the City Council and SAWS Board of Trustees on the
findings of WSO, identifying where the water is unaccounted for, and cost effective corrective actions.
References 1. John Sutton, SAWS audit worksheet and water-loss threshold and application for financial
assistance, discussion and electronic correspondence, March 17, 2015. 2. Assumption by Calvin Finch based on discussion with Patrick Shriver, Karen Guz and
others at SAWS during the fall of 2014. 3. Average lost water percentage taken from EPA website. Available at
http://www.epa.gov/watersense/our_water/water_use_today.html 4. Kelly Brumbelow, Edwards Aquifer Lost Water Conference at the EAA, October 30, 2014. 5. Calculated by Calvin Finch by applying the 15% to an assumed SAWS pumping rate of
200,000 AFY. 6. Patrick Shriver, SAWS Program Coordinator, Water Resources electronic communication,
November 19, 2014. 7. Calculations by Calvin Finch based on a projected cost of water of $1,000/acre foot, less
than the cost of water from the three projects listed.
Edwards Aquifer Habitat Conservation Plan Overview Grade The achievement of a Habitat Conservation Plan (HCP) and Incidental Take Permit (ITP) is an important accomplishment for COSA and the region. San Antonio should continue its efforts to stay in compliance with the EAHCP.
A
Description The Edwards Aquifer Habitat Conservation Plan (EAHCP) was the result of five years of negotiation between 26 representatives of stakeholders involved with Edwards Aquifer water. The negotiations began in 2007 just before the state legislature passed Senate Bill 3, legislation that formalized the requirement that negotiations proceed and identify required stakeholder representation.1 There were two main goals for the EAHCP effort: 1. Develop a plan to manage the Edwards Aquifer that protects seven endangered animal
species and wild rice at Comal and San Marcos Springs. 2. Arrive at a management scheme that achieves an ITP to reduce the threat of court or
federal intervention, and stabilize the availability of Edwards water.2
After five years of negotiation (2007-2012), an agreement was reached among the 26 entities on the steering committee. The U.S. Fish and Wildlife Service also accepted the management plan, and an ITP was granted for 15 years from 2013 through 2028. A review of the EAHCP convinced the U.S. Fish and Wildlife Service that it had an excellent chance of maintaining enough spring flow at Comal and San Marcos Springs through a series of management activities, improvement of habitat at the springs, and a formalized monitoring and adjustment of the activities (adaptive management) to ensure spring-flow goals are achieved. The budget for EAHCP is approximately $18 million/year. The management activities3 begin with: 1. Voluntary Irrigation Suspension Program Option (VISPO) – A dry-year irrigation option for
agricultural producers wanting to take advantage of a yearly subscription payment. 2. Edwards Aquifer Regional Water Conservation Program (EARWCP) – A total of 8,400 AF
of water – SAWS (8,000 AF), San Marcos (300 AF) and Texas State University (100 AF) – was “lent” to the program for 10 years. The “lent” water will be replaced by water conserved through the EAHCP Regional Water Conservation Program conducted by communities using EAHCP funds.
3. Replacement Water – SAWS ASR stores 40,000 to 126,000 AF of regional water to be used to replace SAWS aquifer pumping during drought conditions. This is the most important HCP activity based on impact to spring flow.
4. Additional Drought-Pumping Reduction Stage – A fifth stage is being added to the current 4 stages of water-use reductions, which is activated as aquifer or spring flow levels fall to specified flows. New restrictions mandate a reduction in water pumping ranging from 4% to 44%.
Additionally, the EAHCP includes funding for studies on the habitat requirements of the endangered species and includes analysis of actual spring-flow effects of the various activities. Legislation (SB 3) to initiate the Edwards Aquifer Recovery Implementation Program (EARIP), and the resultant EAHCP, have a number of impacts on the COSA water supply. These are generally positive, but some challenges may arise as the EAHCP proceeds.4
SRP Grade Validation and Adjustment
☒ Grade is reasonable
within one letter grade variance
☐ New information was
provided and warrants adjustment of two or more letter grades
☐ Grading of issue is not
appropriate or not enough information is available to warrant grade assignment
75
Positive: 1. The likelihood of another intervention by the federal courts as occurred in 1995 is greatly
reduced with the ITP. 2. Total permitted water of 572,000 AFY and the drought restrictions are part of state law,
making it unlikely to be changed. 3. The Science Committee determination that pumping from the Edwards Aquifer would have
to be reduced by 85% in Stage 1 to protect spring flow was rejected by all parties in favor of the current EAHCP.
4. The yearly $18M costs is affordable compared to early estimates and project calculations that up to $1B in capital costs and $60M/year would be required to protect the endangered species.
5. The work by the diverse set of stakeholders, including environmentalists, agriculture, downstream interests, industrial pumpers, small cities and San Antonio, represents a major accomplishment in regional cooperation.
Potential challenges: 1. There are provisions in the EAHCP to evaluate management activities to ensure the impact
on spring flow is as predicted. Programming could require adjustment. 2. Phase II of the EAHCP specifically identifies the inclusion of the SAWS western distribution
pipeline (under construction) into the ASR management activity if the effect of the ASR activity is not as influential on spring flow as predicted.
3. Studies currently being conducted as part of the EAHCP may change the assumptions concerning required spring flow and other important issues that serve as the basis of the EAHCP.
4. The EAHCP extends only for 15 years. Although it is anticipated the EAHCP will be extended, that may not be the case.
Considerations The EAHCP is of major importance to COSA’s water-supply situation. It is important that SAWS, in representing COSA, continue to provide leadership. These efforts can include (1) staff support in evaluating management activities, assessing spring-flow, and renegotiating the EAHCP to ensure San Antonio’s interests are well represented, (2) completing the Western Water Distribution Pipeline, and (3) regularly updating the city and SAWS Board of annual EAHCP accomplishments.
Grade Assessment The EAHCP stabilizes the city’s access to the water and does so in a cost-effective manner. The ITP reduces the threat of lawsuits and federal intervention, which provides SAWS with greater operational flexibility.
Recommendation – It is important for SAWS to continue its support of the EAHCP through active leadership.
Actions 1. Produce a SAWS annual report on EAHCP issues to include goals in the upcoming year.
Make report available on the SAWS website. 2. Present the annual report to the SAWS Board, City Council, business community, and local
university leadership to ensure awareness and continued support of EAHCP.
76
References 1. Robert Gulley, “Heads Above Water, The Inside Story of the Edwards Aquifer Recovery
Implementation Program.” Published in 2015 by Texas A&M Press. Preface. 2. The two main goals are the interpretation of the main goals of the EARIP by Calvin Finch,
who represented SAWS in the negotiations. 3. The management activities are summarized by Calvin Finch, based on his role as the
SAWS representative on the EARIP Steering Committee. 4. The positive impacts and challenges are offered by Calvin Finch, based on his participation
in the EARIP process and the effort to receive support from the EARIP stakeholders, including the SAWS.
Bexar Metropolitan Water District Integration (Bexar Met) Overview Grade The consolidation of Bexar Met into the system was successful with a process was transparent, encouraged public comment, and protected both Bexar Met and SAWS’ customer interests.
A
Description With 93,000 connections, Bexar Met was providing water comparable to a city of about the size of Corpus Christi.1 There was considerable debate about the condition of the water purveyor prior to integration with SAWS. Some of the issues identified were:
Bexar Met did not have adequate water resources to meet demand in a drought of record. It was estimated it would be 25,000 AFY short in such a situation.2
The Bexar Met financial situation was precarious, and its credit status questioned.3
Bexar Met rates were different for various parts of its service area. The reasoning for the differences was questioned.4
Bexar Met rates were generally higher than SAWS rates in a similar situation.
There were complaints about the response time and efficacy of leak and other repairs.
The water resource agreement with WECo was identified as unacceptably one-sided in favor of the contractor.5
Bexar Met owned 20,000 AFY of Edwards Aquifer rights and leased 14,500 AFY.6 The purveyor also had water rights from CRWA (Lake Dunlap and Wells Ranch), Medina Lake and Trinity Aquifer groundwater.7
On November 11, 2011, through Senator Carlos Uresti-sponsored legislation, a vote of Bexar Met customers was held. With a 74% majority, voters decided absorption into SAWS was a better way of meeting future water needs than to remain an independent entity. 8 Among the features of the integration outlined by SAWS included:
All staff would be retained and integrated into the SAWS work force. The legislation protected all staff earning $50,000 or under.9
No rate increases would be instituted in the Bexar Met service area until rates in the original SAWS jurisdiction reached Bexar Met levels.10
SRP Grade Validation and Adjustment
☒ Grade is reasonable
within one letter grade variance
☐ New information was
provided and warrants adjustment of two or more letter grades
☐ Grading of issue is not
appropriate or not enough information is available to warrant grade assignment
77
The Bexar Met portion of the combined water system would remain in a special status for up to five years to protect SAWS ratepayers.10
Customers in the District Special Project (Bexar Met) would immediately be eligible to participate in the SAWS Water Conservation Program.11
A Bexar Met Advisory Committee was established to help guide integration.12 In 2012, the WECo agreement was renegotiated to include terms more reasonable for the SAWS/DSP water purveyor.13 In terms of water resources, Bexar Met brought the following supplies into SAWS (Note: the water resources represented are not firm-yield)14:
20,000 AFY of owned Edwards Aquifer water and 14,500 AFY of leased water
19,974 AFY of Medina Lake water and the Medina Lake treatment plant with approximately 13,000 AFY treatment capacity
17,000 AFY of Trinity Aquifer water
6,800 AFY from Lake Dunlap and Wells Ranch though the CRWA system. There were several arguments against the merger due to concerns over potential lawsuits, anticipated impacts to other efforts to secure water resources, and SAWS interests in securing Bexar Met water resources. Supporters of the merger proposed that combined resources of the two entities would lead to efficiencies in water supply, infrastructure, customer service, and improved financial and synergistic management.14 As of 2015, the integration effort has proven successful and was accomplished with minimal controversy and dispute.
Considerations Integration into SAWS was the logical solution to concerns regarding Bexar Met customer service, financial status and water resource conditions that were not acceptable. This integration, however, was not without challenges. Tackling the integration in the midst of the EARIP, EPA wastewater issues, and the search for new water resources was not ideal. To its credit, SAWS managed the integration without major issues in accomplishing this controversial, complex merger.
Grade Assessment This integration process was an example of a community’s ability to efficiently respond to a water resources problem with remarkable success. SAWS managed the incorporation of Bexar Met into its system with minimal disruption.
Recommendation – The success and the ongoing benefits to San Antonio should be communicated.
Actions 1. SAWS should consider continued reporting on the successful integration of Bexar Met,
relating the benefits and challenges of the integration, through its website and other media outlets.
References 1. Colin McDonald, “Bexar Met and SAWS go toe to toe,” San Antonio Express-News, May
25, 2011, www.sara-tx.org/newsclippings. 2. Darren Thompson, SAWS Water Resources Manager, “Integration of Bexar Met,”
PowerPoint presented to TGRGCD, January 12, 2012, slide 7. 3. Joint Committee On Oversight of Bexar Metropolitan Water District, Report to the 81st
4. Information and conclusions provided by Calvin Finch based on his role as a SAWS administrator during the lead up to the Bexar Met Integration.
5. Colin McDonald, “SAWS ready to shut off pricey Bexar-Met deal,” San Antonio Express-News, July 9, 2012, www.mysanantonio.com/news/environment.
6. Patrick Shriver, SAWS Coordinator, Edwards Aquifer, phone conversation, March 3, 2015. 7. SAWS Water Management Plan, page 28. 8. “Evaluation of Bexar Metropolitan Water District,” Response to Senate Bill 341, Texas
Commission on Environmental Quality, August 2012. 9. Colin McDonald, “Bexar Met district goes down the drain,” San Antonio Express-News,
January 27, 2012, www.mysanantonio.com/news/environment. 10. Darren Thompson, SAWS Water Resources Manager, “Integration of Bexar Met,”
PowerPoint given to TGRGCD, January 12, 2012, slide 5. 11. SAWS website, “Bexar Met Integration” found in “Welcome to saws.org” at www.saws.org. 12. San Antonio Water System website, “Dear Valued Bexar Met Customers,” at
http://www.saws.org/welcome/. 13. SAWS website, “SAWS Trustees Save Ratepayer Money with Revisions to Controversial
Bexar Met Water Contract” at www.saws.org. 14. SAWS 2012 Water Management Plan, pages 27 and 28.
San Antonio as a Water Neighbor Overview Grade SAWS reflects as a good water neighbor with projects such as the SSLGC shared pipeline, Canyon Lake agreement, reduced pumping of the Trinity Aquifer, and cooperation in the EAHCP. SAWS should pursue such collaborative efforts.
B
Description Through its recent history, San Antonio has not always rated as a good neighbor in terms of water issues.1 San Antonio’s neighbors have had a number of issues that may characterize the city as not being cooperative.1 For example, the communities of San Marcos and New Braunfels (both providing springs for Edwards aquifer), cite San Antonio’s long reluctance to diversify its water supplies in favor of dependence on the Edwards Aquifer. Atascosa, Wilson, and Gonzales counties cite the city’s attempts to access Carrizo fresh water and Wilcox brackish water. San Antonio originally passed up the opportunity to partner with SSLGC in favor of an effort to obtain Carrizo water in the same areas for its own pipeline. In addition, the perception of urban versus rural water needs continues in many cases, as has become evident for example with the Vista Ridge project.2
Considerations The SAWS 2012 Water Management Plan includes examples of SAWS and San Antonio being good neighbors. For example, SAWS is now sharing pipeline space with the SSLGC in a cooperative arrangement that reduces costs for all parties. In the Western Canyon project, SAWS uses the water and pays the cost of surplus water not used by smaller communities. Everyone benefits from this arrangement. Another example of COSA/SAWS being a “good neighbor” includes the role in the EAHCP. San Antonio pays 70% of the total cost of the
SRP Grade Validation and Adjustment
☒ Grade is reasonable
within one letter grade variance
☐ New information was
provided and warrants adjustment of two or more letter grades
☐ Grading of issue is not
appropriate or not enough information is available to warrant grade assignment
agreement and makes its ASR facility available to the region, saving everyone many millions of dollars.3 In terms of its Trinity Aquifer water-supply leases, SAWS reduces its pumping of Trinity Water to very low levels during droughts, even though it has take-or-pay arrangements from some of its contracts.4 By reducing its pumping, SAWS makes it possible for its neighbors to access the limited remaining water. The number of good deeds by SAWS is impressive, and SAWS should take credit and communicate its good neighbor efforts to the public.
Grade Assessment The relationship a community that is seeking and managing water supplies has with its neighbors is very important to its success in water planning. Neighbors can impact outcomes based on their attitudes toward their area water purveyor. In the case of San Antonio, relationships with its neighbors have occasionally been strained with certain water planning efforts but overall successes outweigh failures.
Recommendation – Actions identified in the SAWS 2012 Water Management Plan and this report reflect that San Antonio overall is a good neighbor. Addressing any issues that suggest otherwise is important as this impacts cooperation on water issues, making the task of obtaining and protecting water resources more difficult.
Actions 1. Identify “good neighbor” actions to communicate their benefits by social and traditional
media to specific neighbors affected and in general to internal (San Antonio) and external (statewide) audiences.
2. Consider implementing a policy evaluating the impact of water projects to regional neighbors prior to decision-making.
3. Prepare an annual examination of good neighbor actions versus those that negatively impact neighbors to keep the issue at the forefront of San Antonio water policy decisions.
References 1. Robert Gulley, “Heads Above Water, The Inside Story of the Edwards Aquifer Recovery
Implementation Program.” Pages 5-7, Texas A&M Press, 2015. 2. Michele Gangnes, “Is the pipeline deal good for everyone involved? Con Rural Texas could
be next endangered species,” San Antonio Express-News, October 26, 2014. 3. Robert Gulley, “Heads Above Water,” pages 123-131. 4. SAWS website, “Trinity Aquifer Project” available at
Water Quality Edwards Aquifer Conservation Easements
Overview Grade
The conservation easement program uses sales-tax revenues to purchase land development rights over the Edwards Aquifer recharge zone. This program is highly effective and efforts to increase protection of the recharge zone be encouraged.
A
SRP Grade Validation and Adjustment
☒ Grade is reasonable
within one letter grade variance
☐ New information was
provided and warrants adjustment of two or more letter grades
☐ Grading of issue is not
appropriate or not enough information is available to warrant grade assignment
Description In 2000, the citizens of San Antonio voted to use sales-tax funds to purchase land and conservation easements to protect sensitive lands over the contributing and recharge zones of the Edwards Aquifer. Through this sales-tax revenue, $235M has been authorized and $183M raised and spent to protect nearly 128,347 acres of sensitive lands since the program’s inception.1 The 128,347 acres represents 18% of the contributing and recharge zones in Uvalde, Bexar and Medina counties.2 The first venture in 2000 (Proposition 3) targeted land purchases (Table 10), which included the Friedrich Park Wilderness Area in Bexar County. Propositions passed in 2005 and 2010, changing the approach to the purchase of conservation easements rather than the actual purchase of property. A conservation easement is the selling of development rights by a landowner to a land trust. The landowner continues ownership with restrictions of what he/she can do on the property. The change allowed the funds to protect more acreage because conservation easements are less expensive than land purchases. The 2005 and 2010 propositions also allowed purchase of conservation easements in Medina and Uvalde County (Figure 5). In May 2015, San Antonio citizens voted overwhelmingly (78% in favor) to renew funding for the Edwards Aquifer Protection Program for the fourth time (in addition to the $100 million for easements represented by Proposition 1, Proposition 2 includes $80 million for linear parks).3
Table 10. Edwards Aquifer Protection Program conservation easements
Title Date Amount
Authorized Acres
Purchased Easement
Acres
Proposition 3 May 2000 $45M 6,553 -
Proposition 1 May 2005 $90M - 90,150
Proposition 1 Nov 2010 $90M - 31,534
Totals
$225M 6,553 121,684
81
Source: Rivard Report. October 17, 2014
1
Figure 5. Map of conservation easement program Edwards Aquifer Protection
Conservation easements for the program are negotiated by two entities, the Green Space Alliance and The Nature Conservancy. The COSA Edwards Aquifer Protection Program and the EAA monitor easements in the program and ensure the provisions of the easements are maintained.4 The program is popular with landowners who want to preserve the rural and agricultural nature of their land. Landowners receive payments for the easements that prevent development or major land-use changes. The rules prevail even in a land sale or inheritance. The decreased value reduces real-estate taxes and takes economic pressure off the landowner to seek higher-value development.5
Significant Issues Taxpayer support for the program illustrates that San Antonio voters understand the relationship between the recharge area and their water supply, and are willing to spend tax funds to protect that resource.
Grade Assessment The willingness of COSA to support purchase of conservation easements speaks of San Antonio’s overall awareness regarding the importance of the recharge zone to its water supply.
Recommendation – It is important that COSA officials recognize the success of the conservation easement program and promote its continuation. It is recommend the program set a higher goal for conservation easements (e.g., doubling to 35%), and explore the potential in leveraging of program funds with other conservation easement programs.
82
Action Steps 1. Explore establishing a higher target goal for the easement program (e.g., 35% of recharge
zone protected), and perhaps management activities to increase land recharge potential.
References 1. Robert Rivard, “Conservation: Grant Ellis and the Backbone of Aquifer Protection,” Rivard
Water Resources Institute. 3. Justin Horne, “Council approves aquifer protection program,” KSAT 12 TV, January 29,
2015. http://www.ksat.com/news/council-approves-aquifer-protection-program 4. City of San Antonio website, “Conservation Easement FAQs.”
www.sanantonio.gov/EdwardsAquifer/ConservationEasementsFAQ 5. Kate Galbraith, “In San Antonio, a Focus on Land Conservation,” Texas Tribune, March 18,
2011.
EARZ and Contributing Zone Protections
Overview Grade
Rules for development over the Edwards Aquifer Recharge Zone are in place. As urban areas continue to expand, there should be a long-term plan in place to protect water quality for contributing-zone regions.
C
Description Land-use regulations of COSA Unified Development Code (UDC) include specific protections for the Edwards Aquifer Recharge Zone District (EARZ) developed in cooperation with SAWS. A review of the prohibited use categories indicates these are appropriate measures to protect water quality for the Edwards Aquifer. Additionally, the city code includes a systematic program requiring aquifer protection plans for certain development activities, which are a satisfactory approach and means of implementation. It has long been known the major source of recharge to the Edwards Aquifer is infiltration of water from streams as they cross the recharge zone.1 While the exact magnitude of streambed infiltration versus diffuse land surface infiltration is still under investigation, Slade et al. (1985) reports that approximately 85% of recharge to the aquifer occurs from streambed influx.2 Thus, the overwhelming majority of recharge begins as rainfall runoff over the porous recharge zone. The importance of addressing potential water quality problems in contributing zone runoff is underscored by state legislation and TCEQ procedures. Specifically, 30 TAC 213.21, as implemented by TCEQ, requires formulation of a Contributing Zone Plan to protect runoff water quality during development activities that may disturb soil or otherwise cause contamination. This is an important approach. The rapid nature of flow in karstic aquifers like the Edwards increases the importance of source water protection.3
Considerations By statute, only the contributing zone in Bexar, Comal, Hays, Kinney, Medina, Travis, Uvalde, and Williamson counties are considered within the EARZ. This limitation ignores the vast
SRP Grade Validation and Adjustment
☒ Grade is reasonable
within one letter grade variance
☐ New information was
provided and warrants adjustment of two or more letter grades
☐ Grading of issue is not
appropriate or not enough information is available to warrant grade assignment
majority of the contributing zone area (Figure 6) to include Kendall and Bandera counties draining to the Cibolo Creek, Medina River and Hondo Creek watersheds. The fragility of water quality in this area has already been recognized by efforts to develop and implement a watershed protection plan for Upper Cibolo Creek.4 As the San Antonio metropolitan region continues to expand outward, it is expected that increasing urbanization will threaten water quality by increasing the potential for runoff-borne contaminants to enter recharge streams as has been seen for the Upper Cibolo drainage area. A long-term plan serves to protect runoff water quality from contributing zone regions and could encompass the full range of programs or management activities (i.e., conservation easements, land purchases, and watershed protection planning). Beyond the Upper Cibolo Creek plan, significant expertise on watershed protection has been demonstrated for the Upper San Antonio River.5
Map shows the full extent of the Edwards Aquifer Contributing Zone (white outlined in black, marked as “Catchment Area” in legend). Source: Excerpted from SAWS data 2015.
6
Figure 6. Edwards Aquifer Contributing Zone
Grade Assessment COSA UDC and the requirement for aquifer protection plans for certain development activities, provide protection for the recharge zone. There is opportunity to increase protection of runoff with the expansion of regulations through an enlarged protected region.
Recommendation – It is recommended that EARZ rules be expanded in both consistency and area of protection to sustain water quality of the Edwards Aquifer and Trinity Aquifer recharge zones.
84
Actions 1. Designate a subcommittee as part of the Comprehensive Plan effort to revise COSA EARZ
development protection rules toward the end of presenting a set of rules to all of the communities in the region. The goal would be to achieve common rules across the region.
2. Organize a process of interaction and negotiation with all area governments with the goal of having them accept a set of effective workable rules across the region.
3. Determine if legislation would be useful, or necessary, to reach the goal of reasonable and consistent development rules across the region. If so, organize that effort with support of as many participating entities as are proponents of the legislative route.
References 1. B. R. Scanlon, A. Dutton, and M. Sophocleous. 2003. Groundwater recharge in Texas.
Technical report submitted to Texas Water Development Board. http://www.beg.utexas.edu/environqlty/vadose/pdfs/webbio_pdfs/TWDBRechRept.pdf
2. Sources below: a. Y. Huang and B. P. Wilcox. 2005. How karst features affect recharge? Implication
for estimating recharge to the Edwards Aquifer. Sinkholes and the Engineering and Environmental Impacts of Karst. American Society of Civil Engineers, Reston, VA. pp. 201-206.
b. R. M. Slade, L. Ruiz, and D. Slagle. 1985. Simulation of the flow system of Barton Springs and associated Edwards Aquifer in the Austin area, Texas. Water Resources Investigation Report 85-4299. U.S. Geological Survey, Austin, TX.
3. Sources below: a. R. J. Lindgren, N. A. Houston, M. Musgrove, L. S. Fahlquist, and L. J. Kauffman.
2011. Simulations of groundwater flow and particle-tracking analysis in the zone of contribution to a public-supply well in San Antonio, Texas: U.S. Geological Survey Scientific Investigations Report 2011–5149, 93 p.
b. M. Musgrove, L. Fahlquist, G. P. Stanton, N. A. Houston, and R. J. Lindgren. 2011. Hydrogeology, chemical characteristics, and water sources and pathways in the zone of contribution of a public-supply well in San Antonio, Texas: U.S. Geological Survey Scientific Investigations Report 2011–5146, 194 p.
4. R. Bass, D. Burger, M. Vargas, K. Dean, M. Dulay, L. Bilbe, and A. Talley. 2013. Upper Cibolo Creek Watershed Protection Plan. http://www.ci.boerne.tx.us/DocumentCenter/View/3690
5. James Miertschin & Associates. 2014. Upper San Antonio River Revised Watershed Protection Plan Summary. http://www.bexarfloodfacts.org/watershed_protection_plan/FinalWPP_7242014.pdf
6. San Antonio Water System (SAWS). 2015. “About the Edwards Aquifer: Detailed map.” http://www.saws.org/Your_Water/aquifer/map.html
SAWS’ Water Vulnerability Assessment and Emergency Response Plan should be reviewed with COSA to ensure measures are adequate and coordinated.
B
Description
Among various infrastructure systems, drinking water utilities have perhaps the most intimate relationship with the public. Water systems literally extend into people’s homes, thus, the potential for conveyance of a chemical or biological hazard through a drinking water system should be carefully managed. In response to the 2001 terrorist attacks, the U.S. government passed the Public Health Security and Bioterrorism Preparedness and Response Act of 2002 (P.L. 107-188). This law required community drinking water systems serving more than 3,300 persons to (1) complete a vulnerability assessment, and (2) develop an emergency response plan based on the results of the vulnerability assessment. We were not able to review either of these documents by SAWS due to document confidentiality/security requirements. Thus, the information and recommendations presented in this section are based on general knowledge and best management practices.
Risk of Intentional Contamination While the post 9/11 era has placed significant emphasis on the possibility of terrorism in the United States, the risk posed by an external actor intentionally attempting to contaminate a large water system such as SAWS is very low. While there have been several incidents over the past few decades of groups or persons believing they could do so1, there is no documented, significant case in contemporary U.S. history of an intentional water contamination event. Several factors make this type of event very difficult to achieve:
Disinfectant chlorine levels in potable water systems are sufficient to neutralize many biological and chemical agents.
The large volumes and flow rates present in a major city water system would require very large quantities (i.e., trailer loads of a contaminant to overcome dilution effects). Equipment necessary to input these large quantities of contaminant would be large and visible.
Access points to the distribution network appropriate to distributing a contaminant tends to be in central and visible locations. The most critical locations in the distribution network (e.g., pump stations, storage tanks) also are protected with multiple types of physical security.
Internal actors (e.g., utility employees and contractors) could theoretically overcome some of these obstacles. However, standard protocols including cross checking, redundancy in operations, and monitoring makes this difficult.
Accidental Contamination In contrast to intentional events, accidental contamination events have occurred in numbers significant enough for concern and meaningful analysis. Blackburn et al. (2004) reported just under 300 accidental contamination events in U.S. community water systems for the period 1971-2002.2 Hrudey and Hrudey (2004) provide detailed descriptions of over 70 events worldwide between 1974-2004.3 On occasion, these events have had devastating
SRP Grade Validation and Adjustment
☒ Grade is reasonable
within one letter grade variance
☐ New information was
provided and warrants adjustment of two or more letter grades
☐ Grading of issue is not
appropriate or not enough information is available to warrant grade assignment
86
consequences. In 1993, over 400,000 cryptosporidiosis illnesses and 54 deaths occurred in Milwaukee, Wisconsin, and in 2014, a “Do Not Drink or Boil” order affected 500,000 water users in Toledo, Ohio.4 Meta-analysis of these studies by Rasekh and Brumbelow (2013) investigated a range of risk factors and reported the following:5
Accidental contamination events occurred approximately evenly between groundwater and surface water supplied systems.
Human error played at least a partial role in causation for about 56% of events.
Human error was the dominant cause in about 25% of events.
Contaminant intrusion into the water system occurred 89% of the time at a water treatment plant/production well, 9% of the time in the pipe network, and 2% of the time at storage tanks.
Bristow and Brumbelow (2006) reviewed accidental water contamination events to find that prior emergency planning, including communication to water users, plays a significant role in the eventual consequences of such an event.6
Considerations Consistent with the development of a revised Comprehensive Plan, reviewing the policy of SAWS’ automatic responsibility to provide infrastructure for water and wastewater services in the ETJ should be considered. Questions to include:
Does the policy encourage urban sprawl and wasteful expenditure of public funds?
Does the current policy reduce the chance of Edwards Aquifer recharge contamination and threats to new homeowners due to inadequate water resource development and/or individual septic systems?
Are the differences that exist within the EARZ development rules for unincorporated areas in the ETJ and annexed properties within city limits appropriate?
Issues under this topic gain special significance if Comprehensive Plan development is parallel to an effort to establish an adequate and consistent policy of development rules across the entire recharge and contributing zone.
Grade Assessment Surface waters, water sources with treatment plants, and long pipelines generally are more susceptible to contamination than groundwater sources that are pumped from wells within the city limits. Contamination can result from intentional or accidental sources. Groundwater can also be susceptible to contamination including bacterial contamination, faulty septic systems, contaminant load of stormwater runoff, to name a few.
Recommendation – COSA officials should review SAWS’ Water Vulnerability Assessment and Emergency Response Plan (while maintaining necessary confidentiality and security requirements) to make sure that the documents are comprehensive. Risk management strategies should be periodically reviewed and updates made as well as implementing a process to ensure staff receives adequate training in these areas.
Actions 1. As part of Comprehensive Plan implementation program, City Council should review
emergency response plans for water resources to ensure they are adequate and coordinated.
2. Document the coordination plan between SAWS and COSA Office of Emergency Management and other appropriate entities.
87
3. Continue to diversify water supplies to aid in addressing a contamination threat along with the numerous aquifer protection activities that SAWS currently performs.
References 1. P. H. Gleick. 2006. “Water and terrorism.” Water Policy 8, 481-503. doi:
10.2166/wp.2006.035 2. B. G. Blackburn, et al. 2004. “Surveillance for waterborne-disease outbreaks associated
with drinking water: United States, 2001–2002.” MMWR Surveill. Summ., 53, 23–45. 3. S. Hrudey and E. Hrudey. 2004. Safe drinking water: Lessons from recent outbreaks in
affluent nations, IWA Publishing, London 4. N. J. Hoxie, J. P. Davis, J. M. Vergeront, R. D. Nashold, and K. A. Blair. 1997.
“Cryptosporidiosis-associated mortality following a massive waterborne outbreak in Milwaukee, Wisconsin.” American Journal of Public Health 87(12), 2032-2035; Tanber, G. 2014. “Toxin leaves 500,000 in northwest Ohio without drinking water.” Reuters News Service Online. < http://www.reuters.com/article/2014/08/02/us-usa-water-ohio-idUSKBN0G20L120140802> (Accessed February 19, 2015).
5. A. Rasekh and K. Brumbelow. 2013. “Probabilistic Analysis and Optimization to Characterize Critical Water Distribution System Contamination Scenarios.” Journal of Water Resources Planning and Management 139(2), 191-199. doi: 10.1061/(ASCE)WR.1943-5452.0000242.
6. E. Bristow and K. Brumbelow. 2006. “Delay between Sensing and Response in Water Contamination Events.” Journal of Infrastructure Systems 12(2), 87-95. doi:10.1061/(ASCE)1076-0342(2006)12:2(87).
Low Impact Development (LID)
Overview Grade
There is an effort led by SARA with cooperation from SAWS and COSA to use LID to protect water quality. LID BMPs should be considered in the Comprehensive Plan Implementation program in supporting water quality protection.
C
Description The San Antonio River Authority (SARA) has initiated a major effort to encourage the use of low impact development (LID) in the greater San Antonio area. LID is a set of development criteria that decreases risk of pollutants, such as heavy metals, bacteria, and eroded soil, will reach tributaries and the San Antonio River.1 SARA defines LID as a “group of techniques to mitigate the impact of urbanization on the hydrologic cycle.”2 LID is synonymous with terms such as “voluntary use pattern” and “conservation use pattern.”1 The idea of this program is with adequate information, builders will assess property characteristics and use alternative water-conservation and pollution-control strategies appropriate for property during development.3 Some best management practices (BMPs) include rain gardens, permeable pavements, cisterns, and natural channel design protocol.1 Maintaining the natural hydrology and historical features of the land while reducing chances of erosion, impermeable cover, and vegetation removal is the program’s goal.1
SRP Grade Validation and Adjustment
☒ Grade is reasonable
within one letter grade variance
☐ New information was
provided and warrants adjustment of two or more letter grades
☐ Grading of issue is not
appropriate or not enough information is available to warrant grade assignment
88
The current UDC has a provision for LID development; however, it is rarely used likely because it requires 50% of the site to have LID-type features and the belief that LID is a more expensive development option.1 Program proponents have suggested making compliance easier through a reduction in 40% of the land surface reserved for LID, and expanding the definition of LID features to include golf courses and walking trails.1 The proposed rules would not allow easements, utility rights of way, or equestrian paths in the total.1 SARA formed an Agency Advisory Panel and the Development Stakeholder Group to work on the proposed UDC changes. The groups consist of representatives from SAWS, Bexar County, COSA, EAA and the Texas Department of Transportation (TxDOT), and representatives of the development industry, real estate interests and other interested parties.1 For more information on the current discussions and provisions for the proposed UDC changes, visit the SARA website (www.sara-tx.org).
In addition to staffing the LID advisory groups, SARA has prepared a Low Impact Development Technical Guidance Manual that offers free assessment services to property developers. The manual includes general LID information, BMP descriptions, cost estimates, and regulatory guidance. The assessment service helps developers consider some of the LID-type features their property has and how the development may benefit from the LID option. SARA also hosted a LID competition to promote its use throughout the larger San Antonio community
Considerations SARA’s low impact development is limited to areas outside the Edwards Aquifer recharge zone. The SARA website links visitors to TCEQ for development requirements over the Edwards recharge zone.3 LID development offers an alternative option that combines less intrusive property use with more natural pollution and erosion protection techniques.4 Efforts to encourage LID development through less restrictive requirements, education, incentives, and outreach would serve as an example for COSA and FOR to consider as they explore and organize a “contributing zone” effort.1
Grade Assessment Local governments and developers are exploring UDC changes to make LID more attractive to property developers in non-aquifer recharge areas. These efforts aim to achieve LID program benefits through development rules using more natural or ecological functions via BMPs.
Recommendation – The COSA Planning and Community Development Department and SAWS are participants in the San Antonio LID effort. They can serve to translate best management practices from LID to improving UDC approaches in protecting the contributing zone.
Action Step 1. Consider LID as a tool to protect the contributing zone and address it in the Comprehensive
Plan implementation program.
References 1. Karen Bishop, Coordinator Sustainable Development, San Antonio River Authority,
Personal interview, April 16, 2015 2. San Antonio River Authority website, “LID Services,” http://www.sara-tx.org/LIDservices 3. San Antonio River Authority website, Sustainability, https://www.sara-tx.org/sustainability 4. Texas Commission on Environmental Quality website, www.tceq.gov/publications/rg/rg-
Both sides have literature supporting their claims. Consideration in the City’s Sustainability Plan on a possible coal-tar sealant ban based on existing research should be evaluated.
B
Description Coal tar sealant is commonly used in the pavement of driveways, parking lots, and paved roadways, and is an example of a potential contaminant threat to water quality. Minimizing coal tar sealant contamination may be mitigated via legislation or local ordinance. Legislative action in Minnesota and Washington banned the use of coal tar sealants state-wide, and numerous local bans exist in many counties and cities across the country. Austin was a pioneer in passing a local ordinance banning the use of coal tar sealant. The city linked high polycyclic aromatic hydrocarbons in area waterways to nearby parking lots recently coated with coal tar products. The arguments for reducing the use of coal tar products are persuasive to some communities and states.
Research from the U.S. Geologic Survey and some university researchers identify coal tar sealants as a major source of polycyclic aromatic hydrocarbons, a material identified by various entities as a carcinogen.1 Hawthorne (2013) cites sources of research on both sides of the issue but concludes the anti-coal tar research is more convincing.2 The Pavement Coating Technology Council and other industry sources disagree. They describe the body of research as flawed and cite other studies for consideration.3,2 The industry’s arguments have resulted in states such as Maine, Illinois, Michigan, and Maryland defeating ban initiatives.3
Considerations Contradictory research results increase the difficulty for developing sound policy regarding the use of coal tar sealants. We recommend COSA policymakers review the available research to determine if coal tar sealants provide a threat to San Antonio water quality, and if an ordinance regulating use of such materials would minimize risk to contamination. Eleven sources of information on the coal tar issue are listed below for review.
Grade Assessment Debate continues regarding water quality threats posed by coal tar sealants and the polycyclic aromatic hydrocarbons (PAH) that are released. This report provides a sample of positive and negative references concerning a coal tar sealant ban.
Recommendation – Review the available scientific literature and incorporate goals and actions in the City’s Sustainability Plan on the use of coal tar.
SRP Grade Validation and Adjustment
☐ Grade is reasonable
within one letter grade variance
☐ New information was
provided and warrants adjustment of two or more letter grades
☒ Grading of issue is not
appropriate or not enough information is available to warrant grade assignment
N/A
Justification: No historical efforts for city in addressing coal tar sealants, which prevents a grade assignment based on previous performance.
90
References 1. B. J. Mahler, P. C. Van Metre, J. C. Crane, A. W. Watts, M. Scroggins, E. S. Williams.
“Coal tar based pavement sealant and PAH’s: Implications for the environment, human health, and stormwater management. Env. Sci. Technol., 2012.
2. Michael Hawthorne, Coal tar industry fights bans on sealant, March 28, 2013, Chicago Tribune.
3. Wendy Koch, Toxic driveways? Cities ban coal tar sealants. USA Today at http://www.usatoday.com/story/money/business/2013/06/16/toxic-driveways-cities-states-ban-coal-tar-pavement-sealants/2028661/.
Pro Ban: http://tx.usgs.gov/sealcoat.html
Barbara J. Mahler, Peter Van Metre, Judy L. Crane, Alison W. Watts, Mateo Scoffins, and E. Spencer Williams, “Coal-tar-based pavement sealcoat and PAHs: Implications for the environment, human health, and stormwater management.” USGS, Austin, TX http://tx.usgs.gov/coring/pubs/MahlerESTsealcoatFeature2012.pdf
E. Spencer Williams, Barbara J. Mahler, Peter C. Van Metre, “Coal-tar pavement sealants might substantially increase children’s PAH exposures” Environmental Pollution. Elsevier. May 2012. http://www.sciencedirect.com/science/article/pii/S0269749112000279
Peter C. Van Metre, Barbara J. Mahler, “Contributions of PAHs from coal-tar pavement sealcoat and other sources to 40 U.S. lakes” USGS, Austin, TX, 2010. http://tx.usgs.gov/coring/pubs/Van%20Metre%20PAH%20sources%20STOTEN2010.pdf
P.C. Van Metre, B. J. Mahler, J. T. Wilson, and T. L. Burbank, 2008, Collection and analysis of samples for polycyclic aromatic hydrocarbons in dust and other solids related to sealed and unsealed pavement from 10 cities across the United States, 2005–07: U.S. Geological Survey Data Series 361, 5 p. http://pubs.usgs.gov/ds/361/pdf/ds361.pdf
P. C. Van Metre and B. J. Mahler, PAH Concentrations in Lake Sediment Decline Following Ban on Coal-Tar-Based Pavement Sealants in Austin, Texas. http://tx.usgs.gov/coring/pubs/PAHConcentrationsArticle.pdf
Con Ban: http://www.pavementcouncil.org/scientific-journals
Robert P. DeMott, Thomas D. Gauthier, James M. Wiersema, Geoffrey Crenson, ”Polycyclic Aromatic Hydrocarbons (PAHs) in Austin sediments after a ban on pavement sealers” Environmental Forensics Vol. 11, Iss. 4, 2010. http://www.tandfonline.com/doi/abs/10.1080/15275922.2010.526520#.VPiqAfnF_y0
R. P. DeMott, T. D. Gauthier (2014). Comment on “PAH concentrations in lake sediment decline following ban on coal-tar-based 1 pavement sealants in Austin, Texas.” Environmental Science & Technology DOI: 10.1021/es5046088. http://pubs.acs.org/doi/abs/10.1021/es5046088
Brian Magee and Janet Keating-Connolly,“ Comment on ‘Cancer risk from incidental ingestion exposures to PAHs associated with coal-tar-sealed pavement’” Environmental Science & Technology 2014 48 (1), 868-869. http://pubs.acs.org/doi/abs/10.1021/es404184q
O'Reilly, K. (2014). Article title misstates the role of pavement sealers. Environmental Pollution 191:260-261. http://www.sciencedirect.com/science/article/pii/S0269749113006180
ARCADIS (2013). Peer review of coal-tar-sealed pavement risk assessment report prepared for the Pavement Coatings Technology Council. 17 p. http://www.pavementcouncil.org/pavementcouncil/Peer%20Review%20CTS%20Report_Revised2.pdf
K. O’Reilly, J. Pietari, and P. Boehm, (2012). A forensic assessment of coal tar sealants as a source of Polycyclic Aromatic Hydrocarbons in urban sediments. Environmental Forensics, 13:185-196. http://www.tandfonline.com/doi/abs/10.1080/15275922.2012.676598#preview
Annexation of Unincorporated Areas Overview Grade Territory in the ETJ is restricted to 15% impervious cover. Under annexation, this restriction would be relaxed to allow for single family (30%), multi-family (50%), and commercial uses (65%). A consistent policy of development rules across the entire recharge and contributing zone should be established and incorporated into the Comprehensive Plan.
C
Description There are advocates for COSA to more readily annex unincorporated areas in the county, the argument presented being that fast growing areas need more access to services that can only be provided through incorporation.1 Bexar County cannot provide those services because it is limited to revenues provided by the property tax. A municipal government has access to the property tax plus a portion of the sales tax. In San Antonio’s case, the city also receives revenue from CPS Energy and SAWS based on gross receipts.1 Conversely, the city must deliver complete city services to annexed areas, ensuring that paying for these services is not relegated unfairly to current COSA residents. COSA is limited to an annexation plan that does not exceed 10% of its current land area annually or may not annex more than 30% of its land area if carrying over from previous years.1 Potable water and sewer services are not required as part of annexation because SAWS already has that responsibility over a significant portion of the ETJ. SAWS provides municipal water and sewer services to developments that request them, and developers pay the necessary impact fees.2 Another important water-related result of annexation is annexed areas have less restrictive EARZ restrictions than unincorporated areas of ETJ.3
Considerations Consistent with the development of a revised Comprehensive Plan, COSA should review policy that automatically requires SAWS to provide infrastructure for water and wastewater services in the ETJ. Questions to consider include:
Does the policy encourage urban sprawl and inefficient expenditure of public funds?
Does the current policy reduce the chance of Edwards Aquifer recharge contamination threats from new homeowners due to inadequate water resource development and/or individual septic systems?
Differences in development rules between EARZ and annexed properties within the city limits are potentially problematic. Currently, territory in the ETJ is restricted to 15% impervious cover, and if annexed this restriction is relaxed for single family (30%), multi-family (50%) and commercial uses (65%). The appropriateness of these differences need further evaluation during the revision of the Comprehensive Plan.
SRP Grade Validation and Adjustment
☒ Grade is reasonable
within one letter grade variance
☐ New information was
provided and warrants adjustment of two or more letter grades
☐ Grading of issue is not
appropriate or not enough information is available to warrant grade assignment
Grade Assessment Currently, there are differing levels of protections between the other cities, the San Antonio ETJ and the San Antonio City Limits. Greater consistency in the protection of the water quality in the Edwards Aquifer should be considered, though challenging as unincorporated areas will likely be reluctant to adopting COSA regulations. The rules governing annexation of unincorporated areas within the COSA ETJ should continue to be a priority to SAWS, who provides infrastructure for water and sewage collection systems.
Recommendation – COSA should review differences in Edwards Aquifer recharge zone development restrictions in various jurisdictions as a means to improve protection of this major water source.
Actions 1. COSA should address the following issues identified in the section for review and action in
the Comprehensive Plan Implementation program a. Work with the SAWS Board to examine merits of establishing a policy to provide utility
extension consistent with the Comprehensive Plan. b. Ensure EARZ development rules are designed to protect water quality in the ETJ and
annexed areas, including impervious surface, buffer, and use restrictions. 2. Work with municipal jurisdictions to develop a regional action plan to address water quality
protection over the contributing zone.
References 1. Vianna Davila, “Wolff frets that city is in no rush to annex,” San Antonio Express-News,
December 10, 2014. 2. San Antonio Water System, Utility Service Regulations, December 4, 2012 at
3. Nina Nixon-Mendez, Senior Planner, City of San Antonio personal communication on November 19, 2014 to Calvin Finch.
Regulatory Agencies Texas Water Development Board (TWDB) Overview Grade SAWS is involved in TWDB programming and utilizes available resources for developing water-supply projects. SAWS officials should be involved and seek to promote beneficial TWDB policies whenever possible.
B
Description The TWDB is the state’s primary water planning and financing agency. TWDB has three main responsibilities: (1) collect and disseminate water-related data, (2) plan for the development of the state’s water resources, and (3) administer cost-effective financing programs.1 TWDB mission is “to provide leadership, planning, financial assistance, information and education for
SRP Grade Validation and Adjustment
☒ Grade is reasonable
within one letter grade variance
☐ New information was
provided and warrants adjustment of two or more letter grades
☐ Grading of issue is not
appropriate or not enough information is available to warrant grade assignment
the conservation and responsible development of water for Texas.”1 TWDB is a state agency with responsibilities important to COSA/SAWS efforts to include:
Responsible for the production of a state water plan and support for regional planning efforts used to construct the state plan. Local water projects must be included in the regional plan to be considered for funding from the TWDB.
TWDB specifies the method that water purveyors must calculate lost and non-revenue water and collects the information. Lost/ non-revenue water over a specified amount must be addressed before TWDB funds can be used.
TWDB specifies that each water purveyor must have an approved water-conservation plan before any funding can be considered.
Funding sources available through TWDB include the Texas Water Development Fund, the Water Research Grant Program, and State Water Implementation Fund for Texas (SWIFT).
SWIFT Funds for Water-supply Projects House Bill 4, passed by the Texas Legislature in 2011 and approved by voters as Proposition 6 in 2013, made provision for a $2B SWIFT fund. These funds are available for low-interest, flexible-term loans for water-resource projects. At least 20% of the funding is reserved for water-conservation or reuse projects, and another 10% is reserved for rural projects.2 The legislation did not provide a specific definition of a water-conservation project. A popular definition of water conservation is to “make new water resources available through practices and technology that allow activities that use water to be completed at current levels with less water.” 2
SWIFT funds are available to water purveyors and local governments as a loan, not a grant; the money must be repaid. The assistance is desirable in many situations because the interest rates are low and terms flexible. The TWDB created rules based on input from regional water-planning groups for prioritization of the water-resource projects for funding.3 The TWDB also considers project funding based on whether they serve a large population, provide regional needs, or provides a high percentage of water-supply needs, to name a few.4 In addition, the TWDB must also consider other criteria such as local contribution to finance the project, financial capability of the applicant to repay the provided funding, and other factors.5
Considerations As the primary state agency involved in water planning and water resource funding, TWDB is very important to water security. Water planning officials should stay informed of and provide input regarding TWDB policies when possible to improve the ability to utilize services provided. Support also should be given for the appointment of TWDB commissioners who are cognizant of the San Antonio area water-supply issues. Funding availability from TWDB could be an issue given the complexity and cost of water-supply projects as well as competition for available funding resources.
Policies that affect funding availability to water purveyors are also important and should be pursued. Policies that reward strong conservation programs as a prerequisite for receiving TWDB funds encourage successful conservation programs. Policies that reward water resource innovations, such as brackish groundwater desalination, aquifer storage and recovery, and direct recycling, also are desirable. A mobilized and strategic effort related to TWDB resources, including SWIFT, would be worth the investment of staff time in leveraging resources.
94
Grade Assessment TWDB is the vehicle for state funding resources and its funding levels and policies are important to San Antonio water supplies. San Antonio has benefitted from the availability of TWDB funds in the past, most recently the brackish water desalination project. Expansion of the Water Reuse System and Water Conservation programs fit into current SWIFT priorities. ASR, brackish groundwater desalination, and seawater desalination are identified as areas for creation of new freshwater supplies and also would be viewed favorably for TWDB funding.
Recommendation – It is important for SAWS and COSA to maintain continued awareness of TWDB funding issues. Include a goal in the Comprehensive Plan implementation program to consider additional TWDB funding sources.
References
1. Texas Water Development Board website, Mission Statement available at www.twdb.state.tx.us.
2. Texas Water Code, Title 2, Subtitle C, Chapter 15, Subchapter R, Section 15.992. 3. House Bill 4, Section 15.436a 4. House Bill 4, Section 15.437c 5. House Bill 4, Section 15.437d
Texas Commission on Environmental Quality (TCEQ) and Environmental Protection Agency (EPA)
Overview Grade
The Texas Commission on Environmental Quality is a state level delegate for the U.S. Environmental Protection Agency. SAWS should be proactive with programming such as organizing a Contaminants of Emerging Concern (CEC) effort that follows EPA guidelines.
D
Description The Texas Commission on Environmental Quality (TCEQ) is the state agency charged with environmental regulation and enforcement. Its mission includes a wide range of responsibilities; however, two areas of jurisdiction are most relevant to SAWS:
Regulation of water utility operations, including water quality as delivered to consumers
Regulation of environmental water quality, including quality of treated wastewater discharged to receiving water bodies
TCEQ frequently acts as a state level delegate for the U.S. Environmental Protection Agency (EPA). The relationship between these agencies is complex and has included some conflict in the past. Critical federal laws relevant to the two regulatory jurisdictions above are (1) the Safe Drinking Water Act (SDWA), originally passed in 1974 and amended multiple times since, and (2) the Clean Water Act (CWA) originally passed in 1972 and also amended on multiple occasions. SAWS’ present water-supply operations are in compliance with SDWA
SRP Grade Validation and Adjustment
☐ Grade is reasonable
within one letter grade variance
☐ New information was
provided and warrants adjustment of two or more letter grades
☒ Grading of issue is not
appropriate or not enough information is available to warrant grade assignment
N/A
Justification: No historical efforts for city in addressing CECs, which prevents a grade assignment based on previous performance.
requirements.1 Wastewater infrastructure and operations have included CWA violations due to discharge of untreated wastewater during significant storm water events. However, SAWS has entered into a settlement with EPA, or consent decree, to upgrade wastewater infrastructure and end these violations. Under the settlement terms, SAWS will make improvements over a period of 10 years. Costs to SAWS under the settlement include a $2.6M civil penalty and an estimated $1.1B in project costs.2
State and federal laws and regulations relevant to CWA and SDWA issues have been relatively constant for several years. Progressive implementation of existing law and regulation has occurred recently, but not additions of new concern. A typical example of the gradual nature of these processes is the groundwater rule first proposed by EPA in 2000, finally promulgated by EPA in 2006, and adopted for implementation by TCEQ in 2012.3 TCEQ, in its current strategic plan, maintains the position that “government should be limited in size and mission”, which relevant to the CWA and SDWA emphasizes gradual implementation and efficiency improvements in regulatory activities, as well as technical assistance to water utilities for compliance. In other words, the agency does not express interest in expanding regulatory reach.4
Considerations The potential for future regulatory requirements could be quite costly. One potential area to consider and remain aware of are Contaminants of Emerging Concern (CECs) in both drinking water and environmental waters. CECs include a wide range of substances: pharmaceuticals, antibiotics, industrial chemicals, food additives, and others; and are hypothesized to have a wide range of effects on human and animal health, including disruption of endocrine systems and inducement of antibiotic resistance. The primary distinguishing feature of CECs is their low levels of concentration when detected, typically on the order of “micrograms per liter” of water. Concentrations are roughly 1,000 times less than traditional contaminants measured in “milligrams per liter.” Recognition of CECs is largely due to improved laboratory testing. It is known, however, that existing water and wastewater treatment technologies are often ineffective at removal of CECs with better removal techniques accompanied by higher costs (e.g., reverse osmosis and ozonation).5
Research is being conducted to assess the effects of CECs on human and environmental health as well as the introduction, transport, and fate of these substances in the environment6, and use of appropriate technologies for CEC removal.6 EPA is currently engaged in CEC research through its “Endocrine Disruptor Screening Program” (EDSP).7 We predict that regulatory action in Texas under SDWA or CWA authority is unlikely in the next 10 years due to (1) uncertainty over human and environmental health effects of CECs, (2) uncertainty over effective technologies for CEC removal, and (3) gradual nature of regulatory implementation by TCEQ. The next 10 years will likely see significant gains in knowledge regarding the effects and treatment technologies. SAWS should monitor this field of knowledge on a regular basis to anticipate and prepare for any regulatory changes that may eventually occur.
Grade Assessment The TCEQ is responsible for the regulation of water utility operations and regulation of environmental water quality and is the state level delegate for the EPA. Compliance with SDWA or CWA regulations can be challenging, for example, SAWS is in a settlement agreement with the EPA that requires improvements on its wastewater collection.
Recommendation – We recommend SAWS continue to monitor developments regarding “Contaminants of Emerging Concern” and research findings. SAWS is currently working with
96
the EPA to evaluate CEC at select potable water pumping stations and wastewater treatment plants.
Actions 1. Review TCEQ and EPA programming in the same manner as described for the TWDB to
ensure San Antonio is aware of current programs and proposed programs to enable issues to be proactively addressed.
2. Organize a CEC effort that is coordinated as closely as possible with the EPA program and is included as part of the discussed EARZ Development Rules and Contributing Zone Water Protection Program.
References 1. San Antonio Water System (SAWS). 2014. “2014 Water Quality Report.”
http://www.saws.org/Your_Water/WaterQuality/Report/docs/2014_SanAntonioWaterSystemTX0150018.pdf (Accessed February 18, 2015).
2. Sources below: a. U.S. Environmental Protection Agency (EPA). 2013a. “San Antonio Water System
(SAWS) Settlement.” http://www2.epa.gov/enforcement/san-antonio-water-system-saws-settlement (Accessed February 18, 2015);
b. U.S. Environmental Protection Agency (EPA). 2013b. “San Antonio Agrees to $1.1 Billion Upgrade Sewer Systems to Comply With Clean Water Act.” http://yosemite.epa.gov/opa/admpress.nsf/6427a6b7538955c585257359003f0230/f70554777733e77085257bb1006f6765!OpenDocument (Accessed February 18, 2015).
3. Texas Commission on Environmental Quality (TCEQ). 2014b. “History Page: Chapter 290 Public Drinking Water.” http://www.tceq.state.tx.us/assets/public/legal/rules/rules/pdflib/290_his.pdf (Accessed February 18, 2015).
4. Texas Commission on Environmental Quality (TCEQ). 2012. “Strategic Plan: Fiscal Years 2013-2017.” SFR-035/13.
5. U.S. Environmental Protection Agency (EPA). 2010. “Treating Contaminants of Emerging Concern: A Literature Review Database.” EPA-820-R-10-002.
6. Sources below: a. A. Encinas, F. J. Rivas, F. J. Beltran, A. Oropesa. 2013. “Combination of Black-Light
Photocatalysis and Ozonation for Emerging Contaminants Degradation in Secondary Effluents.” Chemical Engineering & Technology 36(3), 492-499. doi:10.1002/ceat.201200311
b. M. Ibanez, E. Gracia-Lor, L. Bijlsma, E. Morales, L. Pastor, F. Hernandez. 2013. “Removal of emerging contaminants in sewage water subjected to advanced oxidation with ozone.” Journal of Hazardous Materials 260, 389-398. doi:10.1016/j.jhazmat.2013.05.023
c. T. Wintgens, F. Salehi, R. Hochstrat and T. Melin. 2008. “Emerging contaminants and treatment options in water recycling for indirect potable use.” Water Science & Technology 57(1), 99-107.
7. Endocrine Descriptor Screening Program (EDSP), U.S. Environmental Protection Agency website, http://epa.gov/oscpmont/oscpendo/pubs.edsp
The EAA works closely with SAWS and other Edwards Aquifer pumpers (e.g., EAHCP). Efforts to negotiate an agreement with the pending LULAC lawsuit should be pursued.
B
Description Created by the State of Texas in 1993, EAA has regulatory jurisdiction to manage, conserve, and protect the Edwards Aquifer and to prevent waste or pollution of the aquifer’s water in all of Bexar, Medina and Uvalde counties and portions of Atascosa, Caldwell, Comal, Guadalupe, and Hays counties.1 The EAA authorizes up to a total of 572,000 AF of groundwater withdrawals each year used for municipal, industrial, and irrigation purposes. Among EAA responsibilities are:
Issuing groundwater permits that allow non-exempt well owners to draw Edwards Aquifer groundwater for municipal, industrial, and irrigation purposes.
Regulating the storage of certain substances and hazardous materials on the recharge zone and the contributing zone of the Edwards Aquifer.
Regulating above ground and underground storage tanks.
Prohibiting coal tar based pavement sealant products in Comal and Hays counties.
Serving as the administrator of the Habitat Conservation Plan for incidental takes related to well permitting and other actions of the Authority.1
Representation on the EAA Board is based on a seven representatives for San Antonio and eight for the rest of the region.2 This representation means that San Antonio with 70% of the population in the region has less than 50% of the elected positions on the EAA board of directors. In 2013, the League of United Latin American Citizens (LULAC) filed a lawsuit seeking equal racial representation on the EAA Board based on population. SAWS joined the lawsuit shortly thereafter. If the litigants win the suit, the voters of Bexar County will have the population base to support electing as many as 13 of the 15 positions instead of seven of the 15 elected positions, as is now the case. This disparity in representation is a valid concern for citizens of San Antonio in terms of future of the water supply.
The EAA funds its regulatory and educational efforts by charging Edward Aquifer pumpers based on the water they lease or own. Agricultural pumpers pay $2 AFY for water they actually use. Municipal and industrial pumpers pay $84 AFY ($37 AFY plus another $47 AFY for the Edwards Aquifer Habitat Conservation Program Implementation costs).3 EAA staff has noted reduced pumping in the region by 2-4M AF. Since 1996, this reduced pumping has resulted in 1.8 million AFY more spring flow and 600,000 AFY more water in the aquifer, or 17 extra feet as measured at the J-17 monitoring well.4
EAA accomplishments include creating an effective water market and contributing to negotiation of the EAHCP, which have further protected endangered species and stabilized the availability of Edwards Aquifer water for COSA. EAA also has cooperated with SAWS issues such as abandoned well capping, pump metering, supplementing water supplies for communities with shortages, and the Pucek catfish farm water, to name a few. Development over the EARZ is an ongoing issue. EAA and some environmental entities favor EAA regulation
SRP Grade Validation and Adjustment
☒ Grade is reasonable
within one letter grade variance
☐ New information was
provided and warrants adjustment of two or more letter grades
☐ Grading of issue is not
appropriate or not enough information is available to warrant grade assignment
98
as it exists in the non-urban areas while SAWS, TCEQ, developers and the state legislature have supported SAWS rules and enforcement in its Certificate of Convenience and Necessity (CCN).5
Considerations The LULAC lawsuit presents a set of complex issues for EAA. The areas in the Edwards Aquifer area around San Antonio have a long history of using Edwards Aquifer water and currently have major influence in the policies governing its use. EAA recognizes that COSA has 70% of the region’s population but does not necessarily believe urban populations should govern water policy. EAA cites a history of San Antonio water use that has not been in the best interest of the resource or the environment. COSA should consider pursuing a solution with the rest of the Edwards Aquifer stakeholders prior to an all-or-nothing settlement of the court case. A solution that keeps the EAA team in action but integrates more representation from Bexar County could be ideal.
Grade Assessment SAWS has joined the LULAC lawsuit against the EAA to redistribute the representation of EAA’s board of directors based on current populations, which would give Bexar County increased number of votes. Seeking solutions with the regional, legislative, and downstream interest groups to ensure Bexar County increased EAA board representation without alienating regional partners should be the goal.
Recommendation – SAWS and COSA should work toward a resolution with the lawsuit while maintaining the important work of the EAA and cooperation between government entities and stakeholders in the region.
Actions 1. COSA City Council should be updated on the state of the LULAC lawsuit and justification
for SAWS support of the lawsuit; especially how they relate to San Antonio’s water security and effects on relationships with regional neighbors.
2. Efforts to maintain close relationships with the EAA board and staff to ensure the cornerstone of San Antonio’s water supply is adequately protected should be paramount. An alternate strategy involving negotiation, rather than legal action, with the parties involved that accomplishes the goals of SAWS should be pursued.
References 1. City of San Antonio, Department of Planning Information Document provided to Calvin
Finch by Nina-Nixon-Mendez on October 24, 2014. 2. Robert Gulley, Author of “Heads Above Water,” and former EAA employee, phone
conversation with Calvin Finch on December 8, 2014. 3. Brock Curry, EAA Financial Director, phone conversation with Calvin Finch on December
12, 2014. 4. Mark Hamilton, EAA official, Presentation on December 10, 2014 to the EA Habitat
Conservation Program Implementing Group. 5. Gregg Eckhardt, “Edwards Water Quality,” section of the topic laws and regulations
applicable to the Edwards Aquifer at www.edwardsaquifer.net/rules.html, Edwards Aquifer website.
Local Groundwater Districts Overview Grade It has been difficult at times because of the inclination of the groundwater districts to oppose regional water sharing, but due to SAWS’ persistence, the results have been successful.
C
Description In addition to the EAA, there are a number of local groundwater districts that have considerable influence over water-supply projects important to COSA. A short description of these groundwater conservation districts (GCD) is provided:
Evergreen Underground Water Conservation District (EUWCD) – The EUWCD is responsible for the Carrizo-Wilcox and minor aquifers in Atascosa, Wilson, Karnes, and Frio counties where agricultural irrigation is the dominant use. The Twin Oaks ASR, brackish groundwater desalination and local Carrizo projects are impacted by this jurisdiction. EUWCD is the most influential GCD within Groundwater Management Area (GMA) 13, where decisions on Desired Future Conditions (DFCs) are made for part of the Carrizo-Wilcox Aquifers. EUWCD is also an important factor in Eagle Ford hydraulic fracturing issues.1
Trinity Glen Rose Groundwater Conservation District (TGRGCD) – The TGRGCD is a member of GMA 9 and is responsible for Trinity Aquifer resources in north central Bexar County and for the Trinity Aquifer water used by FOR in Kendall, Comal and Bexar counties. The Trinity Aquifer water-supply project is impacted by this jurisdiction.1
Gonzales County Underground Water Conservation District (GCUWCD) – The GCUWCD is in GMA 13 and is responsible for the Carrizo-Wilcox and minor aquifers in most of Gonzales County (576,000 acres) and a portion of Caldwell County (77,440 acres). The Schertz/Seguin Carrizo (Gonzales County) and Wells Ranch projects are impacted by this jurisdiction.1
Post Oak Savannah Groundwater Conservation District (POSGCD) – The POSGCD covers the Carrizo-Wilcox Aquifer in Milam and Burleson counties. It is part of GMA 12, which includes the Brazos Valley and Bastrop areas of the Carrizo-Wilcox Aquifer. The POSGCD is the only major GCD for the Vista Ridge project.1
Guadalupe County Groundwater Conservation District (GCGCD) – The GCGCD is in GMA 13 and is responsible for permits to use Carrizo-Wilcox water in Guadalupe County. This impacts the Schertz/Seguin Carrizo project and the Wells Ranch water projects.1
Considerations GCDs have local boards elected by residents in the geographic areas they represent whose focus is commonly on local rather than regional water resource management and utilization. GCD rules typically discourage the export of water from their districts; however, the election of local boards may result in policy changes that create uncertainty in water projects impacted by GCDs.
Recent legislation (HB 1248) allows for automatic renewal of groundwater permits every five years by a GCD, which allows for more predictability. Alternatively, SAWS suggests integrating a level of local input into the decision-making process (e.g., support of water project) as
SRP Grade Validation and Adjustment
☒ Grade is reasonable
within one letter grade variance
☐ New information was
provided and warrants adjustment of two or more letter grades
☐ Grading of issue is not
appropriate or not enough information is available to warrant grade assignment
100
opposed to state agency control (i.e., dictated by state, not local GCD). Other bills related to GCDs that passed in the 2015 Legislature included HB 30, which directs TWDB to identify zones in the state where brackish water appears to be a potential water source. HB 200 provides for a DFC appeals process to the TWDB. HB 655 addresses use of ASR as a water storage facility.
Grade Assessment GCDs have limited geographic responsibility and localized philosophy regarding regulation, making it difficult for San Antonio and others to navigate the different rules and potential changes. Support for regional water projects is more likely if funders can expect stability in the rules that govern them. Consistent statewide governance of water sources, such as brackish groundwater, would improve the ability to develop these resources.
Recommendation – The COSA water-supply effort would benefit from legislation limiting the ability of local GCDs to direct rules against regional projects and to change rules after projects are permitted. We recommend active support from legislation to develop a more favorable regulatory environment for brackish groundwater.
Action Step Assess issues not addressed in the 2015 Legislature, such as placing responsibility for brackish groundwater with a state agency, and prepare for the next legislative session by preparing proposed legislative language, identifying potential legislative sponsors, and developing alliances for the next session.
References 1. Texas Water Development Board website, “Groundwater Conservation District Information”
at www.twdb.texas.gov/groundwater/conservation_districts. Calvin Finch has added factors to the paragraphs.
Water Cost
Water Project Costs
Overview Grade
The cost of a water projects varying based on project characteristics. An appendix in the next water plan can serve to explain assumptions behind the cost assignments of water projects.
B
Description The SAWS 2012 Water Management Plan recommends an annualized cost methodology be used as the basis for developing the cost/AF.1 This methodology is currently recommended by TWDB for the regional water-planning process, and calculates annual capital, operations, and maintenance costs in current year dollars throughout the debt-payoff period. Project cost estimates prepared based on recommended TWDB standards reflect current financial market conditions. SAWS assumes a 3% inflation rate for its water projects through 2030, but it also recommends that inflation not be assumed in the per AF costs to allow comparison. Water-
SRP Grade Validation and Adjustment
☒ Grade is reasonable
within one letter grade variance
☐ New information was
provided and warrants adjustment of two or more letter grades
☐ Grading of issue is not
appropriate or not enough information is available to warrant grade assignment
supply project estimates taken from the SAWS 2012 Water Management Plan reports costs per AF (Figure 7). Clarification on whether inflation is included or not should be provided.
Considerations Comparing project costs is easier if they are estimated at constant levels. It is recommended that water projects include a table showing current and inflated water costs, and when the project is scheduled for implementation, will give the next water plan more long-term value. COSA should be provided with and review this information to develop a more complete understanding of anticipated water-supply project costs. An addition of an appendix outlining these costs would be useful in comparing cost estimates between various versions of SAWS Water Management plans.
Annual Cost per Acre Foot by Project
Figure 7. Annual cost per acre foot by project
Grade Assessment Comparison of water project costs is an important factor in determining a project’s desirability. It is important for COSA officials to be able to directly compare costs for water-supply options. SAWS does a good job of assigning water unit costs.
Recommendation – The next SAWS water plan should include an appendix outlining how water costs for projects were calculated (e.g., Figure 7). Water project estimates sometimes change between versions of the plans, and costs applied to one project may not include all
102
project costs. A clearly defined cost determination methodology and similar cost assumptions would allow easier comparison.
Actions 1. Provide link to the TWDB water project cost method that SAWS uses for public review. Any
deviation from this approach should be shared with stakeholders. 2. Provide a history of cost estimates for Water Management Plan water projects to compare
between various plan versions.
References 1. San Antonio Water System 2012 Water Management Plan, page 42.
Residential Water Rates
Overview Grade As population continues to grow, SAWS will consider residential rate increases. The Rate Advisory Committee should continue to review and discuss these changes on behalf of ratepayers.
B
Description Water Rate Structure Water rate structure is typically the accumulation of political, economic, and social factors. An appropriate water rate structure should include the costs of acquisition, treatment, delivery, and the value of raw water. The value of the raw water has historically been omitted from water pricing, which has led to such issues as overuse, limited conservation, and other factors. To account for this, the following considerations are suggested:
Raw water values should be included as they are with other commodities
Appropriate water rates are the foundation of conservation plans
Water should be billed volumetrically
Fixed fees for stability and ability cover fixed costs should be used
The two most commonly used water rate structures are uniform pricing and increasing block rate. Although the common view is increasing block rate structures promote conservation of water over uniform rates, this depends on the two rate structures compared and elasticity of demand (i.e., how water use varies by price) between various water users.
Water Rate Comparison As a point of comparison, water rates for San Antonio, Austin, Houston, and Dallas were compared (Table 11, Figure 8).1-4 No economic efficiency or proper pricing of water resources were considered in this comparison. Rate structures are consistent between cities in that they vary by meter size and type of user (e.g., residential vs. other users). Only residential rates for a 5/8-inch meter size are presented in this comparison. All four cities employ a fixed monthly charge plus an increasing-block-rate structure based on water use (Table 11, Figure 8). The
SRP Grade Validation and Adjustment
☒ Grade is reasonable
within one letter grade variance
☐ New information was
provided and warrants adjustment of two or more letter grades
☐ Grading of issue is not
appropriate or not enough information is available to warrant grade assignment
103
blocks vary by city. The sewer-rate structure is an increasing block rate for San Antonio (only two blocks with a small first block), Austin, and Houston (Figure 9). Dallas’ volumetric rate for sewer is a uniform rate (Figure 9).3 Sewer rates are based on winter water use in Austin, Dallas and San Antonio while Houston charges based on all water usage.5
Compared to the other cities, in general, San Antonio’s (1) fixed monthly charge for water is larger, (2) fixed charge for sewer is average, (3) its volumetric water rates for water and water plus sewer are less for most blocks, but higher than Houston and Dallas for the highest block, and (4) its block-rate structure is closer to a uniform rate than the other cities (note: this is true for the lower end, but higher blocks similar to other cities, Figure 8). Research suggests that increasing block rate structure promotes conservation compared to the low uniform rate (Figure 10). The result is not so clear when comparing the higher uniform rate to the increasing block rate. At lower usage levels, the higher uniform rate encourages conservation over the uniform block rate structure whereas higher usage in the increasing block rate structure encourages conservation. The overall effect depends on how the lower water users, which are usually lower income, react relative to the larger water users. Properly set uniform rates can encourage conservation and considered economically efficient. Further, a uniform rate that includes scarcity value of water can be associated with a lower fixed fee that dominates the water bill of low water users. Steeper increasing block rates are more economically inefficient. Subsidies intrinsic to low price first blocks are more fully captured by high users than is normally recognized. Currently, San Antonio uses an increasing block rate structure for residential usage (http://www.saws.org/service/rates/Resident.cfm), with rates that are set to increase in 2015.
Considerations San Antonio has the most successful water-conservation program of the four major cities compared. The city also has the least expensive water and the least difference between blocks in its block-rate structure of the four cities. Moderate residential water users are not penalized by a steep rate increase for high water use. SAWS' Rate Advisory Committee (RAC) recommended and SAWS proposed a new rate structure, which will soon present to the SAWS Board and the COSA City Council for their consideration. SAWS officials suggest that the proposed rates and structure would serve to address several issues. The new rate structure would increase rates for all but the lowest-water-use households (27% fall in this category) and higher water usage blocks would be responsible for steeper increases in rates. However, under the new rate structure, the weighted average of consumption less than ~6,000 gallons actually would result in a lower bill. It is suggested that the changes to the water rates for residential ratepayers will protect families through a “lifeline” water rate, and will have more water-conservation impact than the current rate structure.
Table 11. Residential fixed monthly service charge for four Texas cities
*Note: 5/8 Meter Size5
City Water Sewer
San Antonio $7.57 $12.69 Austin $7.10 $10.30 Houston $5.00 $10.62 Dallas $4.85 $4.45
Rates effective:
San Antonio – January 1, 2015 Austin – Water, January 1, 2015; Sewer, November 1, 2014 Houston – April 1, 2015 Dallas – October 1, 2014
San Antonio’s fixed sewer charge also covers the first 1,496 gallons of wastewater usage; a volumetric charge is assessed on usage above 1,496 gallons. Austin also charges a monthly tiered minimum charge based on total billed volume of water as follows: 0-2,000 gallons $1.05; 2,001-6,000 gallons $3,00; 6,001-11,000 gallons $7.60; 11,001-20,000 gallons $23.75; and 20,001+ gallons $23.75.
105
Figure 8. Residential volumetric water rates for four Texas cities
Figure Assumptions:
Houston estimates do not include volumetric charges, only select examples.4 Charges for Houston
presented here are approximated from the examples for 2013 and 2014.
Austin charges a rate of $0.19/1,000 gallons as a water-revenue-stability reserve fund surcharge2
and it is included in the volumetric charges for Austin.3
San Antonio has different rates based on the season and location inside and outside the city. Standard inside-the-city rates are used here
1 as is its Water Supply and Edwards Aquifer pass
through fees.
106
Figure 9. Residential volumetric water and sewer rates for four Texas cities
Grade Assessment Rates in San Antonio are re-examined on a regular basis by a RAC made up of stakeholders. SAWS residential water rates are lower than rates in Austin, Houston, and Dallas within the low and moderate water-use blocks. In general, increasing-block rates do not necessarily maximize net benefits. Proposed changes and resulting impacts should be closely monitored by the RAC.
Recommendation – Proposed rate increases and steeper increasing block rates for 2015 may provide incentive for increased conservation; however, the impact should be closely monitored by the RAC.
Actions 1. Include an analysis of the effect of current and proposed rates for consideration by the RAC
in the future 2. Consider increasing the volumetric charges and level of increase of the increasing-block
rates if it is determined it is desirable for the water-rate structure to contribute more to water conservation.
3. It is suggested that net benefits are maximized when all consumers are paying the same marginal cost. We recommend SAWS investigate the use of a revenue-neutral change to a single volumetric pricing structure.
107
Figure 10. Example of two uniform water rates (dashed lines) and one increasing block rate structure (solid line)
References 1. San Antonio website, http://www.saws.org/service/rates/Resident.cfm 2. Austin website.
5. http://www.austintexas.gov/sites/default/files/files/Water/Rates/Approved_Service_Retail_Wastewater_Rates_2014-15.pdf. Revised by input from Mary Bailey, SAWS Vice President, Business Planning and Controller. June 11, 2015 by email.
6. Graph compiled by James Mjelde from information from the various city websites above. Revised by Mary Bailey, SAWS Vice President Business Planning and Controller, July 2, 2015.
Overview Grade To bolster economic development, the RAC should continue to review and discuss commercial and industrial water rate increases on behalf of ratepayers. They should identify optimal pricing strategies to best support the city’s growth.
B
Description Unlike residential water rates, commercial or industrial rates are not likely to influence discretionary water use, such as landscape irrigation. Commercial and industrial rates, however, may be a factor for a high-water-use industry. As with residential rates, a comparison of rates between San Antonio, Austin, Houston, and Dallas is provided. No economic efficiency or proper pricing analysis of the water resource was conducted in this assessment. Commercial, business, and industrial water rates are more complex in each city than residential-rate structures. Rates vary depending on the city, meter size, type of user, user volume and sometimes even the particular customer. In general, Houston and Austin charges approximate a uniform volumetric rate, whereas Dallas employs a two-tier rate and San Antonio use approximates an increasing-block rate based on average annual use (Table 12, Figure 11). Estimates used in assessment include rates for commercial customers with 5/8” meters.
In 2005, SAWS put commercial and industrial firms on an increasing-block-rate structure that resembles the residential increasing-block-rate structure and includes a fixed charge based on meter size and a monthly volume charge using an increasing-block-rate structure (based on 100% of annual average consumption). This rate also includes a water-use budget feature1 that identifies 100% of annual average consumption. Entities in this water rate category pay $3.19/1,000 gallons/month and rates increase as follows if the entity exceeds 100% use of its base rate:
Up to 125% of base amount used - $3.43/1,000 gallons/month
From 125-175% of base amount used - $4.02/1,000 gallons/month
Above 175% of base amount used - $4.97/1,000 gallons/month
The base amount can change from year to year, especially if the increased water use expectation reflects increased production and/or employment.1 San Antonio’s sewer rates include a minimum monthly charge of $12.69 for the first 1,496 gallons consumed and a uniform rate of $3.36/1,000 gallons (Table 12).1 Austin’s rate structure includes:2
Commercial monthly rates are a fixed volumetric charge based on meter size of $5.98 and $6.58/1,000 gallons for off-peak and peak usage
Specified large-volume customers have fixed monthly charges and lower uniform rates that vary by user from $5.02 to $5.98/1,000 gallons for off peak and $5.52 to $6.58/gallons for peak usage
A fixed minimum charge on the volumetric portion of the bill also is mandated, along with a water revenue stability charge of $0.19/gallon/month. Austin monthly sewer charges are a fixed charge of $10.30 per customer plus a uniform rate per 1,000 gallons based on the user.
SRP Grade Validation and Adjustment
☒ Grade is reasonable
within one letter grade variance
☐ New information was
provided and warrants adjustment of two or more letter grades
☐ Grading of issue is not
appropriate or not enough information is available to warrant grade assignment
109
Uniform rates vary between $7.32 and $8.82 with most commercial customers paying either $8.79 or $8.82/1,000 gallons (Table 12).3
Dallas has two rate structures for general services that include a fixed charge based on meter size. The first is a 3-tiered increasing-block-rate structure of:4
$3.05/1,000 gallons for the first 10,000 gallons/month
$3.45/1,000 gallons above 10,000 gallons
$5.00/1,000 gallons above 10,000 gallons and 1.4 times annual average monthly use
Dallas also has an optional general services rate of $2,025 (minimum) for the first 1 million gallons and $2.75 per 1,000 gallons above 1 million gallons/month. Dallas sewer rates include a monthly fixed charge based on meter size and a uniform rate of $3.70/1,000 gallons for general services under the tiered system and $3.38/1,000 gallons under the optional general-services rate with the one million gallon minimum charge (Table 12).4
Houston charges a fixed rate based on meter size and a uniform monthly water rate of $4.10/1,000 gallons for commercial and industrial users. Sewer charges include a monthly fixed sewer charge based on meter size and volume used. For commercial users, the sewer volumetric monthly charge is a uniform $5.80/1,000 gallons, whereas industrial users without a surcharge face an increasing-block-rate structure of $3.57/1,000 gallons up to 2,000 gallons and over 2,000 gallons, the rate is $6.35/1,000 gallons (Table 12).5
The four cities have various rate structures for customers with different needs, such as lawn irrigation, temporary services, recycled water, untreated water, interruptible and non-interruptible services. Sewer surcharges may also apply for the various customers based on wastewater constituents, such as biochemical oxygen demand.
Considerations San Antonio’s commercial and industrial rates are less expensive in most ways compared to Austin, Houston and Dallas but are probably not different enough to provide a general competitive advantage over other cities. A city’s willingness to negotiate special rates with high-water-use industries or treatment of special water needs may differentiate the cities. San Antonio may secure economic efficiency gains by considering moving to a uniform rate.
Grade Assessment Commercial and industrial rates are important as competitive rates may be a tool for attracting new industries and firms while high rates may allow selective economic development. COSA has adopted policies identifying key industry clusters and SAWS rate structures should consider these policies.
Recommendation – The RAC should consider recommendations offered in this section in its decision-making processes. Economic development goals should be clear and industrial and commercial water rates structured to help accomplish stated goals. Note: This recommendation has been done by the RAC and currently before City Council for its consideration.
Actions 1. Review commercial and industrial wastewater and water rates in terms of their comparison
to Dallas, Houston, and Austin to ensure they are in a competitive range. 2. Construct a water use/payroll dollars (or position) and water-use/product-produced
calculation to include in consideration of economic development prospects in terms of water efficiency. Determine a desired level of efficiency.
110
3. Evaluate rates to determine if adjustment is needed to better meet COSA’s economic development goals; consider the economic opportunities of a single volumetric price for water.
Table 12. Commercial fixed monthly service charge ($) for four Texas cities
City Water Sewer
San Antonio $10.53 $12.69
Austin $14.77 $10.30
Houston $5.19 $9.13
Dallas $4.85 $4.45
Rates effective: San Antonio – January 1, 2015 Austin – Water, January 1, 2015; Sewer, November 1, 2014 Houston – April 1, 2015 Dallas – October 1, 2014. San Antonio’s fixed sewer charge of $12.69 also covers the first 1,496 gallons of wastewater usage and then a volumetric charge is assessed on usage above 1,496 gallons.
Note: 5/8 Meter 6
Figure 11. Commercial volumetric water rates
111
References 1. San Antonio Water System. http://www.saws.org/service/Rates/ 2. City of Austin Water Rates.
3. City of Austin Wastewater Rates. http://www.austintexas.gov/sites/default/files/files/Water/Rates/Approved_Service_Retail_Wastewater_Rates_2014-15.pdf
4. City of Dallas Water Rates. http://www.dallascityhall.com/dwu/pdf/DWU-water-rates.pdf 5. City of Houston Water Rates.
6. Table is compiled by James Mjelde from information from the various city websites above. Revised by Mary Bailey, SAWS Vice President, Business Planning and Controller, June 11, 2015.
Impact Fees Overview Grade Impact fees are not simple to delegate, however, SAWS performs these duties well and regularly reviews and revises them on a regular basis. There is a potential for impact fees to include increased water-quality protection for the Edwards Aquifer recharge and contributing zone.
B
Description Development impact fees vary in name among communities but are usually one-time charges that aim to raise revenue for new-infrastructure construction. San Antonio defines them as “a one-time charge imposed on new development to help recover capital costs associated with providing the infrastructure and other required improvements to provide service to that new development.”1 New developments come with infrastructure requirements to maintain and increase the level of services, such as water and sewer systems, roads, schools, libraries, public safety, parks and other recreational outlets. Total infrastructure services necessary for a given new development are generally not altered by impact fees but those fees affect who pays for the infrastructure and the distribution of costs. Use of impact fees arose because existing property taxes typically are not sufficient to cover the full costs of the new infrastructure.
Two general methods used to raise capital necessary for infrastructure include (1) raising property taxes and/or (2) impact fees. Increasing current property taxes charges the cost of the new infrastructure to all residents and not just the residents residing in the new development. Costs are spread out among many taxpayers, lowering any one resident’s costs. It has been argued that all residents benefit from economic development; therefore, they should help pay the costs. In contrast, impact fees charge the costs directly to new residents. Impact fees may not recover the full costs of the infrastructure; however, the idea is that impact fees may be a more efficient way to pay for new infrastructure since those who benefit the most pay the costs. Impact fees are generally considered to promote economic efficiency as they charge the marginal costs to the new residents. Developers themselves may also assume some of the fee
SRP Grade Validation and Adjustment
☒ Grade is reasonable
within one letter grade variance
☐ New information was
provided and warrants adjustment of two or more letter grades
☐ Grading of issue is not
appropriate or not enough information is available to warrant grade assignment
costs due to the current economic climate. Elasticities of demand and supply (a relative term measuring responsiveness to changes in price) are the main driver in this scenario. The less responsive (more inelastic demand) buyers are to price, the larger the share of the fee paid by the buyers. On the other hand, the more responsive buyers are to price changes (more elastic demand), the relatively larger share developers pay.
Impact of Fees on New Development – Demand for development is a derived demand based on the demand for new housing. Economic principles suggest increasing the price of a new house would decrease the quantity of new homes demanded; however, this is not the case as developments can be quite different in location, type, and size (e.g., small number of expensive homes vs. large number of inexpensive homes). Thus, the effect of impact fees on housing prices is complex, involving land costs and localized housing markets beyond the scope of this report. Important factors driving the effect of these fees include the amount of the fee, elasticities of supply and demand, economic and population growth, and the utility home buyers receive from buying new housing. As expected, because local conditions play an important role, the empirical evidence is mixed on how water and sewer fees affect new construction. Current Impact Fees (San Antonio) – Current impact fees charged by San Antonio effective June 1, 2015 are provided (Table 13). San Antonio realtors estimate the median price of a single-family home to be $184,200, which is below the $201,400 median price of single-family homes in metropolitan areas in the United States.2 Based on the sum of largest impact fees in each category ($7,604) and the median home price, impact fees represent about 4.43% of the median price of a home. This represents the largest possible increase for the median home and assumes the price of a median home represents new home prices. This is an upper bound, or ceiling, because most buyers will not pay the largest fees in each category because (1) new home median prices are usually larger than the median price of all homes, and (2) homebuyers and builders share the costs. A lower bound of 3.18% is found by summing the smallest fee values ($5,858). The weighted average impact fee of $7,205 per Equivalent Dwelling Unit (EDU) is 3.91% of the median home price.
Considerations San Antonio’s goal is for new developments to pay 100% of its water and wastewater infrastructure costs.1 This is sometimes difficult to realize. A recent headline stated impact fees covered approximately 46% of the projected capital spending on water-supply projects over the next 10 years.3 SAWS estimates the level and occurrence of development within its CCN, and costs of infrastructure and when funds will be needed for these costs. Cash flow issues can include total costs being paid from past, current, and future impact fee accounts.4 Impact fees can also be used to direct growth and counteract urban sprawl in a community. In San Antonio impact fee waivers are available for City of San Antonio developments that build projects in the inner city and other targeted development areas.3
113
Table 13. Current impact fees for City of San Antonio
Current Impact Fees*5, (Effective June 1, 2015)
Water Supply Impact Fee $2,796
Water Delivery
Flow $1,182
System Development
Low Elevation $ 619
Middle Elevation $ 799
High Elevation $ 883
Wastewater
Treatment
Medio $1,429
Dos Rios/Leon Creek $ 786
Collection
Medio $ 838
Upper Medina $1,565
Lower Medina $ 475
Upper Collection $2,520
Middle Collection $1,469
Lower Collection $ 719 Impact fees are shown as per Equivalent Dwelling Unit (EDU) *Impact fees charged are based upon the date of plat record. Properties requesting an increase in water or wastewater service beyond designated in the original plat will be subject to current impact fees.
Grade Assessment San Antonio reviews and revises its impact fees on a regular basis with the last review occurring in 2014. SAWS' six wastewater collection impact fee service areas are based on the miles of sewer line required to convey sewage to the treatment plant. Because the service areas encompassing the EARZ and EACZ are further from SAWS treatment plants than the service areas encompassing the inner-city and south side areas, the impact fees for the new development over the EARZ and EACZ are $1,801-$2,045 per EDU higher than the impact fees for the inner-city and other targeted areas
Recommendation – Impact fees contribute to economic efficiency when they meet the infrastructure costs of new developments. Impact fees can also be an important factor in directing development to better protect aquifer-recharge zones. San Antonio should examine this potential. Policy reviews should continue and efforts to maximize the ability of these fees to fund needed infrastructures expansions should be pursued.
Action Step 1. Prior to the next round of impact-fee consideration, the subcommittees described in the
annexation and EARZ and contributing zones sections should consider the role impact fees could play in contributing to a new policy related to providing increased water-quality protection for the Edwards Aquifer recharge and contributing zone.
References 1. San Antonio Water System, Impact Fees. 2014.
2. San Antonio Economic Development Foundation. 2014. Housing. http://www.sanantonioedf.com/living/housing/ . Accessed Dec. 26, 2014.
3. Iris Dimmick, The Rivard Report, “City Council Backs SAWS, Boosts Water Impact Fees,” May 30, 2014. http://therivardreport.com/new-developments-face-maximum-water-impact-fees/
4. Sam Mills, SAWS Director of Master Planning, Phone interview, April 13, 2015 5. San Antonio Water System, Impact Fees. 2014.
http://www.saws.org/business_center/developer/impactfees/ Accessed Dec. 26, 2014. Revised by Sam Mills, June 11, 2015.
6. General references for the topic of impact fees: a. G. Burge. and K. Ihlanfeldt. 2006. Impact Fees and Single-Family Home Construction.
Journal of Urban Economics 60:284-306. b. G. Burge and K. Ihlanfeldt. 2006. The Effects of Impact Fees on Multi-Family Housing
Construction. Journal of Regional Science 46(1): 5-23. c. C. Carrión and L. W. Libby. Development Impact Fees: A Primer.
http://aede.osu.edu/sites/aede/files/publication_files/dif.pdf. Accessed Dec. 26, 2014. d. E. Hanak. 2008. Is Water Policy Limiting Residential Growth? Evidence from California.
Land Economics 84(1): 31-50. e. Impact Fee Handbook. Prepared for National Association of Home Builders 1201 15th
Street, NW, Washington, DC 20005-2800. http://www.nahb.org/fileUpload_details.aspx?contentID=184609. Accessed Dec. 26, 2014.
f. A. C. Nelson and M. Moody. 2003. Paying for Prosperity: Impact Fees and Job Growth. A Discussion Paper Prepared for The Brookings Institution Center on Urban and Metropolitan Policy. http://www.brookings.edu/research/reports/2003/06/metropolitanpolicy-nelson. Accessed Dec. 26, 2014.
g. Red Oak Consulting. 2014. Water and Wastewater Facilities Land Use Assumptions Plan, Capital Improvements Plan, and Maximum Impact Fees. http://www.saws.org/business_center/developer/impactfees/docs/2014_Impact_Fee_Final%20Report.pdf. Accessed Dec. 26, 2014.
City of Fair Oaks Ranch – Water Resources In this section, results and discussion are presented for FOR’s assessment, both water resources/supply and water management activities or issues. Three water-supply resources were evaluated (Table 14, Table 15). The water policy assessment was based on available data of city policies, regulations, and initiatives, to include cost, quantity, and quality, for the 2015-2060 time period.
Table 14. Fair Oaks Ranch water resources (both current and future) in order of water production
Project Water Amount (AFY)
Ranking
Canyon Lake Water 1,850 1
Trinity Aquifer Water 543 2
FOR Recycled Water 224 3
Table 15. Risk ratings for Fair Oaks Ranch water resources (from high to low)
Project Low Risk (-)
High Risk (+)
Overall Risk Value
Risk Label
Canyon Lake Water -1 5 4 High
Trinity Aquifer Water -6 3 -3 Low
FOR Recycled Water -4 1 -3 Low
FOR must secure water-supply quantities to meet its future needs. Because the main water supply is a relatively high-risk source suggests protection of resources (e.g., contamination, other challenges to quality) and diversification efforts are in order. A new water plan for FOR may indicate that the city needs to obtain more water supplies. If so, the resources available through TWDB, such as SWIFT funds may be useful. One of the recommended actions to ensure the favorable supply situation is to work with SAWS to establish an interconnection between the two water systems.
116
Trinity Aquifer Groundwater
Project Overview Rating
Amount of Water: 543 AFY ¹*
Cost of Water: $30/AF if the Trinity water makes up over 50% of the city's supply. There is no cost if the use is less than 50% of total supply.
The $30/acre foot is the cost of the raw water paid to TGRGCD. The TGRGCD Board has granted permission to increase the fee to $40/acre foot at some point in the future.²
Cost Stability: Prices are stable. (0) Ownership State of Water:
Wells are owned by the city.3 (-)
Length of Contract N/A Distance of Source from FOR:
The Trinity Aquifer well sites are in and around the FOR city limits
(-)
Endangered or Threatened Species Issue:
None (-)
Treatment Required: Only requires chlorination (-)
Contamination Threat: Sources state that 4-5% of the rainfall that falls recharges the aquifer. Recharge is described as slow, therefore, although there is localized risk; large-scale contamination threat is low.4
(-)
Drought Restrictions: (Drought Sensitivity)
Yes. The Trinity Aquifer is often described as an inconsistent water source. The Trinity Aquifer as the most stressed water source in the area. 4
(++)
Regulatory Agencies Involved:
TGRGCD. FOR has a representative on the TGRGCD Board. 2
(-)
Other Issues: FOR’s Trinity Aquifer water supplies are related to water use in Boerne, Comal County, and Kendall County where growth is rapid. The Cow Creek Groundwater Conservation District has some density growth controls for groundwater. 5
(+)
Rating: -6 (-)
3 (+)
Total: -3 Low Risk *This value is questionable and FOR is currently having its groundwater supply modelled for improved accuracy.
Description Water from the Trinity Aquifer is approximately 50% of the total FOR water supply. By 2040, the 543 AFY available will be 23% of total supply. The decade of 2040 is a key period because, according to the 2011 Water and Wastewater Planning Study, the city will be built out by that time. Unless changes occur, supply adequate for 2040 will be adequate for 2060 and beyond.1
TGRGCD reports there are several reasons to expect the Trinity Aquifer water source to be a reliable source for FOR.2
The projected water use for the Bexar County portion of the Trinity/Glen Rose Aquifer is only 50% of the MAG.2
117
The remaining land over the Trinity Aquifer in Bexar County is all within the SAWS CCN. The expectation is that there will not be a large number of additional wells drilled into the Trinity Aquifer. Water for new homes in the area will be part of the SAWS municipal system.2
Although the Trinity Aquifer water supply is considered low-risk, careful management of the supply is recommended due to its performance during drought periods.3 Homeowners in developments such as Cross Mountain Ranch and other parts of Kendall County, who rely on Trinity Aquifer water, have faced water deliveries by truck because of their falling well levels (potential impact varies based on region and well depth).6 The degree of reliability depends on which Trinity Glen Rose pool is being pumped, but it is important to remember that, according to SAWS’ 2012 Water Management Plan, SAWS relegates Trinity Aquifer supplies to a reduced-supply status during drought. 7
The rural and unorganized areas over the Trinity Aquifer north and adjacent to FOR in Kendall and Comal counties rely almost entirely on Trinity water. Boerne has a surface water treatment plant and uses Canyon Lake water, Trinity Aquifer water, and other resource supplies (e.g., Esperanza and Cordillera Ranch).15 Boerne and the surrounding rural areas are still growing very quickly despite fears reflected in the more demanding well-drilling permit requirements promulgated by the Cow Creek Groundwater Conservation District (CCGCD).2
Considerations It is important the city recognizes the general concerns about the Trinity Aquifer as a water source and develops a strategy to help ensure reasonable aquifer use.
Grade Assessment The Trinity Aquifer project is rated as a low-risk, though challenged, water source, based on its geology and the pressure from growth in the area. Recommendation –FOR should work even more closely with TGRGCD to play a strong role in managing use of the aquifer and protecting water quality. It is important to develop closer relationships with Boerne, Comal County, and Kendall County in the same regard. This might mean more involvement in Groundwater Management Area 9 issues.
Actions 1. Convene a discussion with Boerne, Comal County, Kendall County, CCGCD, and
TGRGCD to develop a process of regular communications and path to take action to better protect the water quality and recharge quantity of the Trinity Aquifer.
2. Initiate discussion to organize a regional Edwards Aquifer contributing zone initiative. Work with the parties listed in action one to integrate protection for the Trinity Aquifer recharge system in that effort.
References 1. Reem Zoun and David Parkhill. Kendall County and the City of Fair Oaks Ranch Water and
Waste Water Planning Study. Feb. 2011, AECOM for Guadalupe-Blanco River Authority Page 3-12.
2. George Wissman Interview, January 7, 2015. Wissman is the General Manager of the TGRGCD.
3. Ron Emmons, FOR Public Works Director, Q&A Meeting with FOR and TGRGCD officials at the FOR offices on December 18, 2014.
118
4. Gregg Eckhardt, “The Trinity Aquifer,” The Edwards Aquifer Website, http://www.edwardsaquifer.net.html.
5. Ron Emmons, FOR Public Works Director, electronic communication, March 11, 2015. 6. Colin McDonald “Thirsty for Water in Kendall County” San Antonio Express-News, C.
McDonald. Express-news.net, July 1, 2011, and conversation with George Wissman on January 7. 2015.
7. San Antonio Water System 2012 Water Management Plan. www.saws.org
Amount of Water: 1,850 AFY¹ Cost of Water/Cost Stability:
$2.90/1000 gallon or $943.92/acre foot in 2015, price adjusted based on inflation and operating costs through complex formula.² It can be changed at GBRA’s discretion with 60 days’ notice.
(+)
Ownership State of Water:
Bought yearly from GBRA through a contract, more water may be available. Contract extensions available through 2077 if the cost conditions are acceptable.³
(+)
Length of Contract: Decision points at 2037 and every few years (+)
Distance of Source from FOR:
A short pipeline, less than 25 miles⁴ (0)
Endangered or Threatened Species Issue:
None (-)
Treatment Required: Treated by GBRA (+) Contamination Threat: Lake in Comal County (+) Regulatory Agencies Involved:
Yes, but liberal.⁵ (0)
Drought Restrictions: (Drought Sensitivity)
Surface water permitted by TCEQ (state agency) to GBRA and Certificate of Convenience and Necessity
to FOR from TCEQ ⁶
(0)
Other Issues: N/A Rating: -1 (-) 5 (+) Total: 4 High Risk
Description Canyon Lake is the other primary water resource for FOR. GBRA currently delivers water through a contract last amended in 2012 and extending at least to 2077, assuming contract conditions continue to be acceptable.3 The current contract provides a commitment of 942 AFY of treated potable water to be delivered to the city, and up to 1,850 AFY available with notice on or before December 31 of the previous year.1
The Canyon Lake agreement is desirable in that it has an upper volume (1,850 AFY) that is 78.5% of its estimated needs once the community is built out to its ultimate size. The city also has the option to use only a portion of the total available Canyon Lake allotment because SAWS has agreed to purchase the supplies that exceed what FOR and other entities need each year and the maximum amount available.4 The cost of the Canyon Lake water is re-calculated as GBRA determines necessary, with a 60-day notice to FOR. In 2015, it is at $943.92/AF.2
Considerations The price of Canyon Lake water is established by a complex set of calculations and is relatively expensive. SAWS involvement in purchasing the difference between the water FOR needs in the current year and its full entitlement is an advantage, which reinforces the need for FOR to maintain its close relationship to SAWS and COSA. It also is important that FOR Utilities continue playing an active role on the GBRA Project Management Committee to maximize its use of this water resource.
120
Grade Assessment Canyon Lake is assigned a high-risk value. The water-supply project is important to FOR, but the water is relatively expensive and the price will continue to increase.
Recommendation – FOR should continue to be involved in the complex price mechanisms that characterize the Canyon Lake water project. The efforts recommended in water conservation, a SAWS interconnection and Trinity Aquifer protections will all make FOR less dependent on this high-risk project.
Actions 1. Continue the active involvement in GBRA Canyon Lake policymaking processes toward the
end of protecting the price, quantity, and quality of the water supply. 2. Encourage GBRA to analyze the impact that climate change will have on the Canyon Lake
water-supply resources. Impact of climate change on refilling of the reservoir and evaporation from the reservoir needs to be quantified.
3. Use FOR’s relationships with GBRA and San Antonio to keep the cooperation concerning Canyon Lake water resources at its current level. Because of San Antonio’s involvement as a default purchaser of extra Canyon Lake water and the influence it contributes in the Texas Legislature, it is important to FOR’s interests that San Antonio stays involved as a partner.
References 1. Third Amendment to Agreement Between City of Fair Oaks Ranch, Texas and Guadalupe-
Blanco River Authority, January 1, 2012. Provided to Calvin Finch by Christina Picioccio at the December 12, 2014 meeting at the FOR offices.
2. GBRA Invoice date February 1, 2015 was provided to Calvin Finch by Christina Picioccio of the FOR Utilities on February 17, 2015. The information on the invoice was used to calculate the water rate. Corrected by Ron Emmons March 11, 2015.
3. Agreement between City of Fair Oaks Ranch, Texas and Guadalupe-Blanco River Authority, Regional Water Supply Project for portions of Comal, Kendall, and Bexar counties, September 16,1999. Hard copy provided to Calvin Finch by Christina Picioccio of the FOR Utilities February 17, 2015. Page 19.
4. Dave Pasley, SAWS Supports Sprawl: Western Canyon Pipeline, March 28, 2006. Available at http://sawssupportssprawl.blogspot.com. Page 2.
5. In the opinion of Calvin Finch based on experiences in drought of 2011 and before. 6. Certificate of Convenience and Necessity, Certificate No 11246 Texas Natural Resource
Project Overview Rating Amount of Water: Up to 560 AFY (500,000 GPD) ¹
Averages 235 AFY (219-251 AFY) Cost of Water: $0 Cost Stability: Prices are stable (0) Ownership State of Water:
Owned by FOR (-)
Length of Contract N/A
Distance of Source from FOR:
Within city (-)
Endangered or Threatened Species Issue:
None (-)
Treatment Required: Yes (+)
Contamination Threat: Used for the golf course, none (0)
Drought Restrictions (Drought Sensitivity):
No (-)
Regulatory Agencies: TCEQ, state agency (0)
Other Issues: None
Rating: -4 (-) 1 (+) Total: -3 Low Risk
Description The FOR recycled water program is not large in terms of total water (up to 560 AFY), but it is a reliable source that reduces potable water needs to irrigate the Fair Oaks Ranch Golf Course.1
A permit from TCEQ allows FOR to apply up to 500,000 gallons per day (GPD) of treated effluent to the land in the FOR area.1 The permit requires that all the water be applied as irrigation (no discharge permit) and that none be released into the Cibolo Creek, an important Edwards Aquifer recharge feature.1 The Fair Oaks Ranch Golf Course option is desirable because the 280-acre facility is capable of using the entire amount of available water. Treated wastewater produced in the winter can be stored in the golf course storage ponds for use at other times of the year. Cost of the water is described as $0 in the risk-rating table because it would have to be treated whether it was reused or not. The 560 AFY reflects the entire potential and allowed amount in the permit. FOR generally has less wastewater to treat than the 500,000 GPD.1 The amount of available reuse water means FOR also requires a contract to provide Trinity Aquifer water/year to be mixed with the reuse water, as needed.1 The Fair Oaks Ranch Golf and Country Club entered into an agreement with the city in 2012 to receive 52 AFY of potable water to irrigate the 560 acres of golf course land. The country club desired additional sources due to the city’s wastewater treatment plant not yet delivering its full 560 AFY during the record drought year of 2011. The city, in turn, added 52 AFY via its contract with GBRA starting in 2012 to avoid drawing from the Trinity Aquifer to meet conditions of this contract agreement with the country club.
122
Considerations The FOR recycled water program is as much a water-quality issue as it is a water-supply project. The 224 AF used by the golf course in an average year replaces potable water. Using the water to irrigate the golf course also eliminates the need for the wastewater to be placed in Cibolo Creek. There are probably legitimate considerations questioning whether the water is a contamination threat in the Cibolo (e.g., waste water treatment plant capability of water treatment), suggesting irrigation demands may be best option for this water supply.
Grade Assessment The FOR recycled water program is considered a low-risk water resource. The relatively small water-supply project is significant as it uses the entire FOR treated wastewater production to replace potable water to irrigate the Fair Oaks Ranch Golf Course.
Recommendation – The reuse program is important as both a water-supply and water-quality project and should be more aggressively promoted to the public as part of FOR’s water policy. Action 1. Detail the recycled water program and how it works on the FOR website.
References 1. Ron Emmons, FOR Public Works Director, email communication, Reuse Water, March 11,
2015.
123
City of Fair Oaks Ranch – Water Issues In this section, results and discussion for water management activities or issues for FOR are presented (Table 16). The evaluation is based on available data on city policies, regulations, and initiatives, to include cost, quantity, and quality, for the 2015-2060 period.
Table 16. Overview of 11 water issues for City of Fair Oaks Ranch
Category and Issue Synopsis Original Grade
SRP Grade*
Water Planning
Population Estimates Population estimates need updating and incorporated into the new water plan. The AECOM Water and Wastewater Report of 2011 characterized a balance between water supplies and demand that also requires a reassessment.
A
Drought-of-Record Conditions
Water supply based on conditions such as drought of record, climate change, high gallons per capita per day (GPCD) levels, and increased population estimates were calculated. Water deficits need to be addressed.
B
Climate Change The City of Fair Oaks Ranch (FOR) recognizes the potential for climate change to have an effect on water demand and supplies and seek to mitigate its impact.
A
Water Management
Water Conservation The FOR Water Conservation Plan presents a goal to reduce GPCD from 200 to 160 by 2060. If a more ambitious effort is organized, the GPCD may be reduced from 200 to 160 by 2040.
D
Drought Management FOR successfully uses surcharges as a drought-management tool but could benefit by adding drought enforcement. Drought-restriction rules can be more effective with added education to the community.
C
Lost/Non-revenue Water FOR manages lost/non-revenue water well with an average monthly rate of 7.8%. It also sources the loss between line flushing and an estimated calculation of leaks.
A
Water Quality
Relationships with Neighboring Communities
FOR cooperates on Extraterritorial Jurisdiction (ETJ) and other issues with San Antonio, but needs to pursue the idea of an interconnection. There is considerable room for increasing the relationship with Boerne and Comal and Kendall counties to protect the Trinity Aquifer resource
C
Regulatory Agencies
Trinity Glen Rose Groundwater Conservation District (TGRGCD)
The cooperation between the city and TGRGCD is close. The two entities should review TGRGCD fees and the city’s relationships with other Trinity-Aquifer stakeholders.
B
Texas Water Development Board (TWDB)
Officials should stay involved with TWDB programming and pursue available funding. The value is to be able to influence TWDB policies when possible.
B
124
Texas Commission on Environmental Quality (TCEQ) and Environmental Protection Agency (EPA)
FOR works closely with the agency on its recycled water program. The relationship should be continued to develop a regional water-quality-protection effort.
B N/A**
Water Costs
Residential and Commercial Rates and Impact Fees
FOR should look at its rate structure in terms of system expenses and water-use goals. Examine the water-pricing structure taking into account marginal cost pricing, scarcity value of the water, economic efficiency, and other city goals.
C
*Some of the water issues grades were adjusted based on SRP recommendations (see Appendix C for details on process). See each individual section for details. Blank cells represent grade is reasonable within one letter grade variance. **The SRP felt there was not enough information available or history to allow a grade assignment. N/A = not applicable.
Water Planning Population Estimates
Overview Grade Population estimates need updating and incorporated into the new water plan. The AECOM Water and Wastewater Report of 2011 characterized a balance between water supplies and demand that also requires a reassessment.
A
Description FOR has had an average GPCD of 200 over the last 10 years.1 The highest GPCD was 235 in 2011 (dry year), and the lowest was 148 (very wet year).1 Its population was estimated to be 6,382 in 2009. The 2011 AECOM Water and Wastewater Study projects that FOR and its ETJ will be completely built out by 2040 and the population to reach 10,301 people in 2040.2 The Mayor and City Council members estimate the population may reach 16,411 (approximately 59% more water).1
In 2040, based on a dry-year GPCD of 207 and a total population of 10,301, the water needs of the community will be 778,292,055 gallons or 2,389 AFY.3 The expectation is water demand will stay constant through 2060. If the 16,411-person estimate calculated by the Mayor and City Council members is valid, the overall water demand would increase by 60%.4
FOR’s water sources include groundwater from the Trinity Aquifer, surface water from the Canyon Lake, and recycled water from the FOR Recycled Water Program. The 2011 AECOM Water and Wastewater Study reports that, based on available supplies, there will be no shortage of water through 2040 and beyond.5
The Region L (SCTRWP) water plan reflects that FOR per-capita water use will be reduced from 207 to 204 by 2040. Total water needs in 2040 would then be 2,354 AFY. In 2011, FOR used 890 AF of water from Canyon Lake. In 2040, 1,850 AFY will be available from Canyon Lake. Since approximately 543 AFY is available from Trinity groundwater wells, the 2011 AECOM Water and Wastewater Study projects a 39 AFY surplus in 2040 and beyond.
SRP Grade Validation and Adjustment
☒ Grade is reasonable
within one letter grade variance
☐ New information was
provided and warrants adjustment of two or more letter grades
☐ Grading of issue is not
appropriate or not enough information is available to warrant grade assignment
125
If the 16,411-population projection is more accurate, there would be a water-supply shortage well before build-out is complete unless the GPCD or other factors in the water-demand calculation are reduced or supplies are increased. The issue is not a major concern because the estimated growth would occur within the SAWS CCN (though >2,000 acres are within ETJ of FOR), and the expectation is that SAWS will address the demand.
Considerations FOR needs to resolve the uncertainty over its projected population at build-out. If estimates in the 2011 Water and Wastewater planning study are accurate, FOR appears to be relatively well situated to meet its future water needs. If it is built out by 2040, the city has adequate supplies available from a combination of Canyon Lake and Trinity Aquifer sources, even if per-capita water use remains at the 200-207 level. If the 16,411 figure is more accurate, the expectation is that the added growth will occur within the SAWS CCN (though >2,000 acres are within ETJ of FOR) so SAWS will provide the additional water supply.
Grade Assessment FOR’s approach to addressing population estimates in its planning receives an A due to use of multiple estimates and recognition of need for updated estimates. To meet its water needs for a 10,301 population, FOR has a contracted commitment of 2,393 AFY, 543 AF from the Trinity Aquifer and 1,850 from the Canyon Lake project operated by GBRA.
If the estimate of 16,411 is more accurate, then considering the potential impact of drought-of-record conditions, climate change and the vulnerability of water supplies from the Trinity Aquifer, the FOR water situation may not be as secure as the 2011 AECOM Water and Wastewater Report suggests.
Recommendation – If the built-out population is 10,301, the city should protect the water sources in place and reduce risk by working closely with neighbors to regulate use of the Trinity; by working with FOR citizens to achieve the city’s water-conservation goals; by seeking agreements with SAWS that allow a mutually beneficial interconnection; and by staying influential in the machinations of pricing and water allocation for the Canyon Lake project. If the 16,411-person estimate is the likely build-out population, more water supplies are required, which would be the responsibility of SAWS if growth occurs in the SAWS CCN, and in cooperation with FOR and local developers.
Actions 1. Determine the most accurate population estimate for FOR build-out. 2. If the number is the 10,301 then the nature of the FOR water plan becomes one of blending
protection of the Trinity Aquifer and Canyon Lake Project with water conservation and a SAWS interconnection. Prepare that plan.
3. If the 16,411 population is the more realistic estimate, a new water plan must be created. The same issues described in Step 1 are important, but a new source, or sources of water, for 500-1,500 AFY more water needs to be identified. The additional water is expected to be the responsibility of SAWS, but other options include an expanded Canyon Lake water supply and increased water conservation.
References 1. Ron Emmons, FOR Public Works Director, email communication, March 11, 2015. Based
on calculations completed by the Mayor and three City Council members. 2. Reem Zoun and David Parkhill. Kendall County and the City of Fair Oaks Ranch Water and
Wastewater Planning Study, February 2011. Prepared for Guadalupe Blanco River
126
Authority in association with Texas Water Development Board by AECOM Page 1-1 for 2009 population and pages 2-4 (Table 2.2) for 2040 population estimate.
3. Calculated by multiplying GPCD in Kendall County and Fair Oaks Ranch Water and Wastewater Planning Study (page 3-1) by population at 2040 when build-out is reached (Page 3-11).
4. Information provided by Mayor Landman, June 4, 2015, email communication to Calvin Finch.
5. AECOM report. Page 3-11.
127
Drought-of-Record Conditions Overview Grade Water supply based on conditions such as drought of record, climate change, high GPCD levels, and increased population estimates were calculated. Water deficits need to be addressed.
B
Description When calculating water needs, water purveyors in Texas generally use firm yield during drought-of-record conditions to determine what portion of their water supply will be available. Drought of record refers to the weather conditions that existed in the period of 1950 through 1957 in Central Texas. These were eight years of extreme drought, with the worst year in 1956. Temperatures were high, rainfall was low, and recharge to aquifers and lakes was low. Conditions in 1956 did not quite match the high temperatures and low rainfall experienced in the record-setting year of 2011. The cumulative impact of eight years of drought, however, is more severe than 2011, even if it set records.
Recharge data for the Edwards Aquifer showed the average recharge in the period 1950-1956 was 24% of average recharge for the overall period of 1934-2011.1 Predictions are that if conditions again approach the intensity of the drought of record, Trinity Aquifer water levels may fall as much as 100 feet (some local estimates are upwards of 150 feet) and a large part of the aquifer would be depleted by 2030.2 Despite the severity of the 1950s drought, wells pumping from the Trinity fared rather well. Most wells continued to produce water. Since the 1950s, the population has increased by more than 800% over much of the Trinity Aquifer.3 In recent years, wells drilled into the upper layers of the Trinity by developments such as Cross Mountain Ranch have gone dry. Even Jacobs Well, an artesian well near Wimberley, quit flowing during a dry spell in 2008. It had flowed all through the drought of record.4
It is difficult to determine how much of the water supplies from the Trinity Aquifer and Canyon Lake will be reduced during drought-of-record conditions. Until better data exist, it is reasonable to use estimates made for the reliability of the Trinity Aquifer sources during drought. SAWS has contracts for 8,800 AFY of water from Trinity sources, but in its 2012 Water Management Plan, only rates firm yield at 2,000 AFY, just 23% of total yield.5
The net effect is that water purveyors, such as FOR Public Utilities Department, that rely on the Trinity Aquifer and even Canyon Lake, need to make provision to address potentially severe water-supply reductions during drought-of-record conditions. Table 17 illustrates how conditions, such as drought of record, climate change, high GPCD levels, and increased population estimates, may affect water supply and demand.
Grade Assessment Drought-of-record conditions play a major part in determining how much water supply a community such as FOR requires to meet its needs. Other factors include population, GPCD, and climate change. Although the AECOM 2011 Water and Wastewater Study describes the water-supply situation as adequate to handle the population at build-out, that may be an optimistic outlook. There are several scenarios where FOR will have a water deficit well before
SRP Grade Validation and Adjustment
☒ Grade is reasonable
within one letter grade variance
☐ New information was
provided and warrants adjustment of two or more letter grades
☐ Grading of issue is not
appropriate or not enough information is available to warrant grade assignment
128
2040, especially if drought-of-record conditions occur (Figure 12). Table 17 outlines some water-supply and demand-reduction recommendations available to FOR.
Recommendation –FOR should include drought-of-record conditions in its water planning.
Actions 1. Prepare a new water plan based on a water-balance type of analysis (e.g., Table 17). The
analysis considers the water-supply-and-demand conditions due to population, GPCD, drought-of-record conditions, and climate change.
2. The deficit indicates how much more water-supply needs to be obtained. Table 17 does not take into account the time factor, but it should be considered in the more comprehensive plan required for FOR. Figure 16 includes the impact of timing in planning for needed water supplies for San Antonio. FOR should complete a similar water-supply/time-interaction graph.
Table 17. Drought of record, climate change and other factors for Fair Oaks Ranch water balance (all volumes are per year)
Population estimate 10,301 16,411
Water requirement at 207 GPCD in AF (GPCD from AECOM paper)
2,390 AFY 3,808 AFY
Requirement at 160 GPCD 1,847 AFY 2,932 AFY
Climate change
1.5% Increase in demand in 2030 1,871 AFY 2,970 AFY
Drought of record reduces Trinity Aquifer supply by 77%
2,289 AFY 3,388 AFY
Total water available at this point 1,973 AFY 1,975 AFY
FOR recognizes the potential for climate change to have an effect on water demand and supplies and seeks to mitigate its impact.
A
Description Local communities and water planning groups in Texas have been slow to consider climate change as a factor in preparing water-need estimates. The phenomenon is not mentioned in the Region L Water Plan for 2011 or the 2012 state water plan. Part of the reluctance may be a lack of confidence in the science. It has also been difficult to obtain data that could be translated into local change in water demand, evaporation rate, and rainfall.
At this stage in the process, however, water purveyors should consider the data that exist and fine-tune the local impact of climate change as the availability of and confidence in the data increase.
A starting point for determining the effect climate change will have on the FOR water situation could be the paper by Chi-Ching Chen et al., “Effects of Climate Change on a Water Dependent Regional Economy: A Study of the Texas Edwards Aquifer.” It was produced in 2000 so it does not have the most recent data, but it does offer useful estimates.1
The authors estimated that the forecasted climate change of higher temperatures, less rainfall and more erratic rainfall will contribute to an increase in municipal demand by 1.5% in 2030 and increase to 3.5% by 2090.1 They also predicted recharge to the Edwards Aquifer would decrease so much that pumping from the aquifer would have to be reduced by 9% in 2030 and 20% in 2090 to maintain spring flow at high enough level to protect the endangered species.1
Considerations The data are important to FOR water planning because it predicts demand will increase and recharge will be reduced. Based on the FOR water situation, the effects of climate change will not translate to water shortages in the mid-term because of demand increases. The most important effect will be to make the Trinity Aquifer, already a challenged water source, even more challenged.
Grade Assessment Despite the position taken on the impacts of climate change, it would be prudent to further evaluate the impacts in terms of water supplies and water demand. An outline of key climate change strategies within the water plan would be beneficial.
The authors of the 2000 paper estimated that pumping from the Edwards Aquifer will have to be reduced by 9% in 2030 and 20% in 2090 to account for a reduction in Edwards Aquifer recharge in order to protect the endangered species. Edwards Aquifer pumping to protect spring flow does not have direct application to FOR and the Trinity Aquifer recharge, but it does raise questions that need to be considered.
SRP Grade Validation and Adjustment
☒ Grade is reasonable
within one letter grade variance
☐ New information was
provided and warrants adjustment of two or more letter grades
☐ Grading of issue is not
appropriate or not enough information is available to warrant grade assignment
130
Recommendation – Climate change needs to be considered in the next FOR water-management plan. The phenomenon has the potential to increase the likelihood of increasing demand and reducing supply in the period of this analysis, 2015-2060. Recharge volume for the Trinity Aquifer, and recharge levels and higher evaporation rates’ effect on the Canyon Lake reservoir require special attention.
Actions 1. Take advantage of work done by neighboring water-related agencies such as SAWS, EAA,
or Region L Water Planning Group to update the local climate-change impacts on demand, recharge, evaporation rate, and rainfall for use in FOR water planning.
2. Determining the impact of the availability of Trinity Aquifer water because of a possible reduction in recharge flows is important. Both evaporation-rate increases and rainfall total will also affect the Canyon Lake reservoir. Work with the TGRGCD to seek reasonable estimates as to how much supply will be affected.
References 1. Chi-Chung Chen, Dhazn Gillig, and Bruce A. McCarl, Effects of Climatic Change on a
Water Dependent Regional Economy: A Study of the Texas Edwards Aquifer, National Assessment of Climate Change, Agricultural Focus Group supported by U.S. Global Climate Change Office, 2000.
Water Management
Water Conservation
Overview Grade The FOR Water Conservation Plan presents a goal to reduce GPCD from 200 to 160 by 2060. If a more ambitious effort is organized, the GPCD may be reduced from 200 to 160 by 2040.
D
Description In Article 13.06 of the FOR Code of Ordinances, the city proposes to achieve 160 GPCD by 2060.1 Its current GPCD averages 200 and has reached 235 during dry years. The high water use is largely the result of landscape watering, with a reported 2.5 to 3.0 ratio of summer water use to winter water use.2 The high summer peak use characterizes a community with large residential lawns and limited industrial or commercial water use. In contrast, San Antonio, FOR’s neighbor to the east and south, has a 1.5 ratio of summer water use to winter water use, reflecting its more diverse mix of multi-family housing, smaller landscapes, and business water use.3 If the landscape-watering season is nine months, then approximately 50% of FOR water use is landscape irrigation.4
A first glance suggests that water-conservation programming does not need to be a high priority for FOR. The city has adequate water supplies to meet future water needs. Build-out will be accomplished by 2040 and, at that time and beyond, the contracted water supplies are
SRP Grade Validation and Adjustment
☒ Grade is reasonable
within one letter grade variance
☐ New information was
provided and warrants adjustment of two or more letter grades
☐ Grading of issue is not
appropriate or not enough information is available to warrant grade assignment
131
projected to meet population needs. There are, however, some good reasons to work to achieve the 160 GPCD goal reflected in the FOR Water Conservation Plan to include:
Trinity water supplies are traditionally a risky proposition, and the Canyon Lake water has several decision points starting in 2037, when costs and conditions may make the water source more difficult to use.5
A per-capita water use level of 140 GPCD is generally viewed as optimal for efficient water use; therefore 200-207 GPCD is not necessarily a level that reflects efficient water use or environmentally appropriate.6
If the built-out population estimate of 16,411 is more accurate than the 10,301 population, those citizens receiving SAWS water will be under pressure to meet more ambitious water-conservation goals.
There are a number of characteristics for FOR that suggest a potential for a successful water-conservation program:
FOR citizens are environmentally aware and involved in the issues of their community and region. We believe that they would work with officials to have the freedom they desire to manage their landscapes consistent with environmentally and horticulturally appropriate practices. The goal should be to convert the preponderance of well-watered, very large lawn areas to more natural Hill County landscapes with smaller areas of irrigation.7
FOR is approximately 60% built out according to the 2011 Water and Wastewater Planning Study. Development rules for the 40% of new homes expected to be built by 2040 include a limit for sodded and irrigated landscape only to exceed the house footprint by 55 feet in all directions.
o For a 2,500-square feet home, that would amount to approximately one-half acre of irrigated landscape (194 x 140 feet = 27,300 square feet less 2,500 square feet). If the current average irrigated landscape is one acre then average new home for the next 40% of the households will use 50% less water.
o Using these speculative estimates, the new development requirements could reduce the GPCD to 182 by 2040 (assuming the average irrigated lot is now one acre and 40% of the eventual households will be the home footprint plus 55 feet on all sides).8
FOR has an automated meter-reading (AMR) system in place, so there is huge potential for early leak detection, irrigation-pattern analysis, water budgeting, drought-restriction enforcement, and other water-conservation related activities.9
TGRGCD and the Texas A&M AgriLife Extension Service offer water-use education, rainwater catchment, and water-use-audit programming, but there is still a largely untapped opportunity for water-conservation education in the city.10
FOR has an increasing-block system of water rates, with significant monetary penalties for high water use, but even at its most extreme, during periods of drought restrictions, the rates are not very high. Rate increases could influence water use.11
Considerations Analysis suggests that FOR would benefit from taking advantage of its water-conservation assets and organizing a formalized program to achieve the 160 GPCD goal in 2040. The reduction of the GPCD from 207 to 160 at the projected population of 10,301 in 2040 reduces annual water need by ≈577 AF (2,390 AF vs. 1,812 AF) of water, equal to 23% of total water needs and about the amount of water that will be extracted from the Trinity Aquifer (Figures 12-13).12
132
In addition to the advantages listed above of organizing a successful water-conservation program, it would be beneficial to do the program at an investment of about $500/acre foot. If the goal is to reduce per-capita water use by 2 gallons per year, the overall annual budget for water-conservation could begin at $7,500 ($14.58/acre foot) in 2015 and reach $11,550 ($23.10/acre foot) for the year 2040. The $500/acre foot does not provide a generous budget for water-conservation activities, but it is the approximate cost experienced by COSA in its water-conservation program. Key features of a FOR conservation program could include:13
1. The water-use regulations already require leak repairs and limiting sprinkler irrigation to periods of the day when evaporation and winds are lowest.
2. Consideration of a community conservation committee (CCC) made up of citizens with the goal of advising City Council and city staff on conservation activities, and perhaps more importantly, to communicate with citizens to mobilize community support for conservation initiatives.
3. Organization of an education program using resources available in and around the city is important. FOR already uses conservation programs presented by AgriLife Extension personnel and water-use audits offered by Trinity Glen Rose personnel. The effort would contribute more toward achieving the 2 GPCD/year reduction in water use if the CCC identified a list of priority educational classes for the FOR situation. Among suggested classes are: a. “Turfgrass Water Requirements and Drought Capabilities” – Research in the region has
shown that all lawn grasses on soil depth of approximately 12 inches survived 60 days of no rain or irrigation.
b. “The Characteristics and Advantages of Hill County Landscape” – This education offering would list the characteristics that make it attractive, including the plants, geographic features, and its tolerance for drought.
c. “Twelve Months of Low Water Use Color” – This class would identify and describe a list of plants with colorful berries or blooms so that a landscape can have 12 months of color without irrigation.
d. “Advances in High Efficiency Irrigation Technology that can be Used to Reduce Water Use” – There is a relatively long list of irrigation technology and management techniques that keep landscapes healthy with reduced water.
e. “Using Graywater, Condensate and Rainwater Catchment to Reduce Potable Water Use on the Landscape” – Graywater and even condensate are probably effective sources of water for a typical household in the FOR climate.
4. Consideration of a graywater-use initiative in FOR. Graywater is the water recycled from the shower, clothes washing machine, and bathroom sinks. The average household produces 100 GPD of graywater that can be used to replace a portion of the potable water currently used on the lawn. If 50% of the households used 50 gallons/household per day, it would save approximately 84 AF of water in 2015 and 100 AFY by 2040.14
5. Use the AMR system to identify and alert area residents in real time to unusual water use patterns due to leaks. The AMR system also lends itself to the establishment of a recognition program that results when city residents reduce water use on the landscape or in other ways.
6. FOR could offer a brief horticulture article in its utility insert that would contribute to reduced landscape-water use and/or offered some sorts of prize or response if the household responded to the water-conservation help or advice. The opportunity for response could target youth on some bills and other individuals on others.
133
FOR has opportunities for a strong water-conservation program to achieve the 2 GPCD/year reduction reflected in its water-conservation plan. Implementation of an effort with features such as those described would provide considerable insurance to back up the uncertainty in the Trinity Aquifer and Canyon Lake water resources.
Figure 12. Total annual water use with and without conservation, City of Fair Oaks Ranch
Grade Assessment Current water-conservation efforts for FOR are assigned a D, though opportunities to improve can increase this grade assignment. FOR has an average GPCD of 200 over the last 10 years, and a goal of reducing consumption to 160 gallons per capita per day by 2060 (or perhaps 2040). The goal of reducing water demand by 577 AF annually (Figure 12) is desirable as insurance if the final population at build-out reaches 10,301 citizens. If the alternate estimate of 16,411 people is more accurate, the 577 AFY would serve to provide the additional 1,500 AFY of water supply required.
FOR would be especially well positioned to gain access to low-interest-rate SWIFT funds from TWDB if the ambitious water-conservation program is identified as a priority. The advantages would include access to design and development funds at a low interest rate that would be paid back when the water savings were actually achieved.
Recommendation – Pursue the 160 GPCD goal by implementing a water-conservation plan that includes a budget and annual programming to achieve a water-use reduction. Annual GPCD reduction targets should be determined. This report offers a list of specific programming that may be considered. A key recommendation is the creation of a community conservation committee (CCC) of interested citizens to provide public input and help develop the long-term plan.
134
Figure 13. GPCD (2015-2040) and population (2009-2060)
Actions 1. Organize a CCC (or an advisory group of another name) with the stakeholder
representation suggested in the text to provide leadership in organizing the water-conservation program and serve as a communications link to the rest of the community.
2. Prepare a plan that lists the activities to be implemented to achieve the 2 GPCD reduction each year from 2015 through 2040. The GPCD impact expected of each activity should be described to allow for program monitoring. Water-conservation BMPs on the TWDB website describe the amount of water they are expected to save and the cost to save that water.
3. Implement the water-conservation program and a monitoring process so activities can be adjusted if the results are not as expected.
References
1. Article 13.06 Water Conservation Plan from the Fair Oaks Ranch Code of Ordinances, Page 1. This document was provided to Calvin Finch at the December 18, 2014 meeting with Mayor Cheryl Landman, Public Works Director Ron Emmons, and others from FOR and TGRGCD.
2. Ron Emmons provided the winter/summer watering ratio at the December 18, 2014. 3. Information provided by Calvin Finch based on his experiences with SAWS. 4. Calculated by Calvin Finch. 5. Ron Emmons in phone conservation noted that one important decision point was at 2037.
The review of the contract between GBRA and FOR for Canyon Lake Water related many decision points. January 12, 2015.
135
6. Opinion offered by Calvin Finch. 7. Opinion offered by Calvin Finch based on his experiences with various citizens and groups
within FOR on water conservation since 1989. 8. Calculations by Calvin Finch based on the development rules offered in the Article 13.06
Water Conservation Plan, Section 13.06.004. 9. Ron Emmons related the existence of the newly completed automated Meter Reading
system in the December 18, 2014 discussions first noted under #2 in the Trinity Water Source section.
10. Opinion of Calvin Finch after discussions with Ron Emmons, George Wissman, and Mayor Landman at the various discussions held between him and the individuals mentioned (December 18, 2014, January 7, 2015, January 1, 2015).
11. Opinion of James Mjelde based on his experience with water rates and their impact in changing water use.
12. Numbers calculated and graphed by Uyen Truong. 13. Opinions offered by Calvin Finch and other authors based on their experiences with the
water-conservation programming in San Antonio, the Edwards Aquifer Region and the State of Texas.
14. Graywater estimates based on data received by Calvin Finch in his research and promotion of graywater as a water resource.
Drought Management
Overview Grade FOR successfully uses surcharges as a drought-management tool but could benefit by adding drought enforcement. Drought-restriction rules can be more effective with added education to the community.
C
Description FOR is well positioned with its water supply compared to water demand. Even at GPCD of 207, FOR has enough water to meet its needs in 2040 and beyond when it reaches its fully built-out status under the regime predicted in the 2011 AECOM Study.1 Unfortunately, droughts regularly occur in the area, and a water emergency due to infrastructure failure, contamination, and other concerns are possible. It is best for a well-governed community to have a drought/emergency-management plan in place.
FOR has a unique and relatively complex drought-management system. The main enforcement tool is an escalating surcharge system.2 The city has, however, also imposed a once-per-week sprinkler-irrigation limitation and other water-saving activities.3 Once-per-week watering is allowed with sprinklers on a day of the week based on address. FOR officials report the once/week requirement and enforcement combination has not appeared to reduce overall water use, as expected.4 Officials are more positive about the three-stage drought-management program that relies on rate surcharges as outlined below (Ordinance Section 13.03.117):4
SRP Grade Validation and Adjustment
☒ Grade is reasonable
within one letter grade variance
☐ New information was
provided and warrants adjustment of two or more letter grades
☐ Grading of issue is not
appropriate or not enough information is available to warrant grade assignment
136
Stage 1 Drought-management restrictions are imposed when two of the following three conditions are met:
The static level in the observation well reaches 1,045 feet above mean sea level (MSL) for 15 consecutive days.
The system’s average daily consumption of Trinity Aquifer groundwater exceeds 1.2 million/gallons for the same 15 days.
GBRA institutes Stage 1 water-reduction requirements. The goal of imposing Stage 1 drought restrictions is to reduce Trinity Aquifer water use to levels below 1.2 million gallons for 30 days. Supply management measures include:
Implementing a surcharge on all water used over 25,000 gallons.
Banning commercial car washes using non-recycled technology
Reducing water-main flushing to a minimum level required to maintain quality standards.
Stage 2 Declared when two of the three conditions below are met:
Static water level in the observation well reaches 1,030 feet above MSL for eight consecutive days.
Trinity Aquifer water use level reaches 700,000 GPD for the same eight consecutive days.
GBRA implements Stage 2. The goal is to reduce total water use and reduce Trinity Aquifer groundwater use to below 700,000 gallons/day for 30 consecutive days. Supply management measures include:
Implementing a surcharge on all water over 18,000 gallons per billing period
Limiting water use from fire hydrants to firefighting and other health-safety activities
Banning ornamental-fountain use
No sale of bulk water
Stage 3 Restrictions imposed when one of the following three conditions is met:
The static water level reaches 1,015 feet above MSL.
Any time that the city’s Trinity wells are falling at a rate to prevent pumping of 1.2 million GPD for seven consecutive days.
Prohibiting all non-essential water uses as defined in the definitions except hand watering of household shrubs
Limiting golf-course irrigation to recycled water from FOR utility treatment plant
Issuing moratorium on new landscaping or construction of new swimming pools
No approval of application of new or expanded water-service connections
Possibly installing water-flow restrictors on customer meters
Retaining surcharge imposed in Stage 2 It is a misdemeanor to violate these provisions. Conviction will result in a fine. In addition to the severity of the surcharge, the key to the effectiveness of drought-management restrictions in an emergency is ratepayer cooperation and the strength of the enforcement.5 In Stage 1, the monthly surcharge is $5/1,000 gallons for water use of 25,000 to 40,000 gallons with increases to $12.50/1,000 gallons for water use over 100,000 gallons. In Stage 2, the monthly surcharge increase starts at 18,000 gallons. The surcharge is $30/1,000 gallons for use over 100,000 gallons. In Stage 3, the surcharge stays the same as the charge for Stage 2.5 Although the surcharges do not seem severe enough to reduce water use to
137
levels enough to accomplish the goals described for each stage, city officials report the surcharges were, in fact, effective.5 Officials also reported that the imposing and enforcing the once/week watering was not effective in reducing water use.4
Considerations It is important FOR have an effective drought- and emergency-management scheme. If FOR is subjected to a severe drought or infrastructure emergency, the actions to reduce water use are required. The following are some suggestions to consider:
An in-depth review of the drought-management scheme by the new CCC (See the Water Conservation Section above).
Simplify the rules so everyone understands them, buys into them, and understands they will be enforced.
Review surcharge amounts to ensure they are high enough to make it likely that water use will be reduced rather than just increasing revenues.
Review the mechanism of enforcement. COSA uses certified police officers working part-time to enforce drought restrictions, which may be a consideration.
The availability of the automated meter-reading system may offer an enforcement strategy assuming available staff in real time. It would be useful to review the response of ratepayers to the once/week sprinkler-irrigation limitation. Data collected through the AMR system should be able to show individual compliance and particularly the weekend reduction that should be easily detectible.
Grade Assessment The drought-management plan for FOR is assigned a C. City officials have reported less-than-acceptable results with the restriction tools, but are more satisfied with response to the surcharges. The surcharge program works well to reduce water use in drought situations but would be less effective in other types of water emergencies, such as infrastructure or contamination emergencies, where supply is drastically reduced. The city needs to use its new AMR system to assess why its drought-management rules and enforcement have not been effective so they can be modified to serve the city in other types of water emergencies. The restriction portion of the drought-management effort also needs to be made more functional.
Recommendation – One of the priorities for a CCC is to review FOR’s drought-management plan. The plan is very complex; however, it has features that have been successful in reducing short-term water use in other cities. The suggestion is to develop citizen support for a simplified plan and enforcement mechanisms.
Actions 1. A priority for the committee is to review the rules and enforcement mechanisms of the
restriction portion of the drought-management rules to simplify them and make them more effective as protection for emergencies involving infrastructure failure or a contamination event.
2. Organize and implement an education program to familiarize FOR citizens with the simplified drought-restriction rules. The education effort will be a natural progression after the input collection and communication exchange to develop the new rules.
References 1. Reem Zoun and David Parkhill. Kendall County and the City of Fair Oaks Ranch Water and
Wastewater Planning Study, February 2011. Prepared for Guadalupe-Blanco River Authority in association with Texas Water Development Board by AECOM. Page 1-1 for 2009 population and Page 2-4 (Table 2.2) for 2040 population estimate.
138
2. Article A 9.000 Water charges from the FOR Code of Ordinances provided to the authors by the attendees of a January 7, 2015 meeting.
3. Article 13.06 Water Conservation Plan from the FOR Code of Ordinances, Page 1. This document was provided to Calvin Finch at a December 18, 2014 meeting with Mayor Cheryl Landman, Public Works Director Ron Emmons, and others from FOR and TGRGCD.
4. Ron Emmons opinion offered at December 18, 2014 between the authors, the Mayor Landman, George Wissman, FOR water staff, and TGRGCD Board Members and staff.
5. Rate and Surcharge information is provided by Article A9.000 Water Charges from the FOR Code of Ordinances provided by Ron Emmons at the January 7, 2015 meeting. The opinion on surcharge impact is offered by Calvin Finch based on his experience in drought restriction enforcement.
Lost/Non-revenue Water
Overview Grade FOR manages lost/non-revenue water well with an average monthly rate of 7.8%. It also sources the loss between line flushing and an estimated calculation of leaks.
A
Description Every water purveyor has an amount of water that is lost or used for non-revenue producing activities. This amount is expressed as a percentage where the difference between the water pumped and purchased, and the water sold is divided into the water pumped and purchased. There is much discussion in how much lost water is acceptable and how much is excessive. Large, complex water systems want the characteristics of the system considered when lost water is calculated. A water purveyor with long stretches of distribution pipes, multiple wells or entry points, many connections, and other complications, would naturally have a higher lost-water rate than a simpler, modern system for a recently planned community.
TWDB requires all water purveyors with 3,505 or more connections to complete a water-audit report.1 The report is also required for any water entity using state funding. Water purveyors with a lost-water rate higher than the rate allowed for a system of the complexity completing the audit must use some of the funds being requested to reduce the lost-water level. It is generally accepted by water industry that a lost-water rate of 10% or less is excellent and a rate of 15% or more merits action to correct the problems. A community losing a large portion of its water supply to a lost-water source needs to address the issue.
The first step in understanding the lost/non-revenue water is to calculate a gross figure by comparing water pumped (Trinity Aquifer) and received (Canyon Lake) to water that is actually paid for by system ratepayers. The next step is to determine where the non-revenue water is going: leaky distribution lines, inaccurate pumping data, firefighting water, stolen water, unmetered water, inaccurate consumer metering, line flushing, inaccurate bookkeeping, forgiven water bills, or various other categories. Only when the lost-water contributing factors
SRP Grade Validation and Adjustment
☒ Grade is reasonable
within one letter grade variance
☐ New information was
provided and warrants adjustment of two or more letter grades
☐ Grading of issue is not
appropriate or not enough information is available to warrant grade assignment
139
and amounts are identified can it be determined how much it will cost to reverse all or part of the losses. In some cases, all or a portion of the lost water will be tolerated because it is not sound business management to spend the money required to correct the situation. In all cases, however, the amount and source of the non-revenue water should be identified and quantified so that the problem can be corrected if it does make business sense.
Considerations With 2,698 connections, FOR is not required to prepare a full-scale lost/non-revenue-water determination for TWDB to consider, but the city is conscious of the issue and makes regular calculations to help identify any problems related to lost water.2 The city produces a non-revenue-water percentage every month by recording water used in dead-end flushes, random flushes, and water purchased for construction projects. To this total, FOR adds an estimate for the volume of water lost through broken water-main leaks. The average total is 7.8% per month.2
Grade Assessment FOR has given the question of lost water considerable attention; therefore receiving a high grade. The attention makes it possible for the city to closely manage this important source of water supply. The low rate of lost/non-revenue water achieved by the city will make it easier for city leaders to ask area residents to launch an equally effective water-conservation effort.
Recommendation – Continue to manage the lost/non-revenue water effectively. It is not always easy to use a lost-water rate as an education and confidence-building tool, even where it is as low as the rate in FOR. However, the effort should be worth it to encourage more water conservation and raise confidence levels in the city’s water-management effort.
Actions 1. Continue to manage the lost/non-revenue water levels effectively as displayed today and in
years past. 2. Expand the effort to educate FOR residents and policymakers about the success in
managing this water source. The confidence gained in the effort will be useful for addressing other demanding water issues as they occur. There is similar value to be gained by educating neighboring communities about the success and techniques that FOR uses in managing lost/non-revenue water.
References 1. Water Loss Audit, Texas Water Development Board,
http://www.twdb.texas.gov/conservating/municipal/waterloss/. The web item describes that a water purveyor must have 3300 connections to be required to prepare an audit annually even if they do not have a financial obligation to TWDB.
2. Christine Picioccio, FOR Public Utility, email communications on February 17, 2015, April 10, 2015, April 16, 2015 City of Fair Oaks Lost Water Determination.
Water Quality Relationships with Neighboring Communities
Overview Grade FOR cooperates on ETJ and other issues with San Antonio but needs to pursue the idea of an interconnection. There is considerable room for increasing the relationship with Boerne and Comal and Kendall counties to protect the Trinity Aquifer resource.
C
Description FOR cooperates on ETJ and other issues with San Antonio, but it needs to pursue the idea of an interconnection. There is considerable room for increasing the relationship with Boerne and Comal and Kendall counties to protect the Trinity Aquifer resource. The basis for fostering these relationships includes good communication with COSA and neighboring communities.
City of San Antonio – FOR and its large neighbor to the east and south, San Antonio, work closely with TGRGCD on Trinity Aquifer issues.
Considerations
The water-policy study is jointly sponsored by the two cities and is linked to cooperation concerning an ETJ issue. The arrangement that has SAWS buying surplus Western Canyon water until FOR and other area communities need it is also an example of cooperation between the two entities.1 Based on the history of cooperation, FOR may consider creation of a wholesale interconnection between FOR water lines and COSA lines. Such a relationship is dependent on demonstrating the value of such a partnership to both parties. It should also be noted that FOR provided an interconnect for SAWS at Village Green at no cost.2 COSA relies on the Edwards Aquifer for the majority of its supply. It also has Carrizo water and is soon to have treated brackish groundwater. COSA’s water supplies are very different from the FOR supply. The interconnect would provide FOR a diversified source for backup in case of problems in one or both of its current supplies.
The promise of access to FOR’s Canyon Lake and Trinity Aquifer water supplies may not be as important to San Antonio as the connection is to FOR, but there are other issues important to the San Antonio that could be addressed as part of the cooperative interconnect agreement. A significant portion of the rain that falls over the Trinity Aquifer recharge area eventually recharges the Edwards Aquifer.3 The two cities could find value, for example, in reaching agreement on land use to govern development and even conservation easements within the cities’ boundaries and in the region.
Boerne, Comal and Kendall Counties The 2011 AECOM Water and Wastewater Study treats the FOR Trinity Aquifer water supply as if it were an uniquely FOR source, unaffected and unrelated to any other communities’ water use. It is, of course, not in that category. The Trinity Aquifer is under pressure as a water source throughout its range.4 Population growth and Trinity water pumping in Kendall and Comal counties is especially important to the reliability of FOR supply.4 As was noted in the
SRP Grade Validation and Adjustment
☒ Grade is reasonable
within one letter grade variance
☐ New information was
provided and warrants adjustment of two or more letter grades
☐ Grading of issue is not
appropriate or not enough information is available to warrant grade assignment
141
Trinity Aquifer supply section of this analysis, the Trinity Aquifer “is the most stressed water source in the area.”5
Recognizing the interdependence of communities and other pumpers that rely on the Trinity Aquifer as a water source, nine groundwater districts formed the Hill Country Alliance of Groundwater Districts in 2001. Some of the parties expected the group would eventually evolve into an EAA-type of entity. The Hill Country Alliance did receive a grant of $450,000 to support nine monitoring wells but beyond that, joint action seems limited. In 2008, the last vestiges of cooperative action occurred after disagreements arose against the CCGCD permitting rules.5
SAWS reduces use of its Trinity sources during drought, which allows other pumpers to better rely on the challenged resources.6 Boerne, the rest of Kendall County, and Comal County are growing at a fast rate. Boerne has several supply sources, but the unincorporated areas rely almost entirely on the Trinity Aquifer. The new developments and even the existing Trinity water pumpers cannot be expected to switch to other water sources during drought like SAWS does further south.
Considerations
It is important that area Trinity Aquifer pumpers revisit the idea of close cooperation to protect the Trinity Aquifer. FOR would benefit from strengthening relationships with Boerne, the rest of Kendall County, and the Comal County areas that rely on the Trinity Aquifer with the goal of working together to jointly protect this important water source. The discussion may be sponsored, or under the auspices of the CCWCD and TGRGCD, but such a discussion is essential so the parties can work more closely together to manage their Trinity Aquifer resources. HB 2407 passed in the 2015 Legislative session so a new Comal-Trinity GCD will now be a player in managing Trinity Aquifer water resources.7
Grade Assessment The relationship with neighboring communities was assigned a grade of C. The Trinity Aquifer is identified as the most challenged water-supply source in the state because of the area’s population growth and aquifer’s geology.
FOR is a relatively small community that has done a good job of projecting its future water needs and obtaining the resources required. Its task now is to protect the water sources that have been identified to meet its needs. Key relationships in that quest are with COSA and with Boerne, Comal County and the rest of Kendall County. These four areas have major influence over the integrity of Trinity Aquifer and even Canyon Lake water.
Recommendation – FOR should pursue cooperation with SAWS to share an interconnection as part of an agreement to better protect both the Trinity and Edwards Aquifer recharge zones. The agreement should include consideration of COSA’s annexation plans for areas near FOR and their effect on FOR. Equally important, FOR officials must interact with Boerne, Kendall County, Comal County, CCGCD and other entities involved in the growth of population over the Trinity Aquifer, both for water-quality and water-quantity concerns. It is essential the entities mentioned work under some formalized structure to coordinate mutually beneficial policies to protect all parties relying on the Trinity Aquifer.
Actions 1. Continue communication with COSA to reach agreement on the completion of a water
interconnection to provide both entities back-up water insurance. 2. Express willingness to work with San Antonio on better protecting Trinity and Edwards
Aquifer recharge water through a two-city or regional examination of EARZ-development
142
rules, contributing-zone rules, and cooperation on meeting ETJ infrastructure needs, either as part of an interconnection or apart from it.
3. Confer with TGRGCD leadership to extend an invitation to the City of Boerne, Kendall County, Comal County, and the CCGCD to discuss issues important to protecting the Trinity Aquifer and other water sources affected by the separate and joint actions of the parties involved. It would be desirable to seek formal agreements on how to jointly address the issues.
References 1. Canyon Lake, SAWS website at www.saws.org. Relates the relationship between SAWS
and its purchase of water prior to the smaller purveyors taking their full contracted quantity. 2. Mayor Cheryl Landman, FOR Mayor, Q&A Meeting with FOR and TGRGCD officials at
FOR offices on December 18, 2014. Information on the Village Green interconnect provided by Mayor Landman in July 2015.
3. Gregg Eckhardt, “The Trinity Aquifer,” The Edward Aquifer website, http://www.edardsaquifer.net.html.
4. Robert Mace; Ali Chowdhury; Roberto Anaya; Shao-Chih (Ted) Way. Groundwater Availability of the Trinity Aquifer, Hill Country Area, Texas: Numerical Simulations through 2050. Page 2. September 2000. Texas Water Development Board.
5. Greg Eckhardt “The Trinity Aquifer,” the Edwards Aquifer website, http://www.edwardsaquifer.net. Page 6.
6. San Antonio Water System 2012 Water Management Plan. Page 25. www.saws.org. The 2009 Plan did not consider the Trinity as a firm supply. The 2012 Plan considers it firm for 2000 AF of the 8000 AF of water available in an average rainfall year.
7. Ron Emmons, FOR Public Works Director, email communications, March 11, 2015.
Trinity Glen Rose Groundwater Conservation District
Overview Grade The cooperation between the city and TGRGCD is close. The two entities should review TGRGCD fees and the city’s relationships with other Trinity-Aquifer stakeholders.
B
Description The Trinity Glen Rose Groundwater Conservation District (TGRGCD) was created by the legislature in 2001 and was confirmed by area voters in 2002.1 Its purpose is to develop and implement regulatory, conservation, and recharge programs that preserve and protect the underground water resources in the district.2 In the legislation, TGRGCD was charged with responsibility for Trinity Aquifer resources in northern Bexar, north of Highway 1604 to the Medina, Bandera, and Kendall County lines.3 Based on an election in 2004, the citizens of FOR decided that TGRGCD is responsible for the territory within the entire boundaries of the city, even that portion in Kendall County and Comal County (Figure 14).4 TGRGCD legislation was written to benefit existing Trinity pumpers in the jurisdiction both by well spacing and other requirements, such as water costs. Existing pumpers were grandfathered and FOR and other municipal pumpers whose Trinity water use is less than 50% of their total water use, do not need to pay the aquifer fee for water used.4
TGRGCD is a small district with limited income and staff. Among the services it offers to FOR residents are residential water use surveys (audits). The surveys are not in high demand.4 TGRGCD staff also reports they maintain close relationships with the CCGCD, District 9 Water Management Area and the Region L Water Planning District.4 TGRGCD also has close relationships with FOR and SAWS.5
Considerations FOR benefits now and could benefit further by a close working relationship with TGRGCD. Because of the importance of Trinity Aquifer water to FOR’s supply, it is essential the city’s interests be represented in the Trinity pumping areas in Bexar County where TGRGCD is responsible. TGRGCD can also help protect FOR’s interests in the CCGCD area and in the respective water-planning and management regions. Toward the end of protecting Fair Oak Ranch’s interests, the city needs to maintain an active presence on the TGRGCD Board. The city may also want to consider the TGRGCD funding situation. Would FOR benefit by a more powerful TGRGCD organization that would result if FOR, SAWS, and other municipalities benefitting from the “under 50% rule” were paying for use of Trinity water?6 A better funded TGRGCD may better represent FOR’s interests in the various entities and fields described in the report.
SRP Grade Validation and Adjustment
☒ Grade is reasonable
within one letter grade variance
☐ New information was
provided and warrants adjustment of two or more letter grades
☐ Grading of issue is not
appropriate or not enough information is available to warrant grade assignment
144
Grade Assessment FOR has an excellent relationship with TGRGCD, meriting a B. The groundwater district is important for its role in helping protect the FOR water sources, particularly the Trinity Aquifer. TGRGCD has regulatory authority over Trinity Aquifer water resources within FOR boundaries. The district also represents FOR’s Trinity Aquifer interests in many important situations, including cooperation with CCGCD and COSA. It is important for FOR to review the Trinity Glen Rose administrative situation toward a determination whether it is in the city’s interest to strengthen the conservation district’s administrative capabilities with extra funding.
Recommendations – FOR should consider actions that strengthen TGRGCD’s ability to represent FOR’s water-supply interests with CCGCD, SAWS, Boerne and other Trinity-Aquifer stakeholders. It seems reasonable FOR officials (with citizen input) to weigh the advantages that would result if TGRGCD fees were paid.
Figure 14. TGRGCD district boundaries7
145
Actions 1. Review the capabilities of TGRGCD in terms of its ability to represent FOR’s water interests
and contribute to the city’s water security. 2. Begin discussion and improve the situation if it is determined that an increase in funding or
status would make them more effective.
References 1. TGRGCD Rules Chapter 1. Available on the TGRGCD website at
www.trinityglenrose.com/. 2. HB 2005 the legislation creating TGRGCD in 2001. The document was provided to Calvin
Finch in a meeting with TGRGCD General Manager George Wissman on January 7, 2015. 3. Ibid. Page 2. 4. George Wissman, TGRGCD General Manager, in a meeting on January 7, 2015 at his
office with Calvin Finch. Date of election correction provided by Mayor Landman, June 4, 2015.
5. In the opinion of Calvin Finch based on his interaction with both water purveyors. 6. The “50% rule” makes it possible for FOR and other water purveyors to escape paying
TGRGCD fees as long as Trinity Aquifer water makes up less than 50% of their total water use.
7. Map provided to Calvin Finch in a meeting with TGRGCD General Manager George Wissman at a meeting on January 7, 2015.
Texas Water Development Board Overview Grade
Officials should stay involved with TWDB programming and pursue available funding. The value is to be able to influence TWDB policies when possible.
B
Description The Texas Water Development Board (TWDB) is the state’s primary water planning and financing agency. TWDB has three main responsibilities: (1) collect and disseminate water-related data, (2) plan for the development of the state’s water resources, and (3) administer cost-effective financing programs.1 TWDB mission is “to provide leadership, planning, financial assistance, information and education for the conservation and responsible development of water for Texas.”1 TWDB is a state agency with responsibilities important to FOR’s efforts to include:
Responsible for the production of a state water plan and support for regional planning efforts used to construct the state plan. Local water projects must be included in the regional plan to be considered for funding from the TWDB.
TWDB specifies the method that water purveyors must calculate lost and non-revenue water and collects the information. Lost/ non-revenue water over a specified amount must be addressed before TWDB funds can be used.
TWDB specifies that each water purveyor must have an approved water-conservation plan before any funding can be considered.
SRP Grade Validation and Adjustment
☒ Grade is reasonable
within one letter grade variance
☐ New information was
provided and warrants adjustment of two or more letter grades
☐ Grading of issue is not
appropriate or not enough information is available to warrant grade assignment
Funding sources available through TWDB include the Texas Water Development Fund, the Water Research Grant Program, and State Water Implementation Fund for Texas (SWIFT).
SWIFT Funds for Water Supply Projects
House Bill 4, passed by the Texas Legislature in 2011 and approved by voters as Proposition 6 in 2013, made provision for a $2 billion SWIFT fund. This money will be available for low-interest, flexible-term loans for water-resource projects. At least 20% of the funding is reserved for water-conservation or reuse projects, and another 10% is reserved for rural projects.2 The legislation did not provide a specific definition of a water-conservation project. A popular definition of water conservation is to “make new water resources available through practices and technology that allow activities that use water to be completed at current levels with less water.”2 A definition of “rural” is referenced in the legislation. 3 Rural political subdivision means:
A non-profit water supply or sewer service corporation, district, or municipality with a service area of 10,000 or less in population or that otherwise qualifies for financing from a federal agency.
A county in which no urban area exceeds 50,000 in population.” 2
To be considered for SWIFT funding, water-resource projects must be sponsored by a local government or public water purveyor and must already be in the current state water plan, which is made up of regional plans.
SWIFT funds are available to water purveyors and local governments as a loan, not a grant; the money must be repaid. The assistance is desirable in many situations, however, because the interest rates will be low and the terms flexible. TWDB created rules based on input from regional water-planning groups for prioritization of the water-resource projects for funding. TWDB also considers projects funding based on whether they serve a large population, provide regional needs, or provide a high percentage of the water-supply needs, to name a few.4 In addition, TWDB must also consider other criteria such as local contribution to finance the project, financial capability of the applicant to repay the provided funding, and other factors.5
Considerations
As the primary state agency involved in water planning and water resource funding, TWDB is very important to water security. Water planning officials should stay informed of and provide input regarding TWDB policies when possible to improve the ability to use services provided by TWDB. Support should also be given for the appointment of TWDB board who are cognizant of the greater San Antonio area water-supply issues. Funding availability from TWDB could be an issue given the complexity and cost of water-supply projects as well as competition for available funding resources.
Policies that affect funding availability to water purveyors are also important and should be pursued. Policies that reward strong conservation programs as a prerequisite for receiving TWDB funds encourage successful conservation programs. Policies that reward water resource innovations, such as brackish groundwater desalination, aquifer storage and recovery, and direct recycling, are also desirable. A mobilized and strategic effort related to TWDB resources, including SWIFT, would be worth the investment of staff time in leveraging resources.
Grade Assessment
TWDB is the vehicle for state funding resources and its funding levels and policies are important to FOR water supplies. These funds allow water purveyors to pay low interest rates
147
and often delay the payback period until the project funded can begin paying for itself. TWDB funds used for design and construction contribute to cash flow advantages.
Recommendation – It is important for FOR to maintain continued awareness of TWDB funding opportunities. Emphasizing the requirement for strong water conservation and drought management will benefit the city regarding TWDB funding acquisition.
Action 1. Include a goal in the water plan to consider additional TWDB funding sources.
References 1. Texas Water Development Board website, Mission Statement available at
www.twdb.state.tx.us. 2. Texas Water Code, Title 2, Subtitle C, Chapter 15, Subchapter R, Section 15.992. 3. House Bill 4, Section 15.474(a). Passed in 2011. 4. Ibid, Section 15.437 (c). 5. House Bill 4, Section 15. 437(d).
Texas Commission on Environmental Quality (TCEQ) and Environmental Protection Agency (EPA)
Overview Grade FOR works closely with the agency on its recycled water program. The relationship should be continued to develop a regional water-quality-protection effort.
B
Description The Texas Commission on Environmental Quality (TCEQ) is the state agency charged with environmental regulation and enforcement. Its mission includes a wide range of responsibilities; however, two areas of jurisdiction most relevant:
Regulation of water-utility operations, including water quality as delivered to consumers
Regulation of environmental water quality, including quality of treated wastewater discharged to receiving water bodies
TCEQ frequently acts as a state-level delegate for the U.S. Environmental Protection Agency (EPA). Critical federal laws relevant to the two regulatory jurisdictions named above are, respectively, (1) the Safe Drinking Water Act (SDWA), originally passed in 1974 and amended multiple times since, and (2) the Clean Water Act (CWA), originally passed in 1972 and also amended on multiple occasions. FOR’s present water-supply operations are incompliance with SDWA requirements.1 State and federal laws and regulations relevant to CWA and SDWA issues have been relatively constant for several years. Progressive implementation of existing law and regulation has
SRP Grade Validation and Adjustment
☐ Grade is reasonable
within one letter grade variance
☐ New information was
provided and warrants adjustment of two or more letter grades
☒ Grading of issue is not
appropriate or not enough information is available to warrant grade assignment
N/A
Justification: No historical efforts for city in addressing CECs, which prevents a grade assignment based on previous performance.
occurred recently, but not additions of new concern. A typical example of the gradual nature of these processes is the groundwater rule first proposed by EPA in 2000, finally promulgated by EPA in 2006, and adopted for implementation by TCEQ in 2012.2 TCEQ, in its current strategic plan, maintains the position that “government should be limited in size and mission”, which relevant to the CWA and SDWA emphasizes gradual implementation and efficiency improvements in regulatory activities, as well as technical assistance to water utilities for compliance. In other words, the agency does not express interest in expanding regulatory reach.3
Considerations The potential for future regulatory requirements could be quite costly. One potential area to consider and remain aware of are “Contaminants of Emerging Concern” (CECs) in both drinking water and environmental waters. CECs include a wide range of substances: pharmaceuticals, antibiotics, industrial chemicals, food additives, and others; and are hypothesized to have a wide range of effects on human and animal health, including disruption of endocrine systems and inducement of antibiotic resistance. The primary distinguishing feature of CECs is their low levels of concentration when detected, typically on the order of “micrograms per liter” of water. Concentrations are roughly 1,000 times less than traditional contaminants measured in “milligrams per liter.” Recognition of CECs is largely due to improved laboratory testing. It is known, however, that existing water and wastewater treatment technologies are often ineffective at removal of CECs with better removal techniques accompanied by higher costs (e.g., reverse osmosis and ozonation).4 Research is being conducted to assess the effects of CECs on human and environmental health as well as the introduction, transport, and fate of these substances in the environment5, and use of appropriate technologies for CEC removal.6 EPA is currently engaged in CEC research through its “Endocrine Disruptor Screening Program” (EDSP).7 We predict that regulatory action in Texas under SDWA or CWA authority is unlikely in the next 10 years due to (1) uncertainty over human and environmental health effects of CECs, (2) uncertainty over effective technologies for CEC removal, and (3) gradual nature of regulatory implementation by TCEQ. FOR should monitor this field of knowledge on a regular basis to anticipate and prepare for any regulatory changes that may eventually occur.
Grade Assessment TCEQ is responsible for the regulation of water utility operations and regulation of environmental water quality and is the state level delegate for the EPA. . Compliance with SDWA or CWA regulations can be challenging.
Recommendation – We recommend FOR continues to monitor developments regarding “Contaminants of Emerging Concern” and research findings. SAWS is currently working with the EPA, for example, to evaluate the contaminants of emerging concern at select potable water pumping stations and wastewater treatment plants. Communication with SAWS also would be beneficial.
Actions 1. Review TCEQ and EPA programming in the same manner as described for the TWDB to
ensure FOR is aware of current programs and proposed programs to enable issues to be proactively addressed.
References 1. Mayor Cheryl Landman in email correspondence to authors in April 2015.
149
2. Texas Commission on Environmental Quality (TCEQ). 2014b. “History Page: Chapter 290 Public Drinking Water.” http://www.tceq.state.tx.us/assets/public/legal/rules/rules/pdflib/290_his.pdf (Accessed February 18, 2015).
3. Texas Commission on Environmental Quality (TCEQ). 2012. “Strategic Plan: Fiscal Years 2013-2017.” SFR-035/13.
4. U.S. Environmental Protection Agency (EPA). 2010. “Treating Contaminants of Emerging Concern: A Literature Review Database.” EPA-820-R-10-002.
5. Sources below: a. Glassmeyer, S.T. 2007. “The Cycle of Emerging Contaminants.” Water Resources
Impact 9(3), 5-7. b. U.S. Geological Survey (USGS). 2014. “Emerging Contaminants In the Environment.”
http://toxics.usgs.gov/regional/emc/ (Accessed February 18, 2015). 6. Sources below:
a. A. Encinas, F. J. Rivas, F. J. Beltran, A. Oropesa. 2013. “Combination of Black-Light Photocatalysis and Ozonation for Emerging Contaminants Degradation in Secondary Effluents.” Chemical Engineering & Technology 36(3), 492-499. doi:10.1002/ceat.201200311.
b. M. Ibanez, E. Gracia-Lor, L. Bijlsma, E. Morales, L. Pastor, F. Hernandez. 2013. “Removal of emerging contaminants in sewage water subjected to advanced oxidation with ozone.” Journal of Hazardous Materials 260, 389-398. doi:10.1016/j.jhazmat.2013.05.023.
c. T. Wintgens, F. Salehi, R. Hochstrat and T. Melin. 2008. “Emerging contaminants and treatment options in water recycling for indirect potable use.” Water Science & Technology 57(1), 99-107.
7. Endocrine Disrupter Screening Program (EDSP). US Environmental Protection Agency Website. http://epa.gov/oscpmontoscpendo/pubs.edsp.
Water Cost
Rates and Impact Fees Overview Grade
FOR should look at its rate structure in terms of system expenses and water-use goals. Examine the water-pricing structure taking into account marginal cost pricing, scarcity value of the water, economic efficiency, and other city goals.
C
Description A notable characteristic of the water rates in FOR is the difference between residential and commercial rates. Both water-fee categories include a service fee based on meter size (Figure 15).1 Wastewater fees are set on a monthly basis (Tables 18-19).1 A reasonable set fee as opposed to a volumetric fee for wastewater treatment may reflect administrative ease and the efficiency of the recycled water program. If FOR wanted to convert to a volumetric charge, the new AMR system would make that relatively easy.2
SRP Grade Validation and Adjustment
☒ Grade is reasonable
within one letter grade variance
☐ New information was
provided and warrants adjustment of two or more letter grades
☐ Grading of issue is not
appropriate or not enough information is available to warrant grade assignment
Current impact fees charged by FOR are presented (Table 19). One estimate of the median price of a single family home in FOR is $396,489.3 Using the impact fee of $6,950 and the median home price, the percentage increase in the price of a home is 1.75%.4 It would be beneficial for FOR to examine its water-pricing structure taking into account marginal cost pricing, scarcity value of the water, economic efficiency, and other goals. Uniform rates that are revenue-neutral to the proposed increasing-block rates would provide higher economic efficiency (see Figure 10).
Considerations The expanded block rate for residential water uses increases significantly as water use increases (Figure 15). The block rates in Figure 15 may be deceiving, however, because the higher monthly rates, ≈$24/1000 gallons, for example, only kick in for water use over 100,000 gallons in a month. The monthly rate for relatively high use of 20,000 gallons is less than $5/1,000 gallons. If FOR would like block rates to reduce water use, the rate will likely have to increase for lesser amounts of water. The city may actually be achieving water reduction with its drought-management surcharge imposed to reduce water use during a drought emergency.5
The rate structure is sympathetic to commercial ratepayers (Figure 15). There may be an economic development policy decision reflected in the low and steady rates for commercial customers. It is recommended that FOR re-evaluate that policy to ensure its appropriateness and because more similar rates between residential and commercial ratepayers would likely facilitate the launch of a water-conservation program. The impact fees are reasonable, as long as they cover all infrastructure costs and meet the needs of the community.
Residential and Commercial Volumetric Water for Fair Oaks Ranch
Figure 15. Monthly residential and commercial volumetric water rates for Fair Oaks Ranch
151
Table 18. Fixed monthly service charge ($) for Fair Oaks Ranch
Fixed Monthly Service Charges (dollars) for Fair Oaks Ranch, 3/4 Meter
Grade Assessment Residential customers pay water rates based on an increasing-block rate. The rates represented in the blocks increase from approximately $3.50 per 1,000 gallons at 10,000 gallons of water to approximately $23.75 per 1,000 gallons for use over 100,000 gallons of use. Commercial rates are charged through an expanded-block rate without much difference between the rates/block (Figure 15). These blocks are close to uniform rates (see discussion on uniform vs. increasing-block rates in the San Antonio section). Please note that approximately 1,100 water customers have individual septic systems and are not charged city wastewater.
There is a connection service charge in addition to the volumetric charge. The service charge when the set wastewater fee is included reaches $96.67/month.
Impact fees are charged for new construction and connections at a rate that appears competitive. There was a major increase in impact fees in 2015 after a review by the staff and City Council. For further discussion on impact fees in general, see the section in San Antonio’s section.
Recommendation – FOR should reassess its rate structure in terms of system expenses and water-use goals. Of particular interest is the justification for the low block rates for commercial customers. Commercial rates may be adjusted to match residential rates.
Actions 1. Review the water rate structure to assure that revenues cover water and wastewater
expenses plus provide funding for desirable programming such as water-conservation activities and participation in regional water-quality protection efforts.
2. Review the rate structure to ensure the increasing rate blocks elevate quickly enough in terms of volume to reduce excessive water use for landscapes. Change the commercial rate structure to provide steeper increases of volumetric rates to comparable to residential rates and to encourage water conservation.
3. Examine water-pricing structure taking into account marginal cost pricing, scarcity value of the water, economic efficiency, and other FOR goals. Uniform rates that are revenue-neutral to the increasing-block rates would provide higher economic efficiency.
References 1. Fair Oaks Ranch Utilities Water and Wastewater Rates.
http://www.fairoaksranchtx.org/index.aspx?NID=228 and How to Read Your Utility Bill. http://www.fairoaksranchtx.org/DocumentCenter/Home/View/456 and arranged in graph and table by James Mjelde.
2. Opinion offered by Calvin Finch. 3. City-Data.com Median home price. http://www.city-data.com/city/Fair-Oaks-Ranch-
Texas.html. 4. FOR Impact Fees. http://www.fairoaksranchtx.org/ArchiveCenter/ViewFile/Item625. 5. Ron Emmons, FOR Public Works Director, Discussion with Calvin Finch, December 18,
2015. 6. Residential and Commercial Volumetric Rates for FOR graphed by James Mjelde.
Other Considerations Water Supply and Demand, 2015-2060 Based on comparison of supply and demand from 2015-2060 (Figure 16), there are two periods of potential water shortage for SAWS to consider. The intersection of the demand and supply curves suggests a water-supply deficit if drought-of-record conditions are experienced on or about 2041 and assuming GPCD is 126. If the GPCD is 135, as it would be under the water-conservation conditions described in the SAWS 2012 Water Management Plan, the deficit potentially could occur as early as 2038.
Two figures illustrate the percentage of the total San Antonio water supply by project and year (2015 and 2060). Both current water supplies (Figure 17, 2015) and projected future water supplies (Figure 18, 2060) assume a normal rainfall year. Efforts to diversify the San Antonio water supply reduce the use of Edwards Aquifer water from 73% in 2015 to 67% in 2060, not including new water projects or projects designed to be used during drought conditions. The percentage of Edwards Aquifer use would be further reduced when new water-supply projects are considered to meet supply deficits (Figure 16). Two important points about projected future water supply need mentioning.
First, future projected supplies (Figure 18) did not include water sources that were contracted for set periods (e.g., Vista Ridge); however, recent planning efforts from SAWS report these contracts would be extended beyond 2060. Under the assumption that water provided by the Vista Ridge Project continues after 2050 through 2080, this would reduce the portion of the total supply provided by the Edwards Aquifer from 67% to 60% of the total supply. It also would contribute up to 50,000 AF (annually) of water available in both drought-of-record and normal conditions, extending the timing of a potential water deficit from 2040 to 2050 (Figure 16). Second, the Twin Oaks ASR also was not included because the Twin Oaks ASR is a supply designated for use in drought conditions (Figure 18). The ASR is more likely to be used to store Edwards Aquifer water during a normal year than it is to be providing water supplies. The water-supply portfolio for SAWS under drought conditions would diversify when Twin Oaks ASR is included.
154
*With normal rainfall, the water-supply deficit appears on or about 2050.
Figure 16. Supply and Demand with MPO Population Estimate, 2015-2060
155
Figure 17. Supply and Demand with MPO Population Estimate, 2015-2060
Figure 18. Total water available for normal year, 2060
156
Legislative and Ordinance Opportunities Late in the 2015 Texas Legislative session, after this Water Policy Analysis report was drafted, legislation addressing some of the opportunities listed this report and other important water-related issues were passed. Four state House Bills (HB) are noted here:
HB 30 did not move responsibility for permitting of brackish groundwater to a state agency, such as the TCEQ, as suggested in the analysis, but it did direct Regional Planning Regions and TWDB to identify zones in specific parts of the state, including the Carrizo-Wilcox Aquifer, where brackish water appears to be a potential water source.1
HB 200 provides the opportunity for entities to appeal DFC decisions by a groundwater conservation district. The legislation requires the DFC decision be backed up by appropriate science. TWDB is charged with the responsibility to complete the study in response to the appellant’s petition.2
HB 1248 allows for automatic renewal of groundwater permits every five years by groundwater conservation district, unless said district has grounds and can defend the decision to deny the permit extension.3
HB 655 addresses issues in the use of ASR as a water storage facility. TCEQ is charged with responsibility for surface water permitting, but no separate beneficial use beyond ASR storage must be declared. Groundwater conservation districts have responsibility for permitting injection and retrieval wells, but charges may only be assessed for water amounts retrieved beyond that amount injected.4
Recommendations for additional state legislation and local ordinances: 1. Pursue legislation to move the responsibility for brackish-groundwater regulation and
permitting to TCEQ, which place a priority on developing this resource/ A segmented permitting process from local groundwater conservation district jurisdiction does not encourage water purveyors to make the large investments necessary to pump and treat brackish groundwater.
2. Pursue legislation to lengthen the time between granting a permit for groundwater supply development and renewal of that permit. Renewal every five years by local groundwater districts is not enough time to encourage water purveyors to make the commitment of resources necessary to develop a water-supply project. The potential to lose a permit after five years is a disincentive for water-supply investments.
3. Consider a San Antonio ordinance change to remove the reward of relaxed EARZ development rules for areas annexed into the city jurisdiction. a. Consideration of an ordinance change to join Austin in banning use of coal-tar sealants
within the ETJ. Research results and arguments on both sides of the issue have been identified.
b. Pursue legislation to allow and initiate required action over the expanded area of the contributing zone.
References 1. House Research Organization bill analysis, May 7, 2015. http://www.hro.house.state.tx.us 2. CGISCAN TXHB200, 2015-2016, 84th Legislature, 84® HB200-Enrolled version.
http://www.legis.state.x.us/tlodocs/84R/billt 3. HB655 House Research Organization. 4/21/15. http://www.hro.house.state.tx.us/pdf/ba84r/1 4. HB1248/SB854. 4/15/2015. http://www.rcgcd.org/allbillsbysubject.pdf.
Science Review Panel Commentary Cities of San Antonio and Fair Oaks Ranch Water Policy Analysis
1 November 2015
The purpose of the Science Review Panel (SRP) was to validate values, assumptions, and methodologies used in the original draft report and offer recommendations so the Sponsor may have a more balanced and objective assessment to use in decision-making. Although we made every effort to incorporate all of the SRP’s suggestions (as per Sponsor direction), focus was placed on water-resource projects, and, given the strict time constraints to complete the water policy analysis, not all of the suggestions could be incorporated. Instead, SRP comments are provided here and throughout the report to offer the reader a broader perspective. Below are the SRP’s findings, categorized and summarized in outline form, followed by a discussion of issues and recommendations. 1. Risk Analyses Metrics
a. Subjective b. Some measures are lacking (e.g., reliability of supply). c. Risk scaling is biased and needs improvement. d. Recommendations:
i. Consider a revised risk metric table that clearly defines the assessment criteria and assumptions.
ii. Apply methodology in determining risk values consistently to all projects. iii. Review SRP supplemental assessment as example (see Appendix B).
Risk Analyses Overview.—The purpose of the Risk Analysis was to provide guidance for decision-making while considering factors associated with water-resource projects. The report defined “risk” as characteristics of water-supply resources that expose the supply to some degree of unreliability, threat, or challenge. A numerical “risk” value was developed to estimate degree of unreliability, threat, or challenge for that water resource. Each water resource assessment included a (1) risk analysis “score card,” (2) project overview and description, (3) project considerations, (4) grade assessment (to include suggested recommendations and actions), and (5) source references. In the original draft, risk characteristics viewed as “low risk” were assigned a negative value (-); those with a “medium risk” were assigned a 0; and those viewed as “high risk” were assigned a positive value (+). The summation of -, 0, and + resulted in a total “risk” value. Projects with an overall negative value were considered low risk. Projects with a 0-1 value were considered medium-risk resources. Finally, projects with a positive value >1 were considered high-risk resources. Five SRP members reviewed the Risk Analysis and determined the following: Subjective.—Reviewers noted the subjectivity of risk measures within the original report. In terms of the Risk Analysis metrics, a member summarized the concern of the metrics used in the following way: “To define the metrics is to define the ranking that will result. Therefore, to provide decision-makers with a basis for judging alternatives—and indeed that is the goal (not to make a decision for them)—other sets of metrics would be highly recommended.” The SRP also noted that many of the “risk” measures were not in fact directly representative of project risk but rather uncertainty or reliability of supply. Risk is defined as “the probability of an unwanted event or unintended consequence.” In consideration of this, it is unclear how the level of water
160
treatment required, for example, is a “risk” as all water projects require some level of treatment prior to public consumption, and those necessary treatments are typically known or certain. Inappropriate Metrics.—Although one reviewer believed the metrics used in the risk analysis were appropriate for an assessment of potential water resources for COSA, the majority (4 out of 5) of the SRP believed metrics used in the study were somewhat limited in assessing and ranking water projects related to “risk.” Risk is certainly a consideration for decision-makers to weigh when making decisions about future projects. The majority of the SRP believed the study did not include critically important project evaluation metrics directly, such as reliability of supply and costs, and/or regulatory certainty. The SRP noted metrics of questionable or marginal relevance in the draft report included (1) distance from source (e.g., pipeline length, which is already encompassed in the cost factor), (2) assumptions made in measuring contamination threat, and (3) use of the number of regulatory agencies as an indicator of regulatory certainty, to name a few. Instead, the SRP suggested alternative metrics for the citiesto consider: (1) reliability of a measured supply, (2) regulatory certainty, (3) contamination threat to source water, and (4) cost certainty. The original report did not directly use or clearly define these measures. The SRP believed a measure of reliability of supply or water resource certainty was inadequately addressed in the report. Sample “uncertainty” measures were developed and, in one case, applied to illustrate how future water policy analyses can be improved (see Report Appendix B). Rating Scale.—With respect to the risk ranking system used in the report, the majority of the SRP (4 out of 5) noted a three-point scaling system (-, 0, +) did not allow for meaningful differentiation for ranking and prioritization purposes. One SRP member suggested the authors’ recommendations were reasonable and captured many of the essential issues related to evaluating numerous and varied water-supply projects; however, this member also suggested the scale was a little unusual in the use of negative, zero, and positive numbers to represent low, medium, and high risks, with medium risk basically carrying no weight. The SRP uniformly agreed (5 out of 5) the report did not identify the basis for assigning a project a -, 0, or + and suggested an explanation of how the negative, zero, and positive numbers were assigned would improve the report. For example, in the measure Distance of Source, it is unclear why a +1 is assigned for 30-100 miles and +2 assigned to projects >100 miles. A rationale for the categories or ranges used in assigning values is needed. The SRP majority (4 out of 5) suggested future water project assessments ideally use 4-5 point scales enumerating the basis for risk assignment to yield better dispersion than 2-3 point scales. A five-point scale also would allow for a more discriminating analysis of risk or uncertainty. A SRP member commented that assigning a risk factor of +, 0, or – was too restrictive even with the double positive assignment. A numerical range would provide the decision-makers better insight for specific factors of risk, and if the decision is to add across the components, a numerical range would offer more ability to have a spread among projects. Each measure also should have an equal number of categories (e.g., 4 or 5 points) across the rubric so the weight of each measure is equal compared to others. To have varied numbers of categories within measures (i.e., non-standardized) serves to over penalize or under value a given project. For example, the risk measure of Treatment Requirement (i.e., 2 scale levels) contributed 7.6% to the overall score versus Distance to Water Source (i.e., 4 scale levels) contributed 15.3% to the overall score, resulting in an unbalanced overall score value contribution and inherent bias. The SRP also suggested there was a need to carefully review potential redundancy within the rating scale to reduce the potential to overly penalize a project or to overly show support in its favor. Finally, one SRP reviewer suggested the last several lines should be removed from the risk score cards. It was suggested minuses and pluses not be summed nor a total summation be cited
161
because the factors are not commensurate. The total rating implies that these non-commensurate factors can be combined into a single, quantitative metric for each project to facilitate comparison, which is inappropriate. The summations can be misleading to readers interested in comparing the alternative projects. Further explanation on addressing water project complexity is described in Appendix B of the report. SRP Recommendations: Though it does not address all concerns above, use clearly defined risk measures and a
numerical scale with positive numbers. This would allow a more appropriate calculation of a “risk” value.
Review sample approaches to estimating water project uncertainty (see Appendix B). The attached example in Appendix B illustrates how suggestions discussed above can be incorporated into the report and improve the report’s usefulness.
2. Water Grade
a. Subjective b. Grade does not offer translation of actions. c. Recommendations:
i. Future report should identify relevant and appropriate “water issues.” ii. Future report should consider a revised metric by which to grade water issues
in a qualitative manner. iii. Revised measures should be applied equally across all “water issues.”
Water Grade Overview.—As part of the project, COSA and FOR requested letter grade assignments for water management activities or issues within their communities. The original authors assessed water management activities/issues within five broad categories: water planning, water management, water quality, regulatory agencies, and water costs. The grade assignment served to provide insight into the discussion of whether the communities are prepared in terms of water supply and where opportunities may exist to improve that preparation. Grade assignments in many cases were the opinions of the authors, and, in some cases, based on a limited amount of information. Subjective.—The majority of SRP members (4 out of 5) suggested the metrics used in the study were subjective with one member noting the issues themselves were subjective as well. They noted that assigning a grade to water issues developed by the authors brings about similar issues as discussed in the Risk Analysis Metrics section of this commentary. They suggested that listing water issues and then assigning a grade is subjective on both fronts. To bring in objectivity requires metrics on which to assign a grade be defined a priori. Without previously designed metric criteria, any grade can be justified. Furthermore, water issues assigned a grade need justification. For example, SAWS received a “D” for Population Estimates in water planning, but in the Discussion section, it was stated in the draft report that SAWS is moving toward using the best available population data along with the city. This suggests the “D” grade is for past work, but the outlook is to use best available data. Authors need to be clear that grades assigned are for the past because in some cases, SAWS has already begun to implement the recommendations in the report. In this regard, the grading seems subjective. Another example relates to Lost/Non-revenue water, where the report deemed it as too high and gave it a “D” grade. Certainly water losses are a topic to be addressed, but compared to many other complex city systems, SAWS water loss is comparable. The reviewer commented that, nevertheless, water loss deserves mention but questioned whether a “D” could be justified. Specific criteria and/or measures would serve to ensure consistency in grade assignment.
162
One SRP member believed the recommendations related to the 24 San Antonio water issues were a continuation of subjective conclusions, which do not belong in this report. An example highlighted by this reviewer is found within the Water Shortages section of the report under the Actions, which says ocean water desalination can be included in the planning, but more effective is “...conservation, lost water savings, recycling, ASR and even an extended Vista Ridge project.” The SRP member emphasized that imposing subjective judgements such as this, without specific data presented to support such statements, did not have a place in this report. Another example is found in the Edwards Aquifer Conservation Easements section of the report, which suggests doubling conservation easements to 35%. The reviewer reiterated that this was “again not the role of this report” and questioned “Why not triple or maybe accept what conservation easements that exist? It is the decision-makers who set goals” to illustrate that statements made must be supported by appropriate data and remain within the limits of the data and purpose. Despite these shortcomings, and with the exceptions listed above, the recommendations and action items listed in the report were considered logical but are at the discretion of the decision-makers who perhaps have more background information than is presented in this report. Grades Do Not Offer Translatable Actions.—The purpose of the report is to facilitate decision-making. One SRP member suggested that defining what a letter grade represents in terms of actions would be useful. In other words, how can the assigned grade be used in translatable actions? For example, an assigned grade of “A” perhaps translates into “continue activities” versus a “D” translates into “opportunity to improve or implement corrective measures.” In some cases, the water issues being “graded” did not have any historical activities (e.g., Coal Tar Sealant section). If the grade measure is related to past activities, how can an assigned grade be justified for a potentially future activity that has not occurred? SRP Recommendations: During the peer-review process, a small number of grades (i.e., <3) were adjusted to correct
those based on inaccurate data. It is recommended that those adjustments noted within the report be taken into consideration when determining future action.
In reviewing the grade distribution for the report, grades range from A to D. Due to the subjective nature of the current grading rubric, the panel recommends the following water grade interpretation by the sponsors: A or B = maintain activities/effort; C or D = opportunity for improvement or area of potential gain.
Future water policy assessments should develop a well-defined, qualitative grading rubric for grade assignment. An example of such a grading rubric is provided as an illustrative example (Table A-1). With such a rubric, water experts could independently grade water issues, develop average scores, and report results for use by decision-makers.
163
Table A-1. Example of improved water grade rubric based on four criteria: goal attainment, program approach, ratepayer acceptance, and level of effort to correct issues.
Grade Grade Name Goal Attainment Program Approach
Acceptance by Ratepayers
Level of Effort to Correct Issues
A Exemplary Surpasses goals of effort (≥90% of
the time)
Comprehensive (meets ≥90% of program goals)
Widely accepted by ratepayers
(≥90% acceptance rating)
Excellent/ Minimal to no effort to
correct (≤10% effort to
correct)
B Widely Effective
Accomplishes goals of effort (80-89% of the
time)
Encompasses most issues
(meets 80-89% of program
goals)
Accepted by ratepayers (80-89%
acceptance rating)
Above average/ Minor effort to
correct (11-20% effort to
correct)
C Effective Meets some goals of effort,
few missing (70-79% of the time)
Considers some issues
(meets 70-79% of program
goals)
Somewhat accepted by rate
payers (70-79%
acceptance rating)
Average/Some effort required to
correct (21-30% effort to
correct)
D Somewhat Effective
Does not meet all goals of effort, many missing (60-69% of the
time)
Considers minimal issues (meets 60-69%
of program goals)
Not accepted by ratepayers (60-69%
acceptance rating)
Below Average/ Much effort to
correct (31-40% effort to
correct)
F Needs Improvement
Failure to meet goals of effort (≤59% of the
time)
Very Narrow Focus
(meets ≤59% of the program
goals
Widely unaccepted by
ratepayers (≤59% acceptance
rating)
Inadequate/ Great effort to correct (≥41% effort to
correct)
3. Methodology Used in Assessment
a. A Methods section was added in final version of the report to describe the assessment process (e.g., how values were calculated, etc.). The original draft lacked this section.
b. Greater details and clarification on how values/grades were determined are needed within the methods section (e.g., do values presented represent average grades from all authors or the assessment by one author?).
c. Recommendations: i. Future report should outline appropriate and scientifically sound
methodology. ii. Methodology should be applied consistently throughout report.
Methodology Overview.—The overarching goal of the study was to assess water resources (actual and planned) and water issues relevant to future Sponsor policy decisions regarding COSA and FOR during the time period of 2015-2060 (study planning horizon). The water report reviewed 12 water-supply resources or projects for COSA and three for FOR. These projects were assessed for “risk” considering the following factors: total water, cost of water, ownership of water, length of the contract, distance from COSA/FOR, endangered species, treatment required, contamination threat, sensitivity to drought, regulatory agencies, and other issues. Based on the original authors’ assessment, each of these projects was assigned an overall risk
164
rating. Also, as part of the project, COSA and FOR requested letter grade assignments for water management activities or issues within their communities. The original authors assessed water management activities/issues within five broad categories: water planning, water management, water quality, regulatory agencies, and water costs. The grade assignment served to provide insight into whether the communities are prepared in terms of water supply and where opportunities exist to improve that preparation. Unclear Methodology on Value Calculation for Water Projects and Issues.—The majority of the SRP agreed information on methodology was limited, particularly within metric construction and application. This impacted the methods, results and discussion sections of the report and ensuing recommendations. See Risk Analysis and Water Grade sections above for discussion on subjectivity and its impact within the assessment. The purpose of the report was to offer decision-makers a sound and objective technical report. In this regard, the SRP identified several opportunities to reduce the subjectivity of the report. Although the risk related to infrastructure projects is generally determined as a factor of the consequence of failure and/or the likelihood of failure, this report defined “risk” as characteristics of water-supply resources that expose the supply to some degree of unreliability, threat, or challenge. For the purposes of this report, the latter should more appropriately be termed “uncertainty” rather than risk, as consequence is not considered in the definition of risk proposed in the original work. Assigning a numerical “risk” value reflected the estimated degree of unreliability, threat, or challenge for that water resource. The basic risk factors evaluated for each water resource attempted to capture variability and/or unpredictability of that water resource; however, the majority of the SRP agreed the metrics used were limited, or in some cases, not a measure of uncertainty. The SRP also noted metrics should not diminish, double count (in favor or against), or overly favor some risks over others (see Risk Analyses section). Metrics should be applied uniformly across all projects and represent a wider spread to offer more objectivity for decision-making. As a rule, evaluation criteria should have the following attributes: Non-redundant: each criterion needs to measure something not measured by others to
avoid a biased decision. Specific: each criterion should be described in detail and clearly specify what is being
measured and the rationale for it. Relevant: criterion need to help discriminate between projects in terms of how well they
match with Sponsor goals and objectives. If a criterion does not vary between projects (i.e. the score for all projects is the same for a given criterion), then the criterion may be inadequate. Relevancy is also related to whether a factor considered is relevant to the study; in other words, is the factor appropriate within the bounds of the study (Does it have a valid and direct influence)?
Frequently, scoring criteria development entails using distribution of data and percentiles as a guide. Further, metric development typically uses an iterative process, which includes a sensitivity analysis for each metric and assessment of appropriate weighting of each factor. With respect to the Water Grades, identification of water issues and then constructing a metric based on those issues were viewed by the SRP as limiting on both fronts, possibly leading to false conclusions. The SRP (4 out of 5) agreed the report, as written, fell short of a technical report based on its subjectivity and suggest more well-defined, objective, and well-applied metrics to improve the report.
165
SRP Recommendations: Add a Methods section to the report to describe and capture the approach used in the
assessment. This would allow the reader to better understand the approach and potential short-comings of the assessment. Note: This was done as part of the revision process.
Use scientifically appropriate and sound methodology. Along with corrective measures discussed, adding statistical confidence levels to the analyses to aid the reader or user in determining action steps from presented information would improve the work. For example, part of the methodology could include assigning both risk and water grades from 3-4 water experts, averaging of those grades or assigned values, and reporting of confidence levels (e.g., average risk value = 3 (range 1.5-4.2).
Methodology should be applied consistently throughout report. 4. Vista Ridge Project
a. Do the recommendations offer a balanced and broad view of the project? b. What questions should the COSA consider in making decisions about the project? c. Recommendations:
i. Key questions to ask in assessing the project Vista Ridge Overview.—In the draft report, Vista Ridge was one of 12 water projects assessed for COSA. The majority of the SRP (4 out of 5) concluded the report was limited in offering a balanced and broad view of the Vista Ridge project. The report states population estimates used in the study are low and the city will likely reach a deficit before 2050, requiring alternative sources of water. Assuming this project is not pursued, it is unclear what other viable options are available for avoiding this shortfall of water. Based on the draft report, the SRP suggested decision-makers consider reliability, sustainability, and diversification in reviewing alternatives such as Vista Ridge. Due to the added attention to the Vista Ridge project, the SRP provided additional suggestions for Sponsor consideration. Three measures were used in the original risk assessment that either appeared marginally important or may potentially introduce bias to the Vista Ridge project evaluation. A brief review of each measure listed below is provided:
Distance to water source
Water treatment requirement
Costs/finances Distance to Water Source (i.e., pipeline length): The Vista Ridge project was the only water supply evaluated >100 miles from COSA. SRP questioned the application and weighting of pipeline length to the assessment of the Vista Ridge project. No examples of failure and/or contamination of water in a large pipeline that extends the length of Vista Ridge are offered nor are the histories of water pipelines extending lengths similar to Vista Ridge over the decades provided. Water utilities routinely manage many miles of pipeline. Austin Water Utility, for instance, maintains more than 3,700 miles of pipelines (http://www.austintexas.gov/department/austin-water-utility-statistics). The Colorado River Municipal Water District maintains a 157-mile pipeline connecting Lake Ivie to San Angelo. Methodologies for and examples of assessing risk of pipeline failure are well documented (e.g., Magelky, R. [2009] Assessing the Risk of Water Utility Pipeline Failures Using Spatial Risk Analysis. Pipelines 2009, pp. 1232-1240).
A review of the literature found that total pipeline length is generally not a major consideration in determining pipeline failure. However, it is reasonable that pipeline failure would be impacted by its total length, though such failure would likely only be temporary and remedied quickly by the water utility. As such, if this criterion is maintained as a risk measure, a low-weighting factor should be considered due to the temporary impact of the failure. Further, temporary failure is not a consideration in other project types despite there being similar opportunity of such. Treatment requirement: A risk measure used in project evaluation was the requirement for water treatment. For the Vista Ridge project, the water source was listed as requiring treatment. It is unclear what added treatment would be required beyond standard applications (e.g., adding chlorine) or if the project water would necessitate special treatment. The City of College Station, who uses water from the Carrizo-Wilcox Aquifer in the Carrizo, Sparta, and Simsboro Sand formations (i.e., the same water source for Vista Ridge project; http://www.cstx.gov/index.aspx?page=824), utilizes only chlorine disinfection. If additional treatments would be expected for the Vista Ridge project, this needs to be clarified. Concern with water treatment and pipeline length was not very clear from citations provided (e.g., Urban Neunart 2014, Rasekh and Brumbelow 2013). Costs/Finances: To accurately compare costs between water projects, time horizons used to develop such costs must be comparable. Verification is needed to validate that the cost for water from Vista Ridge is an amortized cost per acre foot that includes investment, maintenance, and operating, and clarifies over what period of time (30 or 50 years) this applies. Conversely, the issue was raised regarding the credit status of Abengoa Vista Ridge LLC. Expanded analysis is needed related to the economic feasibility of Vista Ridge and what vulnerability, if any, relates to the financial status of Abengoa Vista Ridge LLC. Further, as the groundwater has been contracted for 30 years (to 2050), additional confirmation is needed regarding the ability to extend this contract and at what price for SAWS and landowners. The COSA leadership will be evaluating the importance of Vista Ridge project in diversifying the SAWS’ water portfolio in the next few weeks. Some questions the SRP recommend for consideration in this evaluation include the following: 1. Reliability of Supply (within planning horizon).—Recent reports that Vista Ridge pumping will
impact aquifer levels and result in exceedance of the Simsboro Aquifer DFC by 2060 warrants further assessment in reliability of this water supply within the planning horizon. The SRP did not attempt to validate the findings of recent studies but suggested further evaluation of possible DFC exceedances and impacts on future water deliveries would be prudent. Should the DFC reduce the quantity of water delivered, a critical question then becomes what level of water delivery is required for Vista Ridge to be viable.
2. Reliability of Supply (beyond planning horizon).—Groundwater has been contracted for 30
years (to 2050), and verifiable within the conditions of the contract. The certainty of an extension of the contract beyond 30 years has been noted by SAWS but, unfortunately at the time of completion of this report, could not be verified. Reliability of supply for the project’s water source would serve to extend the project’s value beyond 2050 and address potential periods of water shortages faced by COSA. Water reliability for such long time periods are challenging, but efforts to better project water-supply estimates are encouraged. Suggested questions: What are the details of contract extension beyond 30 years? What
are the alternative plans if supply reliability becomes problematic or water availability decreases, and how does that factor into overall project investment or costs?
3. Project Construction.—The 142-mile pipeline will require the securing of pipeline easements
from willing landowners. What is the methodology for acquiring pipeline easements for this project (option agreements or outright purchase easements)? What entities are contracted to acquire the right-of-way easements? What measures have been put in place by Abengoa Vista Ridge to increase landowner participation? What alternative plans are in place if this becomes problematic (i.e., re-routing of pipeline because of unwilling landowner) and how does that impact overall project costs? Does Abengoa Vista Ridge possess condemnation authority should a landowner decide they do not want to grant a pipeline easement? What percentage (of miles) of pipeline easements are currently secured? What is the timetable to secure 100% of the required easements?
4. Formal Project Assessment.—Given the complexity of Vista Ridge, it may warrant its own individual analysis. Consolidating it with the other projects in the report limits the analysis simply because there is no comparable project.
5. Data used to support conclusions should be provided
a. Avoid “self-citations.” b. Avoid non-peer-reviewed literature. c. Avoid overstatements from data used (e.g., per capita water use) or data
mispresented (e.g., discrepancy in population estimates). d. Recommendations:
i. Report should be supported by appropriate citations. ii. Conclusions drawn should be supported by data.
Data Use Overview – Whereas methodology is important to any study, equally important is the collection, validation, and presentation of data and documentation of its source and quality. The SRP recognized areas for improvement within the report regarding data (e.g., overstatements based on available data on per capita water use or misrepresentation of population estimate data). Scientific publication limits the type of data that may be introduced to support scientific work. Self-citations should be avoided, unless one is citing their own previously peer-reviewed journal publication and where the information leads to a progression of knowledge within a novel topic or to a new discovery. Non-peer-reviewed literature use should be limited and is not commonly favored in the scientific community, as the methodology, data, and ensuing findings are not easily validated. Such literature does not employ rigorous scientific peer review via experts in their respective fields. Appropriate conclusions drawn from scientific data may only directly reference the data and may not make assumptions outside of what the data directly support; thus, creative license with data interpretation is prevented. This process ensures a balanced, objective, and calculated process to discovery. During the SRP review, given strict time constraints, values and assumptions were validated to the best of the SRP’s ability through written/verbal communication with COSA/SAWS and/or review of published sources of information. Some of the original “citations” were not removed due to time constraints or the nature of the information was not a data value needed in the assessment. SRP Recommendations:
Ensure all reports, along with methodologies and data used, and conclusions drawn, are supported by peer-reviewed data and literature, and cited appropriately.
168
Scientific conclusions should be supported by validated data presented within reports and should remain within the limits of the data.
169
Appendix B: SRP Project Ratings Based on Improved Metrics and Uncertainty Analysis
170
Uncertainty Analyses – Water Resources
To demonstrate the limitations of the draft report, the Science Review Panel (SRP) used a modified uncertainty analyses “score card” in evaluating the water-supply projects for both COSA and FOR. The SRP noted several issues or biases with the draft risk assessment, which include:
use of marginally important or inappropriate criteria measures,
the weight of certain criteria measures (i.e., bias in % contribution to total score), and
use of an unbalanced scale.
In this modified approach, the SRP conducted an analysis similar to the original analysis but with options to (1) identify new measures that would be more informative (Table B-1), (2) redefine existing measures to address inherent biases or lack of specificity (Table B-2), or (3) use existing original measures that were used appropriately. The SRP also did not use ranking criteria either deemed to be marginally important or inappropriate in the assessment. The data available and value assignment from the original assessment was applied within this modified approach.
Table B-1. Overview of rating criteria used in SRP uncertainty analysis by criteria type (i.e., new, redefined, and original). Rating Criteria Criteria Type
Ownership of Water Original Endangered Species Original Cost Certainty Redefined Length of Contract Redefined Drought Sensitivity Redefined Contamination Threat to Source Water Redefined Regulatory Certainty Redefined Total Water Yielded New Ranking Criteria from original analyses not used in SRP assessment: Distance of source from city Treatment required Other issues
Rating Criteria Cost Certainty – The total cost for water (e.g., $/AFY) is not a measure of water project uncertainty. Typically, water costs in project assessments are evaluated separately (i.e., non-commensurate) but can be considered a measure to water-supply reliability or uncertainty if water costs can prevent the procurement of water. We defined water projects with known, fixed costs (e.g. even if water costs increase during time period, but cost increases are known) over ½ of the planning horizon (i.e., 22½ years, total 45-year planning horizon) as “low uncertainty” compared to projects with unknown or uncertain future costs, which were assigned “high uncertainty” value (Table B-2).
Total Water Yield – Like cost certainty, the total water yield is commonly assessed in water project evaluations separately (i.e., non-commensurate); however, the size of the water project supply relative to others can be considered important when planning to meet the overall water demands of the future. Large projects provide a greater portion of the overall water need; thus, it
171
can be argued that they provide additional certainty for the planning entity while small projects do not provide the same level of certainty. For rating purposes, the projected water amount produced for each COSA water project was ranked (from highest to lowest) and divided into quartiles (see Table 5 in water report). Ranges for each quartile were identified and annual volume thresholds set to reflect these points (Table B-2). FOR projects were rated with highest certainty for the largest project and low certainty for the other two due to their similar size.
Ownership of Water – Water-supply projects include owned and leased water. Water ownership can be viewed as an indicator of supply uncertainty or supply reliability with owned water considered less uncertain (value of 0) and leased water considered more uncertain (value of 1). Water projects with mixed ownership were given an intermediate value (moderate uncertainty = 0.5, Table B-2).
Length of Contract – Water supplies contracted for longer periods result in less uncertainty because contract negotiations are avoided or considerably delayed. In this assessment, contract length is evaluated based on the mid-point of the 45-year planning horizon (i.e., 22½ years) of this report. Water contracts shorter than 22½ years are considered to have greater uncertainty and assigned a rating value of 1. Water contracts longer than 22½ years are considered lower uncertainty and assigned a rating value of 0.
Drought Sensitivity – Water-resource projects are affected differently by drought situations in the region based on the nature of the project. Projects with no or little change in yield (>90% of normal yield available in drought) receive a rating value of 0 or “most reliable.” Moderately reliable projects that yield 51% to 90% during a drought year receive a rating score of 0.5. Projects with yields of 50% or less are considered least reliable and given a rating of 1 (Table B-2).
Endangered Species – Water projects that impact the habitat of known endangered or threatened species are considered highly uncertain and assigned a rating value of 1. If there are no known endangered species or if the issue has been addressed with the completion of an Incidental Take Permit, the project will have a 0 (low uncertainty) value applied (Table B-2).
Contamination Threat to Source Water – The contamination of water sources is complex. Thus, this measure should be applied with caution. The rate of recharge (fast versus slow) along with land cover can collectively give you a reasonable measure of risk to water-supply contamination. Surface water sources are considered most vulnerable and receive a rating value of 1. Groundwater sources that recharge quickly and/or have recharge areas that are greater than 10% developed are deemed more threatened and receive a 0.5 rating value. Groundwater sources that recharge slowly and/or contain less than 10% developed land cover are considered less vulnerable to contamination and receive a 0 rating value. A water-supply project that includes several sources of varying vulnerability may receive an uncertainty rating of 0.5 (Table B-2).
Regulatory Certainty – The characteristics of the regulatory concerns facing a water project and the ability to address those concerns can provide considerable uncertainty to project assessment. Similarly, the presence or absence of local representation within the regulatory process can add or detract from the level of project certainty. For projects with few regulatory concerns or those that contain local representation within the regulatory framework, project certainty is considered high and a rating value of 0 is applied. For projects with a considerable number of regulatory concerns or lack of local representation in the regulatory framework, project certainty is considered low and a rating value of 1 is applied (Table B-2).
172
Average Rating – Uncertainty analysis for each water-supply project was qualitative. The uncertainty measures for each project were averaged, ranked, and categorized based on rank order as “low”, “medium”, and “high.” Assignment of water projects to uncertainty categories was determined by dividing the ranked projects into three equal parts. Water projects with the scores closest to 0 are considered to have the lowest uncertainty while those with scores closest to 1 are considered to have the greatest uncertainty (Figure B-1).
Uncertainty Analysis By definition, risk is the “probability of an unwanted event or unintended consequence”. The original assessment was not a risk assessment in the classic sense, but was instead an attempt to measure uncertainty or reliability of water supply. Here, the SRP recommended water supply uncertainty be measured and defined as characteristics of water-supply resources that expose the supply to some degree of unreliability, threat, or challenge and is illustrated in this analysis. Assigning a numerical “uncertainty” value reflects the estimated degree of unreliability, threat, or challenge for that water resource (Table B-2). Values can be used to compare water-supply projects and even assign water projects into qualitative categories of uncertainty (e.g., low, medium, and high uncertainty). The basic rating criteria used to evaluate each water resource attempted to reflect uncertainty and/or unpredictability of that water resource (Table B-2). Rating criteria viewed as “low” uncertainty were assigned a 0 value; those with a “medium or moderate” uncertainty were assigned a 0.5 (note: may vary for some measures with more than three categories); and those viewed as “high” uncertainty were assigned a value of 1. Thus, the scale for each criteria measure was standardized and ranged from 0 to 1 (low to high uncertainty) for all measures in the project evaluation. Definitions for each rating criteria are described in Table B-2 and defined in the Rating Criteria section below. Once the uncertainty “score card” was applied for all water projects, the criteria measures were averaged to calculate an “uncertainty” value. Water projects were then ranked (highest to lowest) with the upper 1/3 ranked projects assigned a label of “high”, middle 1/3 “medium”, and lower 1/3 being “low” for comparative purposes.
It is important to note that directly comparing risk labels (i.e., high, medium, low) from this analysis to the original assessment should be avoided. The assignment of risk labels from the original assessment has some biases. A project with more minus (-) risk points than positive (+) risk points was rated as a “low-risk” water-supply project. Water projects with an equal number of pluses (+) and minuses (-) or with one more plus (+), were designated as “medium-risk” projects. Projects with 2 or more pluses (+) than minuses (-) were rated “high-risk” projects. The bias in this approach is two-fold. First, the assumption of projects with a “1” being labeled a “medium risk” label is subjective. Why are “-1” projects not medium risk? If you assume a sum of zero equals medium, then Trinity Oliver Ranch Water (the only medium project) would be a “high risk” project (see Table 6 in Results and Discussion section). None of the 12 water supply projects would be medium risk. And, the likelihood of a water project being labeled a “medium risk” label under this approach is 10% compared to high risk (50% probability of occurrence) or low risk (40% probability of occurrence) (see Table 6). A more objective approach would be apply the approach used here (e.g., upper 1/3 ranked projects equals high, etc.).
173
Table B-2. Water project “score card” used in uncertainty analysis by rating criteria, scale, and criteria description. Rating Criteria Scale Description
Cost of Water N/A Provided for informational purposes only Cost Certainty 0 Costs certain (i.e., costs already known or costs likely to
decrease) – (>½ planning horizon*) 1 Costs uncertain (i.e., uncertain costs or future costs may
increase) – (>½ planning horizon) Total Water Yielded: COSA Projects
0 > 54,500 AFY (1st Quartile in Supply Contribution)
0.5 Moderate – (e.g., ground water, high recharge and/or developed land cover [>10%])
1 High – (e.g., surface water, developed land cover [>10%]) Regulatory Certainty 0 Certain (e.g., few regulatory concerns, local
representation with agency) 1 Uncertain (e.g., significant regulatory concerns, absent or
limited representation with agency)
Average Rating: Sum of rating points divided by 8, the number of metrics used; based on a 0 – 1 scale Overall Uncertainty Rating: Qualitative level of perceived project uncertainty for meeting water supply
needs; Low, Medium, or High
*Planning horizon is 45 years (2015–2060)
Revised Project Risk Ratings The SRP project reviews based on the modified approach are outlined in Table B-3. Application of the ranking criteria used in the SRP assessment were admittedly limited due to time constraints and data availability from the current report.
174
Figure B-1. Uncertainty value and ranking for COSA and FOR water supply projects.
Results and Discussion Project uncertainty values ranged from 0.088-0.813 (Figure B-1). Notable shifts in ranking for water projects from the original rankings include Edwards Aquifer, Trinity Oliver Ranch, Western Canyon, and the Lake Dunlap/Wells Ranch projects (+2 increase in rank) and Vista Ridge project (-5 decrease in rank). A simple sensitivity analyses that removed rating criteria that could be considered indirect measures to supply uncertainty (i.e., cost certainty, total water yield), found slight shifts (+ 1 increase/decrease in rank) for Edwards Aquifer and Trinity Oliver Ranch water. In other words, removing cost certainty and total water yield from the analysis did not change the project ranking outcomes significantly. This illustrative example serves to underscore the concerns of the SRP in having assessment “score cards” that are properly developed to avoid over penalizing or under valuing water projects. All score cards used in this analyses are located at the back of this section. It is important to note this assessment has several limitations. First, the SRP only used readily available data from the original report or other easily accessed data sources. More informative measures could be included with a comprehensive assessment not limited by this constraint. Second, time constraints (i.e., <1 month) prevented this comprehensive assessment from thoroughly validating and obtaining the necessary aforementioned data for ideal measures in project evaluation. Further, acquiring additional data would have helped improve the application of many metrics including cost certainty, drought sensitivity, and regulatory certainty.
175
COSA Project Score Cards Edwards Aquifer – Score Card Rating
Cost of Water: $331/acre foot (with no restrictions)
$541/acre foot (during drought management) Cost Certainty: Active water market 1 Total Water Yield: 294,530 acre feet/year (AFY) 0
Ownership of Water: 85% permanent, 15% leased 0.5 Length of Contract: Varies 1-10 years 1
Drought Sensitivity Yes, 5 stages up to 44% reduction based on aquifer level at Monitoring Well 17 and spring-flow rates at Comal and San Marcos Springs.
0.5
Endangered Species: 8 species at Comal and San Marcos Springs are addressed with the Edwards Aquifer Habitat Conservation Plan
1
Whooping crane habitat is related to environmental flows down Guadalupe and San Antonio Rivers
At least 3 mussels are listed as endangered or threatened in the Guadalupe River
3 beetles exist in karst formations in Bexar County and surrounding areas
Contamination Threat:
Development over the Edwards Aquifer Recharge Zone, and Edwards is a fast-recharge aquifer.
0.5
Regulatory Certainty: Edwards Aquifer; San Antonio is represented on the EAA Board.
0
Average Rating: 0.563 Overall Rating: Moderate
SAWS Recycled Water – Score Card Rating
Cost of Water: $319/acre foot
Cost Certainty: Internal costs and power costs 0
Total Water Yield: 125,000 AFY 0
Ownership of Water: Direct Reuse, Owned 0
Length of Contract: Contracts sale of water with recycled water users 0
Drought Sensitivity Steady source because it relies on indoor and commercial water use
0
Endangered Species: None 0
Contamination Threat: Very secure, no storage 0
Regulatory Certainty: TCEQ, COSA input to regulatory agency (TCEQ is a state agency).
Cost of Water: Edwards Water Costs of≈$400/acre foot for the water and an extra $110/acre foot net recovery costs
Current $510 Cost Certainty: Relatively stable 0
Total Water Yield: Current 78,000 AFY 0 Capacity 120,000 AFY
Ownership of Water: Owned 0
Length of Contract: N/A 0 Endangered Species: None 0
Contamination Threat: Limited 0 Drought Sensitivity: The current supplies are available in a drought, but it is
more difficult to refill ASR in drought. 0.5
Regulatory Certainty: Agreement with Evergreen Underground Water Conservation District, permit with TCEQ
1
No representation on Evergreen, but it does not have jurisdiction in ASR area
Average Rating: 0.188
Overall Rating: Moderate
Vista Ridge Water – Score Card Rating Cost of Water: $2,300/AFY for first 30 years Cost Certainty: High costs but certain 0 Total Water Yield: Up to 50,000 AFY (delivery begins 2020) 0.3 Ownership of Water: Leased 1 Length of Contract: Length of agreement 30 years and then SAWS
assumes ownership of assets/infrastructure 0
Endangered Species: The pipeline route will pass through some karst caves area, but endangered species will not be a major issue.
0
Contamination Threat: Slow to recharge Carrizo Aquifer 0
Drought Sensitivity No 0 Regulatory Certainty: Local groundwater districts without San Antonio
Cost of Water: $590/acre foot Cost Certainty: Stable 0 Total Water Yield: 2014 9,900 AFY 0.3
2017 16,400 AFY
2022 23,400 AFY
2026 34,400 AFY
Ownership of Water: Owned Water 0 Length of Contract: N/A 0 Endangered Species: None 0 Contamination Threat: Low 0 Drought Sensitivity N/A 0 Regulatory Certainty: EUWCD does not have jurisdiction over the area but
an agreement exists for 6,400 AFY but none for planned expansion.
Cost of Water: After Phase 3 $1,138/AF Cost Certainty: Power costs may fluctuate 0 Total Water Yield: Phase 1 12,210 AFY 0.3 Phase 2 12,210 AFY Phase 3 6,105 AFY (33,600 AFY total)
Ownership of Water: Phase 1-2016 0
Phase 2-2021 Phase 3-2026
Owned 0
Length of Contract: N/A 0
Endangered Species: None 0 Contamination Threat: Not vulnerable 0
Drought Sensitivity None 0
Regulatory Certainty: TCEQ, Wilson County and EUWCD, San Antonio has no representation on the EUWCD. TCEQ is a state agency.
1
Average Rating: 0.163
Overall Rating: Low
178
Medina Lake – Score Card Rating
Cost of Water: $474/acre foot ($69/acre foot for the raw water, raw-water rate related to GBRA water rate and will increase)
Cost Certainty: Relatively stable, but will increase 1
Total Water Yield: 19,974 AFY in the lake 0.7 9,214 AFY run of river Ownership of Water: Contracted Water 1 Length of Contract: A contract exists with Bexar/Medina Atascosa Water
Control and Improvement District #1. Contract is in place until December 31, 2049
0
Endangered Species: None 0 Contamination Threat: Medina Lake at a low level would be especially
vulnerable 1
Drought Sensitivity Yes. No water is available from the Medina Lake project in the current state of rainfall and lake levels.
1
Regulatory Certainty: TCEQ, state agency 1 Average Rating: 0.713
Cost of Water: $1,224/acre foot Cost Certainty: Relatively expensive but stable 0 Total Water Yield: 11,688 AFY Leased 0.7 5,550 AFY could be added from other utilities along the
pipeline leased
Ownership of Water: Leased Water 1 Length of Contract: Water will be available beginning in 2014. Contract until
2040 and is renewed every 5 years. 0
Endangered Species: None 0 Contamination Threat: Hard to recharge, low threat 0 Drought Sensitivity None 0 Regulatory Certainty: Gonzales County Underground Water Conservation
District (GCUWCD), San Antonio has no representation 1
Average Rating: 0.338 Overall Rating: Moderate
179
Water Conservation – Score Card Rating
Cost of Water: ≈$400/acre foot* at 10 years, $4,000/acre foot in first year of implementation.
Cost Certainty: Costs are low and relatively steady 0
Cost of Water: $1,030/acre foot and is adjusted Cost Certainty: Cost is adjusted. 1
Total Water Yield: 4,000 AFY base amount guaranteed 1 9,000 AFY available, 7,100 AFY average Ownership of Water: Leased from GBRA. The 4,000 AFY is the basic
commitment and SAWS must purchase additional water that is available from Fair Oaks Ranch, and other contractors. Extension options exist.
1
Length of Contract: Contract with GBRA to receive water until 2037. 1 Endangered Species: None 0 Contamination Threat: A lake is vulnerable. 1 Drought Sensitivity Yes, but limited. 0.5 Regulatory Certainty: Surface water, TCEQ is a state agency 1 Average Rating: 0.813 Overall Rating: High
180
Trinity/Oliver Ranch Aquifer – Score Card Rating
Cost of Water: $976/acre foot Cost Certainty: Stable 0 Total Water Yield: Normal 8,800 AFY 1
Stage II 5,500 AFY Drought of Record 2,000 AFY
Ownership of Water: Leased, Contract Length 1 Oliver Ranch-15 years after 2010 with 10-year option,
3,000 acre feet/year
Bulverde Snecker Ranch project 15 years, 1.5 month after 2006 with possible 6-year Extension, 5,000 AFY
Water Exploration Company (WECo)-17,000 AFY, if available, 15-year lease with 2-5 year extensions
Massah Corporation-15 year contract as of 2010 with 10-year extension possible
Length of Contract: 15 years with extensions possible 1 Endangered Species: None 0 Contamination Threat:
Considerable development and wells but slow recharge
0.5
Drought Sensitivity Yes, see amount of water above. 1 Regulatory Certainty: Trinity Glen Rose Underground Water Conservation
District, Bexar County representatives 1
Average Rating: 0.688 Overall Rating: High
Lake Dunlap Wells/Wells Ranch – Score Card Rating
Cost of Water: $1,041/AF Cost Certainty: Adjusted with GBRA water costs 1 Total Water Yield: Lake Dunlap 4,000 AFY, surface water 1 Wells Ranch 2,800 AFY
Ownership of Water: Leased 1 Length of Contract: Contracts are with the Canyon Regional Water
Authority (CRWA), 500 AFY of the Lake Dunlap water is leased to City of Cibolo through 2018. GBRA is ultimate source of Lake Dunlap water.
1
Endangered Species: None 0 Contamination Threat: Surface water and groundwater 0.5 Drought Sensitivity Limited potential for reductions 0.5
Regulatory Certainty: CRWA, GBRA 1 Average Rating: 0.75 Overall Rating: High
181
FOR Project Score Cards Canyon Lake Water – Score Card Rating Cost of Water: $2.90/1000 gallon or $943.92/acre foot in 2015, price
adjusted based on inflation and operating costs through complex formula.
Cost Certainty: Price can be changed at GBRA discretion with 60 days’ notice
1
Total Water Yield: 1,850 AFY 0 Ownership of Water: Bought yearly from GBRA through a contract, more
water may be available. Contract extensions available through 2077 if the cost conditions are acceptable.
1
Length of Contract: Decision points at 2037 and every few years 1 Endangered Species: None 0 Contamination Threat: Lake in Comal County 1 Regulatory Certainty: Yes, but liberal. 1 Drought Sensitivity: Surface water permitted by TCEQ (state agency) to
GBRA and Certificate of Convenience and Necessity to Fair Oaks Ranch from TCEQ
0.5
Average Rating: 0.688 Overall Rating: High
Trinity Aquifer Groundwater – Score Card Rating
Cost of Water: $30/acre feet if the Trinity water makes up over 50% of the City's supply. There is no cost if the use is less than 50% of total supply.
The $30/acre foot is the cost of the raw water paid to the Trinity Glen Rose Groundwater Conservation District. The legislative TGRGCD Board has granted permission to increase the fee to $40/acre foot in the future.
Cost Certainty: Prices are stable. 0 Total Water Yield: 543 AFY 1 Ownership of Water: Wells are owned by the city. 0 Length of Contract N/A Endangered Species: None 0 Contamination Threat:
Sources state that 4-5% of the rainfall that falls recharges the aquifer. Recharge is described as slow, therefore, although there is localized uncertainty; large-scale contamination threat is low.
0
Drought Sensitivity: Yes. The Trinity Aquifer is often described as an inconsistent water source. The Trinity Aquifer as the most stressed water source in the area.
0.5
Regulatory Certainty: Trinity Glen Rose Groundwater Conservation District. Fair Oaks Ranch has a representative on the TGRGCD Board.
0
Average Rating:
0.188
Overall Rating: Medium
182
Fair Oaks Ranch Recycled Water Program – Score Card Rating Cost of Water: $0 Cost Certainty: Prices are stable 0 Total Water Yield: Up to 560 AFY (500,000 GPD) 1
Averages 235 AFY (219-251 AFY) Ownership of Water: Owned by Fair Oaks Ranch 0
Length of Contract N/A 0
Endangered Species: None 0 Contamination Threat: Used for the golf course, none 0 Drought Sensitivity: No 0 Regulatory Certainty: TCEQ, state agency 1
Average Rating: 0.250 Overall Rating: Low
As described above, the score card with assigned values from the SRP provides the opportunity
to conduct sensitivity analysis (which was done to a limited extent earlier) and evaluate the
stability of a rating. The score card also provides a method/tool for decision-makers to input
their estimates for each of the metrics and review rankings.
183
Appendix C: Supplemental Water Issue Grading
184
Water Grades – Water Issues
COSA and FOR requested assignment of letter grades for water management activities or issues within their communities within five broad categories: water planning, water management, water quality, regulatory agencies, and water costs. The grade assignment served to provide insight into the discussion of whether the communities are prepared in terms of water supply and where issues may exist to improve that preparation.
During the review process, the Science Review Panel (SRP) was asked to do a rapid assessment of assigned grades based on additional or new information obtained during the review process that would warrant a re-evaluation. Specifically, the SRP members were asked:
1. Is there additional or new information that may result in re-assignment of a letter grade beyond one letter grade variance (e.g., need to change from D to B, A to C…)?
2. Are there water issues that were graded but likely should not have been due to a lack of history or past activities?
3. If any grade adjustments are warranted, what grade would you suggest?
Below is an example of format used throughout the report for grade validation.
Overview Grade COSA recently began to use a different population estimate compared to SAWS. The difference can result in a water shortage as soon as 2040 if drought of record occurs. SAWS and COSA should jointly determine the best population estimates to use in water planning.
D
SRP Grade Validation and Adjustment
Grade is reasonable within one letter grade variance
New information was provided and warrants adjustment of two or more letter grades
Grading of issue is not appropriate or not enough information is available to warrant grade assignment
B
Justification: The change in population estimate used by the COSA, referred to above, occurred post-2012 SAWS Water Plan (i.e., last year), and SAWS and COSA are in the process of determining appropriate estimates to use in the 2015 plan. The original assessment assumed differential use of population estimates since 2012, which was not the case following data validation.
185
Appendix D: Alternative Project Assessment Framework
186
Alternative Project Assessment Framework Water project assessments typically have multiple considerations ranging from reliability of supply (e.g., analysis described in this section), project costs analysis, and water project performance, to name a few. Attempts to simplify a complex situation can result in erroneous conclusions or attempting to compare non-commensurate project metrics (e.g., reliability, costs, performance, etc.). Unfortunately, evaluating water projects using a single measure or value is inherently biased as described in this commentary. The table outlines a suggested framework for water project evaluation along with other considerations.
Table D-1. Example of water project evaluation framework. Evaluation Metric Performance Scale Mitigation Measures
Supply reliability 5 Point Scale: 1, 2, 3, 4, 5
Regulatory reliability 5 Point Scale: 1, 2, 3, 4, 5
Quality of source water 5 Point Scale: 1, 2, 3, 4, 5
Contamination risk 5 Point Scale: 1, 2, 3, 4, 5
Endangered species risks 5 Point Scale: 1, 2, 3, 4, 5
Susceptibility to drought 5 Point Scale: 1, 2, 3, 4, 5
Time period supply certainty 5 Point Scale: 1, 2, 3, 4, 5
Reliability of cost estimates 5 Point Scale: 1, 2, 3, 4, 5
Evaluation Metrics Supply Reliability – describes the ability of the resource or project to physically provide a certain volume of water. The performance scale is an assessment of risks limiting physical reliability. Regulatory Reliability – describes uncertainty that regulations, or contractual obligations may change so as to limit the volume of water available Quality of Source Water – relates to constituents in the source that may require extraordinary treatment before end use Contamination Risk – relates to threats to source water or infrastructure transport Endangered Species Risks – relates to known species presence in the source or transport infrastructure Susceptibility to Drought – relates to any regulatory or physical limitations to source supply volume Time Period of Supply Certainty – relates to risks that may reduce known time periods. This might not be relevant as an evaluation metric since it is time specific and has limited utility for risk analysis Reliability of Cost Estimates – may be an irrelevant metric unless the cost is highly variable and subject to change. Performance Scale A five (5) point scale provides a standardized method to statistically measure the degree of positive or negative responses to an evaluation metric. A numerical scaling system is the
187
generally accepted standard of practice in evaluation research and project or program assessment.
1. Low risk 2. Some risk 3. Moderate risk 4. Significant risk 5. Great risk
Mitigation Measures These describe options or strategies to reduce risk and enhance project or program reliability. Adding mitigation measures along with each evaluation metric serves to inform the decision-maker of the required effort to offset the level of negative impact from a given measure. Comparative Project Costs Analysis In addition to measures of reliability of supply, separate cost analyses can be informative to decision-makers. These analyses should incorporate known total cost on standard scales, such as cost per acre-foot or cost per thousand gallons. This allows a decision-maker to make project comparisons using standardized approaches. Assessment of Project Performance Relative to Water Need Like project cost analyses and reliability of supply, project performance measures can be informative to decision-makers. While not a risk factor, an assessment of projects relative to cost, volume of water and percent contribution in relationship to meeting total new water needs should be determined. Comparisons between costs, volume, water need and project risk can be incorporated in an Assessment Matrix that integrates various analyses for a comprehensive view of water projects that aid in the decision-making process.