U.S. U.S. Cards 10 - 11 U.S. Retail Distribution 12 - 13 U.S. Consumer Lending 14 - 15 U.S. Commercial Business 16
International International Cards 17 - 18 International Consumer Finance 19 - 20 International Retail Banking 21 - 22
Markets & Banking: 23
Income Statement 24Revenue Details 25Securities and Banking 26Transaction Services 27
Global Wealth Management: 28
Smith Barney 29Private Bank 30
Alternative Investments 31
Citigroup Supplemental DetailReturn on Capital 32
Average Balances - Yields 33Consumer Loan Delinquency Amounts, Net Credit Losses and Ratios 34Allowance for Credit Losses:
Total Citigroup 35 Consumer Loans 36 Corporate Loans 37
Components of Provision for Loan Losses 38Non-Performing Assets 39
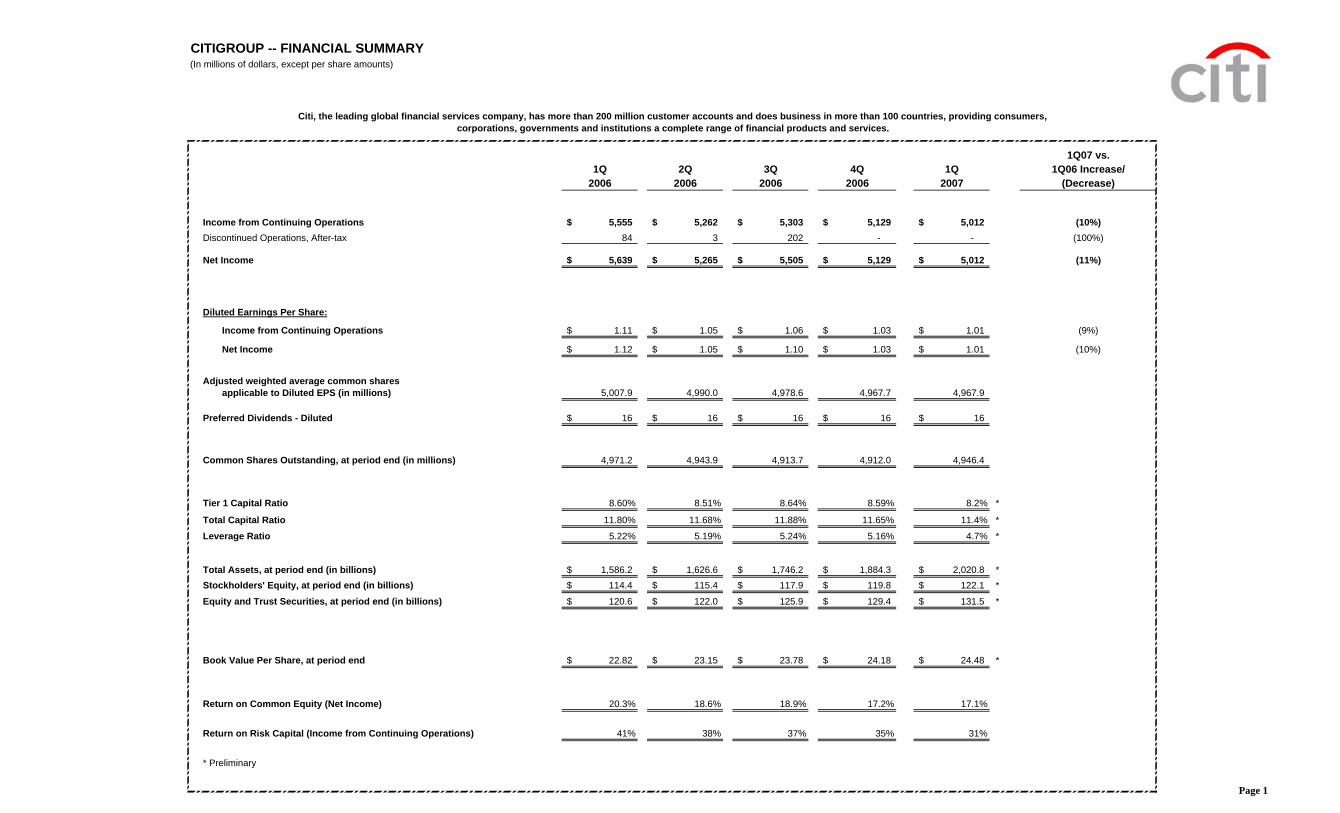
CITIGROUP -- FINANCIAL SUMMARY(In millions of dollars, except per share amounts)
1Q07 vs.1Q 2Q 3Q 4Q 1Q 1Q06 Increase/
2006 2006 2006 2006 2007 (Decrease)
Income from Continuing Operations 5,555$ 5,262$ 5,303$ 5,129$ 5,012$ (10%)Discontinued Operations, After-tax 84 3 202 - - (100%)
Net Income 5,639$ 5,265$ 5,505$ 5,129$ 5,012$ (11%)
Diluted Earnings Per Share:
Income from Continuing Operations 1.11$ 1.05$ 1.06$ 1.03$ 1.01$ (9%)
Net Income 1.12$ 1.05$ 1.10$ 1.03$ 1.01$ (10%)
Adjusted weighted average common sharesapplicable to Diluted EPS (in millions) 5,007.9 4,990.0 4,978.6 4,967.7 4,967.9
Preferred Dividends - Diluted 16$ 16$ 16$ 16$ 16$
Common Shares Outstanding, at period end (in millions) 4,971.2 4,943.9 4,913.7 4,912.0 4,946.4
Tier 1 Capital Ratio 8.60% 8.51% 8.64% 8.59% 8.2% *
Total Capital Ratio 11.80% 11.68% 11.88% 11.65% 11.4% *
Leverage Ratio 5.22% 5.19% 5.24% 5.16% 4.7% *
Total Assets, at period end (in billions) 1,586.2$ 1,626.6$ 1,746.2$ 1,884.3$ 2,020.8$ *Stockholders' Equity, at period end (in billions) 114.4$ 115.4$ 117.9$ 119.8$ 122.1$ *
Equity and Trust Securities, at period end (in billions) 120.6$ 122.0$ 125.9$ 129.4$ 131.5$ *
Book Value Per Share, at period end 22.82$ 23.15$ 23.78$ 24.18$ 24.48$ *
Return on Common Equity (Net Income) 20.3% 18.6% 18.9% 17.2% 17.1%
Return on Risk Capital (Income from Continuing Operations) 41% 38% 37% 35% 31%
* Preliminary
corporations, governments and institutions a complete range of financial products and services.Citi, the leading global financial services company, has more than 200 million customer accounts and does business in more than 100 countries, providing consumers,
Page 1
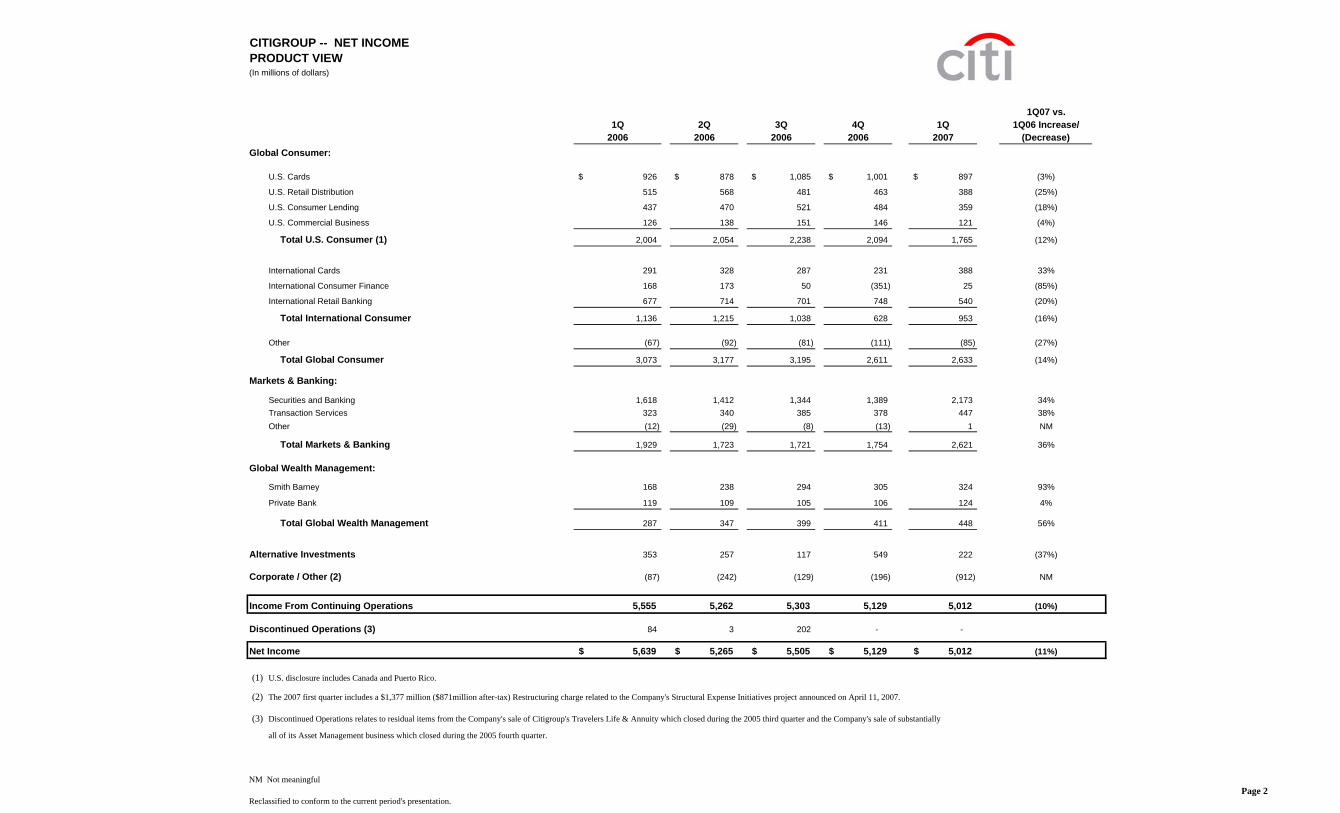
CITIGROUP -- NET INCOMEPRODUCT VIEW(In millions of dollars)
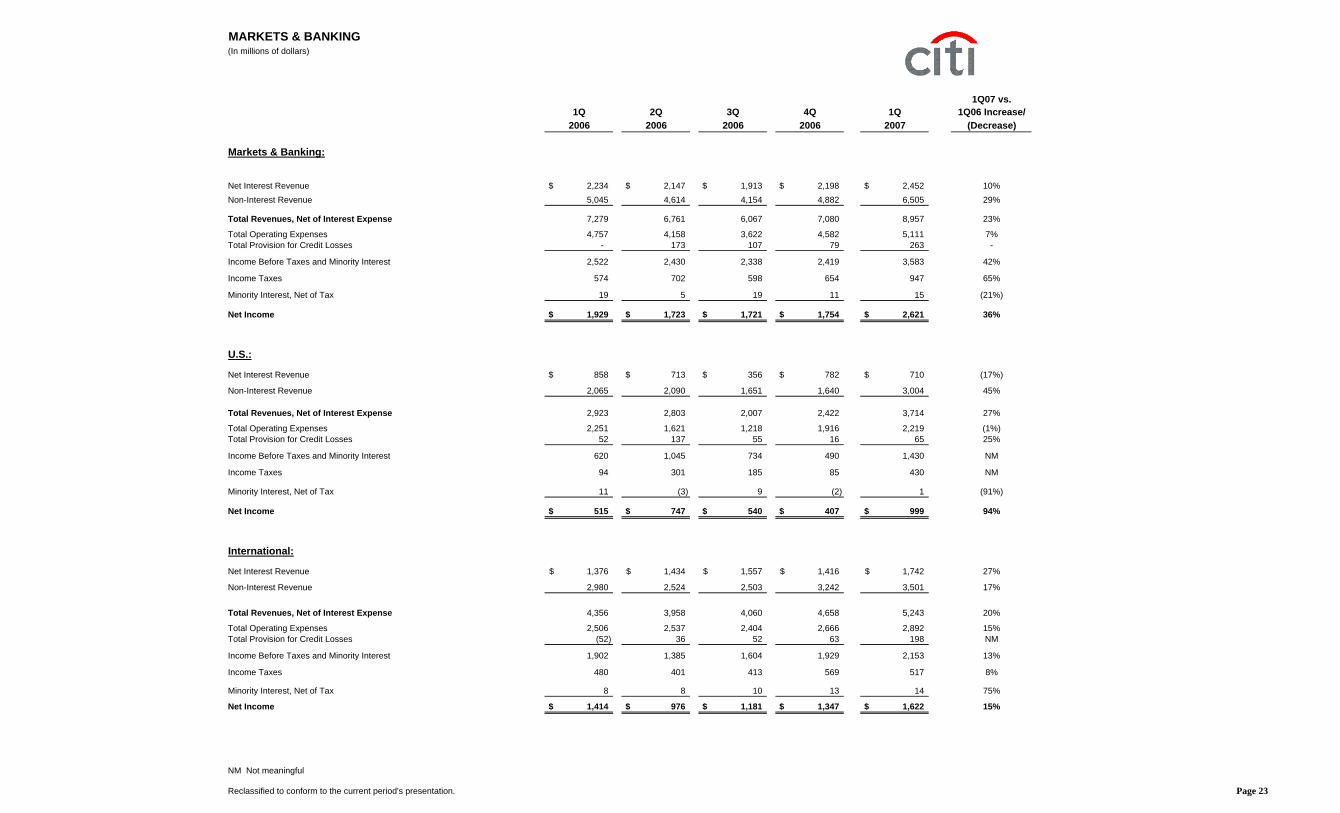
Total Markets & Banking 1,929 1,723 1,721 1,754 2,621 36%
Global Wealth Management:
Smith Barney 168 238 294 305 324 93%
Private Bank 119 109 105 106 124 4%
Total Global Wealth Management 287 347 399 411 448 56%
Alternative Investments 353 257 117 549 222 (37%)
Corporate / Other (2) (87) (242) (129) (196) (912) NM
Income From Continuing Operations 5,555 5,262 5,303 5,129 5,012 (10%)
Discontinued Operations (3) 84 3 202 - -
Net Income 5,639$ 5,265$ 5,505$ 5,129$ 5,012$ (11%)
(1) U.S. disclosure includes Canada and Puerto Rico.
(2) The 2007 first quarter includes a $1,377 million ($871million after-tax) Restructuring charge related to the Company's Structural Expense Initiatives project announced on April 11, 2007.
(3) Discontinued Operations relates to residual items from the Company's sale of Citigroup's Travelers Life & Annuity which closed during the 2005 third quarter and the Company's sale of substantially
all of its Asset Management business which closed during the 2005 fourth quarter.
NM Not meaningful
Reclassified to conform to the current period's presentation.Page 2
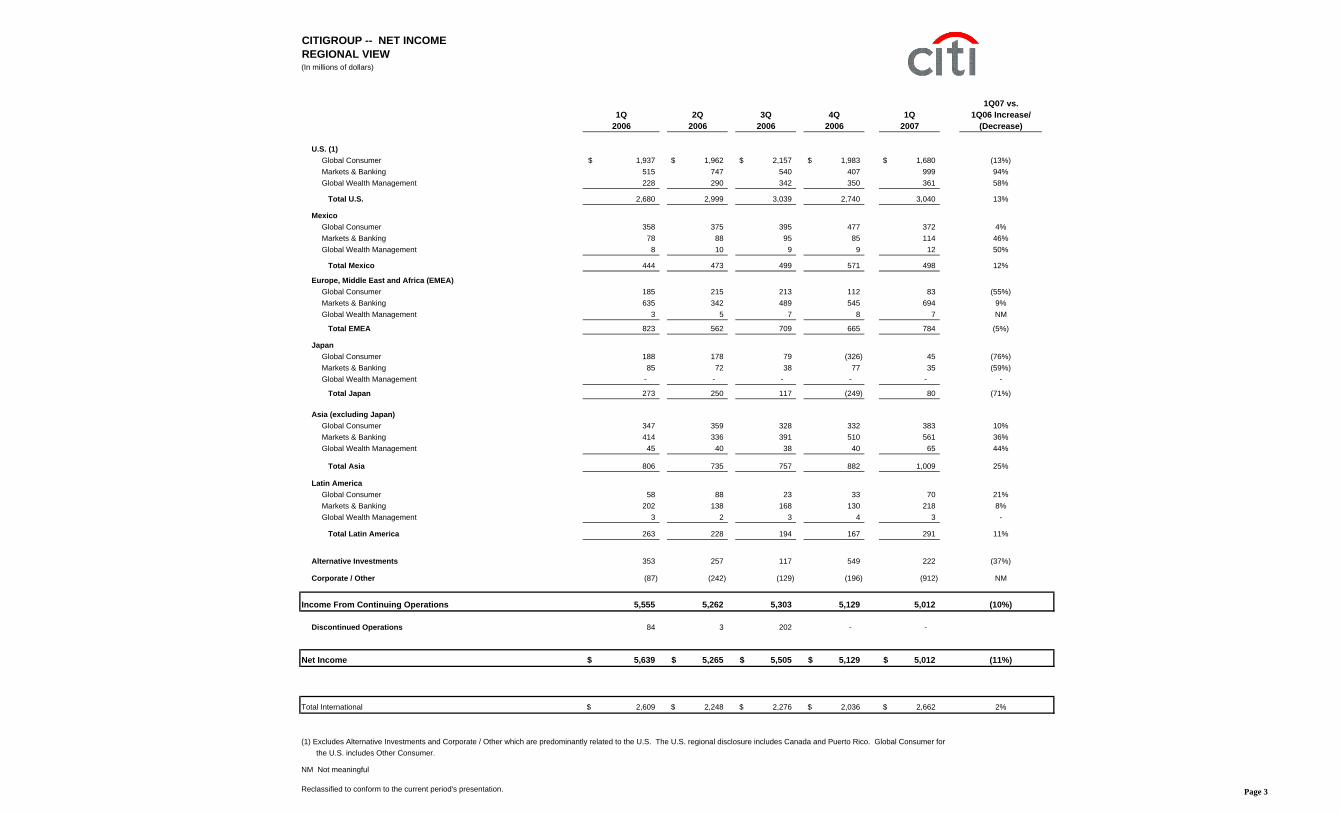
CITIGROUP -- NET INCOMEREGIONAL VIEW(In millions of dollars)
Income From Continuing Operations 5,555 5,262 5,303 5,129 5,012 (10%)
Discontinued Operations 84 3 202 - -
Net Income 5,639$ 5,265$ 5,505$ 5,129$ 5,012$ (11%)
Total International 2,609$ 2,248$ 2,276$ 2,036$ 2,662$ 2%
(1) Excludes Alternative Investments and Corporate / Other which are predominantly related to the U.S. The U.S. regional disclosure includes Canada and Puerto Rico. Global Consumer for the U.S. includes Other Consumer.
NM Not meaningful
Reclassified to conform to the current period's presentation. Page 3
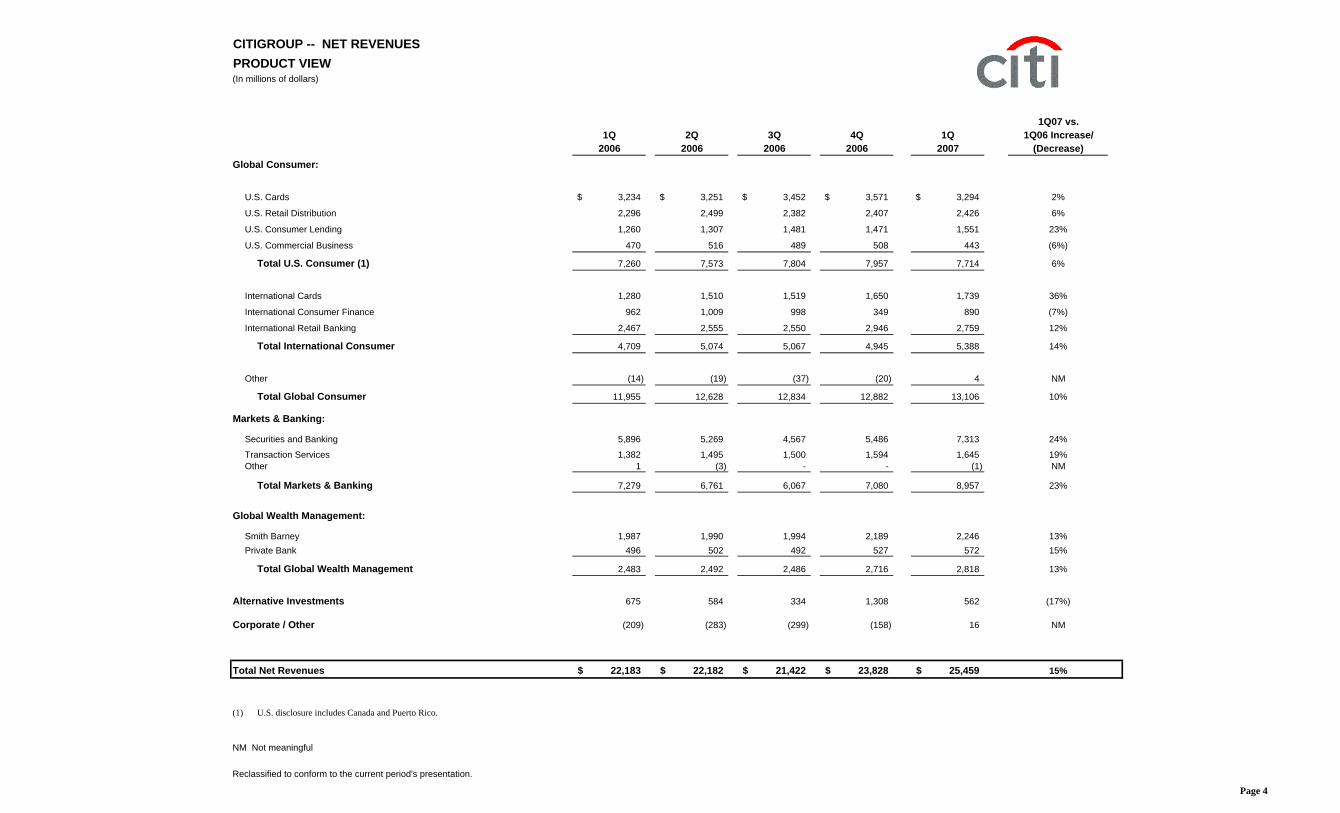
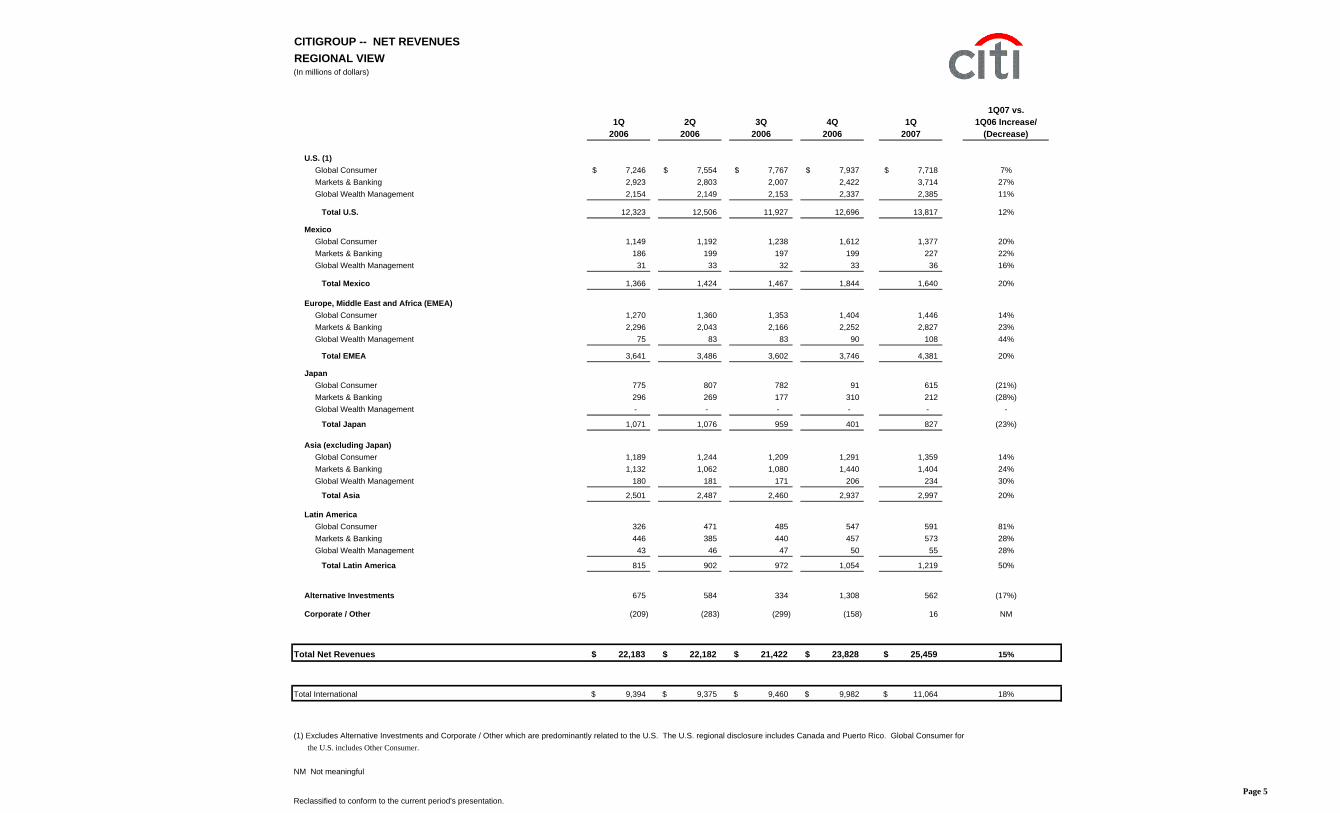
CITIGROUP -- NET REVENUESPRODUCT VIEW(In millions of dollars)
Alternative Investments 675 584 334 1,308 562 (17%)
Corporate / Other (209) (283) (299) (158) 16 NM
Total Net Revenues 22,183$ 22,182$ 21,422$ 23,828$ 25,459$ 15%
Total International 9,394$ 9,375$ 9,460$ 9,982$ 11,064$ 18%
(1) Excludes Alternative Investments and Corporate / Other which are predominantly related to the U.S. The U.S. regional disclosure includes Canada and Puerto Rico. Global Consumer for the U.S. includes Other Consumer.
NM Not meaningful
Reclassified to conform to the current period's presentation.Page 5
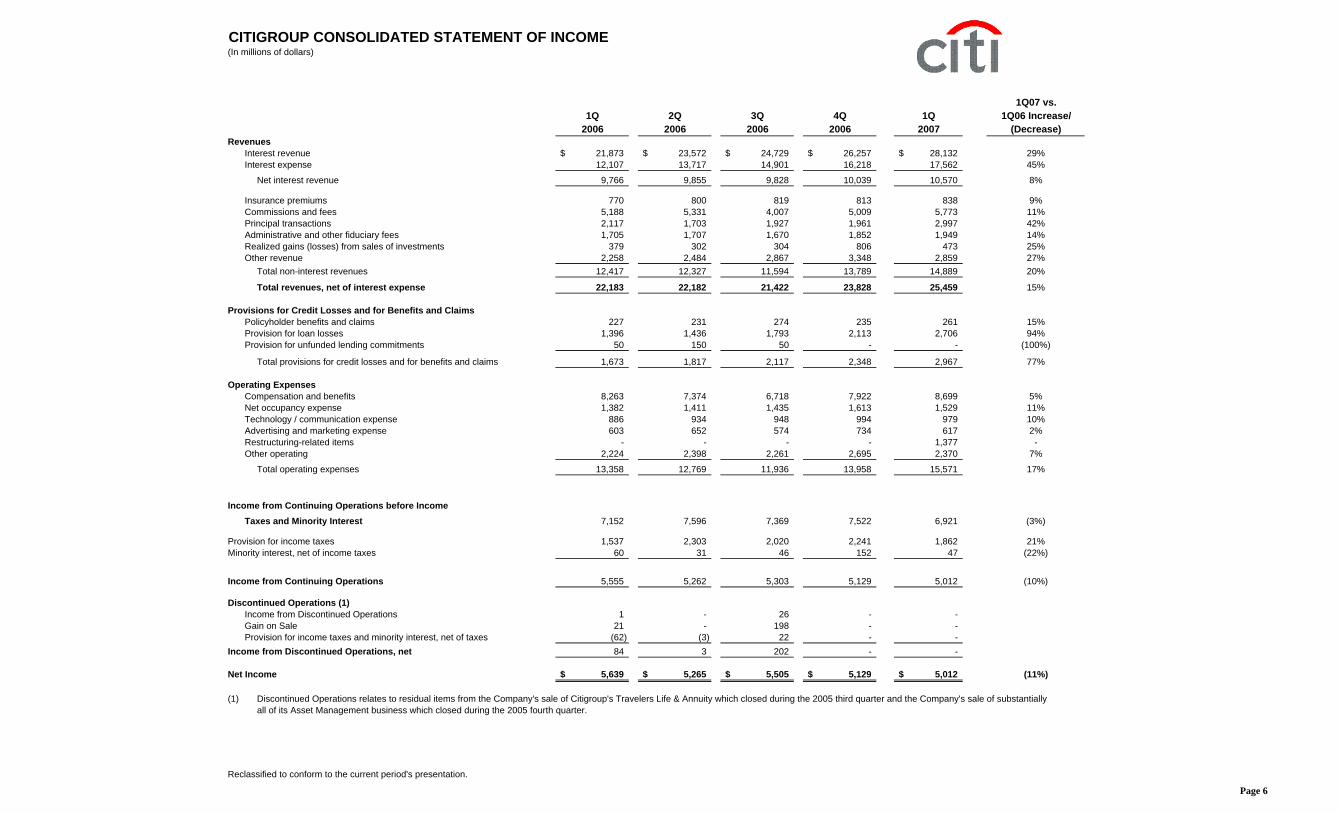
CITIGROUP CONSOLIDATED STATEMENT OF INCOME(In millions of dollars)
Total operating expenses 13,358 12,769 11,936 13,958 15,571 17%
Income from Continuing Operations before IncomeTaxes and Minority Interest 7,152 7,596 7,369 7,522 6,921 (3%)
Provision for income taxes 1,537 2,303 2,020 2,241 1,862 21%Minority interest, net of income taxes 60 31 46 152 47 (22%)
Income from Continuing Operations 5,555 5,262 5,303 5,129 5,012 (10%)
Discontinued Operations (1)Income from Discontinued Operations 1 - 26 - - Gain on Sale 21 - 198 - - Provision for income taxes and minority interest, net of taxes (62) (3) 22 - -
Income from Discontinued Operations, net 84 3 202 - -
Net Income 5,639$ 5,265$ 5,505$ 5,129$ 5,012$ (11%)
(1) Discontinued Operations relates to residual items from the Company's sale of Citigroup's Travelers Life & Annuity which closed during the 2005 third quarter and the Company's sale of substantiallyall of its Asset Management business which closed during the 2005 fourth quarter.
Reclassified to conform to the current period's presentation.
Page 6
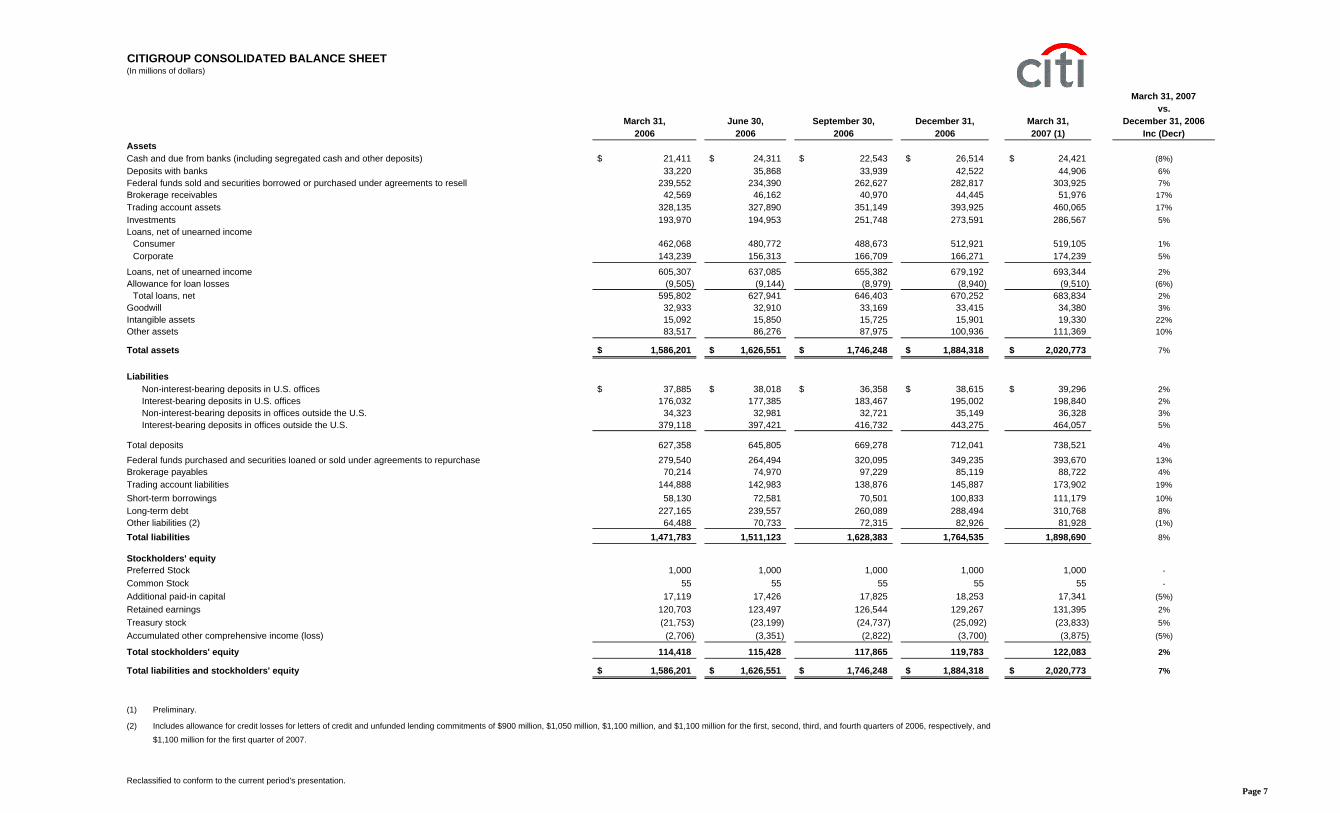
CITIGROUP CONSOLIDATED BALANCE SHEET(In millions of dollars)
March 31, 2007vs.
March 31, June 30, September 30, December 31, March 31, December 31, 20062006 2006 2006 2006 2007 (1) Inc (Decr)
AssetsCash and due from banks (including segregated cash and other deposits) 21,411$ 24,311$ 22,543$ 26,514$ 24,421$ (8%)Deposits with banks 33,220 35,868 33,939 42,522 44,906 6%Federal funds sold and securities borrowed or purchased under agreements to resell 239,552 234,390 262,627 282,817 303,925 7%Brokerage receivables 42,569 46,162 40,970 44,445 51,976 17%Trading account assets 328,135 327,890 351,149 393,925 460,065 17%Investments 193,970 194,953 251,748 273,591 286,567 5%Loans, net of unearned income
Total assets 1,586,201$ 1,626,551$ 1,746,248$ 1,884,318$ 2,020,773$ 7%
LiabilitiesNon-interest-bearing deposits in U.S. offices 37,885$ 38,018$ 36,358$ 38,615$ 39,296$ 2%Interest-bearing deposits in U.S. offices 176,032 177,385 183,467 195,002 198,840 2%Non-interest-bearing deposits in offices outside the U.S. 34,323 32,981 32,721 35,149 36,328 3%Interest-bearing deposits in offices outside the U.S. 379,118 397,421 416,732 443,275 464,057 5%
Total deposits 627,358 645,805 669,278 712,041 738,521 4%
Federal funds purchased and securities loaned or sold under agreements to repurchase 279,540 264,494 320,095 349,235 393,670 13%Brokerage payables 70,214 74,970 97,229 85,119 88,722 4%Trading account liabilities 144,888 142,983 138,876 145,887 173,902 19%Short-term borrowings 58,130 72,581 70,501 100,833 111,179 10%Long-term debt 227,165 239,557 260,089 288,494 310,768 8%Other liabilities (2) 64,488 70,733 72,315 82,926 81,928 (1%)
Total stockholders' equity 114,418 115,428 117,865 119,783 122,083 2%
Total liabilities and stockholders' equity 1,586,201$ 1,626,551$ 1,746,248$ 1,884,318$ 2,020,773$ 7%
(1) Preliminary.
(2) Includes allowance for credit losses for letters of credit and unfunded lending commitments of $900 million, $1,050 million, $1,100 million, and $1,100 million for the first, second, third, and fourth quarters of 2006, respectively, and$1,100 million for the first quarter of 2007.
Reclassified to conform to the current period's presentation.Page 7
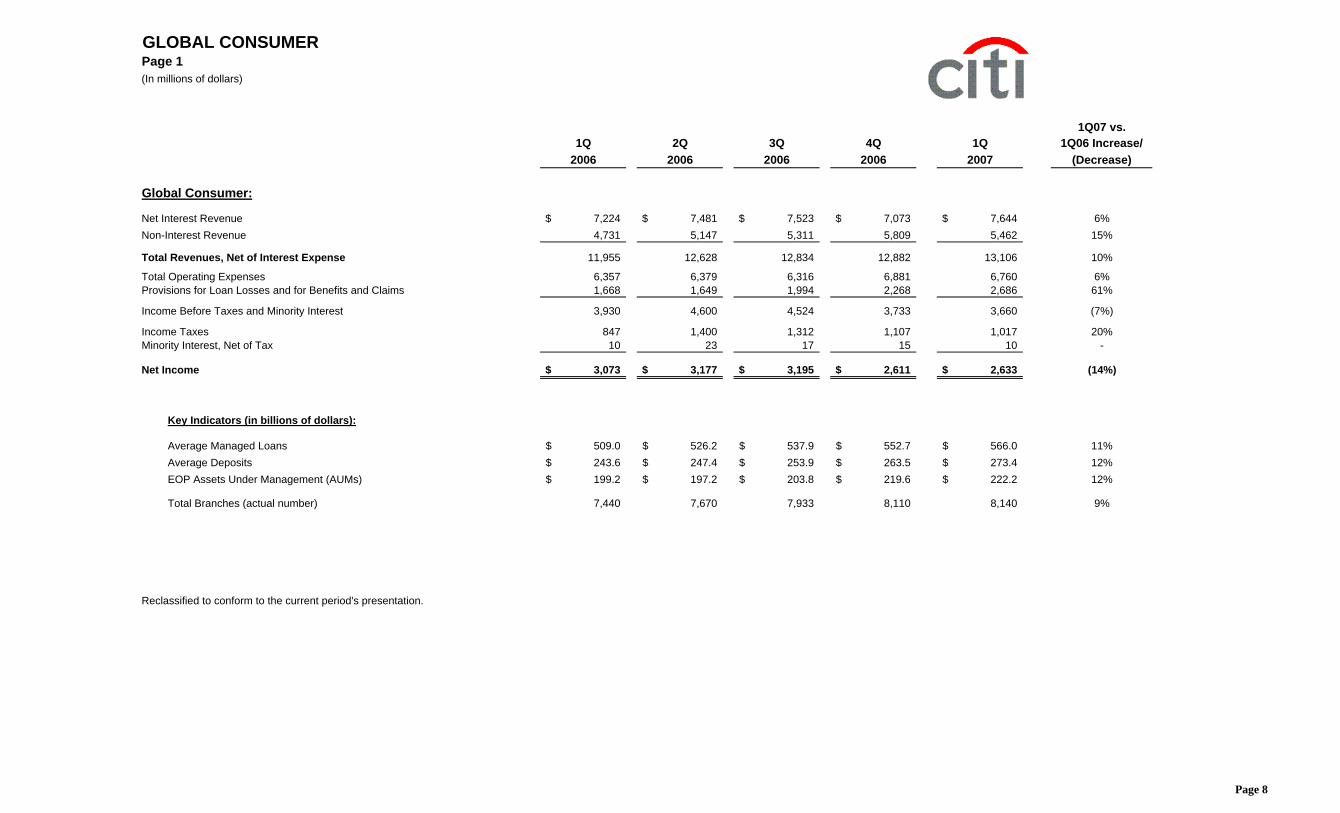
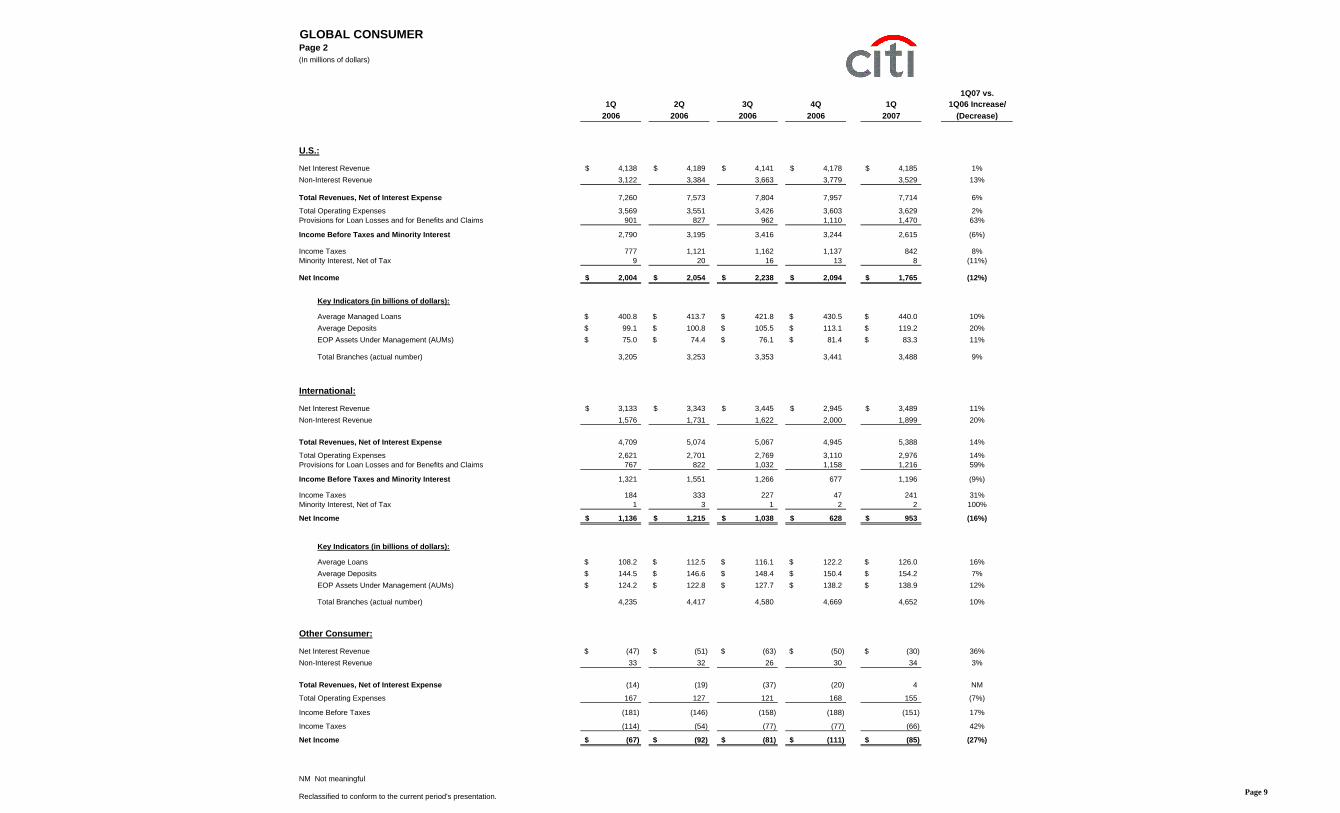
Total Revenues, Net of Interest Expense (14) (19) (37) (20) 4 NM
Total Operating Expenses 167 127 121 168 155 (7%)
Income Before Taxes (181) (146) (158) (188) (151) 17%
Income Taxes (114) (54) (77) (77) (66) 42%
Net Income (67)$ (92)$ (81)$ (111)$ (85)$ (27%)
NM Not meaningful
Reclassified to conform to the current period's presentation. Page 9
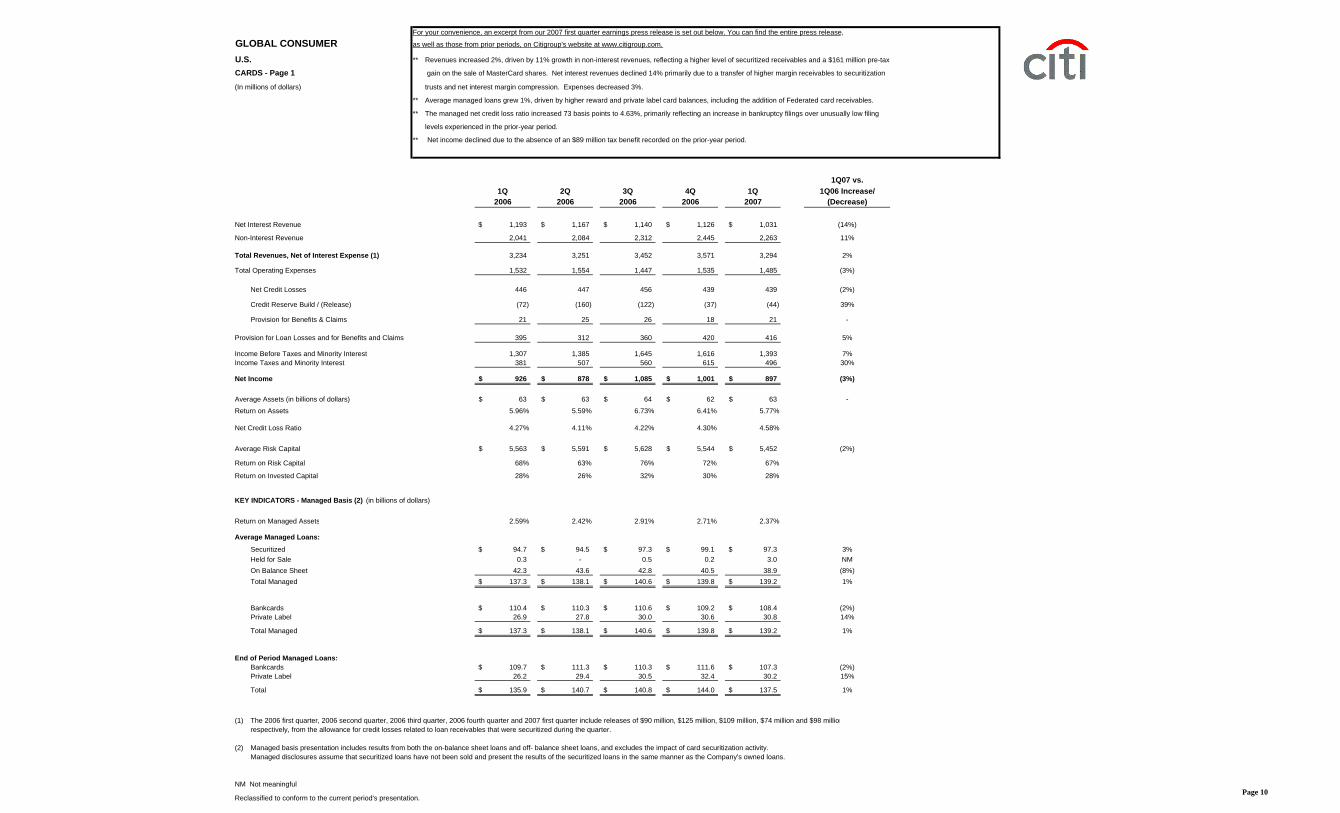
For your convenience, an excerpt from our 2007 first quarter earnings press release is set out below. You can find the entire press release,
GLOBAL CONSUMER as well as those from prior periods, on Citigroup's website at www.citigroup.com.
U.S. ** Revenues increased 2%, driven by 11% growth in non-interest revenues, reflecting a higher level of securitized receivables and a $161 million pre-tax
CARDS - Page 1 gain on the sale of MasterCard shares. Net interest revenues declined 14% primarily due to a transfer of higher margin receivables to securitization
(In millions of dollars) trusts and net interest margin compression. Expenses decreased 3%.
** Average managed loans grew 1%, driven by higher reward and private label card balances, including the addition of Federated card receivables.
** The managed net credit loss ratio increased 73 basis points to 4.63%, primarily reflecting an increase in bankruptcy filings over unusually low filing
levels experienced in the prior-year period.
** Net income declined due to the absence of an $89 million tax benefit recorded on the prior-year period.
1Q07 vs.1Q 2Q 3Q 4Q 1Q 1Q06 Increase/
2006 2006 2006 2006 2007 (Decrease)
Net Interest Revenue 1,193$ 1,167$ 1,140$ 1,126$ 1,031$ (14%)
Total Managed 137.3$ 138.1$ 140.6$ 139.8$ 139.2$ 1%
End of Period Managed Loans:Bankcards 109.7$ 111.3$ 110.3$ 111.6$ 107.3$ (2%)Private Label 26.2 29.4 30.5 32.4 30.2 15%
Total 135.9$ 140.7$ 140.8$ 144.0$ 137.5$ 1%
(1) The 2006 first quarter, 2006 second quarter, 2006 third quarter, 2006 fourth quarter and 2007 first quarter include releases of $90 million, $125 million, $109 million, $74 million and $98 millionrespectively, from the allowance for credit losses related to loan receivables that were securitized during the quarter.
(2) Managed basis presentation includes results from both the on-balance sheet loans and off- balance sheet loans, and excludes the impact of card securitization activity.Managed disclosures assume that securitized loans have not been sold and present the results of the securitized loans in the same manner as the Company's owned loans.
NM Not meaningful
Reclassified to conform to the current period's presentation.Page 10
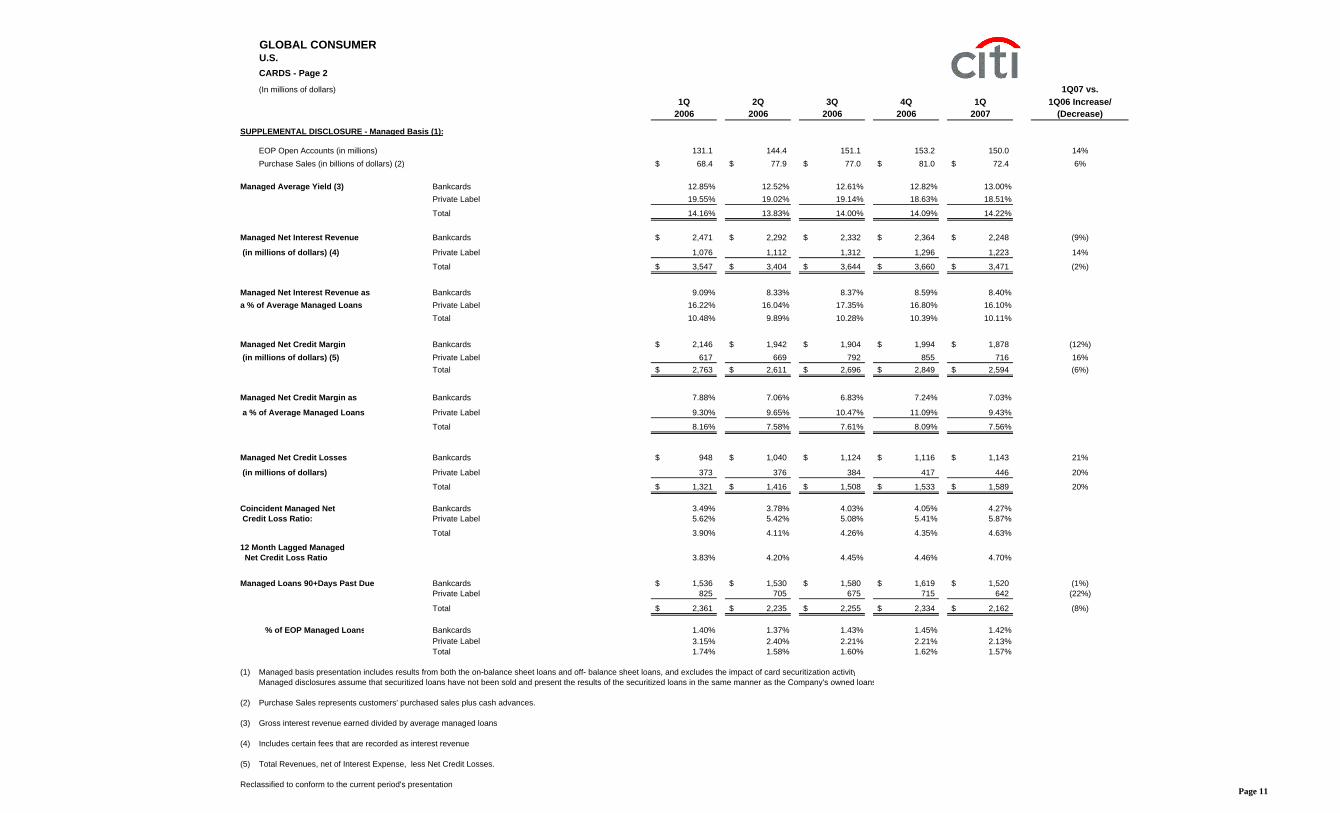
GLOBAL CONSUMERU.S.CARDS - Page 2
(In millions of dollars) 1Q07 vs.1Q 2Q 3Q 4Q 1Q 1Q06 Increase/
2006 2006 2006 2006 2007 (Decrease)
SUPPLEMENTAL DISCLOSURE - Managed Basis (1):
EOP Open Accounts (in millions) 131.1 144.4 151.1 153.2 150.0 14%Purchase Sales (in billions of dollars) (2) 68.4$ 77.9$ 77.0$ 81.0$ 72.4$ 6%
(1) Managed basis presentation includes results from both the on-balance sheet loans and off- balance sheet loans, and excludes the impact of card securitization activityManaged disclosures assume that securitized loans have not been sold and present the results of the securitized loans in the same manner as the Company's owned loans
(2) Purchase Sales represents customers' purchased sales plus cash advances.
(3) Gross interest revenue earned divided by average managed loans.
(4) Includes certain fees that are recorded as interest revenue.
(5) Total Revenues, net of Interest Expense, less Net Credit Losses.
Reclassified to conform to the current period's presentation.Page 11
For your convenience, an excerpt from our 2007 first quarter earnings press release is set out below. You can find the entire press release,
GLOBAL CONSUMER as well as those from prior periods, on Citigroup's website at www.citigroup.com.
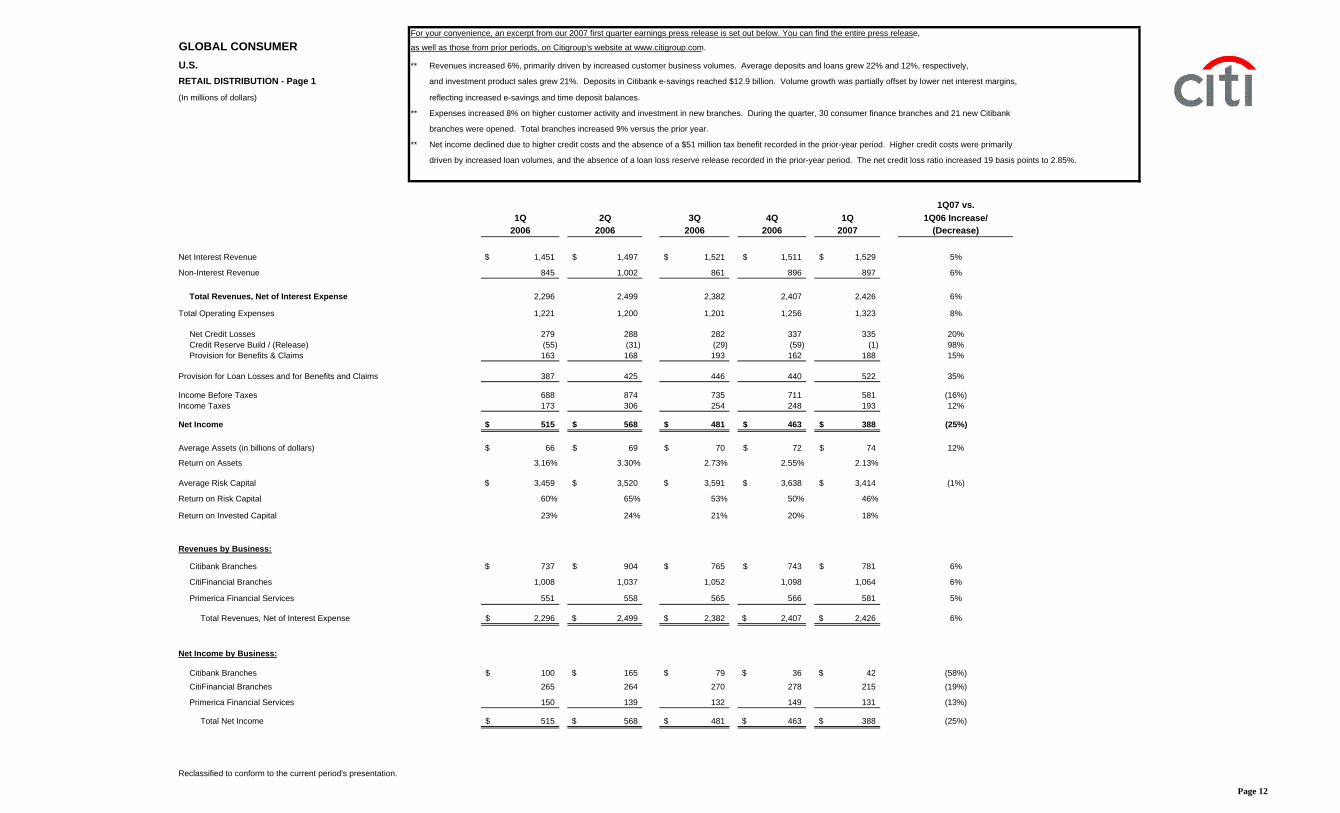
U.S. ** Revenues increased 6%, primarily driven by increased customer business volumes. Average deposits and loans grew 22% and 12%, respectively,
RETAIL DISTRIBUTION - Page 1 and investment product sales grew 21%. Deposits in Citibank e-savings reached $12.9 billion. Volume growth was partially offset by lower net interest margins,
(In millions of dollars) reflecting increased e-savings and time deposit balances.
** Expenses increased 8% on higher customer activity and investment in new branches. During the quarter, 30 consumer finance branches and 21 new Citibank
branches were opened. Total branches increased 9% versus the prior year.
** Net income declined due to higher credit costs and the absence of a $51 million tax benefit recorded in the prior-year period. Higher credit costs were primarily
driven by increased loan volumes, and the absence of a loan loss reserve release recorded in the prior-year period. The net credit loss ratio increased 19 basis points to 2.85%.
1Q07 vs.1Q 2Q 3Q 4Q 1Q 1Q06 Increase/
2006 2006 2006 2006 2007 (Decrease)
Net Interest Revenue 1,451$ 1,497$ 1,521$ 1,511$ 1,529$ 5%
Non-Interest Revenue 845 1,002 861 896 897 6%
Total Revenues, Net of Interest Expense 2,296 2,499 2,382 2,407 2,426 6%
Total Operating Expenses 1,221 1,200 1,201 1,256 1,323 8%
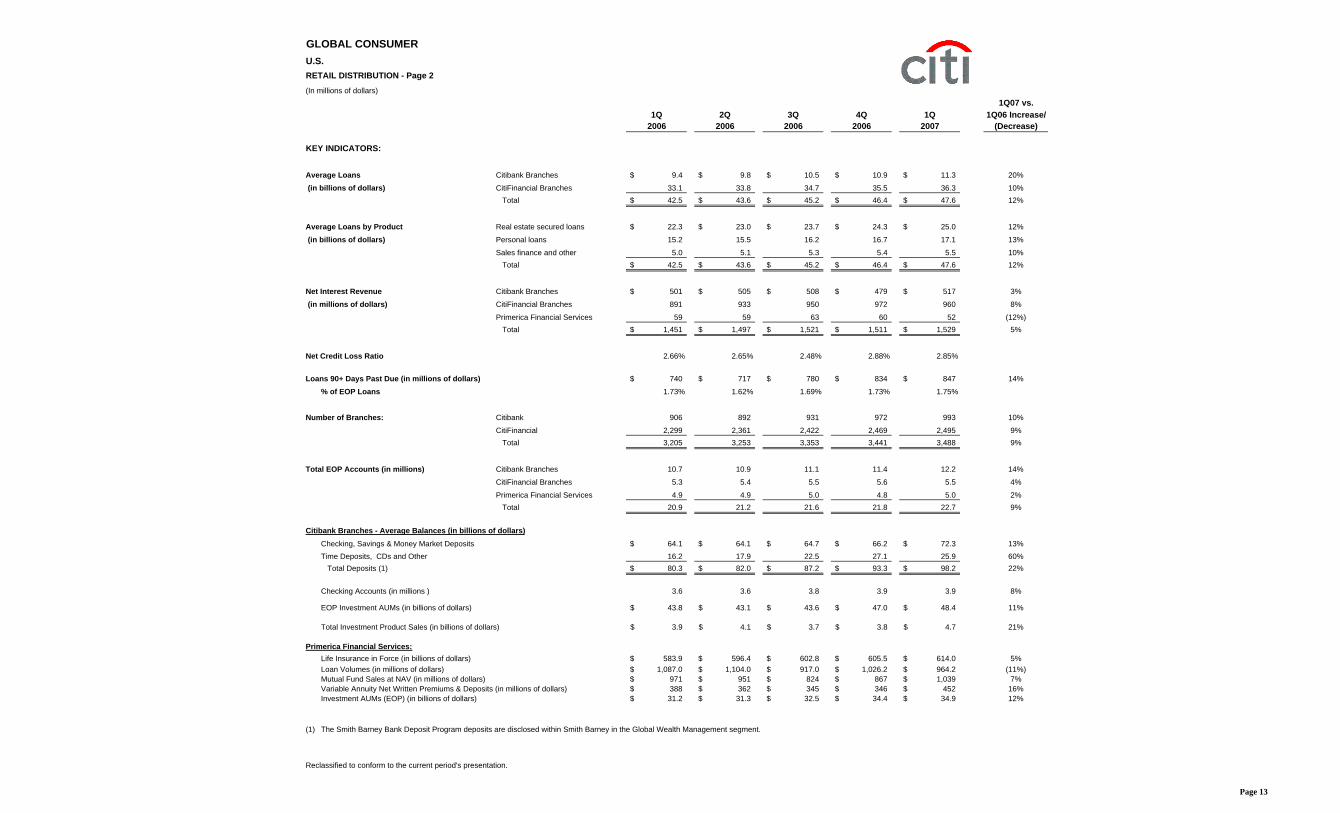
Citibank Branches - Average Balances (in billions of dollars)Checking, Savings & Money Market Deposits 64.1$ 64.1$ 64.7$ 66.2$ 72.3$ 13%Time Deposits, CDs and Other 16.2 17.9 22.5 27.1 25.9 60% Total Deposits (1) 80.3$ 82.0$ 87.2$ 93.3$ 98.2$ 22%
Checking Accounts (in millions ) 3.6 3.6 3.8 3.9 3.9 8%
EOP Investment AUMs (in billions of dollars) 43.8$ 43.1$ 43.6$ 47.0$ 48.4$ 11%
Total Investment Product Sales (in billions of dollars) 3.9$ 4.1$ 3.7$ 3.8$ 4.7$ 21%
Primerica Financial Services:Life Insurance in Force (in billions of dollars) 583.9$ 596.4$ 602.8$ 605.5$ 614.0$ 5%Loan Volumes (in millions of dollars) 1,087.0$ 1,104.0$ 917.0$ 1,026.2$ 964.2$ (11%)Mutual Fund Sales at NAV (in millions of dollars) 971$ 951$ 824$ 867$ 1,039$ 7%Variable Annuity Net Written Premiums & Deposits (in millions of dollars) 388$ 362$ 345$ 346$ 452$ 16%Investment AUMs (EOP) (in billions of dollars) 31.2$ 31.3$ 32.5$ 34.4$ 34.9$ 12%
(1) The Smith Barney Bank Deposit Program deposits are disclosed within Smith Barney in the Global Wealth Management segment.
Reclassified to conform to the current period's presentation.
Page 13
For your convenience, an excerpt from our 2007 first quarter earnings press release is set out below. You can find the entire press release,
GLOBAL CONSUMER as well as those from prior periods, on Citigroup's website at www.citigroup.com.
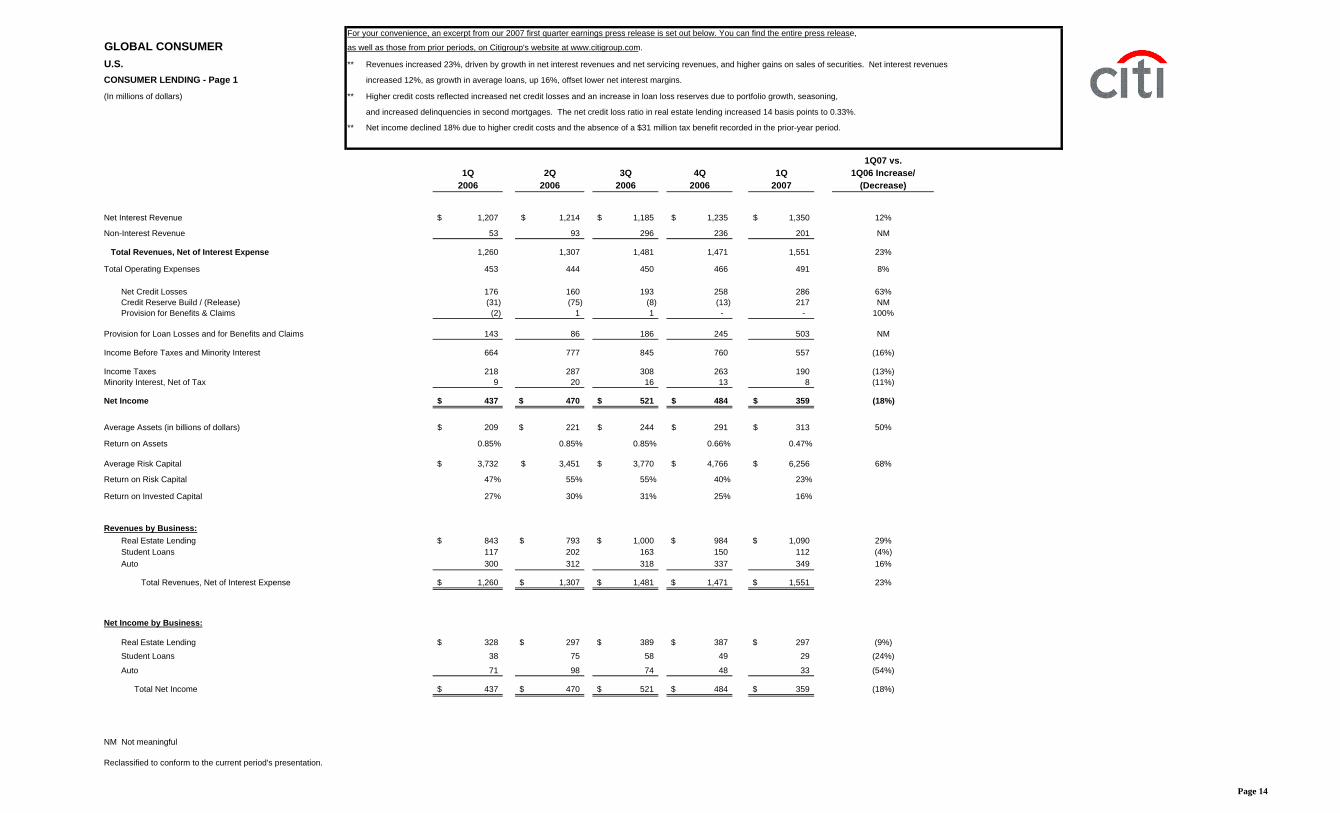
U.S. ** Revenues increased 23%, driven by growth in net interest revenues and net servicing revenues, and higher gains on sales of securities. Net interest revenues
CONSUMER LENDING - Page 1 increased 12%, as growth in average loans, up 16%, offset lower net interest margins.
(In millions of dollars) ** Higher credit costs reflected increased net credit losses and an increase in loan loss reserves due to portfolio growth, seasoning,
and increased delinquencies in second mortgages. The net credit loss ratio in real estate lending increased 14 basis points to 0.33%.
** Net income declined 18% due to higher credit costs and the absence of a $31 million tax benefit recorded in the prior-year period.
1Q07 vs.1Q 2Q 3Q 4Q 1Q 1Q06 Increase/
2006 2006 2006 2006 2007 (Decrease)
Net Interest Revenue 1,207$ 1,214$ 1,185$ 1,235$ 1,350$ 12%
Non-Interest Revenue 53 93 296 236 201 NM
Total Revenues, Net of Interest Expense 1,260 1,307 1,481 1,471 1,551 23%
Reclassified to conform to the current period's presentation.
Page 14
GLOBAL CONSUMERU.S.CONSUMER LENDING - Page 2
1Q07 vs.1Q 2Q 3Q 4Q 1Q 1Q06 Increase/
2006 2006 2006 2006 2007 (Decrease)
KEY INDICATORS:
Real Estate Lending - Balances (in billions of dollars):
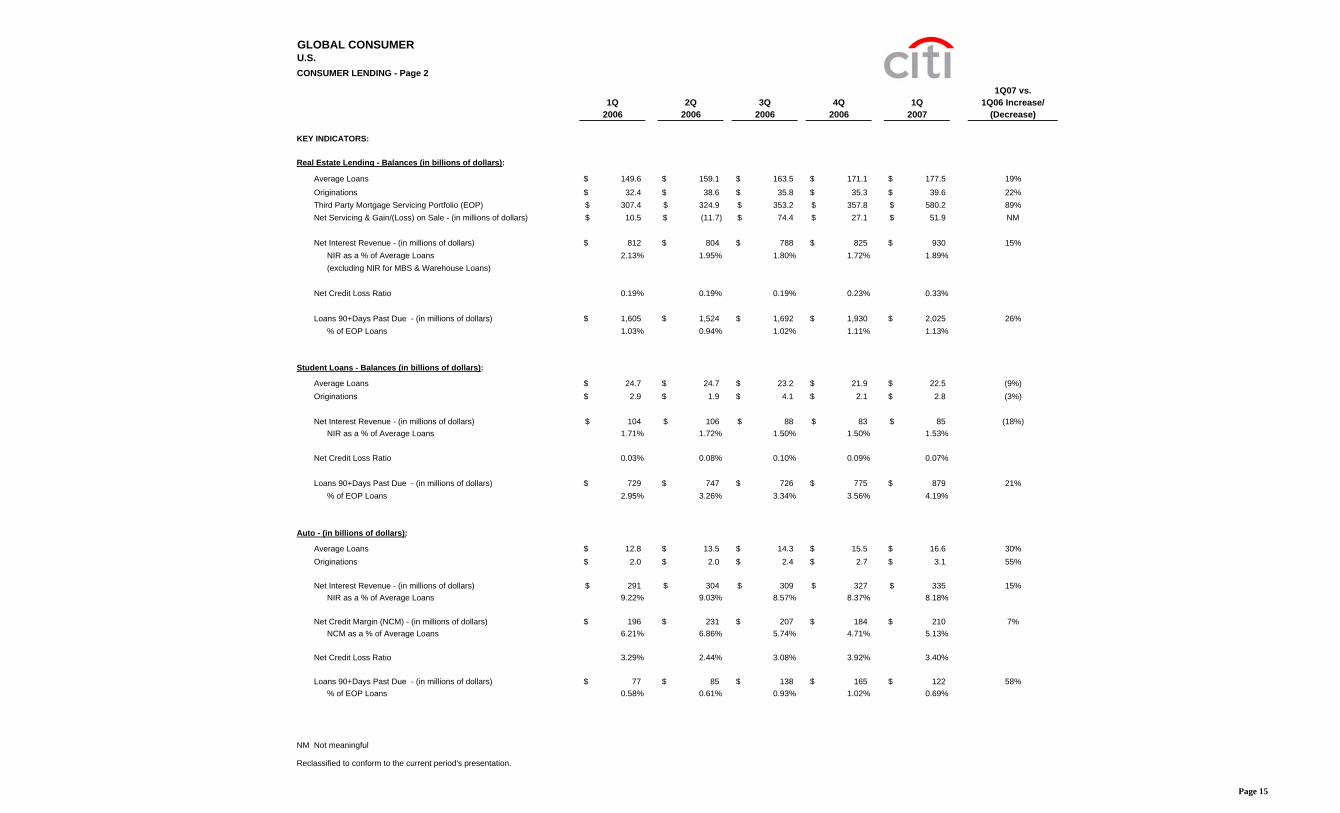
Average Loans 149.6$ 159.1$ 163.5$ 171.1$ 177.5$ 19%
Originations 32.4$ 38.6$ 35.8$ 35.3$ 39.6$ 22%Third Party Mortgage Servicing Portfolio (EOP) 307.4$ 324.9$ 353.2$ 357.8$ 580.2$ 89%Net Servicing & Gain/(Loss) on Sale - (in millions of dollars) 10.5$ (11.7)$ 74.4$ 27.1$ 51.9$ NM
Net Interest Revenue - (in millions of dollars) 812$ 804$ 788$ 825$ 930$ 15%NIR as a % of Average Loans 2.13% 1.95% 1.80% 1.72% 1.89%(excluding NIR for MBS & Warehouse Loans)
Net Credit Loss Ratio 0.19% 0.19% 0.19% 0.23% 0.33%
Loans 90+Days Past Due - (in millions of dollars) 1,605$ 1,524$ 1,692$ 1,930$ 2,025$ 26%% of EOP Loans 1.03% 0.94% 1.02% 1.11% 1.13%
Student Loans - Balances (in billions of dollars):
Net Interest Revenue - (in millions of dollars) 291$ 304$ 309$ 327$ 335$ 15%NIR as a % of Average Loans 9.22% 9.03% 8.57% 8.37% 8.18%
Net Credit Margin (NCM) - (in millions of dollars) 196$ 231$ 207$ 184$ 210$ 7%NCM as a % of Average Loans 6.21% 6.86% 5.74% 4.71% 5.13%
Net Credit Loss Ratio 3.29% 2.44% 3.08% 3.92% 3.40%
Loans 90+Days Past Due - (in millions of dollars) 77$ 85$ 138$ 165$ 122$ 58%% of EOP Loans 0.58% 0.61% 0.93% 1.02% 0.69%
NM Not meaningful
Reclassified to conform to the current period's presentation.
Page 15
For your convenience, an excerpt from our 2007 first quarter earnings press release is set out below. You can find the entire press release,
GLOBAL CONSUMER as well as those from prior periods, on Citigroup's website at www.citigroup.com.
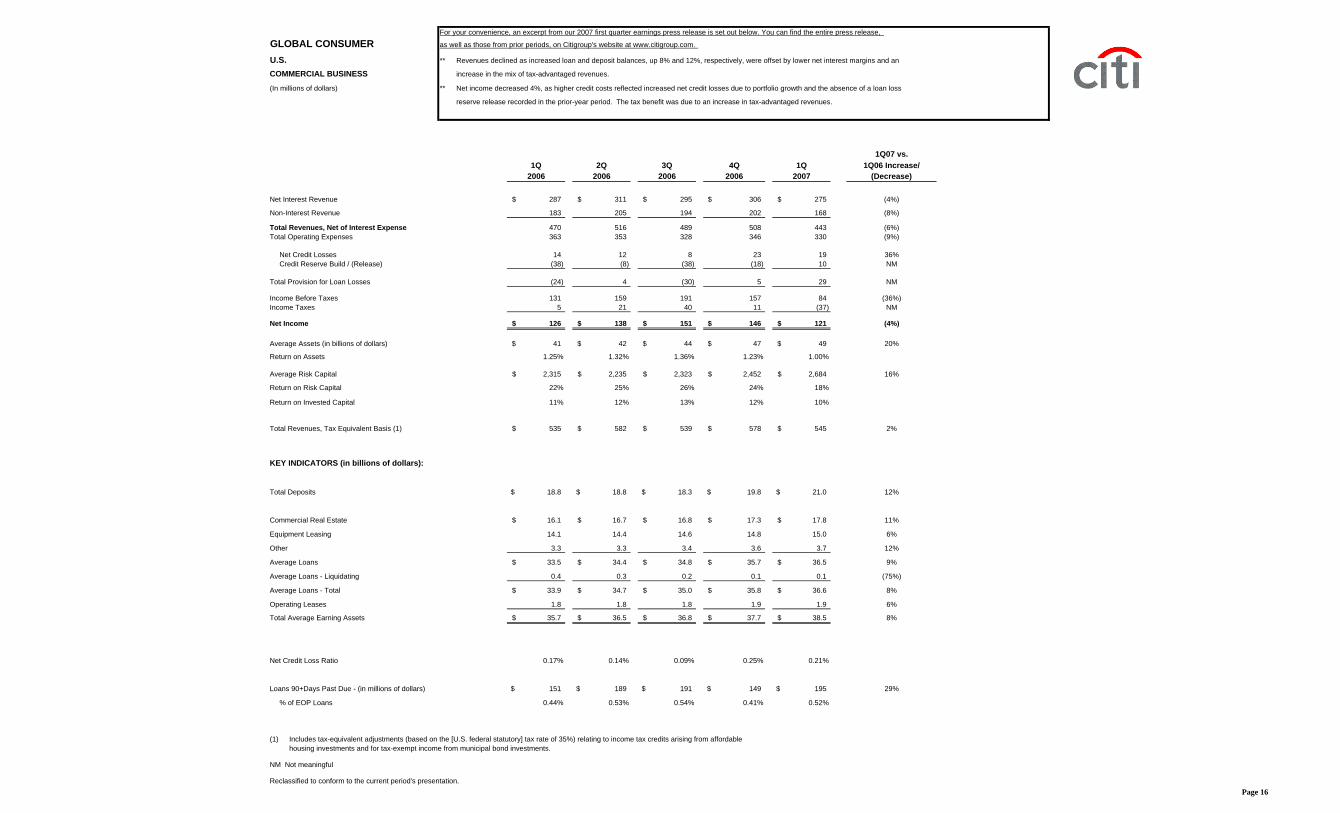
U.S. ** Revenues declined as increased loan and deposit balances, up 8% and 12%, respectively, were offset by lower net interest margins and an
COMMERCIAL BUSINESS increase in the mix of tax-advantaged revenues.
(In millions of dollars) ** Net income decreased 4%, as higher credit costs reflected increased net credit losses due to portfolio growth and the absence of a loan loss
reserve release recorded in the prior-year period. The tax benefit was due to an increase in tax-advantaged revenues.
1Q07 vs.1Q 2Q 3Q 4Q 1Q 1Q06 Increase/
2006 2006 2006 2006 2007 (Decrease)
Net Interest Revenue 287$ 311$ 295$ 306$ 275$ (4%)
Non-Interest Revenue 183 205 194 202 168 (8%)
Total Revenues, Net of Interest Expense 470 516 489 508 443 (6%)Total Operating Expenses 363 353 328 346 330 (9%)
Commercial Real Estate 16.1$ 16.7$ 16.8$ 17.3$ 17.8$ 11%
Equipment Leasing 14.1 14.4 14.6 14.8 15.0 6%
Other 3.3 3.3 3.4 3.6 3.7 12%
Average Loans 33.5$ 34.4$ 34.8$ 35.7$ 36.5$ 9%
Average Loans - Liquidating 0.4 0.3 0.2 0.1 0.1 (75%)
Average Loans - Total 33.9$ 34.7$ 35.0$ 35.8$ 36.6$ 8%
Operating Leases 1.8 1.8 1.8 1.9 1.9 6%
Total Average Earning Assets 35.7$ 36.5$ 36.8$ 37.7$ 38.5$ 8%
Net Credit Loss Ratio 0.17% 0.14% 0.09% 0.25% 0.21%
Loans 90+Days Past Due - (in millions of dollars) 151$ 189$ 191$ 149$ 195$ 29%
% of EOP Loans 0.44% 0.53% 0.54% 0.41% 0.52%
(1) Includes tax-equivalent adjustments (based on the [U.S. federal statutory] tax rate of 35%) relating to income tax credits arising from affordablehousing investments and for tax-exempt income from municipal bond investments.
NM Not meaningful
Reclassified to conform to the current period's presentation.Page 16
For your convenience, an excerpt from our 2007 first quarter earnings press release is set out below. You can find the entire press release,
GLOBAL CONSUMER as well as those from prior periods, on Citigroup's website at www.citigroup.com.
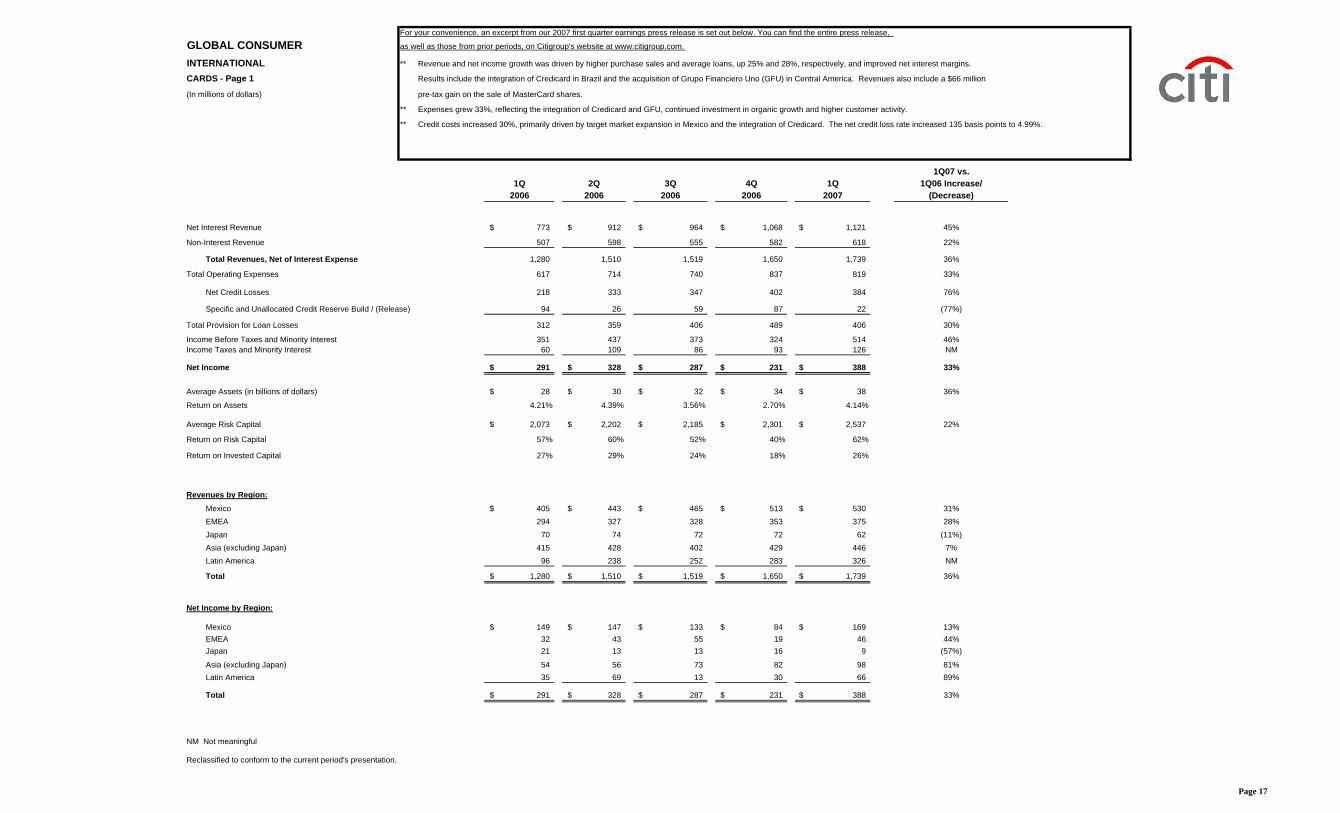
INTERNATIONAL ** Revenue and net income growth was driven by higher purchase sales and average loans, up 25% and 28%, respectively, and improved net interest margins.
CARDS - Page 1 Results include the integration of Credicard in Brazil and the acquisition of Grupo Financiero Uno (GFU) in Central America. Revenues also include a $66 million
(In millions of dollars) pre-tax gain on the sale of MasterCard shares.
** Expenses grew 33%, reflecting the integration of Credicard and GFU, continued investment in organic growth and higher customer activity.
** Credit costs increased 30%, primarily driven by target market expansion in Mexico and the integration of Credicard. The net credit loss rate increased 135 basis points to 4.99%.
1Q07 vs.1Q 2Q 3Q 4Q 1Q 1Q06 Increase/
2006 2006 2006 2006 2007 (Decrease)
Net Interest Revenue 773$ 912$ 964$ 1,068$ 1,121$ 45%
Non-Interest Revenue 507 598 555 582 618 22%
Total Revenues, Net of Interest Expense 1,280 1,510 1,519 1,650 1,739 36%
Total Operating Expenses 617 714 740 837 819 33%
Net Credit Losses 218 333 347 402 384 76%
Specific and Unallocated Credit Reserve Build / (Release) 94 26 59 87 22 (77%)
Total Provision for Loan Losses 312 359 406 489 406 30%
Income Before Taxes and Minority Interest 351 437 373 324 514 46%Income Taxes and Minority Interest 60 109 86 93 126 NM
Net Income 291$ 328$ 287$ 231$ 388$ 33%
Average Assets (in billions of dollars) 28$ 30$ 32$ 34$ 38$ 36%
Return on Assets 4.21% 4.39% 3.56% 2.70% 4.14%
Average Risk Capital 2,073$ 2,202$ 2,185$ 2,301$ 2,537$ 22%
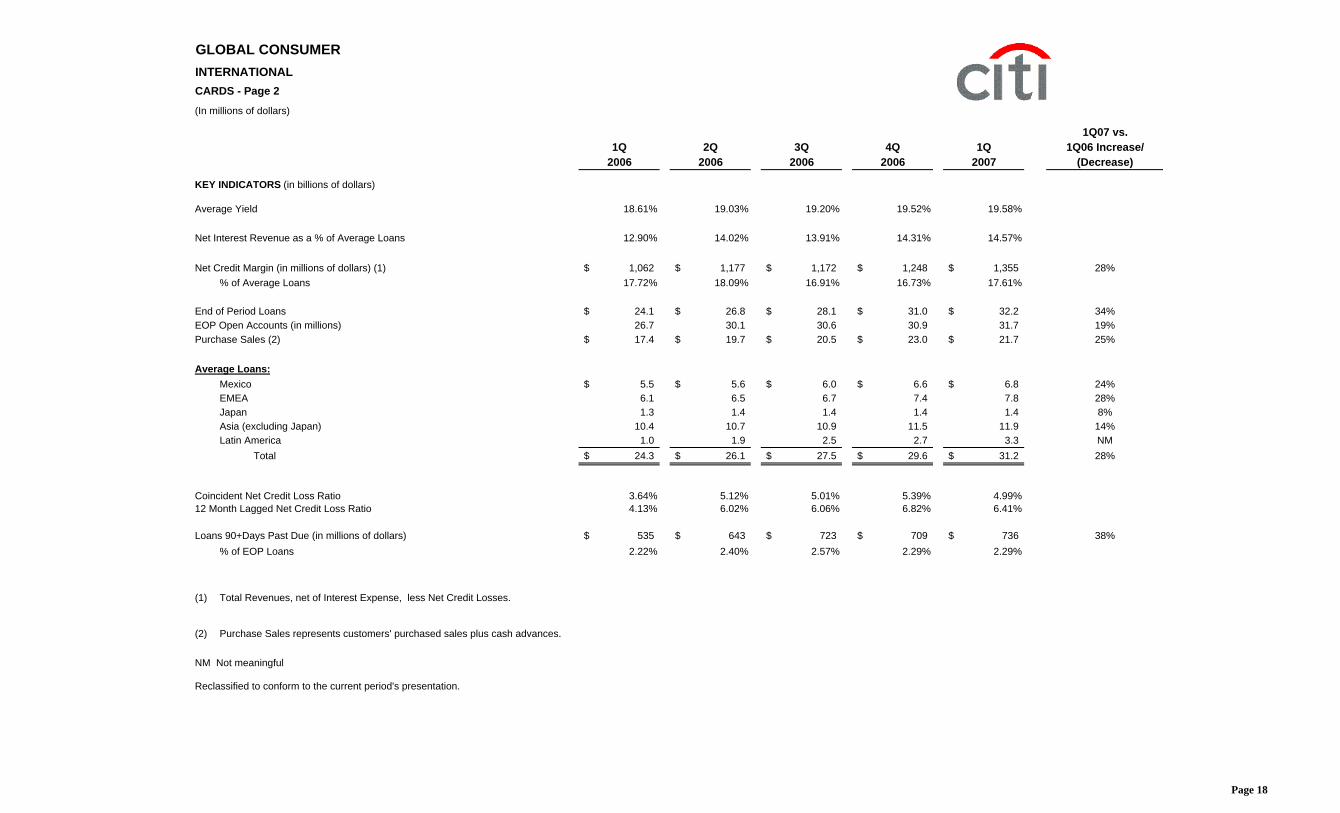
Coincident Net Credit Loss Ratio 3.64% 5.12% 5.01% 5.39% 4.99%12 Month Lagged Net Credit Loss Ratio 4.13% 6.02% 6.06% 6.82% 6.41%
Loans 90+Days Past Due (in millions of dollars) 535$ 643$ 723$ 709$ 736$ 38%% of EOP Loans 2.22% 2.40% 2.57% 2.29% 2.29%
(1) Total Revenues, net of Interest Expense, less Net Credit Losses.
(2) Purchase Sales represents customers' purchased sales plus cash advances.
NM Not meaningful
Reclassified to conform to the current period's presentation.
Page 18
For your convenience, an excerpt from our 2007 first quarter earnings press release is set out below. You can find the entire press release,
GLOBAL CONSUMER as well as those from prior periods, on Citigroup's website at www.citigroup.com.
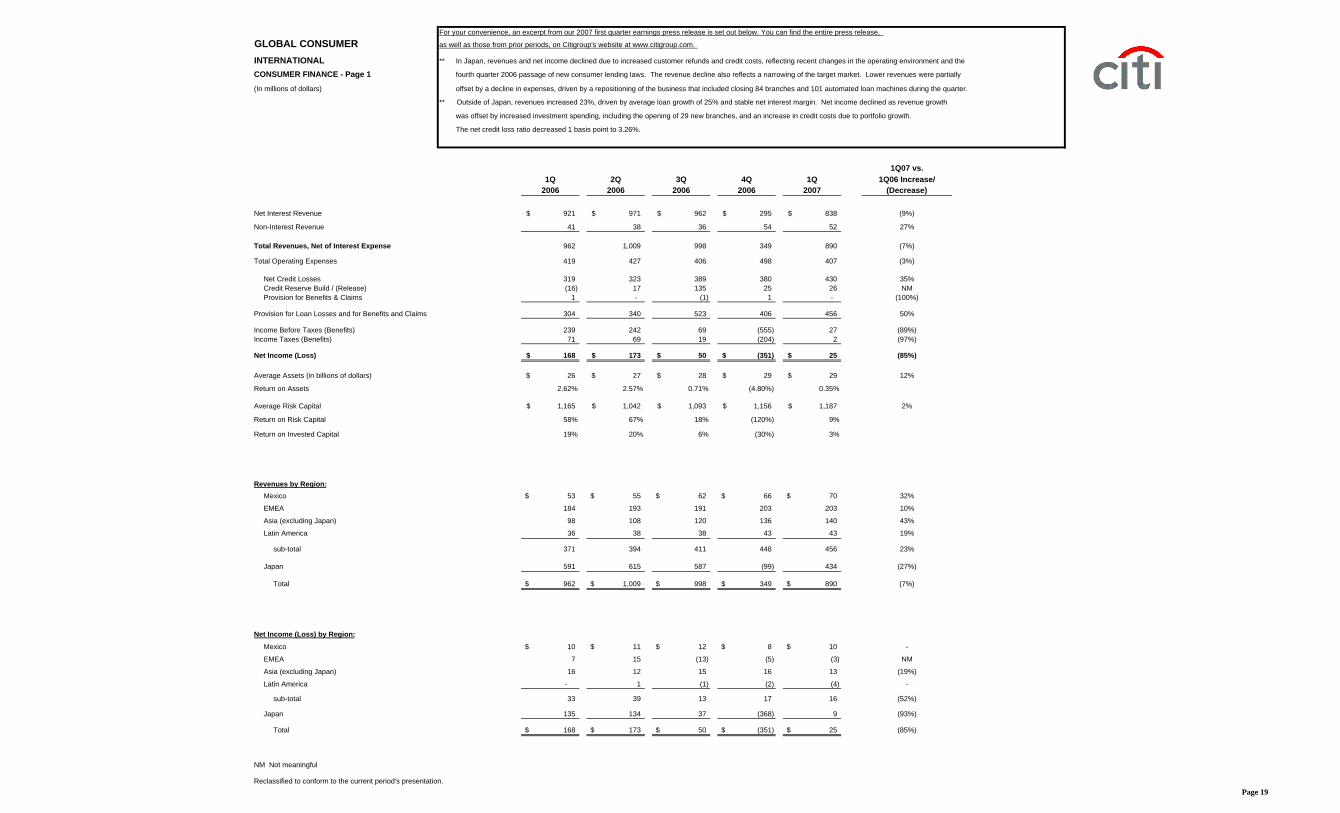
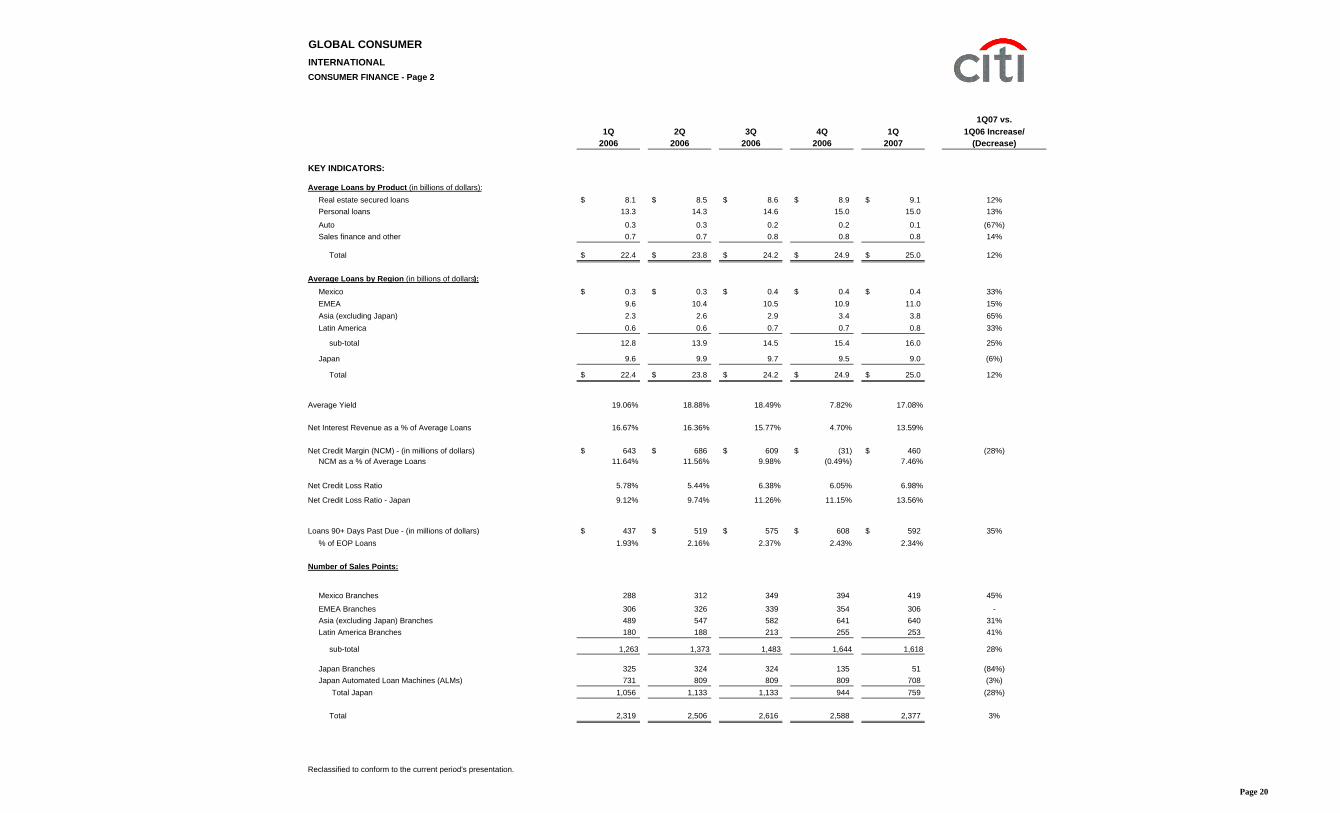
INTERNATIONAL ** In Japan, revenues and net income declined due to increased customer refunds and credit costs, reflecting recent changes in the operating environment and the
CONSUMER FINANCE - Page 1 fourth quarter 2006 passage of new consumer lending laws. The revenue decline also reflects a narrowing of the target market. Lower revenues were partially
(In millions of dollars) offset by a decline in expenses, driven by a repositioning of the business that included closing 84 branches and 101 automated loan machines during the quarter.
** Outside of Japan, revenues increased 23%, driven by average loan growth of 25% and stable net interest margin. Net income declined as revenue growth
was offset by increased investment spending, including the opening of 29 new branches, and an increase in credit costs due to portfolio growth.
The net credit loss ratio decreased 1 basis point to 3.26%.
1Q07 vs.1Q 2Q 3Q 4Q 1Q 1Q06 Increase/
2006 2006 2006 2006 2007 (Decrease)
Net Interest Revenue 921$ 971$ 962$ 295$ 838$ (9%)
Non-Interest Revenue 41 38 36 54 52 27%
Total Revenues, Net of Interest Expense 962 1,009 998 349 890 (7%)
Reclassified to conform to the current period's presentation.
Page 20
For your convenience, an excerpt from our 2007 first quarter earnings press release is set out below. You can find the entire press release,
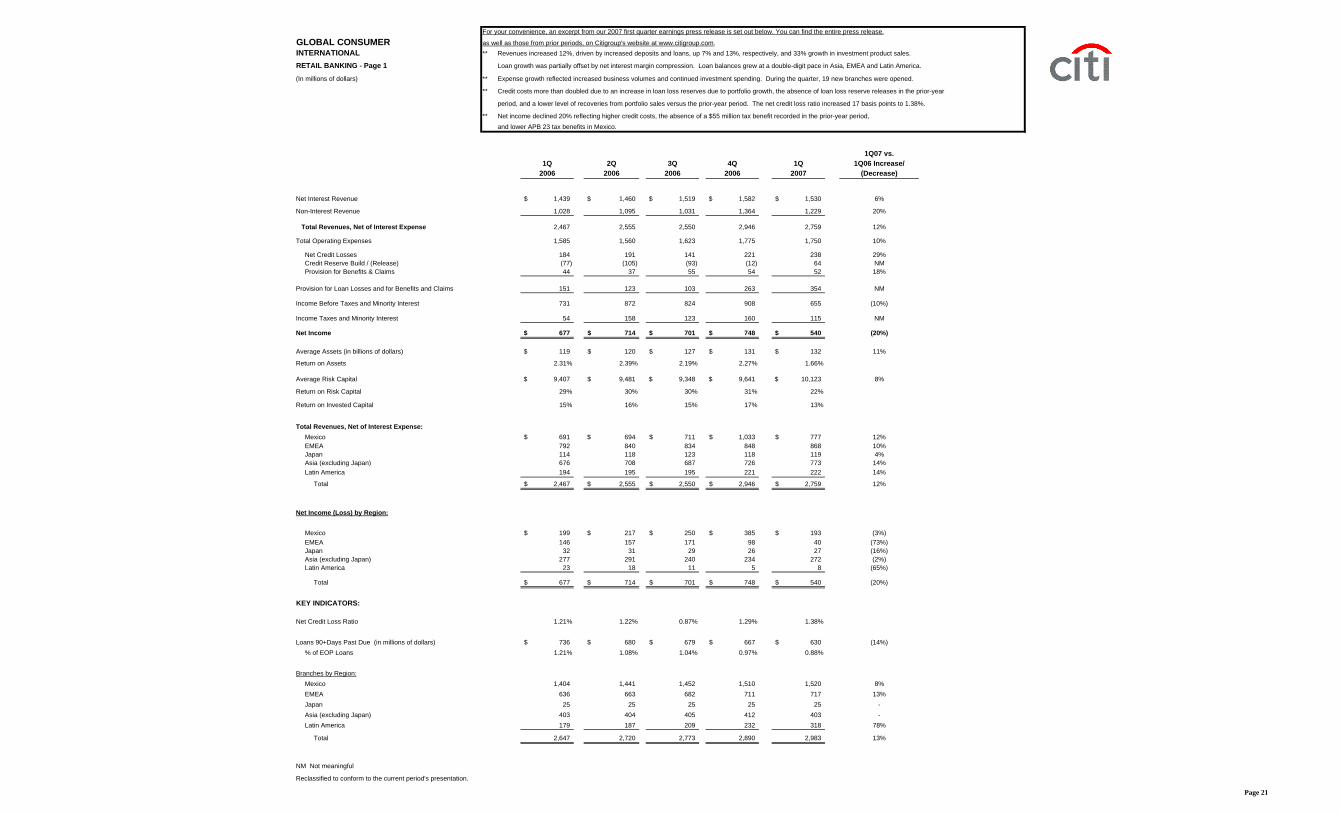
GLOBAL CONSUMER as well as those from prior periods, on Citigroup's website at www.citigroup.com.INTERNATIONAL ** Revenues increased 12%, driven by increased deposits and loans, up 7% and 13%, respectively, and 33% growth in investment product sales.
RETAIL BANKING - Page 1 Loan growth was partially offset by net interest margin compression. Loan balances grew at a double-digit pace in Asia, EMEA and Latin America.
(In millions of dollars) ** Expense growth reflected increased business volumes and continued investment spending. During the quarter, 19 new branches were opened.
** Credit costs more than doubled due to an increase in loan loss reserves due to portfolio growth, the absence of loan loss reserve releases in the prior-year
period, and a lower level of recoveries from portfolio sales versus the prior-year period. The net credit loss ratio increased 17 basis points to 1.38%.
** Net income declined 20% reflecting higher credit costs, the absence of a $55 million tax benefit recorded in the prior-year period,and lower APB 23 tax benefits in Mexico.
1Q07 vs.1Q 2Q 3Q 4Q 1Q 1Q06 Increase/
2006 2006 2006 2006 2007 (Decrease)
Net Interest Revenue 1,439$ 1,460$ 1,519$ 1,582$ 1,530$ 6%
Total Revenues, Net of Interest Expense 4,356 3,958 4,060 4,658 5,243 20%
Total Operating Expenses 2,506 2,537 2,404 2,666 2,892 15%Total Provision for Credit Losses (52) 36 52 63 198 NM
Income Before Taxes and Minority Interest 1,902 1,385 1,604 1,929 2,153 13%
Income Taxes 480 401 413 569 517 8%
Minority Interest, Net of Tax 8 8 10 13 14 75%
Net Income 1,414$ 976$ 1,181$ 1,347$ 1,622$ 15%
NM Not meaningful
Reclassified to conform to the current period's presentation. Page 23
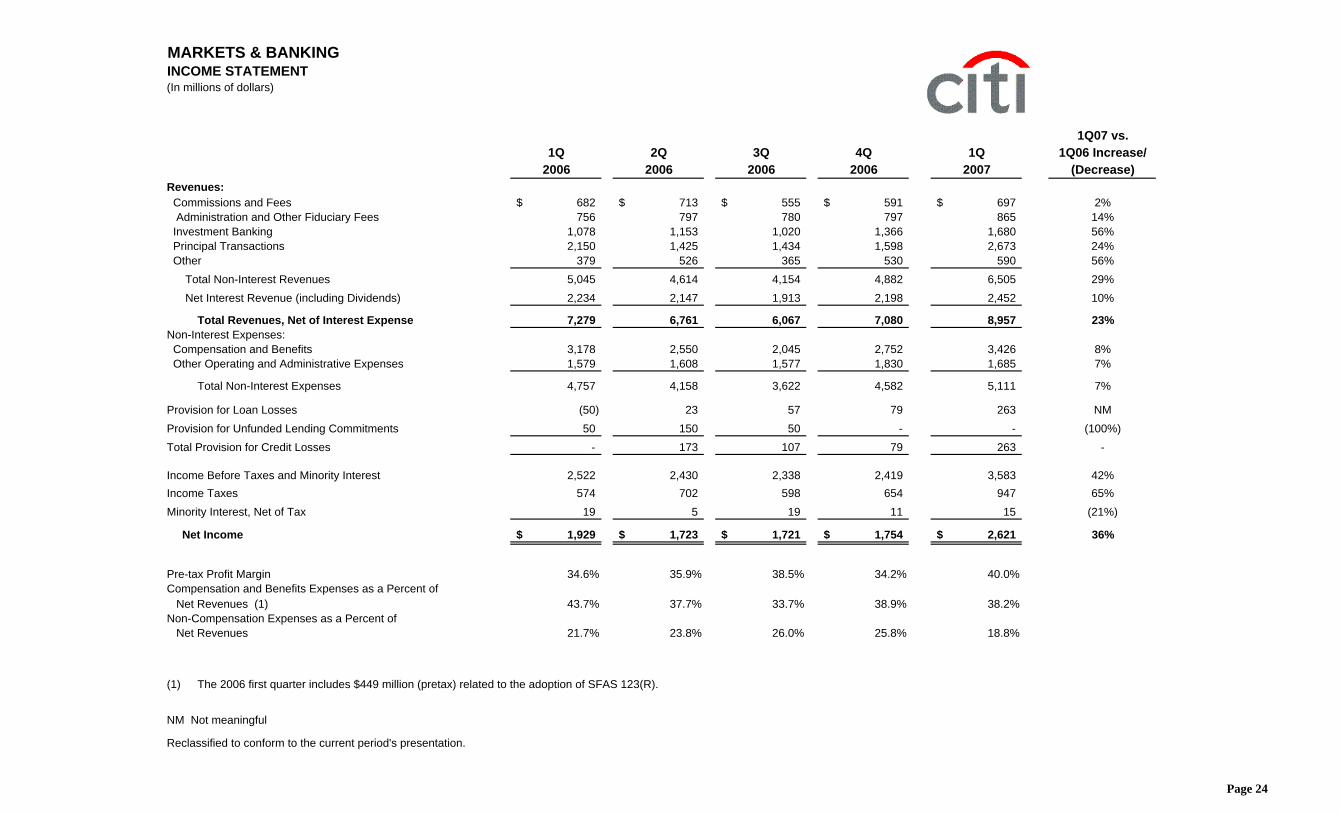
MARKETS & BANKINGINCOME STATEMENT(In millions of dollars)
1Q07 vs.1Q 2Q 3Q 4Q 1Q 1Q06 Increase/
2006 2006 2006 2006 2007 (Decrease)Revenues: Commissions and Fees 682$ 713$ 555$ 591$ 697$ 2% Administration and Other Fiduciary Fees 756 797 780 797 865 14% Investment Banking 1,078 1,153 1,020 1,366 1,680 56% Principal Transactions 2,150 1,425 1,434 1,598 2,673 24% Other 379 526 365 530 590 56%
Total Non-Interest Revenues 5,045 4,614 4,154 4,882 6,505 29% Net Interest Revenue (including Dividends) 2,234 2,147 1,913 2,198 2,452 10%
Total Revenues, Net of Interest Expense 7,279 6,761 6,067 7,080 8,957 23%Non-Interest Expenses: Compensation and Benefits 3,178 2,550 2,045 2,752 3,426 8% Other Operating and Administrative Expenses 1,579 1,608 1,577 1,830 1,685 7%
Total Non-Interest Expenses 4,757 4,158 3,622 4,582 5,111 7%
Provision for Loan Losses (50) 23 57 79 263 NMProvision for Unfunded Lending Commitments 50 150 50 - - (100%)Total Provision for Credit Losses - 173 107 79 263 -
Income Before Taxes and Minority Interest 2,522 2,430 2,338 2,419 3,583 42%Income Taxes 574 702 598 654 947 65%Minority Interest, Net of Tax 19 5 19 11 15 (21%)
Net Income 1,929$ 1,723$ 1,721$ 1,754$ 2,621$ 36%
Pre-tax Profit Margin 34.6% 35.9% 38.5% 34.2% 40.0%Compensation and Benefits Expenses as a Percent of Net Revenues (1) 43.7% 37.7% 33.7% 38.9% 38.2%Non-Compensation Expenses as a Percent of Net Revenues 21.7% 23.8% 26.0% 25.8% 18.8%
(1) The 2006 first quarter includes $449 million (pretax) related to the adoption of SFAS 123(R).
NM Not meaningful
Reclassified to conform to the current period's presentation.
Page 24
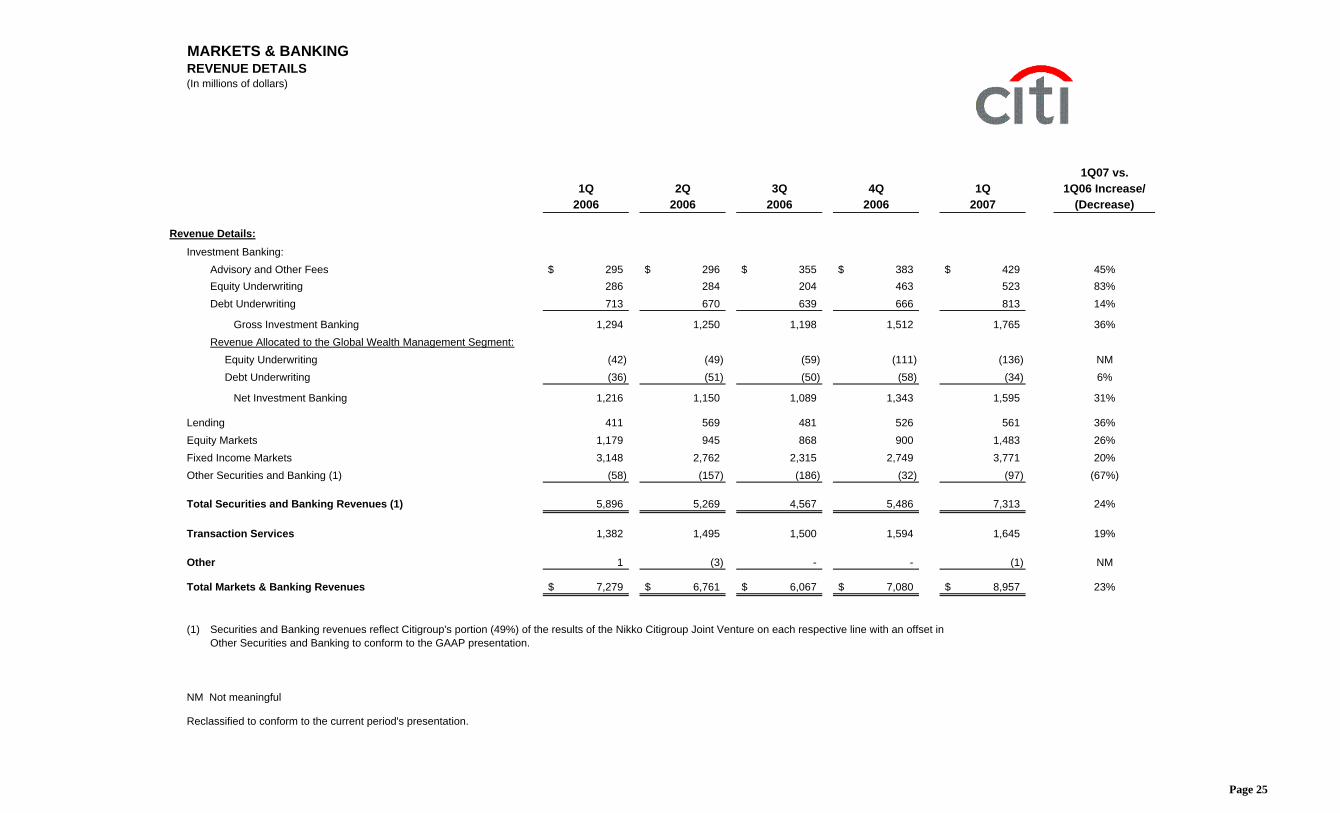
MARKETS & BANKINGREVENUE DETAILS(In millions of dollars)
(1) Securities and Banking revenues reflect Citigroup's portion (49%) of the results of the Nikko Citigroup Joint Venture on each respective line with an offset inOther Securities and Banking to conform to the GAAP presentation.
NM Not meaningful
Reclassified to conform to the current period's presentation.
Page 25
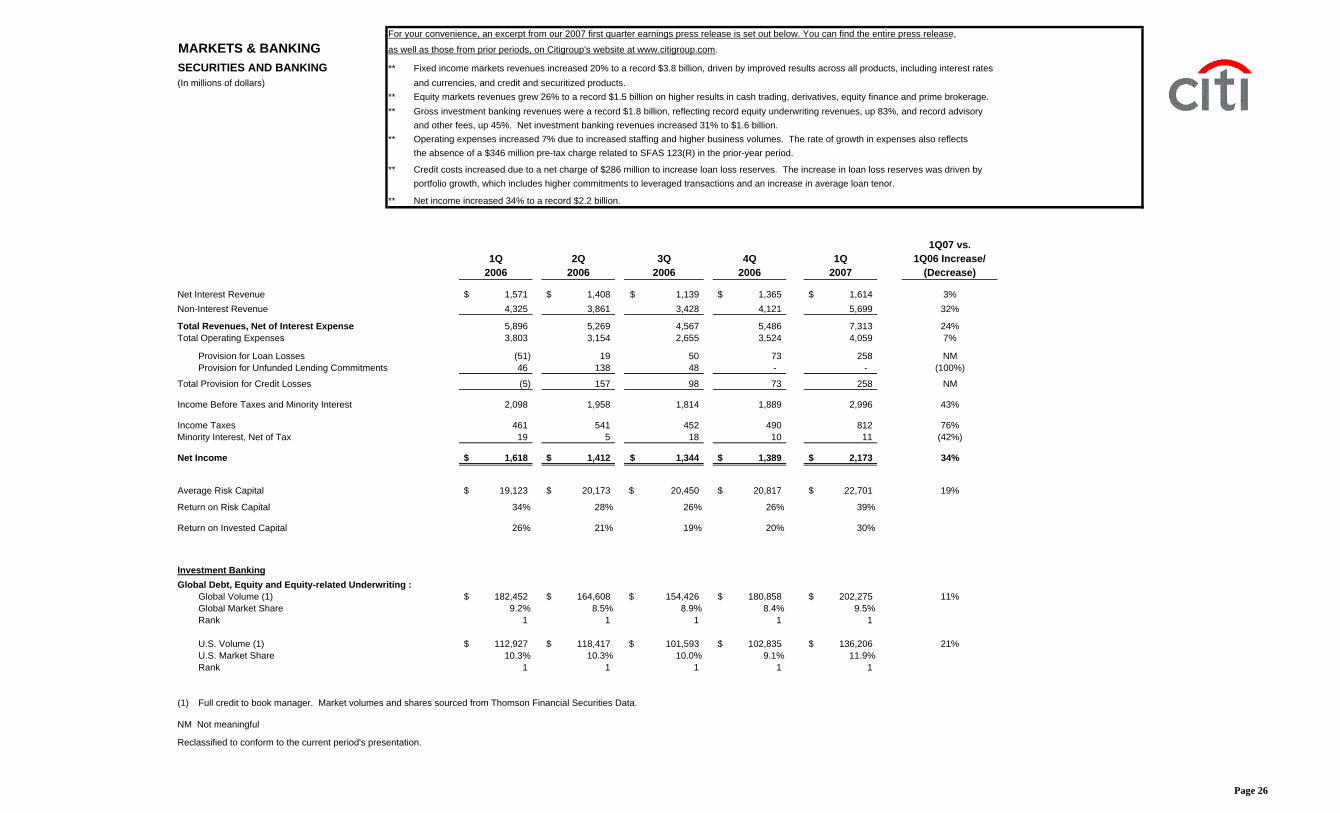
For your convenience, an excerpt from our 2007 first quarter earnings press release is set out below. You can find the entire press release,
MARKETS & BANKING as well as those from prior periods, on Citigroup's website at www.citigroup.com.
SECURITIES AND BANKING ** Fixed income markets revenues increased 20% to a record $3.8 billion, driven by improved results across all products, including interest rates(In millions of dollars) and currencies, and credit and securitized products.
** Equity markets revenues grew 26% to a record $1.5 billion on higher results in cash trading, derivatives, equity finance and prime brokerage. ** Gross investment banking revenues were a record $1.8 billion, reflecting record equity underwriting revenues, up 83%, and record advisory
and other fees, up 45%. Net investment banking revenues increased 31% to $1.6 billion.** Operating expenses increased 7% due to increased staffing and higher business volumes. The rate of growth in expenses also reflects
the absence of a $346 million pre-tax charge related to SFAS 123(R) in the prior-year period.
** Credit costs increased due to a net charge of $286 million to increase loan loss reserves. The increase in loan loss reserves was driven by portfolio growth, which includes higher commitments to leveraged transactions and an increase in average loan tenor.
** Net income increased 34% to a record $2.2 billion.
(1) Full credit to book manager. Market volumes and shares sourced from Thomson Financial Securities Data.
NM Not meaningful
Reclassified to conform to the current period's presentation.
Page 26
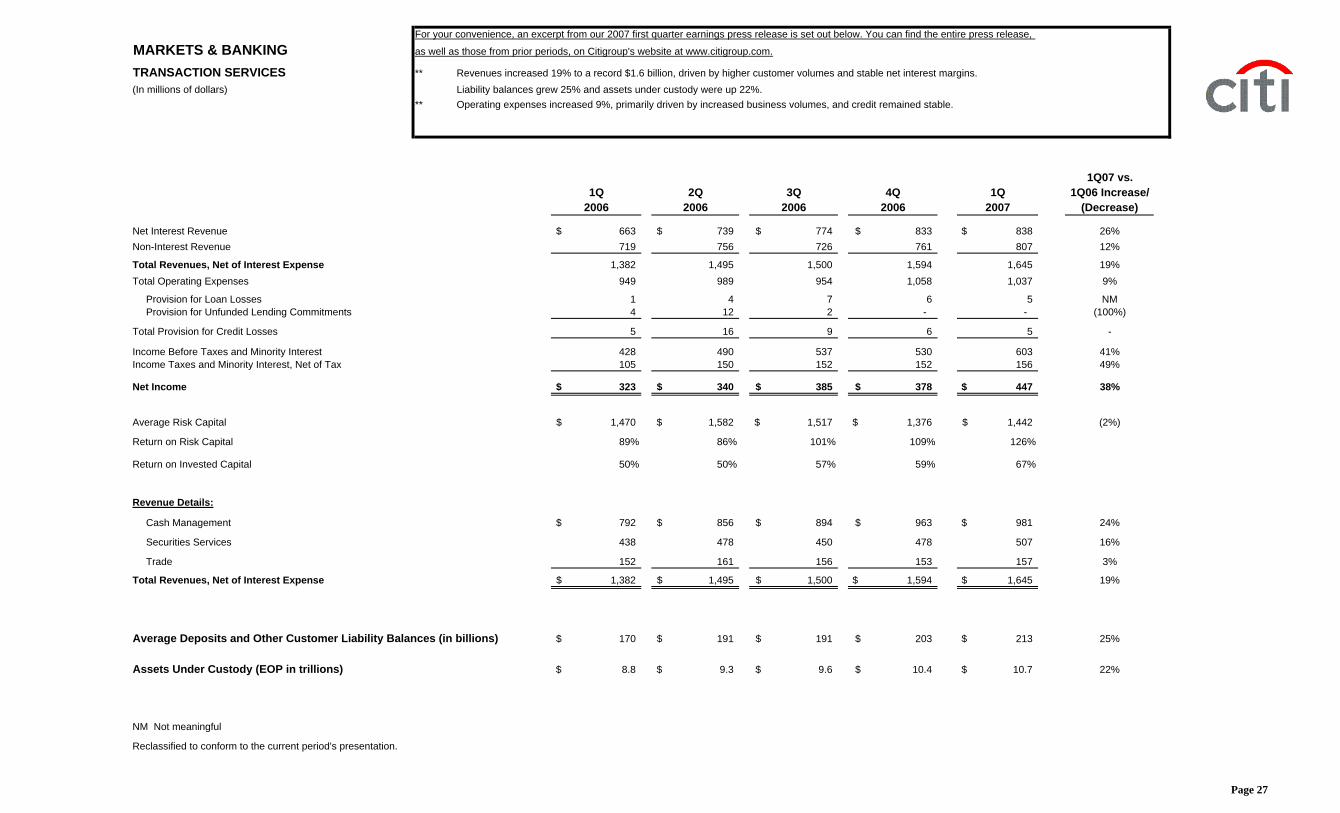
For your convenience, an excerpt from our 2007 first quarter earnings press release is set out below. You can find the entire press release,
MARKETS & BANKING as well as those from prior periods, on Citigroup's website at www.citigroup.com.
TRANSACTION SERVICES ** Revenues increased 19% to a record $1.6 billion, driven by higher customer volumes and stable net interest margins.(In millions of dollars) Liability balances grew 25% and assets under custody were up 22%.
** Operating expenses increased 9%, primarily driven by increased business volumes, and credit remained stable.
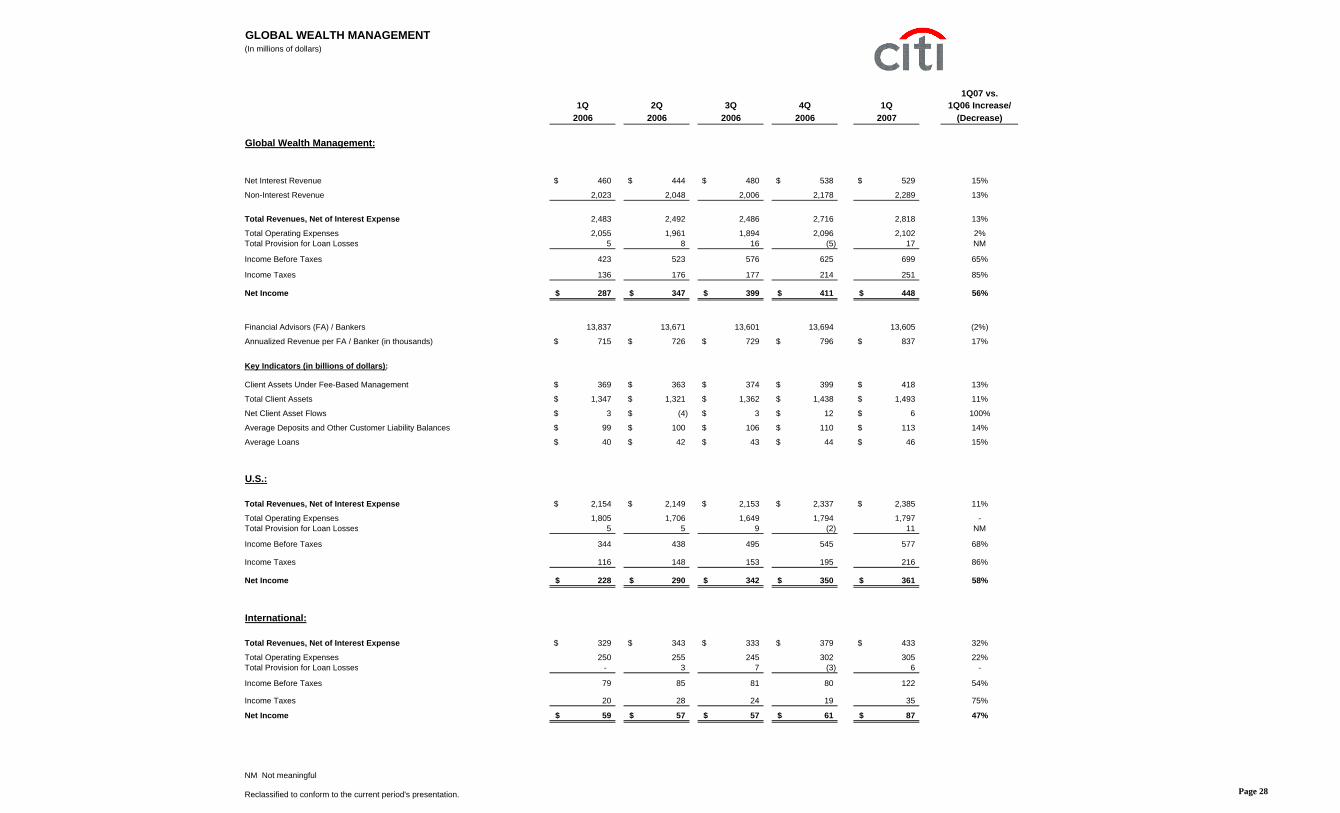
Total Client Assets 1,347$ 1,321$ 1,362$ 1,438$ 1,493$ 11%
Net Client Asset Flows 3$ (4)$ 3$ 12$ 6$ 100%
Average Deposits and Other Customer Liability Balances 99$ 100$ 106$ 110$ 113$ 14%
Average Loans 40$ 42$ 43$ 44$ 46$ 15%
U.S.:
Total Revenues, Net of Interest Expense 2,154$ 2,149$ 2,153$ 2,337$ 2,385$ 11%
Total Operating Expenses 1,805 1,706 1,649 1,794 1,797 -Total Provision for Loan Losses 5 5 9 (2) 11 NM
Income Before Taxes 344 438 495 545 577 68%
Income Taxes 116 148 153 195 216 86%
Net Income 228$ 290$ 342$ 350$ 361$ 58%
International:
Total Revenues, Net of Interest Expense 329$ 343$ 333$ 379$ 433$ 32%
Total Operating Expenses 250 255 245 302 305 22%Total Provision for Loan Losses - 3 7 (3) 6 -
Income Before Taxes 79 85 81 80 122 54%
Income Taxes 20 28 24 19 35 75%
Net Income 59$ 57$ 57$ 61$ 87$ 47%
NM Not meaningful
Reclassified to conform to the current period's presentation. Page 28
For your convenience, an excerpt from our 2007 first quarter earnings press release is set out below. You can find the entire press release,
as well as those from prior periods, on Citigroup's website at www.citigroup.com.
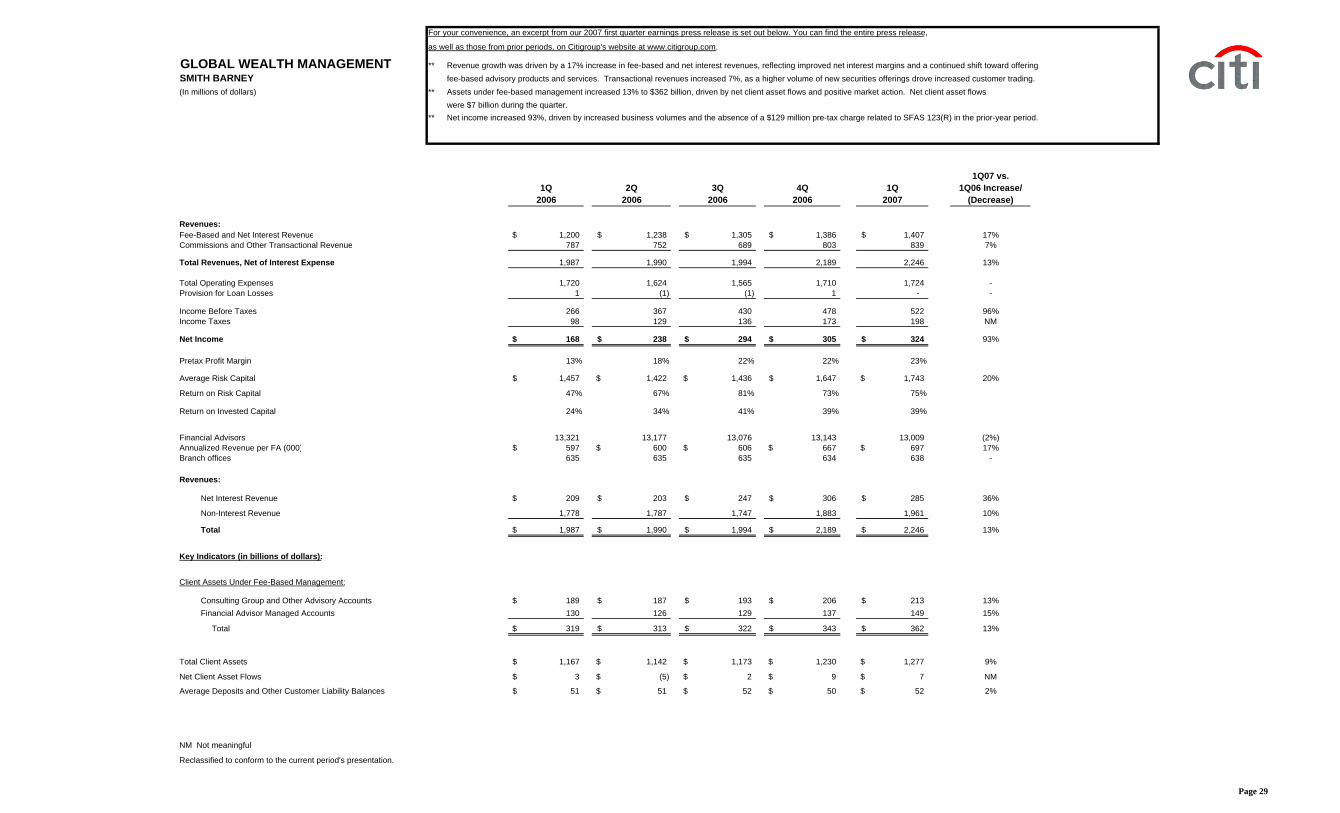
GLOBAL WEALTH MANAGEMENT ** Revenue growth was driven by a 17% increase in fee-based and net interest revenues, reflecting improved net interest margins and a continued shift toward offeringSMITH BARNEY fee-based advisory products and services. Transactional revenues increased 7%, as a higher volume of new securities offerings drove increased customer trading. (In millions of dollars) ** Assets under fee-based management increased 13% to $362 billion, driven by net client asset flows and positive market action. Net client asset flows
were $7 billion during the quarter.** Net income increased 93%, driven by increased business volumes and the absence of a $129 million pre-tax charge related to SFAS 123(R) in the prior-year period.
1Q07 vs.1Q 2Q 3Q 4Q 1Q 1Q06 Increase/
2006 2006 2006 2006 2007 (Decrease)
Revenues:Fee-Based and Net Interest Revenue 1,200$ 1,238$ 1,305$ 1,386$ 1,407$ 17%Commissions and Other Transactional Revenue 787 752 689 803 839 7%
Total Revenues, Net of Interest Expense 1,987 1,990 1,994 2,189 2,246 13%
Total Operating Expenses 1,720 1,624 1,565 1,710 1,724 -Provision for Loan Losses 1 (1) (1) 1 - -
Income Before Taxes 266 367 430 478 522 96%Income Taxes 98 129 136 173 198 NM
Net Income 168$ 238$ 294$ 305$ 324$ 93%
Pretax Profit Margin 13% 18% 22% 22% 23%
Average Risk Capital 1,457$ 1,422$ 1,436$ 1,647$ 1,743$ 20%
Consulting Group and Other Advisory Accounts 189$ 187$ 193$ 206$ 213$ 13%Financial Advisor Managed Accounts 130 126 129 137 149 15%
Total 319$ 313$ 322$ 343$ 362$ 13%
Total Client Assets 1,167$ 1,142$ 1,173$ 1,230$ 1,277$ 9%
Net Client Asset Flows 3$ (5)$ 2$ 9$ 7$ NM
Average Deposits and Other Customer Liability Balances 51$ 51$ 52$ 50$ 52$ 2%
NM Not meaningful
Reclassified to conform to the current period's presentation.
Page 29
For your convenience, an excerpt from our 2007 first quarter earnings press release is set out below. You can find the entire press release,
GLOBAL WEALTH MANAGEMENT as well as those from prior periods, on Citigroup's website at www.citigroup.com.
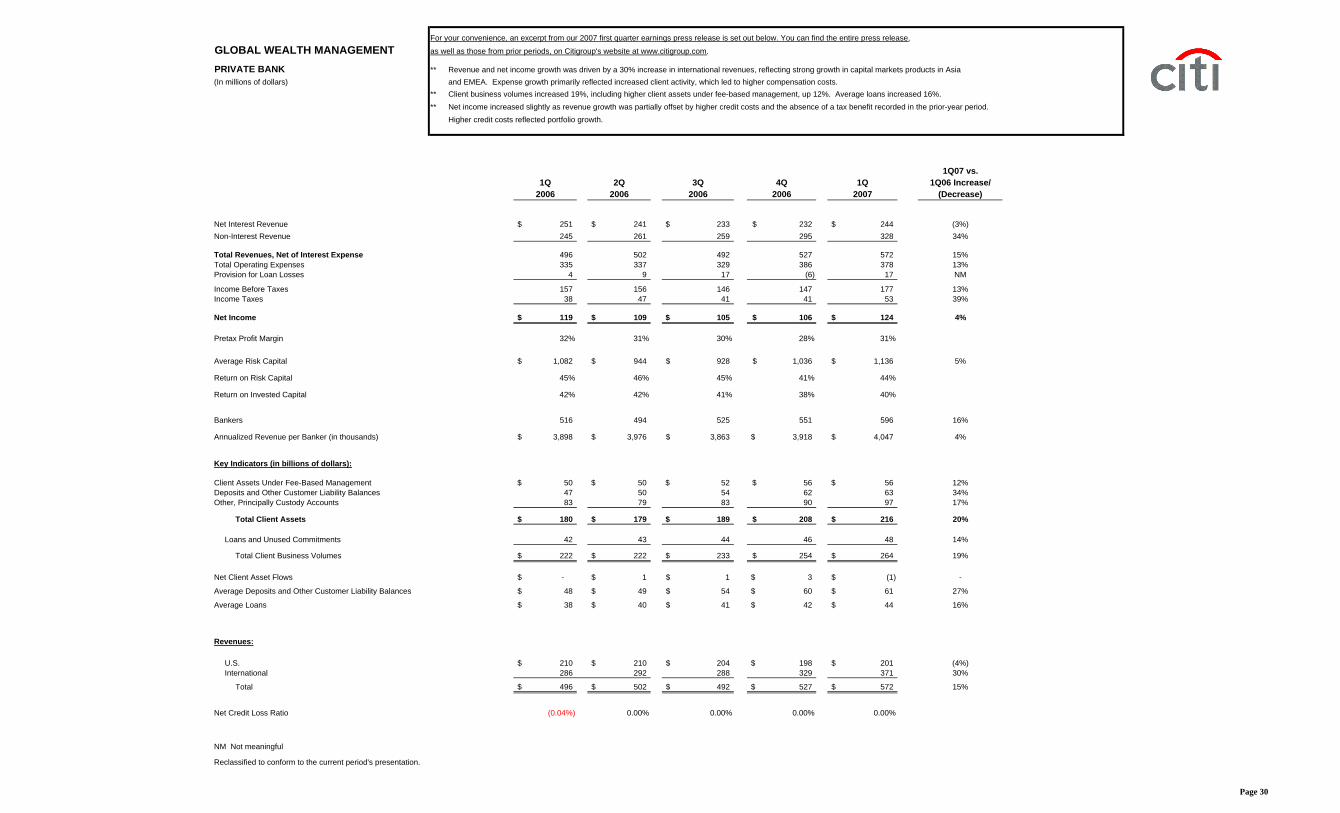
PRIVATE BANK ** Revenue and net income growth was driven by a 30% increase in international revenues, reflecting strong growth in capital markets products in Asia(In millions of dollars) and EMEA. Expense growth primarily reflected increased client activity, which led to higher compensation costs.
** Client business volumes increased 19%, including higher client assets under fee-based management, up 12%. Average loans increased 16%. ** Net income increased slightly as revenue growth was partially offset by higher credit costs and the absence of a tax benefit recorded in the prior-year period.
Net Credit Loss Ratio (0.04%) 0.00% 0.00% 0.00% 0.00%
NM Not meaningful
Reclassified to conform to the current period's presentation.
Page 30
For your convenience, an excerpt from our 2007 first quarter earnings press release is set out below. You can find the entire press release,
ALTERNATIVE INVESTMENTS (1) as well as those from prior periods, on Citigroup's website at www.citigroup.com.
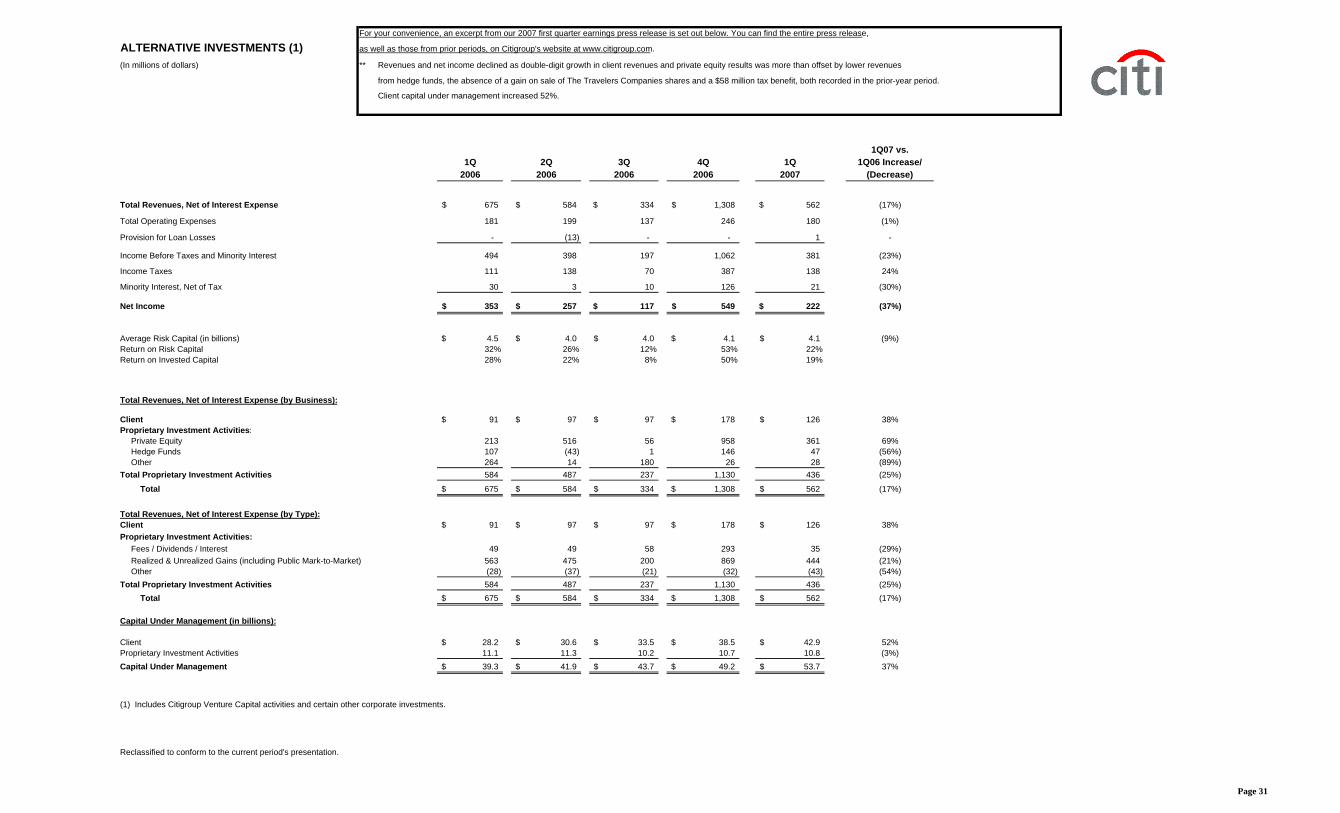
(In millions of dollars) ** Revenues and net income declined as double-digit growth in client revenues and private equity results was more than offset by lower revenues
from hedge funds, the absence of a gain on sale of The Travelers Companies shares and a $58 million tax benefit, both recorded in the prior-year period.
Client capital under management increased 52%.
1Q07 vs.1Q 2Q 3Q 4Q 1Q 1Q06 Increase/
2006 2006 2006 2006 2007 (Decrease)
Total Revenues, Net of Interest Expense 675$ 584$ 334$ 1,308$ 562$ (17%)
Total Operating Expenses 181 199 137 246 180 (1%)
Provision for Loan Losses - (13) - - 1 -
Income Before Taxes and Minority Interest 494 398 197 1,062 381 (23%)
Income Taxes 111 138 70 387 138 24%
Minority Interest, Net of Tax 30 3 10 126 21 (30%)
Net Income 353$ 257$ 117$ 549$ 222$ (37%)
Average Risk Capital (in billions) 4.5$ 4.0$ 4.0$ 4.1$ 4.1$ (9%)Return on Risk Capital 32% 26% 12% 53% 22%Return on Invested Capital 28% 22% 8% 50% 19%
Total Revenues, Net of Interest Expense (by Business):
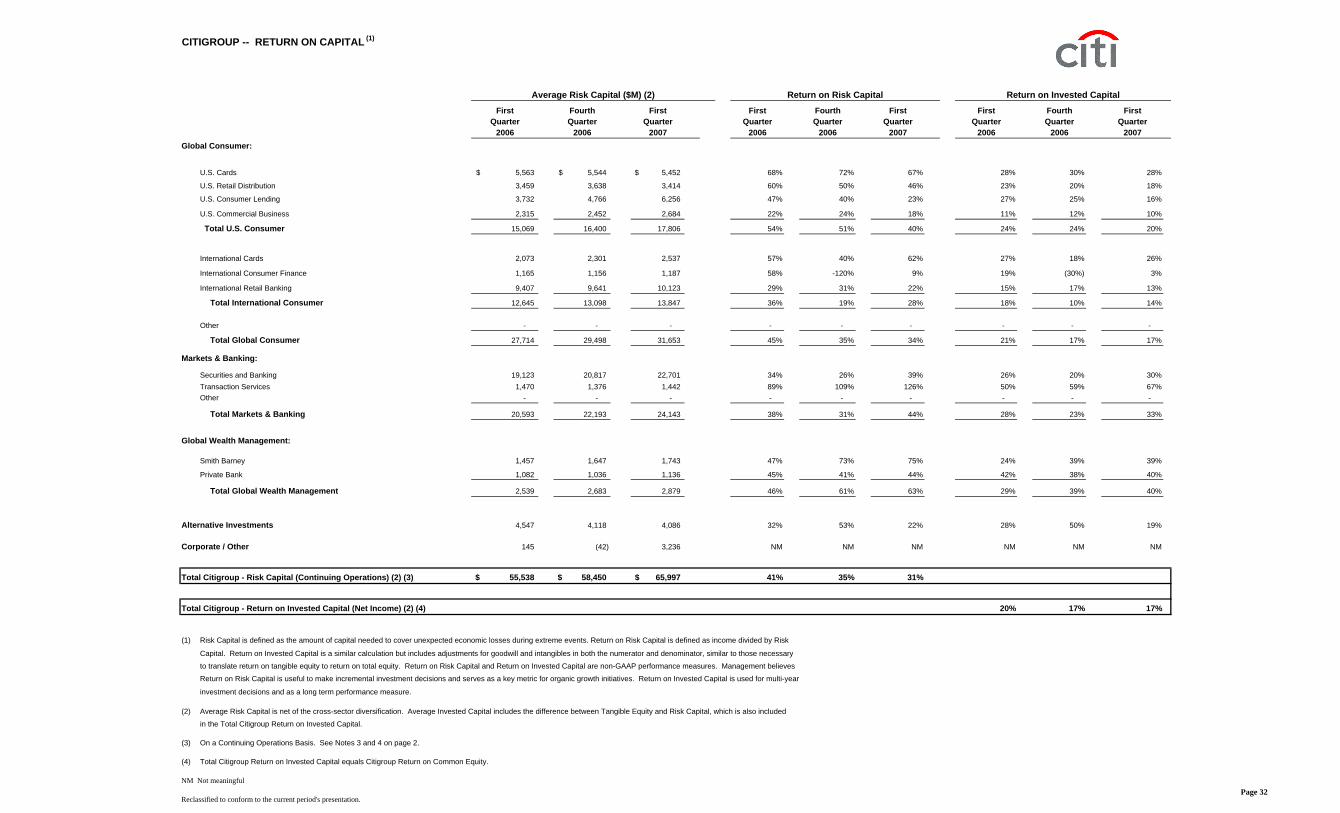
Total Citigroup - Risk Capital (Continuing Operations) (2) (3) 55,538$ 58,450$ 65,997$ 41% 35% 31%
Total Citigroup - Return on Invested Capital (Net Income) (2) (4) 20% 17% 17%
(1) Risk Capital is defined as the amount of capital needed to cover unexpected economic losses during extreme events. Return on Risk Capital is defined as income divided by Risk
Capital. Return on Invested Capital is a similar calculation but includes adjustments for goodwill and intangibles in both the numerator and denominator, similar to those necessary
to translate return on tangible equity to return on total equity. Return on Risk Capital and Return on Invested Capital are non-GAAP performance measures. Management believes
Return on Risk Capital is useful to make incremental investment decisions and serves as a key metric for organic growth initiatives. Return on Invested Capital is used for multi-year
investment decisions and as a long term performance measure.
(2) Average Risk Capital is net of the cross-sector diversification. Average Invested Capital includes the difference between Tangible Equity and Risk Capital, which is also included
in the Total Citigroup Return on Invested Capital.
(3) On a Continuing Operations Basis. See Notes 3 and 4 on page 2.
(4) Total Citigroup Return on Invested Capital equals Citigroup Return on Common Equity.
NM Not meaningful
Reclassified to conform to the current period's presentation.
Average Risk Capital ($M) (2) Return on Risk Capital Return on Invested Capital
Page 32
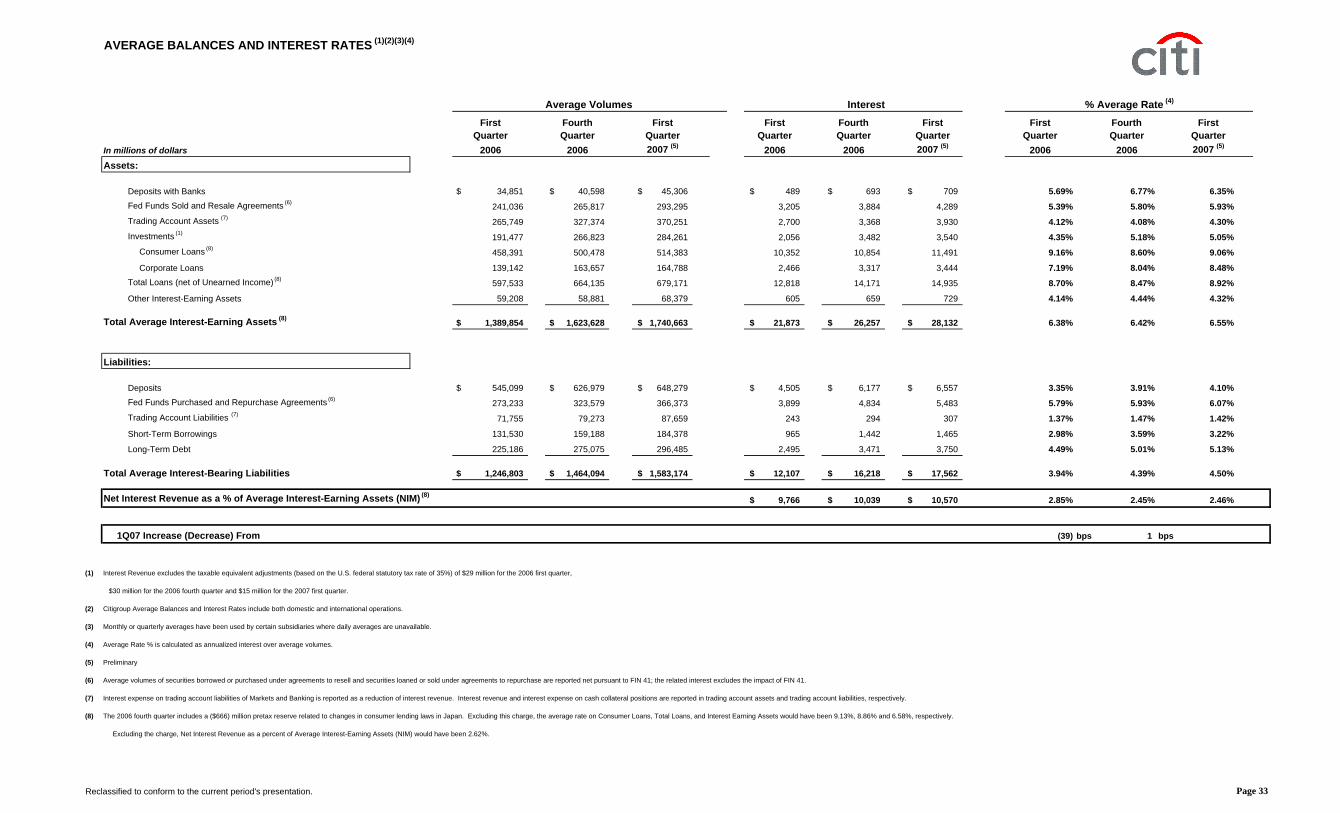
AVERAGE BALANCES AND INTEREST RATES (1)(2)(3)(4)
First Fourth First First Fourth First First Fourth FirstQuarter Quarter Quarter Quarter Quarter Quarter Quarter Quarter Quarter
In millions of dollars 2006 2006 2007 (5) 2006 2006 2007 (5) 2006 2006 2007 (5)
Total Average Interest-Bearing Liabilities 1,246,803$ 1,464,094$ 1,583,174$ 12,107$ 16,218$ 17,562$ 3.94% 4.39% 4.50%
Net Interest Revenue as a % of Average Interest-Earning Assets (NIM) (8)9,766$ 10,039$ 10,570$ 2.85% 2.45% 2.46%
1Q07 Increase (Decrease) From (39) bps 1 bps
(1) Interest Revenue excludes the taxable equivalent adjustments (based on the U.S. federal statutory tax rate of 35%) of $29 million for the 2006 first quarter,
$30 million for the 2006 fourth quarter and $15 million for the 2007 first quarter.
(2) Citigroup Average Balances and Interest Rates include both domestic and international operations.
(3) Monthly or quarterly averages have been used by certain subsidiaries where daily averages are unavailable.
(4) Average Rate % is calculated as annualized interest over average volumes.
(5) Preliminary
(6) Average volumes of securities borrowed or purchased under agreements to resell and securities loaned or sold under agreements to repurchase are reported net pursuant to FIN 41; the related interest excludes the impact of FIN 41.
(7) Interest expense on trading account liabilities of Markets and Banking is reported as a reduction of interest revenue. Interest revenue and interest expense on cash collateral positions are reported in trading account assets and trading account liabilities, respectively.
(8) The 2006 fourth quarter includes a ($666) million pretax reserve related to changes in consumer lending laws in Japan. Excluding this charge, the average rate on Consumer Loans, Total Loans, and Interest Earning Assets would have been 9.13%, 8.86% and 6.58%, respectively.
Excluding the charge, Net Interest Revenue as a percent of Average Interest-Earning Assets (NIM) would have been 2.62%.
Reclassified to conform to the current period's presentation.
Average Volumes Interest % Average Rate (4)
Page 33
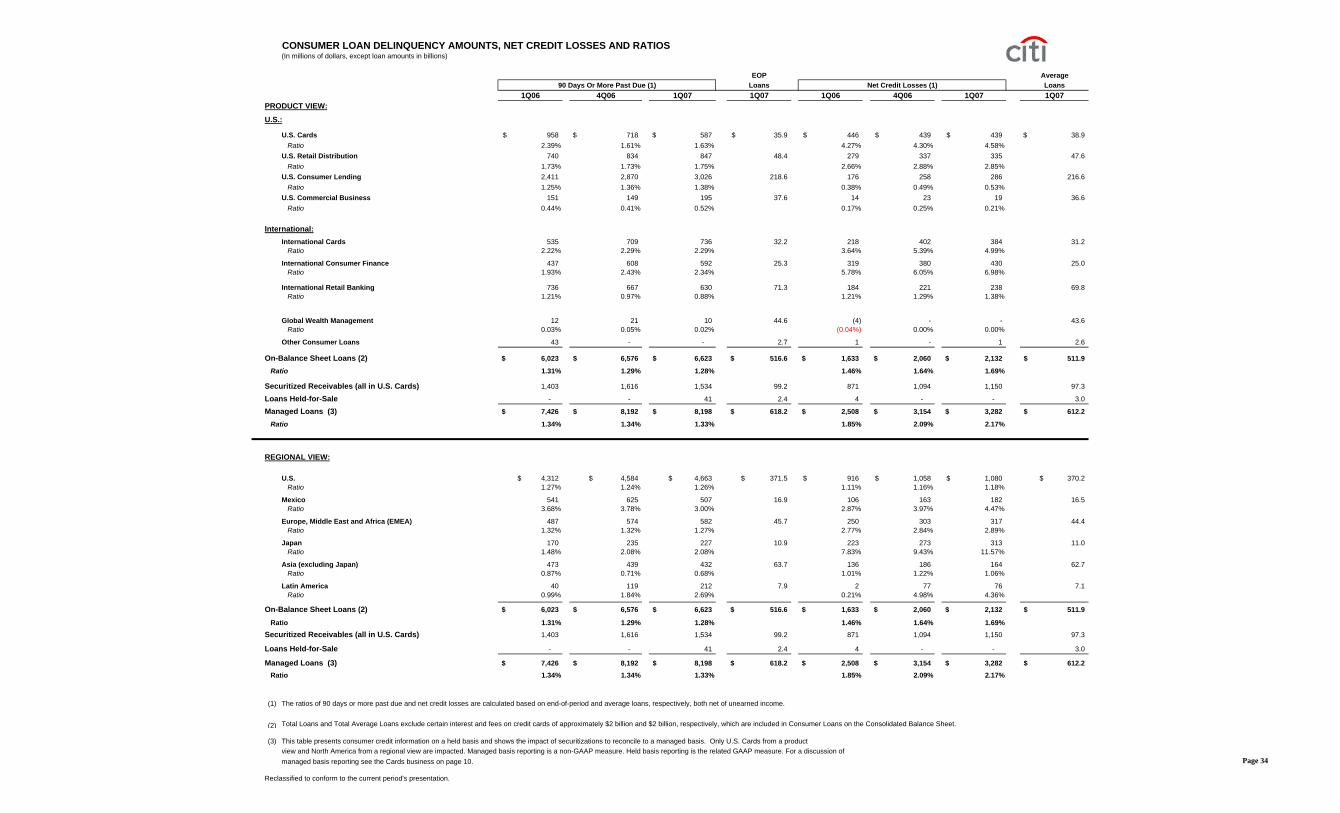
CONSUMER LOAN DELINQUENCY AMOUNTS, NET CREDIT LOSSES AND RATIOS(In millions of dollars, except loan amounts in billions)
(1) The ratios of 90 days or more past due and net credit losses are calculated based on end-of-period and average loans, respectively, both net of unearned income.
(2) Total Loans and Total Average Loans exclude certain interest and fees on credit cards of approximately $2 billion and $2 billion, respectively, which are included in Consumer Loans on the Consolidated Balance Sheet.
(3) This table presents consumer credit information on a held basis and shows the impact of securitizations to reconcile to a managed basis. Only U.S. Cards from a productview and North America from a regional view are impacted. Managed basis reporting is a non-GAAP measure. Held basis reporting is the related GAAP measure. For a discussion ofmanaged basis reporting see the Cards business on page 10.
Reclassified to conform to the current period's presentation.
Managed Loans (3)
On-Balance Sheet Loans (2)
90 Days Or More Past Due (1) Net Credit Losses (1)
On-Balance Sheet Loans (2)
Managed Loans (3)
Page 34
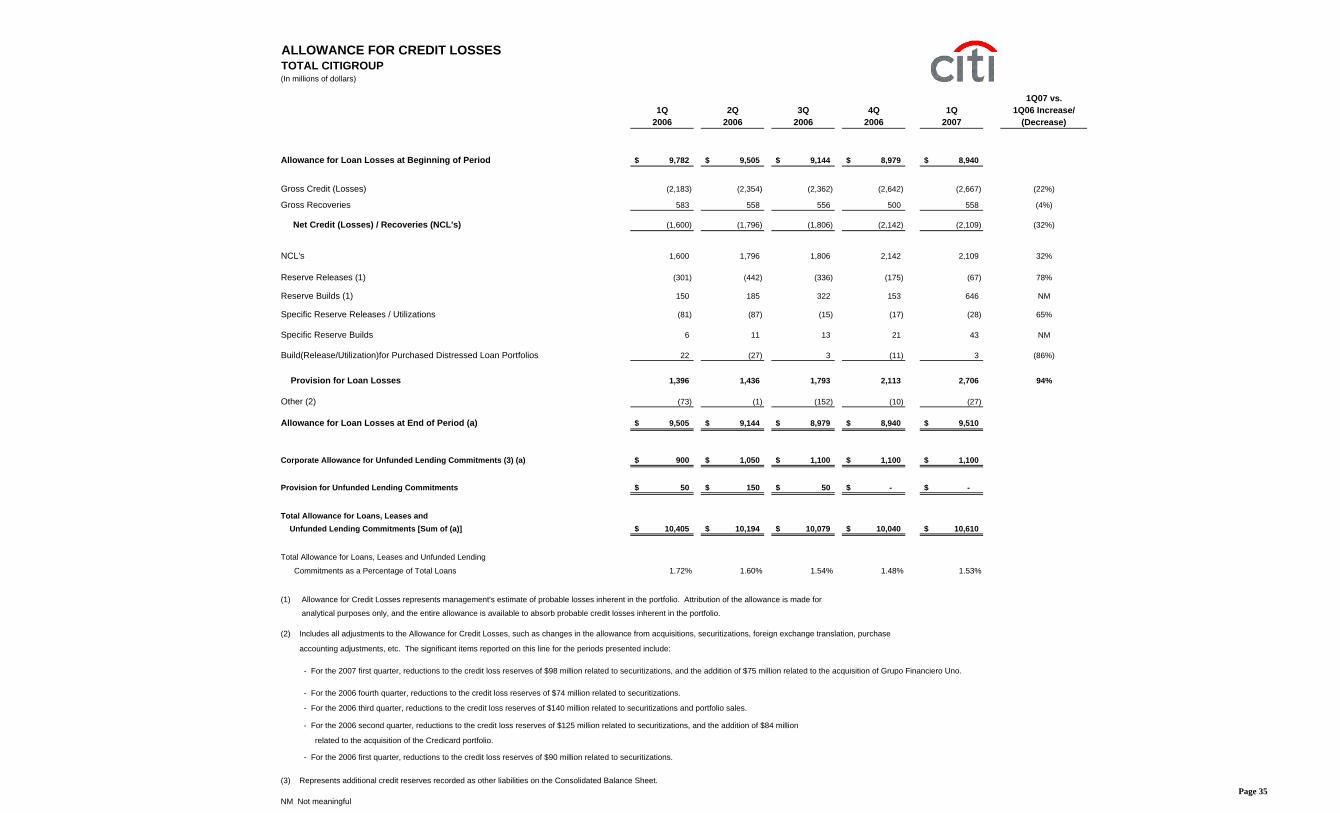
ALLOWANCE FOR CREDIT LOSSESTOTAL CITIGROUP(In millions of dollars)
1Q07 vs.1Q 2Q 3Q 4Q 1Q 1Q06 Increase/
2006 2006 2006 2006 2007 (Decrease)
Allowance for Loan Losses at Beginning of Period 9,782$ 9,505$ 9,144$ 8,979$ 8,940$
Provision for Unfunded Lending Commitments 50$ 150$ 50$ -$ -$
Total Allowance for Loans, Leases and Unfunded Lending Commitments [Sum of (a)] 10,405$ 10,194$ 10,079$ 10,040$ 10,610$
Total Allowance for Loans, Leases and Unfunded Lending
Commitments as a Percentage of Total Loans 1.72% 1.60% 1.54% 1.48% 1.53%
(1) Allowance for Credit Losses represents management's estimate of probable losses inherent in the portfolio. Attribution of the allowance is made for
analytical purposes only, and the entire allowance is available to absorb probable credit losses inherent in the portfolio.
(2) Includes all adjustments to the Allowance for Credit Losses, such as changes in the allowance from acquisitions, securitizations, foreign exchange translation, purchase
accounting adjustments, etc. The significant items reported on this line for the periods presented include:
- For the 2007 first quarter, reductions to the credit loss reserves of $98 million related to securitizations, and the addition of $75 million related to the acquisition of Grupo Financiero Uno.
- For the 2006 fourth quarter, reductions to the credit loss reserves of $74 million related to securitizations.
- For the 2006 third quarter, reductions to the credit loss reserves of $140 million related to securitizations and portfolio sales.
- For the 2006 second quarter, reductions to the credit loss reserves of $125 million related to securitizations, and the addition of $84 million
related to the acquisition of the Credicard portfolio.
- For the 2006 first quarter, reductions to the credit loss reserves of $90 million related to securitizations.
(3) Represents additional credit reserves recorded as other liabilities on the Consolidated Balance Sheet.
NM Not meaningfulPage 35
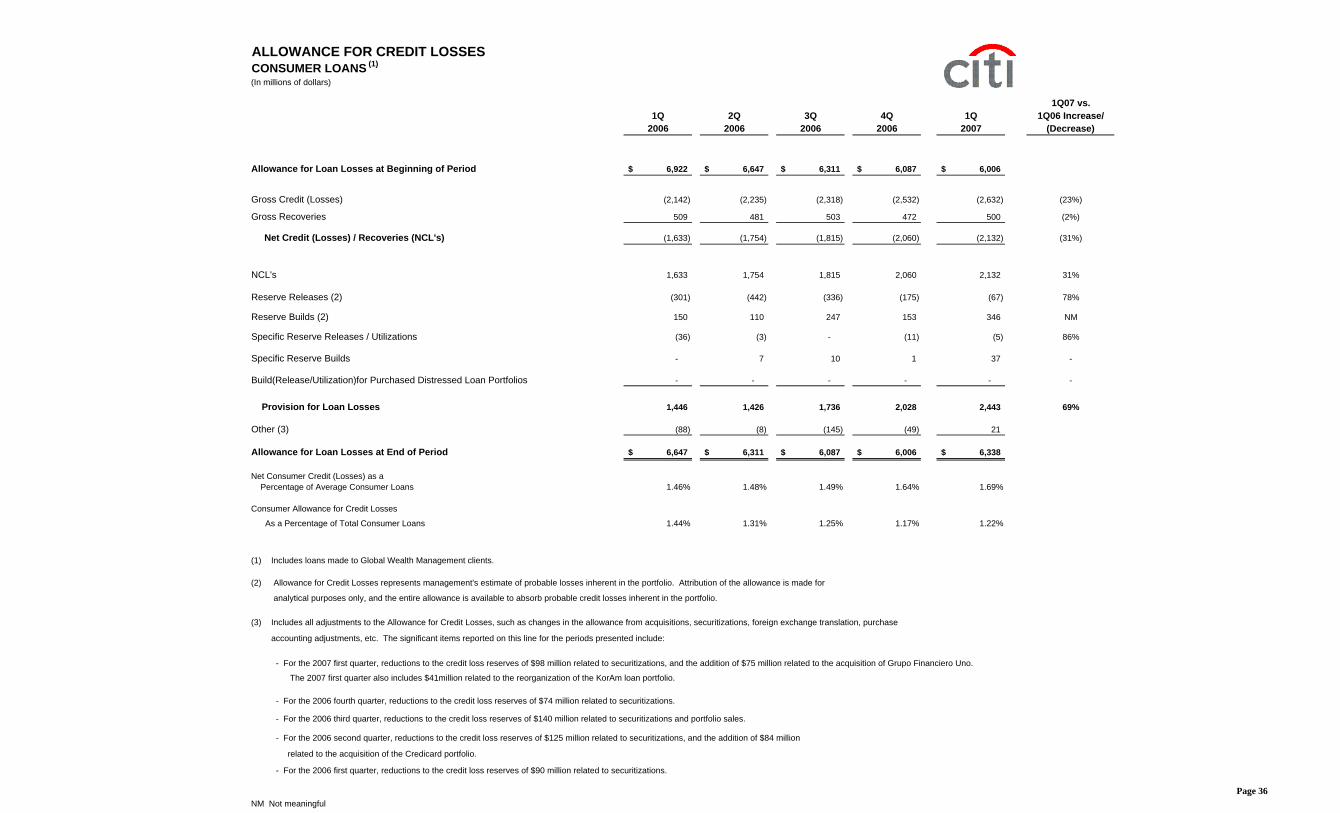
ALLOWANCE FOR CREDIT LOSSESCONSUMER LOANS (1)
(In millions of dollars)
1Q07 vs.1Q 2Q 3Q 4Q 1Q 1Q06 Increase/
2006 2006 2006 2006 2007 (Decrease)
Allowance for Loan Losses at Beginning of Period 6,922$ 6,647$ 6,311$ 6,087$ 6,006$
Provision for Loan Losses 1,446 1,426 1,736 2,028 2,443 69%
Other (3) (88) (8) (145) (49) 21
Allowance for Loan Losses at End of Period 6,647$ 6,311$ 6,087$ 6,006$ 6,338$
Net Consumer Credit (Losses) as a Percentage of Average Consumer Loans 1.46% 1.48% 1.49% 1.64% 1.69%
Consumer Allowance for Credit Losses
As a Percentage of Total Consumer Loans 1.44% 1.31% 1.25% 1.17% 1.22%
(1) Includes loans made to Global Wealth Management clients.
(2) Allowance for Credit Losses represents management's estimate of probable losses inherent in the portfolio. Attribution of the allowance is made for
analytical purposes only, and the entire allowance is available to absorb probable credit losses inherent in the portfolio.
(3) Includes all adjustments to the Allowance for Credit Losses, such as changes in the allowance from acquisitions, securitizations, foreign exchange translation, purchase
accounting adjustments, etc. The significant items reported on this line for the periods presented include:
- For the 2007 first quarter, reductions to the credit loss reserves of $98 million related to securitizations, and the addition of $75 million related to the acquisition of Grupo Financiero Uno.
The 2007 first quarter also includes $41million related to the reorganization of the KorAm loan portfolio.
- For the 2006 fourth quarter, reductions to the credit loss reserves of $74 million related to securitizations.
- For the 2006 third quarter, reductions to the credit loss reserves of $140 million related to securitizations and portfolio sales.
- For the 2006 second quarter, reductions to the credit loss reserves of $125 million related to securitizations, and the addition of $84 million
related to the acquisition of the Credicard portfolio.
- For the 2006 first quarter, reductions to the credit loss reserves of $90 million related to securitizations.
NM Not meaningfulPage 36
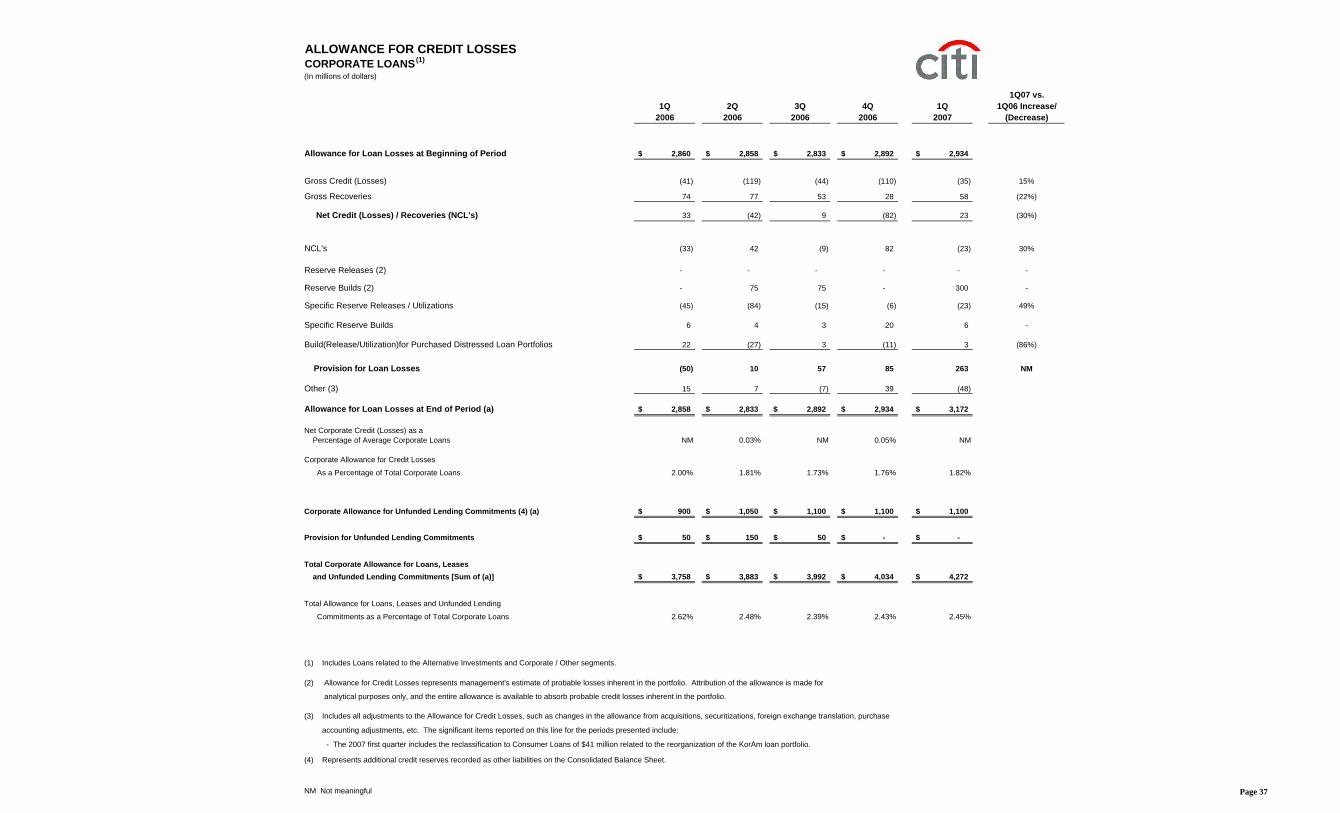
ALLOWANCE FOR CREDIT LOSSESCORPORATE LOANS(1)
(In millions of dollars)
1Q07 vs.1Q 2Q 3Q 4Q 1Q 1Q06 Increase/
2006 2006 2006 2006 2007 (Decrease)
Allowance for Loan Losses at Beginning of Period 2,860$ 2,858$ 2,833$ 2,892$ 2,934$
Provision for Unfunded Lending Commitments 50$ 150$ 50$ -$ -$
Total Corporate Allowance for Loans, Leases and Unfunded Lending Commitments [Sum of (a)] 3,758$ 3,883$ 3,992$ 4,034$ 4,272$
Total Allowance for Loans, Leases and Unfunded Lending
Commitments as a Percentage of Total Corporate Loans 2.62% 2.48% 2.39% 2.43% 2.45%
(1) Includes Loans related to the Alternative Investments and Corporate / Other segments.
(2) Allowance for Credit Losses represents management's estimate of probable losses inherent in the portfolio. Attribution of the allowance is made for
analytical purposes only, and the entire allowance is available to absorb probable credit losses inherent in the portfolio.
(3) Includes all adjustments to the Allowance for Credit Losses, such as changes in the allowance from acquisitions, securitizations, foreign exchange translation, purchase
accounting adjustments, etc. The significant items reported on this line for the periods presented include:
- The 2007 first quarter includes the reclassification to Consumer Loans of $41 million related to the reorganization of the KorAm loan portfolio.
(4) Represents additional credit reserves recorded as other liabilities on the Consolidated Balance Sheet.
NM Not meaningful Page 37
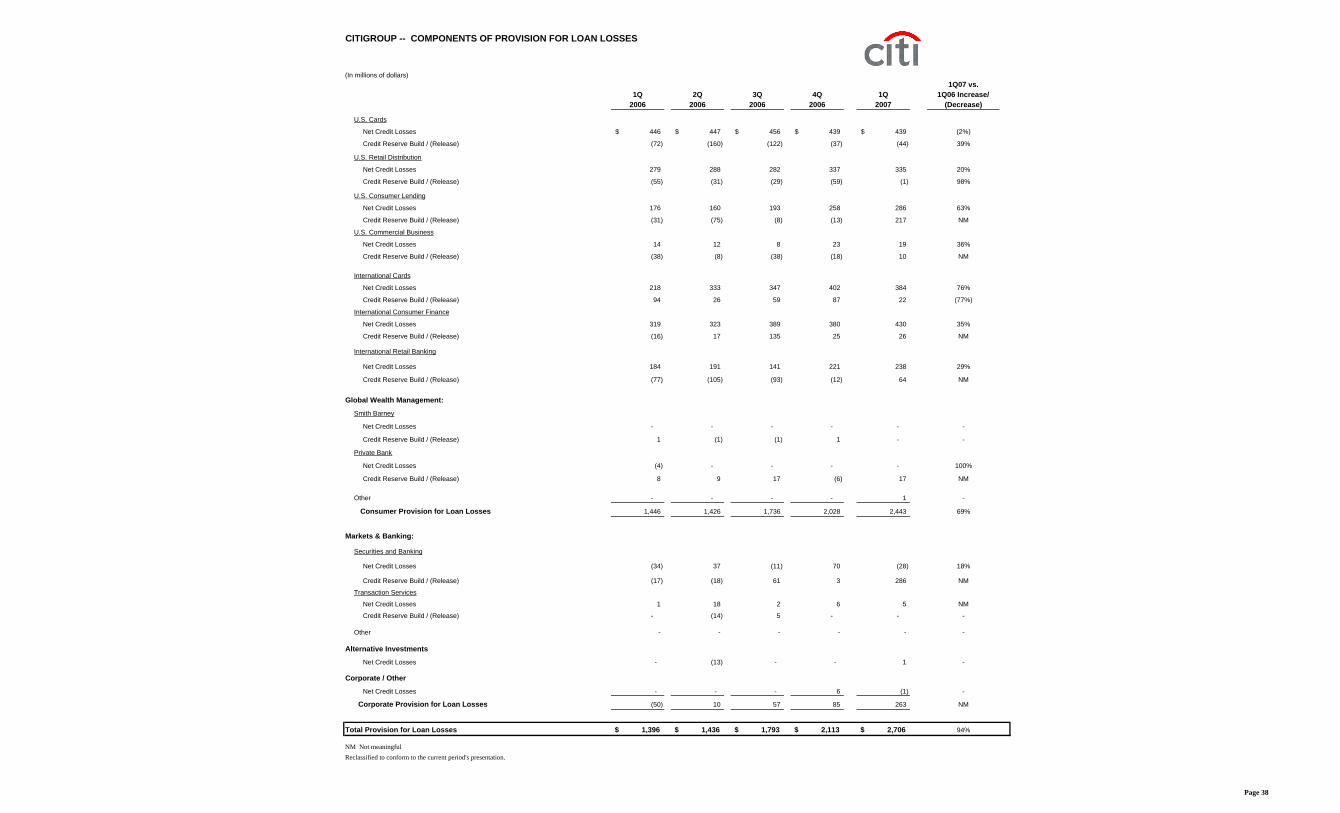
CITIGROUP -- COMPONENTS OF PROVISION FOR LOAN LOSSES
Total Provision for Loan Losses 1,396$ 1,436$ 1,793$ 2,113$ 2,706$ 94%
NM Not meaningfulReclassified to conform to the current period's presentation.
Page 38
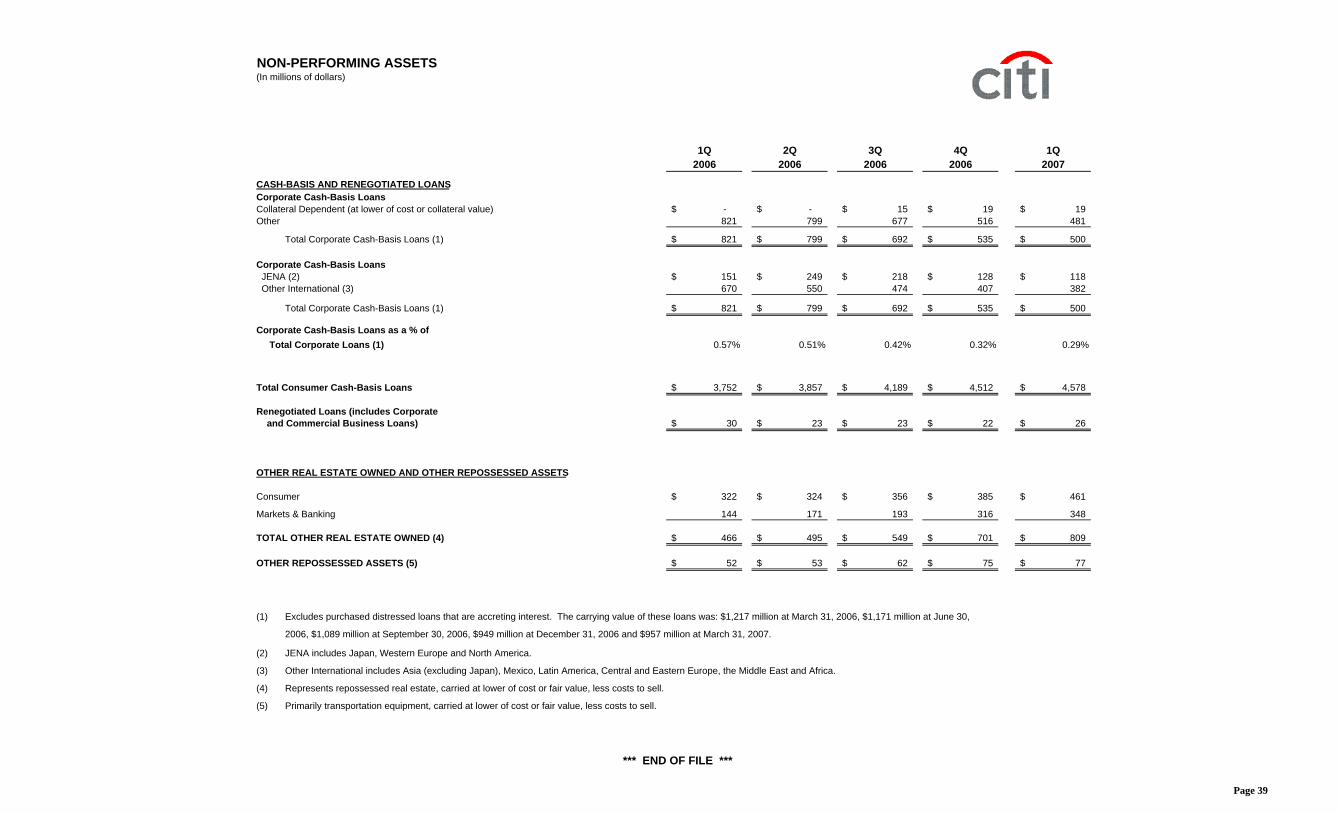
NON-PERFORMING ASSETS (In millions of dollars)
1Q 2Q 3Q 4Q 1Q
2006 2006 2006 2006 2007
CASH-BASIS AND RENEGOTIATED LOANSCorporate Cash-Basis LoansCollateral Dependent (at lower of cost or collateral value) -$ -$ 15$ 19$ 19$ Other 821 799 677 516 481
Total Corporate Cash-Basis Loans (1) 821$ 799$ 692$ 535$ 500$
Corporate Cash-Basis Loans JENA (2) 151$ 249$ 218$ 128$ 118$ Other International (3) 670 550 474 407 382
Total Corporate Cash-Basis Loans (1) 821$ 799$ 692$ 535$ 500$
Corporate Cash-Basis Loans as a % of Total Corporate Loans (1) 0.57% 0.51% 0.42% 0.32% 0.29%
Total Consumer Cash-Basis Loans 3,752$ 3,857$ 4,189$ 4,512$ 4,578$
Renegotiated Loans (includes Corporate and Commercial Business Loans) 30$ 23$ 23$ 22$ 26$
OTHER REAL ESTATE OWNED AND OTHER REPOSSESSED ASSETS
Consumer 322$ 324$ 356$ 385$ 461$
Markets & Banking 144 171 193 316 348
TOTAL OTHER REAL ESTATE OWNED (4) 466$ 495$ 549$ 701$ 809$
OTHER REPOSSESSED ASSETS (5) 52$ 53$ 62$ 75$ 77$
(1) Excludes purchased distressed loans that are accreting interest. The carrying value of these loans was: $1,217 million at March 31, 2006, $1,171 million at June 30,
2006, $1,089 million at September 30, 2006, $949 million at December 31, 2006 and $957 million at March 31, 2007.
(2) JENA includes Japan, Western Europe and North America.
(3) Other International includes Asia (excluding Japan), Mexico, Latin America, Central and Eastern Europe, the Middle East and Africa.
(4) Represents repossessed real estate, carried at lower of cost or fair value, less costs to sell.
(5) Primarily transportation equipment, carried at lower of cost or fair value, less costs to sell.