44
Citigroup Financial Services Conference Vikram Pandit Chief Executive Officer Chief Executive Officer March 11, 2010

Citigroup Financial Services Conference
Vikram PanditChief Executive OfficerChief Executive Officer
March 11, 2010
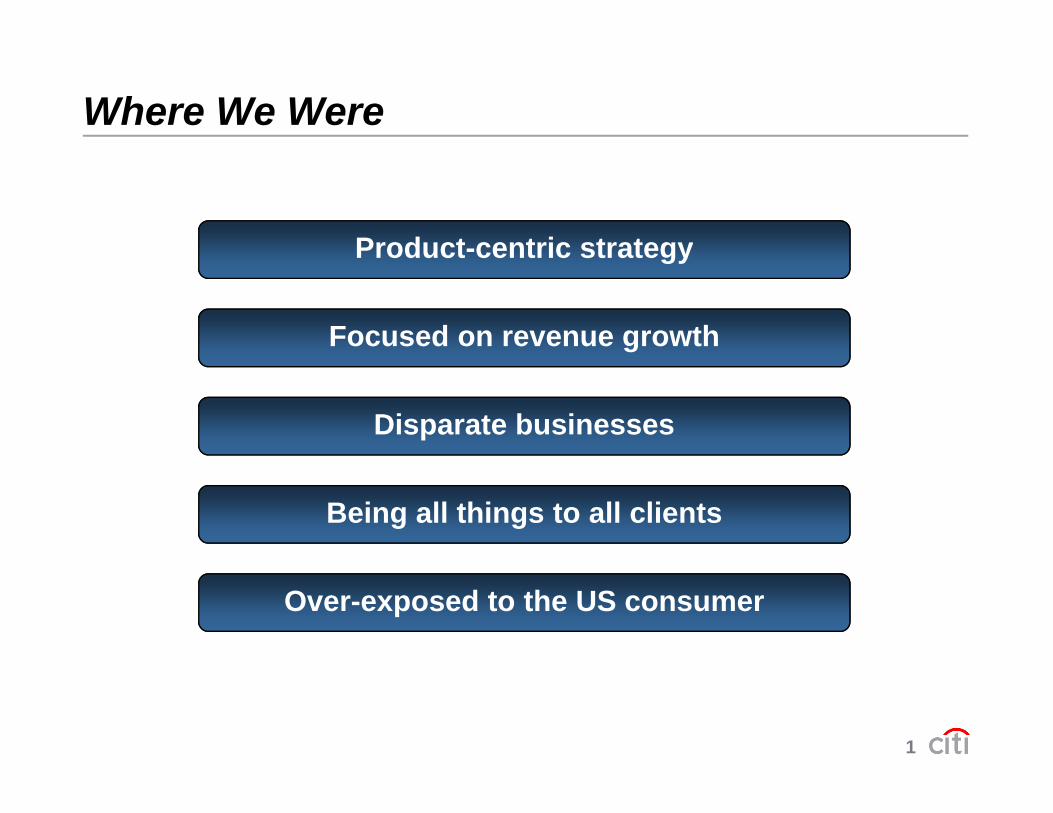
Where We Were
Product-centric strategyProduct centric strategy
Focused on revenue growth
Disparate businesses
Being all things to all clients
Over-exposed to the US consumer
1

Citigroup – Progress Over The Last 2 Years
Raised significant new capitalg p
Reduced amount and riskiness of assets
Cut expenses
Improved risk managementImproved risk management
Added strong leadership
Repaid TARP and exited loss-sharing agreement
2

Citigroup – Progress Over The Last 2 Years
11.9% 11.9% 12.7% 12.8%11.7%
Tier 1 Capital Tier 1 CommonCapital Ratios (1)
(2)
7.7% 8.7% 8.2% 10.3%
4.2% 4.4% 3.7%2.3% 2.2% 2.7%
9.1%9.6%8.2%(2)
(2)
FAS 166/167 Impact Allowance LLR%
1Q'08 2Q'08 3Q'08 4Q'08 1Q'09 2Q'09 3Q'09 4Q'09
Allowance for Loan Losses ($B)
2.31% 2.78% 3.35%4.27% 4.82%
5.60% 5.85%6.09%6.64%
FAS 166/167 Impact Allowance LLR%Allowance for Loan Losses ($B)
$49.4
(2)
(2)
$18.3 $20.8 $24.0 $29.6 $31.7 $35.9 $36.4
36.0
2.31%13.4
3
1Q'08 2Q'08 3Q'08 4Q'08 1Q'09 2Q'09 3Q'09 4Q'09
(1) Tier 1 Common is a non-GAAP financial measure. Please see page 32 for additional information on these measures.(2) Pro forma for the adoption of FAS 166/167, based on information available as of December 31, 2009.

Citigroup – Progress Over The Last 2 YearsExpenses ($B)
9 6
24.6
(20)%(1)
15.4 15.2 14.0
15.0
11.7 12.0 11.8 12.3 9.6
Assets ($Tr)
1Q'08 2Q'08 3Q'08 4Q'08 1Q'09 2Q'09 3Q'09 4Q'09
2.20 2.10 2.05 1.94 1.82 1.85 1.89 1.86
Assets ($Tr)
$(344)B
4
1Q'08 2Q'08 3Q'08 4Q'08 1Q'09 2Q'09 3Q'09 4Q'09
(1) Goodwill impairment charge.

Long-Term Trends And Strategic Implications
Strategic ImplicationsLong-Term Trends
Emerging markets growth
EM economic decoupling
– Capitalize and expand established EM footprint
– Capture increasing cross-border trade and EM economic decoupling
Reduced access to non-bank financial funding
payment flows (globally and intra-regionally)
– Lower reliance on wholesale fundingMatch fund local assets and depositsbank financial funding
Higher urbanization and technology usage
– Match fund local assets and deposits
– Focus consumer strategy on key metropolitan areas and digital distributiontechnology usage
Customized solutions
areas and digital distribution
– Refocus strategy on clients, not products
5

Citigroup Reorganization 2009 ($B)
Citicorp
Transaction
Revenues(1) $66.9Expenses 31.7Provisions 8.8
p
Services
Securities and
Net Income $14.7Assets(3) $1,079Deposits $731
Banking
Regional Consumer B ki
Revenues(1,2) $34.8
Citi Holdings
Banking
• MSSB JV• CitiFinancial
Expenses 14.7Provisions 31.4Net Income(2) $(8.3)Assets(3) $547
• Retail Partners Cards • W.E. Consumer
Banking
6
• Student Loans• Primerica
Assets( ) $547Deposits $92
(1) Reported as Managed Revenues. Managed metrics are non-GAAP financial measures. Please see page 33 for additional information on these measures.(2) Includes a pre-tax gain of $11.1B ($6.7B after-tax) arising from the 2Q’09 closing of the Morgan Stanley Smith Barney joint venture. (3) Approximately $61 billion of assets will be transferred from Citi Holdings to Citicorp in 1Q’10.Note: Corporate / Other not shown.
• Legacy U.S. Mortgages
Banking• SAP Assets

Citi Holdings – AssetsEOP $B
InternationalPrimerica CRE
11%
3% 4%
EOP $B
BAM LCL SAP$(351)898
Local Consumer Lending: $358BAssets(1)
Retail PartnersCards
CitiMortgage
Student Loan Corp
11%
11%
9%
11%
47%
484 469 452 416 396 392 376
346 299 261 241 214 201 182 154
898 833 775 715 662 649 617 547
Auto
CitiFinancial 4%11%
68 65 62 58 52 56 59 35
452 416 396 392 376 358
1Q'08 2Q'08 3Q'08 4Q'08 1Q'09 2Q'09 3Q'09 4Q'09
Brokerage & Asset Management: $35B Special Asset Pool: $154B
8% 17%
Retail Alternative Investments
Latin America Asset Management
31%7%
4% 4%Securities at AFS/HTMEquity
OtherConsumer & SMEs
Brokerage & Asset Management: $35B Special Asset Pool: $154B
75% MS Smith Barney JV
21%20%2%
1%10%
Monolines Loans, leases& Letters of Credit at HFI/HFS
Highly Lev Fin. Commit.
SIVs
7(1) Approximately $61 billion of assets will be transferred from Citi Holdings to Citicorp in 1Q’10.Note: Totals may not sum due to rounding.
Barney JV
Mark-to-MarketHFI/HFS

Citi Holdings – Special Asset Pool
0.6 0.9 0.1
Net Income ($B)
(1.9)
(11.8)(9.1)
(4.3) (4.6)(8.8)
(4.0)(1.2) (0.2)
1Q'07 2Q'07 3Q'07 4Q'07 1Q'08 2Q'08 3Q'08 4Q'08 1Q'09 2Q'09 3Q'09 4Q'09
Citi Holdings Net Revenue Marks(1) ($B)
0.0 0.0
(2 9)
1.0 1.5 0.2
Citi Holdings Net Revenue Marks( ) ($B)
(2.9)
(17 2)(13.7)
(6.6) (6.4)
(12.1)
(4.9)
8
(17.2)1Q'07 2Q'07 3Q'07 4Q'07 1Q'08 2Q'08 3Q'08 4Q'08 1Q'09 2Q'09 3Q'09 4Q'09
(1) Citi Holdings net revenue marks includes SAP and BAM. For a complete list, please see page 35 of the 4Q’09 earnings presentation.

Citi Holdings – Local Consumer Lending
1 2
Net Income
$B
1.1 1.2 0.4
(1.1)
0.1
(1.2)(2 3) (2 3)
(1.4)
(2 1) (2 3)Managed Revenues(2) $23.3
2009
(1)(2.3) (2.3)
(4.2)
(2.1) (2.3)
1Q'07 2Q'07 3Q'07 4Q'07 1Q'08 2Q'08 3Q'08 4Q'08 1Q'09 2Q'09 3Q'09 4Q'09
Managed Net Credit Losses(2)
Expenses 10.4
PB&C 1.1
PPNR $11.8
3 7 4.34.9
5.66.4 6.1 5.7
Managed Net Credit Losses(2)
Managed NCLs(2) $23.8
Loan Loss Reserves(3) $27
1.9 2.0 2.3 2.73.4 3.7 Loan Loss Reserves $27
9(1) Excludes $(2.6)B after-tax goodwill impairment charge. (2) Managed metrics are non-GAAP financial measures. For additional information on these measures please see pages 34 and 43. (3) LLR attributable to Local Consumer Lending is for analytical purposes only. Shown pro forma for FAS 166/167 impact (using 12/31/09 balances).
1Q'07 2Q'07 3Q'07 4Q'07 1Q'08 2Q'08 3Q'08 4Q'08 1Q'09 2Q'09 3Q'09 4Q'09

Citicorp – America’s Global BankUnique global bank for corporations/institutions and consumers− Serving them in over 140 countries
Unmatched global network and emerging markets footprintUnmatched global network and emerging markets footprint− Well positioned to benefit from faster growing products and
geographies
Leveraging core historical strengths to serve clients’ needsLeveraging core historical strengths to serve clients needs− Balanced across three core businesses: transaction services,
securities & banking, and consumer banking
2009 Revenues: $60.2B
25% RCB
By Region By Business
32%
25%
20%
23%
NA EMEA
LatAm
38%
46%16%
RCB
S&B
GTS
10
Asia GTS
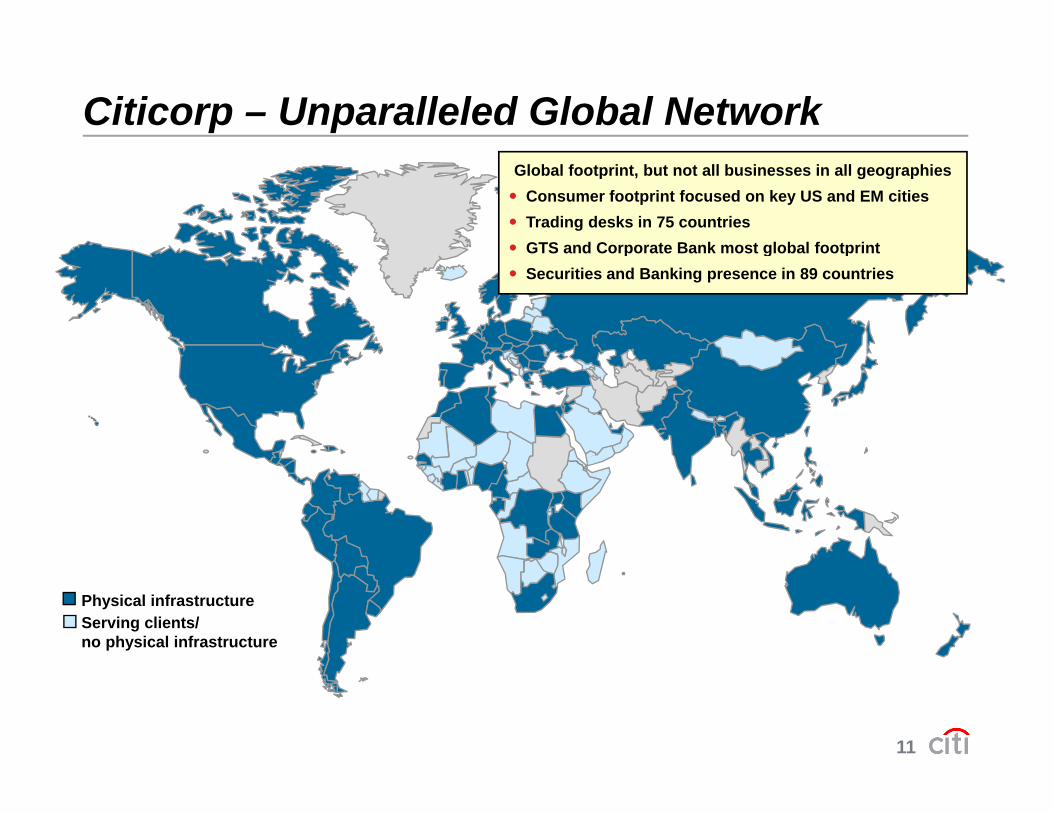
Citicorp – Unparalleled Global NetworkGlobal footprint, but not all businesses in all geographies
Consumer footprint focused on key US and EM citiesTrading desks in 75 countriesGTS and Corporate Bank most global footprintGTS and Corporate Bank most global footprintSecurities and Banking presence in 89 countries
Physical infrastructureServing clients/no physical infrastructure
11

Emerging Markets: A Growing Opportunity
Global Revenue Pool(1) Citicorp: 2009 Financials
CAGR
$3.9Tr 7% 54% 54%
$60B $15B
2.22.5 5%
$3.2Tr
Developed Markets
46% 46%
Revenue Net Income
1.0 1.4
2009 2012E
12% EmergingMarkets
Markets
66% 54%
$1.15Tr $731B
Emerging markets likely to represent over 55% of
potential revenue growth34% 46%
Mgd Assets Deposits(2,3) (2)
12
g
(1) Financial services revenue pool including consumer and corporate/institutional revenues. (source: McKinsey, Citi) (2) End of period.(3) Managed metrics are non-GAAP financial measures. Please see page 34 for additional information on these measures.Note: Developed markets comprise the U.S., Canada, Western Europe, Japan, Australia and New Zealand.
Mgd. Assets Deposits
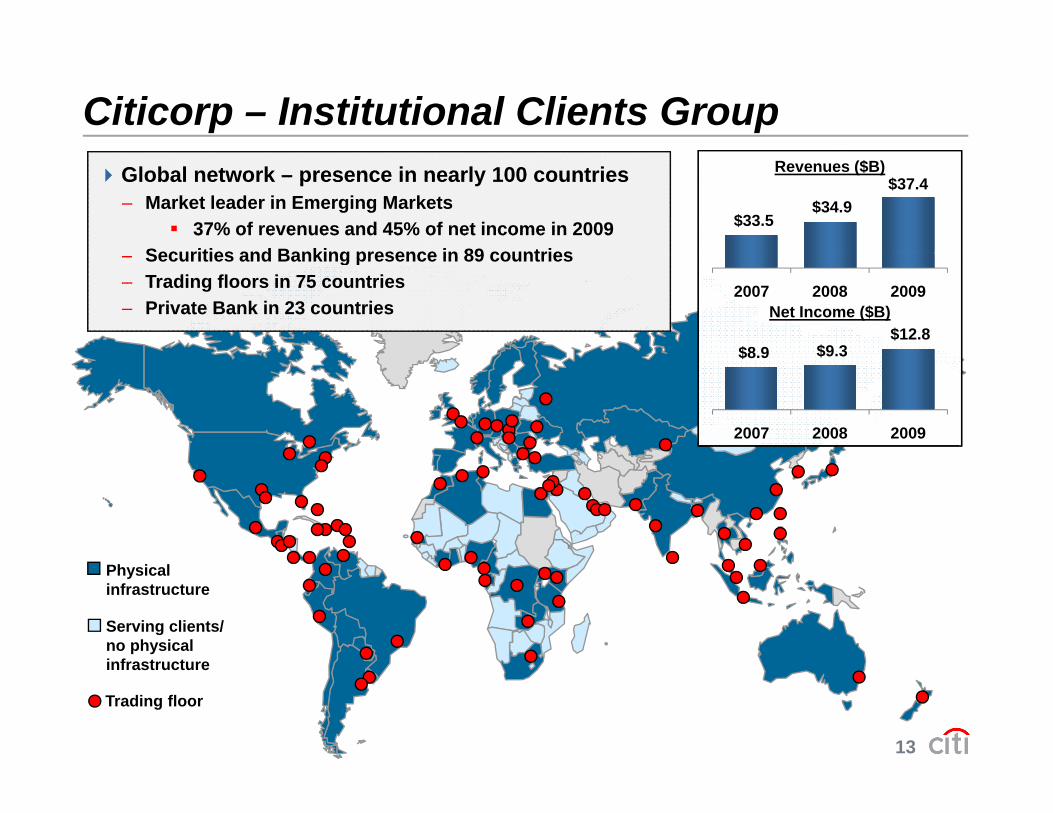
Citicorp – Institutional Clients GroupGlobal network – presence in nearly 100 countries– Market leader in Emerging Markets
37% of revenues and 45% of net income in 2009Securities and Banking presence in 89 countries
Global network – presence in nearly 100 countries– Market leader in Emerging Markets
37% of revenues and 45% of net income in 2009Securities and Banking presence in 89 countries
$33.5 $34.9
$37.4Revenues ($B)
– Securities and Banking presence in 89 countries– Trading floors in 75 countries– Private Bank in 23 countries
– Securities and Banking presence in 89 countries– Trading floors in 75 countries– Private Bank in 23 countries
2007 2008 2009
$8 9 $9.3$12.8
Net Income ($B)
$8.9 $9.3
2007 2008 2009
Physicalinfrastructure
Serving clients/no physicalinfrastructure
13
infrastructure
Trading floor
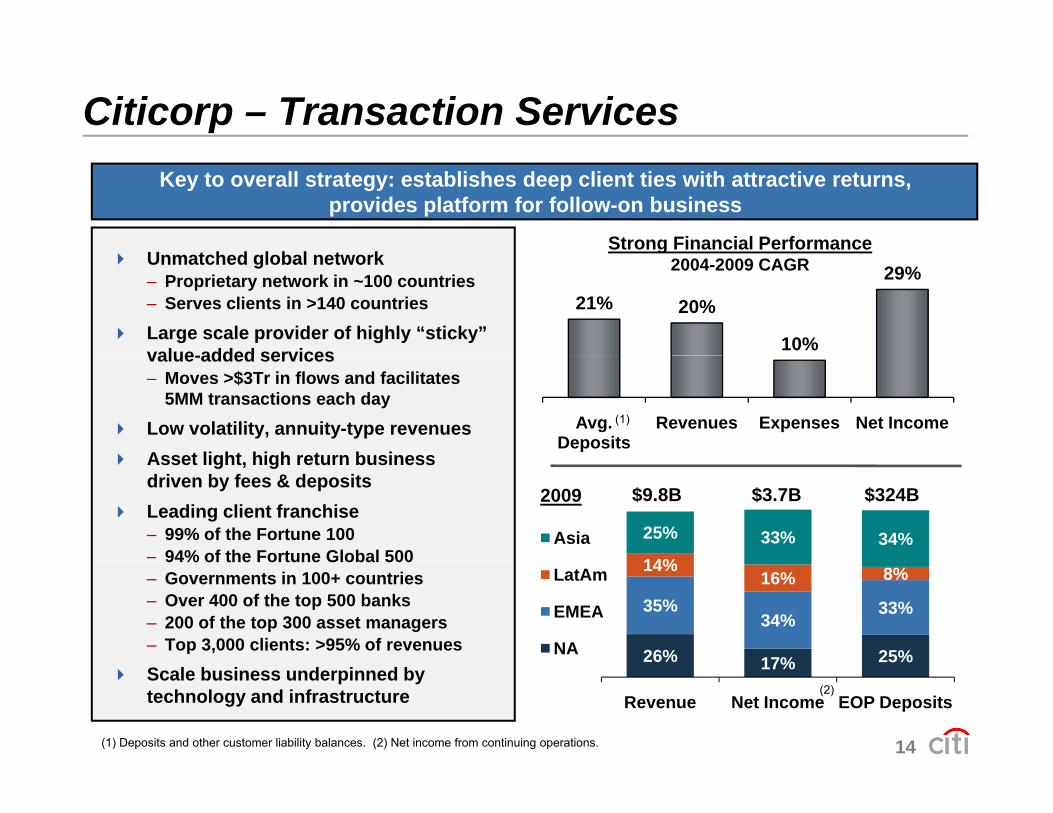
Citicorp – Transaction Services
Strong Financial Performance
Key to overall strategy: establishes deep client ties with attractive returns, provides platform for follow-on business
U t h d l b l t k
21% 20%
10%
29%g
2004-2009 CAGRUnmatched global network – Proprietary network in ~100 countries– Serves clients in >140 countries
Large scale provider of highly “sticky” value-added services
Avg. Deposits
Revenues Expenses Net Income(1)
value-added services– Moves >$3Tr in flows and facilitates
5MM transactions each day
Low volatility, annuity-type revenuesAsset light high return business
14%
25% 33% 34%Asia
$9.8B $3.7B $324B2009
Asset light, high return business driven by fees & depositsLeading client franchise – 99% of the Fortune 100– 94% of the Fortune Global 500
26% 17% 25%
35%34%
33%
14%16% 8%LatAm
EMEA
NA
94% of the Fortune Global 500– Governments in 100+ countries– Over 400 of the top 500 banks– 200 of the top 300 asset managers– Top 3,000 clients: >95% of revenues
14
17%
Revenue Net Income EOP Deposits(2)
(1) Deposits and other customer liability balances. (2) Net income from continuing operations.
Scale business underpinned by technology and infrastructure

Citicorp – Transaction ServicesCash management and custody capabilities are core to the institutional client relationship:
– World’s largest user of SWIFT by volume (7.7% market share in 2009)W ldLi k b d t t 190 t i d 130 i
436 clients use Citi’s globalRapidly growing number of
– WorldLink: processes cross-border payments to ~190 countries and over 130 currencies– Citi Direct: offered in 24 languages, works in 90+ countries and supports 100+ currencies
network in 21+ countries
51+Countries
21+ Countries
11+ Countries
multinational corporations
65 78 ~96‘000s
56% 47% 40%US Domiciled
79% 76% 71%
21% 24% 29%
44% 53% 60%Non US Domiciled
# Clients 61 436 966
71%
2002 2007 2012E
15
Revenues $1.6B $4.4B $5.6B
Source: UNCTAD World Investment Report, Citi estimates.Note: Multinational is defined as an enterprise that controls assets in a foreign entity.
Developed Mkts. Emerging Mkts.

Citicorp – Securities and Banking
$20.8 $24.5 $23.9 $29.4 Strong client franchise with unique exposure to emerging markets– 92 banking clients transact with us in
Revenues (ex-CVA)(1)
2009 Revenues (ex-CVA)(1)
2006 2007 2008 2009
more than 50 countries– Trading floors in 75 countries – Established presence in Asia, Latin
America and CEEMEA$21.1
$5.4 $4.8 $2.1
– Leading local markets FX business
Maintaining focus on:– Risk-adjusted profitability and execution
discipline
$27.6B $9.2B $7792009
$(3.9)FI Mkts
Equity Mkts
Inv. Bnkg.
Prvt. Bank Other
discipline– 5,000 core clients (from 45,000 3 years
ago) and integrating Corporate and Investment Bank
Investing in talent and technology to
(2)
34% 26% 46%
36% 37%25%
12% 17% 8%17% 20% 20%Asia
LatAmEMEANA
Investing in talent and technology to close product gaps and create a more balanced revenue stream– Investment banking, equities, prime
brokerage, commodities, G10 rates,
16(1) CVA of $(1,770) million in 2009, $1,033 million in 2008, and $810 million in 2007. 2009 CVA by business: fixed income markets $464 million, equity markets $(2,190) million, private bank $(44) million. (2) Other includes Lending, Other Securities and Banking. (3) Net income from continuing operations.
34% 26%
Revenue Net Income Avg. Assets
NA
(3)
brokerage, commodities, G10 rates, private bank, equity capital markets

Corporate Clients CoverageInvestment Banking Markets GTSRevenue Profile by International Presence
~1,000 clients active in more than 10 countries and average $10mm in annual revenueen
ts
and average $10mm in annual revenue
Rev
/ Clie
1-10 11-20 21-30 31-40 41-50 51-60 61-70 71-80
I t t B ki M k t GTS
# of Countries in Which Citi Generates Revenue with Client
R P fil b P d t Investment Banking Markets GTS
~1,200 clients utilize at least 8 products and average $10mm in annual revenue
Clie
nts
Revenue Profile by Product
Rev
/ C
17
8 9 10 11 12 13 14 15 16+
# Products used by client

Citicorp – Regional Consumer Banking
N th
Presence in 39 CountriesEmerging Markets Represent Half of Managed Revenues
EMEANorth
America
Asia
Latin AmericaAmerica
$29.4B $196B $290B$1.9B2009:
47%19%
46% 50%5% 4% 3%
25%
17%15% 14%
23%75% 35% 33%
18(1) Managed metrics are non-GAAP financial measures. Please see page 33 for additional information on these measures.
19%(11)%
Managed Revenues Net Income EOP Managed Loans EOP Deposits(1) (1)

A Concentrated Opportunity
150 metro areas equal 30% of world’s GDP(1) Metro GDP: Top 10 largest countries ($Tr)
USA:Rest of
developed:42 iti
7.4
2.0~ EmergingDeveloped
% total GDP
36%31%
23 cities 42 cities
1 0
52%
41%37%
49%
59% 56%
47%
33%
0.80.7
0.5
1.00.8 0.7
0.60.431%
24%
37%
22%
Emerging Markets:85 cities
%
19(1) Calculated using purchase power parity exchange rates. Source: PricewaterhouseCoopers, UK Economic Outlook, November 2009.

Citicorp – North America Consumer Banking
Key part of Citi’s global consumer network
Important source of deposit funding Our top 17 MSAs cover:Our top 17 MSAs cover:
A segment-led strategy:− Target mass affluent, urban, globally-
minded customers − Customer mix skewed towards savers
Our top 17 MSAs cover:−1/3 of US population−1/4 of US deposits(1)
Our top 17 MSAs cover:−1/3 of US population−1/4 of US deposits(1)
− Customer mix skewed towards savers and investors
Target retail segment already represents ~50% of our existing customer base− Estimated 18 million target segment
households within branch footprint− Currently serving less than 10% of
target households
Branch network skewed towards the mass affluent segment
Average deposits per branch at 2.0x peers
Savers and Investors(2) as a % of total customers close to 1.4x large peers
Present in 9 of top 10 U.S. metro areas− Account for 77% of Citi branches
and deposits
20
(1) Deposits in “close proximity” to a Citi branch. The definition is based on county branch density (ranging from 0.25 miles in metro locations to 3 miles in rural locations).
(2) Savers and Investors defined as clients with investable asset levels above $100,000.Source: Nielsen Claritas Market Share Survey, SNL

Citicorp – North America Consumer Banking
3rd largest issuer of cards
Lend-centric model under pressure:
− Legislative and regulatory limits on risk-based pricing
23MM open accounts
risk based pricing
− Consumer deleveraging, spending less
− Smaller but more profitable business p
$83B of managed(1) loans
$167B in annual sales, ~2 billion purchase transactions
p
Redefining business model
− More reliance on convenience of payments transactions
Average spend of ~$8,900 per active account, average balance of ~$4,400
payments
Reengineering cost base to make it more variable
21(1) Managed metrics are non-GAAP financial measures. Please see page 33 for additional information on these measures.

Citicorp – International Consumer Banking20 countries represent over 80%
of Emerging Markets revenue pool(1)Focus on Emerging Markets
– EM countries represented ~90% of 2009 21%18% ChinaRest of EM
International RCB revenues
Targeting the mass affluent
– Critical mass in key cities through
13%
10%2%2%
10%Brazil
Next 5(2)
TurkeyS. Africa
Critical mass in key cities through branches, enhanced using alternative channels and perceptual scale
Leader in cards2009 Citi Int’l RCB Revenues: $15 5B
10%9%5%
4%4%
3%Taiwan
Russia
KoreaIndia
y
Mexico
Thailand
– Top 3 in 20 countries
– 10% share in emerging markets
– Co-branding with top local and global
2009 Citi Int l RCB Revenues: $15.5B
24%23% MexicoRest of Int’l
RCB
– Co-branding with top local and global corporations
Citigold – strong mass affluent proposition
9%6%
5%5%5%4%
4%2%
9% Brazil
JapanKorea
Next 5(3)
AustraliaIndia
Indonesia
22(1) 2010 estimated financial services revenue pool including retail banking, cards and LCB 2008 revenue pool (source McKinsey). (2) Next 5: Hong Kong, Indonesia, Poland, United Arab Emirates, Saudi Arabia. (3) RCB next 5: Poland, Malaysia, Thailand, Turkey, Colombia. Note: Developed markets comprise the U.S., Canada, Western Europe, Japan, Australia and New Zealand.
p p4%
4%Taiwan
KoreaIndiaSingapore Hong
Kong

RCB + GTS: Citi At Work
Joint Consumer–ICG coverage of corporate clients– Leverage GTS into Consumer Banking through integrated payroll solutions
Strong base of ~4,000 ICG clients(1)
5.7 million total customers in 35 countries
Growing source of new customers: 29% of new-to-bank retail customersGrowing source of new customers: 29% of new to bank retail customers
27%
Citi At Work % new-to-bank retail customers Citi At Work % retail banking deposits
80%
59%
33%
27%
18%
11%33%
18%
Russia India Mexico Brazil
11%7%
Russia India Brazil Mexico
23
Russia India Mexico Brazil Russia India Brazil Mexico
(1) Approximately 53,000 clients in total: ~4,000 ICG clients and ~49,000 Local Commercial Banking (RCB) clients.Note: Citi At Work as a % of new-to-bank retail customers for full year 2009. Citi At Work as a % of retail banking deposits as of EOP 2009.

Adjusted Return On AssetsN t I (1) N t R M k & LLR B ild % f A M d(2) A tNet Income(1) ex-Net Revenue Marks & LLR Builds as a % of Avg. Managed(2) Assets
By Segment
1.56% 1.57%
Holdings Citicorp
1.06%1.13% 1.03% 1.07%
(0.11)%(0.11)%
(0.47)%
2006 2007 2008 2009
24
(1) Net income from continuing operations.(2) Managed metrics are non-GAAP financial measures. Please see pages 35 and 36 for additional information on these metrics.Note: Adjusted ROA is a non-GAAP financial measure. Adjusted ROA excludes impact of loan loss reserve builds (LLR) and of net revenue marks, tax affected at 35%. 2008 also excludes impact of goodwill impairment charge. Corporate / Other not shown.
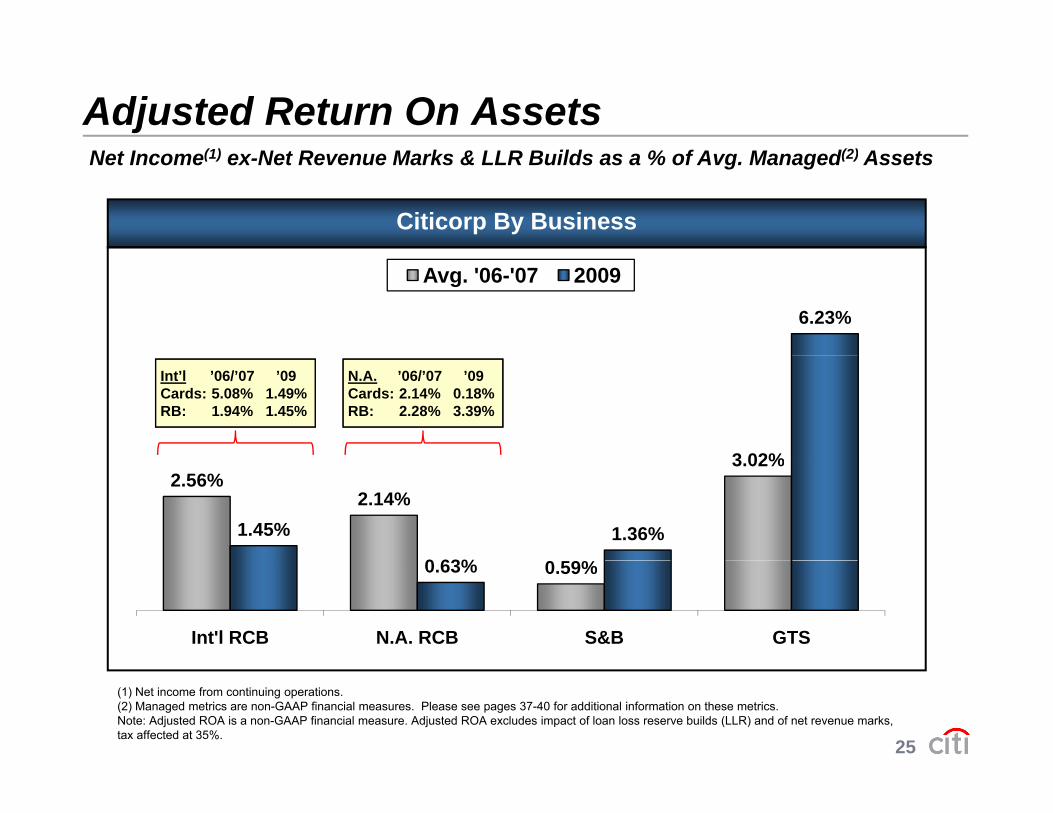
Adjusted Return On AssetsN t I (1) N t R M k & LLR B ild % f A M d(2) A t
Citicorp By Business
Net Income(1) ex-Net Revenue Marks & LLR Builds as a % of Avg. Managed(2) Assets
6.23%
Avg. '06-'07 2009
3 02%
Int’l ’06/’07 ’09Cards: 5.08% 1.49%RB: 1.94% 1.45%
N.A. ’06/’07 ’09Cards: 2.14% 0.18%RB: 2.28% 3.39%
2.56%2.14%
0 9%
3.02%
1.45%
0 63%
1.36%
0.59%0.63%
Int'l RCB N.A. RCB S&B GTS
25
(1) Net income from continuing operations.(2) Managed metrics are non-GAAP financial measures. Please see pages 37-40 for additional information on these metrics.Note: Adjusted ROA is a non-GAAP financial measure. Adjusted ROA excludes impact of loan loss reserve builds (LLR) and of net revenue marks, tax affected at 35%.

Adjusted Return On AssetsN t I (1) N t R M k & LLR B ild % f A M d(2) A t
Citicorp By Region
Net Income(1) ex-Net Revenue Marks & LLR Builds as a % of Avg. Managed(2) Assets
2 96%
Avg. '06-'07 2009
2.96%
1 65%
2.26%1.86% 1.83%
0.60%0.83%
1.65%
1.00%
N.A. EMEA LatAm Asia
26
(1) Net income from continuing operations. (2) Managed metrics are non-GAAP financial measures. Please see page 41 for additional information on these metrics.Note: Adjusted ROA is a non-GAAP financial measure. Adjusted ROA excludes impact of loan loss reserve builds (LLR) and of net revenue marks, tax affected at 35%.

Adjusted Return On AssetsN t I (1) N t R M k & LLR B ild % f A M d(2) A t
Citicorp + Corp/Other
Net Income(1) ex-Net Revenue Marks & LLR Builds as a % of Avg. Managed(2) Assets
1 15%
EOP Mgd. Assets ($Tr) ROA(2)
1.00%0.83% 0.85%
1.15%
$1.3 $1.3 $1.3 $1.4
2006 2007 2008 2009
27
(1) Net income from continuing operations.(2) Managed metrics are non-GAAP financial measures. Please see pages 33 and 42 for additional information on these metrics. Note: Adjusted ROA is a non-GAAP financial measure. Adjusted ROA excludes impact of loan loss reserve builds (LLR) and of net revenue marks, tax affected at 35%. Corporate/Other includes Corporate Treasury (i.e. Citigroup funding expenses, funding costs for non-interest bearing assets), net expenses of global functions and intercompany eliminations. 2009 excludes impact of TARP repayment and exiting of loss-sharing agreement ($6.2B after-tax) and preferred exchange gain ($0.9B after-tax).

Citigroup – Managed(1) Assets
Citicorp Holdings Corp/Other
(EOP $Tr)
1.31
1.47 1.50
1.29 1.30 1 23 1 23
45%
19%12%
24% NALatam
Asia
1.23 1.23
1.07 1.03 1.06 1.08 1.15
0 800.89 0.93 0.94
0.87 0 81
EMEA
Citicorp +0.75 0.80 0.81 0.75 0.70 0.69 0.65
0.59
Citicorp + Corp/Other:
$1.38
0.02 0.03 0.04 0.04 0.04 0.08 0.100.22 0.20 0.21 0.26 0.23
28
1Q'07 2Q'07 3Q'07 4Q'07 1Q'08 2Q'08 3Q'08 4Q'08 1Q'09 2Q'09 3Q'09 4Q'09
(1) Managed metrics are non-GAAP financial measures. Please see page 34 for additional information on these metrics.Note: Corp/Other excludes assets from discontinued operations.
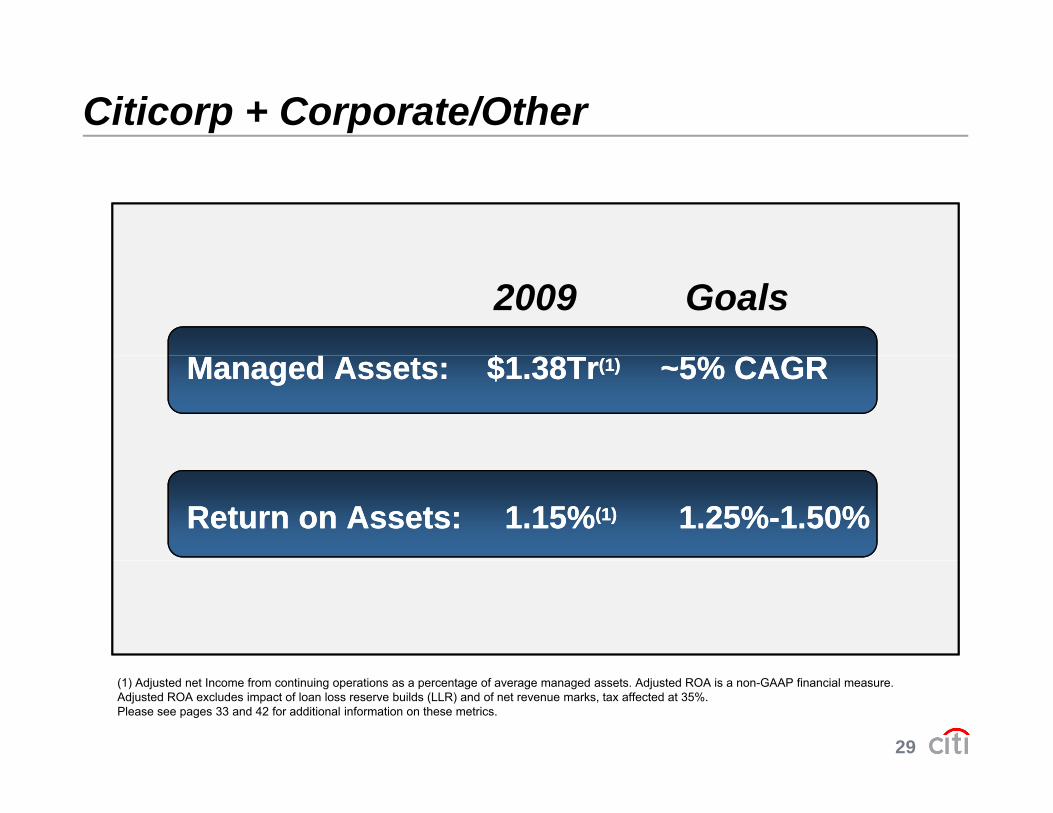
Citicorp + Corporate/Other
$$
2009 Goals
Managed Assets: $1.38Tr(1) ~5% CAGRManaged Assets: $1.38Tr(1) ~5% CAGR
Return on Assets: 1.15%(1) 1.25%-1.50%Return on Assets: 1.15%(1) 1.25%-1.50%
29
(1) Adjusted net Income from continuing operations as a percentage of average managed assets. Adjusted ROA is a non-GAAP financial measure. Adjusted ROA excludes impact of loan loss reserve builds (LLR) and of net revenue marks, tax affected at 35%. Please see pages 33 and 42 for additional information on these metrics.

Fundamentally Different Company
Grow Citicorp’s core businesses: GTS, S&B, RCBGrow Citicorp s core businesses: GTS, S&B, RCB
Client-focused strategy
Leverage unique global footprint with unmatched presence in emerging markets
Strong capital base
W ll iti d t t t t i d fit bilitWell positioned to return to sustained profitability
30

Certain statements in this document are “forward-looking
statements” within the meaning of the Private Securities Litigation
Reform Act. These statements are based on management’s
current expectations and are subject to uncertainty and changes in
circumstances. Actual results may differ materially from those y y
included in these statements due to a variety of factors. More
information about these factors is contained in Citigroup’s filingsinformation about these factors is contained in Citigroup s filings
with the U.S. Securities and Exchange Commission.
31

Non-GAAP Financial MeasuresRECONCILIATION OF NON GAAP FINANCIAL MEASURESRECONCILIATION OF NON-GAAP FINANCIAL MEASURESManaged-basis (Managed) presentations detail certain non-GAAP financial measures. Managed presentations (applicable only to North American credit card operations, as securitizations are not done in any other regions) include results from both the on-balance sheet loans and off-balance sheet loans, and exclude the impact of card securitization activity.
Managed presentations assume that securitized loans have not been sold and present the results of the securitized loans in the same manner as Citigroup's owned loansCitigroup s owned loans.
$MM, except ratio
Tier 1 Common Ratio Calculation 4Q'08 4Q'09Tier 1 Common Ratio Calculation 4Q 08 4Q 09
Citigroup common stockholders’ equity 70,966$ 152,388$
Less: Net unrealized losses on securities available‐for‐sale, net of tax (9,647) (4,347)
Less: Accumulated net losses on cash flow hedges, net of tax (5,189) (3,182)
Less: Pension liability adjustment, net of tax (2,615) (3,461)
Less: Cumulative effect included in fair value of financial liabilities attributable to the change in own g
credit worthiness, net of tax 3,391 760
Less: Disallowed deferred tax assets 23,520 25,958
Less: Intangible assets:
Goodwill 27,132 25,392
Other disallowed intangible assets 10,607 5,899
Other (840) (788)
Total Tier 1 Common 22,927$ 104,581$
Risk Weighted Assets under Federal Reserve Board Capital Regulatory Guidelines (RWA) 996,247 1,088,526 Tier 1 Common Ratio (Total Tier 1 Common / RWA) 2.3% 9.6%
32

Non-GAAP Financial MeasuresRECONCILIATION OF NON GAAP FINANCIAL MEASURESRECONCILIATION OF NON-GAAP FINANCIAL MEASURES
$MM FY 2009
Managed Citicorp Revenues 66,878$
Less: Net impact from Card Securitizations ‐ Citicorp 6,672
GAAP Ci i R 60 206$GAAP Citicorp Revenues 60,206$
$MM FY 2009
Managed Citi Holdings Revenues 34,770$
Less: Net impact from Card Securitizations ‐ Citi Holdings 4,135
GAAP Citi Holdings Revenues 30,635$
$MM FY 2009
Managed Citicorp RCB Revenues 29,443$
Less: Net impact from Card Securitizations ‐ Citicorp 6,672
GAAP Citicorp RCB Revenues 22,771$
$B 4Q'09
Managed Citicorp RCB EOP Loans 196.3$
Less: Impact from Securitized Loans 71.6$
GAAP Citicorp RCB EOP Loans 124.7$
$B 4Q'09
Managed Citicorp NA RCB EOP Loans 82.7$
Less: Impact from Securitized Loans 71.6$
GAAP Citicorp RCB EOP Loans 11.1$
$Tr 2006 2007 2008 2009
Managed Citicorp + Corporate/Other EOP Assets 1 26$ 1 33$ 1 29$ 1 38$
33
Managed Citicorp + Corporate/Other EOP Assets 1.26$ 1.33$ 1.29$ 1.38$
Less: Impact from Securitized Loans 0.07$ 0.07$ 0.07$ 0.07$
GAAP Citicorp + Corporate/Other EOP Assets 1.19$ 1.26$ 1.22$ 1.31$

Non-GAAP Financial MeasuresRECONCILIATION OF NON GAAP FINANCIAL MEASURESRECONCILIATION OF NON-GAAP FINANCIAL MEASURES
$B 1Q'07 2Q'07 3Q'07 4Q'07 1Q'08 2Q'08 3Q'08 4Q'08
Managed Citicorp EOP Assets 1,312$ 1,466$ 1,499$ 1,292$ 1,296$ 1,232$ 1,229$ 1,072$
Less: Impact from Securitized Loans 67 67 70 70 71 72 71 70
GAAP Citicorp EOP Assets 1,245$ 1,399$ 1,429$ 1,222$ 1,225$ 1,160$ 1,158$ 1,002$
$B 1Q'07 2Q'07 3Q'07 4Q'07 1Q'08 2Q'08 3Q'08 4Q'08
Managed Citi Holdings EOP Assets 752$ 798$ 894$ 927$ 938$ 872$ 812$ 751$
Less: Impact from Securitized Loans 35 37 37 39 40 39 37 36
GAAP Citi Holdings EOP Assets 717$ 761$ 857$ 888$ 898$ 833$ 775$ 715$
$B 1Q'09 2Q'09 3Q'09 4Q'09
Managed Citicorp EOP Assets 1,026$ 1,055$ 1,085$ 1,151$
Less: Impact from Securitized Loans 68 71 71 72
GAAP Citicorp EOP Assets 958$ 984$ 1,014$ 1,079$
$B 1Q'09 2Q'09 3Q'09 4Q'09
Managed Citi Holdings EOP Assets 700$ 687$ 654$ 586$
Less: Impact from Securitized Loans 38 38 37 39
GAAP Citi Holdings EOP Assets 662$ 649$ 617$ 547$
$MM FY 2009
Managed Citi Holdings LCL Revenues 23,317$
L N t i t f C d S iti ti Citi H ldi 4 135Less: Net impact from Card Securitizations ‐ Citi Holdings 4,135
GAAP Citi Holdings LCL Revenues 19,182$
$MM FY 2009
Managed Citi Holdings LCL NCLs 23,827$
Less: Impact from Card Securitizations 4,590
34
GAAP Citi Holdings LCL NCLs 19,237$

Non-GAAP Financial MeasuresRECONCILIATION OF NON GAAP FINANCIAL MEASURESRECONCILIATION OF NON-GAAP FINANCIAL MEASURES
Citicorp Adjusted ROA Reconciliation ($B)
Net Income from Cont Ops Loan Loss Revenue GoodwillAdjustments
AdjustedNet Income from Cont. Ops. Loan Loss Revenue Goodwill Citicorp Reserves(1) Marks imp.
2006 $12.5 ($0.1) $12.62007 14.6 (0.7) 0.7 14.72008 6.2 (2.0) 0.1 (6.1) 14.12009 14 8 (1 8) (0 8) 17 3
Adjusted Net Income
2009 14.8 (1.8) (0.8) 17.3
Avg. N.A. Cards Mgd. Avg.Assets Sec. Impact Assets
2006 $1,047 $68 $1,1152007 1 353 67 $1 4202007 1,353 67 $1,4202008 1,256 70 $1,3262009 1,035 69 $1,104
Adjusted ROA
2006 1 13%2006 1.13%2007 1.03%2008 1.07%2009 1.57%
35
(1) Includes provision for unfunded lending commitments

Non-GAAP Financial MeasuresRECONCILIATION OF NON GAAP FINANCIAL MEASURESRECONCILIATION OF NON-GAAP FINANCIAL MEASURES
Holdings Adjusted ROA Reconciliation ($B)
Net Income from Cont Ops Loan Loss Revenue GoodwillAdjustments
AdjustedNet Income from Cont. Ops. Loan Loss Revenue Goodwill Holdings Reserves(1) Marks imp.
2006 9.4 $0.3 9.22007 (8.7) (3.8) (13.1) 8.22008 (36.0) (7.3) (25.2) (2.6) (0.9)2009 (8 2) (3 6) (1 4) (3 2)
Adjusted Net Income
2009 (8.2) (3.6) (1.4) (3.2)
Avg. N.A. Cards Mgd. Avg.Assets Sec. Impact Assets
2006 $556 $29 $5852007 741 32 $7732007 741 32 $7732008 813 37 $8502009 646 36 $682
Adjusted ROA
2006 1 56%2006 1.56%2007 1.06%2008 (0.11%)2009 (0.47%)
36
(1) Includes provision for unfunded lending commitments

Non-GAAP Financial MeasuresRECONCILIATION OF NON GAAP FINANCIAL MEASURESRECONCILIATION OF NON-GAAP FINANCIAL MEASURES
Citicorp RCB Adjusted ROA Reconciliation ($B)Adjustments
Total NA Int'l Total RCB NA Int'l LLR NA Int'l Total
Adjusted Net Income Net Income from Cont. Ops.NA Int l Total RCB NA Int l LLR NA Int l
2006 2.6 3.4 $6.0 0.0 0.0 $0.1 2.6 3.4 $5.92007 1.9 3.7 $5.6 (0.1) (0.5) (0.6) 1.9 4.2 6.22009 0.4 1.5 $1.9 (0.3) (0.8) (1.1) 0.6 2.4 3.0
GAAP Avg. AssetsNA Int'l Total
2006 37 135 $1722007 39 161 2002009 34 162 196
GAAP Avg. Assets
Cards Mgd. Avg.Sec. Impact Assets
$68 $24067 26769 26569 265
NA Int'l Total
2006 2.45% 2.49% 2.47%2007 1 82% 2 64% 2 31%
Adjusted ROA
37
2007 1.82% 2.64% 2.31%06-'07 Avg 2.14% 2.56% 2.39%
2009 0.63% 1.45% 1.13%

Non-GAAP Financial MeasuresRECONCILIATION OF NON GAAP FINANCIAL MEASURESRECONCILIATION OF NON-GAAP FINANCIAL MEASURES
Citicorp RCB Retail Bank Adjusted ROA Reconciliation ($B)Adjustments
Net Income from Cont Ops Total Adjusted Net IncomeNet Income from Cont. Ops. Total NA Int'l Total NA Int'l LLR NA Int'l Total
2006 0.6 2.3 $3.0 0.0 0.2 $0.2 0.6 2.1 $2.82007 0.1 2.3 $2.4 (0.0) (0.2) (0.2) 0.1 2.5 2.62009 0.4 1.6 $2.0 (0.1) (0.2) (0.3) 0.5 1.8 2.3
Adjusted Net Income
Avg.Assets
NA Int'l Total2006 16 110 $1262006 16 110 $1262007 20 126 $1462009 14 125 $139
Adjusted ROANA Int'l Total
2006 3.89% 1.92% 2.18%2007 0.67% 1.95% 1.78%
06-'07 Avg 2.28% 1.94% 1.98%
2009 3.39% 1.45% 1.65%
38

Non-GAAP Financial MeasuresRECONCILIATION OF NON GAAP FINANCIAL MEASURESRECONCILIATION OF NON-GAAP FINANCIAL MEASURES
Citicorp RCB Cards Adjusted ROA Reconciliation ($B)Adjustments
Total NA Int'l Total NA Int'l LLR NA Int'l TotalNet Income from Cont. Ops. Adjusted Net Income NA Int l Total NA Int l LLR NA Int l Total
2006 2.0 1.1 $3.0 0.0 (0.2) ($0.2) 1.9 1.3 $3.22007 1.8 1.4 3.2 (0.0) (0.4) (0.4) 1.8 1.8 3.62009 (0.1) (0.0) (0.1) (0.2) (0.6) (0.8) 0.2 0.5 0.7
GAAP Avg AssetsNA Int'l Total
2006 21 25 $462007 19 35 542009 20 36 57
GAAP Avg. Assets
Cards Mgd. Avg.Sec. Impact Assets
$68 $11367 12169 12569 125
NA Int'l Total
2006 2.19% 5.00% 2.81%2007 2.09% 5.15% 2.97%
Adjusted ROA
39
06-'07 Avg 2.14% 5.08% 2.89%
2009 0.18% 1.49% 0.56%
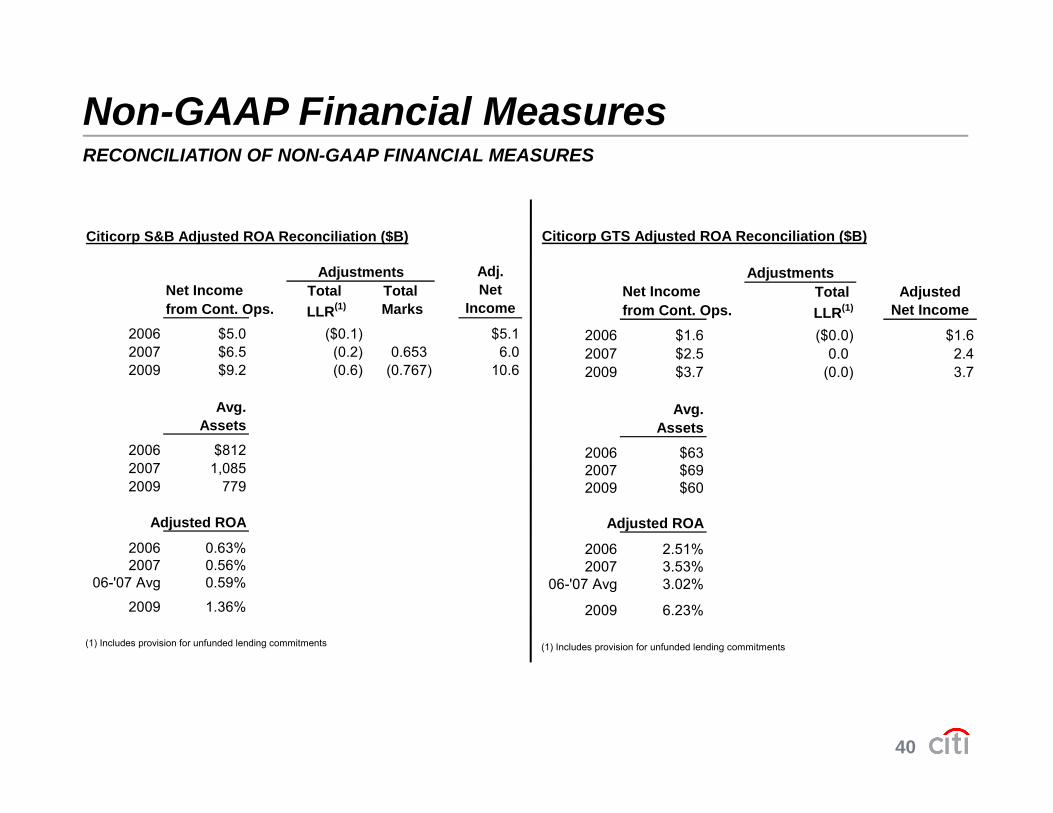
Non-GAAP Financial MeasuresRECONCILIATION OF NON GAAP FINANCIAL MEASURESRECONCILIATION OF NON-GAAP FINANCIAL MEASURES
Citicorp S&B Adjusted ROA Reconciliation ($B) Citicorp GTS Adjusted ROA Reconciliation ($B)
Adj.Net Income Total Total Net from Cont. Ops. LLR(1) Marks Income
2006 $5.0 ($0.1) $5.12007 $6.5 (0.2) 0.653 6.0
Adjustments AdjustmentsNet Income Total from Cont. Ops. LLR(1)
2006 $1.6 ($0.0) $1.62007 $2 5 0 0 2 4
Adjusted Net Income
2007 $6.5 (0.2) 0.653 6.02009 $9.2 (0.6) (0.767) 10.6
Avg.Assets
2006 $812
2007 $2.5 0.0 2.42009 $3.7 (0.0) 3.7
Avg.Assets
2006 $632007 1,0852009 779
Adjusted ROA
2006 0.63%2007 0 56%
$2007 $692009 $60
Adjusted ROA
2006 2.51%2007 0.56%
06-'07 Avg 0.59%
2009 1.36%
(1) Includes provision for unfunded lending commitments
2007 3.53%06-'07 Avg 3.02%
2009 6.23%
(1) Includes provision for unfunded lending commitments
40

Non-GAAP Financial MeasuresRECONCILIATION OF NON GAAP FINANCIAL MEASURESRECONCILIATION OF NON-GAAP FINANCIAL MEASURESCiticorp Regional Adjusted ROA Reconciliation ($B)
NA EMEA Latam Asia Total NA EMEA Latam Asia TotalNet Income from Cont. Ops. Average GAAP Assets
2006 4.0 2.0 3.2 3.4 $12.5 2006 486 250 108 203 $1,0472007 3.8 2.5 3.5 4.8 $14.6 2007 601 338 135 280 1,3532009 3.4 4.5 2.4 4.5 $14.8 2009 405 232 133 266 1,035
Adjustments
Loan Loss Reserves(1) Cards Sec. Avg. NA EMEA Latam Asia Total Impact Mgd.
2006 (0.0) (0.0) (0.1) 0.1 ($0.1) 2006 $68 $1,1152007 (0.1) (0.3) (0.3) (0.0) (0.7) 2007 67 $1,4202009 (0 4) (0 6) (0 4) (0 4) (1 8) 2009 69 $1 1042009 (0.4) (0.6) (0.4) (0.4) (1.8) 2009 69 $1,104
Net Revenue MarksNA EMEA Latam Asia Total NA EMEA Latam Asia Total
2006 2006 0.72% 0.83% 3.10% 1.59% 1.13%2007 0 6 0 0 0 0 0 0 $0 7 2007 0 49% 0 82% 2 82% 1 72% 1 03%
Adjusted ROA
2007 0.6 0.0 0.0 0.0 $0.7 2007 0.49% 0.82% 2.82% 1.72% 1.03%2009 (1.0) (0.2) 0.4 (0.0) (0.8) 06, '07 Avg 0.60% 0.83% 2.96% 1.65% 1.08%
2009 1.00% 2.26% 1.86% 1.83% 1.57%
NA EMEA Latam Asia Total
2006 4 0 2 1 3 3 3 2 $12 6
Adjusted Net Income
41
2006 4.0 2.1 3.3 3.2 $12.62007 3.3 2.8 3.8 4.8 14.72009 4.7 5.2 2.5 4.9 17.3
(1) Includes provision for unfunded lending commitments

Non-GAAP Financial MeasuresRECONCILIATION OF NON GAAP FINANCIAL MEASURESRECONCILIATION OF NON-GAAP FINANCIAL MEASURES
Citicorp + Corp Other Adjusted ROA Reconciliation ($B)
Loan Loss Revenue Preferred TARP Rep./ Goodwill Citicorp Corp/Other Total Reserves(1) Marks Exchange Loss sharing imp. Net Income
AdjustmentsNet Income from Cont. Ops.
C t co p Co p/Ot e ota Reserves a s c a ge oss s a g p et co e
2006 $12.5 ($1.2) $11.3 ($0.1) $11.42007 14.6 (2.7) 11.9 (0.7) 0.7 $12.02008 6.2 (2.2) 4.0 (2.0) 0.1 (6.1) $12.02009 14.8 (7.6) 7.2 (1.8) (0.8) 0.9 (6.2) $15.0
Avg. N.A. Cards Mgd. Avg.Assets Sec. Impact Assets
2006 $1,069 $68 $1,1372007 1,382 67 $1,4492008 1,336 70 $1,4062009 1,243 69 $1,312
Adjusted ROA
2006 1.00%2007 0.83%2008 0 85%2008 0.85%2009 1.15%
Average 2006/2007 0.91%
(1) Includes provision for unfunded lending commitments
42
( ) p g

Non-GAAP Financial MeasuresRECONCILIATION OF NON GAAP FINANCIAL MEASURESRECONCILIATION OF NON-GAAP FINANCIAL MEASURES
$MM 1Q'07 2Q'07 3Q'07 4Q'07 1Q'08 2Q'08 3Q'08 4Q'08
Managed Citi Holdings LCL NCLs 1,936$ 1,975$ 2,262$ 2,660$ 3,358$ 3,707$ 4,299$ 4,897$
Less: Impact from Card Securitizations 531 499 512 501 711 725 812 862Less: Impact from Card Securitizations 531 499 512 501 711 725 812 862
GAAP Citi Holdings LCL NCLs 1,405$ 1,476$ 1,750$ 2,159$ 2,647$ 2,982$ 3,487$ 4,035$
$MM 1Q'09 2Q'09 3Q'09 4Q'09 FY 2009
Managed Citi Holdings LCL NCLs 5,589$ 6,434$ 6,066$ 5,738$ 23,827$
Less: Impact from Card Securitizations 1,057 1,278 1,137 1,118 4,590
GAAP Citi Holdings LCL NCLs 4,532$ 5,156$ 4,929$ 4,620$ 19,237$
43


