CITIGROUP - QUARTERLY FINANCIAL DATA SUPPLEMENT 1Q08 Page Number Citigroup Consolidated Financial Summary 1 Segment Income: Product View 2 Regional View 3 Segment Net Revenues: Product View 4 Regional View 5 Consolidated Statement of Income 6 Consolidated Balance Sheet 7 Segment Detail Global Consumer: 8 - 9 U.S. U.S. Cards 10 - 11 U.S. Retail Distribution 12 - 13 U.S. Consumer Lending 14 - 15 U.S. Commercial Business 16 International International Cards 17 - 18 International Consumer Finance 19 - 20 International Retail Banking 21 - 22 Markets & Banking: 23 Income Statement 24 Revenue Details 25 Securities and Banking 26 Transaction Services 27 Global Wealth Management: 28 Smith Barney 29 Private Bank 30 Alternative Investments 31 Citigroup Supplemental Detail Return on Capital 32 Average Balances and Interest Rates 33 Consumer Loan Delinquency Amounts, Net Credit Losses and Ratios 34 Allowance for Credit Losses: Total Citigroup 35 Consumer Loans 36 Corporate Loans 37 Components of Provision for Loan Losses 38 Non-Performing Assets 39
Transcript
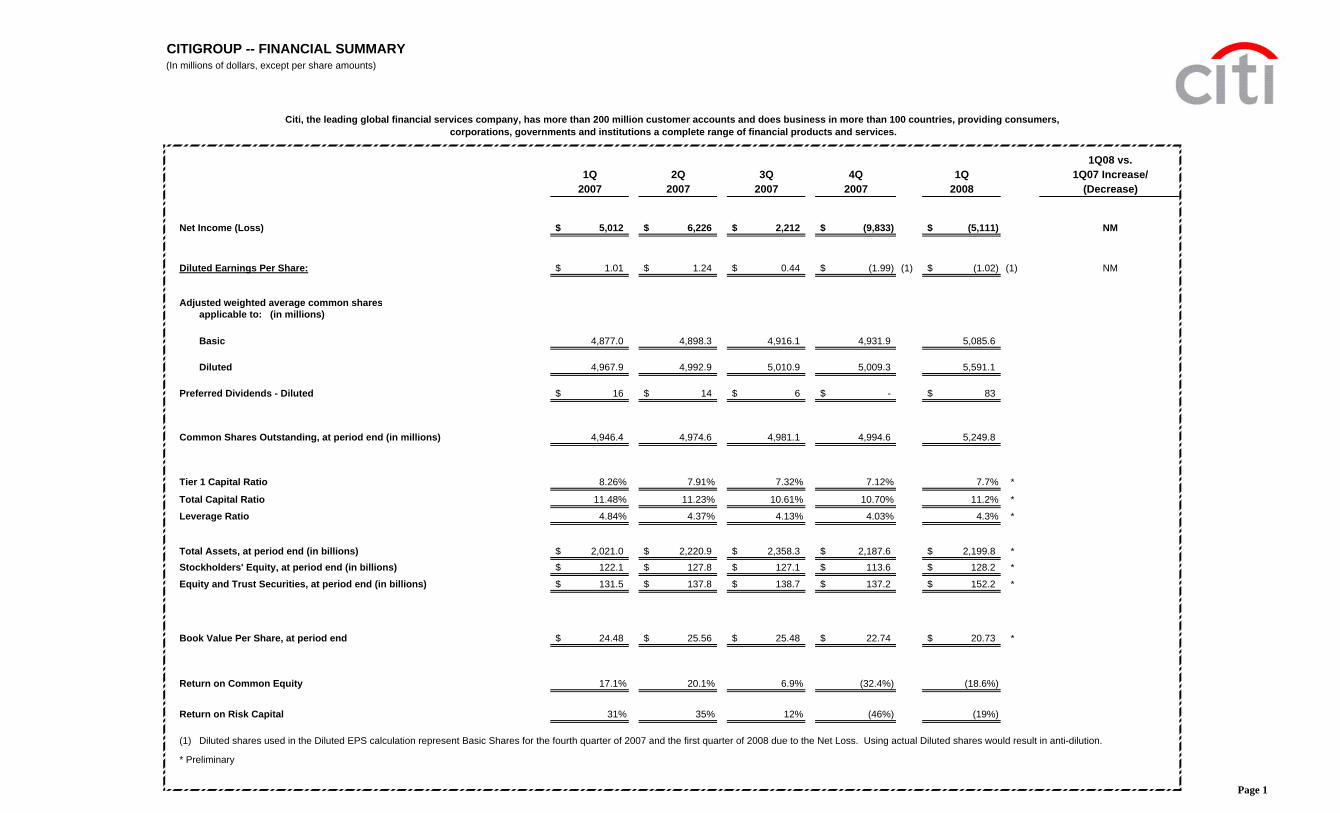
CITIGROUP - QUARTERLY FINANCIAL DATA SUPPLEMENT 1Q08
Adjusted weighted average common sharesapplicable to: (in millions)
Basic 4,877.0 4,898.3 4,916.1 4,931.9 5,085.6
Diluted 4,967.9 4,992.9 5,010.9 5,009.3 5,591.1
Preferred Dividends - Diluted 16$ 14$ 6$ -$ 83$
Common Shares Outstanding, at period end (in millions) 4,946.4 4,974.6 4,981.1 4,994.6 5,249.8
Tier 1 Capital Ratio 8.26% 7.91% 7.32% 7.12% 7.7% *
Total Capital Ratio 11.48% 11.23% 10.61% 10.70% 11.2% *
Leverage Ratio 4.84% 4.37% 4.13% 4.03% 4.3% *
Total Assets, at period end (in billions) 2,021.0$ 2,220.9$ 2,358.3$ 2,187.6$ 2,199.8$ *Stockholders' Equity, at period end (in billions) 122.1$ 127.8$ 127.1$ 113.6$ 128.2$ *
Equity and Trust Securities, at period end (in billions) 131.5$ 137.8$ 138.7$ 137.2$ 152.2$ *
Book Value Per Share, at period end 24.48$ 25.56$ 25.48$ 22.74$ 20.73$ *
Return on Common Equity 17.1% 20.1% 6.9% (32.4%) (18.6%)
Return on Risk Capital 31% 35% 12% (46%) (19%)
(1) Diluted shares used in the Diluted EPS calculation represent Basic Shares for the fourth quarter of 2007 and the first quarter of 2008 due to the Net Loss. Using actual Diluted shares would result in anti-dilution.
* Preliminary
corporations, governments and institutions a complete range of financial products and services.Citi, the leading global financial services company, has more than 200 million customer accounts and does business in more than 100 countries, providing consumers,
Page 1
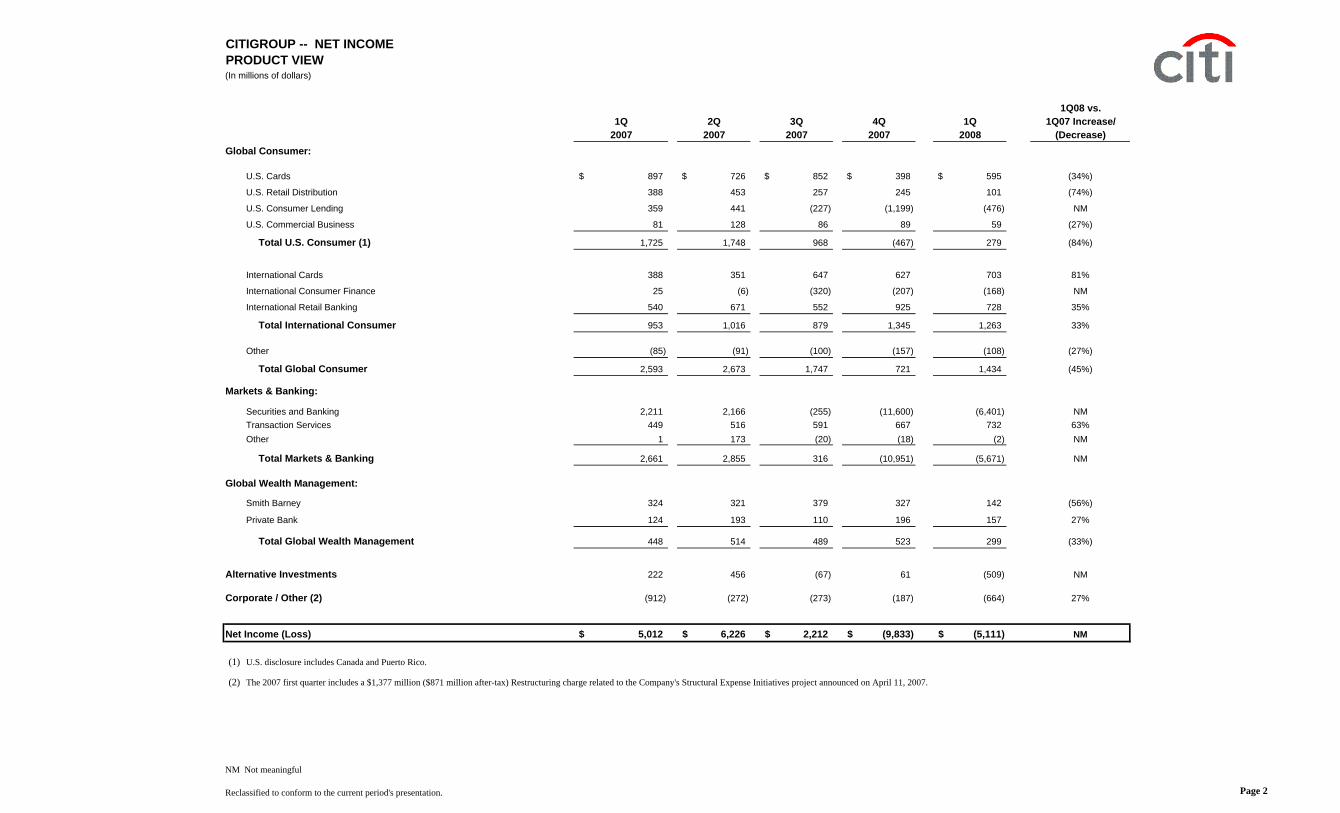
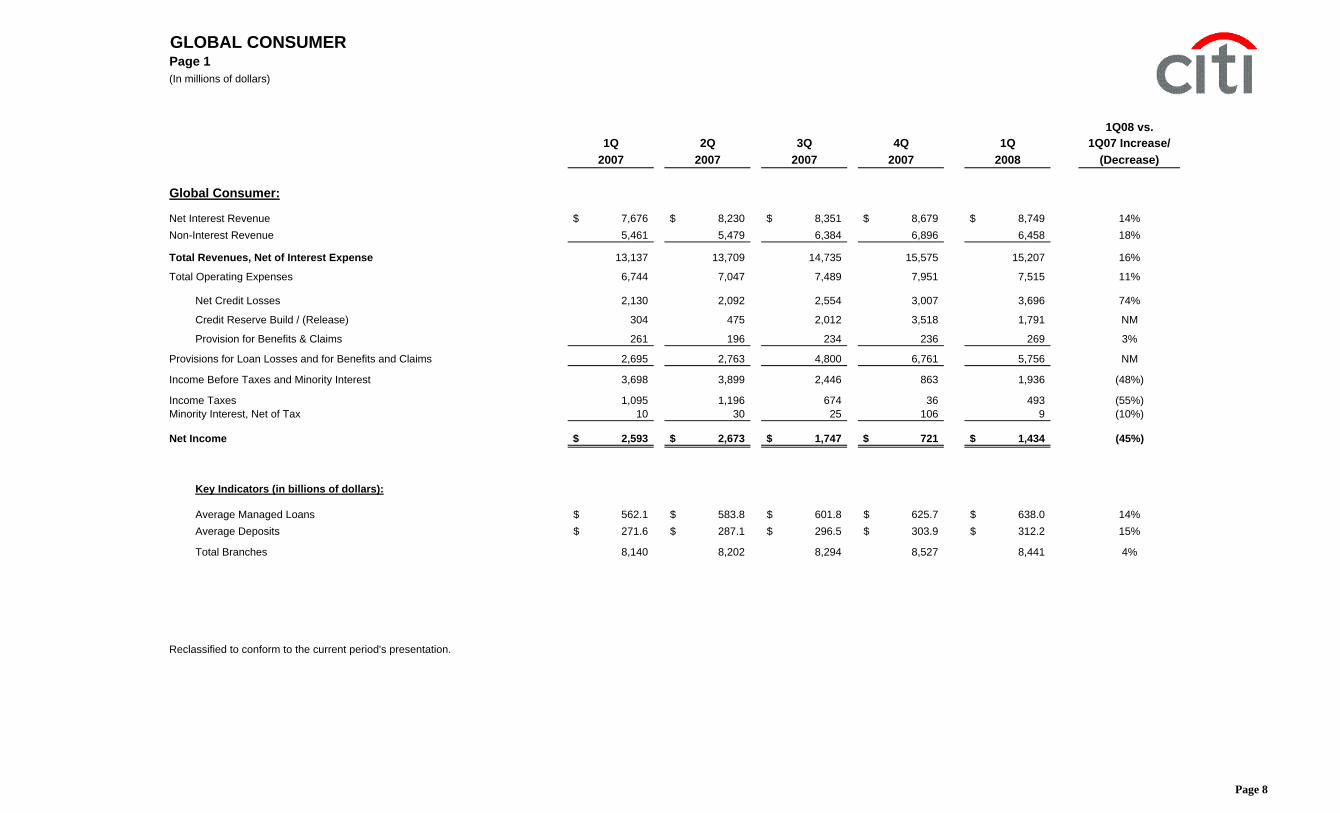
CITIGROUP -- NET INCOMEPRODUCT VIEW(In millions of dollars)
Total Markets & Banking 2,661 2,855 316 (10,951) (5,671) NM
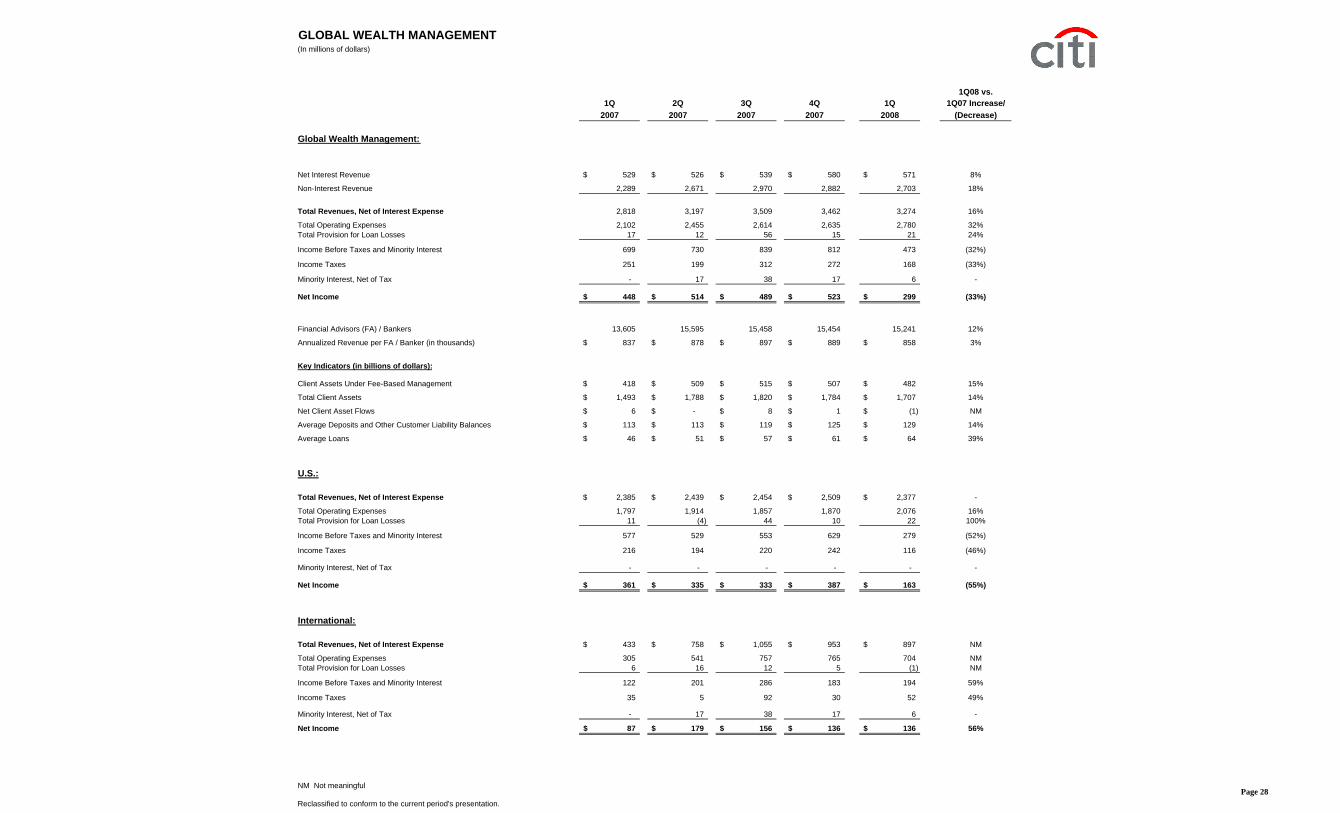
Global Wealth Management:
Smith Barney 324 321 379 327 142 (56%)
Private Bank 124 193 110 196 157 27%
Total Global Wealth Management 448 514 489 523 299 (33%)
Alternative Investments 222 456 (67) 61 (509) NM
Corporate / Other (2) (912) (272) (273) (187) (664) 27%
Net Income (Loss) 5,012$ 6,226$ 2,212$ (9,833)$ (5,111)$ NM
(1) U.S. disclosure includes Canada and Puerto Rico.
(2) The 2007 first quarter includes a $1,377 million ($871 million after-tax) Restructuring charge related to the Company's Structural Expense Initiatives project announced on April 11, 2007.
NM Not meaningful
Reclassified to conform to the current period's presentation. Page 2
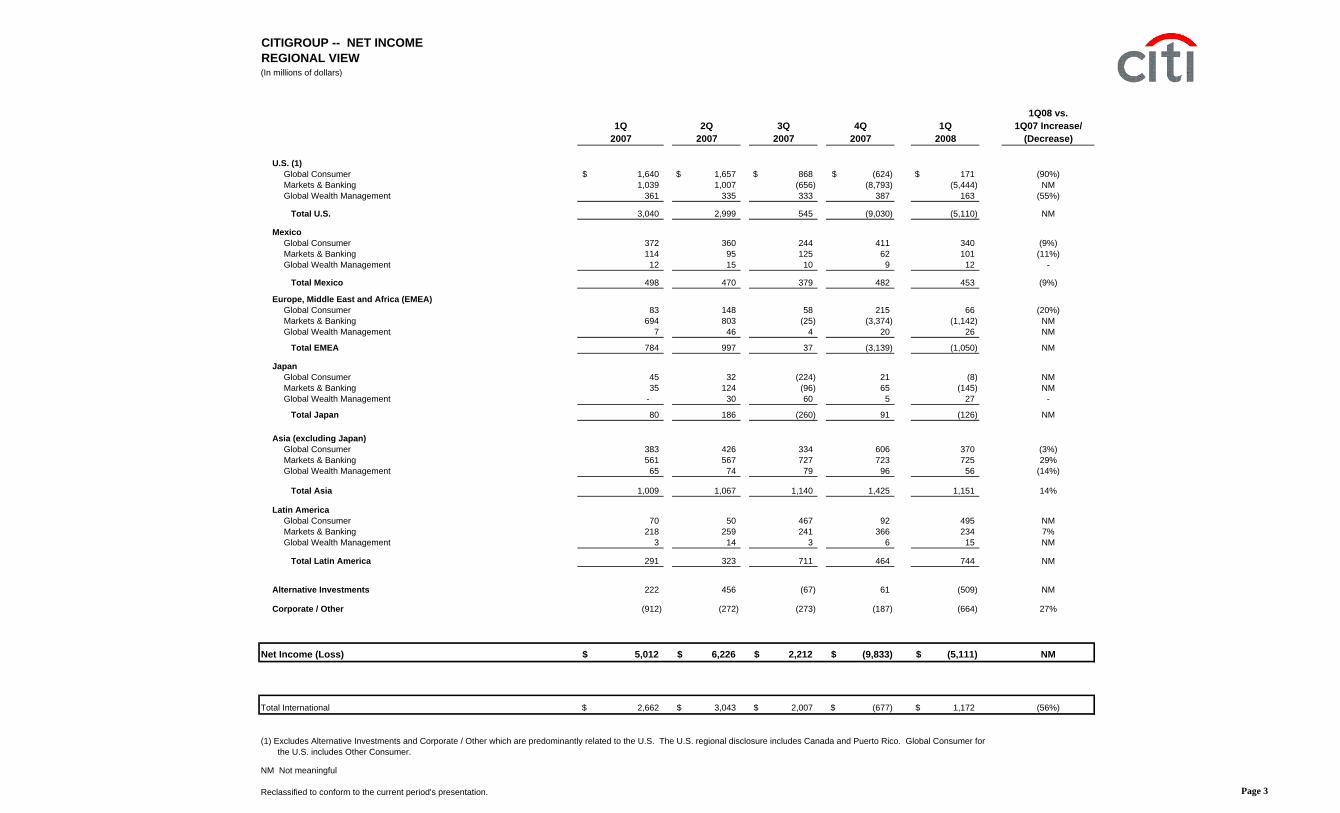
CITIGROUP -- NET INCOMEREGIONAL VIEW(In millions of dollars)
Corporate / Other (912) (272) (273) (187) (664) 27%
Net Income (Loss) 5,012$ 6,226$ 2,212$ (9,833)$ (5,111)$ NM
Total International 2,662$ 3,043$ 2,007$ (677)$ 1,172$ (56%)
(1) Excludes Alternative Investments and Corporate / Other which are predominantly related to the U.S. The U.S. regional disclosure includes Canada and Puerto Rico. Global Consumer for the U.S. includes Other Consumer.
NM Not meaningful
Reclassified to conform to the current period's presentation. Page 3
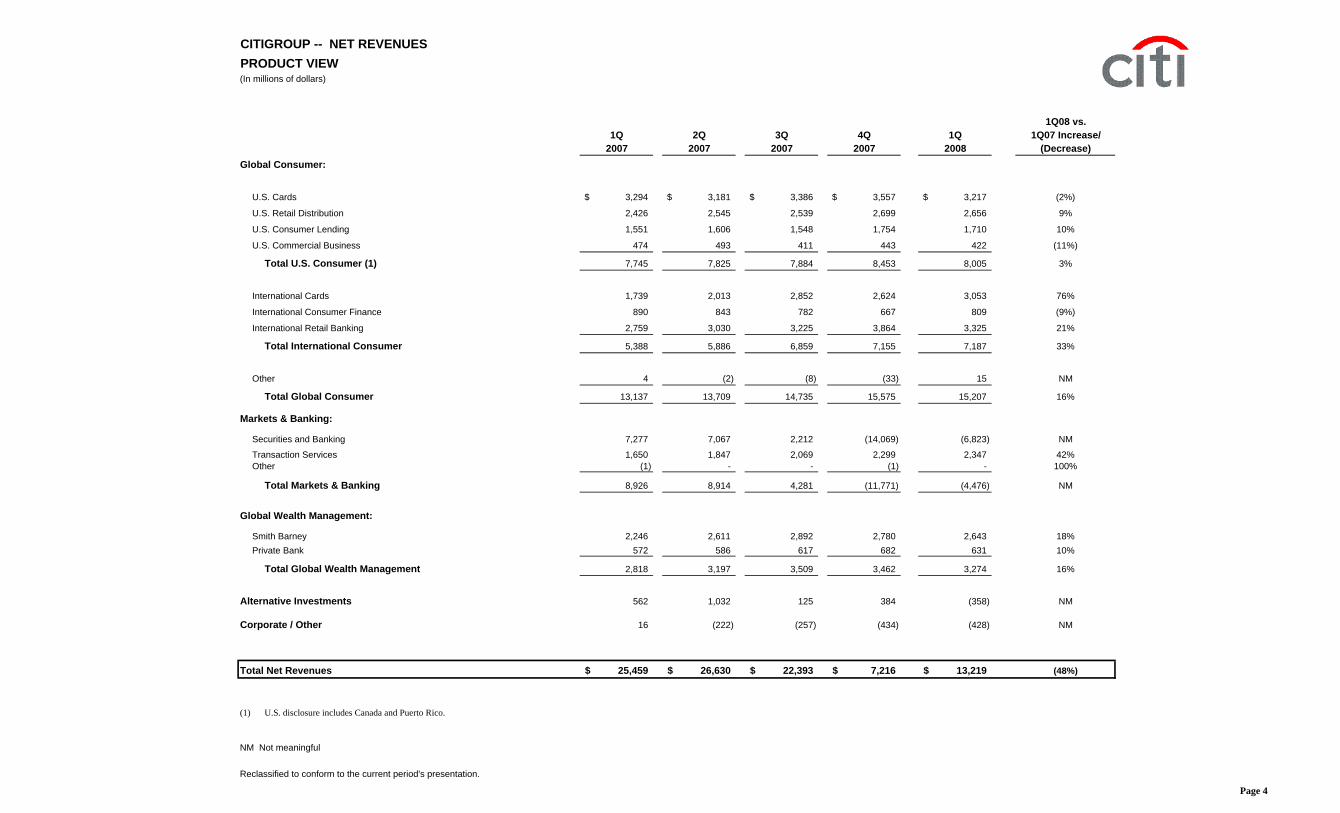
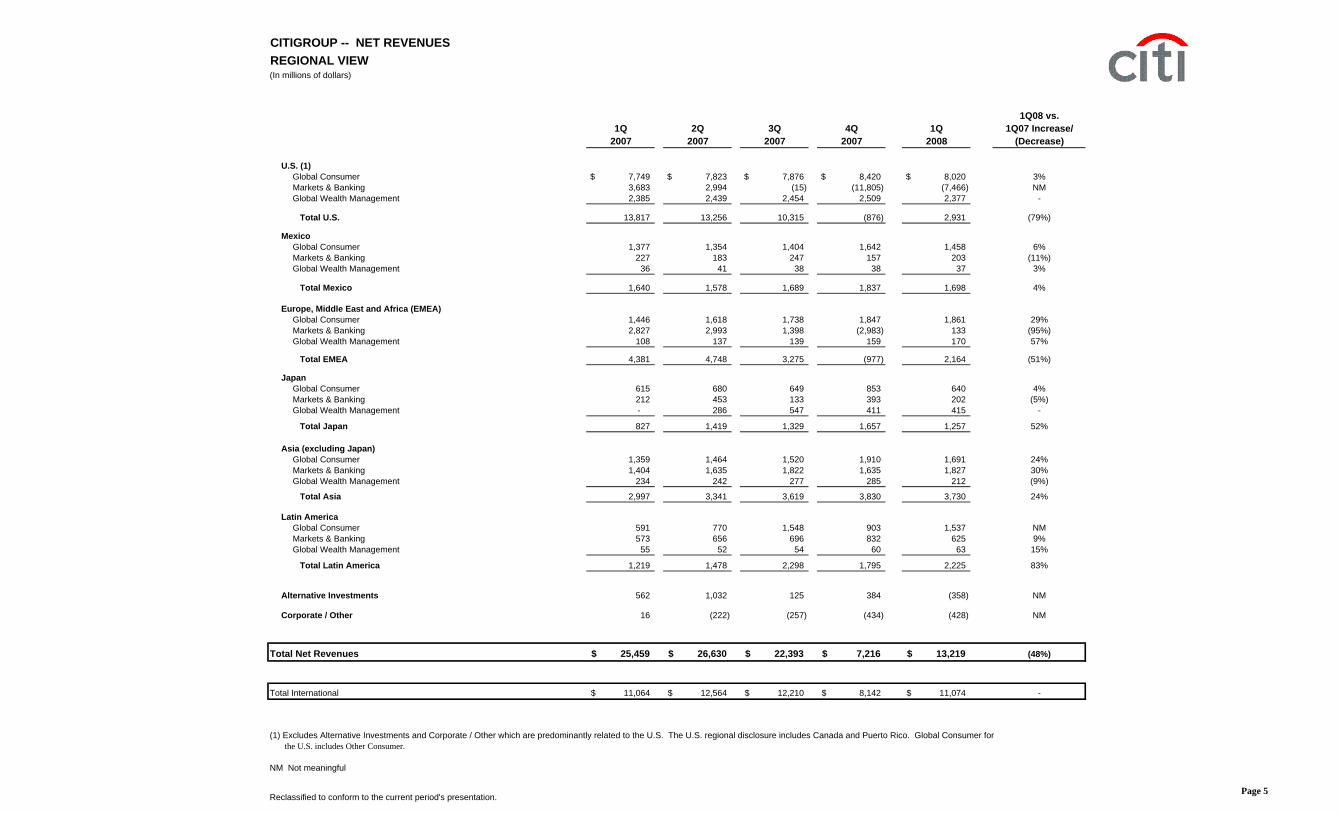
CITIGROUP -- NET REVENUESPRODUCT VIEW(In millions of dollars)
Total Latin America 1,219 1,478 2,298 1,795 2,225 83%
Alternative Investments 562 1,032 125 384 (358) NM
Corporate / Other 16 (222) (257) (434) (428) NM
Total Net Revenues 25,459$ 26,630$ 22,393$ 7,216$ 13,219$ (48%)
Total International 11,064$ 12,564$ 12,210$ 8,142$ 11,074$ -
(1) Excludes Alternative Investments and Corporate / Other which are predominantly related to the U.S. The U.S. regional disclosure includes Canada and Puerto Rico. Global Consumer for the U.S. includes Other Consumer.
NM Not meaningful
Reclassified to conform to the current period's presentation.Page 5
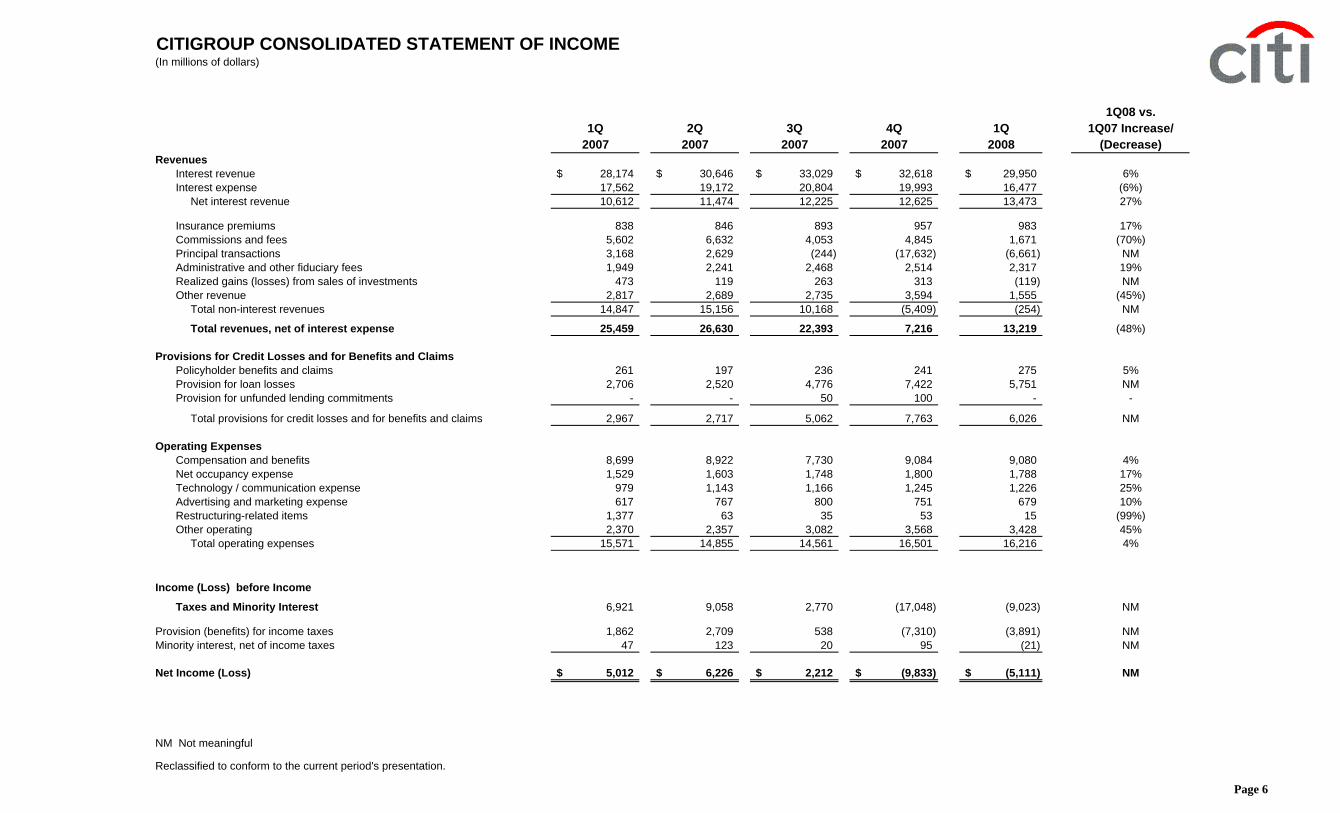
CITIGROUP CONSOLIDATED STATEMENT OF INCOME(In millions of dollars)
Total operating expenses 15,571 14,855 14,561 16,501 16,216 4%
Income (Loss) before Income
Taxes and Minority Interest 6,921 9,058 2,770 (17,048) (9,023) NM
Provision (benefits) for income taxes 1,862 2,709 538 (7,310) (3,891) NMMinority interest, net of income taxes 47 123 20 95 (21) NM
Net Income (Loss) 5,012$ 6,226$ 2,212$ (9,833)$ (5,111)$ NM
NM Not meaningful
Reclassified to conform to the current period's presentation.
Page 6
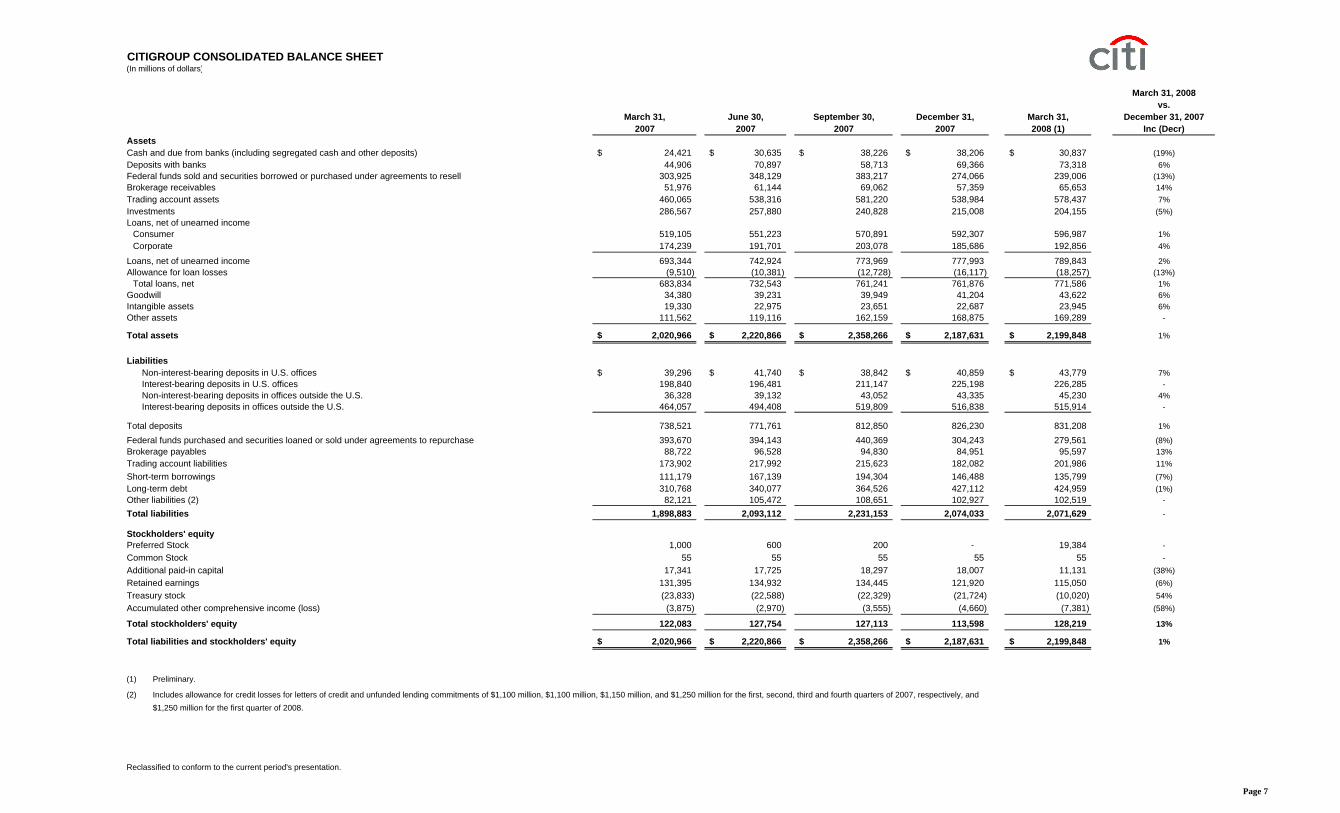
CITIGROUP CONSOLIDATED BALANCE SHEET(In millions of dollars)
March 31, 2008vs.
March 31, June 30, September 30, December 31, March 31, December 31, 20072007 2007 2007 2007 2008 (1) Inc (Decr)
AssetsCash and due from banks (including segregated cash and other deposits) 24,421$ 30,635$ 38,226$ 38,206$ 30,837$ (19%)Deposits with banks 44,906 70,897 58,713 69,366 73,318 6%Federal funds sold and securities borrowed or purchased under agreements to resell 303,925 348,129 383,217 274,066 239,006 (13%)Brokerage receivables 51,976 61,144 69,062 57,359 65,653 14%Trading account assets 460,065 538,316 581,220 538,984 578,437 7%Investments 286,567 257,880 240,828 215,008 204,155 (5%)Loans, net of unearned income
Total assets 2,020,966$ 2,220,866$ 2,358,266$ 2,187,631$ 2,199,848$ 1%
LiabilitiesNon-interest-bearing deposits in U.S. offices 39,296$ 41,740$ 38,842$ 40,859$ 43,779$ 7%Interest-bearing deposits in U.S. offices 198,840 196,481 211,147 225,198 226,285 -Non-interest-bearing deposits in offices outside the U.S. 36,328 39,132 43,052 43,335 45,230 4%Interest-bearing deposits in offices outside the U.S. 464,057 494,408 519,809 516,838 515,914 -
Total deposits 738,521 771,761 812,850 826,230 831,208 1%
Federal funds purchased and securities loaned or sold under agreements to repurchase 393,670 394,143 440,369 304,243 279,561 (8%)Brokerage payables 88,722 96,528 94,830 84,951 95,597 13%Trading account liabilities 173,902 217,992 215,623 182,082 201,986 11%Short-term borrowings 111,179 167,139 194,304 146,488 135,799 (7%)Long-term debt 310,768 340,077 364,526 427,112 424,959 (1%)Other liabilities (2) 82,121 105,472 108,651 102,927 102,519 -
Total stockholders' equity 122,083 127,754 127,113 113,598 128,219 13%
Total liabilities and stockholders' equity 2,020,966$ 2,220,866$ 2,358,266$ 2,187,631$ 2,199,848$ 1%
(1) Preliminary.
(2) Includes allowance for credit losses for letters of credit and unfunded lending commitments of $1,100 million, $1,100 million, $1,150 million, and $1,250 million for the first, second, third and fourth quarters of 2007, respectively, and $1,250 million for the first quarter of 2008.
Reclassified to conform to the current period's presentation.
Total Managed 139.2$ 138.1$ 140.1$ 144.8$ 147.0$ 6%
End of Period Managed Loans:Bankcards 107.3$ 108.9$ 109.9$ 116.4$ 113.5$ 6%Private Label 30.2 31.2 31.8 34.4 31.8 5%
Total 137.5$ 140.1$ 141.7$ 150.8$ 145.3$ 6%
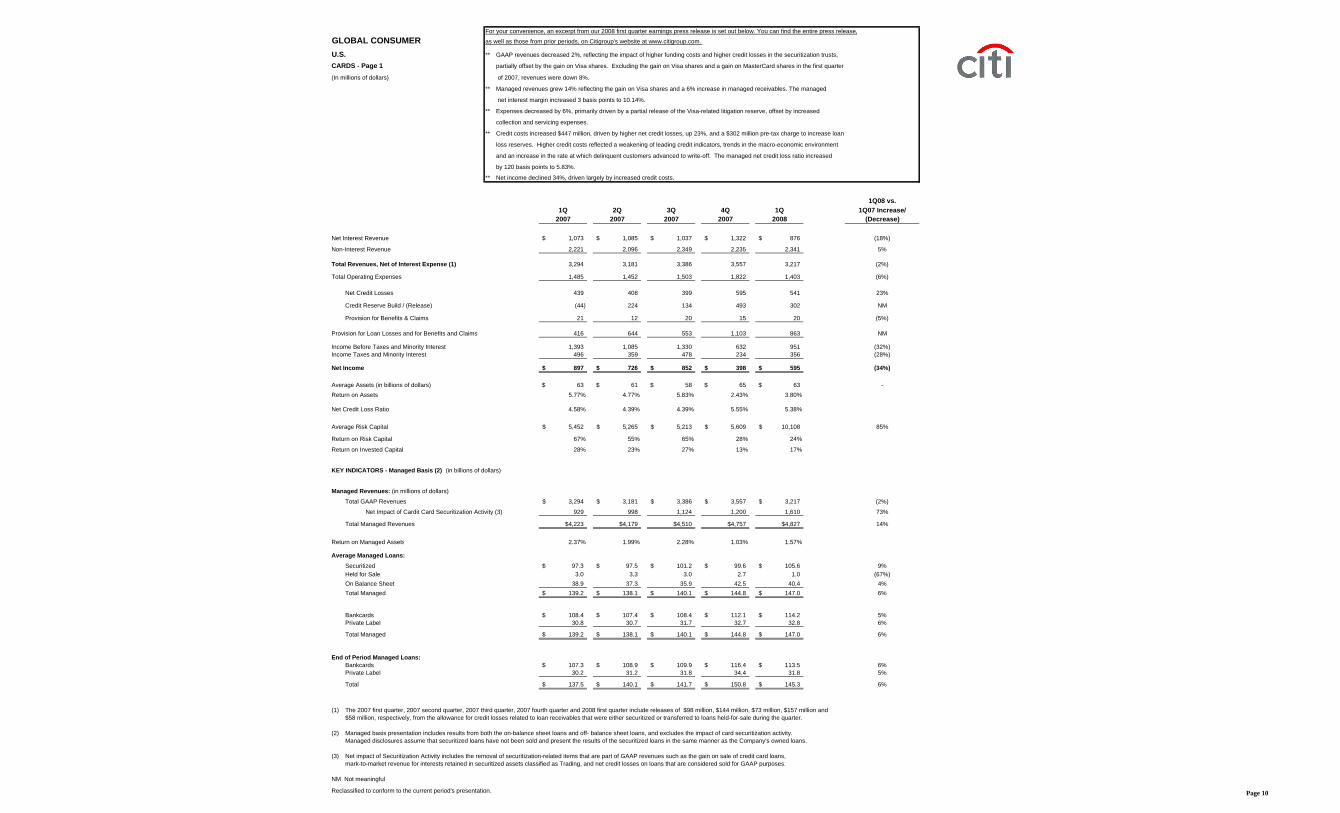
(1) The 2007 first quarter, 2007 second quarter, 2007 third quarter, 2007 fourth quarter and 2008 first quarter include releases of $98 million, $144 million, $73 million, $157 million and$58 million, respectively, from the allowance for credit losses related to loan receivables that were either securitized or transferred to loans held-for-sale during the quarter.
(2) Managed basis presentation includes results from both the on-balance sheet loans and off- balance sheet loans, and excludes the impact of card securitization activity.Managed disclosures assume that securitized loans have not been sold and present the results of the securitized loans in the same manner as the Company's owned loans.
(3) Net impact of Securitization Activity includes the removal of securitization-related items that are part of GAAP revenues such as the gain on sale of credit card loans,mark-to-market revenue for interests retained in securitized assets classified as Trading, and net credit losses on loans that are considered sold for GAAP purposes.
NM Not meaningful
Reclassified to conform to the current period's presentation. Page 10
GLOBAL CONSUMERU.S.
CARDS - Page 2
(In millions of dollars) 1Q08 vs.1Q 2Q 3Q 4Q 1Q 1Q07 Increase/
2007 2007 2007 2007 2008 (Decrease)
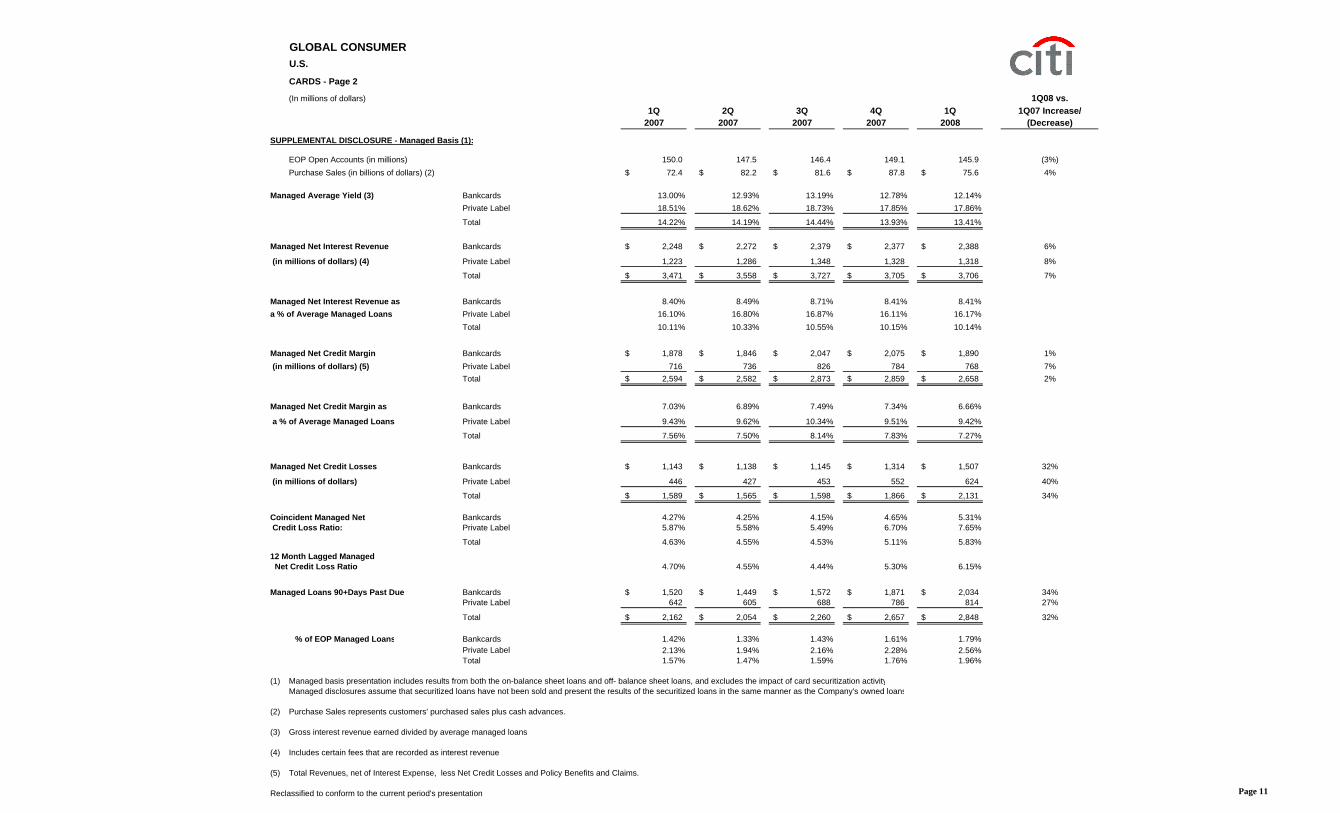
SUPPLEMENTAL DISCLOSURE - Managed Basis (1):
EOP Open Accounts (in millions) 150.0 147.5 146.4 149.1 145.9 (3%)Purchase Sales (in billions of dollars) (2) 72.4$ 82.2$ 81.6$ 87.8$ 75.6$ 4%
(1) Managed basis presentation includes results from both the on-balance sheet loans and off- balance sheet loans, and excludes the impact of card securitization activityManaged disclosures assume that securitized loans have not been sold and present the results of the securitized loans in the same manner as the Company's owned loans
(2) Purchase Sales represents customers' purchased sales plus cash advances.
(3) Gross interest revenue earned divided by average managed loans.
(4) Includes certain fees that are recorded as interest revenue.
(5) Total Revenues, net of Interest Expense, less Net Credit Losses and Policy Benefits and Claims.
Reclassified to conform to the current period's presentation. Page 11
For your convenience, an excerpt from our 2008 first quarter earnings press release is set out below. You can find the entire press release,
GLOBAL CONSUMER as well as those from prior periods, on Citigroup's website at www.citigroup.com.
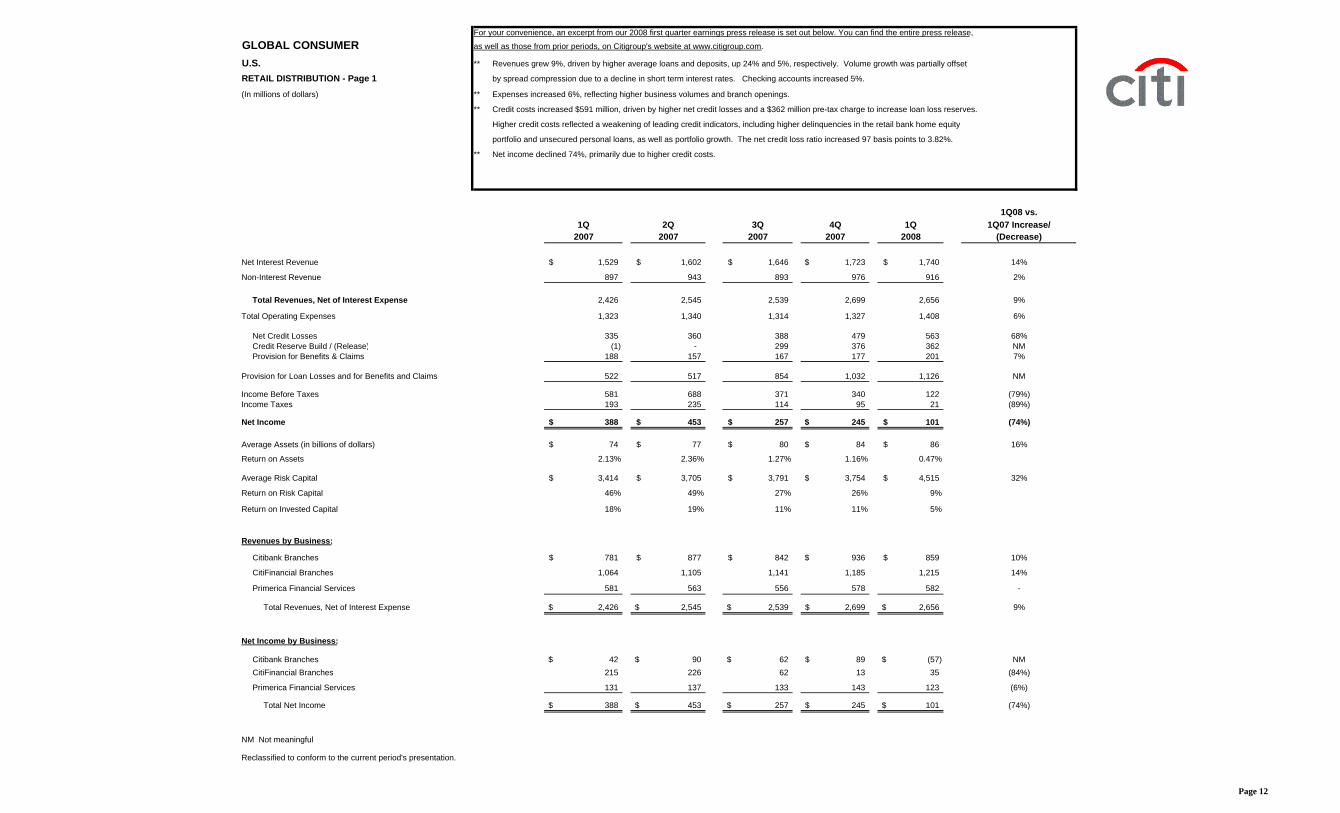
U.S. ** Revenues grew 9%, driven by higher average loans and deposits, up 24% and 5%, respectively. Volume growth was partially offset
RETAIL DISTRIBUTION - Page 1 by spread compression due to a decline in short term interest rates. Checking accounts increased 5%.
(In millions of dollars) ** Expenses increased 6%, reflecting higher business volumes and branch openings.
** Credit costs increased $591 million, driven by higher net credit losses and a $362 million pre-tax charge to increase loan loss reserves.
Higher credit costs reflected a weakening of leading credit indicators, including higher delinquencies in the retail bank home equity
portfolio and unsecured personal loans, as well as portfolio growth. The net credit loss ratio increased 97 basis points to 3.82%.
** Net income declined 74%, primarily due to higher credit costs.
1Q08 vs.1Q 2Q 3Q 4Q 1Q 1Q07 Increase/
2007 2007 2007 2007 2008 (Decrease)
Net Interest Revenue 1,529$ 1,602$ 1,646$ 1,723$ 1,740$ 14%
Non-Interest Revenue 897 943 893 976 916 2%
Total Revenues, Net of Interest Expense 2,426 2,545 2,539 2,699 2,656 9%
Total Operating Expenses 1,323 1,340 1,314 1,327 1,408 6%
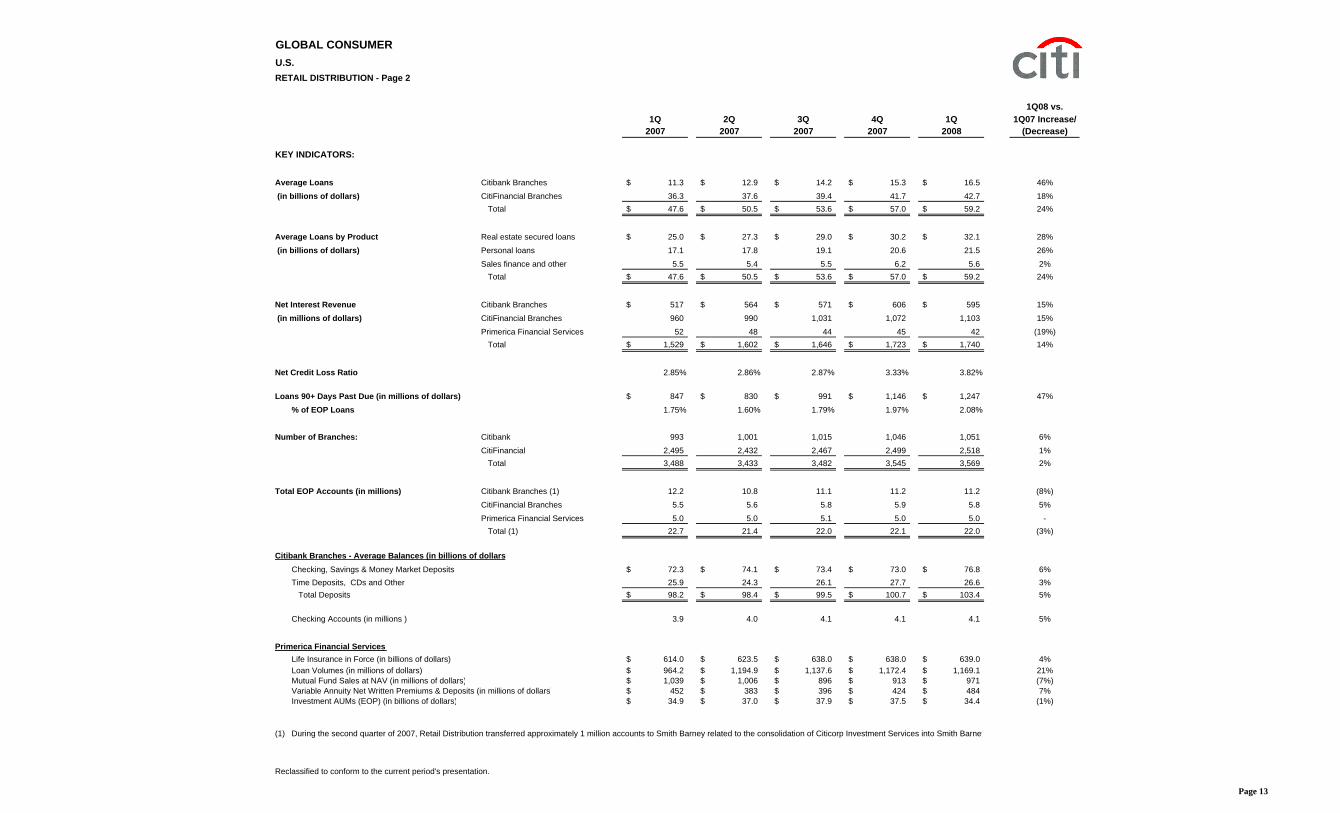
Citibank Branches - Average Balances (in billions of dollarsChecking, Savings & Money Market Deposits 72.3$ 74.1$ 73.4$ 73.0$ 76.8$ 6%Time Deposits, CDs and Other 25.9 24.3 26.1 27.7 26.6 3% Total Deposits 98.2$ 98.4$ 99.5$ 100.7$ 103.4$ 5%
Checking Accounts (in millions ) 3.9 4.0 4.1 4.1 4.1 5%
Primerica Financial Services:Life Insurance in Force (in billions of dollars) 614.0$ 623.5$ 638.0$ 638.0$ 639.0$ 4%Loan Volumes (in millions of dollars) 964.2$ 1,194.9$ 1,137.6$ 1,172.4$ 1,169.1$ 21%Mutual Fund Sales at NAV (in millions of dollars) 1,039$ 1,006$ 896$ 913$ 971$ (7%)Variable Annuity Net Written Premiums & Deposits (in millions of dollars) 452$ 383$ 396$ 424$ 484$ 7%Investment AUMs (EOP) (in billions of dollars) 34.9$ 37.0$ 37.9$ 37.5$ 34.4$ (1%)
(1) During the second quarter of 2007, Retail Distribution transferred approximately 1 million accounts to Smith Barney related to the consolidation of Citicorp Investment Services into Smith Barney
Reclassified to conform to the current period's presentation.
Page 13
For your convenience, an excerpt from our 2008 first quarter earnings press release is set out below. You can find the entire press release,
GLOBAL CONSUMER as well as those from prior periods, on Citigroup's website at www.citigroup.com.
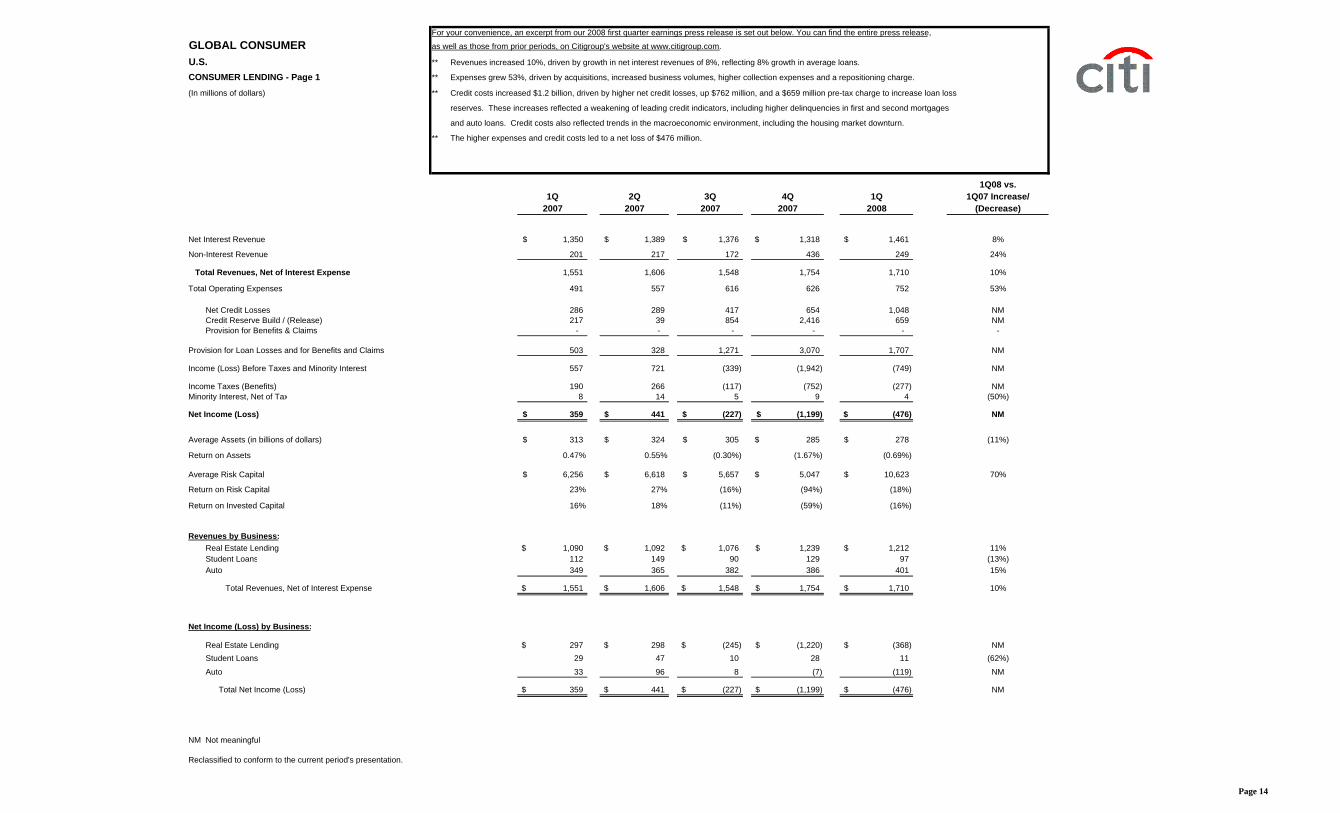
U.S. ** Revenues increased 10%, driven by growth in net interest revenues of 8%, reflecting 8% growth in average loans.
CONSUMER LENDING - Page 1 ** Expenses grew 53%, driven by acquisitions, increased business volumes, higher collection expenses and a repositioning charge.
(In millions of dollars) ** Credit costs increased $1.2 billion, driven by higher net credit losses, up $762 million, and a $659 million pre-tax charge to increase loan loss
reserves. These increases reflected a weakening of leading credit indicators, including higher delinquencies in first and second mortgages
and auto loans. Credit costs also reflected trends in the macroeconomic environment, including the housing market downturn.
** The higher expenses and credit costs led to a net loss of $476 million.
1Q08 vs.1Q 2Q 3Q 4Q 1Q 1Q07 Increase/
2007 2007 2007 2007 2008 (Decrease)
Net Interest Revenue 1,350$ 1,389$ 1,376$ 1,318$ 1,461$ 8%
Non-Interest Revenue 201 217 172 436 249 24%
Total Revenues, Net of Interest Expense 1,551 1,606 1,548 1,754 1,710 10%
Total Net Income (Loss) 359$ 441$ (227)$ (1,199)$ (476)$ NM
NM Not meaningful
Reclassified to conform to the current period's presentation.
Page 14
GLOBAL CONSUMERU.S.CONSUMER LENDING - Page 2
1Q08 vs.1Q 2Q 3Q 4Q 1Q 1Q07 Increase/
2007 2007 2007 2007 2008 (Decrease)
KEY INDICATORS:
Real Estate Lending - Balances (in billions of dollars):
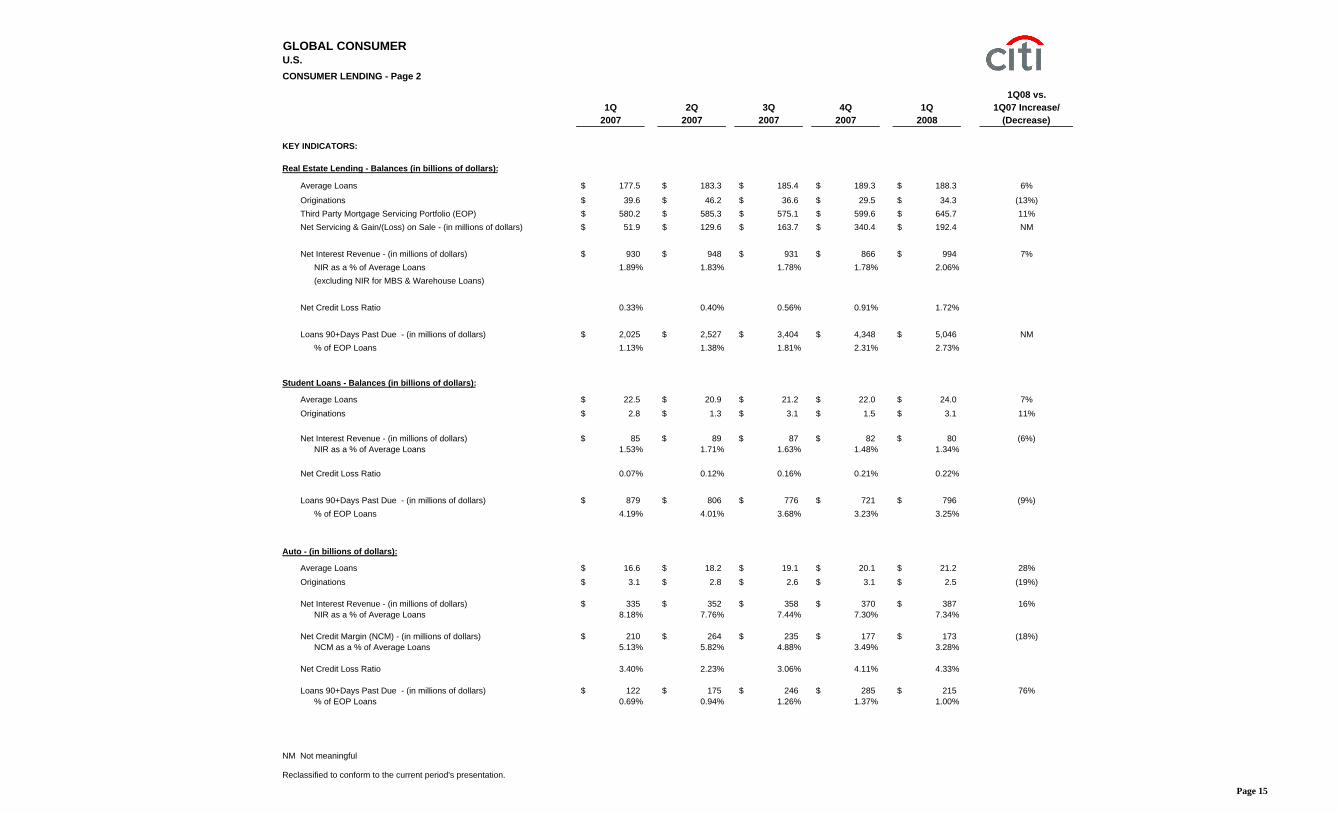
Average Loans 177.5$ 183.3$ 185.4$ 189.3$ 188.3$ 6%
Originations 39.6$ 46.2$ 36.6$ 29.5$ 34.3$ (13%)Third Party Mortgage Servicing Portfolio (EOP) 580.2$ 585.3$ 575.1$ 599.6$ 645.7$ 11%Net Servicing & Gain/(Loss) on Sale - (in millions of dollars) 51.9$ 129.6$ 163.7$ 340.4$ 192.4$ NM
Net Interest Revenue - (in millions of dollars) 930$ 948$ 931$ 866$ 994$ 7%NIR as a % of Average Loans 1.89% 1.83% 1.78% 1.78% 2.06%(excluding NIR for MBS & Warehouse Loans)
Net Credit Loss Ratio 0.33% 0.40% 0.56% 0.91% 1.72%
Loans 90+Days Past Due - (in millions of dollars) 2,025$ 2,527$ 3,404$ 4,348$ 5,046$ NM% of EOP Loans 1.13% 1.38% 1.81% 2.31% 2.73%
Student Loans - Balances (in billions of dollars):
Coincident Net Credit Loss Ratio 4.99% 4.22% 5.62% 4.05% 5.38%12 Month Lagged Net Credit Loss Ratio 6.41% 6.10% 8.57% 6.19% 8.21%
Loans 90+Days Past Due (in millions of dollars) 736$ 950$ 964$ 1,041$ 1,071$ 46%% of EOP Loans 2.29% 2.32% 2.22% 2.24% 2.20%
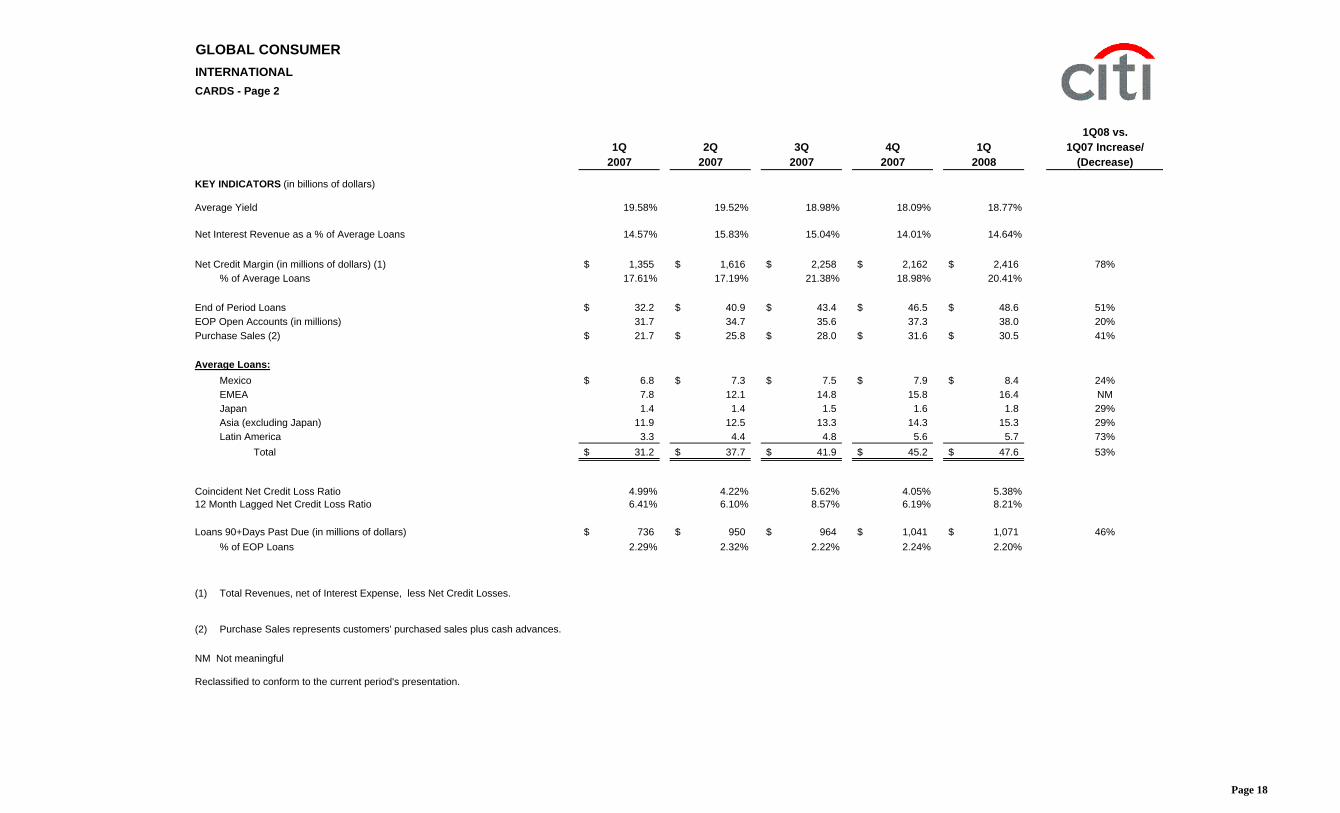
(1) Total Revenues, net of Interest Expense, less Net Credit Losses.
(2) Purchase Sales represents customers' purchased sales plus cash advances.
NM Not meaningful
Reclassified to conform to the current period's presentation.
Page 18
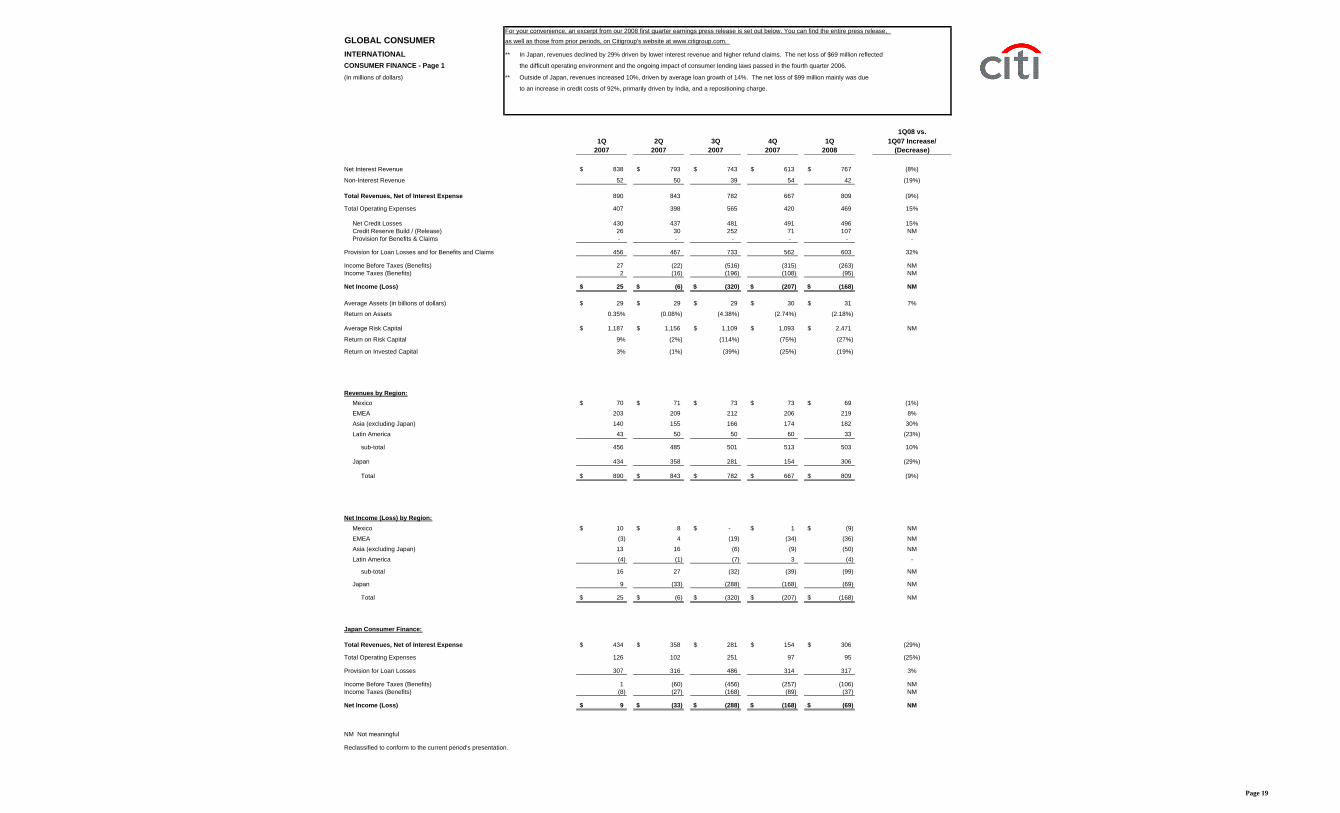
For your convenience, an excerpt from our 2008 first quarter earnings press release is set out below. You can find the entire press release,GLOBAL CONSUMER as well as those from prior periods, on Citigroup's website at www.citigroup.com.
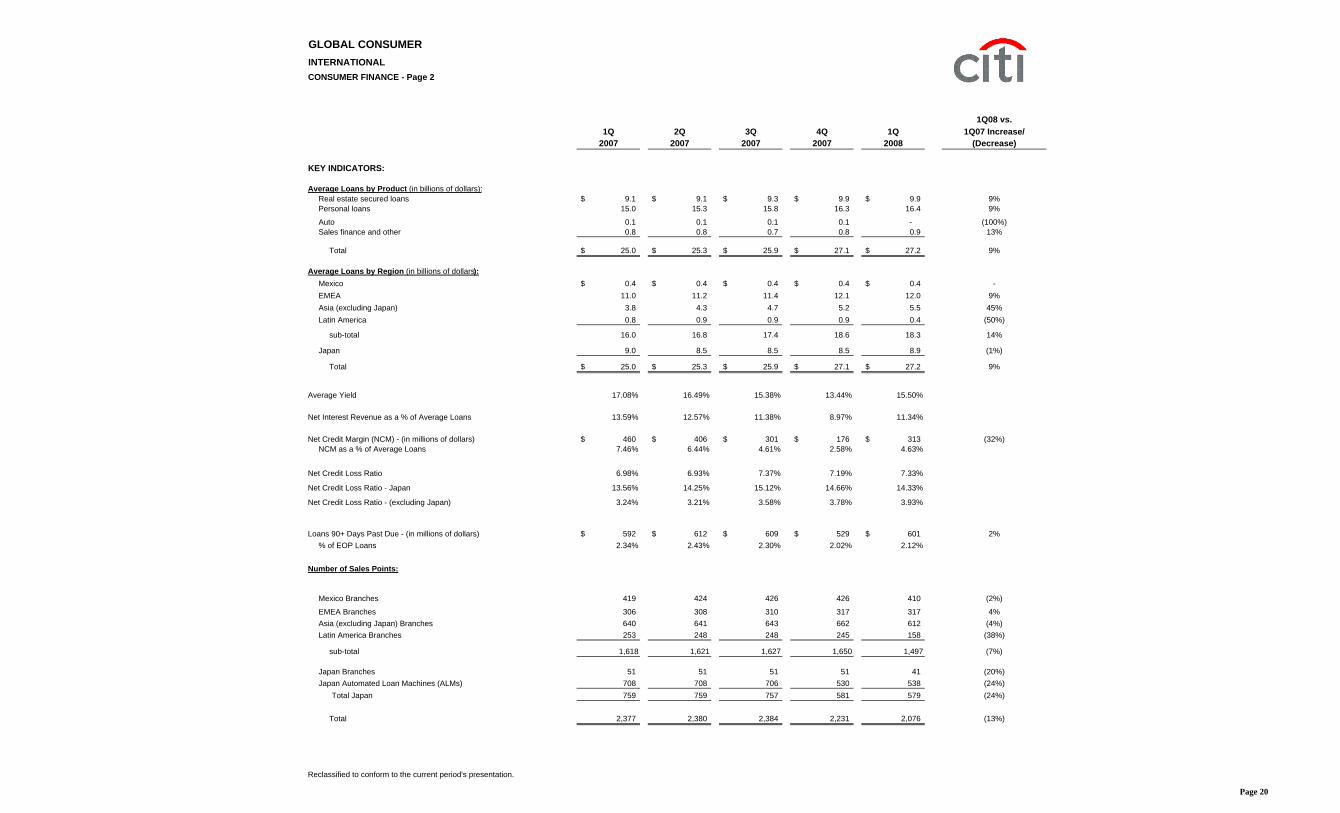
INTERNATIONAL ** In Japan, revenues declined by 29% driven by lower interest revenue and higher refund claims. The net loss of $69 million reflected
CONSUMER FINANCE - Page 1 the difficult operating environment and the ongoing impact of consumer lending laws passed in the fourth quarter 2006.
(In millions of dollars) ** Outside of Japan, revenues increased 10%, driven by average loan growth of 14%. The net loss of $99 million mainly was due
to an increase in credit costs of 92%, primarily driven by India, and a repositioning charge.
1Q08 vs.1Q 2Q 3Q 4Q 1Q 1Q07 Increase/
2007 2007 2007 2007 2008 (Decrease)
Net Interest Revenue 838$ 793$ 743$ 613$ 767$ (8%)
Non-Interest Revenue 52 50 39 54 42 (19%)
Total Revenues, Net of Interest Expense 890 843 782 667 809 (9%)
Reclassified to conform to the current period's presentation.
Page 20
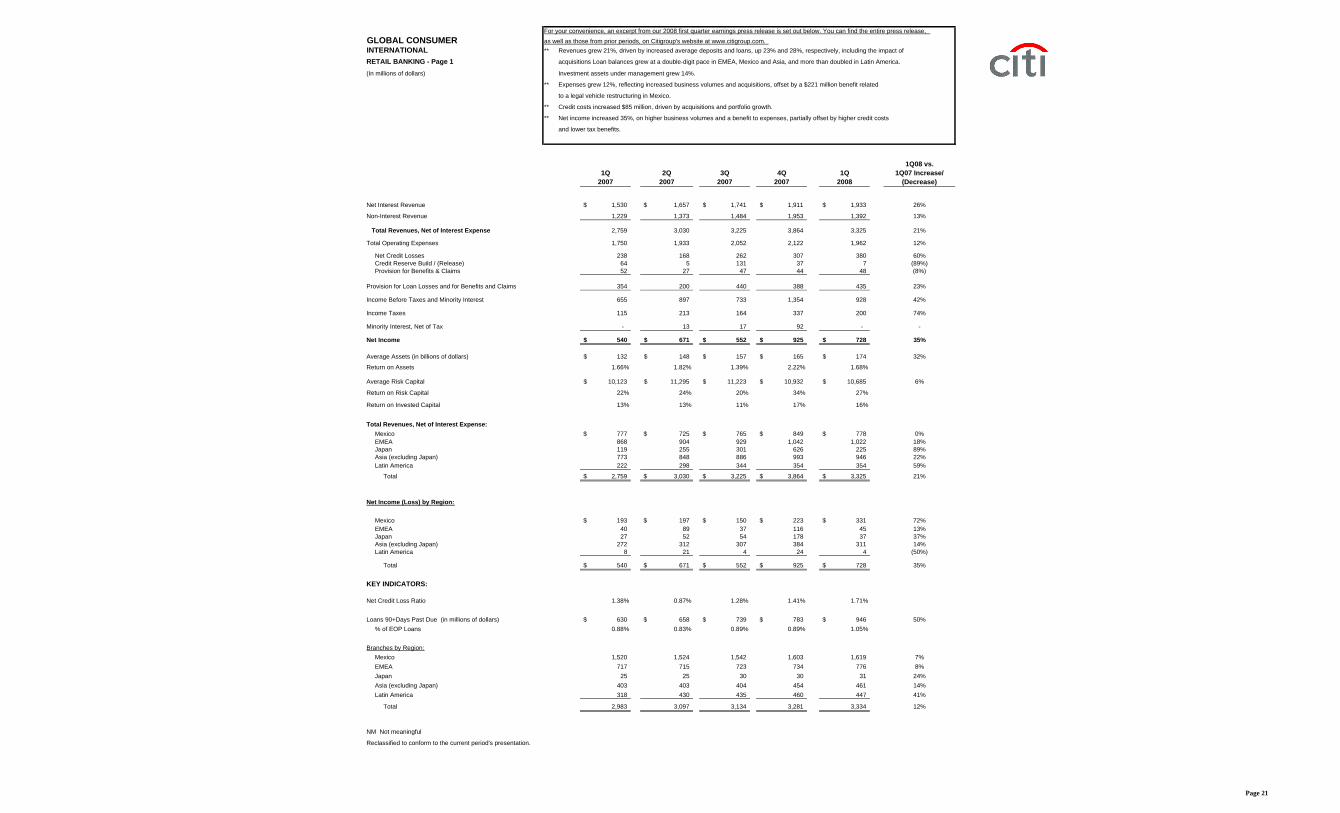
For your convenience, an excerpt from our 2008 first quarter earnings press release is set out below. You can find the entire press release,GLOBAL CONSUMER as well as those from prior periods, on Citigroup's website at www.citigroup.com.INTERNATIONAL ** Revenues grew 21%, driven by increased average deposits and loans, up 23% and 28%, respectively, including the impact of
RETAIL BANKING - Page 1 acquisitions Loan balances grew at a double-digit pace in EMEA, Mexico and Asia, and more than doubled in Latin America.
(In millions of dollars) Investment assets under management grew 14%.
** Expenses grew 12%, reflecting increased business volumes and acquisitions, offset by a $221 million benefit related
to a legal vehicle restructuring in Mexico.
** Credit costs increased $85 million, driven by acquisitions and portfolio growth.
** Net income increased 35%, on higher business volumes and a benefit to expenses, partially offset by higher credit costs
and lower tax benefits.
1Q08 vs.1Q 2Q 3Q 4Q 1Q 1Q07 Increase/
2007 2007 2007 2007 2008 (Decrease)
Net Interest Revenue 1,530$ 1,657$ 1,741$ 1,911$ 1,933$ 26%
Total Revenues, Net of Interest Expense 5,243 5,920 4,296 34 2,990 (43%)
Total Operating Expenses 2,892 3,293 2,927 3,434 3,372 17%Total Provision for Credit Losses 198 (68) 159 179 103 (48%)
Income (Loss) Before Taxes and Minority Interest 2,153 2,695 1,210 (3,579) (485) NM
Income Taxes (Benefits) 517 828 252 (1,435) (270) NM
Minority Interest, Net of Tax 14 19 (14) 14 12 (14%)
Net Income (Loss) 1,622$ 1,848$ 972$ (2,158)$ (227)$ NM
NM Not meaningful
Reclassified to conform to the current period's presentation. Page 23
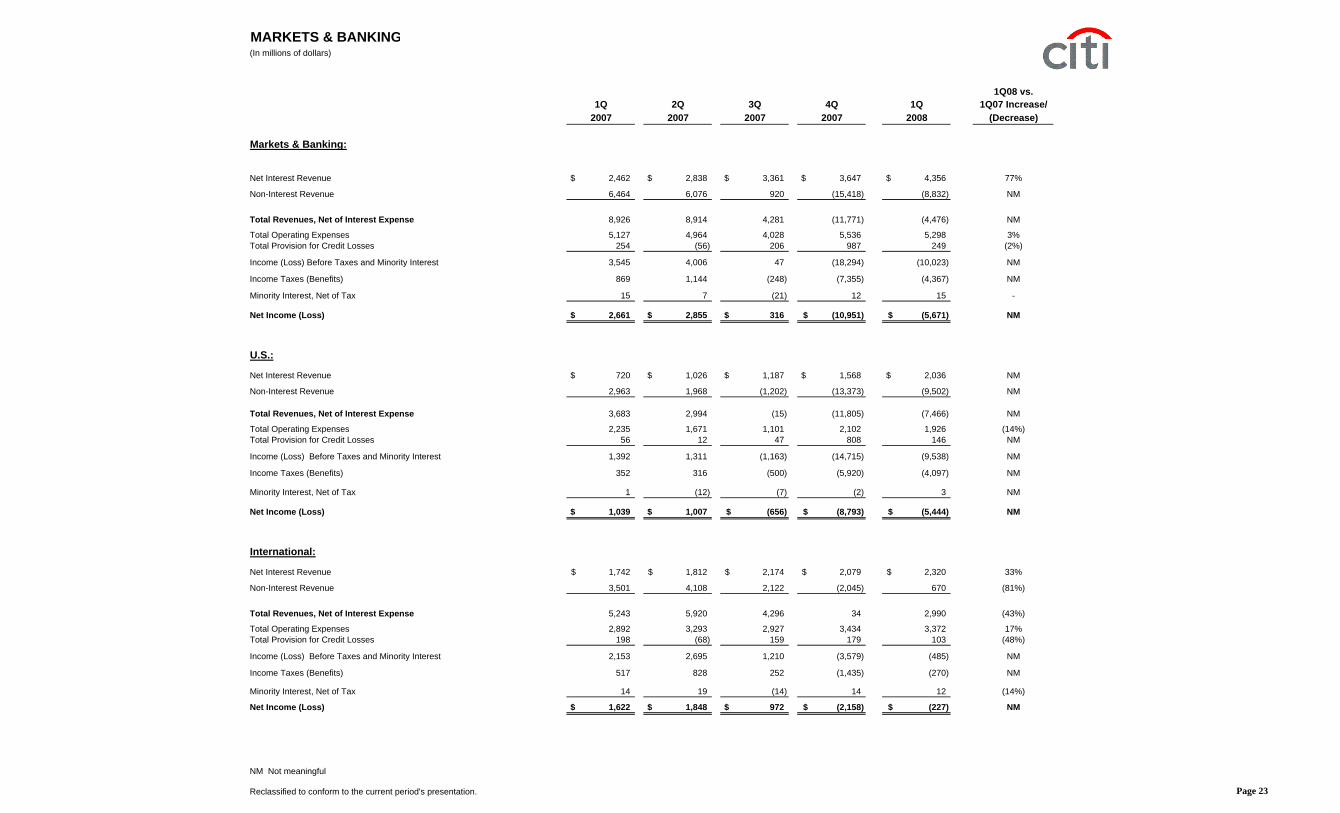
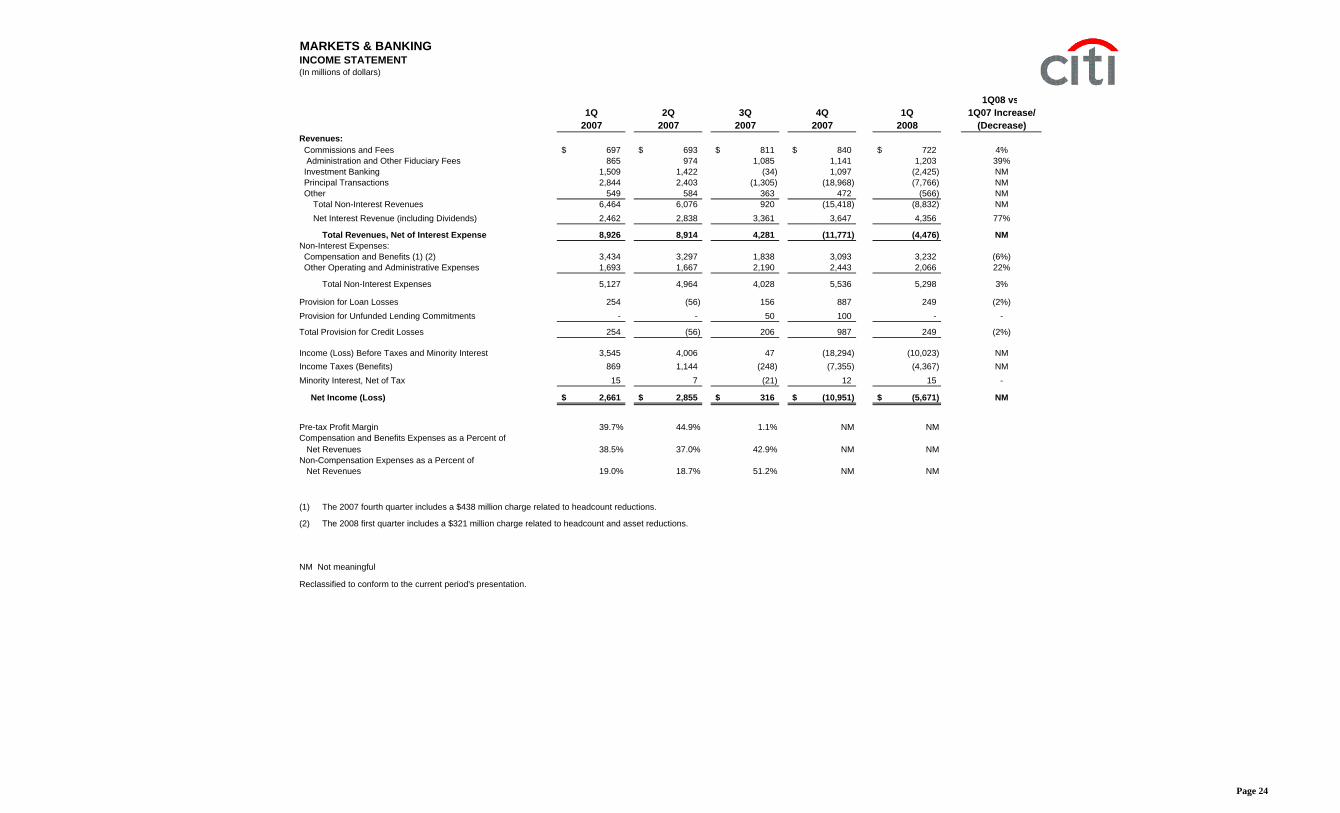
MARKETS & BANKINGINCOME STATEMENT(In millions of dollars)
1Q08 vs.1Q 2Q 3Q 4Q 1Q 1Q07 Increase/
2007 2007 2007 2007 2008 (Decrease)Revenues: Commissions and Fees 697$ 693$ 811$ 840$ 722$ 4% Administration and Other Fiduciary Fees 865 974 1,085 1,141 1,203 39% Investment Banking 1,509 1,422 (34) 1,097 (2,425) NM Principal Transactions 2,844 2,403 (1,305) (18,968) (7,766) NM Other 549 584 363 472 (566) NM
Total Non-Interest Revenues 6,464 6,076 920 (15,418) (8,832) NM Net Interest Revenue (including Dividends) 2,462 2,838 3,361 3,647 4,356 77%
Total Revenues, Net of Interest Expense 8,926 8,914 4,281 (11,771) (4,476) NMNon-Interest Expenses: Compensation and Benefits (1) (2) 3,434 3,297 1,838 3,093 3,232 (6%) Other Operating and Administrative Expenses 1,693 1,667 2,190 2,443 2,066 22%
Total Non-Interest Expenses 5,127 4,964 4,028 5,536 5,298 3%
Provision for Loan Losses 254 (56) 156 887 249 (2%)Provision for Unfunded Lending Commitments - - 50 100 - -
Total Provision for Credit Losses 254 (56) 206 987 249 (2%)
Income (Loss) Before Taxes and Minority Interest 3,545 4,006 47 (18,294) (10,023) NMIncome Taxes (Benefits) 869 1,144 (248) (7,355) (4,367) NMMinority Interest, Net of Tax 15 7 (21) 12 15 -
Net Income (Loss) 2,661$ 2,855$ 316$ (10,951)$ (5,671)$ NM
Pre-tax Profit Margin 39.7% 44.9% 1.1% NM NMCompensation and Benefits Expenses as a Percent of Net Revenues 38.5% 37.0% 42.9% NM NMNon-Compensation Expenses as a Percent of Net Revenues 19.0% 18.7% 51.2% NM NM
(1) The 2007 fourth quarter includes a $438 million charge related to headcount reductions.
(2) The 2008 first quarter includes a $321 million charge related to headcount and asset reductions.
NM Not meaningful
Reclassified to conform to the current period's presentation.
Page 24
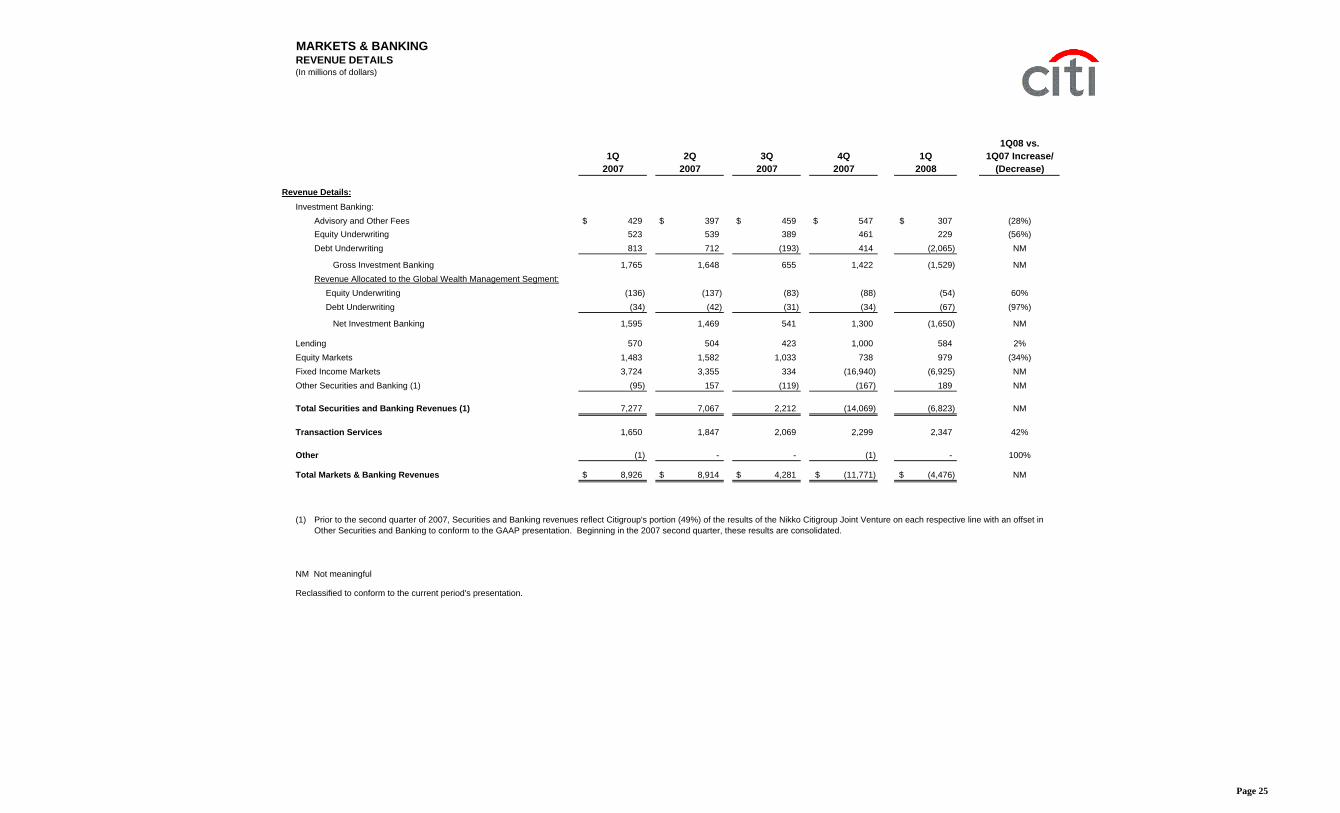
MARKETS & BANKINGREVENUE DETAILS(In millions of dollars)
(1) Prior to the second quarter of 2007, Securities and Banking revenues reflect Citigroup's portion (49%) of the results of the Nikko Citigroup Joint Venture on each respective line with an offset inOther Securities and Banking to conform to the GAAP presentation. Beginning in the 2007 second quarter, these results are consolidated.
NM Not meaningful
Reclassified to conform to the current period's presentation.
Page 25
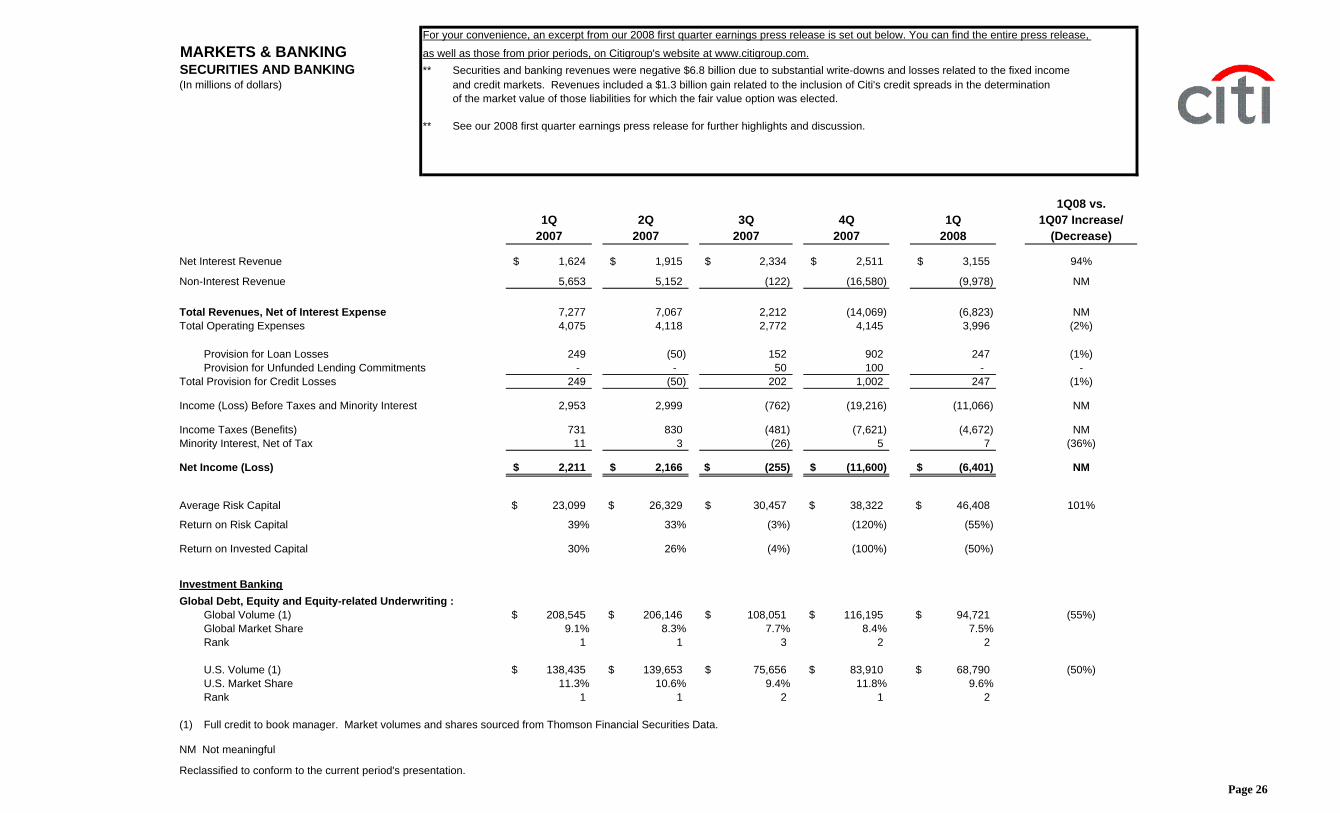
For your convenience, an excerpt from our 2008 first quarter earnings press release is set out below. You can find the entire press release,
MARKETS & BANKING as well as those from prior periods, on Citigroup's website at www.citigroup.com.SECURITIES AND BANKING ** Securities and banking revenues were negative $6.8 billion due to substantial write-downs and losses related to the fixed income(In millions of dollars) and credit markets. Revenues included a $1.3 billion gain related to the inclusion of Citi's credit spreads in the determination
of the market value of those liabilities for which the fair value option was elected.
** See our 2008 first quarter earnings press release for further highlights and discussion.
1Q08 vs.1Q 2Q 3Q 4Q 1Q 1Q07 Increase/
2007 2007 2007 2007 2008 (Decrease)
Net Interest Revenue 1,624$ 1,915$ 2,334$ 2,511$ 3,155$ 94%
(1) Full credit to book manager. Market volumes and shares sourced from Thomson Financial Securities Data.
NM Not meaningful
Reclassified to conform to the current period's presentation.
Page 26
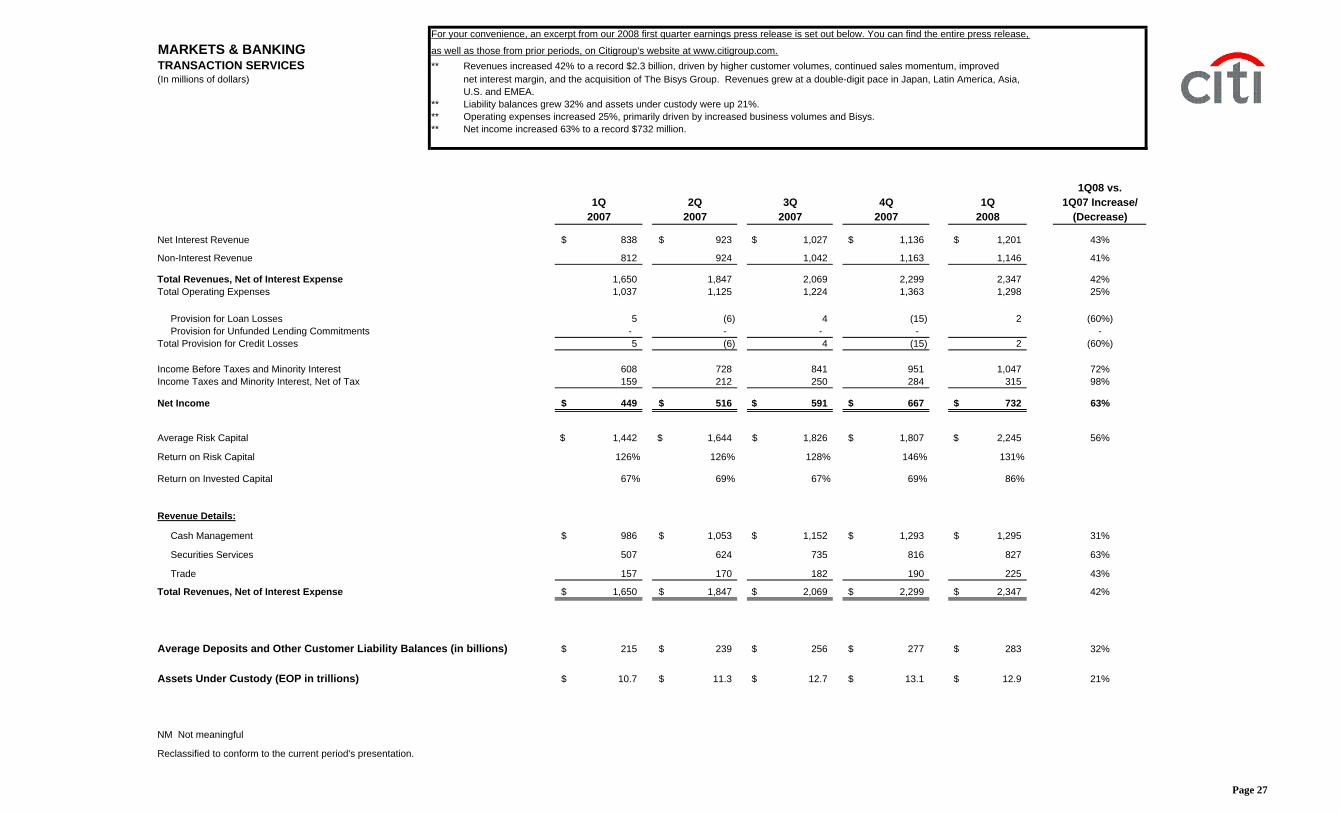
For your convenience, an excerpt from our 2008 first quarter earnings press release is set out below. You can find the entire press release,
MARKETS & BANKING as well as those from prior periods, on Citigroup's website at www.citigroup.com.TRANSACTION SERVICES ** Revenues increased 42% to a record $2.3 billion, driven by higher customer volumes, continued sales momentum, improved(In millions of dollars) net interest margin, and the acquisition of The Bisys Group. Revenues grew at a double-digit pace in Japan, Latin America, Asia,
U.S. and EMEA. ** Liability balances grew 32% and assets under custody were up 21%. ** Operating expenses increased 25%, primarily driven by increased business volumes and Bisys.** Net income increased 63% to a record $732 million.
1Q08 vs.1Q 2Q 3Q 4Q 1Q 1Q07 Increase/
2007 2007 2007 2007 2008 (Decrease)
Net Interest Revenue 838$ 923$ 1,027$ 1,136$ 1,201$ 43%
Total Client Assets 1,493$ 1,788$ 1,820$ 1,784$ 1,707$ 14%
Net Client Asset Flows 6$ -$ 8$ 1$ (1)$ NM
Average Deposits and Other Customer Liability Balances 113$ 113$ 119$ 125$ 129$ 14%
Average Loans 46$ 51$ 57$ 61$ 64$ 39%
U.S.:
Total Revenues, Net of Interest Expense 2,385$ 2,439$ 2,454$ 2,509$ 2,377$ -
Total Operating Expenses 1,797 1,914 1,857 1,870 2,076 16%Total Provision for Loan Losses 11 (4) 44 10 22 100%
Income Before Taxes and Minority Interest 577 529 553 629 279 (52%)
Income Taxes 216 194 220 242 116 (46%)
Minority Interest, Net of Tax - - - - - -
Net Income 361$ 335$ 333$ 387$ 163$ (55%)
International:
Total Revenues, Net of Interest Expense 433$ 758$ 1,055$ 953$ 897$ NM
Total Operating Expenses 305 541 757 765 704 NMTotal Provision for Loan Losses 6 16 12 5 (1) NM
Income Before Taxes and Minority Interest 122 201 286 183 194 59%
Income Taxes 35 5 92 30 52 49%
Minority Interest, Net of Tax - 17 38 17 6 -
Net Income 87$ 179$ 156$ 136$ 136$ 56%
NM Not meaningful
Reclassified to conform to the current period's presentation.Page 28
For your convenience, an excerpt from our 2008 first quarter earnings press release is set out below. You can find the entire press release,
as well as those from prior periods, on Citigroup's website at www.citigroup.com.
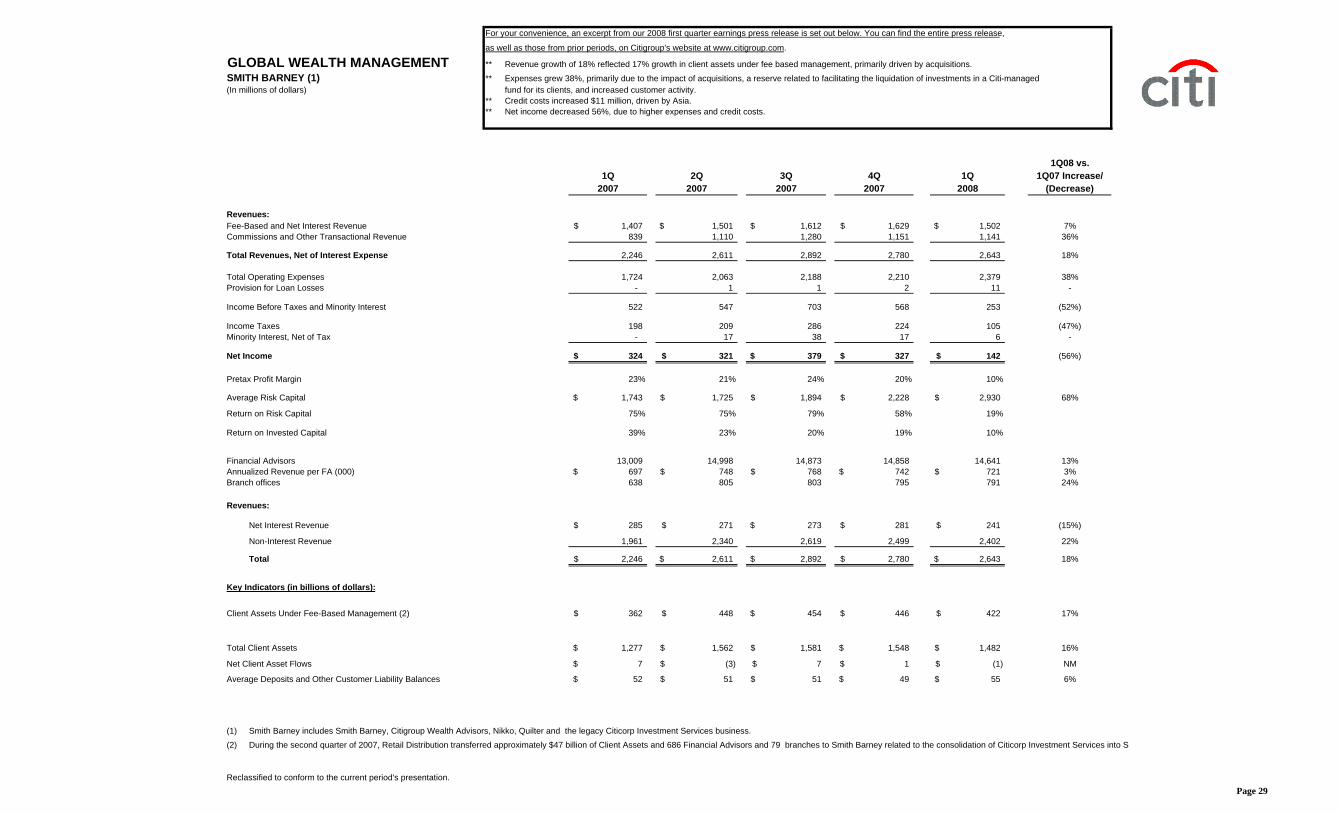
GLOBAL WEALTH MANAGEMENT ** Revenue growth of 18% reflected 17% growth in client assets under fee based management, primarily driven by acquisitions.
SMITH BARNEY (1) ** Expenses grew 38%, primarily due to the impact of acquisitions, a reserve related to facilitating the liquidation of investments in a Citi-managed (In millions of dollars) fund for its clients, and increased customer activity.
** Credit costs increased $11 million, driven by Asia.** Net income decreased 56%, due to higher expenses and credit costs.
1Q08 vs.1Q 2Q 3Q 4Q 1Q 1Q07 Increase/
2007 2007 2007 2007 2008 (Decrease)
Revenues:Fee-Based and Net Interest Revenue 1,407$ 1,501$ 1,612$ 1,629$ 1,502$ 7%Commissions and Other Transactional Revenue 839 1,110 1,280 1,151 1,141 36%
Total Revenues, Net of Interest Expense 2,246 2,611 2,892 2,780 2,643 18%
Total Operating Expenses 1,724 2,063 2,188 2,210 2,379 38%Provision for Loan Losses - 1 1 2 11 -
Income Before Taxes and Minority Interest 522 547 703 568 253 (52%)
Income Taxes 198 209 286 224 105 (47%)Minority Interest, Net of Tax - 17 38 17 6 -
Net Income 324$ 321$ 379$ 327$ 142$ (56%)
Pretax Profit Margin 23% 21% 24% 20% 10%
Average Risk Capital 1,743$ 1,725$ 1,894$ 2,228$ 2,930$ 68%
Total Client Assets 1,277$ 1,562$ 1,581$ 1,548$ 1,482$ 16%
Net Client Asset Flows 7$ (3)$ 7$ 1$ (1)$ NM
Average Deposits and Other Customer Liability Balances 52$ 51$ 51$ 49$ 55$ 6%
(1) Smith Barney includes Smith Barney, Citigroup Wealth Advisors, Nikko, Quilter and the legacy Citicorp Investment Services business.(2) During the second quarter of 2007, Retail Distribution transferred approximately $47 billion of Client Assets and 686 Financial Advisors and 79 branches to Smith Barney related to the consolidation of Citicorp Investment Services into Sm
Reclassified to conform to the current period's presentation.Page 29
For your convenience, an excerpt from our 2008 first quarter earnings press release is set out below. You can find the entire press release,
GLOBAL WEALTH MANAGEMENT as well as those from prior periods, on Citigroup's website at www.citigroup.com.
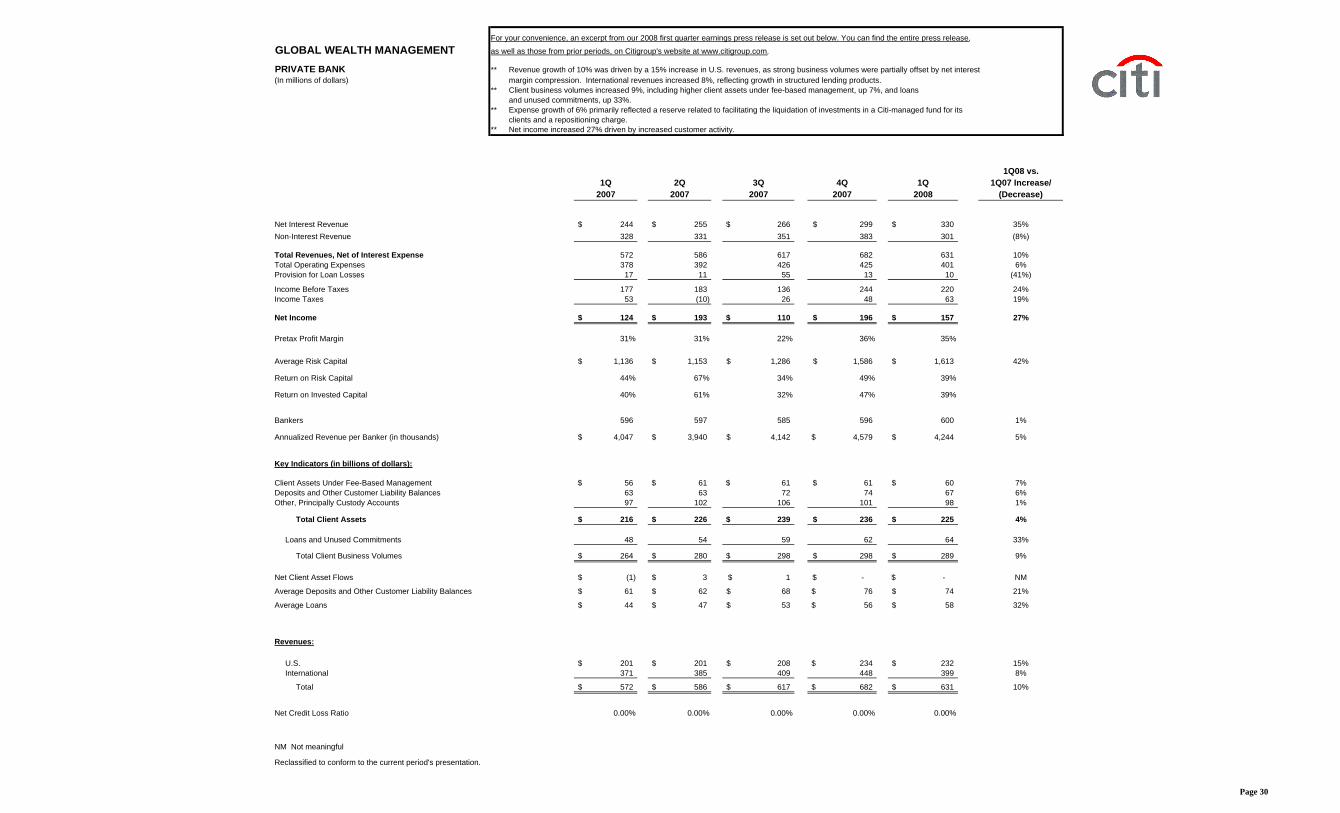
PRIVATE BANK ** Revenue growth of 10% was driven by a 15% increase in U.S. revenues, as strong business volumes were partially offset by net interest(In millions of dollars) margin compression. International revenues increased 8%, reflecting growth in structured lending products.
** Client business volumes increased 9%, including higher client assets under fee-based management, up 7%, and loansand unused commitments, up 33%.
** Expense growth of 6% primarily reflected a reserve related to facilitating the liquidation of investments in a Citi-managed fund for itsclients and a repositioning charge.
** Net income increased 27% driven by increased customer activity.
Net Credit Loss Ratio 0.00% 0.00% 0.00% 0.00% 0.00%
NM Not meaningful
Reclassified to conform to the current period's presentation.
Page 30
For your convenience, an excerpt from our 2008 first quarter earnings press release is set out below. You can find the entire press release,
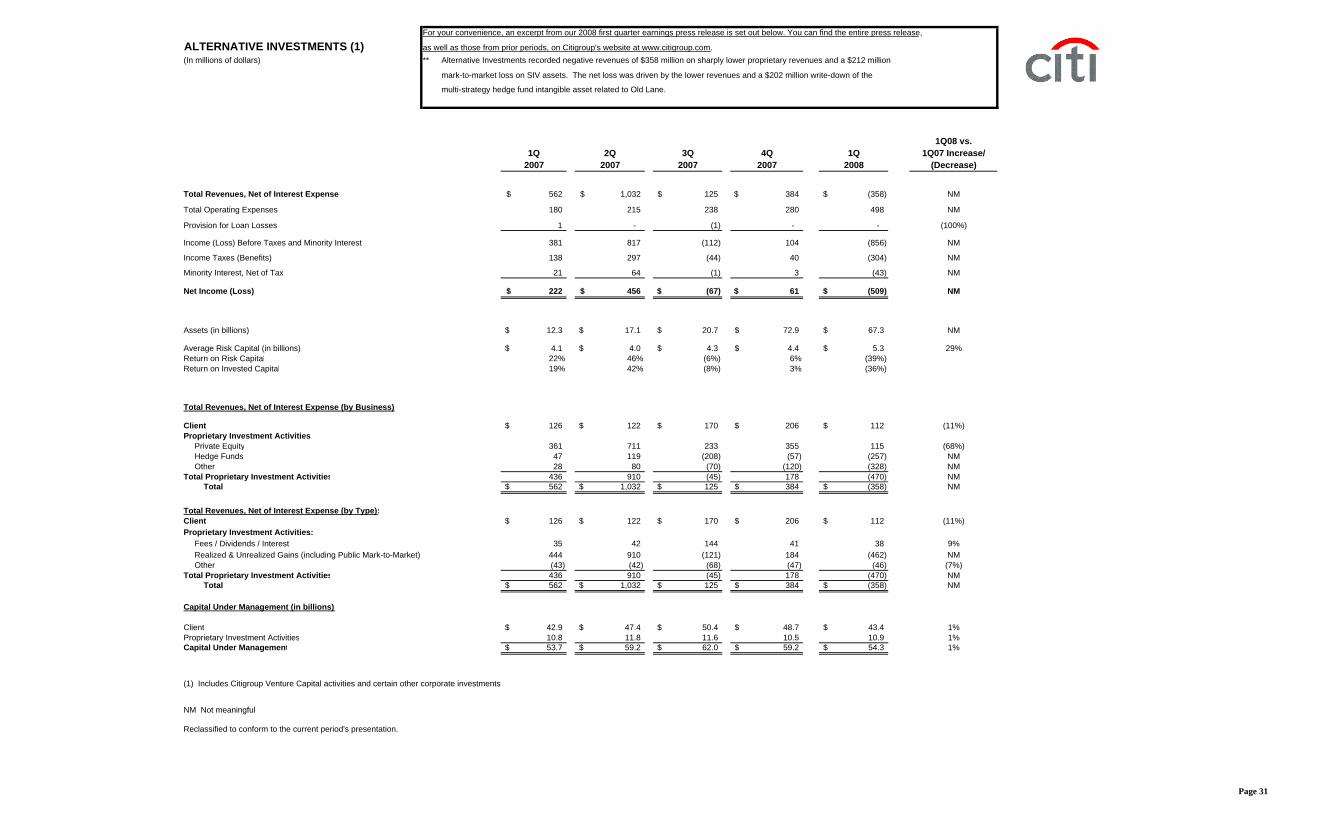
ALTERNATIVE INVESTMENTS (1) as well as those from prior periods, on Citigroup's website at www.citigroup.com.(In millions of dollars) ** Alternative Investments recorded negative revenues of $358 million on sharply lower proprietary revenues and a $212 million
mark-to-market loss on SIV assets. The net loss was driven by the lower revenues and a $202 million write-down of the
multi-strategy hedge fund intangible asset related to Old Lane.
1Q08 vs.1Q 2Q 3Q 4Q 1Q 1Q07 Increase/
2007 2007 2007 2007 2008 (Decrease)
Total Revenues, Net of Interest Expense 562$ 1,032$ 125$ 384$ (358)$ NM
Total Operating Expenses 180 215 238 280 498 NM
Provision for Loan Losses 1 - (1) - - (100%)
Income (Loss) Before Taxes and Minority Interest 381 817 (112) 104 (856) NM
Income Taxes (Benefits) 138 297 (44) 40 (304) NM
Minority Interest, Net of Tax 21 64 (1) 3 (43) NM
Net Income (Loss) 222$ 456$ (67)$ 61$ (509)$ NM
Assets (in billions) 12.3$ 17.1$ 20.7$ 72.9$ 67.3$ NM
Average Risk Capital (in billions) 4.1$ 4.0$ 4.3$ 4.4$ 5.3$ 29%Return on Risk Capital 22% 46% (6%) 6% (39%)Return on Invested Capital 19% 42% (8%) 3% (36%)
Total Revenues, Net of Interest Expense (by Business)
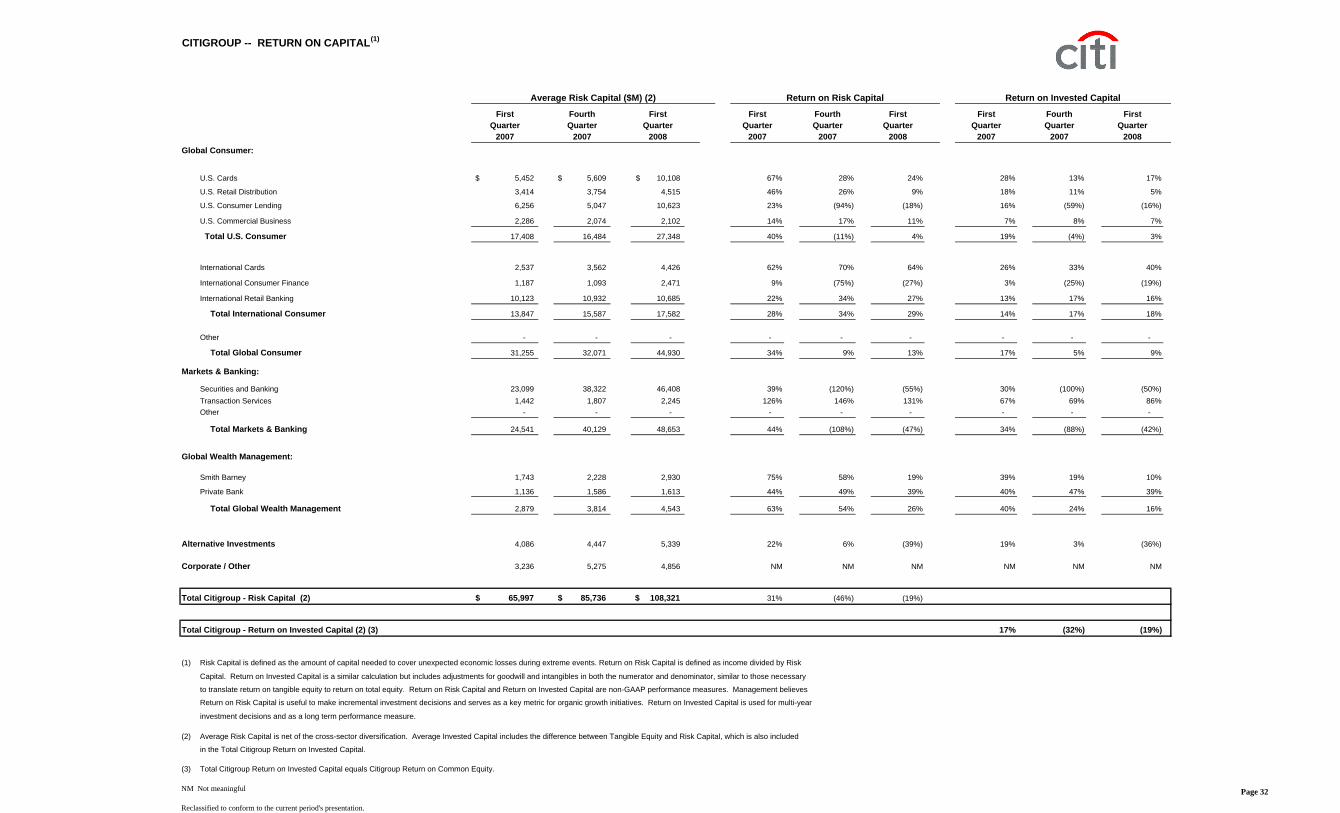
Total Citigroup - Risk Capital (2) 65,997$ 85,736$ 108,321$ 31% (46%) (19%)
Total Citigroup - Return on Invested Capital (2) (3) 17% (32%) (19%)
(1) Risk Capital is defined as the amount of capital needed to cover unexpected economic losses during extreme events. Return on Risk Capital is defined as income divided by Risk
Capital. Return on Invested Capital is a similar calculation but includes adjustments for goodwill and intangibles in both the numerator and denominator, similar to those necessary
to translate return on tangible equity to return on total equity. Return on Risk Capital and Return on Invested Capital are non-GAAP performance measures. Management believes
Return on Risk Capital is useful to make incremental investment decisions and serves as a key metric for organic growth initiatives. Return on Invested Capital is used for multi-year
investment decisions and as a long term performance measure.
(2) Average Risk Capital is net of the cross-sector diversification. Average Invested Capital includes the difference between Tangible Equity and Risk Capital, which is also included
in the Total Citigroup Return on Invested Capital.
(3) Total Citigroup Return on Invested Capital equals Citigroup Return on Common Equity.
NM Not meaningful
Reclassified to conform to the current period's presentation.
Average Risk Capital ($M) (2) Return on Risk Capital Return on Invested Capital
Page 32
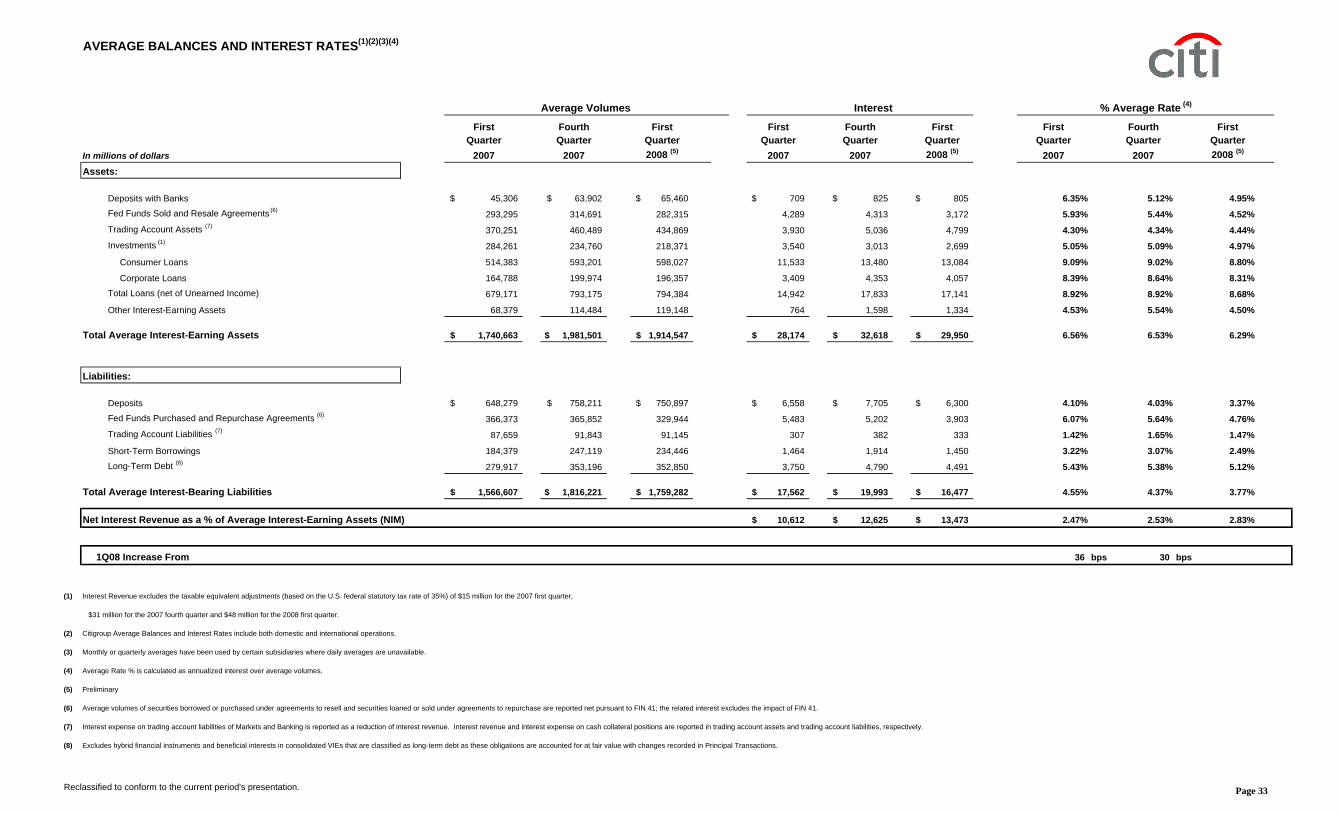
AVERAGE BALANCES AND INTEREST RATES (1)(2)(3)(4)
First Fourth First First Fourth First First Fourth FirstQuarter Quarter Quarter Quarter Quarter Quarter Quarter Quarter Quarter
In millions of dollars 2007 2007 2008 (5) 2007 2007 2008 (5) 2007 2007 2008 (5)
Total Average Interest-Bearing Liabilities 1,566,607$ 1,816,221$ 1,759,282$ 17,562$ 19,993$ 16,477$ 4.55% 4.37% 3.77%
Net Interest Revenue as a % of Average Interest-Earning Assets (NIM) 10,612$ 12,625$ 13,473$ 2.47% 2.53% 2.83%
1Q08 Increase From 36 bps 30 bps
(1) Interest Revenue excludes the taxable equivalent adjustments (based on the U.S. federal statutory tax rate of 35%) of $15 million for the 2007 first quarter,
$31 million for the 2007 fourth quarter and $48 million for the 2008 first quarter.
(2) Citigroup Average Balances and Interest Rates include both domestic and international operations.
(3) Monthly or quarterly averages have been used by certain subsidiaries where daily averages are unavailable.
(4) Average Rate % is calculated as annualized interest over average volumes.
(5) Preliminary
(6) Average volumes of securities borrowed or purchased under agreements to resell and securities loaned or sold under agreements to repurchase are reported net pursuant to FIN 41; the related interest excludes the impact of FIN 41.
(7) Interest expense on trading account liabilities of Markets and Banking is reported as a reduction of interest revenue. Interest revenue and interest expense on cash collateral positions are reported in trading account assets and trading account liabilities, respectively.
(8) Excludes hybrid financial instruments and beneficial interests in consolidated VIEs that are classified as long-term debt as these obligations are accounted for at fair value with changes recorded in Principal Transactions.
Reclassified to conform to the current period's presentation.
Average Volumes Interest % Average Rate (4)
Page 33
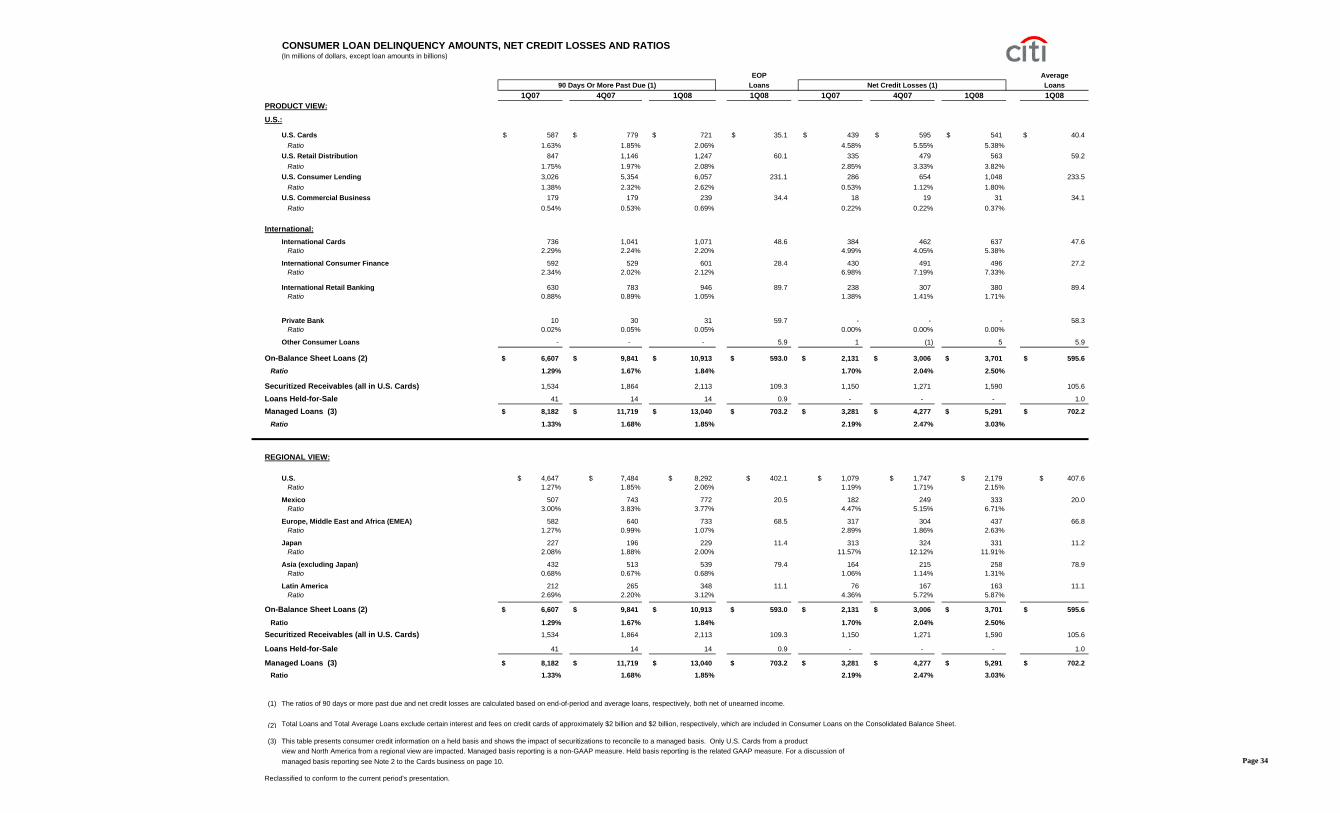
CONSUMER LOAN DELINQUENCY AMOUNTS, NET CREDIT LOSSES AND RATIOS(In millions of dollars, except loan amounts in billions)
(1) The ratios of 90 days or more past due and net credit losses are calculated based on end-of-period and average loans, respectively, both net of unearned income.
(2) Total Loans and Total Average Loans exclude certain interest and fees on credit cards of approximately $2 billion and $2 billion, respectively, which are included in Consumer Loans on the Consolidated Balance Sheet.
(3) This table presents consumer credit information on a held basis and shows the impact of securitizations to reconcile to a managed basis. Only U.S. Cards from a productview and North America from a regional view are impacted. Managed basis reporting is a non-GAAP measure. Held basis reporting is the related GAAP measure. For a discussion ofmanaged basis reporting see Note 2 to the Cards business on page 10.
Reclassified to conform to the current period's presentation.
Managed Loans (3)
On-Balance Sheet Loans (2)
90 Days Or More Past Due (1) Net Credit Losses (1)
On-Balance Sheet Loans (2)
Managed Loans (3)
Page 34
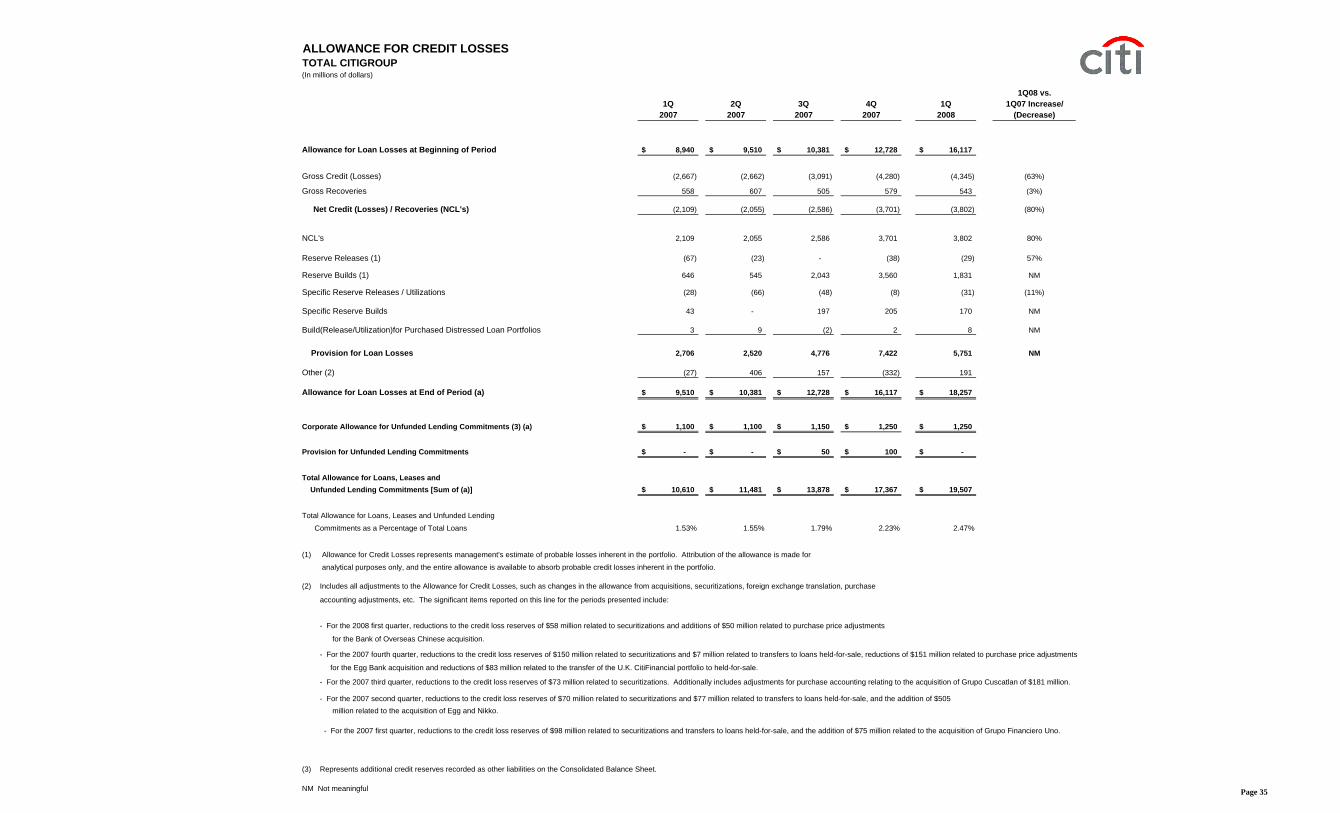
ALLOWANCE FOR CREDIT LOSSESTOTAL CITIGROUP(In millions of dollars)
1Q08 vs.1Q 2Q 3Q 4Q 1Q 1Q07 Increase/
2007 2007 2007 2007 2008 (Decrease)
Allowance for Loan Losses at Beginning of Period 8,940$ 9,510$ 10,381$ 12,728$ 16,117$
Provision for Unfunded Lending Commitments -$ -$ 50$ 100$ -$
Total Allowance for Loans, Leases and Unfunded Lending Commitments [Sum of (a)] 10,610$ 11,481$ 13,878$ 17,367$ 19,507$
Total Allowance for Loans, Leases and Unfunded Lending
Commitments as a Percentage of Total Loans 1.53% 1.55% 1.79% 2.23% 2.47%
(1) Allowance for Credit Losses represents management's estimate of probable losses inherent in the portfolio. Attribution of the allowance is made for
analytical purposes only, and the entire allowance is available to absorb probable credit losses inherent in the portfolio.
(2) Includes all adjustments to the Allowance for Credit Losses, such as changes in the allowance from acquisitions, securitizations, foreign exchange translation, purchase
accounting adjustments, etc. The significant items reported on this line for the periods presented include:
- For the 2008 first quarter, reductions to the credit loss reserves of $58 million related to securitizations and additions of $50 million related to purchase price adjustments
for the Bank of Overseas Chinese acquisition.
- For the 2007 fourth quarter, reductions to the credit loss reserves of $150 million related to securitizations and $7 million related to transfers to loans held-for-sale, reductions of $151 million related to purchase price adjustments
for the Egg Bank acquisition and reductions of $83 million related to the transfer of the U.K. CitiFinancial portfolio to held-for-sale.
- For the 2007 third quarter, reductions to the credit loss reserves of $73 million related to securitizations. Additionally includes adjustments for purchase accounting relating to the acquisition of Grupo Cuscatlan of $181 million.
- For the 2007 second quarter, reductions to the credit loss reserves of $70 million related to securitizations and $77 million related to transfers to loans held-for-sale, and the addition of $505 million related to the acquisition of Egg and Nikko.
- For the 2007 first quarter, reductions to the credit loss reserves of $98 million related to securitizations and transfers to loans held-for-sale, and the addition of $75 million related to the acquisition of Grupo Financiero Uno.
(3) Represents additional credit reserves recorded as other liabilities on the Consolidated Balance Sheet.
NM Not meaningful Page 35
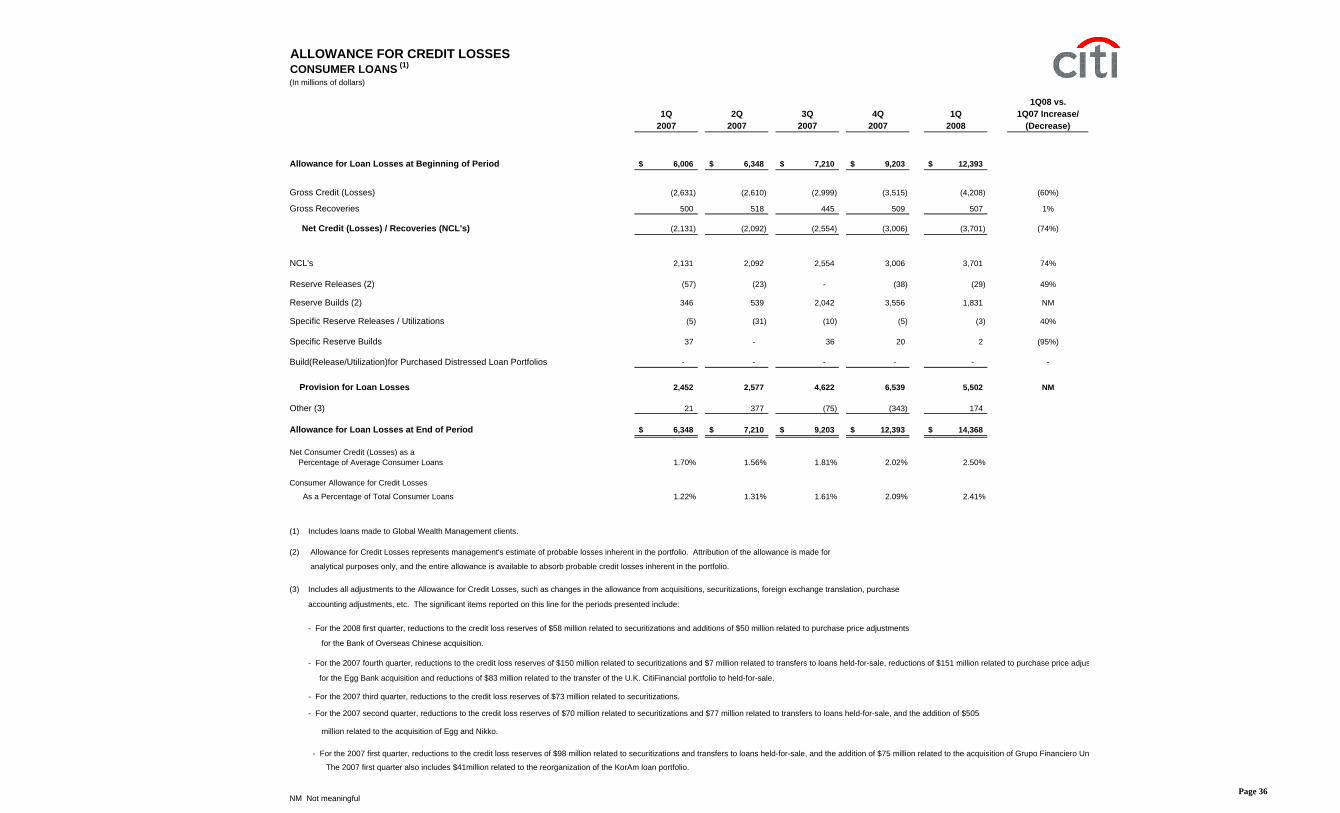
ALLOWANCE FOR CREDIT LOSSESCONSUMER LOANS (1)
(In millions of dollars)
1Q08 vs.1Q 2Q 3Q 4Q 1Q 1Q07 Increase/
2007 2007 2007 2007 2008 (Decrease)
Allowance for Loan Losses at Beginning of Period 6,006$ 6,348$ 7,210$ 9,203$ 12,393$
Provision for Loan Losses 2,452 2,577 4,622 6,539 5,502 NM
Other (3) 21 377 (75) (343) 174
Allowance for Loan Losses at End of Period 6,348$ 7,210$ 9,203$ 12,393$ 14,368$
Net Consumer Credit (Losses) as a Percentage of Average Consumer Loans 1.70% 1.56% 1.81% 2.02% 2.50%
Consumer Allowance for Credit Losses
As a Percentage of Total Consumer Loans 1.22% 1.31% 1.61% 2.09% 2.41%
(1) Includes loans made to Global Wealth Management clients.
(2) Allowance for Credit Losses represents management's estimate of probable losses inherent in the portfolio. Attribution of the allowance is made for
analytical purposes only, and the entire allowance is available to absorb probable credit losses inherent in the portfolio.
(3) Includes all adjustments to the Allowance for Credit Losses, such as changes in the allowance from acquisitions, securitizations, foreign exchange translation, purchase
accounting adjustments, etc. The significant items reported on this line for the periods presented include:
- For the 2008 first quarter, reductions to the credit loss reserves of $58 million related to securitizations and additions of $50 million related to purchase price adjustments
for the Bank of Overseas Chinese acquisition.
- For the 2007 fourth quarter, reductions to the credit loss reserves of $150 million related to securitizations and $7 million related to transfers to loans held-for-sale, reductions of $151 million related to purchase price adjus
for the Egg Bank acquisition and reductions of $83 million related to the transfer of the U.K. CitiFinancial portfolio to held-for-sale.
- For the 2007 third quarter, reductions to the credit loss reserves of $73 million related to securitizations.
- For the 2007 second quarter, reductions to the credit loss reserves of $70 million related to securitizations and $77 million related to transfers to loans held-for-sale, and the addition of $505
million related to the acquisition of Egg and Nikko.
- For the 2007 first quarter, reductions to the credit loss reserves of $98 million related to securitizations and transfers to loans held-for-sale, and the addition of $75 million related to the acquisition of Grupo Financiero Un
The 2007 first quarter also includes $41million related to the reorganization of the KorAm loan portfolio.
NM Not meaningfulPage 36
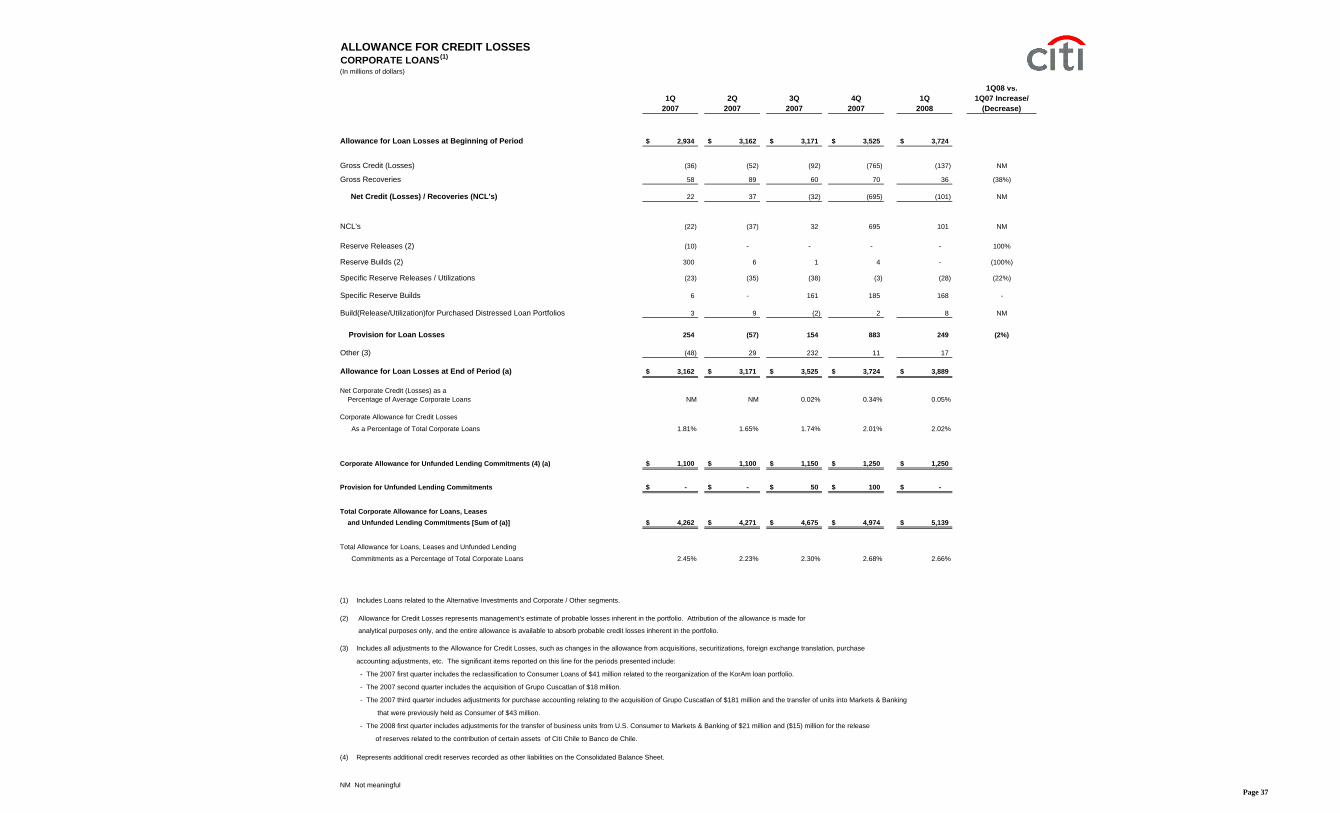
ALLOWANCE FOR CREDIT LOSSESCORPORATE LOANS(1)
(In millions of dollars)
1Q08 vs.1Q 2Q 3Q 4Q 1Q 1Q07 Increase/
2007 2007 2007 2007 2008 (Decrease)
Allowance for Loan Losses at Beginning of Period 2,934$ 3,162$ 3,171$ 3,525$ 3,724$
Provision for Unfunded Lending Commitments -$ -$ 50$ 100$ -$
Total Corporate Allowance for Loans, Leases and Unfunded Lending Commitments [Sum of (a)] 4,262$ 4,271$ 4,675$ 4,974$ 5,139$
Total Allowance for Loans, Leases and Unfunded Lending
Commitments as a Percentage of Total Corporate Loans 2.45% 2.23% 2.30% 2.68% 2.66%
(1) Includes Loans related to the Alternative Investments and Corporate / Other segments.
(2) Allowance for Credit Losses represents management's estimate of probable losses inherent in the portfolio. Attribution of the allowance is made for
analytical purposes only, and the entire allowance is available to absorb probable credit losses inherent in the portfolio.
(3) Includes all adjustments to the Allowance for Credit Losses, such as changes in the allowance from acquisitions, securitizations, foreign exchange translation, purchase
accounting adjustments, etc. The significant items reported on this line for the periods presented include:
- The 2007 first quarter includes the reclassification to Consumer Loans of $41 million related to the reorganization of the KorAm loan portfolio.
- The 2007 second quarter includes the acquisition of Grupo Cuscatlan of $18 million.
- The 2007 third quarter includes adjustments for purchase accounting relating to the acquisition of Grupo Cuscatlan of $181 million and the transfer of units into Markets & Banking
that were previously held as Consumer of $43 million.
- The 2008 first quarter includes adjustments for the transfer of business units from U.S. Consumer to Markets & Banking of $21 million and ($15) million for the release
of reserves related to the contribution of certain assets of Citi Chile to Banco de Chile.
(4) Represents additional credit reserves recorded as other liabilities on the Consolidated Balance Sheet.
NM Not meaningfulPage 37
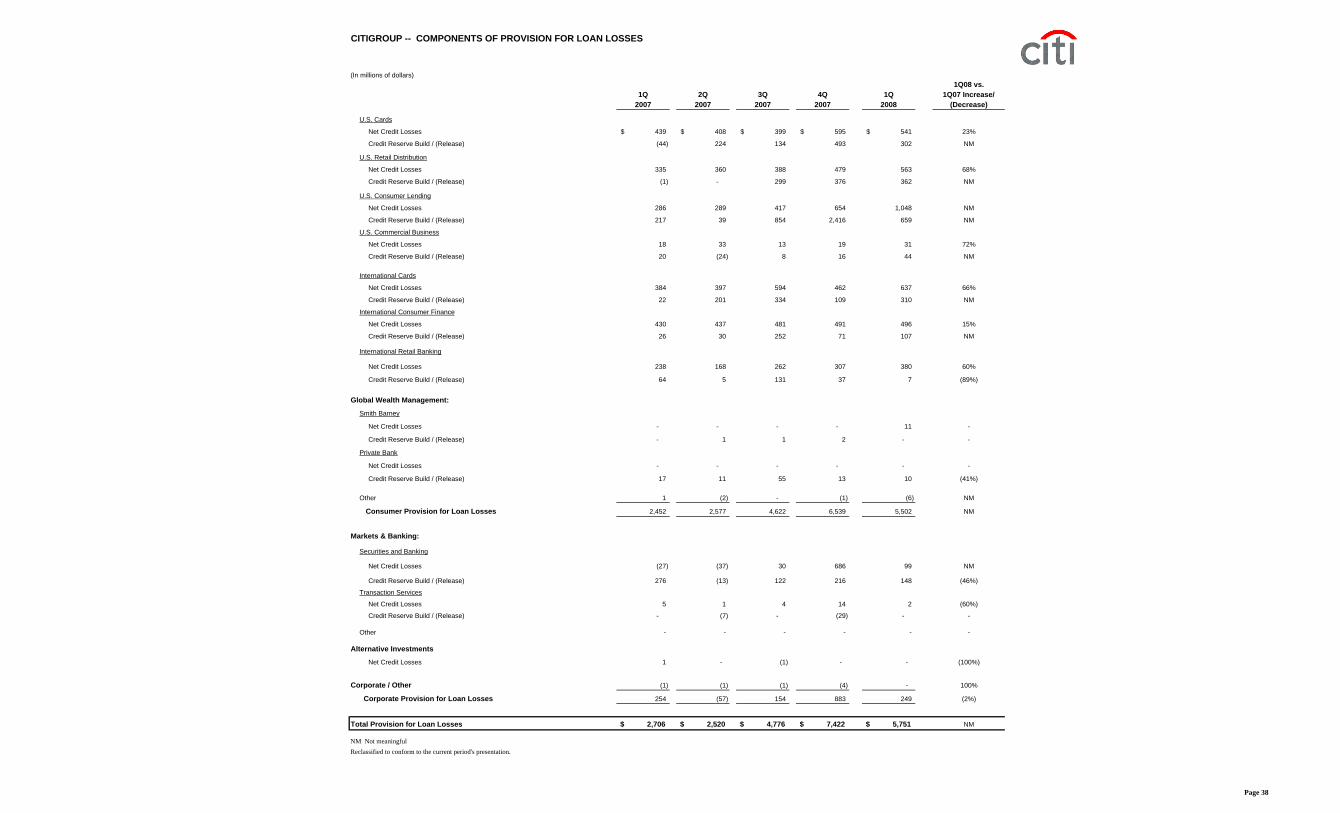
CITIGROUP -- COMPONENTS OF PROVISION FOR LOAN LOSSES
Total Provision for Loan Losses 2,706$ 2,520$ 4,776$ 7,422$ 5,751$ NM
NM Not meaningfulReclassified to conform to the current period's presentation.
Page 38
NON-PERFORMING ASSETS (In millions of dollars)
1Q 2Q 3Q 4Q 1Q
2007 2007 2007 2007 2008
CASH-BASIS AND RENEGOTIATED LOANSCorporate Cash-Basis LoansCollateral Dependent (at lower of cost or collateral value) 19$ 11$ 11$ 11$ 6$ Other 481 588 1,207 1,747 2,028
Total Corporate Cash-Basis Loans (1) 500$ 599$ 1,218$ 1,758$ 2,034$
Corporate Cash-Basis Loans JENA (2) 118$ 204$ 841$ 1,320$ 1,577$ Other International (3) 382 395 377 438 457
Total Corporate Cash-Basis Loans (1) 500$ 599$ 1,218$ 1,758$ 2,034$
Corporate Cash-Basis Loans as a % of Total Corporate Loans (1) 0.29% 0.31% 0.60% 0.95% 1.05%
Total Consumer Cash-Basis Loans (1) 4,578$ 5,160$ 6,137$ 7,210$ 8,301$
Renegotiated Loans (includes Corporate and Commercial Business Loans) 26$ 27$ 56$ 118$ 174$
OTHER REAL ESTATE OWNED AND OTHER REPOSSESSED ASSETS
Consumer 461$ 516$ 594$ 707$ 919$
Markets & Banking 348 219 348 512 545
TOTAL OTHER REAL ESTATE OWNED (4) 809$ 735$ 942$ 1,219$ 1,464$
OTHER REPOSSESSED ASSETS (5) 77$ 66$ 86$ 99$ 107$
(1) Excludes purchased distressed loans. The carrying value of these loans was: $957 million at March 31, 2007, $1,013 million at June 30, 2007, $1,188 at September 30,
2007, $2,399 million at December 31, 2007 and $2,224 million at March 31, 2008.
(2) JENA includes Japan, Western Europe and North America.
(3) Other International includes Asia (excluding Japan), Mexico, Latin America, Central and Eastern Europe, the Middle East and Africa.
(4) Represents repossessed real estate, carried at lower of cost or fair value, less costs to sell.
(5) Primarily transportation equipment, carried at lower of cost or fair value, less costs to sell.