Jamie Davies Head of Pharmaceuticals & Healthcare Business Monitor International Oscar Mazza Consumer & Healthcare Industry Head Citi Transaction Services Latin America The Pharmaceutical & Healthcare Industry in Latin America Citi’s Online Academy Presents:
Transcript
Jamie Davies Head of Pharmaceuticals & HealthcareBusiness Monitor International
Oscar MazzaConsumer & Healthcare Industry HeadCiti Transaction Services Latin America
The Pharmaceutical & Healthcare Industry in Latin America
Citi’s Online Academy Presents:
Agenda
Introduction
Market drivers
Risk/Reward Ratings
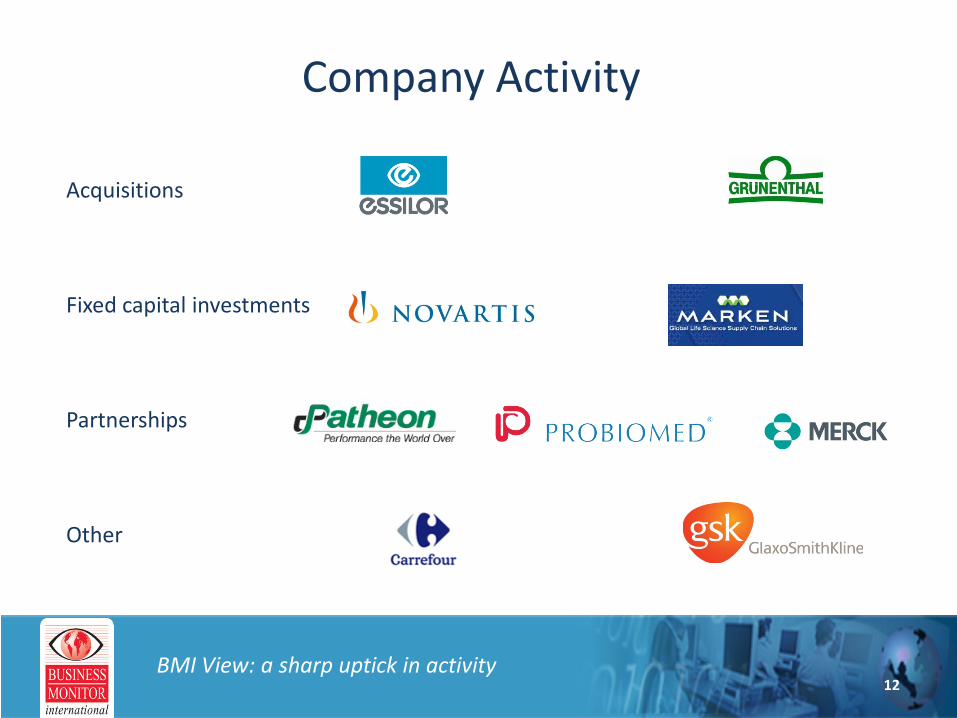
Company Activity
Case Studies
Q&A
0 min 30 min
1 2 3 4 5 7
2
Introduction
• Established in 1984.
• Headquartered in London, with regional offices in Singapore, Johannesburg and New York City.
• Clients include corporations, investment banks, consultancies, governments and academic institutions.
• Over 100 research analysts.
Image: the City of London
3
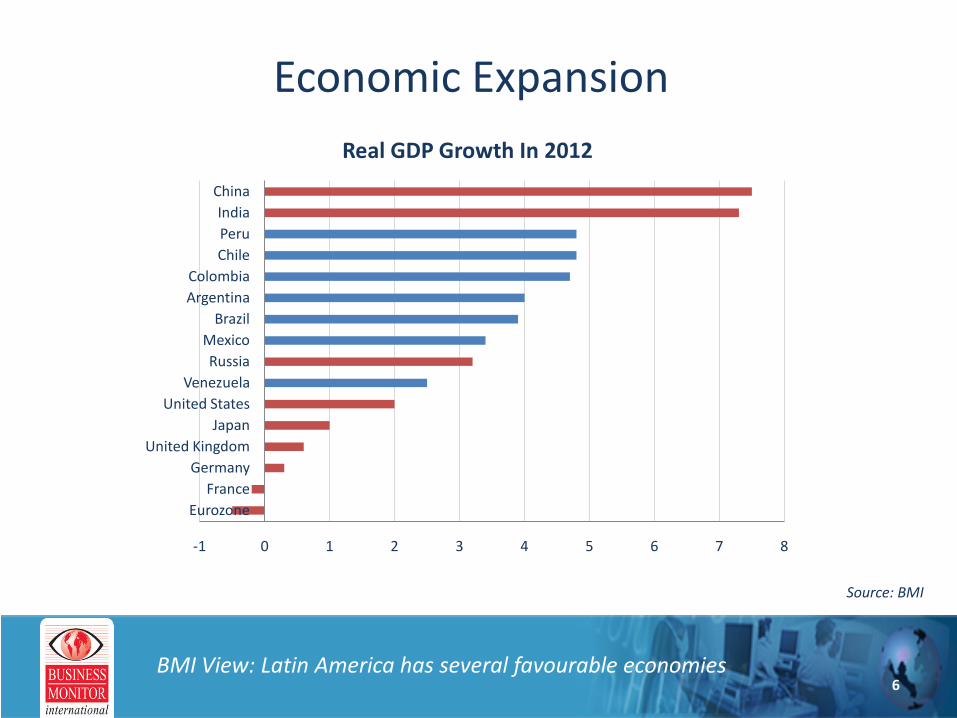
The Global Context
BMI View: moderate risk, moderate reward
Pharmaceutical Sales In 2011
Latin America US$70bnEurope US$329bn
Middle East US$16bn
Africa US$19bn
North America US$358bn
Asia US$265bn
Source: BMI
4
The Global Outlook
BMI View: emerging markets to drive industry growth
Latin America Sales (EURmn) (LHS) Latin America sales as % of global sales (RHS)
18
Local Company Case Study: Genomma
BMI View: should concentrate on its domestic market
Source: Bloomberg
0
50
100
150
200
250
300
350
400
450
The Relative Performance Of Genomma Lab Internacional And The Mexico IPC Index
Genomma Mexico IPC Index
19
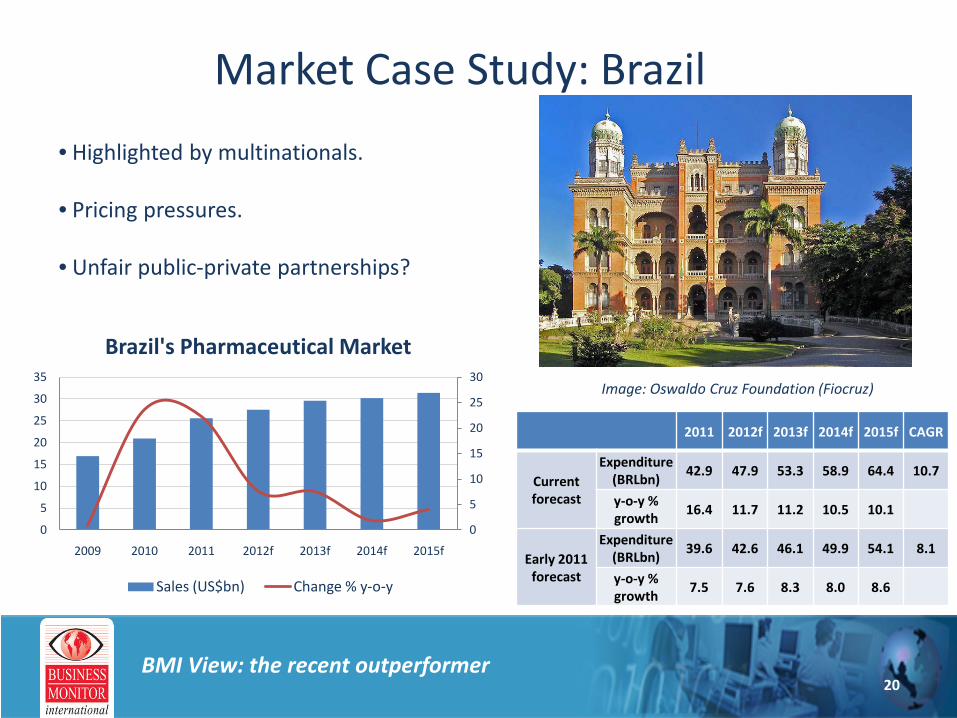
Market Case Study: Brazil
2011 2012f 2013f 2014f 2015f CAGR
Current forecast
Expenditure (BRLbn)
42.9 47.9 53.3 58.9 64.4 10.7
y-o-y % growth
16.4 11.7 11.2 10.5 10.1
Early 2011 forecast
Expenditure (BRLbn)
39.6 42.6 46.1 49.9 54.1 8.1
y-o-y % growth
7.5 7.6 8.3 8.0 8.6
Image: Oswaldo Cruz Foundation (Fiocruz)
BMI View: the recent outperformer
0
5
10
15
20
25
30
0
5
10
15
20
25
30
35
2009 2010 2011 2012f 2013f 2014f 2015f
Brazil's Pharmaceutical Market
Sales (US$bn) Change % y-o-y
• Highlighted by multinationals.
• Pricing pressures.
• Unfair public-private partnerships?
20
Market Case Study: Mexico
2011 2012f 2013f 2014f 2015f CAGR
Current forecast
Expenditure (MXNbn)
161 175 189 204 220 8.0
y-o-y % growth
8.5 8.3 8.1 7.9 7.7
Early 2011 forecast
Expenditure (MXNbn)
152 156 161 165 170 2.8
y-o-y % growth
2.5 2.6 2.8 2.9 2.9
Image: Petróleos Mexicanos (Pemex) oil rig in the Gulf of Mexico
BMI View: a positive surprise
-20
-15
-10
-5
0
5
10
15
0
5
10
15
20
2009 2010 2011 2012f 2013f 2014f 2015f
Mexico's Pharmaceutical Market
Sales (US$bn) Change % y-o-y
• No energy liberalisation?
• Dependent on US economy.
• General security concerns.
21
Market Case Study: Venezuela
2011 2012f 2013f 2014f 2015f CAGR
Current forecast
Expenditure (VEFbn)
33.3 41.2 49.8 59.3 69.5 20.2
y-o-y % growth
24.6 23.8 21.1 19.0 17.1
Early 2011 forecast
Expenditure (VEFbn)
29.4 36.1 42.8 49.9 57.6 18.3
y-o-y % growth
10.0 23.0 18.4 16.7 15.4
Image: Hugo Chavez
BMI View: October 2012 election is key
-40
-30
-20
-10
0
10
20
30
40
0
2
4
6
8
10
2009 2010 2011 2012f 2013f 2014f 2015f
Venezuela's Pharmaceutical Market
Sales (US$bn) Change % y-o-y
• High oil prices.
• Repatriation of revenues.
• Anti-American sentiment.
22
Market Case Study: Argentina
2011 2012f 2013f 2014f 2015f CAGR
Current forecast
Expenditure (ARSbn)
37.9 45.4 53.7 62.9 72.8 17.7
y-o-y % growth
30.7 19.6 18.4 17.1 15.7
Early 2011 forecast
Expenditure (ARSbn)
34.2 39.9 46.2 53.2 60.9 15.5
y-o-y % growth
17.2 16.7 15.8 15.2 14.3
Image: Instituto Nacional de Estadística y Censos, INDEC
BMI View: consistently defying risks
0
5
10
15
20
25
0
2
4
6
8
10
2009 2010 2011 2012f 2013f 2014f 2015f
Argentina's Pharmaceutical Market
Sales (US$bn) Change % y-o-y
• Under-reporting of inflation.
• Patent approval backlog.
• Import restrictions.
23
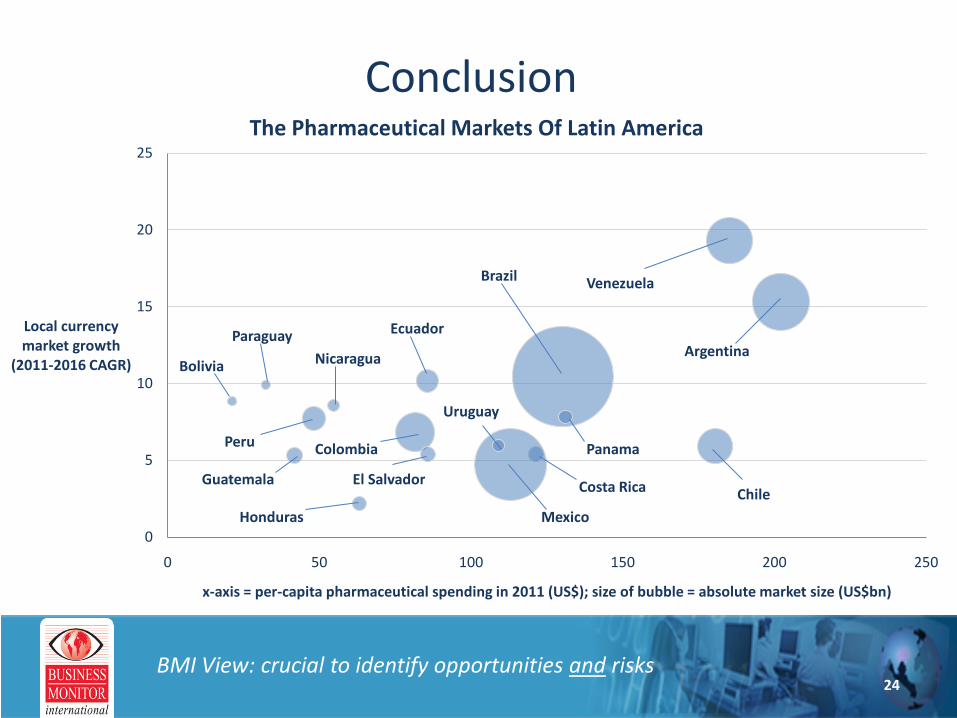
Conclusion
BMI View: crucial to identify opportunities and risks
0
5
10
15
20
25
0 50 100 150 200 250
Local currency market growth
(2011-2016 CAGR)
x-axis = per-capita pharmaceutical spending in 2011 (US$); size of bubble = absolute market size (US$bn)
The Pharmaceutical Markets Of Latin America
Costa Rica
Mexico
Panama
Uruguay
El Salvador
Colombia
Honduras
Guatemala
Peru
Bolivia
ParaguayNicaragua
Ecuador
Brazil
Chile
Argentina
Venezuela
24
Questions
For all questions and inquiries related to Business Monitor International, including interest in a free trial or to obtain more information about our subscription services, please contact: