91


i 2009 CITIZEN CORPS NATIONAL SURVEY
Table of Contents Introduction 1 Research Method 5 Research Findings 7 Extent of Individual Preparedness 7 Disaster Supplies 7 Household Plan 9 Familiarity with Community Systems 10 Volunteerism 11 Knowledge of Immediate Response 13 Participation in Drills 15 Preparedness Training 16 Perceived Preparedness versus Actual Preparedness 18 Preparedness Barriers 19 Barriers to Preparedness Activities 19 Barriers to Preparedness Training 21 Expectation of Reliance on Others 22 Reliance on Others During an Evacuation 23 Perception of Risk and Utility of Preparedness 25 Perception of Risks 25 Perception of Severity 26 Utility of Advance Preparation 28 Confidence in Ability to Respond 29 Stages of Change in Preparedness 31 Preparedness Differences by Demographics 34 Disability Profile 34 Gender Profile 35 Community Type Profile 36 Race and Ethnicity Profile 37 Income Profile 38 Education Profile 39 Age Profile 41 Employment Profile 42 Volunteerism Profile 43 Religiousness Profile 44 Social Responsibility and Suspicious Behavior 45 Summary and Recommendations 47 Conclusion and Next Steps 55 Appendix A – Survey Script 57 Appendix B – Survey Respondents Profile 81

ii 2009 CITIZEN CORPS NATIONAL SURVEY
THIS PAGE INTENTIONALLY LEFT BLANK
1 2009 CITIZEN CORPS NATIONAL SURVEY
Introduction Disaster preparedness became a renewed priority for our Nation as a direct response to the devastation of the terrorist attacks of September 11, 2001. Following the tragedies of that day, government at all levels has embedded stronger collaboration with nongovernmental civic and private sector organizations and the general public in policies and practices. The Citizen Corps grassroots model of community preparedness has spread across the country, and Americans have been asked to become fully aware, trained, and practiced on how to respond to potential threats and hazards.
To evaluate the Nation’s progress on personal preparedness, the Federal Emergency Management Agency’s (FEMA’s) Community Preparedness Division conducts Citizen Corps National Surveys to measure the public’s knowledge, attitudes, and behaviors relative to preparing for a range of hazards. This report provides a summary of the findings from the 2009 Citizen Corps National Survey.
Research Objectives
The research objectives and survey questions for the Citizen Corps National Survey were developed based on previous research, preparedness modeling, and policy and guidance from the Department of Homeland Security (DHS). In 2003, Citizen Corps conducted a national survey to provide baseline data on individual preparedness for disasters. In 2007, the Citizen Corps National Survey was designed to incorporate additional areas of examination and to refine the questioning, while retaining several specific questions from the 2003 survey to provide trend data. The 2009 Citizen Corps National Survey includes several more small refinements. Comparisons between the findings from the 2003, 2007, and 2009 surveys are noted throughout the report.
Citizen Preparedness Reviews1
FEMA’s Community Preparedness Division publishes the Citizen Preparedness Review to highlight specific areas of research regarding community preparedness and to summarize research findings from multiple sources. To assess the research landscape on preparedness, Citizen Corps has developed and maintains the Citizen Preparedness Surveys Database of surveys on personal and business preparedness conducted in the United States since September 11, 2001. As of August 2009, the database contains 102 surveys on individual preparedness, 29 surveys on business, and 11 surveys on school preparedness. Analyzing research from this wide variety of sources allows larger preparedness trends and research gaps to be identified.
Citizen Preparedness Review Issue 3, Patterns in Current Research and Future Research Opportunities (published summer 2006), made several recommendations for future research that were taken into consideration
1 The Citizen Preparedness Reviews and other preparedness research are available at: http://www.citizencorps.gov/ready/research.shtm.

2 2009 CITIZEN CORPS NATIONAL SURVEY
in the development of the Citizen Corps National Survey implemented in 2007 and 2009. These recommendations included:
• More fully explore participants’ knowledge of the correct preparedness measures and appropriate responses for different types of hazards.
• Investigate a more comprehensive range of knowledge, supplies, and skills related to disaster preparedness, such as knowledge of warning systems, evacuation routes, and training for specific skills.
• More fully explore motivational barriers to preparedness, such as the degree of uncertainty about ability to perform recommended measures or perceptions that recommended measures will not make a difference in disaster situations.
• Investigate demographic and contextual characteristics as they relate to preparedness including: prior experience with disasters, disability/ability factors, and community engagement.
• Examine individuals’ preparedness in multiple locations in addition to their homes, such as the school, workplace, and community.
An important finding from the Citizen Preparedness Surveys Database is that perceived preparedness can be very different from the specific preparedness measures taken. In nearly all cases, these surveys substantiate that the proportion of those who have taken appropriate preparedness measures is much lower than those that indicate that they are prepared.
Personal Disaster Preparedness Model
Citizen Corps Preparedness Review Issue 4, Citizen Corps Personal Behavior Change Model for Disaster Preparedness, presented the Citizen Corps Personal Disaster Preparedness (PDP) Model. This behavioral model describes the various factors that may influence whether or not a person engages in disaster preparedness activities. Based on two theoretical models common to the social science field that have been applied in other risk assessment and protection motivation work, the Extended Parallel Process Model (EPPM) and the Stages of Change/Transtheoretical Model, the PDP Model explores personal motivation factors and identifies ways to target individuals based on their motivation for, or perceived barriers to, preparedness. Several questions in the Citizen Corps National Survey were designed to test the PDP Model.
Community Preparedness and Participation Target Capability
Homeland Security Presidential Directive 8 (HSPD-8) on National Preparedness, enacted December 17, 2003, directed the Secretary of Homeland Security to develop a national all-hazards preparedness goal. To execute this directive, in March 2005, DHS released the Interim National Preparedness Goal. In September 2007, the National Preparedness Guidelines and accompanying Target Capabilities List (TCL) were updated and published. The guidelines define what it means for the Nation to be prepared for all hazards. The Target Capabilities List denotes 37 specific capabilities that communities, the private sector, and all levels of government should collectively possess in order to respond effectively to disasters. The Target Capabilities are

3 2009 CITIZEN CORPS NATIONAL SURVEY
currently being revised with the updated Community Preparedness and Participation capability expected to be released in December 2009.
The Community Preparedness and Participation (CPP) Target Capability is one of four common capabilities that support all mission areas and all other Target Capabilities. The CPP Capability encourages government to collaborate with civic leaders from all sectors to strengthen community preparedness and resilience, to integrate nongovernmental resources and assets in government plans and protocols, and to engage citizens in personal preparedness, exercises, ongoing volunteer programs, and surge capacity response.
For individuals, the CPP Capability outlines the goal that everyone in America become fully aware, trained, and practiced on how to prevent, protect, mitigate, prepare for, and respond to all threats and hazards. Several questions in the Citizen Corps National Survey were designed to provide strategic insight into specific aspects of the CPP TCL goals, including the following:
• Percent of residents within the jurisdiction who are alert to unusual behavior—indicative of potential criminal/terrorist activity—and who understand appropriate reporting procedures, until 80 percent of residents maintain knowledge.
• Percent of households that conduct pre-incident preparation to include creating and maintaining a communication plan, obtaining disaster supplies, and practicing evacuation/shelter-in-place and additional maintenance skills, until 80 percent of households maintain pre-incident preparation.
• Percent of residents prepared to evacuate or relocate to designated shelter (to include residents with special needs), until 80 percent of the population is prepared.
• Percent of a jurisdiction’s population that is knowledgeable of workplace, school, and community emergency plans, until 80 percent of population maintains knowledge.
• Percent of residents prepared to shelter-in-place and have emergency supplies on hand as advised by local authorities, until 80 percent of population is thus prepared.
• Percent of annual increase in number of residents trained in basic first aid, until 80 percent of population maintains these skills.
• Percent of residents educated and trained in risk-based capabilities for high-threat incidents in their area, to include natural hazards, technological hazards, and terrorism, until 72 percent of population (80% of those living in high-threat areas) are educated and trained per appropriate hazard.
• Percent of trained residents providing volunteer support to local emergency responder disciplines (law enforcement, fire, emergency medical, and public health services), until 10 percent of the population volunteers an average of 20 hours per year, to equal 560 million hours per year.

4 2009 CITIZEN CORPS NATIONAL SURVEY
THIS PAGE INTENTIONALLY LEFT BLANK
5 2009 CITIZEN CORPS NATIONAL SURVEY
Research Method Under contract to FEMA’s Community Preparedness Division, ICF Macro, an applied research and consulting firm, supported the survey design, data collection, and analysis and reporting of the 2003, 2007, and 2009 Citizen Corps surveys.
Survey Design
The 2009 survey instrument consists of 56 items covering the following topics:
• Utility/Response Efficacy • Self-Efficacy • Drills/Exercises
• Risk Awareness/Perception • Prevention • Volunteering
• Severity • Disaster Supplies • Demographics
• Stages of Change • Household Plan
• Reliance • Community Plan
In addition, the survey included questions relative to four different types of disasters: natural disasters, an act of terrorism, a hazardous materials accident, and a several disease outbreak. See Appendix A for the survey instrument.
Office of Management and Budget Approval
In accordance with the Paperwork Reduction Act, the Office of Management and Budget (OMB) approved a multiyear collection on May 18, 2007. The OMB Control Number for this survey is 1670-0006.
Institutional Review Board Exemption Approval
In addition to OMB approval, the research survey was also granted Institutional Review Board (IRB) exemption from ICF Macro’s internal IRB under 45 CFR 46.101(b) (2b).
Survey Administration
The 2009 Citizen Corps National Survey was fielded from April 2009 to May 2009. The survey was administered using ICF Macro’s computer-assisted telephone interviewing system. ICF Macro also provided Spanish-speaking interviewers as an option for Spanish-speaking respondents. During the survey fielding, there was an H1N1 influenza outbreak that was reported repeated in the national news. An analysis of the potential impact of this outbreak on survey responses will be provided at a later date.

6 2009 CITIZEN CORPS NATIONAL SURVEY
National Sampling2
ICF Macro conducted the survey with a sample size of 4,461 U.S. households. Some counties in California were inadvertently excluded from the sampling frame. The survey sample represents 96.5% of U.S. households, providing overall results at +/-3.27 percent sampling error (at a 95% confidence level). Findings that have a higher percentage than the sampling error are more likely to be accurate and are considered to be statistically significant.
The sample was selected via random digit dialing (RDD) from a list-assisted sampling frame. The RDD sampling frame represents the noninstitutionalized U.S. adult population residing in households equipped with landline telephones. The frame excludes adults in penal, mental, or other institutions; adults living in other group quarters such as dormitories, barracks, convents, or boarding houses (with 10 or more unrelated residents); adults living in a household without a telephone; and/or adults who did not speak English or Spanish well enough to be interviewed in either language.
Weighting
Each telephone number in the national sample had an equal chance of selection. However, operational aspects associated with RDD surveys, such as nonresponse and landline saturation, may produce respondents that over-represent or under-represent certain population segments. ICF Macro accounted for these potential biases by weighting the data according to geography, age, gender, and race. (See Appendix B for the survey respondents’ profile based on the weighted data.) This adjusted the sample’s demographic distributions to match the distribution in the 2007 U.S. Census population estimates.
Research Questions
Building on the findings of previous research, the understanding of disaster preparedness garnered from Citizen Preparedness Reviews, the Citizen Corps PDP Model, and the CPP TCL, the following research questions were developed to guide the design and analysis of the Citizen Corps National Survey:
• To what extent are individuals prepared for disasters? What barriers do individuals perceive in preparing for disasters?
• What is the perception of vulnerability to different types of disasters? How do people perceive the utility of preparedness?
• In which stage of the Stages of Change model (Precontemplation, Contemplation, Preparation, Action, Maintenance) are individuals relative to disaster preparedness?
• How does disaster preparedness differ by demographic characteristics?
• What is the perceived social responsibility for reporting suspicious behavior?
2 To provide greater insight in preparedness in an urban environment, an additional oversample of 3,077 respondents was drawn from six jurisdictions in the Regional Catastrophic Preparedness Grant Program: Chicago, IL; Houston, TX; Long Beach/Los Angeles, CA; National Capital Area; New York City, NY/Newark, NJ; and San Francisco, CA.
7 2009 CITIZEN CORPS NATIONAL SURVEY
Research Findings Results from the 2009 Citizen Corps National Survey are organized according to the research questions to further inform these critical aspects of preparedness. Statistically significant differences across demographics or contextual variables such as religiousness or employment status are also provided. Findings relevant to the CPP Target Capability are highlighted in callout boxes throughout the report. References to the exact wording of survey questions are noted in quotation marks.
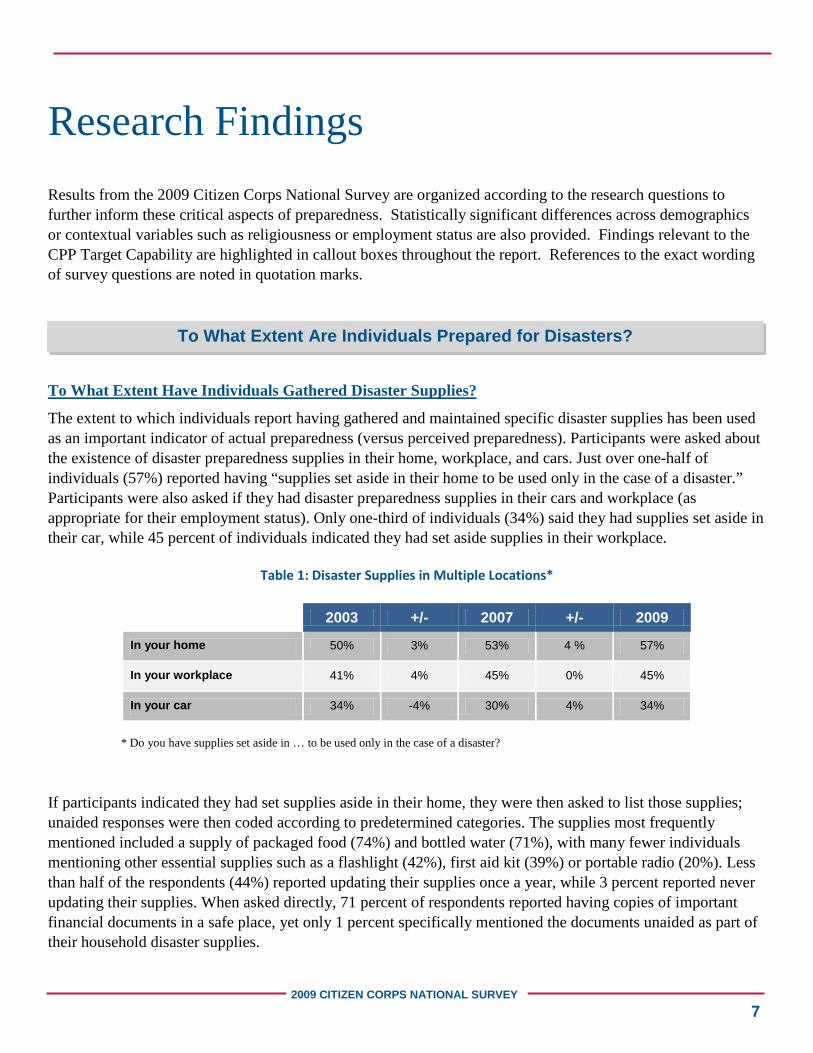
The extent to which individuals report having gathered and maintained specific disaster supplies has been used as an important indicator of actual preparedness (versus perceived preparedness). Participants were asked about the existence of disaster preparedness supplies in their home, workplace, and cars. Just over one-half of individuals (57%) reported having “supplies set aside in their home to be used only in the case of a disaster.” Participants were also asked if they had disaster preparedness supplies in their cars and workplace (as appropriate for their employment status). Only one-third of individuals (34%) said they had supplies set aside in their car, while 45 percent of individuals indicated they had set aside supplies in their workplace.
To What Extent Have Individuals Gathered Disaster Supplies?
Table 1: Disaster Supplies in Multiple Locations*
2003 +/- 2007 +/- 2009
In your home 50% 3% 53% 4 % 57%
In your workplace 41% 4% 45% 0% 45%
In your car 34% -4% 30% 4% 34%
* Do you have supplies set aside in … to be used only in the case of a disaster?
If participants indicated they had set supplies aside in their home, they were then asked to list those supplies; unaided responses were then coded according to predetermined categories. The supplies most frequently mentioned included a supply of packaged food (74%) and bottled water (71%), with many fewer individuals mentioning other essential supplies such as a flashlight (42%), first aid kit (39%) or portable radio (20%). Less than half of the respondents (44%) reported updating their supplies once a year, while 3 percent reported never updating their supplies. When asked directly, 71 percent of respondents reported having copies of important financial documents in a safe place, yet only 1 percent specifically mentioned the documents unaided as part of their household disaster supplies.
To What Extent Are Individuals Prepared for Disasters?

8 2009 CITIZEN CORPS NATIONAL SURVEY
Table 2: Home Disaster Supplies*
2003 +/- 2007 +/- 2009
Supply of packaged food 45% 26% 71% 3% 74%
Supply of bottled water 54% 19% 73% -2% 71%
Flashlight 41% -1% 40% 2% 42%
First aid kit 64% -30% 34% 5% 39%
Batteries 21% 4% 25% 2% 27%
Portable, battery-powered radio 14% 9% 23% -3% 20%
Medications --- --- 9% 2% 11%
Cash --- --- 3% -1% 2%
Financial documents --- --- 2% -1% 1%
Photocopies of personal identification --- --- 1% 0% 1%
Eyeglasses --- --- 1% 0% 1%
*These responses were unaided and asked as part of a multiple response question. The results represent the total percent of respondents mentioning the existence of the particular item in their home as part of their disaster preparedness supplies. Respondents were asked “Could you tell me the disaster supplies you have in your home?”
• Age: Individuals between the ages of 18 to 34 (38%) and ages 35 to 54 (35%) were significantly more likely to have disaster supplies set aside in their cars than individuals aged 55 years and older (29%).
Demographic and Contextual Differences
• Education: Individuals with some college education (36%) were significantly more likely than less educated individuals (29%) to have supplies set aside in their cars.
• Ethnicity: Non-Hispanic individuals (73%) were significantly more likely than Hispanic individuals (60%) to have a supply of bottled water as part of their home disaster supplies. Non-Hispanic individuals (73%) were significantly more likely to have copies of important financial and insurance documents in a safe place than Hispanic individuals (59%).
• Household income: Households making $25,000 - $49,000 (75%), and $50,000 - $74,000 (74%) and more than $75,000 (73%) were significantly more likely than households earning less to have a supply of bottled water in their home (58%). Households earning $50,000 - $74,000 (81%) were significantly more likely to have a supply of packaged food in their home than households making less than $25,000 (67%).
• Race: White individuals (76%) were significantly more likely than Black individuals (55%) to have a supply of bottled water as part of their home disaster supplies.
9 2009 CITIZEN CORPS NATIONAL SURVEY
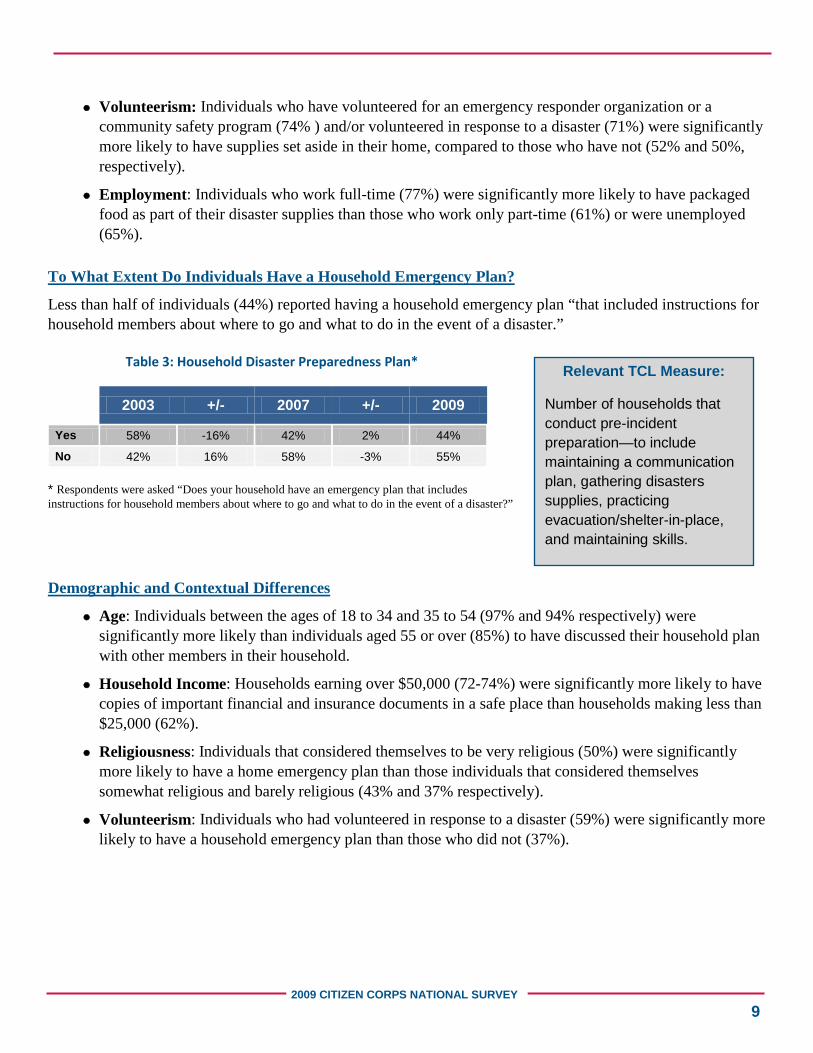
Relevant TCL Measure:
Number of households that conduct pre-incident preparation—to include maintaining a communication plan, gathering disasters supplies, practicing evacuation/shelter-in-place, and maintaining skills.
• Volunteerism: Individuals who have volunteered for an emergency responder organization or a community safety program (74% ) and/or volunteered in response to a disaster (71%) were significantly more likely to have supplies set aside in their home, compared to those who have not (52% and 50%, respectively).
• Employment: Individuals who work full-time (77%) were significantly more likely to have packaged food as part of their disaster supplies than those who work only part-time (61%) or were unemployed (65%).
Less than half of individuals (44%) reported having a household emergency plan “that included instructions for household members about where to go and what to do in the event of a disaster.”
To What Extent Do Individuals Have a Household Emergency Plan?
Table 3: Household Disaster Preparedness Plan*
2003 +/- 2007 +/- 2009
Yes 58% -16% 42% 2% 44%
No 42% 16% 58% -3% 55% * Respondents were asked “Does your household have an emergency plan that includes instructions for household members about where to go and what to do in the event of a disaster?”
• Age: Individuals between the ages of 18 to 34 and 35 to 54 (97% and 94% respectively) were significantly more likely than individuals aged 55 or over (85%) to have discussed their household plan with other members in their household.
Demographic and Contextual Differences
• Household Income: Households earning over $50,000 (72-74%) were significantly more likely to have copies of important financial and insurance documents in a safe place than households making less than $25,000 (62%).
• Religiousness: Individuals that considered themselves to be very religious (50%) were significantly more likely to have a home emergency plan than those individuals that considered themselves somewhat religious and barely religious (43% and 37% respectively).
• Volunteerism: Individuals who had volunteered in response to a disaster (59%) were significantly more likely to have a household emergency plan than those who did not (37%).

10 2009 CITIZEN CORPS NATIONAL SURVEY
Relevant TCL Measures:
Jurisdiction’s population that is knowledgeable of workplace, school, and community emergency plans.
Number of households that conduct pre-incident preparation—to include maintaining a communication plan, gathering disaster supplies, practicing evacuation/shelter-in-place, and maintaining skills.
Number of citizens prepared to evacuate or relocate to designated shelter (to include citizens with special needs).
Participants were asked to rate their familiarity with community disaster preparedness plans and protocols. Consistent with the 2007 survey, respondents reported familiarity with alerts and warning systems (50%) and official sources of public safety information (38%). Some individuals (59%) who said they had a child attending a school outside of their home, including day care or part-time kindergarten, said they were aware of the details of the emergency or evacuation plan of their children’s school, including where the school planned to evacuate and how to get information about the child in the event of a disaster. Also similar to the 2007 survey results, respondents also reported being least familiar with community evacuation routes (58%) and shelter locations (54%). Questions new to the survey in 2009 showed that almost half of the respondents (48%) were familiar with how to get information regarding a public health emergency such as the H1N1 virus or swine flu, while only 34 percent of respondents were familiar with information regarding local hazards in their area.
How Familiar Are Individuals with Their Community’s Disaster Preparedness Plans and Protocols?
Table 4: Familiarity with Community Plans/Systems*
Most Familiar Least Familiar 2007 +/- 2009 2007 +/- 2009
Alerts and warning systems in your community 45% 5% 50% 33% -3% 30%
How to get local information about a public health emergency, such as the H1N1 virus or swine flu
--- --- 48% --- --- 31%
Official sources of public safety information 34% 4% 38% 43% -5% 38%
How to get help with evacuating or getting to a shelter
29% 4% 34% 49% 2% 47%
Information on what your local hazards are --- --- 34% --- --- 48%
Shelter locations near you 31% -1% 30% 54% 1% 54%
Community evacuation routes 26% 2% 28% 60% -2% 58%
* Each percentage represents top-and-bottom-box scores, respectively. Those stating 4 or 5 (top-box, most familiar) and 1 or 2 (bottom-box, least familiar) are measured on a scale of 1 to 5; with 5 being “very familiar” and 1 being “not at all familiar”). Respondents were asked “Using a scale of 1 to 5 with 5 being ‘very familiar’ and 1 being ‘not at all familiar,’ how familiar are you with…?”

11 2009 CITIZEN CORPS NATIONAL SURVEY
In early May, following news of the Spring 2009 H1N1 pandemic, participants were asked about the sources from which they received information regarding the pandemic. Results showed that 86 percent of respondents received information from a local media source. The next most common sources were an individual’s workplace (25%) followed by an individual’s school or childcare facility (23%).
Table 5: Sources for information on H1N1*
2009
Media 86%
Workplace 25%
Schools or Childcare Facilities 23%
Healthcare Provider 18%
Local Government Official 14%
Faith-Based Organization 7%
Neighborhood Association 3%
None 5%
Other 3%
*Not included in the 2003 and 2007 survey. These responses were unaided and asked as part of a multiple response question. Respondents were asked, “From which organizations in your community have you received information about the recent outbreak of the H1N1 virus or swine flu?”
• Age: Individuals ages 35 to 54 and 55 and older were significantly more likely to be very familiar with community evacuation routes than individuals ages 18 to 34 (20% and 21% compared to 10%). They were also significantly more likely to be very familiar with shelter locations (22% and 23% compared to 16 %).
Demographic and Contextual Differences
• Geography: Rural residents were significantly more likely to be very familiar with information on their local hazards (22%) and community evacuation routes (22%) than suburban residents (15% and 13%, respectively). Rural residents (24%) were also more likely to be very familiar with how to get help with evacuating or getting to a shelter than suburban residents (15%).
• Employment: Individuals who worked full-time (35%) were significantly more likely to be very familiar with community alerts and warning systems than those who were unemployed (25%).
Nearly one-quarter (23%) of individuals stated they had given some time in the past 12 months to support emergency responder organizations or an organization that focuses on community safety, such as Neighborhood Watch, which was a similar finding in the 2007 and 2003 surveys (23% and 22%, respectively). About one-third
What Is the Extent of Volunteer Support for Emergency Responders/Community Safety?
12 2009 CITIZEN CORPS NATIONAL SURVEY
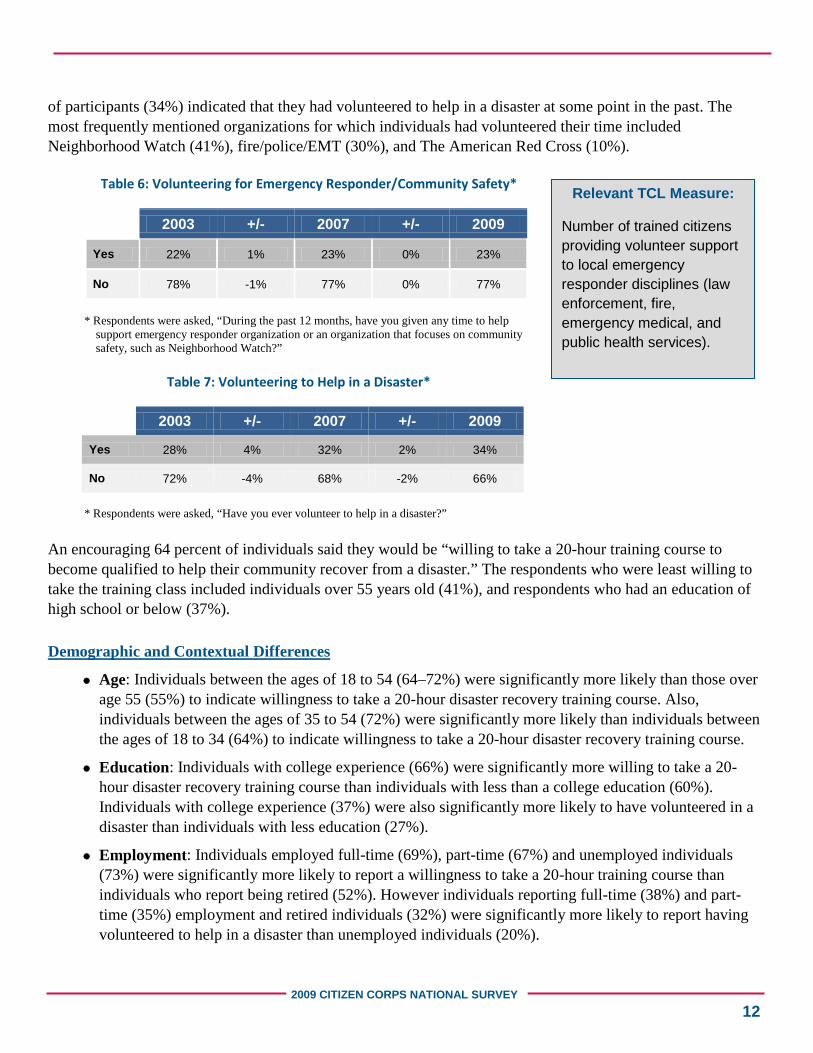
of participants (34%) indicated that they had volunteered to help in a disaster at some point in the past. The most frequently mentioned organizations for which individuals had volunteered their time included Neighborhood Watch (41%), fire/police/EMT (30%), and The American Red Cross (10%).
Table 6: Volunteering for Emergency Responder/Community Safety*
2003 +/- 2007 +/- 2009
Yes 22% 1% 23% 0% 23%
No 78% -1% 77% 0% 77%
* Respondents were asked, “During the past 12 months, have you given any time to help support emergency responder organization or an organization that focuses on community safety, such as Neighborhood Watch?”
Table 7: Volunteering to Help in a Disaster*
2003 +/- 2007 +/- 2009
Yes 28% 4% 32% 2% 34%
No 72% -4% 68% -2% 66%
* Respondents were asked, “Have you ever volunteer to help in a disaster?”
An encouraging 64 percent of individuals said they would be “willing to take a 20-hour training course to become qualified to help their community recover from a disaster.” The respondents who were least willing to take the training class included individuals over 55 years old (41%), and respondents who had an education of high school or below (37%).
• Age: Individuals between the ages of 18 to 54 (64–72%) were significantly more likely than those over age 55 (55%) to indicate willingness to take a 20-hour disaster recovery training course. Also, individuals between the ages of 35 to 54 (72%) were significantly more likely than individuals between the ages of 18 to 34 (64%) to indicate willingness to take a 20-hour disaster recovery training course.
Demographic and Contextual Differences
• Education: Individuals with college experience (66%) were significantly more willing to take a 20-hour disaster recovery training course than individuals with less than a college education (60%). Individuals with college experience (37%) were also significantly more likely to have volunteered in a disaster than individuals with less education (27%).
• Employment: Individuals employed full-time (69%), part-time (67%) and unemployed individuals (73%) were significantly more likely to report a willingness to take a 20-hour training course than individuals who report being retired (52%). However individuals reporting full-time (38%) and part-time (35%) employment and retired individuals (32%) were significantly more likely to report having volunteered to help in a disaster than unemployed individuals (20%).
Relevant TCL Measure:
Number of trained citizens providing volunteer support to local emergency responder disciplines (law enforcement, fire, emergency medical, and public health services).

13 2009 CITIZEN CORPS NATIONAL SURVEY
• Gender: Men (40%) were significantly more likely to have volunteered during a disaster than women (29%).
• Geography: Individuals living in rural residential areas (30%) were significantly more likely to have volunteered during the past 12 months to support an emergency responder organization than suburban and urban residents (19% and 22%, respectively). Urban residents (69%) were significantly more willing than rural residents (60%) to express willingness to take a 20-hour disaster recovery training course.
• Household income: Individuals with a household annual income of $75,000 (25%) or more and individuals with a household annual income of $25,000 - $49,000 (24%) were more likely to volunteer in the past 12 months than individuals with a household annual income of $25,000 or less (17%).
This section of the survey focused on the first 5 minutes following disasters that might occur without warning. These survey items also continued to probe individuals’ perceptions of their abilities to become prepared for a disaster (self-efficacy), as well as the response efficacy of the action—the belief that the preparedness actions they might take could make a difference in the event of a disaster. Participants were asked how confident they were in their own abilities and knowledge of what they should do in the first 5 minutes for four different types of disasters. Over 5 in 10 individuals 53% expressed confidence in their abilities to know what to do in the first 5 minutes of a sudden natural disaster such as an earthquake or tornado. Reported confidence levels of respondents were significantly lower for man-made disasters such as radiological explosions or dirty bombs, the release of chemical agents, or other explosions or bombs (20%, 26%, and 31% confidence, respectively). Individuals reported the least confidence in their abilities to handle an explosion of a radiological or dirty bomb, or release of a chemical agent (59% and 50% not confident, respectively). However, there is a general upward trend in confidence since the 2007 survey in respondent’s reported ability to know what to do in the first 5 minutes of a terrorist act or hazardous materials accident (19% compared to 20% and 23% compared to 26%, respectively). There was a slight decrease in reported confidence levels for explosions/bombs and a sudden natural disaster (33% to 31% and 57% to 53%, comparatively).
Do Individuals Know What To Do in the First Five Minutes After Specific Types of Disasters (Natural, Radiological, Explosion, or Chemical Release)?

14 2009 CITIZEN CORPS NATIONAL SURVEY
Table 8: Confidence in Knowledge of How to Respond in the First Five Minutes*
Confident Not Confident 2007 +/- 2009 2007 +/- 2009
A sudden national disaster such as an earthquake or tornado that occurs without warning
57% -4% 53% 18% 4% 22%
An explosion or bomb 33% -2% 31% 42% 2% 44%
A hazardous material accident such as the release of a chemical agent
23% 3% 26% 59% -9% 50%
A terrorist act such as an explosion of a radiological or dirty bomb
19% 1% 20% 62% -3% 59%
*Each percentage represents top-and-bottom-box scores, respectively. Those stating 4 or 5 (top-box, confident) and 1 or 2 (bottom-box, not confident) are measured on a scale of 1 to 5; with 5 being “very confident” and 1 being “not at all confident”). Respondents were asked “How confident are you in your ability to know what to do in the first 5 minutes of…?”
• Education: Individuals with no college experience (13%) were significantly more likely to report being very confident in their abilities to know what to do in the first 5 minutes of a radiological/dirty bomb explosion than those with more educational experience (7%).
Demographic and Contextual Differences
• Gender: Men were significantly more likely to report being very confident in their abilities to know what to do in the first 5 minutes of any type of disaster (confidence scores for different types of disasters ranged from 12–36%) than women (confidence scores for different types of disaster ranged from 6–20%).
• Geography: Rural residents were significantly more likely to report being very confident in their abilities to know what to do in the first 5 minutes of a radiological/dirty bomb explosion (11%) and a release of a chemical agent (17%) than those living in suburban residential areas (6% and 10%, respectively).
Volunteerism: Those who had volunteered in their community safety programs were significantly more confident in their abilities to know what to do in the first 5 minutes of any type of disaster (13–36%) than those who had not (8–25%). Those who had also volunteered in response to a disaster were also significantly more confident across all disaster categories (12–36%).

15 2009 CITIZEN CORPS NATIONAL SURVEY
Relevant TCL Measures:
Jurisdiction’s population that is knowledgeable of workplace, school, and community emergency plans.
Number of households that conduct pre-incident preparation—to include maintaining a communication plan, gathering disaster supplies, practicing evacuation/shelter-in-place, and maintaining skills.
Number of citizens prepared to evacuate or relocate to designated shelter (to include citizens with special needs).
Participants were asked if they had participated in a variety of disaster-related drills in their home, workplace, or school in the past 12 months. While 4 in 10 individuals (42%) reported having participated in a workplace evacuation drill, only 27 percent had participated in a workplace shelter-in-place drill. Even fewer individuals had participated in school- or home-based shelter-in-place drills (14% and 10%, respectively). Only 14 percent reported having participated in a home evacuation drill. Compared to 2007, there was little change in the percent of respondents who reported having participated in each type of drill or exercise. In the case of a school evacuation drill there was a slight increase of 4 percent in 2009 compared to 2007.
What Is the Extent of Participation in Preparedness Drills/Exercises?
Table 9: Participation in Drills*
2007 +/- 2009
Workplace evacuation drill 41% 1% 42%
Workplace shelter-in-place drill 27% 0% 27%
School evacuation drill 19% 4% 23%
School shelter-in-place drill 14% 0% 14%
Home evacuation drill 13% 1% 14%
Home shelter in place drill 10% 0% 10%
*Respondents indicating they had participated in the specific type of drill in the past 12 months.
• Age: Individuals between the ages of 18 to 54 (14–19%) were significantly more likely to have participated in a home evacuation drill than older individuals (8%).
Demographic and Contextual Differences
• Employment: Individuals who worked full-time (17%) and part-time (14%) as well as students (17%) were all significantly more likely to have participated in a home evacuation drill than retired (8%) individuals. In addition, individuals who worked full-time (17%) were significantly more likely to have participated in a home evacuation drill than unemployed individuals (10%). Individuals reporting to be full-time employees (13%) were also significantly more likely than the unemployed (7%) and retired (7%) to have participated in a home shelter-in-place drill.
• Race: Black individuals (55%) were significantly more likely to have participated in a workplace evacuation drill than White individuals (40%).
• Religiousness: Individuals reporting to be barely or not at all religious (92%) were significantly more likely than individuals reporting to be somewhat religious (85%) to report having never participated in a

16 2009 CITIZEN CORPS NATIONAL SURVEY
home evacuation drill. Very religious individuals (13%) and somewhat religious individuals (9%) were significantly more likely to report having participated in a home shelter-in-place drill than barely or not at all religious individuals (5%). Very religious individuals (13%) were significantly more likely to report having participated in a home shelter-in-place drill than somewhat religious (9%) individuals.
• Income: Individuals who reported earning $25,000-$49,000 (88%) and individuals who reported earning more than $75,000 (87%) were significantly more likely to never have participated in a school shelter in place drill than individuals making less than $25,000 (74%).
Participants were asked if they had engaged in any sort of emergency-related training programs in the past 2 years. Attending first aid skills training was found to be the most common (37%). Cardiopulmonary resuscitation (CPR) training was the next most common response (36%). Approximately 1 in 8 individuals (13%) had attended training as part of a Community Emergency Response Team or CERT. These findings were similar to those from the 2003 and 2007 surveys.
How Many Individuals Have Received Training in Preparation for a Disaster?
Table 10: Preparedness Training Programs*
2003 +/- 2007 +/- 2009
Attended first aid skills training 37% -4% 33% 4% 37%
Attended CPR training 37% -2% 35% 1% 36%
Talked about getting prepared with others in their community --- --- --- --- 35%
Attended a meeting on how to be better prepared for a disaster --- --- 23% 2% 25%
Attended training as part of a Community Emergency Response Team or CERT
10% 0% 10% 3% 13%
*Respondents indicating they had conducted the action in the past 2 years.
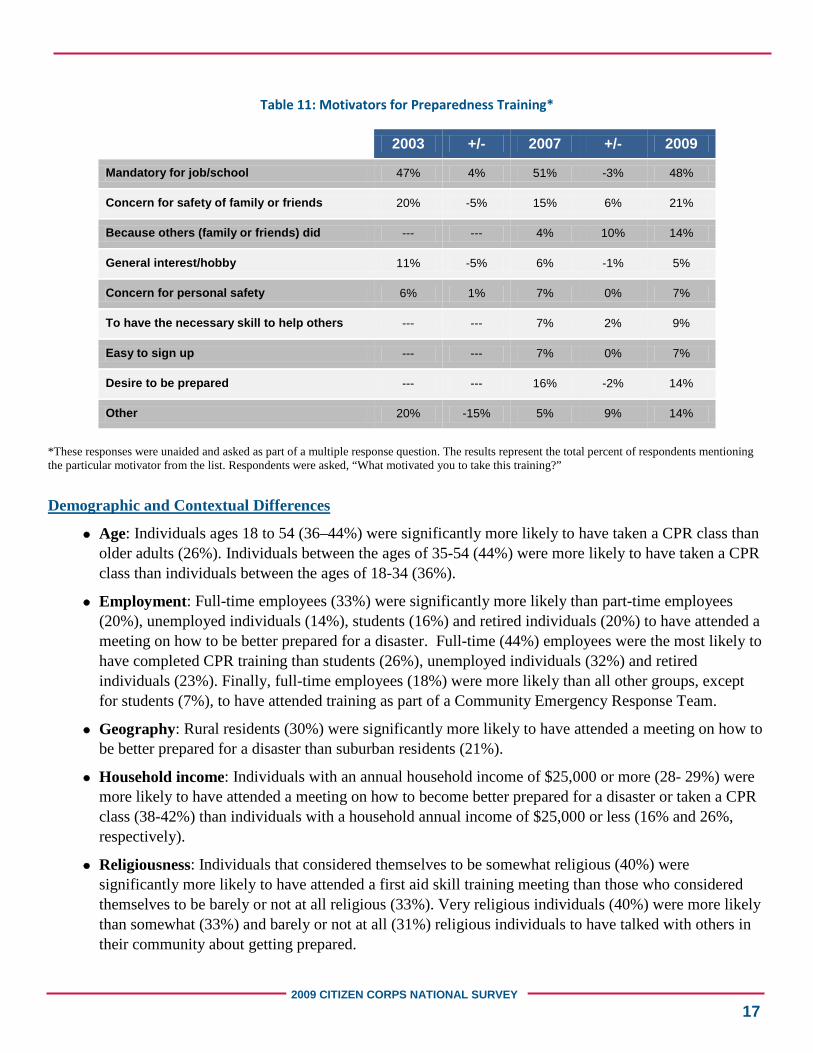
Most individuals taking preparedness classes or emergency training attributed their motivation to a mandatory function of their job or school (48%). The second most common response was for the concern and safety of family or others (21%). Some respondents (14%) also reported taking preparedness training because family or friends did. Other responses included reasons for taking training as an increased awareness of training from the media (2%) and a work, community, or school-based position that prompted them to take the training (3%).
Relevant TCL Measures:
Number of citizens trained in basic first aid.
Number of citizens educated and trained in risk-based capabilities for high-threat incidents in their area, including natural hazards, technological hazards, and terrorism.
17 2009 CITIZEN CORPS NATIONAL SURVEY
Table 11: Motivators for Preparedness Training*
2003 +/- 2007 +/- 2009
Mandatory for job/school 47% 4% 51% -3% 48%
Concern for safety of family or friends 20% -5% 15% 6% 21%
Because others (family or friends) did --- --- 4% 10% 14%
General interest/hobby 11% -5% 6% -1% 5%
Concern for personal safety 6% 1% 7% 0% 7%
To have the necessary skill to help others --- --- 7% 2% 9%
Easy to sign up --- --- 7% 0% 7%
Desire to be prepared --- --- 16% -2% 14%
Other 20% -15% 5% 9% 14%
*These responses were unaided and asked as part of a multiple response question. The results represent the total percent of respondents mentioning the particular motivator from the list. Respondents were asked, “What motivated you to take this training?”
• Age: Individuals ages 18 to 54 (36–44%) were significantly more likely to have taken a CPR class than older adults (26%). Individuals between the ages of 35-54 (44%) were more likely to have taken a CPR class than individuals between the ages of 18-34 (36%).
Demographic and Contextual Differences
• Employment: Full-time employees (33%) were significantly more likely than part-time employees (20%), unemployed individuals (14%), students (16%) and retired individuals (20%) to have attended a meeting on how to be better prepared for a disaster. Full-time (44%) employees were the most likely to have completed CPR training than students (26%), unemployed individuals (32%) and retired individuals (23%). Finally, full-time employees (18%) were more likely than all other groups, except for students (7%), to have attended training as part of a Community Emergency Response Team.
• Geography: Rural residents (30%) were significantly more likely to have attended a meeting on how to be better prepared for a disaster than suburban residents (21%).
• Household income: Individuals with an annual household income of $25,000 or more (28- 29%) were more likely to have attended a meeting on how to become better prepared for a disaster or taken a CPR class (38-42%) than individuals with a household annual income of $25,000 or less (16% and 26%, respectively).
• Religiousness: Individuals that considered themselves to be somewhat religious (40%) were significantly more likely to have attended a first aid skill training meeting than those who considered themselves to be barely or not at all religious (33%). Very religious individuals (40%) were more likely than somewhat (33%) and barely or not at all (31%) religious individuals to have talked with others in their community about getting prepared.

18 2009 CITIZEN CORPS NATIONAL SURVEY
Past research has found that often, participants perceive themselves to be more prepared than their reported actions would indicate. To examine this finding further, the Citizen Corps National Survey asked individuals to name specific preparedness actions that they had taken including household planning, gathering supplies, preparedness training, volunteering, as well as to self-assess their preparedness stage (from contemplating becoming prepared to having been prepared for the last six months). Individuals’ perceptions of their level of preparedness were compared with their self-reported specific preparedness activities. Individuals who reported being prepared were indeed more likely to have taken specific preparedness measures. It should be noted, however, that even those who reported being prepared were lacking some critical elements of preparedness, e.g. just over a third who said they “have been prepared for at least the past six months” did not have a household plan, nearly 80 percent had not conducted a home evacuation drill, and nearly 70 percent did not know their community’s evacuation routes. Compared to those who had not prepared, but intend to prepare in the next one to six months, the respondents who stated they had been prepared for at least the last six months were significantly more likely to:
How Does Perceived Preparedness Compare with Actual Preparedness?
• Have disaster supplies in their home, car, and workplace
• Home: 84 percent compared to 40 percent
• Car: 49 percent compared to 25 percent
• Workplace: 55 percent compared to 45 percent
• Have a household plan and have discussed it with household members
• Have a household plan: 65 percent compared to 33 percent
• Of those with a plan, discussed plan with household members: 95 percent compared to 90 percent
• Have copies of important financials and insurance documents: 86 percent compared to 65 percent
• Be aware of community preparedness resources
• Alerts and warning systems: 44 percent compared to 44 percent
• Official sources of public safety information: 32 percent compared to 27 percent
• Evacuation routes: 27 percent compared to 21 percent
• Shelter locations: 32 percent compared to 27 percent
• How to get help with evacuating or getting to a shelter: 30 percent compared to 26 percent
• Children’s school emergency/evacuation plan: 72 percent compared to 51 percent
• Be confident in their abilities to handle each type of disaster
• Dirty bombs: 32 percent compared to 13 percent
• Chemical agents: 39 percent compared 18 percent
• Explosion/bombs: 44 percent compared to 20 percent
• Natural disaster: 72 percent compared to 36 percent

19 2009 CITIZEN CORPS NATIONAL SURVEY
• Be confident that preparing for disasters will make a difference
• Dirty bombs: 50 percent compared to 35 percent
• Chemical agents: 56 percent compared 52 percent
• Explosion/bombs: 54 percent compared to 48 percent
• Natural disaster: 78 percent compared to 67 percent
• Severe infectious disease: 58 percent compared to 54 percent
• Have taken training
• Preparedness meeting: 41 percent compared to 15 percent
• CPR training: 46 percent compared to 35 percent
• First aid skills training: 49 percent compared to 34 percent
• CERT training: 21 percent compared to 10 percent
• Willing to take a 20-hour training: 66 percent compared to 68 percent
• Have taken part in drills or exercises
• Home evacuation: 23 percent compared to 8 percent
• Home shelter-in-place: 19 percent compared to 4 percent
• Workplace shelter-in-place: 33 percent compared to 29 percent
• School evacuation: 24 percent compared to 24 percent
• School shelter-in-place: 17 percent compared to 13 percent
• Have volunteered
• Community safety: 35 percent compared to 16 percent
• Disaster response: 51 percent compared to 27 percent
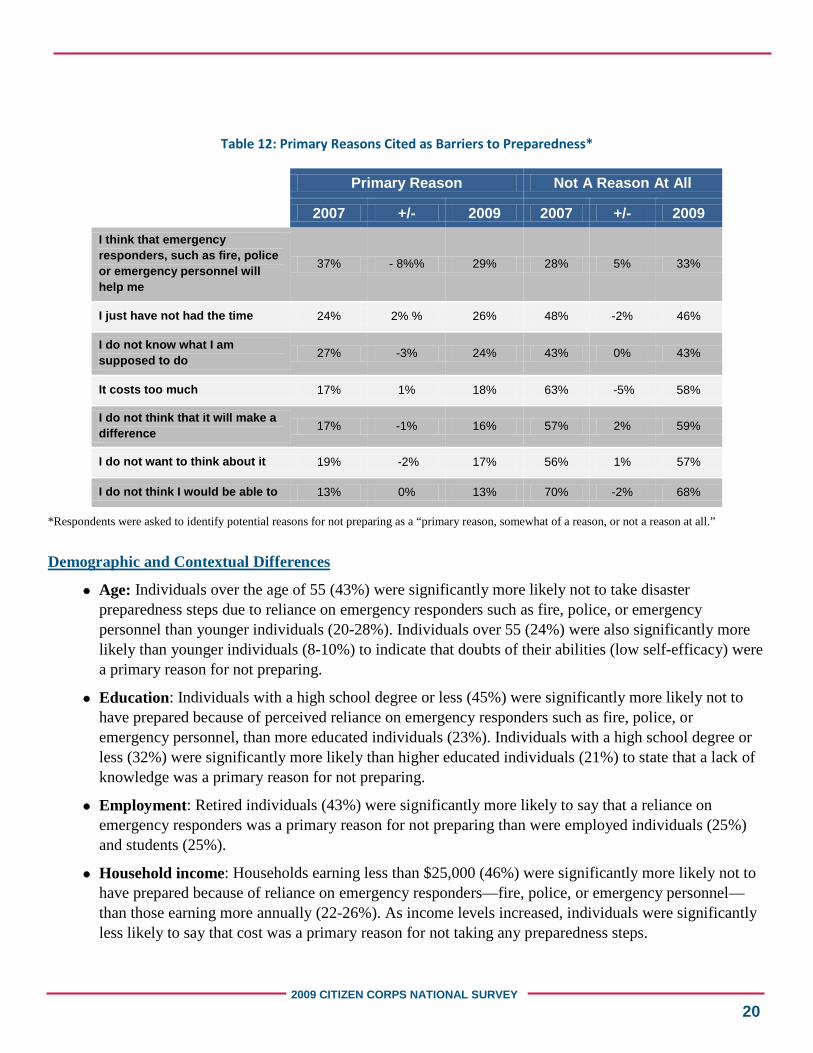
In order to identify the barriers to preparedness, respondents who said they had not yet begun to prepare or were not intending to prepare were asked to respond to a list of possible reasons for why they had not taken any preparedness steps. They were asked to indicate whether the stated barrier was a primary reason, somewhat of a reason, or not a reason at all. The most commonly mentioned primary reason for not preparing was the belief that emergency responders such as fire, police, or emergency personnel would help them (29%). Other primary reasons included lack of knowledge (24%) and lack of time (26%). These findings are similar to the 2007 survey findings with a notable 8% decrease in reliance on emergency responders from 2007 to 2009.
What Are the Barriers to Undertaking Disaster Preparedness Activities?
What Barriers Do Individuals Perceive in Preparing for Disasters?
20 2009 CITIZEN CORPS NATIONAL SURVEY
Table 12: Primary Reasons Cited as Barriers to Preparedness*
Primary Reason Not A Reason At All
2007 +/- 2009 2007 +/- 2009 I think that emergency responders, such as fire, police or emergency personnel will help me
37% - 8%% 29% 28% 5% 33%
I just have not had the time 24% 2% % 26% 48% -2% 46%
I do not know what I am supposed to do 27% -3% 24% 43% 0% 43%
It costs too much 17% 1% 18% 63% -5% 58%
I do not think that it will make a difference 17% -1% 16% 57% 2% 59%
I do not want to think about it 19% -2% 17% 56% 1% 57%
I do not think I would be able to 13% 0% 13% 70% -2% 68%
*Respondents were asked to identify potential reasons for not preparing as a “primary reason, somewhat of a reason, or not a reason at all.”
• Age: Individuals over the age of 55 (43%) were significantly more likely not to take disaster preparedness steps due to reliance on emergency responders such as fire, police, or emergency personnel than younger individuals (20-28%). Individuals over 55 (24%) were also significantly more likely than younger individuals (8-10%) to indicate that doubts of their abilities (low self-efficacy) were a primary reason for not preparing.
Demographic and Contextual Differences
• Education: Individuals with a high school degree or less (45%) were significantly more likely not to have prepared because of perceived reliance on emergency responders such as fire, police, or emergency personnel, than more educated individuals (23%). Individuals with a high school degree or less (32%) were significantly more likely than higher educated individuals (21%) to state that a lack of knowledge was a primary reason for not preparing.
• Employment: Retired individuals (43%) were significantly more likely to say that a reliance on emergency responders was a primary reason for not preparing than were employed individuals (25%) and students (25%).
• Household income: Households earning less than $25,000 (46%) were significantly more likely not to have prepared because of reliance on emergency responders—fire, police, or emergency personnel—than those earning more annually (22-26%). As income levels increased, individuals were significantly less likely to say that cost was a primary reason for not taking any preparedness steps.

21 2009 CITIZEN CORPS NATIONAL SURVEY
Participants who indicated they had not taken any type of disaster preparedness training were asked what had prevented them from doing so. Unaided responses were then coded according to predetermined categories. Of these participants, the most common reasons given were that it was difficult for them to get information on what to do (31%), they had not had the time (22%), or they hadn’t thought about it (18%). Few respondents (4%) provided as a reason that they did not believe training would be effective or that the cost for training was too much (2%). Other responses included the respondent reporting that they already knew how to be prepared (12%) and being physically unable to get to training (5%) as barriers for taking preparedness training.
What Are the Barriers to Taking Preparedness Training?
Table 13: Barriers to Preparedness Training*
2003 +/- 2007 +/- 2009
Difficult to get information on what to do 14% 1% 15% 16% 31%
Lack of time 19% -3% 16% 6% 22%
Haven't thought about it --- --- 15% 3% 18%
Don’t think it is important 16% -11% 5% 4% 9%
Don't think it will be effective --- --- 2% 2% 4%
Lack of money/too expensive 2% 0% 2% 0% 2%
Other 53% 0% 53% -36% 17%
*These responses were unaided and asked as part of a multiple response question. The results represent the total percent of respondents mentioning the particular motivator from the list. Respondents were asked, “What is the main reason you have not received any preparedness training?”
• Age: Individuals ages 18–34 (32%) were more likely to report a lack of time being a primary barrier to not taking part in any preparedness training than individuals 55+ (21%).
Demographic and Contextual Differences
• Education: Individuals with less than a high school degree (9%) compared to individuals with some college experience (4%) were more likely to report being physically unable to get training as a primary barrier to taking part in preparedness training.
• Gender: Males (12%) were significantly more likely than females (7%) to report that they were not participating in preparedness training because they did not think it was important.
• Employment: Full-time employees (36%), part-time employees (13%), students (26%) and unemployed individuals (24%) were significantly more likely to report lack of time as the primary barrier to taking preparedness training courses than retired individuals (5%).

22 2009 CITIZEN CORPS NATIONAL SURVEY
Participants were asked to describe how much they believed they would rely on certain groups of individuals or organizations for assistance in the first 72 hours following a disaster. A large majority of individuals (70%) indicated that they would rely on household members most, while 61 percent of respondents expect to rely on fire, police, and emergency personnel. Respondents also expect to rely on people in their neighborhood (49%), nonprofit organizations (42%), faith-based communities (39%), and state and federal government agencies, including FEMA (36%).
Who Will Individuals Look To For Help During the First 72 Hours?
Table 14: Expectation of Reliance on Others*
2003 +/- 2007 +/- 2009 Household members 68% 3% 71% -1% 70%
Fire, police, and emergency personnel 62% -5% 57% 4% 61%
People in my neighborhood 39% 9% 48% 1% 49%
Nonprofit organizations, such as The American Red Cross or the Salvation Army
--- --- 40% 2% 42%
Faith-based community, such as congregation --- --- 39% 0% 39%
State and federal government agencies, including FEMA 34% -4% 30% 6% 36%
*Each percentage represents top-box scores. Those stating 4 or 5 (top-box, most relied upon) are on a scale of 1 to 5, with 5 being “expect to rely on a great deal” and 1 being “do not expect to rely on at all” for assistance in the first 72 hours following a disaster. Respondents were asked, “In the first 72 hours following a disaster, please indicate how much you would expect to rely on the following for assistance.”
• Education: Individuals with no college experience were significantly more likely than individuals with some college experience to expect to rely a great deal on state and federal government agencies (28% compared to 17%), nonprofit organizations (34% compared to 16%), people in their neighborhood (31% compared to 25%), their faith-based community (36% compared to 20%), and fire, police, and emergency personnel (48% compared to 34%).
Demographic and Contextual Differences
• Gender: Women were significantly more likely than men to expect to rely on household members (61% compared to 49%), people in their neighborhood (29% compared to 24%), nonprofit organizations (25% compared to 15%), their faith-based community (28% compared to 19%) and fire, police, and emergency personnel (42% compared to 32%).
• Geography: Rural residents were significantly more likely than suburban individuals to expect to rely a great deal nonprofit organizations (22% compared to 15%) in the first 72 hours of a disaster.
• Household income: Individuals with an annual income greater than $75,000 (58%) were significantly more likely than individuals making less than $25,000 (50%) to expect to rely a great deal on their household members. Individuals with an annual household income of less than $25,000 were
23 2009 CITIZEN CORPS NATIONAL SURVEY
significantly more likely than individuals making over $75,000 to rely a great deal on state and federal government agencies (28% compared to 17%), fire, police, and emergency personnel (45% compared to 35%), their faith-based community (31% compared to 17%), and nonprofit organization, (31% compared to 14%) in the first 72 hours of a disaster.
• Race: Black individuals were significantly more likely than White individuals to expect to rely a great deal on their faith-based community (40% compared to 22%), nonprofit organizations (34% compared to 17%), fire, police, and emergency personnel (48% compared to 35%) and state and federal government agencies (36% compared to 16%) in the first 72 hours of a disaster.
• Religiousness: Very religious individuals were more likely to rely on their faith-based communities (45%), household members (60%) and nonprofit organizations (24%) as compared to those who are barely or not at all religious (7%, 51%, and 14%, respectively).
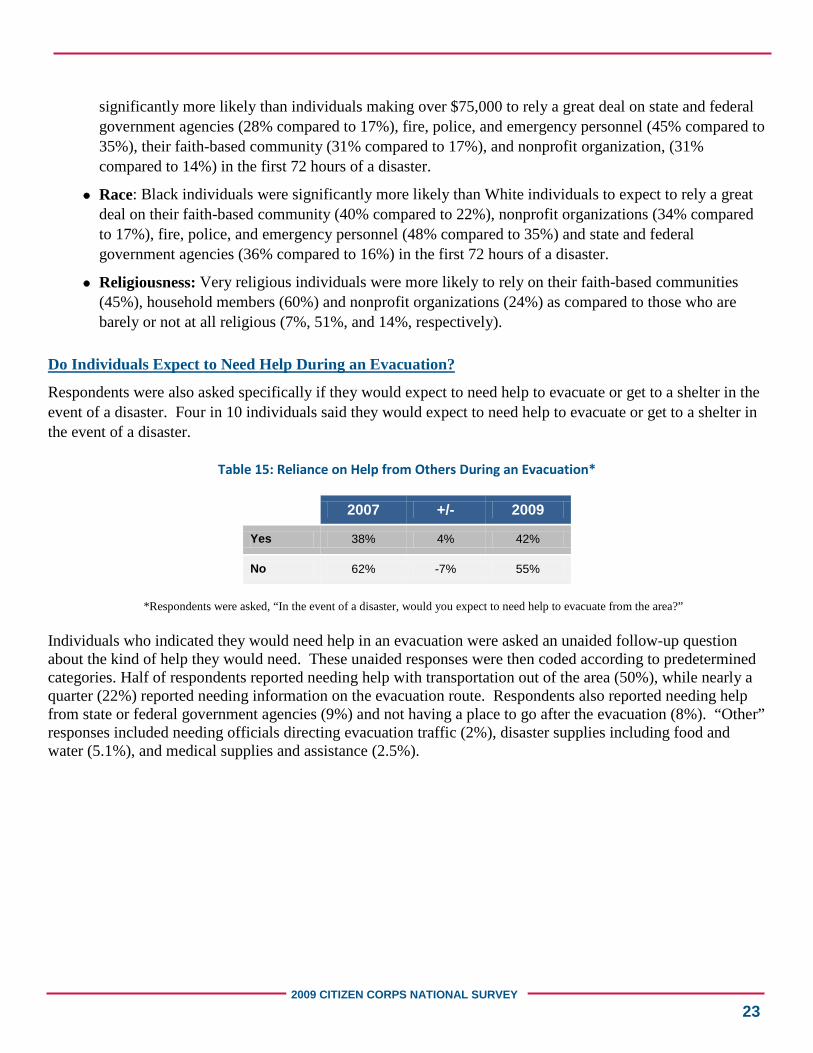
Respondents were also asked specifically if they would expect to need help to evacuate or get to a shelter in the event of a disaster. Four in 10 individuals said they would expect to need help to evacuate or get to a shelter in the event of a disaster.
Do Individuals Expect to Need Help During an Evacuation?
Table 15: Reliance on Help from Others During an Evacuation*
2007 +/- 2009
Yes 38% 4% 42%
No 62% -7% 55%
*Respondents were asked, “In the event of a disaster, would you expect to need help to evacuate from the area?”
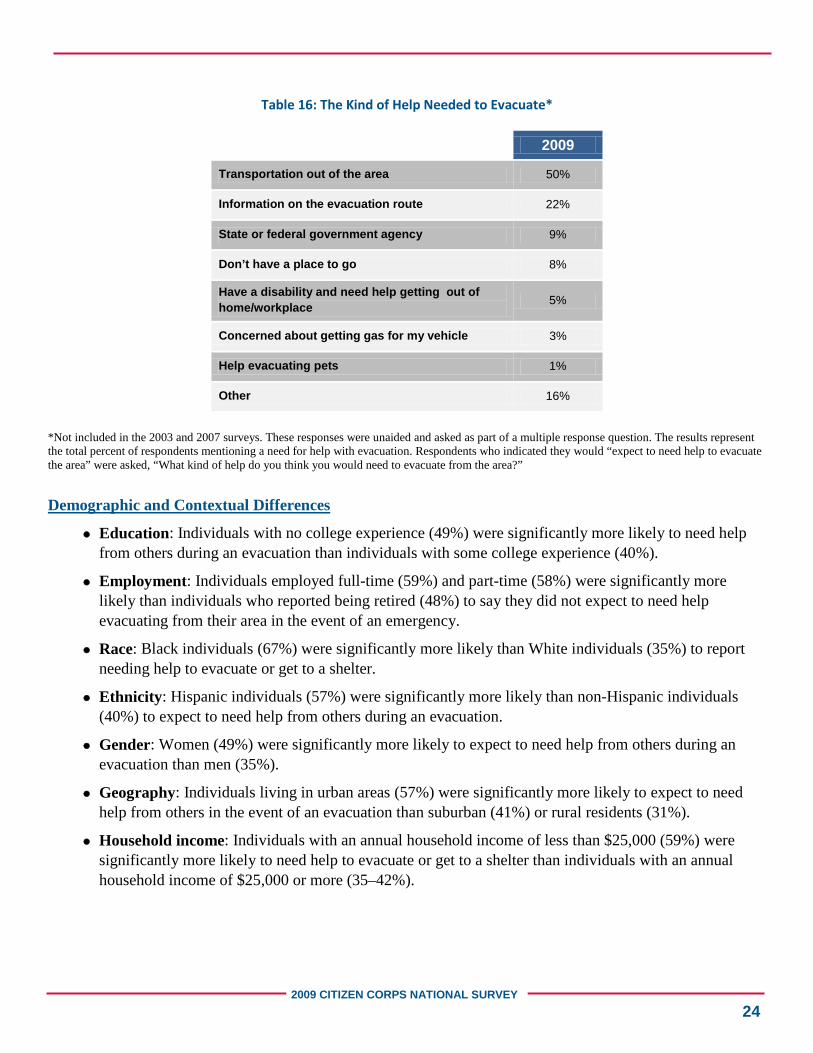
Individuals who indicated they would need help in an evacuation were asked an unaided follow-up question about the kind of help they would need. These unaided responses were then coded according to predetermined categories. Half of respondents reported needing help with transportation out of the area (50%), while nearly a quarter (22%) reported needing information on the evacuation route. Respondents also reported needing help from state or federal government agencies (9%) and not having a place to go after the evacuation (8%). “Other” responses included needing officials directing evacuation traffic (2%), disaster supplies including food and water (5.1%), and medical supplies and assistance (2.5%).
24 2009 CITIZEN CORPS NATIONAL SURVEY
Table 16: The Kind of Help Needed to Evacuate*
2009
Transportation out of the area 50%
Information on the evacuation route 22%
State or federal government agency 9%
Don’t have a place to go 8%
Have a disability and need help getting out of home/workplace 5%
Concerned about getting gas for my vehicle 3%
Help evacuating pets 1%
Other 16%
*Not included in the 2003 and 2007 surveys. These responses were unaided and asked as part of a multiple response question. The results represent the total percent of respondents mentioning a need for help with evacuation. Respondents who indicated they would “expect to need help to evacuate the area” were asked, “What kind of help do you think you would need to evacuate from the area?”
• Education: Individuals with no college experience (49%) were significantly more likely to need help from others during an evacuation than individuals with some college experience (40%).
Demographic and Contextual Differences
• Employment: Individuals employed full-time (59%) and part-time (58%) were significantly more likely than individuals who reported being retired (48%) to say they did not expect to need help evacuating from their area in the event of an emergency.
• Race: Black individuals (67%) were significantly more likely than White individuals (35%) to report needing help to evacuate or get to a shelter.
• Ethnicity: Hispanic individuals (57%) were significantly more likely than non-Hispanic individuals (40%) to expect to need help from others during an evacuation.
• Gender: Women (49%) were significantly more likely to expect to need help from others during an evacuation than men (35%).
• Geography: Individuals living in urban areas (57%) were significantly more likely to expect to need help from others in the event of an evacuation than suburban (41%) or rural residents (31%).
• Household income: Individuals with an annual household income of less than $25,000 (59%) were significantly more likely to need help to evacuate or get to a shelter than individuals with an annual household income of $25,000 or more (35–42%).

25 2009 CITIZEN CORPS NATIONAL SURVEY
The Citizen Corps National Survey assesses an individual’s perceptions of their vulnerability to four different categories of disasters. Participants were asked to state how likely (using a scale of 1 to 5, with 1 signifying “not likely at all” and 5 signifying “very likely”) they thought it was that a specific type of disaster would ever occur in their community.
What Are Individuals’ Perceptions of Risks of Different Types of Disasters?
Of the four specific types of disasters investigated, a natural disaster such as an earthquake, flood, hurricane, tornado, or wildfire was rated as the disaster most likely to occur. It is interesting to note, however, that 4 in 10 40% reported thinking that a natural disaster would ever affect their community. Only 14 percent of individuals felt a terrorist act would ever occur in their community. These low levels of perceived susceptibility were also echoed in the responses related to a severe disease outbreak and hazardous materials accident (28% and 23%, respectively). These findings are consistent with the 2007 survey findings with a notable increase in the perception of risk of a severe disease outbreak from 2007 to 2009, which may be due to the Spring 2009 H1N1 pandemic occurring during the survey fielding. Further analysis of the 2009 survey results will provide additional insight to this possible correlation.
Figure 1: Perception of the Risk of a Disaster*
*Likelihood each disaster would occur, top-box scores (those stating 4 or 5, on a scale of 1 to 5; 5 being “very likely” that the disaster would occur and 1 being “not likely at all” that the disaster would occur). Respondents were asked, “On a scale of 1 to 5, with 5 being ‘very likely’ and 1 being ‘not likely at all,’ how likely do you think some type of …will ever occur in your community?”
• Age: Individuals ages 35–54 (26%) were significantly more likely than older individuals (22%) to believe that a natural disaster was very likely ever to occur in their community.
Demographic and Contextual Differences
37%
19%
22%
20%
40%
14%
23%
28%
0% 10% 20% 30% 40% 50%
Natural Disaster
Act of Terrorism
Hazardous Materials Accident
Disease Outbreak
2009 Survey 2007 Survey
What is the Perception of Vulnerability to Different Types of Disasters? How Do People Perceive the Utility of Preparedness?

26 2009 CITIZEN CORPS NATIONAL SURVEY
• Education: Individuals with less than a college education were significantly more likely to believe that a terrorist and hazardous materials disaster would ever occur in their community (11% and 14%, respectively) than individuals with college experience (5% and 8 %, respectively).
• Geography: Urban residents (13%) were significantly more likely than suburban residents (7%) and rural residents (8%) to believe that a hazardous materials accident was very likely ever to occur in their community. Rural residents (42%) were significantly more likely than suburban residents (32%) and urban residents (26%) to believe that an act of terrorism was not at all likely ever to occur in their community.
• Household Income: Households earning less than $25,000 annually were significantly more likely than individuals earning more to believe that a terrorist attack (11%), hazardous materials accident (14%), and disease outbreak (18%) was very likely ever to occur than households with an income of $75,000 or more (5%, 6%, and 8%, respectively).
• Race: Blacks were significantly more likely than Whites to believe that a terrorist attack (15% and 5% respectively), hazardous materials accident (18% and 7%, respectively), and disease outbreak (20% and 10%, respectively) were very likely ever to occur in their communities.
• Volunteerism: Individuals that had volunteered in response to a disaster (29%) were significantly more likely to believe that a natural disaster was very likely to occur in their community than those who had not (20%). Also, individuals that had volunteered for organizations focusing on community safety were significantly more likely to believe that a natural disaster (28%) and a hazardous materials accident (13%) were very likely ever to occur in their community, as opposed to those who had not (21% and 8%, respectively).
To explore further the potential effect of individuals’ perception of the likely severity of different types of disasters, individuals were asked a new question in 2009 about their perception of how severe the impact of different types of disasters would be on their lives (using a scale of 1 to 5, with 5 being “very severe” and 1 being “not severe at all”). The same four types of disasters: a natural disaster, an act of terrorism, a hazardous materials accident, and a severe disease outbreak, the survey asked if the disaster occurred in your community, “how severe do you think the impact would be to you.” Over half of participants (59%) believed that the impact of an act of terrorism in their community would be severe (rated a 4 or 5 on a 5 point scale), followed by a natural disaster (50%). One-quarter of individuals perceived that a contagious disease outbreak would not be very severe (25%) and 3 in 10 individuals did not believe a hazardous materials accident would be severe (31%).
What Is the Perceived Severity of the Impact of Different Types of Disasters?

27 2009 CITIZEN CORPS NATIONAL SURVEY
Figure 2: Perception of the Severity of Impact of Disaster*
*Perceived severity of the impact of each disaster, top-box scores (those stating 4 or 5, on a scale of 1 to 5; 5 being “very severe” disaster and 1 being “not severe at all” for a perceived impact of a disaster). Respondents were asked, “If a…were to happen in your community, how severe do you think the impact would be to you?”
• Age: More individuals older than 55 significantly felt that the impact of a natural disaster would be not severe at all (9%) as compared to the other age groups.
Demographics and Contextual Differences
• Gender: Across all disaster categories, women significantly felt that the impact of disasters in their community would be very severe for them, with the most severe disaster being a terrorist attack (38%).
• Geography: Urban (22–27%) and rural (20–27%) perceived all of the disaster types, excluding terrorism, to be severe more than suburban residents (13-20%).
• Household Income: Individuals with a household income less than $25,000 (13%) were significantly more likely than those earning more to perceive that a disease outbreak would not be severe to them at all (4–7%).
• Race: Black individuals were significantly more likely to feel that a hazardous materials accident would severely impact them, as compared to White individuals (26% versus 16%, respectively).
• Ethnicity: Hispanic individuals (36%) were significantly more likely to feel that a natural disaster would have a severe impact on them personally, as compared to non-Hispanic individuals (22%).
• Religiousness: Across all disaster categories, except for a severe disease outbreak, individuals who reported being very religious felt that the impact of disasters in their community would be very severe for them (20–37%), as compared to those who were barely or not at all religious (14–27%).
• Volunteerism: Individuals who had never volunteered in response to a disaster (35%) were significantly more likely to believe that an act of terrorism would severely impact them personally, as compared to those who had volunteered in response to a disaster (29%).
50%
59%
37%
44%
20% 19%
31%25%
0%
10%
20%
30%
40%
50%
60%
70%
Natural Disaster
Act of Terrorism
Hazardous Materials Accident
Disease Outbreak
High Perceived Severity
Low Perceived Severity

28 2009 CITIZEN CORPS NATIONAL SURVEY
The survey sought to measure individuals’ perceptions of the efficacy or utility of preparing in advance for a disaster. Participants were asked whether preparation, planning, and emergency supplies would help them handle the situation in the event of four different categories of disasters—a natural disaster, an act of terrorism, a hazardous materials accident, and a severe disease outbreak. Roughly 8 out of 10 82% individuals felt that preparation, planning, and emergency supplies would help them handle a natural disaster. Eleven percent of individuals believed they could handle a natural disaster without advance preparation. In response to dealing with an act of terrorism, 59 percent of individuals felt preparation, planning, and supplies would help them. This lower level of response efficacy for a terrorist event (lack of belief that recommended preparedness measures will mitigate the personal impact of a disaster) is coupled with relatively high levels of fatalism, with over one-third of individuals (35%) reporting the belief that nothing they do to prepare would help them handle an act of terrorism. While participants indicated greater response efficacy related to threats such as a severe disease outbreak or hazardous materials accidents (73% and 65%, respectively), about 1 out of 5 individuals believed that nothing would help them respond to those threats.
What Is the Perceived Utility of Advance Preparation for Different Types of Disasters?
Figure 3: Utility of Advance Preparations for Different Types of Disasters*
*Respondents were asked, “In a…which of the following statements best represents you belief?”
11%
4%
9%
8%
82%
59%
65%
73%
6%
35%
25%
18%
0% 20% 40% 60% 80%100%
Natural Disaster 2009
Act of Terrorism 2009
Hazardous Materials Accident 2009
Disease Outbreak 2009
I can handle the situation without any preparation
Preparation, planning, and emergency supplies will help me handle the situation
Nothing I do to prepare will help me handle the situation

29 2009 CITIZEN CORPS NATIONAL SURVEY
• Employment: Full-time employed individuals (69%) were significantly more likely to think preparation, planning, and emergency supplies would help them handle a hazardous materials accident than those who were unemployed (58%).
Demographic and Contextual Differences
• Gender: Men were significantly more likely than women to believe they could handle a natural disaster, terrorist attack, or a hazardous materials accident without any preparation (14% versus 9%; 6% versus 3%; and 11% versus 6%). Women (68%) were significantly more likely than men (62%) to feel that preparation, planning and emergency supplies would help them handle a hazardous materials accident.
• Geography: Rural residents (20%) were significantly more likely than urban (14%) to believe that nothing they could do would help them handle a severe disease outbreak.
• Household Income: Individuals with an annual household income of $75,000 or more were significantly more likely to believe that preparation, planning, and emergency supplies would help them handle a natural disaster (86%) or a hazardous materials accident (68%) than individuals with an annual household income of $25,000 or less (72% and 59%, respectively).
• Ethnicity: Hispanic individuals (12%) were significantly more likely to believe that nothing they do would help them prepare for a natural disaster, as compared to non-Hispanic individuals (6%).
• Religiousness: Individuals who reported being very religious were significantly more likely to think that preparation, planning, and emergency supplies would help them handle an act of terrorism (61)than those who are barely or not at all religious (54%).
• Volunteerism: Individuals who had never volunteered in a community safety program or in response to a major disaster were significantly more likely to believe that there is nothing they can do to help them prepare for a natural disaster (7% and 8%, respectively), as compared to those that have volunteered (3% and 4%, respectively).
Participants were also asked how much preparing in advance would help them be able to handle specific types of disasters: a terrorist act, a hazardous materials accident, an explosion or bomb, a highly contagious disease outbreak, and a natural disaster. Individuals felt that preparing for a natural disaster would help them the most (67%), compared to other types of disasters (45–52%). The disaster with which most individuals felt preparation would not help much at all was a terrorist attack (34%), compared to a natural disaster (13%) and a severe disease outbreak (24%).
What Is the Perceived Effectiveness of Advanced Preparation on Handling a Disaster?

30 2009 CITIZEN CORPS NATIONAL SURVEY
Table 17: Perceptions of Effectiveness of Advance Preparations*
Useful Not Useful
Natural Disaster 67% 13%
Terrorist Act 45% 34%
Hazardous Materials Accident 49% 29%
Explosion or Bomb 47% 32%
Disease Outbreak 52% 24%
*Utility of advance preparation for disasters, top-box scores (those stating 4 or 5, on a scale of 1 to 5; 5 being “very much” useful and 1 being “not at all” useful). Respondents were asked, “How much do you think preparing for a…will make a difference in how you handle the situation?”
• Age: Across all disasters, except for a severe disease outbreak, individuals ages 35-54 (33-47%) were significantly more likely than those over the age of 55 (29–39%) to think that preparing for a disaster would help them very much.
Demographic and Contextual Differences
• Household Income: Individuals with a household income of less than $25,000 were significantly more likely to think that preparing for a hazardous materials accident (40%) would help them very much, as compared to households earning more than $75,000 (32%).
• Race: Black individuals (46–52%) were significantly more likely to think preparing for all disasters would help them very much as compared to White (29–41%) and Asian individuals (16–25%).
• Religiousness: Across all disasters, individuals who considered themselves to be very religious (37–48%) were significantly more likely to think that preparing for a disaster would help them very much, than were those who did not consider themselves to be somewhat, barely, or not at all religious (22-40%).
• Volunteerism: Individuals who had volunteered to help in a disaster in the past (47%) were significantly more likely to think that preparing for a natural disaster would help them very much, than those who had not (40%).
The survey also sought to measure perceptions relative to self-efficacy, the belief in one’s ability to perform an action. Survey participants were asked how confident they felt in their ability to prepare for a disaster, using a scale of 1 to 5, with 5 being “very confident” and 1 being “not at all confident.” Over half (61%) the survey participants had confidence in their ability to prepare for a disaster (rated a 4 or 5 on the 5-point scale), whereas 14 percent indicated low levels of confidence (rated a 1 or 2 on the 5-point scale).

31 2009 CITIZEN CORPS NATIONAL SURVEY
Table 18: Levels in Confidence in Ability to Prepare for Disasters*
2009
Very Confident 61%
Not At All Confident 14%
*Levels in confidence in ability to prepare for disasters, top-box scores (those stating 4 or 5, on a scale of 1 to 5; 5 being ”very” confident and 1 being ”not at all” confident). Respondents were asked, “How confident are you about your own ability to prepare for a disaster?”
• Age: Individuals in the 35–54 age groups (29%) were significantly more confident in their ability to prepare for a disaster than the younger group (21%).
Demographic and Contextual Differences
• Race: Both White (26%) and Black (27%) individuals were significantly more confident in their ability to prepare for a disaster than Asian individuals (7%).
• Household income: Individuals earning an annual income greater than $75,000 (30%) were significantly more confident in their ability to prepare for a disaster than those in households earning $25,000–$49,999 (21%). Individuals earning less than $25,000 (14%) were the least confident in their ability to prepare for a disaster as compared to all other income groups.
• Geography: Both urban (7%) and rural residents (6%) were significantly less confident in their ability to prepare for a disaster as compared to those residents in suburban areas (2%).
• Education: Those who have not received a college education (10%) were significantly less confident in their ability to prepare for a disaster when compared to those who had some college education (4%).
• Volunteerism: Individuals who had volunteered in response to a disaster (33%) were significantly more confident in their ability to prepare for a disaster as compared to those who had not (22%).
Developed by Prochaska and DiClemente, the Stages of Change Model, or Transtheoretical Model of Behavior Change3
3 Prochaska, J.O., and C.C. DiClemente. 1982. Transtheoretical therapy: Toward a more integrative model of change. Psychotherapy: Theory, Research and Practice, 20, 161–173.
, states that behavior change is not an event, but rather a process. In this conceptualization, individuals move through five distinct stages that indicate their readiness to attempt, make, or sustain behavior change. These five stages are precontemplation, contemplation, preparation, action, and maintenance. The stages are not linear, as individuals do not necessarily progress from one stage to the next, but instead individuals may relapse to earlier stages and begin the change process again. Often, social marketing campaigns are targeted
In Which Stage of the Stages of Change Model (Precontemplation, Contemplation, Preparation, Action, Maintenance) Are Individuals Relative to
Disaster Preparedness?

32 2009 CITIZEN CORPS NATIONAL SURVEY
toward individuals in the contemplation stage, as these individuals may be more readily prompted to take action if given assistance.
Figure 4: Stages of Change model
STAGE DESCRIPTION
Precontemplation The individual is not intending to change or even thinking about change in the near future (usually measured as the next 6 months).
Contemplation The individual is not prepared to take action at present, but is intending to take action within the next 6 months.
Preparation The individual is actively considering changing his or her behavior in the immediate future (e.g., within the next month).
Action The individual has actually made an overt behavior change in the recent past, but the changes are not well established (maintained for 6 months or less).
Maintenance The individual changed his or her behavior, maintained the change for more than 6 months, and is working to sustain the change.
The Stages of Change model was used in this survey to determine individuals’ perceptions of their relative stage of change within the preparedness change process. Participants were asked which of the statements in the chart below best matched their level of preparedness. The stages with the greatest percentage of individuals represented both ends of the Stage of Change spectrum, with over one-third of individuals (35%) stating that they had been prepared for at least the past six months, and the second largest number stating they were not planning to do anything about preparing (23%)4
4 The question on Stages of Change originated from and was used with the permission of the National Center for Disaster Preparedness (NCDP).
2007. The American Preparedness Project: Where the US public stands in 2007 on terrorism, security, and disaster preparedness. New York, NY:
NCDP.
.

33 2009 CITIZEN CORPS NATIONAL SURVEY
Figure 5: Stages of Change (2007)*
*Respondents were asked, “In thinking about preparing yourself for a major disaster, which best represents your preparedness?”
Figure 6: Stages of Change (2009)*
*Respondents were asked, “In thinking about preparing yourself for a major disaster, which best represents your preparedness?”

34 2009 CITIZEN CORPS NATIONAL SURVEY
Relevant TCL Measure:
Number of citizens prepared to evacuate or relocate to designated shelter (to include citizens with special needs).
• Age: Individuals ages 35 to 54 years (40%) and ages 55 and more (36%) were significantly more likely to have been prepared for the last six months than individuals ages 18 to 34 (27%); however, both age groups 18 to 34 and 35 to 54 (19% and 16% respectively) were significantly more likely to fall within the contemplation stage of preparedness as compared to individuals over 55 (11%).
Demographic and Contextual Differences
• Employment: Full-time employed individuals (17%) were more likely to be in the contemplation stage (planning to prepare within the next six months) than retired individuals (9%).
• Gender: Men (39%) were significantly more likely than women (31%) to have been prepared for the last six months.
• Household income: Households earning less than $25,000 annually (24%) were significantly less likely to have been prepared for the last six months than those earning more than $50,000 annually (37% to 41%, depending on income level).
• Religiousness: Individuals that considered themselves not to be religious (30%) were significantly more likely to be in the precontemplation stage (not planning to do anything about preparing) than those that considered themselves to be very religious (20%).
• Volunteerism: Individuals who had volunteered to help in a disaster (52%) were significantly more likely to report being prepared for the last six months than those who had not volunteered (26%).
• Race: Black individuals were significantly more likely to be in the contemplation or preparation stage (24% and 17%, respectively) than White individuals (14% and 7%, respectively).
• Education: Those with college experience (37%) were significantly more likely to have been prepared for the last six months than those who did not have college experience (27%).
•
In the event of a disaster, individuals with physical or mental disabilities may have unique challenges relative to their ability to respond to a disaster. Of the survey participants, 15 percent reported having a physical or other disability that would affect their capacity to respond to an emergency situation. Another 14 percent of survey participants indicated they lived with and/or cared for someone with a physical or other disability.
What Is the Potential Impact of Disability on Disaster Preparedness?
• Plan: Caretakers of individuals with a disability (47%) were significantly more likely to have a household emergency plan as those who were not caretakers of an individual with a disability (43%).
• Preparedness training programs: Individuals with a disability were significantly less likely to have attended a preparedness meeting (20%), taken a CPR training class (28%), or taken first aid skills training (28%) than those without a disability (26%, 39%, and 39%, respectively). Individuals with
How Does Disaster Preparedness Differ by Demographic Characteristics?
35 2009 CITIZEN CORPS NATIONAL SURVEY
disabilities were also significantly less willing to attend a 20-hour training course (55%) than those without disabilities (66%).
• Perceptions of the utility of preparing in advance for a disaster: Individuals with a disability (74%) were significantly less likely to believe that preparation, planning, and emergency supplies would help them handle a natural disaster than those without a disability (83%).
• Barriers: Individuals with disabilities were significantly more likely to not have taken disaster preparedness steps because they don’t think they will be able to (30%), don’t want to think about it (27%), and emergency responders will help them (41%) as compared to those without a disability (10%, 15%, and 27%, respectively).
Per survey protocol, gender was determined by the interviewer, based on the voice of the participant. In general, men reported greater levels of preparedness and confidence in their abilities to handle the situation. This was also reflected in the finding that fewer men expected to need help in the event of an evacuation.
What Is the Potential Impact of Gender on Disaster Preparedness?
• Ability to respond in the first five minutes of a disaster: Men (12–36%) were significantly more confident in their abilities to know what to do in the first 5 minutes of any type of disaster than women (6–20%).
• Barriers: Women were significantly more likely to not take any disaster preparedness steps due to lack of knowledge (28%) than men (20%).
• Perceptions of the utility of preparing in advance of a disaster: Men were significantly more likely than women to believe they could handle a natural disaster, terrorist attack, or a hazardous materials accident, without any preparation (14% versus 9%; 6% versus 3%; and 11% versus 6%, respectively). Women (68%) were significantly more likely than men (62%) to feel that preparation, planning and emergency supplies would help them handle a hazardous materials accident.
• Reliance on others: Women were significantly more likely to rely on household members and people in their neighborhood (61% and 29%, respectively), than men (49% and 24%, respectively). Women (49%) were also significantly more likely to report needing help to evacuate or get to a shelter than men (35%).
• Perceptions of severity of impact of disasters: Women were significantly more likely to believe that a severe disease outbreak (25%), hazardous materials accidents (21%), act of terrorism (38%) and natural disaster (30%) would very severely impact them, as compared to men (15–28%).
• Stages of Change: Men were significantly more likely than women to report having been prepared for the last 6 months (39% versus 31%).
• Perceptions of risk: Women were significantly more likely (8%) to believe that an act of terrorism is very likely to occur in their community, as compared to men (5%).
• Volunteering: Men (40%) were significantly more likely to have volunteered during a disaster than women (29%).

36 2009 CITIZEN CORPS NATIONAL SURVEY
Each respondent was asked to describe his/her location as urban, suburban, or rural. Overall, rural respondents were more likely to report having volunteered, taken preparedness training, and to feel more confident about their preparedness (or in other words, their ability to respond in the early stages of a disaster and believing that preparing for a disaster could actually aid in reducing harm).
What Is the Potential Impact of Community Type on Disaster Preparedness?
Suburban respondents overall were less prepared than were urban respondents. Mostly, suburban residents were equally confident in their ability to respond in the first 5 minutes of a disaster. Although urban residents were not as confident in their ability to act in the event of a disaster, except for a terrorist attack, they indicated that they were significantly more willing to take a 20-hour disaster recovery training course than rural residents
• Volunteering: Individuals living in rural residential areas (38%) were significantly more likely to have volunteered to help in a disaster than suburban residents (32%). Urban residents (69%) were significantly more willing than rural residents (60%) to express willingness to take a 20-hour disaster recovery training course.
• Community plan: Rural residents (22%) and urban residents (18%) were significantly more likely to be familiar with their evacuation routes as opposed to suburban residents (13%).
• Perceptions of the severity of impact of disasters: Both urban and rural residents were significantly more likely to feel that a severe disease outbreak (24% and 22%, respectively), hazardous materials accident (22% and 20% respectively) and natural disaster (27% and 27% respectively) would severely impact them as compared to suburban residents (16%, 13%, and 20%, respectively).
• Perceptions of the utility of preparing in advance of a disaster: Suburban residents (85%) were significantly more likely than urban or rural residents (80% reported for both) to believe that preparation, planning, and emergency supplies would help them handle a natural disaster.
• Perception of risks: Urban residents (13%) were significantly more likely to believe that a hazardous materials accident would ever occur in their community, as compared to suburban (7%) and rural residents (8%).
• Preparedness training programs: Rural residents (30%) were significantly more likely to have attended a meeting on how to be better prepared for a disaster than suburban residents (21%).
• Reliance on others: Rural residents (30%) were significantly more likely than suburban individuals (24%) to rely a great deal on people in their neighborhood in the first 72 hours of a disaster.

37 2009 CITIZEN CORPS NATIONAL SURVEY
A respondent’s race was solicited by asking the respondent to select one of the following categories: White, Black or African American, Asian, American Indian, Alaska Native, Native Hawaiian, Other Pacific Islander, or something else. A respondent’s ethnicity was solicited by asking whether or not they were of Hispanic, Latino, or Spanish origin.
What Is the Potential Impact of Race and Ethnicity on Disaster Preparedness?
Black respondents were more likely to have higher risk perceptions about disasters; that is, they were more likely than White respondents to believe that the majority of the disasters discussed were likely to occur in their communities. Additionally, black respondents were more likely to expect to rely on others (especially their faith-based communities) in the event of an evacuation. Black respondents were also more prepared in terms of having participated in a workplace evacuation drill.
White respondents were more likely to be prepared for the last six months than Black respondents and had stronger beliefs in their own responsibility to report suspicious behavior.
Non-Hispanic respondents were more likely to be prepared, by having important financial and insurance documents in a safe place.
• Plan: Non-Hispanic individuals (73%) were also significantly more likely to have copies of important financial and insurance documents in a safe place than Hispanic individuals (59%).
• Reliance on others: Black individuals were significantly more likely to rely a great deal on their faith-based community (40%) or nonprofit organizations (34%) in the first 72 hours of a disaster than White individuals (22% and 17%, respectively) and Hispanic individuals (30%) were significantly more likely to rely a great deal on nonprofit organizations than non-Hispanic individuals (19%). Blacks (67%) were also significantly more likely to expect to need help to evacuate or to get to a shelter than Whites (36%).
• Perceptions of the utility of preparing in advance of a disaster: Hispanic individuals (12%) were significantly more likely to believe that nothing they did could help them prepare for a natural disaster, as compared to non-Hispanic individuals (6%).
• Perception of risks: Blacks were significantly more likely than Whites to believe that a terrorist attack (15% and 5% respectively), hazardous materials accident (18% and 7%, respectively), and disease outbreak (20% and 10%, respectively) were very likely ever to occur in their communities.

38 2009 CITIZEN CORPS NATIONAL SURVEY
• Participation in preparedness drills and exercises: Black individuals (55%) were significantly more likely to have participated in workplace evacuation drills than White individuals (40%).
• Willingness to report suspicious behavior: White individuals (97%) were significantly more likely than Black individuals (93%) to feel that they had a personal responsibility to report suspicious behavior or circumstances to the authorities.
• Stages of Change: White individuals (38%) were significantly more likely to have been prepared for the last six months than Black individuals (23%).
• Barriers: Blacks were significantly more likely to report that cost (30%) and ability to take action (25%) were primary reasons they have not taken any disaster preparedness steps as compared to White individuals (16% and 10%, respectively).
• Perceptions of severity of impact of disasters: Hispanic individuals (36%) were significantly more likely to feel that a natural disaster would have a severe impact on them personally, as compared to non-Hispanic individuals (22%).
A respondent’s household income was solicited by asking which of the following categories applied to his/her household: less than $25,000; $25,000 to $50,000; $50,000 to $75,000; and $75,000 or more. Across several constructs measuring preparedness—including self-reported preparedness activities, attitudes around preparedness, and awareness of preparedness groups and plans—the data indicate a direct relationship between income level and preparedness: as income increased so did measures of preparedness. For example, respondents with household incomes of $50,000 or more were more likely than those with a lesser income to have disaster supplies in their cars, communicated this household disaster plan with others, volunteered to help in a disaster, taken a preparedness training or CPR course, communicated the importance of preparing to someone else, and believe that preparedness would actually help them handle a disaster situation.
What Is the Potential Impact of Income on Disaster Preparedness?
Conversely, those with lower household incomes were less likely to have taken preparedness measures and indicated an increased need for help in an evacuation. Individuals with lower household incomes were more likely to cite cost as a barrier to preparing than were those with higher incomes. Furthermore, individuals reporting lower household incomes were also more likely to have different attitudes about preparedness than those with higher incomes. For instance, they reported little to no confidence in their ability to know what to do in the first 5 minutes and an increased belief that a terrorist attack was likely to occur in their community.
• Disaster Supplies: Households earning $50,000 to $75,000 (38%) were significantly more likely to have supplies set aside in their cars than households making less than $25,000 (28%).
• Plan: Those who reported incomes $75,000 and over were significantly more likely to have discussed their household plan with other household members (97%) than those earning less than $25,000 (84%). Survey respondents from households that reported making more than
39 2009 CITIZEN CORPS NATIONAL SURVEY
$75,000 (72%) were significantly more likely to have copies of important financial and insurance documents in a safe place than households earning less than $25,000 (62%).
• Volunteering: Individuals with an annual household income of $75,000 or more (37%) were significantly more likely to have volunteered to help in a disaster than individuals with an annual household income of $25,000 or less (27%).
• Reliance on others: Households earning less than $25,000 expected to rely on state and federal government agencies (28%), as well as fire, police, and emergency personnel (45%) in the first 72 hours of a disaster than those earning more (17-19%, and 34-36%, respectively). Additionally, these individuals were significantly more likely to need help evacuating or getting to a shelter 59%).
• Confidence in ability to respond in a disaster: Individuals with a household income of less than $25,000 were significantly more likely to have no confidence in their own ability to handle the first 5 minutes of a natural disaster (20%) than were households earning more than $25,000 (7–12%).
• Preparedness training programs: Individuals in households earning $75,000 or more were more likely to attend a meeting on how to become better prepared for a disaster (29%) or take a CPR class (40%) than those earning $25,00 and below (16% and 26%, respectively).
• Barriers: Households earning less than $25,000 were significantly more likely not to have taken disaster preparedness steps due to reliance on emergency responders (45%)—fire, police, or emergency personnel—than those earning more (22–26%). As income levels increased, individuals were significantly less likely to say that cost was their primary reason for not taking any preparedness steps.
• Perceptions of the utility of preparing in advance of a disaster: Individuals in households earning $75,000 or more believed that preparation, planning, and emergency supplies would help them handle a natural disaster (86%) or a hazardous materials accident (68%) than those earning $25,00 and below (72% and 59% respectively).
• Perception of risks: Households earning less than $25,000 were significantly more likely to believe that a terrorist attack was very likely to occur in the next 12 months (11%) than individuals earning $75,000 and over (5%).
• Stages of Change: Households earning less than $25,000 were significantly more likely to have not prepared but intend to in the next 6 months (21%) or 1 month (13%) than those earning over $75,000 (13% and 7% respectively).
A respondent’s education was solicited by asking which of the following categories applied to him or her: less than 12th grade (no diploma); high school graduate or GED; some college but no degree; associate degree in college; bachelor’s degree; master’s degree; or doctorate degree. The data show that individuals with some college experience were overwhelmingly more aware, prepared, and confident in the benefits of disaster preparedness. These measures include keeping disaster supplies in their vehicles and having volunteered with a local emergency response group.
What Is the Potential Impact of Education on Disaster Preparedness?

40 2009 CITIZEN CORPS NATIONAL SURVEY
Individuals with no college education were less prepared among all the measures previously mentioned. Furthermore, people with no college experience perceived two significant barriers to personal preparedness: reliance on emergency responders and a lack of knowledge about how to prepare. Also, people with no college experience had a greater perception that several types of disasters would occur in their community. Both groups (those with some college and those with no college experience) predicted a reliance on others in the first 72 hours of a disaster: individuals with no college experience predicted they would rely on people in their neighborhood, nonprofit organizations, and state and federal government agencies.
• Disaster Supplies: Individuals with some college education (36%) were significantly more likely than those with less education (29%) to have supplies set aside in their cars.
• Volunteering: Individuals with college experience (37%) were significantly more likely to have volunteered in a disaster than individuals with less education (27%).
• Reliance on others: Individuals with only a high school education (31%) were significantly more likely than individuals with college experience (25%) to rely on people in their neighborhood. Individuals without college experience were more likely to rely a great deal on state and federal government agencies (28%), as well as fire, police, and emergency personnel (48%) than individuals with college experience (17% and 34%, respectively).
• Ability to respond in the first five minutes of a disaster: Individuals with only a high school education (13%) were significantly more confident in their abilities to know what to do in the first 5 minutes of a radiological/dirty bomb explosion than those with more educational experience (7%).
• Barriers: Individuals with less than a high school degree were significantly more likely not to have taken disaster preparedness steps due to expected reliance on emergency responders such as fire, police, or emergency personnel (45%) than were higher educated individuals (23%). Individuals with less than a high school degree (32%) were significantly more likely than higher educated individuals (21%) to state that a lack of knowledge was their primary reason for not taking any preparedness steps.
• Perception of risks: Across disaster categories, individuals without college education were more likely to believe that a hazardous materials accident (14%) or act of terrorism (11%) was very likely to occur in their community than individuals with college experience (8% and 5%, respectively).
• Perceptions of the utility of preparing in advance of a disaster: Individuals with a college education (84%) were significantly more likely to believe that preparation, planning, and emergency supplies would help them handle a natural disaster than those with less than a college education (74%).
• Perceptions of the severity of impact of disasters: Individuals with less than a college degree were significantly more likely to believe that a hazardous materials accident (29%) and a severe disease outbreak (27%) would have a severe impact as opposed to those with a college degree (15% and 18%, respectively).

41 2009 CITIZEN CORPS NATIONAL SURVEY
A respondent’s age was solicited by asking in what year the respondent was born. Respondents’ years of birth were grouped into the age categories of 18 to 34, 35 to 54, and 55 and over. The data suggest that the most prepared age group was individuals 18 to 34 years old and 35 to 54 years old. For example, these groups were more likely than older individuals to have household plans, be willing to volunteer to take a 20-hour disaster training course, and have taken a CPR course or a preparedness course They were also more likely to have participated in an evacuation drill and believe that preparing would be effective in preventing harm in the event of a disaster (high response efficacy). The primary barrier to being prepared reported by these groups was an anticipated reliance on emergency responders.
What Is the Potential Impact of Age on Disaster Preparedness?
There were some nuances among these two more prepared groups, however. For example, the 35- to 54-year-olds were more likely to be in the action stage of the Stages of Change model; whereas, the 18- to 34-year-olds were more likely than other groups to be in the precontemplation stage. Also, individuals 35+ years old were more likely to feel it was their responsibility to report suspicious behavior.
Adults 55+ years old were less prepared among some of the measures mentioned earlier. For example, this age group perceived many barriers to being prepared, including higher reliance than younger groups on emergency responders in the event of a disaster. The data do suggest, however, that older adults are aware of community groups and plans. For example, individuals 55+ years old were more likely to be aware of their community’s shelter locations and evacuation routes.
• Disaster Supplies: Individuals between the ages of 18 to 54 were significantly more likely to have disaster supply kits set aside in their cars (35–38%) than individuals older than 55 years (29%).
• Plan: Individuals between the ages of 18 to 54 were significantly more likely to have discussed their household plan with other members in their household (94-97%) than older individuals (85%).
• Volunteering: Individuals between the ages of 18 to 54 were significantly more likely to indicate willingness to take a 20-hour disaster recovery training course (64-72%) than older individuals (55%).
• Confidence in ability to respond in a disaster: Individuals ages 35 to 54 (10%) were significantly more likely than those over the age of 55 (5%) to be confident in their ability to respond in the first five minutes of an explosion of a radiological or dirty bomb.
• Preparedness training programs: Individuals ages 18 to 34 and 35 to 54 (36% and 44%, respectively) were significantly more likely to have taken a CPR class than older adults (26%).
• Barriers: Individuals over the age of 55 (43%) were significantly more likely not to have taken disaster preparedness steps due to expected reliance on emergency responders such as fire, police, or emergency personnel than younger individuals (20–28%). Individuals over the age of 55 (24%) were also significantly more likely than younger individuals (8–10%) to indicate that doubts regarding their abilities to take action were a primary reason for not taking any preparedness steps.

42 2009 CITIZEN CORPS NATIONAL SURVEY
• Stages of Change: Individuals 35 to 54 (40%) were significantly more likely to have been prepared for the last 6 months than individuals ages 18 to 34 (27%). This younger group was significantly more likely to fall within the precontemplation stage of preparedness (19%) than individuals over the age of 55 (11%).
• Community Plan: Individuals over the age of 35 were significantly more likely to be very familiar with their community’s evacuation routes (20–21%), as well as shelter locations (22–23%) than were younger individuals (10–16%).
• Participation in preparedness drills and exercises: Individuals between the ages of 18 and 54 (14–19%) were significantly more likely to have participated in a home evacuation drill than older individuals (8%).
• Willingness to report suspicious behavior: Individuals over the age of 35 (97%) were significantly more likely than younger individuals (93%) to feel that they had a personal responsibility to report suspicious behavior to the authorities.
Each participant was asked to describe their job status according to the following categories: works full-time, works part-time, student, unemployed, retired, or other. Overall, employed individuals were more likely to take part in various training programs and volunteer opportunities than unemployed individuals. Also, employed individuals were more likely than retired individuals to be in the contemplation phase of the Stages of Change model; whereas, retired individuals were more likely to be in the precontemplation stage than full-time individuals. Retired individuals were also more likely to experience more barriers to taking disaster preparedness steps than those who work full-time.
What Is the Potential Impact of Employment on Disaster Preparedness?
• Plan: Individuals who are employed full-time (71%) were significantly more likely to have copies of important financial and insurance documents in a safe place than those who were unemployed (63%).
• Perception of risks: Individuals who were unemployed were significantly more likely to believe that a terrorist attack (9%) and a hazardous materials accident (14%) would ever occur in their community, as compared to individuals who work full-time (5% and 8%, respectively).
• Perceptions of utility of preparing in advance of a disaster: Individuals who work full-time (86%) were significantly more likely to believe that preparation, planning, and having emergency supplies would help them handle a natural disaster, as compared to those who are unemployed (73%) or retired (71%).
• Community plan: Employed individuals (35%) were significantly more likely to be familiar with community alerts and warning systems than those who were unemployed (26%).
• Stages of Change: Retired individuals (29%) were significantly more likely to be in the precontemplation stage than full-time individuals (21%).
• Barriers: Retired individuals were significantly more likely to not have taken disaster preparedness steps due to reliance on emergency responders (43%) and their lack of knowledge (35%) as opposed to those who work full-time (25% and 22%, respectively).

43 2009 CITIZEN CORPS NATIONAL SURVEY
• Volunteerism: Individuals who work full-time were significantly more likely to volunteer in a community safety program (26%) or a disaster response team (38%) than those who are unemployed (17% and 20%, respectively).
• Preparedness training programs: Full-time employed individuals were more likely to have attended a meeting on disaster preparedness (33%), CPR training (44%) and a session on first aid (45%), as compared to unemployed individuals (14%, 32%, and 31%, respectively).
Individuals who had volunteered to help in their community or during a disaster were more likely to have a disaster supplies and a household plan in place, were more willing to prepare for disasters, and had more confidence in their abilities to prepare for disasters. Individuals who had volunteered to help during a disaster were also more likely to be in the action stage of the stages of change model. Finally, individuals who have volunteered in the past were more likely to have participated in various training programs.
What Is the Potential Impact of Volunteerism on Disaster Preparedness?
• Confidence in ability to respond in a disaster: Individuals who had volunteered to help in a disaster in the past (33%) were significantly more likely to have confidence in their ability to handle a disaster than those who had not (22%).
• Community plan: Individuals who have volunteered in response to a disaster were more likely to be familiar with community alerts and warning systems (42%), evacuation routes (24%) and shelter locations (30%) than those who have not volunteered (26%, 13%, and 15%, respectively).
• Stages of Change: Individuals who had volunteered to help in a disaster (52%) were significantly more likely than those who had not volunteered to have been prepared for the last six months (26%).
• Perceptions of the severity of impact of disasters: Individuals who had not volunteered in response to a disaster (35%) were significantly more likely to believe that an act of terrorism would severely impact them personally, as compared to those who have volunteered in response to a disaster (29%).
• Plan: Individuals who had volunteered in a community safety program (67%) or a disaster response team (59%) were significantly more likely to have a household emergency plan as compared to those who had not volunteered (38% and 37%, respectively).
• Perceptions of the utility of preparing in advance of a disaster: Individuals who had volunteered in response to a disaster were significantly more likely to believe that preparation, planning and emergency supplies would help them handle a severe disease outbreak (77%), as compared to those who have not (71%).
• Perception of risks: Individuals that had volunteered in response to a disaster (29%) were significantly more likely to believe that a natural disaster was very likely to occur in their community than those who have not (20%). Also, individuals who had volunteered with organizations focusing on community safety were significantly more likely to believe that a natural disaster (28%) and a hazardous materials accident (13%) were very likely ever to occur in their community, as opposed to those who had not volunteered (21% and 8%, respectively).

44 2009 CITIZEN CORPS NATIONAL SURVEY
• Preparedness training programs: Individuals who had volunteered in a community safety program were significantly more likely to had attended a meeting on disaster preparedness (51%), CPR training (51%) and first aid training (56%) than those who had not volunteered (17%, 32%, and 31%, respectively).
• Disaster Supplies: Individuals who had volunteered in a community safety program (74%) or a disaster response team (71%) were significantly more likely to have disaster supplies in their home as compared to those who had not volunteered (52% and 50%, respectively).
Survey participants were also asked how religious they believed they were, according to the following categories: very religious, somewhat religious, barely religious, and not at all religious. Those who considered themselves to be very religious felt that disasters would have a great impact on them personally, and in the event of a disaster they would rely heavily on their faith communities, household members, and local nonprofit organizations. Very religious individuals were also more likely to participate in home shelter-in-place drills and have a household emergency plan.
What Is the Potential Impact of Religiousness on Disaster Preparedness?
• Plan: Individuals who were very religious (50%) were significantly more likely to have a household emergency plan in place, as compared to those who report being barely to not at all religious (37%).
• Perceptions of the severity of impact of disasters: Individuals who are very religious significantly felt that the impact of natural disasters, acts of terrorism, and hazardous materials accidents in their community would be very severe for them (27%, 37%, and 20%, respectively) compared to those who were barely or not at all religious (18%, 27%, and 14%, respectively).
• Perceptions of the utility of preparing in advance of a disaster: Individuals who reported being very religious were significantly more likely to think that preparation, planning, and emergency supplies would help them handle an act of terrorism (61%) than those who report being barely or not at all religious (54%).
• Stages of Change: Individuals that considered themselves not to be religious (30%) were significantly more likely to report not planning to do anything about preparing than those that considered themselves to be very religious (20%).
• Participation in preparedness drills and exercises: Very religious individuals (13%) were significantly more likely to have participated in a home shelter-in-place drill than those who consider themselves to be barely or not at all religious (5%).
• Barriers: Individuals who consider themselves to be very religious are more likely to report not having taken any disaster preparedness steps because of cost (25%) and a belief that it won’t make a difference (19%) compared to those who consider themselves to be somewhat religious (14% and 11%, respectively).
• Reliance on others: Very religious individuals were more likely to rely on their faith-based communities (45%), household members (60%) and nonprofit organizations (24%) as compared to those who are barely or not at all religious (7%, 51%, and 14% respectively).

45 2009 CITIZEN CORPS NATIONAL SURVEY
14%
86%
In the past 12 months have you seen any suspicious
behavior or circumstances?
Yes
No
As part of the survey, participants were asked about their prior experiences observing and reporting suspicious behavior or circumstances. Only 14 percent of individuals reported that they had seen any suspicious behavior or circumstances in the past 12 months. Almost all of the respondents (96%) reported feeling that they had a personal responsibility to report such behavior to the authorities. When individuals who had seen suspicious behavior or circumstances were asked what they did in response to the behavior, 7 out of 10 respondents (70%) reported having taken some proactive action (called police or neighbor/friend) in response to observing the behavior/circumstance. However, 14 percent reported not taking any action. The majority of individuals who observed suspicious behavior and took action reported their observation to the police or a tip-line (64%). “Other” responses (13%) included intervening or confronting the perpetrator, and observing or taking notes.
What Is the Willingness to Report Suspicious Behavior?
Figure 7: Observation of Suspicious Behavior
• Age: Individuals over the age of 35 (97%) were significantly more likely than younger individuals (93%) to feel that they had a personal responsibility to report suspicious behavior to the authorities.
Demographic and Contextual Differences
• Race: White individuals (97%) were significantly more likely than Black individuals (93%) to feel that they had a personal responsibility to report suspicious behavior or circumstances to the authorities.
What Did You Do? 2009
Called Police and/or a tip line 64%
Nothing 11%
Called neighbor/friend 6%
Left the area/situation/event 2%
Waited for someone else to do something
1%
Other 13%
What Is the Perceived Social Responsibility for Reporting Suspicious Behavior?
Relevant TCL Measure:
Number of citizens within the jurisdiction who are alert to unusual behavior in others that might indicate potential terrorist activity and understand appropriate reporting procedures.

46 2009 CITIZEN CORPS NATIONAL SURVEY
• Household income: Individuals in households earning more than $50,000 (97-98%) were significantly more likely to feel that they had a personal responsibility to report suspicious behavior to the authorities than those earning less than $25,000 (92%).
• Religiousness: Very religious individuals (98%) were significantly more likely to feel a personal responsibility to report suspicious behavior than individuals who are barely or not at all religious (93%).

47 2009 CITIZEN CORPS NATIONAL SURVEY
Summary and Recommendations The following recommendations are based on specific findings from the 2007 and 2009 Citizen Corps National surveys and are intended to assist researchers and practitioners in increasing personal preparedness, civic engagement, and community resilience. Unless noted otherwise, all data cited is from the 2009 survey results.
• Individuals’ high expectations of assistance from emergency responders may inhibit individual preparedness. Communicating more realistic expectations and personal responsibilities is critical. From a list of possible reasons why individuals had not prepared, 29 percent of individuals indicated that a primary reason they had not prepared was because they believed that emergency personnel would help them in the event of a disaster. Further, 61 percent of participants indicated they expected to rely on emergency responders in the first 72 hours following a disaster.
Communication to the public must emphasize the importance of self-reliance and convey a more realistic understanding of emergency response capacity. Especially in large-scale events, emergency responders will not be able to assist all individuals in an affected area. Messaging should speak to a shared responsibility and stress that everyone has a role to play in preparedness and response.
• Too few people had stocked disaster supplies, and most supplies were incomplete. More emphasis is needed on the importance of stocking disaster supplies in multiple locations, and more specificity is needed on critical items to include, such as flashlights, radios, batteries, first aid kits, and personal documents. The lack of progress in the number of individuals with critical disaster supplies at home and in other locations remains a concern. While more than half of individuals (57%) reported having emergency supplies set aside in their homes to be used only in the case of a disaster, when they were asked to list the supplies unaided, only food and bottled water were mentioned by more than half the respondents (74% and 71%, respectively). A flashlight and first aid kit the next most common supplies mentioned (42% and 39%, respectively), with the percentage naming other supplies dropping off considerably, batteries (27%), portable radio (20%), and medications (11%). Only 1 percent mentioned photocopies of personal identification or financial documents as part of disaster supplies unaided. With respect to other locations, 45% of individuals indicated having emergency supplies at their workplaces, and 34% had emergency supplies in their cars.
Because disasters can happen at any time, greater emphasis is needed on the importance of maintaining supplies in multiple locations. In addition, more prominence is needed on the importance of specific supplies and why they are so critical. In any type of disaster that impacts electricity, communications will be limited to battery or crank-operated devices, yet less than one-quarter of respondents reported having a battery-powered radio in the home. Employers and managers should stress the importance of emergency
48 2009 CITIZEN CORPS NATIONAL SURVEY
supplies in the workplace and in vehicles and have preparedness days to test and restock supplies. Car dealers, auto stores, car service companies, and motor vehicle departments and administrations should be encouraged to provide information about the need for preparedness supplies in cars.
• Greater appreciation for the importance of household plans and knowledge of local community emergency procedures and response resources is needed. Individuals who reported being prepared lacked critical plans and information. Fewer than half of individuals (44%) had an emergency plan for their home. Additionally, individuals’ low level of familiarity with critical local information such as the community alerts and warning systems (30%), shelter locations (55%), and community evacuation routes (58%) indicated that these essential elements were missing or incomplete from household planning efforts. Surprisingly, even those who reported that they had been prepared for the past six months had not completed important preparedness activities or did not have a sound understanding of community plans. Of those who perceived themselves to be prepared, 35 percent did not have a household plan, 81 percent had not conducted a home shelter-in-place drill, and 68 percent did not know their community’s shelter locations.
Local outreach efforts on personal preparedness need to provide individuals with community level preparedness information regarding disaster vulnerabilities, alerts and warning systems, evacuation plans and other local procedures, and explain how household, workplace, school, and organizational plans support community preparedness and resilience. Messages should also target individuals who may think they are prepared to encourage a reassessment of their preparedness actions.
• Practicing response protocols is critical for effective execution. Greater emphasis on drills and exercises is needed. Fewer than half of individuals (42%) had participated in a workplace evacuation drill in the past 12 months, and only 27 percent had participated in a workplace shelter-in-place drill. Few individuals had participated in home-based drills or, of those in school or with children in school, in-school drills (37% participated in an evacuation drill and 32% participated in a shelter-in-place drill). While the majority of individuals who indicated their household had an emergency plan (44% of total respondents) reported that they had discussed their plan with other members in their household (92%), only a quarter had ever practiced or drilled those household plans (14% had practiced a home evacuation plan and 10% had practiced a home shelter-in-place drill). Of those who said they did not have a household plan (55% of total respondents), only 3% had conducted a home evacuation drill and only 3% had conducted a home shelter-in-place drill.
Greater emphasis is needed on drills and exercises and they should be conducted through social networks, including households and neighborhoods, the workplace, schools, and faith communities. While many organizations hold required fire drills, far fewer drill on evacuations for other hazards or practice sheltering in place. In addition, community members need to be included more effectively in government-sponsored community exercises.

49 2009 CITIZEN CORPS NATIONAL SURVEY
• An awareness of vulnerabilities to natural disasters motivates individuals to prepare. Most individuals, however, did not believe their communities will ever be affected by any type of disaster.
The survey data indicated a correlation between awareness of vulnerability to natural disasters and motivation to prepare. Interestingly, this correlation was not as strong for terrorist events or severe disease outbreaks, perhaps due to a lower perceived response efficacy of preparedness measures for these events. Most individuals, however, were skeptical about the likelihood that their communities would ever be impacted by any type of disaster, including natural disasters. Only 40 percent of individuals thought a natural disaster was likely ever to impact their communities, with even less believing in the likelihood of an act of terrorism, hazardous materials accident, or severe disease outbreak (14%, 23%, and 28% respectively) ever impacting their communities. In 2007, participants were also asked about the potential for a disaster to occur in the next 12 months. Between 10 and 20 percent of the participants in 2007 thought any of the disasters were likely to impact their communities in this timeframe.
Educating individuals about their communities’ vulnerabilities to natural disasters as well as concerns with utility outages, extreme heat or cold, and other disruptive circumstances should increase awareness of risks and, in turn, increase motivation to prepare. Before perceptions of vulnerability to terrorism or disease outbreak lead to an increase in individuals’ motivation to prepare for these hazards, a greater appreciation of the utility and effectiveness of advance preparation for these types of events is needed.
• Perceptions of the utility of preparedness and confidence in ability to respond varied significantly by type of hazard. Because all-hazards messaging may dilute critical differences in preparedness and response protocols, preparedness and response education should include a focus on hazard-specific actions appropriate for each community. The survey results indicated that individuals’ perceived utility of preparing and their confidence in their ability to respond varies significantly by disaster type. Over half (54%) of individuals felt confident about their abilities to respond in the event of a natural disaster, while only 22 percent did not feel confident in their response abilities. In stark contrast, over half of individuals were not confident in their abilities to handle manmade disasters, such as a dirty bomb or a chemical agent (59% and 50%, respectively).
Additionally, while most individuals (66%) believed that preparing for a natural disaster would help them better handle the disaster, individuals had significantly lower response efficacy regarding acts of terrorism, with 35 percent of individuals indicating that preparing for a terrorist attack would not help them respond to that type of event.
Outreach, social marketing, and risk communication strategies should take into account that motivators to undertake preparedness activities may be different for natural disasters as compared to other disasters. Communication strategies that seek to increase preparedness for terrorist-related threats must address susceptibility and response efficacy. Individuals should be better educated about specific disasters and the training necessary to respond to each type of disaster likely for their community. Special attention should be
50 2009 CITIZEN CORPS NATIONAL SURVEY
focused on helping engage individuals in basic preparedness for explosions, dirty bombs, and release of chemical agents, if appropriate for their community.
• Social networks, such as households, neighborhoods, the workplace, schools, and faith-based communities, and the concepts of mutual support should be emphasized. The majority of individuals (69%) expected to rely on their household members in the event of a disaster and a little less than half (48%) expected to rely on others in their neighborhood. In 2007, of the 4 in 10 who had spoken to someone regarding the need to be prepared, only 34 percent had spoken with household members, and only 26 percent had talked with people in their neighborhoods. In 2009, 3 in 10 individuals (35%) reported talking about getting prepared with others in their community. In an event, the effectiveness of assistance provided by household members and neighbors will be limited by lack of prior discussion and planning.
Messages and activities should encourage greater discussion and evaluation of knowledge, skills, and supplies necessary to support resilience within social networks, such as households and neighborhoods, the workplace, schools, and faith-based communities, and should promote drills and exercises to test response capabilities.
• Focusing on individuals in the contemplation and preparation stages for personal preparedness may yield greater results. Messaging and community outreach efforts should be designed to support those already considering taking action. Nearly one quarter of individuals (25%) indicated that they intended to prepare in the next 1 to 6 months. A further 16 percent reported that they had recently begun to prepare. Communication efforts should be designed specifically towards targeting those in the contemplation and preparation stages of the Stages of Change model to leverage their interest and intention to prepare and to support them in moving from contemplation to action.
• Individuals’ strong interest in attending training courses and volunteering should be harnessed through social networks. Training and volunteer service should be linked with a responsibility for educating and encouraging others to prepare. Encouragingly, over half (64%) of individuals said they would be willing to take a 20-hour training course for the purpose of helping their communities recover from disasters. The most fertile ground for training may lie in partnerships with schools and workplaces, as the majority of individuals who participated in training programs (48%) indicated they were motivated to do so because it was mandatory for a job or school.
Individuals are also willing to support their community. Nearly one-quarter (23%) of individuals stated they had given some time in the past 12 months to support emergency responder or community safety organizations. Over one-third (34%) indicated they had volunteered to help in a disaster at some point in the past. Those who had volunteered in past disasters were significantly more likely to report that they had been prepared for the last six months.

51 2009 CITIZEN CORPS NATIONAL SURVEY
Training in emergency response skills and basic first aid must become more accessible and more established in the core social network arenas, workplace, neighborhoods, schools, faith-based communities, and civic organizations. Opportunities to volunteer to support emergency services, both year-round and in a response or recovery effort, must also continue to be offered and valued. Volunteers in past disasters should be marshaled as ambassadors for preparedness in the community.
• Specific sociodemographic characteristics correlated with attitudes toward and actions for preparedness. Insights into these differences offer the ability to tailor outreach efforts to targeted audiences. Individuals with Disabilities: Fifteen percent reported having a physical or other disability that would affect their capacity to respond to an emergency situation. Alarmingly, however, less than one-third of individuals with disabilities had taken specific actions to help them respond safely in the event of an emergency, with only 20 percent attending a meeting on how to get prepared and 28 percent attending CPR or first aid training. Another 14 percent of survey participants indicated they lived with and/or cared for someone with a physical or other disability. Of these individuals only 23 percent attended a meeting on preparing, 37 percent attended CPR training, and 40 percent attended first aid training – about the same as individuals who did not identify themselves as caregivers (25%, 36%, and 37%, respectively).
Gender: In general, men reported greater levels of preparedness and confidence in their abilities to handle situations. Male confidence was also reflected in the finding that fewer men expected to need help in the event of an evacuation.
Race and Ethnicity: Individuals’ preparedness and need for support varied based on race and ethnicity. White respondents were significantly more likely than Black respondents to report being prepared for the past 6 months. Black respondents were more likely to have participated in a workplace evacuation drill. Black respondents were also more likely than White respondents to believe that the majority of the disasters discussed were likely to occur in their communities. In terms of ethnicity, Non-Hispanic respondents were more likely to be prepared, by having important financial and insurance documents in a safe place. Hispanics were also more likely to cite expected reliance on emergency personnel as primary reason for not being prepared for disasters.
Income: Across several constructs measuring self-reported attitudes around preparedness and preparedness activities, the data indicated a direct relationship between higher income and higher levels of preparedness. Conversely, those with lower incomes were less likely to have taken preparedness measures and indicated an increased anticipated need for help in an evacuation.
Education
: Individuals with some college experience were overwhelmingly more aware, prepared, and confident in the benefits of disaster preparedness than respondents with no college experience. People with no college experience who had not prepared gave two prominent reasons: expected assistance from emergency responders and a lack of knowledge about how to prepare.
52 2009 CITIZEN CORPS NATIONAL SURVEY
Age
The most unprepared group surveyed were adults 55+ years old. This age group perceived many barriers to being prepared, including, higher reliance on emergency responders.
: Individuals 18 to 34 years old and 35 to 54 years old were more likely to have undertaken several different preparedness activities. For example, these groups were more likely to have household plans, have taken training courses, and be willing to volunteer to take a 20-hour disaster training course. Individuals in these groups reported a lack of time to prepare as their primary reason for not preparing.
Employment: Individuals with full-time employment were significantly more likely than unemployed individuals to have disaster plans, be aware of community plans, and take part in various training programs and volunteer opportunities. Retired individuals were more likely to report barriers to taking preparedness steps, such as reliance on emergency responders.
Volunteerism: Previous volunteering for community safety programs or during a disaster had a significant impact on individuals’ likelihood to be prepared. Individuals with volunteer experience were more likely to have disaster supplies and a household plan and to have participated in various training programs. This group was more likely to be in the action stage of preparedness.
Religiousness
Research, outreach, and communication should take into account the needs of different audience segments where preparedness disparities exist. Specific strategies should be developed that focus on the reasons given for not preparing for these different segments, such as improving accessibility of education materials and training for people with disabilities, and incorporating preparedness education and training in existing social network activities to alleviate time constraints. Strategies should include working more closely with associations and organizations that provide support services to identified audience segments to integrate preparedness into their activities. Additional research should focus on identifying optimal outreach methods activities, messages, and spokespersons.
: Individuals reporting being very religious perceived the impact of all types of disasters, except disease outbreaks, to be potentially very severe compared to barely or not at all religious individuals. Very religious individuals were also more likely to participate in drills and to have household plans. Individuals who were barely or not at all religious were more likely to be in the precontemplation stage than very religious individuals.
• Individuals believed they had a personal responsibility to report suspicious behavior, but greater collaboration between citizens and law enforcement is needed.
Encouragingly, a very high percentage (96%) of individuals believed that they had a personal responsibility to report suspicious behavior to the appropriate authorities. Despite this high level of perceived responsibility, 13 percent of individuals who had witnessed suspicious behavior or circumstances failed to report the activity or did not take any action.

53 2009 CITIZEN CORPS NATIONAL SURVEY
Additional research should examine why people who have witnessed unusual behavior fail to alert authorities. Outreach and education should address these barriers. Furthermore, because individuals have a high sense of responsibility to report suspicious behavior, individuals should be educated about what behaviors should be considered suspicious, how to contact law enforcement or security, and what types of information or details are most useful to authorities.

54 2009 CITIZEN CORPS NATIONAL SURVEY
THIS PAGE INTENTIONALLY LEFT BLANK

55 2009 CITIZEN CORPS NATIONAL SURVEY
Conclusion and Next Steps FEMA’s Community Preparedness Division 2009 Citizen Corps National Survey offers a comprehensive source of data on the public’s thoughts, perceptions, and behaviors related to preparedness and community safety for multiple hazard types. Survey questions addressed several critical areas in the field of disaster preparedness research including elements of personal preparedness such as stocked supplies, plans, knowledge of community protocols, and training; elicited insights on barriers and motivators to preparedness; and tested social-behavior modeling on disaster preparedness, the Citizen Corps Personal Disaster Preparedness Model.
Findings from this study have important implications for the development of more effective communication and outreach strategies to achieve greater levels of preparedness and participation. While the federal government and national leaders must continue to emphasize the importance of preparedness from a national platform, it is clear that effective strategies for preparedness must be implemented at the community level and through social networks. DHS and FEMA national policy and guidelines issued since September 11, 2001 have recognized the importance of government collaboration with nongovernment sectors and the importance of supporting grassroots efforts such as Citizen Corps.
In addition to the analysis of the Citizen Corps National Survey provided in this report, FEMA’s Community Preparedness Divisions plans to conduct more in-depth analysis of the 2009 survey results and to continue to review other surveys in the public domain. Areas of planned exploration include:
• Further examination of the demographic characteristics of groups who share similar beliefs, attitudes, and behaviors relative to preparedness.
• Evaluation and potential review of the Citizen Corps Personal Disaster Preparedness Model, especially in light of findings that indicate stark differences in the perceived utility of preparing for natural vs. mandmade disasters.
• An in-depth examination of the impact of the H1N1 influenza pandemic on individual preparedness and shifts in attitudes and behaviors related to infectious diseases, and public outreach specific to H1N1.
There are also many other areas of needed research to understand more fully the complexities of motivating and sustaining personal preparedness and participation. Areas for future research include:
• An exploration of different perceptions of hazard types and how perception affects preparedness, to include terminology such as “disaster,” “terrorism,” “pandemic flu,” and “preparedness.”
• A clearer assessment of the most critical knowledge, skills, and supplies needed for effective personal response, to include an examination of survivor and nonsurvivor behavior in actual events. Understanding response will, in turn, inform appropriate areas of emphasis for preparedness training and education.

56 2009 CITIZEN CORPS NATIONAL SURVEY
• How sociodemographic factors relate to preparedness and how outreach strategies should be tailored to achieve the greatest impact for targeted audiences.
• Qualitative research such as focus groups or interviews to explore more fully how individuals understand the issues of threat, self-efficacy, and response efficacy and to explore internal and external barriers and motivators to preparedness.
• Testing specific messages, spokespersons, and social marketing strategies that will have greater impact on individuals’ understanding of their role in preparedness and willingness to engage in preparedness activities, to include targeted audiences from sociodemographics segments and from the Stages of Change model.
• An exploration of better ways to deliver training and to practice response skills through multiple and varied types of exercises.
• How social networks such as neighborhoods, the workplace, schools, and faith-based communities can be better used to institutionalize preparedness information, training, and drills, and how civic leaders from these sectors can be more fully engaged in government-led community resilience efforts.
Civic engagement and personal responsibility are rooted in the founding ideology of our Nation, and these principles have deep and abiding implications for our continued national resilience. Comprehensive assessment of personal preparedness in America must be multifaceted, adaptive, and enduring. It requires investment and leadership from all sectors. In the end, it is the toll on human life and on our way of life that makes resilience such a crucial endeavor. We must work together to strengthen social capital, we must learn from each other and learn to help each other, and we must continue to pursue a culture of preparedness through the active participation of all.

57 2009 CITIZEN CORPS NATIONAL SURVEY
OMB Control #: 1670-0006
Expiration Date: 5/31/2010
Appendix A
2009 Citizen Corps National Survey Script
INTRODUCTION //ASK ALL// S1. Hello, my name is ____________ and I am calling from Macro International. We are conducting public opinion research under contract with the Federal Emergency Management Agency (FEMA). For this research, we are obtaining people’s views about how well prepared they are for an emergency or disaster in their communities. Is this a private residence?
01 Yes, continue 02 No, non-residential [Go to S1_02] 03 Hang-up 04 Answering machine 07 Termination screen 14 CONTINUE IN SPANISH 99 REFUSED [TERMINATE, INITIAL REFUSAL]
//ASK IF S1=02// (S1_02) Thank you very much, but we are only interviewing private residences. Thank you for your time.
//ASK IF S1=01//
S2. I would like to speak with an adult, age 18 or older, who lives in the household. Would that be you?
01 YES //GO TO Intro2a// 02 NO [ASK TO TRANSFER TO ADULT]
99 REFUSED //TERMINATE, INITIAL REFUSAL//
//ASK IF S2=02//
NEWS2. May I speak with an adult member of the household?
01 Yes, transferring 02 Not available //schedule callback//
99 REFUSED //TERMINATE, INITIAL REFUSAL//
58 2009 CITIZEN CORPS NATIONAL SURVEY
//ASK IF NewS2=01//
S3. Hello, my name is ____________ and I am calling from Macro International. We are conducting public opinion research under contract with the Federal Emergency Management Agency (FEMA). For this research, we are obtaining people’s views about how well prepared they are for an emergency or disaster in their communities.
01 Continue 99 REFUSED
//ASK IF S2=01 or S3=01//
INTRO2A. The survey will only take about 15 minutes.
Your telephone number was chosen randomly. I will not ask for your name, address, or other personal information that can identify you. You do not have to answer any question you do not want to, and you can end the interview at any time. Your participation in this survey is entirely voluntary. Your answers to the survey questions will be held confidential by Macro International. Your name or any other information that could identify you will not be associated with your responses or used in any reports. If you have any questions, I will provide a telephone number—either here at Macro International or FEMA—for you to call to get more information or to validate this research.
This interview may be monitored for quality assurance purposes.
01 Continue 02 RESPONDENT WANTS MORE INFORMATION 99 REFUSED //TERMINATE, INITIAL REFUSAL//
///ASK IF INTRO2A=02/// INTRO2B. For questions about the survey administration/confidentiality concerns: Nicole Vincent (Macro International) 240-747-4942 For questions about the nature of the study or validity of the study: Jenelle Gabriele (FEMA) 202 786-9463 IF RESPONDENT REQUESTS A CALLBACK, TYPE SUSPEND 01 Continue 99 REFUSED //TERMINATE, INITIAL REFUSAL//

59 2009 CITIZEN CORPS NATIONAL SURVEY
A. SCREENER //ASK ALL// A1. In your current residence, do you live…?
01 With family members 02 With roommates (including boyfriend/girlfriend) 03 With both family members and roommates 04 Alone 97 DON’T KNOW 99 REFUSED
//ASK IF A1=01 or 02 or 03// A2. Are there children under the age of 18 living in your residence?
01 YES 02 NO 97 DON’T KNOW 99 REFUSED //ASK IF A2=01// A3. Does at least one of the children currently attend a school outside of your home, including day care or
part-time kindergarten?
02 YES 03 NO
97 DON’T KNOW 99 REFUSED
//ASK ALL// A4. Which best describes your job status? [INTERVIEWER: READ LIST, CHOOSE UP TO TWO RESPONSES] ///MUL=2///
01 Work full-time 02 Work part-time 03 Student 04 Unemployed 05 Retired 95 Other 97 DON’T KNOW 99 REFUSED

60 2009 CITIZEN CORPS NATIONAL SURVEY
B. UTILITY //ASK ALL// B1T. I’d like to ask you some questions about different kinds of disasters. Throughout this survey, when I use the term “disaster”, I am referring to events that could disrupt water, power, transportation, and also emergency and public services for up to three days. //SPECIAL// THROUGHOUT SURVEY MAKE THIS STATEMENT AVAILABLE TO CALLERS WHEN
THEY TYPE “SPECIAL”: Throughout this survey, when I use the term “disaster”, I am referring to events that could disrupt water, power,
transportation, and also emergency and public services for up to three days. //ASK ALL// B1. In a natural disaster, such as an earthquake, a hurricane, a flood, a tornado, or wildfires, which of the
following statements best represents your belief? 01 I can handle the situation without any preparation. 02 Preparation, planning, and emergency supplies will help me handle the situation. 03 Nothing I do to prepare will help me handle the situation. 97 DON’T KNOW 99 REFUSED
//ROTATE B2, B3, B4// ///START ROTATE/// //ASK ALL// B2. In an act of terrorism, such as a biological, chemical, radiological, or explosive attack, which of the
following statements best represents your belief? 01 I can handle the situation without any preparation. 02 Preparation, planning, and emergency supplies will help me handle the situation. 03 Nothing I do to prepare will help me handle the situation. 97 DON’T KNOW 99 REFUSED

61 2009 CITIZEN CORPS NATIONAL SURVEY
//ASK ALL// B3. In a hazardous materials accident, such as a transportation accident or a power plant accident, which of
the following statements best represents your belief?
01 I can handle the situation without any preparation. 02 Preparation, planning, and emergency supplies will help me handle the situation. 03 Nothing I do to prepare will help me handle the situation. 97 DON’T KNOW 99 REFUSED
//ASK ALL// B4. In a severe disease outbreak, such as a bird flu epidemic, which of the following statements best
represents your belief?
01 I can handle the situation without any preparation. 02 Preparation, planning, and emergency supplies will help me handle the situation. 03 Nothing I do to prepare will help me handle the situation. 97 DON’T KNOW 99 REFUSED
///END ROTATE/// C. RISK AWARENESS / PERCEPTION //ASK ALL// On a scale of 1 to 5, with 5 being “very likely” and 1 being “not likely at all,” how likely do you think…? C1. Some type of natural disaster
will ever occur in your community?
05 VERY LIKELY 04 03 02 01 NOT LIKELY AT ALL 97 DON’T KNOW 99 REFUSED [CATI: DISPLAY LEAD STATEMENT FROM SECTION C INTRO FOR ITEMS C2through C8: “On a scale of 1 to 5, with 5 being “very likely” and 1 being “not likely at all,” how likely do you think…?”] //ASK ALL// C2. Some type of terrorism
will ever occur in your community?
//ASK ALL// C3. Some type of hazardous materials accident will ever occur in your community?

62 2009 CITIZEN CORPS NATIONAL SURVEY
//ASK ALL// C4. Some type of disease outbreak
will ever occur in your community?
D. SEVERITY //ASK ALL// D1. If a [fill in from below] were to happen in your community how severe do you think the impact would be
to you? Please use a scale of 1 to 5, with 5 being “very severe” and 1 being “not severe at all.” //ROTATE A - D//
a. A natural disaster, such as an earthquake, a hurricane, a flood, a tornado, or wildfires b. An act of terrorism, such as biological , chemical, radiological, or explosive attack c. A hazardous materials accident, such as a transportation accident or a power plant accident d. A highly contagious disease outbreak, such as a bird flu epidemic
05 VERY SEVERE 04 03 02 01 NOT SEVERE AT ALL 97 DON’T KNOW 99 REFUSED
E. STAGES OF CHANGE //ASK ALL// EINTRO. As we continue with the survey, I will ask you questions about being prepared for a disaster. When I
use the words “preparing” or “prepared”, I’m referring to actions people can take at any time to prevent or reduce the impact of disasters on their lives.
//ASK ALL// E1. How confident are you about your own ability to prepare for a disaster? Please use a scale of 1 to 5, with 5
being “very confident” and 1 being “not at all confident.” 05 VERY CONFIDENT 04 03 02 01 NOT VERY CONFIDENT
97 DON’T KNOW 98 REFUSED

63 2009 CITIZEN CORPS NATIONAL SURVEY
//ASK ALL// E2. In thinking about preparing yourself for a major disaster, which best represents your preparedness? [INTERVIEWER: READ ENTIRE LIST, CHECK ONLY ONE RESPONSE]
01 I have not yet prepared but I intend to in the next 6 months
02 I have not yet prepared but I intend to in the next month
03 I just recently began preparing
04 I have been prepared for at least the past 6 months
05 I am not planning to do anything about preparing
97 DON’T KNOW 99 REFUSED
//ASK IF E2=01, 02, or 05// E3. For each of the following statements, please tell me whether it is “The primary reason”, “Somewhat of a
reason,” or “Not a reason at all” why you have not taken any disaster preparedness steps? //ROTATE A - G//
a. I don’t know what I’m supposed to do. b. I just haven’t had the time. c. I don’t want to think about it d. It costs too much. e. I don’t think it will make a difference f. I don’t think I’d be able to g. I think that emergency responders, such as fire, police or emergency personnel, will help me. 01 A Primary Reason 02 Somewhat of a reason 03 Not a reason at all 97 DON’T KNOW 99 REFUSED

64 2009 CITIZEN CORPS NATIONAL SURVEY
F. RELIANCE //ASK ALL// F1. In the first 72 hours following a disaster, please indicate how much you would expect to rely on the
following for assistance. Please use a scale of 1 to 5, with 5 being “expect to rely on a great deal” and 1 being “do not expect to rely on at all.”
//ROTATE A - F//
a. Household members b. People in my neighborhood c. Non-profit organizations, such as the American Red Cross or the Salvation Army d. My faith community, such as a congregation e. Fire, police, emergency personnel f. State and Federal Government agencies, including FEMA
05 EXPECT TO RELY ON A GREAT DEAL 04 03 02 01 DO NOT EXPECT TO RELY ON AT ALL
97 DON’T KNOW
99 REFUSED //ASK ALL// F2. In the event of a disaster, would you expect to need help to evacuate from the area?
01 YES 02 NO 97 DON’T KNOW 99 REFUSED
65 2009 CITIZEN CORPS NATIONAL SURVEY
//ASK IF F2=01// F3. What kind of help do you think you would need to evacuate from the area? //DO NOT READ LIST// [PROBE: ANYTHING ELSE? RECORD ALL RESPONSES] ///MUL=7///
01 DON’T HAVE A PLACE TO GO 02 INFORMATION ON THE EVACUATION ROUTE 03 TRANSPORTATION OUT OF THE AREA 04 HAVE A DISABILITY AND NEED HELP GETTING OUT OF MY HOME/WORKPLACE 05 HELP EVACUATING MY PET(S) 06 CONCERNED ABOUT GETTING GAS FOR MY VEHICLE 95 OTHER [RECORD RESPONSE] 97 DON’T KNOW 99 REFUSED
///ASK IF F3=95 F3OTH. ENTER OTHER RESPONSE ______________ G. PERSONAL RESPONSE/EFFICACY //ASK ALL// G1. How confident are you in your ability to know what to do in the first 5 minutes of [fill in from below]?
Please use a scale of 1 to 5, with 5 being “very confident” and 1 being “not at all confident.” ///ROTATE A-D///
a. A terrorist act such as an explosion of a radiological or dirty bomb? b. A hazardous materials accident such as the release of a chemical agent? c. An explosion or bomb? d. A sudden natural disaster such as an earthquake or tornado that occurs without warning?
05 VERY CONFIDENT 04 03 02 01 NOT VERY CONFIDENT
97 DON’T KNOW 100REFUSED

66 2009 CITIZEN CORPS NATIONAL SURVEY
//ASK ALL// G2. How much do you think preparing for a ///FILL IN FROM BELOW/// will make a difference in how you
handle the situation? Please use a scale of 1 to 5, 5 being “very much” and 1 being “not much at all.” ///ROTATE A - D///
a. A terrorist act such as an explosion of a radiological or dirty bomb? b. A hazardous materials accident such as the release of a chemical agent? c. An explosion or bomb? d. A highly contagious disease outbreak such as bird flu? e. A natural disaster?
05 VERY MUCH 04 03 02 01 NOT MUCH AT ALL
97 DON’T KNOW
99 REFUSED //ASK ALL// G3. In the past 2 years, have you done any of the following? Have you… ///ROTATE ITEMS a-e///
a. Attended a meeting on how to be better prepared for a disaster b. Attended CPR training c. Attended first aid skills training d. Attended training as part of a Community Emergency Response Team or CERT e. Talked about getting prepared with others in your community
01 YES 02 NO 97 DON’T KNOW 99 REFUSED
67 2009 CITIZEN CORPS NATIONAL SURVEY
[If any of G3a-d=01] G4. What motivated you to take this training? [INTERVIEWER: DO NOT READ LIST] [PROBE: Anything else? Record all responses] ///MUL=9///
01 MANDATORY FOR JOB/SCHOOL 02 EASY TO SIGN UP (E.G., OFFERED AT WORK, SCHOOL OR PLACE OF WORSHIP) 03 CONCERN FOR PERSONAL SAFETY 04 CONCERN FOR SAFETY OF FAMILY OR OTHERS 05 TO HAVE THE NECESSARY SKILLS TO HELP OTHERS 06 GENERAL INTEREST/HOBBY 07 TO BE PREPARED 08 BECAUSE OTHERS (FAMILY OR FRIENDS) DID 95 OTHER (Specify) 97 DON’T KNOW 99 REFUSED
///ASK IF G4=95 G4OTH. ENTER OTHER RESPONSE ______________ [If all of G3a-d <> 01 ask G5] G5. What is the main reason you have not received any preparedness training? DO NOT READ LIST.
[PROBE: Anything else? Record all responses] //MUL=8//
01 LACK OF TIME 02 LACK OF MONEY/TOO EXPENSIVE 03 DON’T THINK IT’S IMPORTANT 04 HAVEN’T THOUGHT ABOUT IT 05 DIFFICULT TO GET INFORMATION ON WHAT TO DO 06 DON’T THINK IT WILL BE EFFECTIVE 07 ALREADY KNOW HOW TO BE PREPARED 08 PHYSICALLY UNABLE TO GET TO A TRAINING 97 DON’T KNOW 99 REFUSED

68 2009 CITIZEN CORPS NATIONAL SURVEY
H. PREVENTION //ASK ALL// Now I’d like to ask you a series of questions about noticing and reporting suspicious behavior or circumstances. H1. In the past 12 months, have you seen any suspicious behavior or circumstances?
01 YES 02 NO
97 DON’T KNOW 99 REFUSED
//ASK If H1=01// H2. What did you do? [INTERVIEWER: DO NOT READ LIST, RECORD ALL RESPONSES] ///MUL=5///
01 CALLED POLICE AND/OR A TIPLINE 02 CALLED NEIGHBOR/FRIEND 03 WAITED FOR SOMEONE ELSE TO DO SOMETHING 04 LEFT THE AREA/SITUATION/EVENT 05 NOTHING 95 OTHER (Specify) 97 DON’T KNOW 99 REFUSED
///ASK IF H2=95 H2OTH. ENTER OTHER RESPONSE ______________ //ASK ALL// H3. Do you feel you have a personal responsibility to report suspicious behavior or circumstances to the
authorities?
01 YES 02 NO 97 DON’T KNOW 99 REFUSED
69 2009 CITIZEN CORPS NATIONAL SURVEY
I. DISASTER SUPPLIES
//ASK ALL//
For this next set of questions, I’d like to ask you about some specific things you may or may not have done to prepare yourself and/or your household.
I1. Do you have supplies set aside in your home
to be used only in the case of a disaster?
01 YES 02 NO 97 DON’T KNOW 99 REFUSED
//ASK IF I1=01// I2. Could you tell me the disaster supplies you have in your home?
[DO NOT READ LIST]
[PROBE: ANYTHING ELSE?. RECORD ALL RESPONSES]
///MUL=12///
1 A SUPPLY OF BOTTLED WATER 2 A SUPPLY OF PACKAGED FOOD 3 A FLASHLIGHT 4 A PORTABLE, BATTERY-POWERED RADIO 5 BATTERIES 6 A FIRST AID KIT 7 EYEGLASSES 8 MEDICATIONS 9 PHOTOCOPIES OF PERSONAL IDENTIFICATION 10 FINANCIAL DOCUMENTS 11 CASH
95 OTHER (Specify) 97 DON’T KNOW 99 REFUSED
///ASK IF I2=95 I2OTH. ENTER OTHER RESPONSE ______________

70 2009 CITIZEN CORPS NATIONAL SURVEY
//ASK IF I1=01// I3. How often do you update these supplies? Would you say…
01 Never
02 Less than once a year
03 Once a year
04 More than once a year
97 DON’T KNOW 99 REFUSED
//ASK ALL//
I4. Do you have supplies set aside in your car
to be used only in the case of a disaster?
01 YES 02 NO 03 DON’T OWN A CAR 97 DON’T KNOW 99 REFUSED
//ASK IFA4=01 or 02// I5. Do you have supplies set aside in your workplace
to be used only in the case of a disaster?
01 YES 02 NO 97 DON’T KNOW 99 REFUSED
71 2009 CITIZEN CORPS NATIONAL SURVEY
J. HOUSEHOLD PLAN
//ASK ALL//
J1. Does your household have an emergency plan that includes instructions for household members about where to go and what to do in the event of a disaster?
01 YES 02 NO 97 DON’T KNOW 99 REFUSED
//ASK IFJ1=01//
J2. Have you discussed this plan with other members in your household?
01 YES 02 NO 97 DON’T KNOW 99 REFUSED
//ASK ALL//
J3. Do you have copies of important financial or insurance documents in a safe place to help you rebuild or seek assistance following a disaster?
01 YES 02 NO 97 DON’T KNOW 99 REFUSED

72 2009 CITIZEN CORPS NATIONAL SURVEY
K. COMMUNITY PLAN
//ASK ALL//
K1. Using a scale of 1 to 5 with 5 being “very familiar” and 1 being “not at all familiar,” how familiar are you with…
//ROTATE A - F//
a. Alerts and warning systems in your community? b. Official sources of public safety information? c. Community evacuation routes? d. Shelter locations near you? e. How to get help with evacuating or getting to a shelter? f. Information on what your local hazards are? g. How to get local information about a public health emergency, such as the H1N1 virus or swine flu?
01 NOT AT ALL FAMILIAR 02 03 04 05 VERY FAMILIAR 97 DON’T KNOW 99 REFUSED
//ASK IF A3=01// K2. Are you aware of the details of the emergency or evacuation plan of the child(ren)’s school including
where the school plans to evacuate and how to get information about the child in the event of a disaster? 01 YES 02 NO 97 DON’T KNOW 99 REFUSED
73 2009 CITIZEN CORPS NATIONAL SURVEY
K3. From which organizations in your community have you received information about the recent outbreak of the H1N1 virus or swine flu? We are talking about information that may have been provided through tv/radio, emails, flyers, presentation, phone calls),? [read all responses. Multiple choices allowed]
01 Local media 02 Local government official 03 Health care provider 04 Neighborhood association 05 Faith-based organization 06 Schools or childcare facilities 07 Workplace 08 None 09 Other [record response]
L. DRILLS/EXERCISES //ASK ALL// L1. Aside from a fire drill, in the past 12 months, have you participated in any of the following? //ROTATE LIST //
a. ///ASK ALL/// A homeb. ///ASK ALL/// A
evacuation drill home
c. ///ASK IFA4=01 or 02/// A shelter in place drill
workplaced. ///ASK IFA4=01 or 02///A
evacuation drill workplace
e. ///ASK IF A3=01 OR A4=03///A shelter in place drill
schoolf. ///ASK IF A3=01 OR A4=03///A
evacuation drill school
shelter in place drill
01 YES 02 NO 97 DON’T KNOW 99 REFUSED M. VOLUNTEERING //ASK ALL//
M1. During the past 12 months, have you given any time to help support emergency responder organizations or an organization that focuses on community safety, such as Neighborhood Watch?
01 YES 02 NO 97 DON’T KNOW 99 REFUSED
74 2009 CITIZEN CORPS NATIONAL SURVEY
//ASK IFM1=01//
M2. Which one or ones?
01 [Record all responses]
97 DON’T KNOW 99 REFUSED
///ASK IF M2=01///
M2O. ENTER RESPONSE ___________________
//ASK ALL//
M3. Have you ever volunteered to help in a disaster?
01 YES 02 NO 97 DON’T KNOW 99 REFUSED
//ASK ALL//
M4. Would you be willing to take a 20 hour training course to be qualified to help your community recover from disasters?
01 YES 02 NO 97 DON’T KNOW 99 REFUSED

75 2009 CITIZEN CORPS NATIONAL SURVEY
N. DEMOGRAPHICS AND CONTEXT
//ASK ALL// Lastly, I would like to ask you for some information about you and your household. Again, all information that you provide will be held confidential. N1. Would you describe the location of your residence as…?
01 Urban 02 Suburban 03 Rural 97 DON’T KNOW 99 REFUSED
//ASK IF A4=01,02,03// N2 Do you generally use public transportation, such as subways or buses, to get to school or work?
01 YES 02 NO 97 DON’T KNOW 99 REFUSED
//ASK ALL// N3. What is the highest level of education that you attained? Would it be…?
01 Less than 12th Grade (no diploma) 02 High School Graduate or GED 03 Some College but No Degree 04 Associate Degree in College 05 Bachelor’s Degree 06 Masters Degree 07 Doctorate Degree 97 DON’T KNOW 99 REFUSED
//ASK ALL// N4. Do you have a disability that would affect your capacity to respond to an emergency situation?
01 YES 02 NO 97 DON’T KNOW 99 REFUSED

76 2009 CITIZEN CORPS NATIONAL SURVEY
//ASK ALL//
N5. Do you currently live with or care for someone with a disability, including someone elderly who requires assistance?
01 YES 02 NO 97 DON’T KNOW 99 REFUSED
//ASK ALL// N6. How religious would you say you are? Would you say…
01 Very religious 02 Somewhat religious 03 Barely religious 04 Not at all religious 97 DON’T KNOW 99 REFUSED
//ASK ALL// N7. Which of the following best describes your race? Would you consider yourself to be…? ///MUL=6/// 01 White
02 Black or African American 03 Asian 04 American Indian or Alaska Native 05 Native Hawaiian or Other Pacific Islander 95 Something else (Specify) 97 DON’T KNOW 99 REFUSED
///ASK IF N7=95/// N7OTH. ENTER RESPONSE _____________________

77 2009 CITIZEN CORPS NATIONAL SURVEY
//ASK ALL// N8. Are you of Hispanic or Latino or Spanish origin?
01 YES 02 NO 97 DON’T KNOW 99 REFUSED
//ASK ALL// N9. In what year were you born? Enter response _ _ _ _ [RANGE 1900-1991//]
9997 DON’T KNOW 9999 REFUSED
//ASK ALL// N10. Which of the following income ranges represents your annual household income in 2008? Feel free to stop me at the correct range. Was your household income…?
01 Less than $25,000 02 $25,000 to less than $50,000 03 $50,000 to less than $75,000 04 $75,000 or more 97 DON’T KNOW 99 REFUSED

78 2009 CITIZEN CORPS NATIONAL SURVEY
//ASK ALL// N11. What state do you live in? _ _ AL Alabama MD Maryland SC South Carolina
AK Alaska MA Massachusetts SD South Dakota
AZ Arizona MI Michigan TN Tennessee
AR Arkansas MN Minnesota TX Texas
CA California MS Mississippi UT Utah
CO Colorado MO Missouri VT Vermont
CT Connecticut MT Montana VA Virginia
DE Delaware NE Nebraska WA Washington
DC District of Columbia NV Nevada WI Wisconsin
FL Florida NH New Hampshire WV West Virginia
GA Georgia NJ New Jersey WY Wyoming
HI Hawaii NM New Mexico
ID Idaho NY New York AS American Samoa
IL Illinois NC North Carolina CN Northern Mariana Islands
IN Indiana ND North Dakota GU Guam
IA Iowa OH Ohio PR Puerto Rico
KS Kansas OK Oklahoma VI Virgin Islands
KY Kentucky OR Oregon 95 Other
LA Louisiana PA Pennsylvania 97 DON'T KNOW
ME Maine RI Rhode Island 99 REFUSED
///ASK IF N11=95/// N11OTH.. ENTER OTHER RESPONSE ______________ //ASK ALL//

79 2009 CITIZEN CORPS NATIONAL SURVEY
N12. What is your zip code? _ _ _ _ _ //RANGE 00000-99996// 99997 DON’T KNOW 99999 REFUSED ///ASK ALL/// N13. Record gender [DO NOT ASK]
01 Men 02 Women
CLOSE1. Those are all of the questions that I have. On behalf of Macro International and FEMA, I would like to thank you for your time and participation. Thank you again.

80 2009 CITIZEN CORPS NATIONAL SURVEY
THIS PAGE INTENTIONALLY LEFT BLANK

81 2009 CITIZEN CORPS NATIONAL SURVEY
Appendix B
Survey Respondents’ Profile
To understand the National results we begin with the overall demographic profile. The charts below display the distribution of demographics across the national sample:
In your current residence, do you live…? Weighted
With family members 80%
With roommates (including boyfriend/girlfriend) 3%
With both family members and roommates 2%
Alone 15%
Are there children under the age of 18 living in your residence? Weighted
Yes 52%
No 48%
Does at least one of the children currently attend a school outside of your home, including day care or part-time kindergarten?
Weighted
Yes 83%
No 17%
Which best describes your job status? Weighted
Work full-time 49%
Work part-time 12%
Student 6%
Unemployed 9%
Retired 19%
Other 7%

82 2009 CITIZEN CORPS NATIONAL SURVEY
Would you describe the location of your residence as…? Weighted
Urban 25%
Suburban 43%
Rural 30%
Do you generally use public transportation, such as subways or buses, to get to school or work?
Weighted
Yes 10%
No 90%
Gender Weighted
Male 49%
Female 51%
Do you have a disability that would affect your capacity to respond to an emergency situation?
Weighted
Yes 15%
No 85%
Do you currently live with or care for someone with a disability, including some elderly who requires assistance?
Weighted
Yes 14%
No 86%
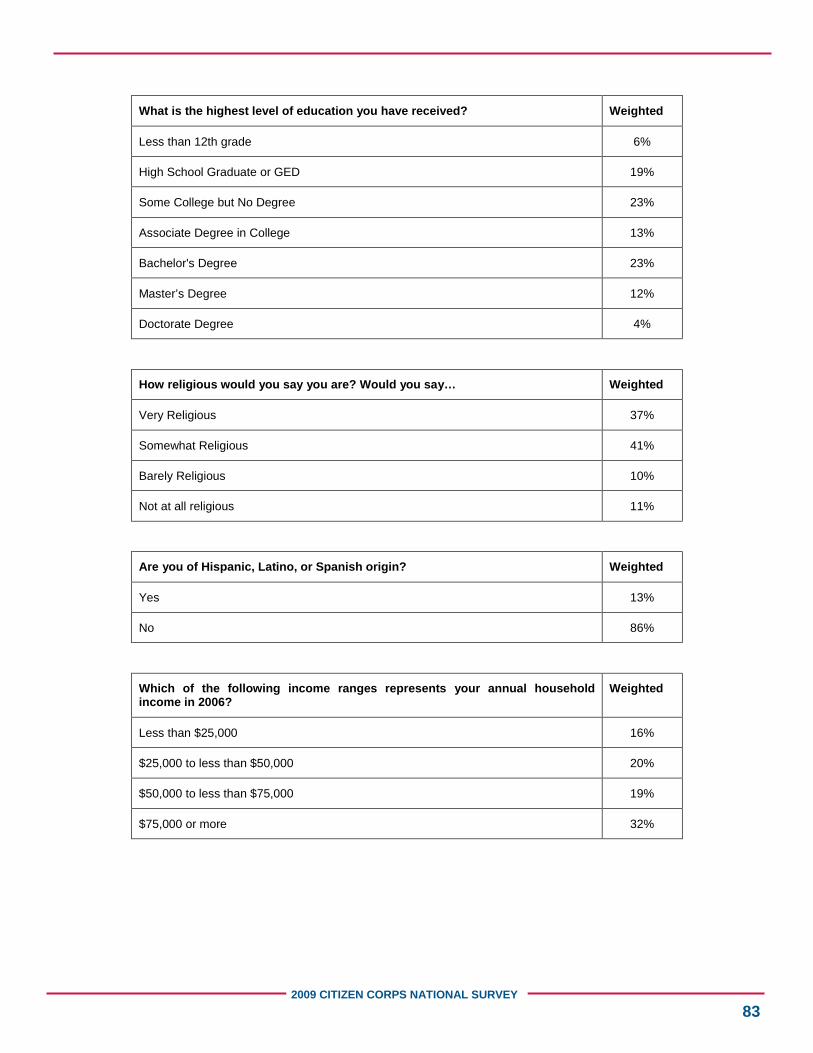
83 2009 CITIZEN CORPS NATIONAL SURVEY
What is the highest level of education you have received? Weighted
Less than 12th grade 6%
High School Graduate or GED 19%
Some College but No Degree 23%
Associate Degree in College 13%
Bachelor's Degree 23%
Master’s Degree 12%
Doctorate Degree 4%
How religious would you say you are? Would you say… Weighted
Very Religious 37%
Somewhat Religious 41%
Barely Religious 10%
Not at all religious 11%
Are you of Hispanic, Latino, or Spanish origin? Weighted
Yes 13%
No 86%
Which of the following income ranges represents your annual household income in 2006?
Weighted
Less than $25,000 16%
$25,000 to less than $50,000 20%
$50,000 to less than $75,000 19%
$75,000 or more 32%

84 2009 CITIZEN CORPS NATIONAL SURVEY


