OfficeofInstitutionalResearch1Citrus College Cafeteria Survey Report Office of Institutional Research March 2013 In December 2012, faculty/staff and students at Citrus College were asked to complete a 17-item survey which assessed on-campus dining habits, food and beverage preferences, and satisfaction with the on-campus dining services. A total of 543 surveys were completed: faculty/ staff (n=218), students (n=261), and unknown role (n=64). Question 1 asked participants how many times they purchase the following in the Owl Café in a typical week. A total of 541 participants responded to this question. The data revealed that participants purchased lunch most frequently in the Owl Café and breakfast the least. Figure 1 illustrates the frequency of all responses. Figure 1. Frequency of responses regarding types of food purchased at the Owl Cafe 0 100 200 300 400 500 600 Breakfast Lunch Snacks Beverage 6timesormoreperweek 4‐5timesperweek 2‐3timesperweek Onceperweekorless Never Notsure
Transcript
Office of Institutional Research 1
Citrus College Cafeteria Survey Report
Office of Institutional Research March 2013
In December 2012, faculty/staff and students at Citrus College were asked to complete a 17-item survey which assessed on-campus dining habits, food and beverage preferences, and satisfaction with the on-campus dining services. A total of 543 surveys were completed: faculty/ staff (n=218), students (n=261), and unknown role (n=64).
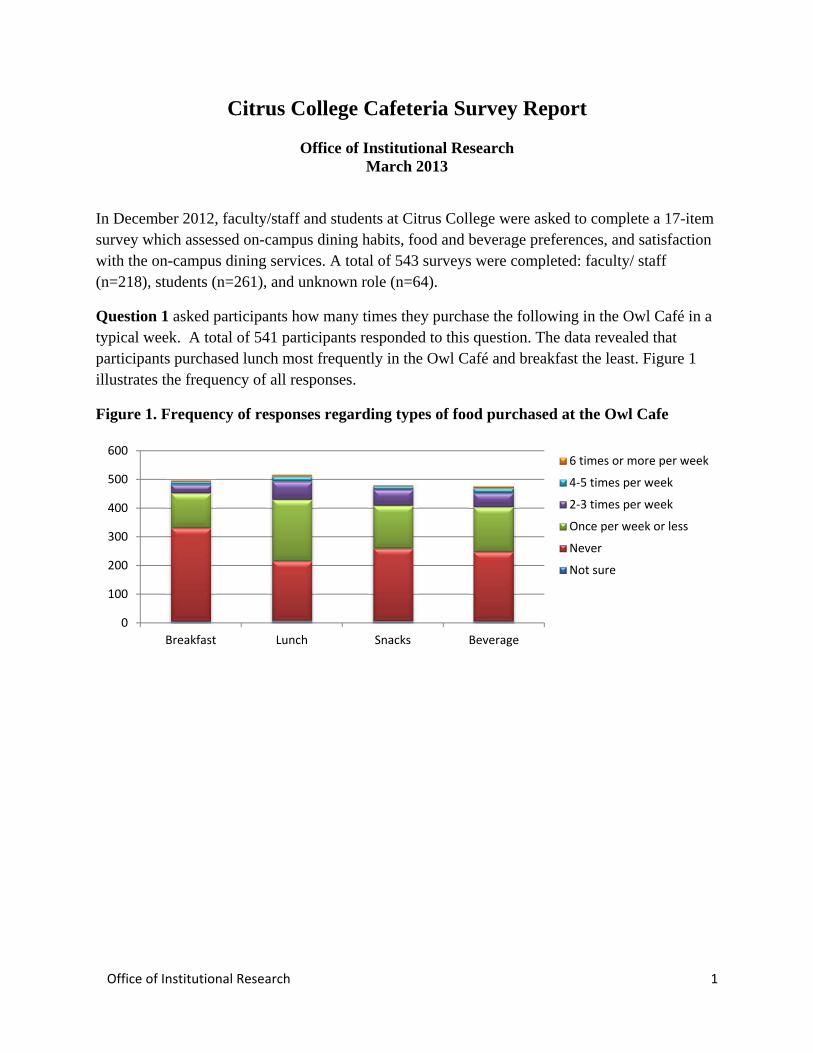
Question 1 asked participants how many times they purchase the following in the Owl Café in a typical week. A total of 541 participants responded to this question. The data revealed that participants purchased lunch most frequently in the Owl Café and breakfast the least. Figure 1 illustrates the frequency of all responses.
Figure 1. Frequency of responses regarding types of food purchased at the Owl Cafe
0
100
200
300
400
500
600
Breakfast Lunch Snacks Beverage
6 times or more per week
4‐5 times per week
2‐3 times per week
Once per week or less
Never
Not sure
Office of Institutional Research 2
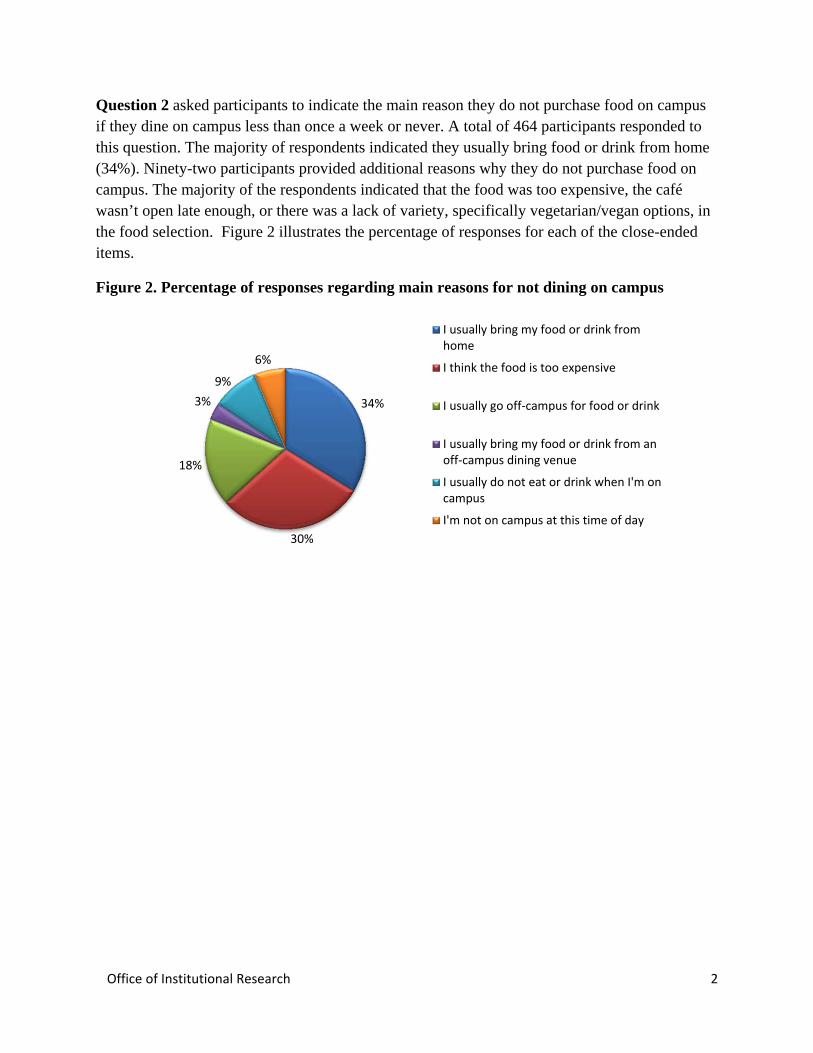
Question 2 asked participants to indicate the main reason they do not purchase food on campus if they dine on campus less than once a week or never. A total of 464 participants responded to this question. The majority of respondents indicated they usually bring food or drink from home (34%). Ninety-two participants provided additional reasons why they do not purchase food on campus. The majority of the respondents indicated that the food was too expensive, the café wasn’t open late enough, or there was a lack of variety, specifically vegetarian/vegan options, in the food selection. Figure 2 illustrates the percentage of responses for each of the close-ended items.
Figure 2. Percentage of responses regarding main reasons for not dining on campus
34%
30%
18%
3%
9%
6%
I usually bring my food or drink fromhome
I think the food is too expensive
I usually go off‐campus for food or drink
I usually bring my food or drink from anoff‐campus dining venue
I usually do not eat or drink when I'm oncampus
I'm not on campus at this time of day
Office of Institutional Research 3
Question 3 asked participants to indicate how often they select the following venues if they go of campus for dining options. A total of 492 participants responded to this question. The majority of respondents reported dining at sandwich shops. The least amount of participants reported dining at sushi restaurants. Forty-nine participants responded “other” and provided open-ended comments to specify. The majority of comments were in reference to buying food at a local grocery store, Asian foods (i.e. Thai, Chinese), or bringing food from home. Figure 3 illustrates the frequency of responses for each of the close-ended items.
Figure 3. Frequency of responses regarding types of off campus dining preferences
0
50
100
150
200
250
300
350
400
450
500
Specialty coffee
shop
(Starbucks, the Grind, Coffee
Bean, etc.)
Fast food chains (M
cDonald's,
Jack in
the Box, Burger King,
etc.)
Sandwich shops or chains
(Subway, Plaza Produce, Jersey
Mike's, etc.)
Local or sm
all chain hot
sandwich ( ham
burger,
Tommy's) restaurants
Pizza restaurants
Sushi restaurants
Mexican
restaurants
6 times or more per week
4‐5 times per week
2‐3 times per week
Once per week or less
Never
Not sure
Office of Institutional Research 4
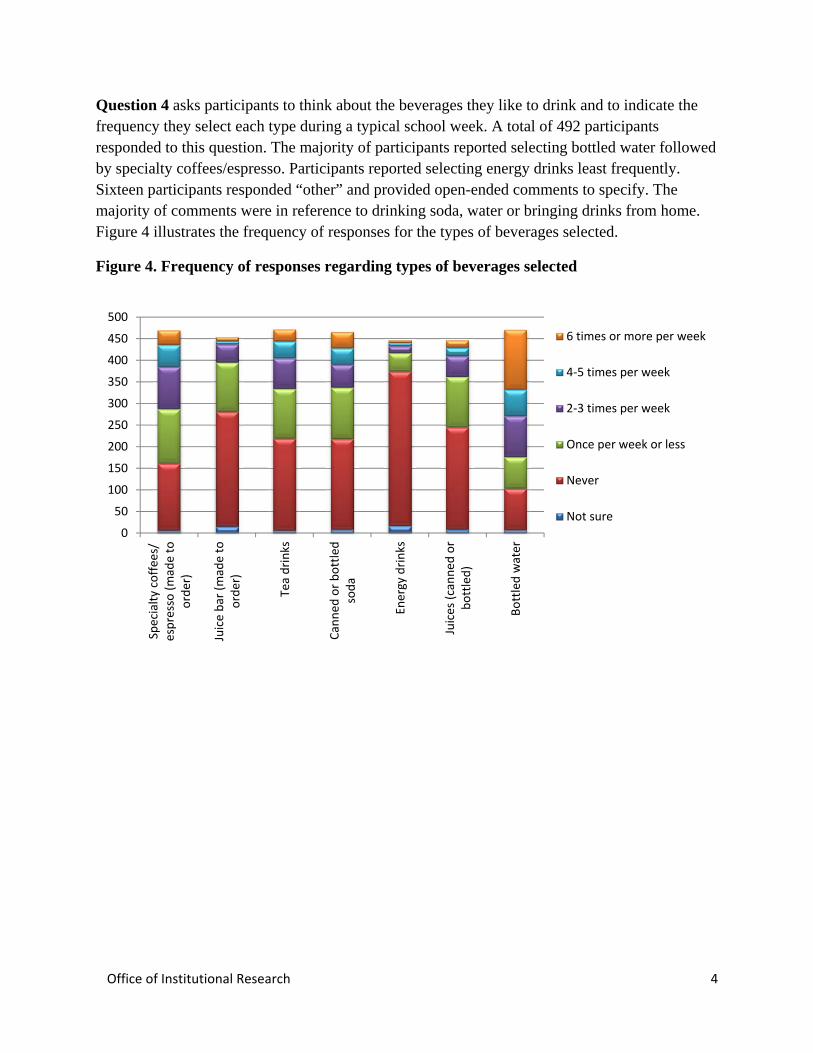
Question 4 asks participants to think about the beverages they like to drink and to indicate the frequency they select each type during a typical school week. A total of 492 participants responded to this question. The majority of participants reported selecting bottled water followed by specialty coffees/espresso. Participants reported selecting energy drinks least frequently. Sixteen participants responded “other” and provided open-ended comments to specify. The majority of comments were in reference to drinking soda, water or bringing drinks from home. Figure 4 illustrates the frequency of responses for the types of beverages selected.
Figure 4. Frequency of responses regarding types of beverages selected
0
50
100
150
200
250
300
350
400
450
500
Specialty coffees/
espresso (made to
order)
Juice bar (made to
order)
Tea drinks
Canned
or bottled
soda
Energy drinks
Juices (canned
or
bottled)
Bottled water
6 times or more per week
4‐5 times per week
2‐3 times per week
Once per week or less
Never
Not sure
Office of Institutional Research 5
Question 5 asked participants to think about the foods they like to eat and to indicate how often they eat each of those types of food during a typical school week. A total of 490 participants responded to this question. The data reveal that toast or bagels are consumed the most followed by cereal and oatmeal while donuts are consumed the least. Fourteen participants responded “other” and provided open-ended comments to specify. Of those comments, the majority of participants responded that they eat fresh fruit, yogurt, or vegetarian/vegan meals. Figure 5 shows the list of all closed-ended responses.
Figure 5. Frequency of responses regarding types of breakfast food consumed
0
50
100
150
200
250
300
350
400
450
500
Breakfast burritos
Eggs/O
melets (m
ade
to order)
Toast or bagels
Cereal or oatmeal
Yogurt
Pancakes or waffles
Egg/meat sandwiches
Donuts
Pastries
6 times or more per week
4‐5 times per week
2‐3 times per week
Once per week or less
Never
Not sure
Office of Institutional Research 6
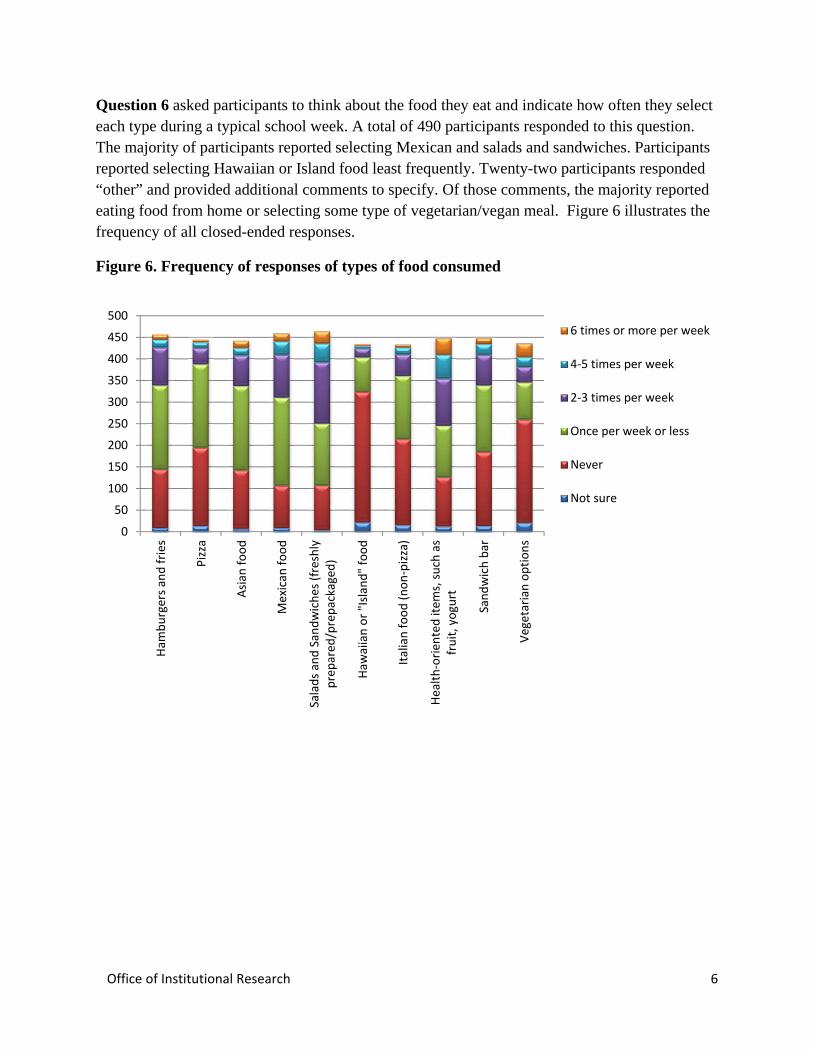
Question 6 asked participants to think about the food they eat and indicate how often they select each type during a typical school week. A total of 490 participants responded to this question. The majority of participants reported selecting Mexican and salads and sandwiches. Participants reported selecting Hawaiian or Island food least frequently. Twenty-two participants responded “other” and provided additional comments to specify. Of those comments, the majority reported eating food from home or selecting some type of vegetarian/vegan meal. Figure 6 illustrates the frequency of all closed-ended responses.
Figure 6. Frequency of responses of types of food consumed
0
50
100
150
200
250
300
350
400
450
500
Ham
burgers and fries
Pizza
Asian
food
Mexican
food
Salads and Sandwiches (freshly
prepared
/prepackaged)
Haw
aiian or "Island" food
Italian food (non‐pizza)
Health‐orien
ted item
s, such as
fruit, yogurt
Sandwich bar
Vegetarian options
6 times or more per week
4‐5 times per week
2‐3 times per week
Once per week or less
Never
Not sure
Office of Institutional Research 7
Question 7 asked participants to rate their satisfaction with several aspects of food service at the Owl Café. A total of 476 participants responded to this question. Convenience of location, payment options, friendliness of staff, and cleanliness of the cafeteria had the most positive ratings (over 60% rated “good” or better). Options for special dietary needs had the poorest ratings. Figure 7 illustrates the frequency of all responses.
Figure 7. Frequency of satisfaction ratings regarding food service at Owl Cafe
0
50
100
150
200
250
300
350
400
450
500
Convenience of locations
Hours of operation (7:30 am to 2:00
pm)
Fair pricing
Paymen
t options (e.g. A
TM, credit
card, cash)
Food quality: taste
Food quality: appearance
Food quality: freshness
Variety of food choices
Dining atmosphere/environment
Seating (sufficient number and
comfort)
Variety of Grab‐n‐Go options
availability of Grab‐n‐Go options
Options for special dietary needs
Cleanliness of the cafeteria
Friendliness of staff
Overall dining experience
Excellent (5)
Very Good (4)
Good (3)
Fair (2)
Poor (1)
N/A
Office of Institutional Research 8
Questions 9-13 were answered by faculty and staff only. These questions were related to the use of banquet and food services for outside guests.
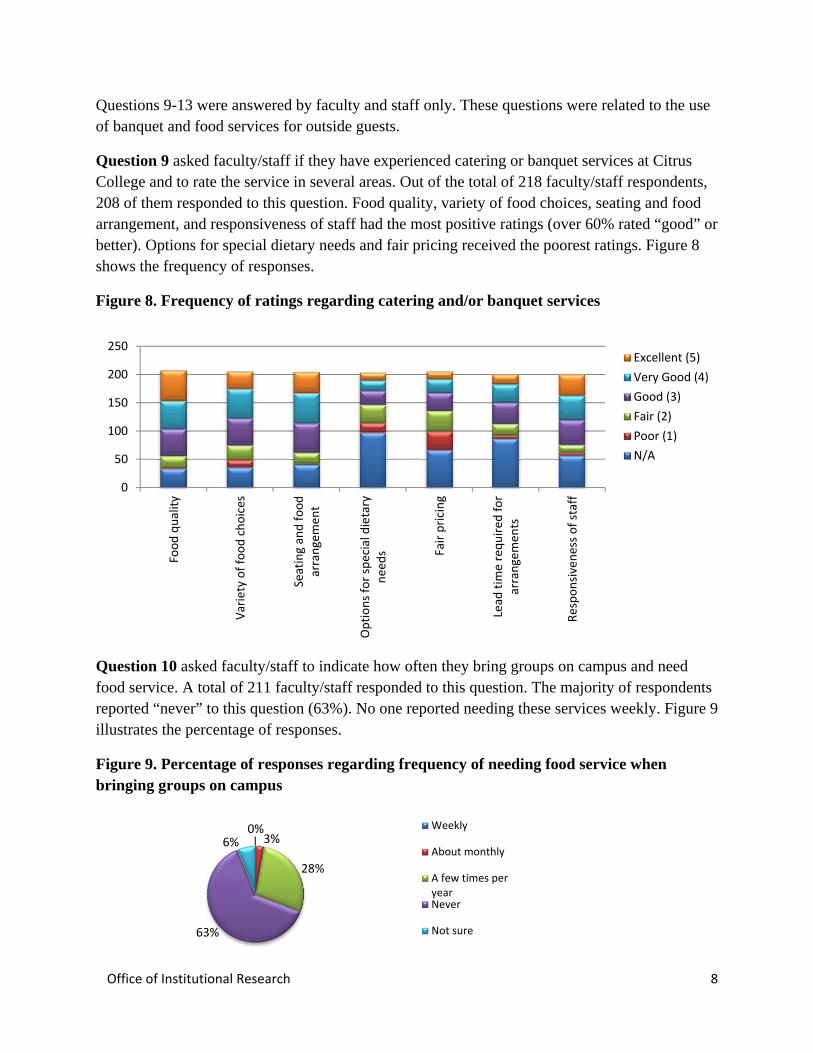
Question 9 asked faculty/staff if they have experienced catering or banquet services at Citrus College and to rate the service in several areas. Out of the total of 218 faculty/staff respondents, 208 of them responded to this question. Food quality, variety of food choices, seating and food arrangement, and responsiveness of staff had the most positive ratings (over 60% rated “good” or better). Options for special dietary needs and fair pricing received the poorest ratings. Figure 8 shows the frequency of responses.
Figure 8. Frequency of ratings regarding catering and/or banquet services
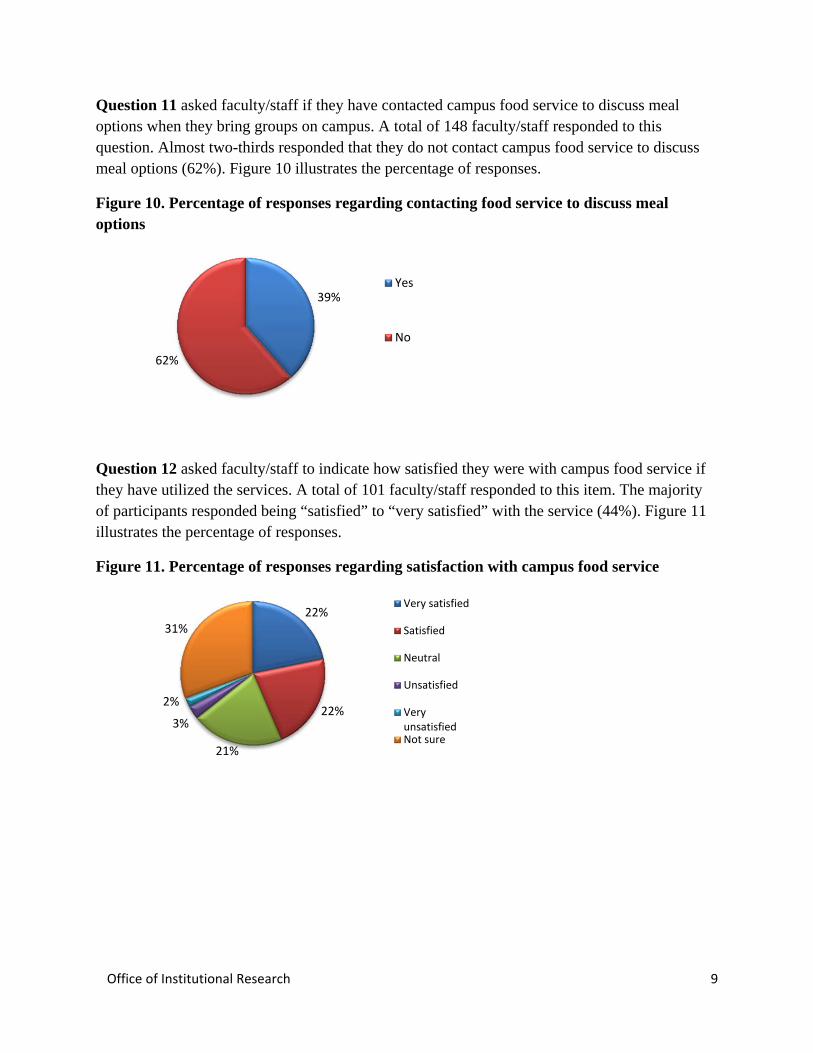
Question 10 asked faculty/staff to indicate how often they bring groups on campus and need food service. A total of 211 faculty/staff responded to this question. The majority of respondents reported “never” to this question (63%). No one reported needing these services weekly. Figure 9 illustrates the percentage of responses.
Figure 9. Percentage of responses regarding frequency of needing food service when bringing groups on campus
0
50
100
150
200
250
Food quality
Variety of food choices
Seating and food
arrangemen
t
Options for special dietary
needs Fair pricing
Lead
tim
e required
for
arrangemen
ts
Responsiveness of staff
Excellent (5)
Very Good (4)
Good (3)
Fair (2)
Poor (1)
N/A
0%3%
28%
63%
6%
Weekly
About monthly
A few times peryearNever
Not sure
Office of Institutional Research 9
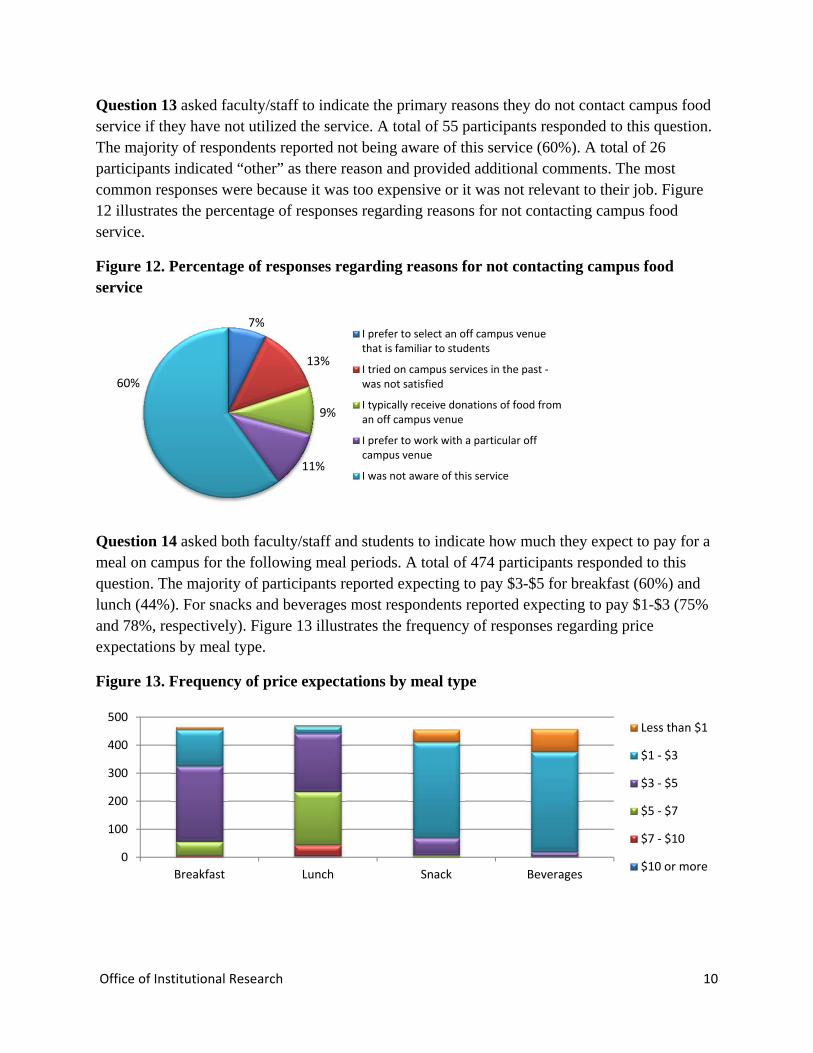
Question 11 asked faculty/staff if they have contacted campus food service to discuss meal options when they bring groups on campus. A total of 148 faculty/staff responded to this question. Almost two-thirds responded that they do not contact campus food service to discuss meal options (62%). Figure 10 illustrates the percentage of responses.
Figure 10. Percentage of responses regarding contacting food service to discuss meal options
Question 12 asked faculty/staff to indicate how satisfied they were with campus food service if they have utilized the services. A total of 101 faculty/staff responded to this item. The majority of participants responded being “satisfied” to “very satisfied” with the service (44%). Figure 11 illustrates the percentage of responses.
Figure 11. Percentage of responses regarding satisfaction with campus food service
39%
62%
Yes
No
22%
22%
21%
3%
2%
31%
Very satisfied
Satisfied
Neutral
Unsatisfied
VeryunsatisfiedNot sure
Office of Institutional Research 10
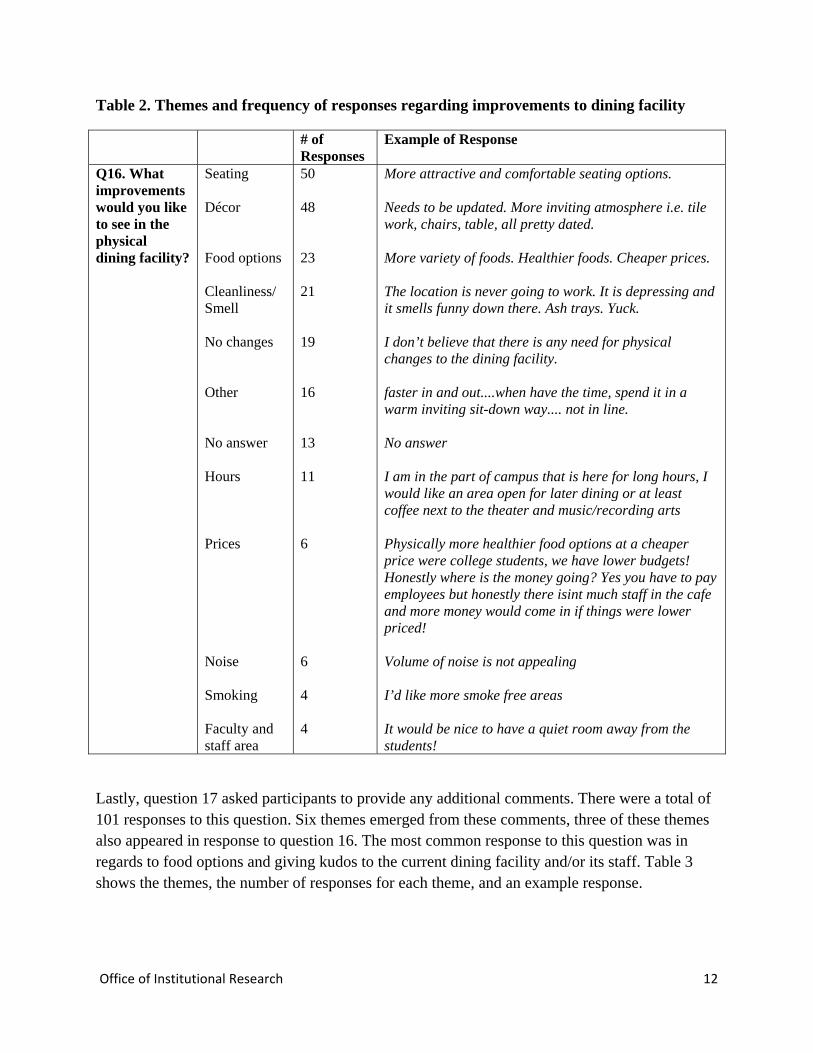
Question 13 asked faculty/staff to indicate the primary reasons they do not contact campus food service if they have not utilized the service. A total of 55 participants responded to this question. The majority of respondents reported not being aware of this service (60%). A total of 26 participants indicated “other” as there reason and provided additional comments. The most common responses were because it was too expensive or it was not relevant to their job. Figure 12 illustrates the percentage of responses regarding reasons for not contacting campus food service.
Figure 12. Percentage of responses regarding reasons for not contacting campus food service
Question 14 asked both faculty/staff and students to indicate how much they expect to pay for a meal on campus for the following meal periods. A total of 474 participants responded to this question. The majority of participants reported expecting to pay $3-$5 for breakfast (60%) and lunch (44%). For snacks and beverages most respondents reported expecting to pay $1-$3 (75% and 78%, respectively). Figure 13 illustrates the frequency of responses regarding price expectations by meal type.
Figure 13. Frequency of price expectations by meal type
7%
13%
9%
11%
60%
I prefer to select an off campus venuethat is familiar to students
I tried on campus services in the past ‐was not satisfied
I typically receive donations of food froman off campus venue
I prefer to work with a particular offcampus venue
I was not aware of this service
0
100
200
300
400
500
Breakfast Lunch Snack Beverages
Less than $1
$1 ‐ $3
$3 ‐ $5
$5 ‐ $7
$7 ‐ $10
$10 or more
Office of Institutional Research 11
Question 15 asked in which parts of campus participants would like additional dining venues. There were a total of 225 open-ended responses to this question1. Eight major themes emerged and were categorized based on 4 major sections of campus (south, east, west, and central) using the campus map. For instance, if a respondent reported wanting a dining venue near the cosmetology department their response was coded as “east” since that department is located on the east end of campus. The majority of respondents reported they would like additional dining venues on the east or west side of campus. Table 1 shows the themes, the number of responses for each theme, and an example response.
Table 1. Themes and frequency of responses regarding location of future dining venues
# of Responses Example of Response Q15. In which parts of campus would you like to see future dining venues?
East West Central As is Unsure/NA Other Food options South
86 56 32 16 16 16 14 2
East side of campus. I think it would be well used by the Cosmetology students especially. Student Service Building end of Campus I would like to see venues near the CI building and the Administration Building The locations where the dining venues are good for right now. No idea never on campus long enough Somewhere where it is not hidden I’ll like to see variety of foods option in our cafeteria, and also offer delivery for the office, because some time staff unable to leave It would be nice to have a dining venue like the OWL Café down by the stadium
Question 16 asked participants to comment on the improvements they would like to see in the physical dining facility. A total of 219 participants responded to question. Twelve themes emerged from the comments in response to this question. The two most common responses were in reference to updating the décor and seating. Table 2 shows the themes, the number of responses for each theme, and an example response.
1 Some comments were coded under two or more themes. They were then counted for each theme in which they appeared. For instance, if a respondent wrote that they feel there should be additional dining venues on the east and west side of campus their response was coded under both “east” and “west”. Therefore, the number of coded responses may exceed the actual number of responses.
Office of Institutional Research 12
Table 2. Themes and frequency of responses regarding improvements to dining facility
# of Responses
Example of Response
Q16. What improvements would you like to see in the physical dining facility?
Seating Décor Food options Cleanliness/ Smell No changes Other No answer Hours Prices Noise Smoking Faculty and staff area
50 48 23 21 19 16 13 11 6 6 4 4
More attractive and comfortable seating options. Needs to be updated. More inviting atmosphere i.e. tile work, chairs, table, all pretty dated. More variety of foods. Healthier foods. Cheaper prices. The location is never going to work. It is depressing and it smells funny down there. Ash trays. Yuck. I don’t believe that there is any need for physical changes to the dining facility. faster in and out....when have the time, spend it in a warm inviting sit-down way.... not in line. No answer I am in the part of campus that is here for long hours, I would like an area open for later dining or at least coffee next to the theater and music/recording arts Physically more healthier food options at a cheaper price were college students, we have lower budgets! Honestly where is the money going? Yes you have to pay employees but honestly there isint much staff in the cafe and more money would come in if things were lower priced! Volume of noise is not appealing I’d like more smoke free areas It would be nice to have a quiet room away from the students!
Lastly, question 17 asked participants to provide any additional comments. There were a total of 101 responses to this question. Six themes emerged from these comments, three of these themes also appeared in response to question 16. The most common response to this question was in regards to food options and giving kudos to the current dining facility and/or its staff. Table 3 shows the themes, the number of responses for each theme, and an example response.
Office of Institutional Research 13
Table 3. Themes and frequency of responses regarding additional comments
# of Responses Example of Response Q17. If you have any comments, please type them in the space provided below.
Kudos Other Food options Hours Pricing No comment
24 24 22 13 12 6
The staff is great and very friendly at the Owl Cafe, I hope they are around for a long time I hope some changes are forthcoming....many students and faculty go off campus for food. Bring on several off campus vendors so we have more variety and the school can make some money Make the cafeteria open for evening students. This would greatly help those who work during the day, and those who study on campus. Food is way too expensive, and the portions are small. That's why id rather walk 20 min to jack in the box and eat. Then buy anything. And the Starbucks here is really bad. It always makes my stomach hurt. No comment


![Small Business and The Cafeteria Plan - Paley Rothman · 3 SYNOPSIS § 1.01 Small Business and the Cafeteria Plan § 1.02 Types of Cafeteria Plans [1] Three Types of Cafeteria Plans](https://static.documents.pub/doc/80x56/5b3a44e97f8b9a5e1f8b50d3/small-business-and-the-cafeteria-plan-paley-rothman-3-synopsis-101-small.jpg)


