+ All Categories
Home > Documents > City Corporate Plan cum Business Plan for Ambattur ...tnuifsl.com/documents/ccpbp/Ambattur.pdf ·...

City Corporate Plan cum Business Plan for Ambattur ...tnuifsl.com/documents/ccpbp/Ambattur.pdf ·...

Date post: 08-Apr-2019
Category:
Upload: letruc
View: 213 times
Download: 0 times
Share this document with a friend
111
Tamil Nadu Urban Infrastructure Financial Services Limited City Corporate Plan cum Business Plan for Ambattur Municipality Final Report March 2008 ICRA Management Consulting Services Limited
Transcript

Tamil Nadu Urban Infrastructure Financial Services Limited

City Corporate Plan cum Business Plan for Ambattur Municipality

Final Report

March 2008

ICRA Management Consulting Services Limited

CCP cum BP - Ambattur Municipality

Contents

1. INTRODUCTION ............................................................................................................................................ 1

1.1 BACKGROUND TO THE STUDY ..................................................................................................................... 1 1.2 OBJECTIVES, SCOPE OF WORK AND STUDY MODULES .................................................................................. 1 1.3 APPROACH AND METHODOLOGY ................................................................................................................ 2 1.4 ORGANIZATION OF THIS REPORT ................................................................................................................. 2

2. TOWN PROFILE AND CITY DEMOGRAPHICS ........................................................................................... 3

2.1 GEOGRAPHY ............................................................................................................................................ 3 2.2 AMBATTUR MUNICIPALITY - ADMINISTRATIVE STATUS ..................................................................................... 3 2.3 POPULATION ............................................................................................................................................ 5 2.4 POPULATION PROJECTIONS........................................................................................................................ 7

3. ECONOMIC PROFILE AND LAND USE ....................................................................................................... 8

3.1 PLANNING EFFORTS WITHIN CMA ............................................................................................................... 8 3.2 ECONOMIC STATUS ................................................................................................................................... 9 3.3 LAND-USE AND DEVELOPMENT ................................................................................................................. 11

4. RAPID URBAN ASSESSMENT - SERVICES, ISSUES AND GAPS .......................................................... 14

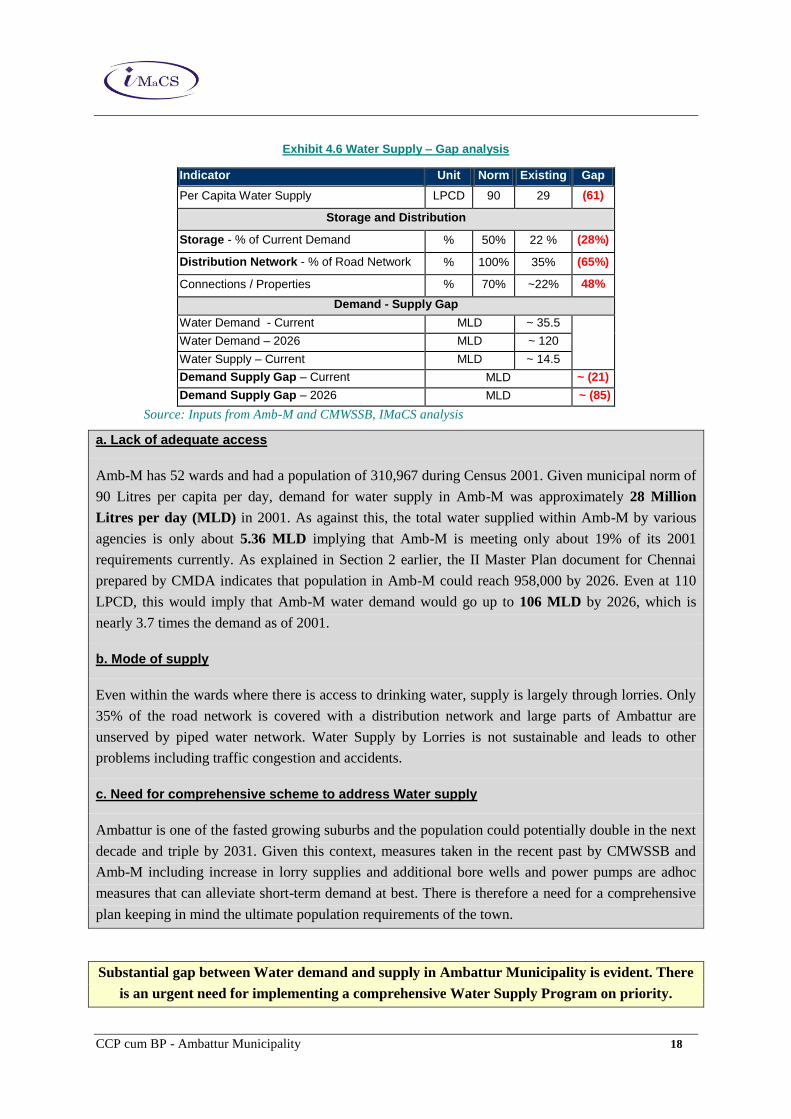
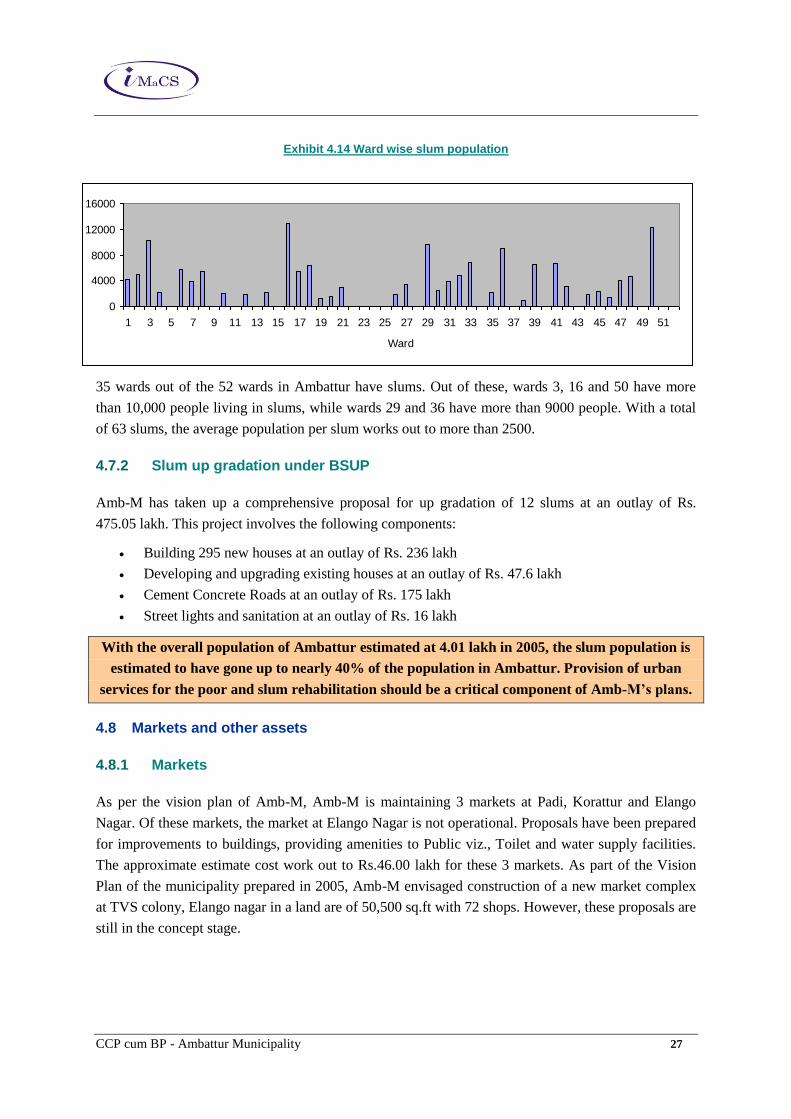
4.1 WATER SUPPLY – EXISTING STATUS ......................................................................................................... 14 4.2 CMWSSB NETWORK - ANNA NAGAR EXTENSION AND MOGAPPAIR AREA - 11 WARDS ................................... 15 4.3 WATER SUPPLY IN OTHER WARDS – MAINTAINED BY AMB-M ........................................................................ 15 4.4 SEWERAGE AND SANITATION ................................................................................................................... 19 4.5 SOLID WASTE MANAGEMENT (SWM) ....................................................................................................... 21 4.6 TRANSPORTATION, BUS STANDS AND STREET LIGHTS ................................................................................. 24 4.7 URBAN SERVICES FOR POOR ................................................................................................................... 26 4.8 MARKETS AND OTHER ASSETS.................................................................................................................. 27 4.9 SOCIAL INFRASTRUCTURE........................................................................................................................ 28 4.10 STATUS OF VISION PLAN PROJECTS ......................................................................................................... 29 4.11 SERVICE LEVEL INDICATORS AND DEMAND ASSESSMENT SUMMARY .............................................................. 30

5. URBAN GOVERNANCE AND MANAGEMENT .......................................................................................... 32

5.1 POLICY OVERSIGHT AND INSTITUTIONAL FRAMEWORK – STATE LEVEL ........................................................... 32 5.2 GOVERNANCE STRUCTURE OF AMBATTUR MUNICIPALITY ............................................................................. 34 5.3 MANPOWER POSITION ............................................................................................................................. 36 5.4 ROLE OF OTHER AGENCIES ...................................................................................................................... 37 5.5 REFORMS UNDERTAKEN BY AMBATTUR MUNICIPALITY ................................................................................. 38

6. ANALYSIS OF FINANCIALS ....................................................................................................................... 39

6.1 INCOME AND EXPENDITURE SUMMARY OF AMBATTUR MUNICIPALITY ............................................................ 39 6.2 REVENUE STREAMS OF ULB IN TAMIL NADU .............................................................................................. 40 6.3 ANALYSIS OF COSTS ............................................................................................................................... 45 6.4 TRENDS IN CAPITAL EXPENDITURE ........................................................................................................... 46 6.5 LOANS AND FINANCE CHARGES ................................................................................................................ 47

7. VISION & STRATEGIC PLAN, CIP AND ASSET MANAGEMENT PLAN .................................................. 48

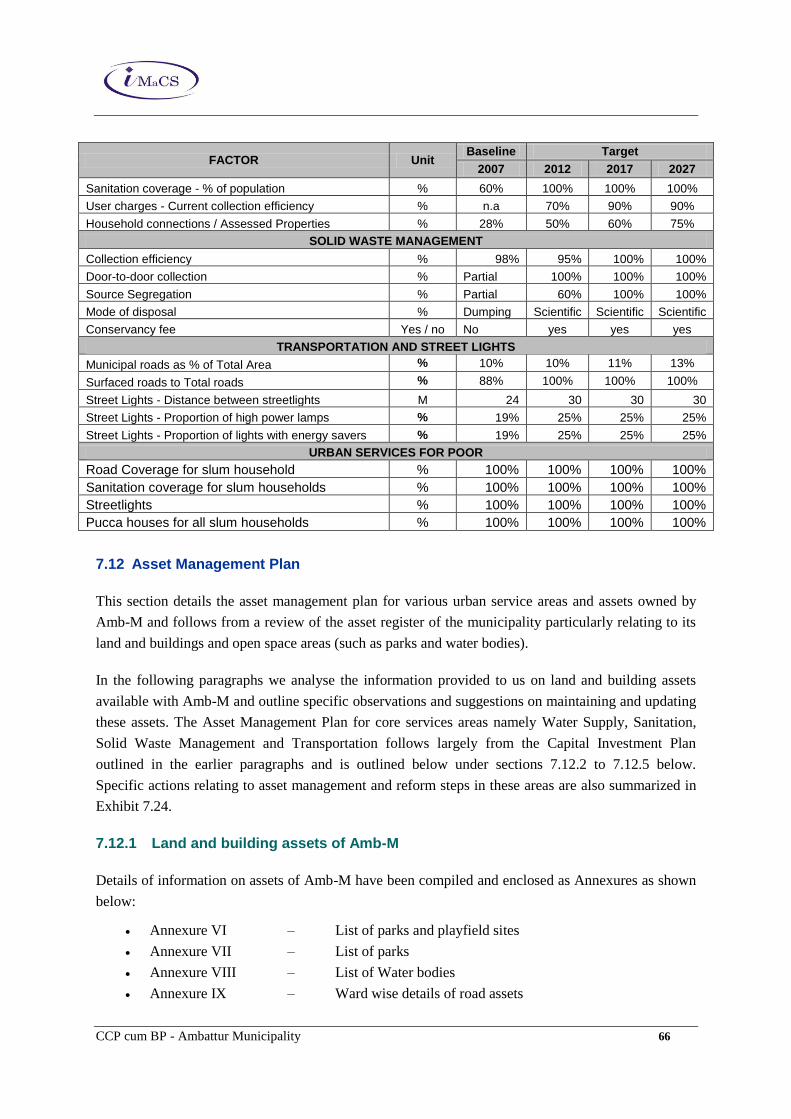
7.1 POTENTIAL THEMES FOR ECONOMIC DEVELOPMENT .................................................................................... 48 7.2 SWOT ANALYSIS ................................................................................................................................... 50 7.3 STRATEGIC PLAN – FOCUS AREAS AND TIME HORIZON ................................................................................. 50 7.4 POPULATION PROJECTIONS UNDERLYING THE STRATEGIC PLAN ................................................................... 51 7.5 WATER SUPPLY ..................................................................................................................................... 51 7.6 SANITATION ........................................................................................................................................... 53 7.7 SOLID WASTE MANAGEMENT ................................................................................................................... 57 7.8 ROADS, TRANSPORTATION AND STREETLIGHTS ......................................................................................... 59 7.9 URBAN SERVICES FOR THE POOR ............................................................................................................. 61 7.10 SOCIAL INFRASTRUCTURE AND OTHER URBAN AMENITIES ............................................................................ 63 7.11 CAPITAL INVESTMENT PLAN ..................................................................................................................... 63 7.12 ASSET MANAGEMENT PLAN ..................................................................................................................... 66

CCP cum BP - Ambattur Municipality

8. PROJECT PROFILES, ANALYSIS OF RISKS AND ESA CONSIDERATIONS ......................................... 74

8.1 WATER SUPPLY ...................................................................................................................................... 74 8.2 SANITATION ........................................................................................................................................... 75 8.3 SOLID WASTE MANAGEMENT .................................................................................................................... 77 8.4 TRANSPORTATION .................................................................................................................................. 77

9. REFORM AGENDA AND TECHNICAL ASSISTANCE ............................................................................... 79

9.1 URBAN SECTOR REFORM IN TAMIL NADU – AN OVERVIEW ............................................................................ 79 9.2 REFORM AGENDA – INTERVENTIONS REQUIRED AT THE STATE LEVEL ............................................................ 80 9.3 SUGGESTIONS FOR IMPROVING FINANCIAL PERFORMANCE AND COLLECTION EFFICIENCY ................................ 83

10. SUSTAINABLE FINANCIAL AND OPERATING PLAN .......................................................................... 89

10.1 FINANCIAL AND OPERATING PLAN (FOP)– TIME HORIZON, BASIS AND ASSUMPTIONS ...................................... 89 10.2 ESTIMATION OF BORROWING CAPACITY AND INVESTMENT CAPACITY ............................................................. 91 10.3 PROJECT SPECIFIC CASH FLOWS .............................................................................................................. 92 10.4 POSSIBLE FINANCING MIX FOR ACHIEVING FULL INVESTMENTS ...................................................................... 93 10.5 FINANCIAL AND OPERATING PLAN............................................................................................................. 94

CCP cum BP - Ambattur Municipality

List of exhibits

Exhibit 1.1 IMaCS’ approach and methodology ...................................................................................................... 1 Exhibit 2.1 Location of Ambattur within CMA .......................................................................................................... 4 Exhibit 2.2 Population growth trend ......................................................................................................................... 5 Exhibit 2.3 Amb-M vis-à-vis other suburban areas in CMA ..................................................................................... 6 Exhibit 2.4 Literacy and sex ratio ............................................................................................................................ 6 Exhibit 2.5 Population Projections ........................................................................................................................... 7 Exhibit 4.1 Water Supply in Amb-M - Ward wise status ........................................................................................ 14 Exhibit 4.2 Details of water supply in 11 wards maintained by CMWSSB ............................................................. 15 Exhibit 4.3 Water supply in Ambattur - Sources of water and daily supply in MLD ............................................... 16 Exhibit 4.4 Water Supply - Storage infrastructure ................................................................................................. 17 Exhibit 4.5 House service connections .................................................................................................................. 17 Exhibit 4.6 Water Supply – Gap analysis .............................................................................................................. 18 Exhibit 4.7 UGD schemes - current status ............................................................................................................ 19 Exhibit 4.8 Ongoing UGD scheme - Pumping stations .......................................................................................... 20 Exhibit 4.9 Public Conveniences ........................................................................................................................... 20 Exhibit 4.9 Storm water drain network ................................................................................................................... 20 Exhibit 4.10 Solid Waste Management - Current status ........................................................................................ 22 Exhibit 4.11 Garbage collection and transportation process – Proposed plan ...................................................... 23 Exhibit 4.12 Road network .................................................................................................................................... 24 Exhibit 4.13 Street Lighting .................................................................................................................................. 26 Exhibit 4.14 Ward wise slum population ................................................................................................................ 27 Exhibit 4.15 Educational institutions ...................................................................................................................... 28 Exhibit 4.16 Medical institutions in Amb-M ............................................................................................................ 29 Exhibit 4.17 Vision Plan projects and status ......................................................................................................... 29 Exhibit 4.18 Core urban services - Ongoing initiatives, Baseline indicators and gaps .......................................... 31 Exhibit 5.1 Urban sector - Institutional framework - State Level ........................................................................... 32 Exhibit 6.1 Consolidated Income and Expenditure trend ...................................................................................... 39 Exhibit 6.2 Revenue streams - ULBs in Tamil Nadu ............................................................................................. 40 Exhibit 6.3 Analysis of Revenues of Ambattur Municipality ................................................................................... 41 Exhibit 6.4 Property tax - analysis of key revenue drivers ..................................................................................... 41 Exhibit 6.5 Property Tax - breakup of assessees (2005) ..................................................................................... 42 Exhibit 6.6 Professional Tax - revenue drivers ...................................................................................................... 42 Exhibit 6.7 Professional Tax – assessee break up (2005) .................................................................................... 43 Exhibit 6.8 Water charges - revenue drivers ......................................................................................................... 44 Exhibit 6.9 Costs (as a % of income) – FY 2003 and FY 2006 ............................................................................. 45 Exhibit 6.10 Repair and maintenance expenditure - Sector wise break up ........................................................... 46 Exhibit 6.11 Power costs - Water & Sewerage and Street Lights (Rs in Lakh) ..................................................... 46 Exhibit 6.12 Capital Expenditure (Rs in Lakh) - Last five years ............................................................................. 47 Exhibit 6.13 Loan Statement (Rs in Lakh) ............................................................................................................ 47 Exhibit 7.1 Population projections and related estimates - Ambattur town ............................................................ 51 Exhibit 7.2 Water supply - Service Goals and Reform Targets ............................................................................. 51 Exhibit 7.3 Water Supply - Baseline status and gaps (short term and long term) ................................................. 52 Exhibit 7.4 Water Supply - Capital Investment outlay and phasing ....................................................................... 53 Exhibit 7.5 Sanitation - Service Goals and Reform Targets .................................................................................. 54 Exhibit 7.6 Sanitation- Baseline status and gaps (short term and long term) ........................................................ 54 Exhibit 7.7 UGD scheme for uncovered areas – cost break-up ............................................................................ 55 Exhibit 7.8 Low lying / flood prone areas in Amb-M .............................................................................................. 55 Exhibit 7.9 Sanitation - Capital Investment outlay and phasing ............................................................................. 57 Exhibit 7.10 Solid Waste Management - Service Goals and Reform Targets ....................................................... 57 Exhibit 7.11 Solid Waste Management - Baseline status and gaps (short term and long term) ............................ 57 Exhibit 7.12 Solid Waste Management - Capital Investment outlay and phasing .................................................. 59 Exhibit 7.13 Transportation and street lighting - Service Goals and Reform Targets ............................................ 59 Exhibit 7.14 Transportation- Interventions - Physical ............................................................................................ 59 Exhibit 7.15 Transportation and Street lighting - Capital Investment outlay and phasing ...................................... 61 Exhibit 7.16 Urban Services for poor – Service level goals and outcomes ........................................................... 62 Exhibit 7.17 Urban Services for the poor – Slum details Capital outlay and phasing ............................................ 62 Exhibit 7.18 Social infrastructure and other urban amenities – Capital outlay and phasing .................................. 63 Exhibit 7.19 Priority projects - FY 2008-12 ............................................................................................................ 63 Exhibit 7.20 Capital Investment Plan summary ..................................................................................................... 64 Exhibit 7.21 Service level and reform targets – a summary .................................................................................. 65

CCP cum BP - Ambattur Municipality

Exhibit 7.22 Land assets summary ....................................................................................................................... 67 Exhibit 7.23 Building assets summary ................................................................................................................... 67 Exhibit 7.24 Asset Management Plan and timeline ............................................................................................... 70 Exhibit 10.1 Population projections and related estimates - Ambattur town .......................................................... 89 Exhibit 10.2 Revenue related assumptions ........................................................................................................... 89 Exhibit 10.3 Expenditure related assumptions ...................................................................................................... 90 Exhibit 10.4 Capital Investment Plan ..................................................................................................................... 91 Exhibit 10.5 Loan related assumptions ................................................................................................................. 91 Exhibit 10.6 Possible financing mix ....................................................................................................................... 94 Exhibit 10.7 FOP projections ................................................................................................................................. 94 Exhibit 10.8 FOP summary ................................................................................................................................... 95

CCP cum BP - Ambattur Municipality i

Executive Summary

The Tamil Nadu Urban Infrastructure Financial Services (TNUIFSL) mandated ICRA Management

Consulting Services (IMaCS) for preparation of City Corporate Plan cum Business Plan (CCP-BP) of

Ambattur Municipality (Amb-M). This exercise intends to enable Amb-M to develop a holistic,

structured and consultative approach to fine-tune and define its development priorities going forward.

The objectives of the exercise are three-fold: a) to assess existing demand-supply gaps in service

delivery and derive a comprehensive infrastructure improvement plan (including a Capital Investment

Plan), b) to identify revenue enhancement and financial improvement measures and c) to develop a

Financial and Operating Plan to implement a sustainable infrastructure improvement plan.

City profile and growth potential

Ambattur is a special grade town located in the

Tiruvallur district and is a suburban area within the

Chennai Metropolitan Area (ChMA). Ambattur

municipality covers an area of 40.36 sq.km and had a

population of 301,967 in 2001. Ambattur is the largest

municipality in terms of population and stands second in terms of land area (behind Avadi) within the

ChMA. Considering Ambattur’s low population density (77 per hectare) vis-à-vis Chennai (240 per

hectare), Ambattur offers substantial development potential. Development of arterial roads covering

the MTH road, NH Bypass and other proposed new road formations could further boost the

developments within Ambattur.

A brief SWOT analysis of the town is presented below:

Strengths

Vibrant industrial centre and emerging as a

services hub

One of the largest and fastest growing suburbs of

Chennai

Strategically located between Chennai and the

rapidly industrializing regions to its west

Well connected by road and rail

Weakness

Significant gaps in basic infrastructure services

– roads, water supply and sanitation

Growing slum population

Jurisdiction of multiple authorities with the

industrial estate falling under SIDCO

Opportunities

Potential to emerge as a leading industrial and

services hub

Emerging as a rapidly growing residential area

Improvements in road and rail connectivity could

spur further growth

Proposed move to carve out a Corporation out of

Ambattur and adjoining areas could facilitate

greater focus and planning for orderly growth.

Threats

Town requires significant investments in basic

infrastructure

Rampant encroachment of public land and

weak town and layout planning

Inability to address infrastructure deficiencies

could constrain growth

Slum proliferation.

Municipal capacity needs significant

upgradation.

Constitution Special Grade

Area 40.36 sq.km

Wards 52

Population (2001) 310967

Decadal growth % 44%

Population Density (per Ha) 77

Slum population (% of total) 29%

CCP cum BP - Ambattur Municipality ii

The key economic development themes for Ambattur town are articulated below:

1. There is an urgent need to step up pace of investments to address the glaring gaps in

Physical Infrastructure – Piped water supply and protected sanitation are almost non-existent,

arterial roads continue to be congested and there is no composting / scientific landfill facility for

solid waste disposal yet. The long delay in the ongoing UGD scheme in 19 wards has caused

severe hardships for the local public and needs to be addressed on priority to restore the

credibility of public service delivery that has been severely dented due to this project. These

serious gaps in physical infrastructure is already constraining growth and is severely hampering

quality of life in the town and hence is the starting point for realising the vision of making

Ambattur a vibrant suburban town of Chennai.

2. Accord high priority to planning and developing Social Infrastructure to cater to the rapid

population growth - The potentially explosive growth in the population would require a

combination of Government / private investment to address future requirements, particularly in

education and health infrastructure. GoTN through CMDA and Amb-M should immediately map

land-use to identify and ring-fence public land (including a specific strategy for minimising slum

proliferation and removal of encroachments from public spaces) for this purpose. Public

stakeholders in particular cited the need to utilise the land available in Century Nagar in Athipattu

area for specific social asset development such as a) Engineering or Medical College, b)

Integrated Sports complex, c) Modern Government Hospital for the region or d) Government

Boys high school. Restoration of water bodies (particularly Ambattur and Korattur lakes) and

provision of parks/jogging tracks around decaying and polluted water bodies figured high in the

list of felt needs.

3. Implement world-class road and rail connectivity between Ambattur and Chennai and the

growth centres of Sriperumbudur and Tiruvallur - Ambattur is strategically located between

Chennai and the rapidly urbanising regions of Sriperumbudur and Maraimalainagar.

Consultations as well as evidence on the ground point to significant growth in both residential

settlements and industrial developments along the Ambattur-Avadi-Tiruvallur corridor and the

Ambattur-Poonamallee-Sriperumbudur corridor. This is also expected to get accelerated with the

completion of the bypass sections connecting National Highway corridors. Completion of the

proposed and ongoing road connectivity projects and strengthening and widening of MTH road

(NH 205) are important priorities in this direction. In terms of railway connectivity, Ambattur is

on the suburban railway line from Chennai Central to Arakonam. Para-transit facilities should be

planned between the proposed Chennai metro rail and this railway line to provide seamless

connectivity. The recent proposal for feasibility of rail connectivity between Ambattur and

Sriperumbudur is also a positive initiative and needs immediate scrutiny.

4. Invest in industrial infrastructure to reinforce Ambattur’s position as a premier industrial

hub - The maintenance of infrastructure services within the Ambattur Industrial Estate has been

entrusted to a Special Purpose Vehicle called the ‘Chennai Auto Ancillary Industrial

CCP cum BP - Ambattur Municipality iii

Infrastructure Upgradation Company (CAAIIUC)’. The areas identified for improvement as part

of this initiative1 include roads, common facilities, flood management and storm drains, water

supply, sewage treatment, street lighting, Logistics services, public amenities and landscaping.

There is a need for expediting the project in view of the poor infrastructure conditions that

continue to plague this estate. In particular, a truck terminal and a multi-level car park should be

developed given the transportation requirements emerging from the industrial area.

5. Guide the ongoing services/IT developments in a planned manner. In spite of being a

manufacturing oriented industrial estate, there is already a significant presence of IT and ITES

units in Ambattur. A number of leading players including HCL and Perot systems already have

presence and the trend of IT-ITES companies investing in Ambattur could intensify further. In

this regard, there is a need to review the master plan for the town and the land use to support this

trend and to facilitate an orderly development of the services sector in Ambattur.

Municipal Services - Status assessment, gaps and actions being taken

Exhibit 1 presents a summary of service levels and status with respect to select indicators in Water

Supply, Sanitation, Transportation, Street lights and Solid Waste Management.

Exhibit 1 Summary of prevailing service levels – key indicators, issues and gaps

Sl.

no

Name of the Indicator Value Issues and Gaps

Water Supply:

CMWSSB currently preparing a DPR for comprehensive water supply in all wards in Ambattur town.

1 Daily Per Capita Supply (LPCD) 29 Current supply on a per capita basis is

significantly below municipal norms

Need for significant augmentation of water

supply at source, storage and distribution.

2 Storage Capacity / Daily Supply (%) 22%

3 Distribution Network / Road Length (%) 35%

4 Water connections / Assessed properties (%) 22%

Sanitation:

Ongoing UGD scheme in 19 wards. DPR for uncovered wards being prepared by CMWSSB for comprehensive

sanitation and sewerage program

5 Presence of UGD network (Yes / No) Partial Coverage of UG network inadequate

Storm water drainage coverage in just 31%

of roads

Public convenience network needs

augmentation in view of high floating

population.

6 UG connections / assessed properties (%) 27%.

7 Household per Public convenience (nos.) 3506

8 Storm Drain Length / road network (%) 31%

Roads and Street Lights:

Flyovers under implementation and arterial road improvements planned.

9 BT roads / Total (%) 85% Poor condition of Arterial road.

Improvements envisaged in Chennai master

1 www.caauiic.com

CCP cum BP - Ambattur Municipality iv

Sl.

no

Name of the Indicator Value Issues and Gaps

10 Road length per Street Light (m) 23 m plan needs to be implemented on priority

Municipal roads would require

comprehensive up gradation following water

supply and UGD implementation.

Solid Waste Management:

Collection activity in 27 wards including industrial area privatised. Land procurement for scientific disposal for ultimate

population requirement under evaluation. Need for preparation of a Detailed Project Report on actions needed in

the entire chain of activities from collection to disposal.

11 Waste generation per capita (gms) 470 Need for a comprehensive program for SWM

Scope for greater private participation

covering end-to-end given the size and

scope of the SWM service requirement.

Composing, Source segregation and Door-

to-door collection needs implementation in a

phased manner.

12 Compost yard area (Acres per 10,000 population) 88%

13 Average vehicle trips n.a

14 Source Segregation and Composting (Yes/No) partial

Analysis of financial performance

Exhibit 2 provides a summary of the income and expenditure of Ambattur Municipality.

Exhibit 2 Income and Expenditure summary

FY 2003 FY 2004 FY 2005 FY 2006 CAGR%

INCOME

OWN INCOME 1393 1516 1888 2038 14%

Property tax 886 956 1096 1030 5%

Profession tax 143 167 224 271 24%

Water & Sewerage Charges 104 101 118 106 1%

Other Service Charges & Fees 60 74 105 96 17%

Other Income 200 218 346 536 39%

ASSIGNED REVENUE 618 1281 1343 598 -1%

DEVOLUTION FUND 506 712 512 534 2%

GRANTS & CONTRIBUTIONS 67 - - - -100%

PRIOR PERIOD INCOME 56 54 233 144 37%

TOTAL 2640 3563 3976 3314 8%

EXPENDITURE

Salaries 503 504 499 504 0%

Operating Expenses 376 411 569 577 15%

Program Expenses 0 56 294 329

Administrative Expenses 39 59 80 42 3%

Finance Expenses 173 181 244 174 0%

Depreciation 1304 1241 527 1192 -3%

Prior Period Expenses 19 1 39 6 -32%

TOTAL 1110 1212 1724 1632 14%

SURPLUS - (Excl.Depr) 1529 2351 2252 1682 3%

TE / TR incl Depreciation 91% 69% 57% 85% 79%

TE / TR excl. Depreciation 42% 34% 43% 49% 42%

DS / TR 6% 8% 4% 4% 6%

CCP cum BP - Ambattur Municipality v

Income growth (CAGR of 8%) has lagged expenditure (CAGR of 14%). However, the municipality

has shown a positive cash balance and overall surplus over past four years.

Capital Investment Plan, priority projects and technical assistance requirements

Exhibit 3 provides a summary of the CIP for Amb-M. The CIP has been prepared based on

Normative gaps in infrastructure services given existing status and norms for service delivery.

Status and progress on projects identified as part of the Vision Plan (2004-09)

Consultations with stakeholders and feedback on our presentation to the Council.

Discussion with Amb-M officials and review with TNUIFSL and CMA

Exhibit 3 Capital Investment Plan summary

Segment 2008 2009 2010 2011 2012 2008-

12 2013-

17 2018-

27 TOTAL

Water Supply - 4,167 4,217 4,217 50 12,650 656 5,202 18,508

Sanitation 448 6,368 6,368 5,820 820 19,823 2,480 4,545 26,848

Solid Waste Management - 823 1,053 180 - 2,056 1,342 1,058 4,457

Transportation - 2,149 2,149 2,149 46 6,493 2,244 11,754 20,490

Urban Services for the poor 158 158 158 - 4,242 4,717 21,210 - 25,927

Others 147 100 230 205 75 757 830 960 2,547

TOTAL 753 13,765 14,175 12,571 5,233 46,496 28,762 23,518 98,776

Priority projects

Priority projects identified for implementation by Amb-M are listed in Exhibit 4 below.

Exhibit 4 Priority projects: FY 2008-12

Sl. No

Sector Project Cost Rs.

Lakh

Status DPR needed

1 Water Supply Implementation of comprehensive scheme for protected water supply

12500 DPR under preparation

Yes

2 Sanitation UGD scheme for uncovered areas 15000 DPR ready. Under TS

-

3 Sanitation Restoration of water bodies 200 Proposed Yes

4 Sanitation Storm water drains 3800 Proposed Yes

5 SWM Land acquisition and compost yard development

900 In progress Yes

6 SWM Development of Transfer station 750 Phase I to be started

-

7 Transportation Road up gradation and restoration 4811 Proposed Yes

8 Transportation Category A Bus stand at Kallikuppam 600 Resolution adopted

Yes

9 Social Development of 26 parks 260 Proposed -

10 Social Gasifier crematorium and Slaughter house

93 Ongoing projects -

CCP cum BP - Ambattur Municipality vi

Technical assistance requirements

A list of project level / sector specific technical assistance requirements needed from CMA/TNUISFL

is given below:

1. Comprehensive GIS for the town with updated information on all urban assets including roads,

water supply, sanitation etc.

2. Technical assistance for digitization of layout records and town planning information

3. Roadmap for 135 LPCD water supply and 24x7 supply

4. DPR for restoration of water bodies and flood management measures covering storm water drain

and canal network design.

5. DPR for Traffic and Transportation improvement plan for the town including feasibility of

specific junction improvements and road strengthening suggested in section 7.8.3. of the report.

6. DPR for solid waste management with focus on scientific disposal and mechanised handling of

waste with private sector participation

Projects by other departments / agencies

Projects to be taken up for implementation by other Government departments include the following:

1. State Highways/National highways – a) Feasibility study for widening and strengthening MTH

road (NH 205) including widening of bridge on MTH road near Ambattur municipal office.

2. CMDA – Review of master plan / land-use and roadmap for extension of city limits.

3. Chennai Metro Water / CMA – Comprehensive plan for water supply and sanitation for

Ambattur municipality and implementation of the same.

4. PWD – Restoration and development of Ambattur and Korattur lakes

5. Department of Education, GoTN – a) Feasibility for setting up a Government High School for

boys and b) Feasibility for setting up an Engineering or Medical college in Ambattur.

6. Department of Youth welfare and Sports – a) Feasibility study for setting up an integrated

sports complex in Ambattur.

Reform Agenda

Amb-M’s ability to improve on its financial performance hinges primarily on its ability to sustain and

improve on the revenue growth noticeable in recent years.

State level - 10 point agenda

1. Implement recommendations of the Third State Finance Commission, particularly those relating

to the revenue buoyancy including property tax reform and devolution income from GoTN.

2. Ensure stability of tenure of key officials. Except under extraordinary circumstances, there should

be a minimum tenure of at least 2 years for all the key positions including Commissioner,

Municipal Engineer, Manager, Town Planning Inspector, Sanitary and public health head and

Accountant. Further, guidelines need to be clarified and enforced for formal charge handover to

ensure continuity, when there is a transfer of officials.

CCP cum BP - Ambattur Municipality vii

3. Conduct a zero-base assessment of skill gaps and manpower needs of ULBs to ascertain the

appropriate manpower plan in terms of skill sets and experience/seniority. This is particularly

relevant given the recent developments, specifically in urban planning and GIS, accrual

accounting, e-governance and modern practices in infrastructure service delivery including

Public-Private Partnerships.

4. Address critical operational areas through focused training and capacity building interventions,

particularly in the areas of a) Engineering and project development, b) Accounting and Finance

and c) Use of CAD/GIS applications in Town Planning and Engineering functions.

5. CMA, GoTN should continue with its ongoing technical assistance to ULBs to improve their

accounting systems and computerisation. Setting up of the Debt Monitoring Cell to reconcile and

disseminate information on debt status of the ULBs is also a positive step in this direction.

6. CMA, GoTN should insist and make ULBs finalise accounts and audit of the same within 3

months of completion of financial year. TNUIFSL should consider a grading system to categorise

ULBs on the basis of quality of accounting and reporting practices.

7. Develop / enforce technical standards with specific applicability to municipal projects

construction and execution particularly in the areas of a) integrated road asset creation and

management, b) Flood management and guidelines for storm water drain construction and c)

Solid Waste Management with greater implementation focus on waste processing and disposal.

8. CMA, GoTN along with TNUIFSL should develop a framework for PPP covering specific

policies and guidelines and model concessions for PPP in urban services including Water supply,

Sanitation, Solid waste management, Street light maintenance and remunerative projects.

9. ULBs should be required to conduct an independent systems audit annually. This would enable

ULBs to build in robust processes for disaster recovery and security of their IT systems.

10. Create a apex-level committee comprising decision makers across multiple agencies including

TNEB, CMWSSB, State Highways, Telecom service providers that would meet every month to

manage functional overlaps and coordinate provision of respective services in a seamless manner.

ULB level

Amb-M could potentially double its own income to Rs. 6875 lakh by FY ending 2012 through

focused interventions in the following areas. Specific actions for revenue enhancement and

improvement in collection efficiency are outlined in the report.

1. Property tax: – through revision in ARV, widening assessee base and closer scrutiny.

2. Professional tax – sustaining growth in assessments through widening tax base among traders

and self-employed professionals

3. User charges – through increased penetration of water connections and new sewerage

connections could potentially triple user charges income from the current levels.

4. PPP / remunerative projects - Amb-M also needs to explore land development as a revenue

enhancement mechanism and should focus on attracting private sector participation through

appropriate BOT/ SPV structures for implementing remunerative projects.

5. Energy costs - A savings of 15-20% reduction in energy costs appears imminently achievable and

could translate to annual savings of nearly Rs.10-15 lakh on the current cost base of Rs. 160 lakh.

CCP cum BP - Ambattur Municipality viii

6. Collection Efficiencies in both taxes and user charges indicate scope for improvement.

7. NGOs / Corporate participation - Intensify focus on attracting NGOs/advertising revenue for

city beautification projects to reduce reliance on grants for such projects.

FOP, borrowing capacity and investment capacity

The borrowing capacity of Ambattur works out to Rs. 33,070 lakh. At an aggregate level, assuming

loans to be equivalent to 50% of investment, sustainable investment capacity works out to Rs. 66,141

lakh, which translates to about 67 % of the total investment requirement (including slum

rehabilitation). If we exclude slum rehabilitation and urban services for poor projects which are

largely grant funded, the borrowing capacity translates to 91% of the total investment requirement.

Hence Amb-M is well placed to meet its capital investment requirements. Exhibit 5 provides a

summary of the results of the FOP, prepared for a 20-year horizon.

Exhibit 5 Financial and Operating Plan - summary

Estd. Revenues – FY 2008 (Rs. Lakh) 5,205

Estd. Revenues – FY 2016 (Rs. Lakh) 13,057

Estd. Revenues - FY 2027 (Rs. Lakh) 31,434

Revenue CAGR % - FY 2008-17 11.0%

Revenue CAGR % - FY 2008-27 9.9%

Average TE (excl. depreciation)/TR (%) 53%

Average DS/TR (%) 29%

Average DSCR 1.88

Borrowing Capacity 33,070

Investment Requirement 98,776

Investment Capacity (at 50% loan) 66,141

IC/IR (including Urban Service for Poor) 67%

IC/IR (without USP investment) 91%

As can be seen, Amb-M’s revenues could potentially go up to Rs. 13,057 lakh by 2016 and Rs.

31,434 lakh by 2027. If we exclude slum rehabilitation and urban services for poor projects which are

largely grant funded, the borrowing capacity translates to 91% of the total investment requirement.

While it appears that Amb-M would be largely capable of meeting its Capital Investment

Requirements, it needs to put in place systems and improve capacity to meet the revenue and cost

targets set forth in the Financial and Operating Plan. Further, it would also need to work with other

Government agencies responsible for various infrastructure services to enable development of

physical infrastructure and other urban services that are currently beyond the scope of execution of

Amb-M.

CCP cum BP - Ambattur Municipality 1

1. Introduction

1.1 Background to the study

The Tamil Nadu Urban Infrastructure Financial Services Limited (TNUIFSL) intends to assist

Ambattur Municipality (also referred to as Amb-M in this document) in strengthening and improving

its financial position for effective capital investment management and urban service delivery. As part

of its project development and capacity building role, TNUIFSL retained ICRA Management

Consulting Services Limited (IMaCS) for assistance in preparation of a City Corporate Plan cum

Business Plan for Amb-M.

This exercise intends to build on internal efforts of Amb-M and the Vision Plan prepared by Amb-M

in FY 2005 that identified projects and development priorities in various areas of municipal

functioning and also enable Amb-M to develop a holistic, structured and consultative approach to

fine-tune and define its development priorities going forward. The objectives of the exercise are three-

fold: a) to assess existing demand-supply gaps in service delivery and derive a comprehensive

infrastructure improvement plan (including a Capital Investment Plan) required, b) to identify revenue

enhancement and financial improvement measures and c) to develop a Financial and Operating Plan

for a 10-year period to implement a sustainable infrastructure improvement plan.

1.2 Objectives, Scope of Work and study modules2

1.2.1 Objectives of the study

The objectives of this exercise as defined by TNUIFSL were to:

a) Define the growth directions and service up-gradations in relation to the activity mix / growth

b) Look at the demand for the projects specified by the ULBs, and identify gaps in services to

broadly outline infrastructure needs;

c) Identify specific capital improvement needs with regard to priority city infrastructure in both

slums and other areas

d) Define revenue enhancement and revenue management improvements required to sustain the

rehabilitation proposed

e) Identify reforms required in local administration and service delivery and management changes

required at the local level to improve O&M of assets

f) Suggest measures to address common growth and infrastructure issues.

2 Compiled from the Terms of Reference document prepared by TNUIFSL

CCP cum BP - Ambattur Municipality 2

1.2.2 Scope of work

A brief summary of the scope of work for the study is given below:

a) Assessment of demand for projects identified by ULB.

b) Assessment of the financial and operating aspects of Ambattur

c) Review issues relating to revenue realisation, asset management and institutional constraints

d) Development of a Financial and Operating Plan (FOP), taking into account potential revenue

enhancement and cost reduction measures

e) Prepare a draft Memorandum of Association between ULB and TNUIFSL that will outline. base

line indicators and the performance targets on the same.

f) Initiate consultations with council and local stakeholders on the priorities; redefine priorities and

work with the Council to resolve on adoption of the City’s FOP and CCP actions.

g) Finalize Action Plan for the City, with a resolution from the council on the priorities and

commitment to implement revenue and management improvement measures.

The detailed Terms of reference provided by TNUIFSL is enclosed in Annexure I.

1.2.3 Study outputs and modules

We have clubbed overlapping and related study outputs defined in TNUIFSL’s RFP into the

following modules:

Module I - Rapid Urban Assessment

Module II - Strategic Plan, Capital Investment Needs and Asset Management Plan

Module III - Project risk, environmental and social assessment

Module IV - Financial and Operating Plan

Module V - Policy Interventions and Technical Assistance requirements

1.3 Approach and Methodology

We conducted this study in three phases. Exhibit 1.1 provides a snapshot of the approach and

methodology along the study modules and the deliverable(s) covered in each phase.

1.3.1 Phase I – Diagnosis and Fact-finding

The diagnostic review was directed towards achieving an understanding of demographic and

economic profile of the town along with a review of the operating and financial performance of

Ambattur municipality. During this phase, we focused our fact gathering on the following:

Understanding of the city context and characteristics in terms of demographics, land-use and

economic development

Assessment of current status and requirements for various urban services

Review of operational performance and service delivery of Amb-M in infrastructure

segments

Compilation of information on ongoing and proposed schemes and projects.

CCP cum BP - Ambattur Municipality 1

Exhibit 1.1 IMaCS’ approach and methodology

Our methodology for this phase covered the following:

a) Primary research

We had interactions with the Commissioner and officials in various departments of Ambattur

municipality. The objectives of these interactions were to get a first-hand view of the

perspectives of these officials with respect to the overall status of the town and the issues in

delivery of urban services.

b) City Visits

Our team made several reconnaissance visits to different parts of the town to understand the

spatial characteristics of the town and to get hang of the ‘visible’ issues facing municipal

management in the town.

During these visits, IMaCS’ team also had informal dipstick interactions with the local

populace to capture select perceptions on the town and its municipal administration.

c) Collection of information on aspects relating to the town and municipality

We spent substantial time during this phase in perusing various documents and information

available with Amb-M and in follow-up discussions with ULB officials on the information

gathered. In preparing this report, we have relied on the information provided by the ULB.

Phase I of the study culminated with the submission of Rapid Urban Assessment Report.

1.3.2 Phase II - Consultations and Analysis

In phase II, we validated the findings of our rapid urban assessment report through extensive

consultations in the town. The activities during this phase included:

Phase I

Diagnosis and Fact Finding

Phase II

Consultations and Analysis

Phase III

Finalisation of CCP-BP and adoption by Council

• Stakeholder consultations

– Chairperson and Council

– Consultations with Stakeholders

– Interaction with other government

agencies / TNUIFSL / CMA

• Analysis

– Priorities for Capital Investment

– Financial status and borrowing

capacity

– Base projections for 10 years

– Draft Financial and Operating Plan

• Implementation roadmap

– Preparing Draft MoA between TNUIFSL and ULB

– Identifying technical support required

for implementation

– Identifying policy interventions from GoTN /GoTN agencies

• Submission of DRAFT FINAL

REPORT

• Adoption of CCP-BP

– Council Resolution and commitment

Study Modules

• Demand Assessment

• Rapid Urban Assessment

Deliverable

Report on Demand Assessment and Rapid Urban Assessment

Study Modules

• Strategic Plan, CIP and priority asset management plan

• Project risk, environmental and social assessment

• Draft Financial and Operating Plan

Deliverable

Interim Report

Study Modules

• Policy Interventions

• Technical Assistance

• Final Report

Deliverable

Draft Final report and

Final Report

• Interaction with Chairman and

Commissioner

• Fact-finding at department level

– Engineering

– Town Planning

– Health

– Administration/Accounts

• Information collection incl.

– Vision Plan

– SFC questionnaire

– Info on Projects/Schemes planned

– Development Proposals

– Annual accounts and DCB

statements

CCP cum BP - Ambattur Municipality 2

a) Consultations with the Council - The focus was to understand issues in urban services and to

drive a consensus on the future actions for the town. We deliberated the projects needed in order

to factor the council’s priorities. Refer Annexure II for minutes of the discussions

b) Public consultations – We had public consultations with key stakeholders in the city organised

with the support of the Federation of Residents’ Welfare Associations of Ambattur. The objective

of this session was to to facilitate a wider participation of stakeholders in this exercise. Annexure

III provides minutes of our meeting with the public stakeholders.

c) Analysis and finalisation of Capital Investment Plan – Based on the findings of the rapid urban

assessment and consultations with Council and stakeholders, we arrived at the Capital Investment

Requirements for the town for the next 20 years. (i.e., 2008-2027).

Phase II of the report culminated with the submission of the report on Strategic Plan, Capital

Investment Plan and Asset Management Plan report for the municipality.

1.3.3 Phase III – Finalization of report

This phase involved finalizing the contours of the City Corporate Plan cum Business Plan of

Ambattur municipality. During this phase we crystallized

a) Reform agenda to be adopted by Amb-M including revenue enhancement options.

b) Policy interventions and technical assistance required for Amb-M to implement the CCP-BP.

c) Assessment of borrowing capacity and preparation of a sustainable Financial and Operating Plan.

1.4 Organization of this report

This document presents our Final Report of the study and is structured along the sections given below.

Prior to finalisation, the Draft Final Report was submitted and reviewed by TNUIFSL, CMA and

Amb-M. The report with the incorporated changes was presented to the municipal council, which

passed a Council Resolution3, approving the report in its meeting on 18.02.2008

Section 1 Introduction

Section 2 City profile and demographics

Section 3 Economic profile and Land use

Section 4 Rapid urban assessment – services, issues and gaps

Section 5 Urban Governance and management

Section 6 Analysis of financial performance

Section 7 Vision and strategic plan, CIP and asset management plan

Section 8 Project profiles including analysis of risks and ESA considerations

Section 9 Reform Agenda and Technical Assistance

Section 10 Financial and Operating Plan

3 Copy enclosed with Executive Summary of report

CCP cum BP - Ambattur Municipality 3

2. Town profile and city demographics

2.1 Geography

2.1.1 Location

Ambattur is located at 13.1o N 80.16

o E and has an average elevation of 17 m. Situated on the western

side of Chennai city as one of its suburban areas and to the south of Red Hills Lake, one of the

important reservoirs that supply water to Chennai city. Ambattur is within the Chennai Metropolitan

Area (CMA) and is at a distance of about 20-km from Chennai on Chennai - Thiruvallur High Road.

Ambattur falls within the district of Tiruvallur, which was carved out by bifurcating erstwhile

Chengalpattu district. At present this district is comprised of eight taluks namely Ambattur,

Gummindipoondi, Ponneri, Uthukkottai, Tiruvallur, Poonamallee, Tiruttani and Pallipattu.

2.1.2 Road and rail connectivity

Exhibit 2.1 provides the location of Ambattur within Chennai Metropolitan Area along with a map of

Ambattur town. The Chennai Tiruvallur highway (MTH Road or NH 205) passes through Ambattur

and the Chennai-Kolkata highway is about 7 km from Ambattur. The new Chennai Bypass between

Maduravoyal and Madhavaram would pass through Ambattur. The completed first phase of the

Bypass connects NH 45 with NH 4. The second phase, under construction, connects NH 4 with NH 5

and NH 205 via Ambattur Industrial Estate.

The Chennai Central - Arakonam suburban railway line passes through Ambattur and has 3 railway

station at Korattur, Pattravakkam and Ambattur within Amb-M. Suburban broad gauge trains operate

on this route daily from Chennai Central and Chennai Beach to Arakonam, Avadi and Tirutani.

2.2 Ambattur municipality - administrative status

Ambattur comes under the North Chennai parliamentary constituency and Villivakkam assembly

constituency. Earlier a major panchayat, Ambattur was constituted as a township municipality on 30th

January 1971, by bringing together 10 revenue villages namely, Ambattur, Athipattu, Mannurpet

Parravaakkam, Menampet, Kakkapalam, Padi, Koratur, Mogappair and Oragadam.

It was upgraded to a selection grade municipality on 1st April 1975 and subsequently as a Special

Grade Municipality on 26th May 1992. Amb-M includes the areas of Padi, Koratur, Anna Nagar

Western Extension, Moggapair and Ambattur Industrial Estate areas.

The Municipal Council, comprising of 52 ward members, one of whom is elected as the Chairperson.

The executive wing is headed by Commissioner, who is assisted by a team of officials including

Municipal Engineer, Municipal Health Officer and Manager. The current Municipal Council took

charge in October 2006.

CCP cum BP - Ambattur Municipality 4

Exhibit 2.1 Location of Ambattur within CMA

Source: II Master Plan Document. CMDA, Ambattur Municipality

CCP cum BP - Ambattur Municipality 5

2.3 Population

2.3.1 Decadal trends

Exhibit 2.2 provides a snapshot of the population growth over the last few decades.

Exhibit 2.2 Population growth trend

Year Population Census

households

Growth Rate (%)

Annual Decadal

1961 27,000 37,271

1971 52,750 42,597 5.38% 69%

1981 115,901 48,429 9.78% 154%

1991 215,424 53,845 6.39% 86%

2001 310,967 73,630 3.74% 44%

Source: www.tnulbs.tn.gov.in

As per the latest census, Population of Amb-M was 310967 (~ 73630 households). The spike in

population growth since 1960 is attributable to creation of Ambattur municipality, Ambattur Industrial

Estate and industrial developments that followed. Though population growth rate decreased relatively

during 1991-2001, but continues to be substantially high.

Discussions with municipal officials reveal that the town has an average floating population of about

100,000, which is due to the industrial area within the town and proximity to the Chennai city. The

town is an important node on the rail and road corridors connecting Chennai to Avadi, Tiruvallur,

Tiruttani, Renigunta and Tirupati which also explains the high floating population and the traffic trips

attracted by arterial roads of Ambattur.

2.3.2 Ward wise population

Wards 2-6, 11-12, 20, 24, 29, 32, 35-37, 46, 48, 50-52 had a population of more than 6000 at the time

of Census 2001 and constitute the residential areas of the town. The Ambattur Industrial Estate is

spread across wards 29 and 30 and parts of ward 21.

2.3.3 Population vis-à-vis other suburban areas within CMA

Exhibit 2.3 provides details of population growth trend in Ambattur vis-à-vis other suburbs within

CMA. Ambattur is the largest municipality in the CMA in terms of population and stands second in

terms of land area (behind Avadi). In spite of being the largest municipality in the CMA, the

population growth in Ambattur has been healthy even during the 1990s. With its proximity to

Chennai, large land area and lower population density (77 per hectare) vis-à-vis Chennai city area

(247 per ha), the population growth is expected to be strong in Amb-M.

CCP cum BP - Ambattur Municipality 6

Exhibit 2.3 Amb-M vis-à-vis other suburban areas in CMA

Source: Chennai draft II Master Plan document. www.cmdachennai.org, IMaCS analysis.

2.3.4 Literacy Rate and sex ratio

Exhibit 2.4 provides details of the sex ratio along with details of Literates for Ambattur, Chennai City,

CMA and Urban areas in Tamil Nadu.

Exhibit 2.4 Literacy and sex ratio

Particular Male Female Total Region Sex Ratio

Literates (nos) - Ambattur 134,067 113,291 247,358 Ambattur 940

Literacy % - Ambattur 93.59 84.27 89.07 CMA 956

Literacy Rate - CMA n.a n.a 76.09 Chennai City 957

Literacy Rate - Chennai City n.a n.a n.a Tamil Nadu Urban 982

Literacy % - State - Urban 88.97 75.99 82.53

Source: http://www.census.tn.nic.in

As seen, literacy rates in the town are greater than the overall urban literacy scenario in Tamil Nadu.

The number of literates has shown positive trend in absolute terms as per the latest census data. There

has been also been a significant increase in female literacy over the last decade. This may be

attributed to migration of educated male population to other cities in search of employment

opportunities and increase in proportion of girls enrolling into schools. The sex ratio for Amb-M at

940 is lower than the state average of 982 (as per Census 2001) reflecting the lower female

population. Ambattur falls even below Chennai city, which has a sex ratio for 957 and CMA where

the sex ratio is 956.

Pop.density / Ha

1971 1981 1991 2001 1971-2001 1991-2001 2001

1 Alandur 8.08 65.04 97.45 125.24 146.29 2.7% 1.6% 181

2 Ambattur 40.36 45.59 115.90 215.42 310.97 6.6% 3.7% 77

3 Anakaputhur 2.98 10.88 15.30 24.35 31.92 3.7% 2.7% 107

4 Avadi 61.57 77.41 124.70 183.22 229.40 3.7% 2.3% 37

5 Kathivakkam 4.75 16.14 22.10 27.17 32.59 2.4% 1.8% 69

6 Madhavaram 17.41 21.05 29.46 49.26 76.09 4.4% 4.4% 44

7 Maduravoyal 4.78 6.46 7.45 14.88 43.61 6.6% 11.4% 91

8 Manali 7.49 3.34 11.96 19.09 28.60 7.4% 4.1% 38

9 Pallavaram 16.10 51.37 83.90 111.87 137.93 3.3% 2.1% 86

10 Pammal 5.19 9.05 27.82 36.51 50.00 5.9% 3.2% 96

11 Poonamallee 6.55 18.72 23.67 28.83 42.60 2.8% 4.0% 65

12 Tambaram 20.72 58.81 86.92 113.29 137.93 2.9% 2.0% 67

13 Thiruverkadu 18.63 13.08 17.23 27.84 32.20 3.0% 1.5% 17

14 Tiruvottiyur 21.35 82.85 134.01 168.64 212.20 3.2% 2.3% 99

15 Ullagaram 3.64 2.38 8.58 16.13 30.42 8.9% 6.5% 84

16 Valasaravakkam 2.97 2.41 7.58 21.95 30.98 8.9% 3.5% 104

All Municipalities 242.57 484.58 814.03 1,183.69 1,573.73 4.0% 2.9% 65

Chennai Corporation 176 2642.00 3285.00 3843.00 4344.00 1.7% 1.2% 247

Town Panchayats (20) 156.02 111.18 164.19 271.35 385.72 4.2% 3.6% 25

Panchayat Unions (10) 617.00 267.3 338.74 520.24 730.79 3.4% 3.5% 12

TOTAL CMA 1,191.59 3,505.06 4,601.96 5,818.28 7,034.24 2.3% 1.9% 59

Growth % Population (Thousands)

Sl. No. Municipality

Area

sq.km

CCP cum BP - Ambattur Municipality 7

2.4 Population projections

We have projected the population for Ambattur town has been made using the following methods:

d) Arithmetical Increase Method

e) Geometric Increase Method

f) Incremental Increase Method

Exhibit 2.5 provides the summary of the population projects made for the town. Annexure IV

provides the detailed computations.

Exhibit 2.5 Population Projections

Arithmetic Geometrical Incremental Average CMDA Master Plan estimate

2001 (Actual) 310,967 310,967 310,967 310,967 310,967

2011 381,959 558,947 407,610 449,505 488,000

2016 417,455 749,375 465,550 544,127 611,000

2021 452,951 1,004,680 529,904 662,511 765,000

2026 488,446 1,346,964 600,670 812,027 958,000

Source: IMaCS analysis, CMDA II Master Plan for Chennai

The enumerated population for Ambattur in 2005 as provided in the Solid Waste Management Action

Plan is 4.01 lakh. Therefore, the population in the town appears to growing geometrically during 2001

and 2005. The population of Ambattur town could potentially triple in the next two decades going up

to 0.81 mn to 0.95 mn. by 2026. It is therefore critical that land-use and master planning for the town

and adjoining areas factor this population growth. Amb-M should need to take into account these

population projections and trends for planning, execution and implementation of infrastructure

projects in order to ensure adequate provision of urban services.

CCP cum BP - Ambattur Municipality 8

3. Economic profile and Land use

This section analyzes issues relating to Town planning, land-use and economic status of the town.

3.1 Planning efforts within CMA

3.1.1 Chennai Metropolitan Area

Ambattur falls within the Chennai Metropolitan Area. The Chennai Metropolitan Area (CMA)

comprises of Chennai City and areas to an extent of 376.59 sq.km. in Kancheepuram District and 637

sq.km. in Thiruvallur District. According to 2001 Census, 38.6.percent of population of

Kancheepuram District and 57.5 percent of population in Thiruvallur District live within CMA.

Chennai Metropolitan Development Authority (CMDA) constituted by Government in 1975 by an

order formulated the 1st Master Plan, which was consented by the Government in G.O.Ms.No.2395,

Rural Development and Local Administration, dated 04.12.1976. The Chennai Metropolitan Area

consisting of 306 villages in 10 Panchayat Unions, besides 28 Town Panchayats, 8 Municipalities and

1 cantonment covers an extent of 1177 sq.km.

3.1.2 Role of Chennai Metropolitan Development Authority

The functions of the CMDA as per section 9-C of the Tamil Nadu Town & Country Planning Act,

1971 (Tamil Nadu Act No. XXXV of 1972) are

a) To carry out a survey of the Chennai Metropolitan Planning Area and prepare reports on the

surveys so carried out;

b) To prepare a master plan or a detailed development plan or a new town development plan as the

case may be, for the Madras Metropolitan Planning Area;

c) To prepare an existing land use map and such other maps as may be necessary for the purpose of

preparing any development plan;

d) To cause to be carried out such works as are contemplated in any development plan;

e) To designate the whole of the Madras Metropolitan Planning Area or any part thereof within its

jurisdiction as a new town and to perform the following functions, namely (a) to prepare a new

town development plan for the area concerned; and (b) to secure the laying out and development

of the new town in accordance with the new town development plan;

f) To perform such other functions as may be entrusted to it by the Government.

3.1.3 Chennai Master Plan - evolution and status

The first Master Plan for the Chennai Metropolitan Area was prepared by CMDA and approved by

the Government in G.O.Ms.No. 2395, R.D. & L.A., dated 4.12.76. The 1st Master Plan was followed

up with Detailed Development Plan taken up mostly within the city where it was experiencing rapid

growth.

CCP cum BP - Ambattur Municipality 9

a) Land-use regulation and Development Control Rules were implemented to regulate development.

b) A set of measures including shifting the wholesale markets, bus terminus were taken to decongest

the city was suggested such as from the core to the city periphery.

c) Periodic review of Land Use Zoning depending on demand for housing, services, and

employment generation projects in industrial and information Technology sectors etc. apart from

processing of individual requests for reclassification also became a feature of urban planning.

d) Of the three satellite towns proposed at Maraimalai Nagar, Thiruvallur and Gummidipoondi with

target population of 1 lakh each. CMDA had taken up development of Maraimalai Nagar Satellite

Town over an area of about 1200 acres; of which about 50% of the land area has been developed

for industries and the remaining for housing with all infrastructures. The Maraimalai Nagar

Municipality comprising the new town and also the adjoining areas has about 0.5 lakh population.

In respect of the other two satellite towns identified the population as per 2001 was 0.75 lakh in

Thiruvallur and 1.95 lakh in Gummidipoondi. These two towns, even without intervention by

CMDA has grown as satellite town because of good rail and road network connectivity to the

parent city.

e) In respect of urban node at Manali, CMDA acquired about 500 acres of land and developed for

residential developments to accommodate a population of about 70,000. In the remaining 5 nodes

viz. Minjur, Avadi, Ambattur, Alandur and Tambaram through land use regulation, the target

population had been achieved.

Further to the implementation of the I Master Plan, CMDA submitted the draft Second Master Plan

(SMP) for Chennai Metropolitan Area - 2011. Since there were delays in implementing the Master

Plan, GoTN observed that during the long gap between the date of consent of Second Master (1995)

and date of dismissed Writ Petition filed against the finalisation of said draft (2001), GoTN returned

the draft master plan for CMA - 2011 to CMDA directing CMDA to modify the draft second Master

Plan taking into account the urban developments made, amendments made to DCR, future needs of

CMA and also the CRZ regulations etc. An updated draft SMP was submitted by CMDA to GoTN in

December 2005 with the request that an opportunity to the public and local bodies may be given for

giving their objections / suggestions before finally approving the plan. The consultations on the draft

SMP is currently under progress.

3.2 Economic status

Being a part of the CMA and an adjacent urban area, Ambattur’s economic status and growth is

entwined with the economic activities and growth potential within the CMA. The following section

captures some of the key economic drivers for Ambattur municipality.

3.2.1 Developments in CMA

Over the years, the economic base of Chennai had shifted from trade and commerce to administration

and services by the early part of the 20th Century. In the post independence period, manufacturing

became an important sector and CMA continues to be the most important industrial center in the

State. Recent trend shows that the economic structure of the city is getting tertiarised with growing

CCP cum BP - Ambattur Municipality 10

contribution by Information Technology (IT) / Business Process Outsourcing (BPO) and other

services. Analysis presented in Chennai SMP indicates that the CMA region alone accounts for nearly

16.21% of the state’s income from all sectors with a similar proportion of the labor force in the state.

Agriculture enterprise and establishments in Chennai and Kancheepuram Districts accounts for

minimum and contributes only about 5% to the state’s total.

Major industries in CMA are Auto, Auto Components, Railway Coach building, Petrochemicals and

Fertilizers, Light Engineering and Leather products. Some of the large units are located at Ennore,

Thiruvottiyur, Manali, Sembiam, Padi, Ambattur, and Porur and along GST Road, apart from the

Integral Coach Factory at Perambur, and Heavy Vehicles Factory at Avadi. Many Small and Medium

Enterprises (SMEs) are located at Vyasarpadi, Ambattur, Villivakkam, Guindy and Thirumazhisai

industrial estates, at Madhavaram, Kodungaiyur, Poonamallee, Noombal, Perungudi, Seevaram and

Sholinganallur. Simpson, Addison and TVS industries are located in the heart of the city along Anna

Salai. MEPZ spreading over an area of 261 acres is functioning at Tambaram. Leather tanneries and

leather based industries are located at Pammal and Madhavaram. Thermal Power Plants are located at

Basin Bridge and Ennore. Many of the smaller units are scattered in various parts of the Chennai City

and the rest of CMA. Industrial estate for leather goods is being developed at Thirumudivakkam.

Large Scale automobile engineering, glass and ceramic industries are located within 50 Km. from

CMA at Marai Malai Nagar, Irungattukottai, Sriperumbudhur, Thiruvallore and Gummudipoondi; to

mention a few are Mahindra Ford factory - manufacturing cars at Marai Malai Nagar, Hyundai Car

factory and Saint Gobin Glass factory at Sriperumbudur, Spartek Ceramic tile manufacturing industry

and Hindustan Earth Movers and HM Mitsubishi at Thiruvallur. Mahindra Industrial Park developed

over an area of 1300 acres located along GST Road (near Chengalpattu) is about 42 Km. from CMA.

Tamil Nadu accounts for about 21percent passenger cars, 33percent commercial vehicles and

35percent automobile components produced in India. Chennai, the ‘Detroit of India’ is emerging as a

major export hub for cars in South East Asia. In July 2005, the Government of India has decided to

establish a new testing and homologation centre near Chennai. It is expected to bring about large

savings in the foreign exchange spent on testing exportable vehicles at overseas facilities and also

attract foreign exchange inflows by providing a competitive platform for manufacturer abroad to test

their vehicles here. Tamil Nadu accounts for 70percent of leather tanning companies in India and

38percent of leather foot wear and components; most of the footwear industries are located within

CMA. A cluster of chemical industries is located at and around Manali in CMA. The presence of two

major ports (Chennai and Ennore) and an international airport has made the CMA region attractive for

investments with international trade linkages.

3.2.2 Economic drivers - Ambattur

Ambattur Industrial Estate

The Ambattur Industrial Estate was established in 1964 and is one of the largest industrial areas in

Asia. Majority of the manufacturing units are auto ancillary units catering to many large industries

CCP cum BP - Ambattur Municipality 11

located in Chennai and elsewhere. The industrial area employs around 1 lakh employees, of which

women form 1/3 rd of the total workforce. The industrial area's annual turnover is Rs 2000 crore with

exports of more than Rs 500 crore.

Ambattur Industrial Estate had its functioning commissioned in the year 1964, by the Government of

Tamil Nadu. Several factors such as suitability of the soil, communication facilities, availability of

raw materials and availability of ground water suitable for industrial and domestic purposes, etc., were

responsible for seeking this place for the setting up of this industrial Estate. An extent of 4 km²

adjoining the estate was acquired by the Tamil Nadu Housing Board for housing purposes.

Companies like Britannia Industries Limited, TI Cycles of India, Dunlop, TVS have their plants in

Ambattur. Videsh Sanchar Nigam Limited has its Satellite earth station at the Ambattur-Red Hills

road. Jaya TV, Vijay TV, Asianet and Kairali relay signals from this facility. The estate is also

becoming home to a number of IT-ITES facilities. Software companies like HCL Technologies and

Tata Consultancy Services have set up their development centres in the Ambattur industrial estate.

There are also a few BPOs like Perot Systems within the estate.

The maintenance of infrastructure services within the Ambattur Industrial Estate has been entrusted to

a Special Purpose Vehicle called the ‘Chennai Auto Ancillary Industrial Infrastructure Up gradation

Company (CAAIIUC)’. CAAUIUC has been formed to improve infrastructure facilities in the

Ambattur Industrial estate and two other industrial estates in Thirumudivakkam and Thirumazhisai.

Ambattur municipality only provides Solid Waste management services in the Industrial estate. Other

infrastructure services have been entrusted to CAAUIUC.

Linkages to nearby industrial centres and Chennai city

Ambattur is well connected to Chennai city to other industrial areas of Tiruvallur, Sriperumbudur,

Manali and Ennore. The Chennai Tiruvallur highway (MTH Road or NH 205) passes through

Ambattur and the Chennai-Kolkata highway is about 7 km from Ambattur. The new Chennai Bypass

between Maduravoyal and Madhavaram would pass through Ambattur. The completed first phase of

the Bypass connects NH 45 with NH 4. The second phase, under construction, connects NH 4 with

NH 5 and NH 205 via Ambattur Industrial Estate. The Chennai Central - Arakonam railway line

passes through Ambattur and has a railway station at Ambattur. Suburban broad gauge trains operate

daily from Chennai Central and Chennai Beach to Arakonam, Avadi and Tirutani via Ambattur.

The connectivity to these nearby areas, proximity to Chennai city and local employment opportunities

due to the presence of the industrial estate and other commercial developments has made Ambattur

one of the fastest growing residential settlements in the CMA region as well.

3.3 Land-use and development

Ambattur was identified as a major node for development in the first Master Plan of the Chennai

Metropolitan Area, through which major transport corridors and development was envisaged to take

place. As per the draft Second Master Plan, the large scale neighbourhood development of Tamil

CCP cum BP - Ambattur Municipality 12

Nadu Housing Board (TNHB) with full infrastructure catalysed further private developments for

residential use in Mogappair and parts of Ambattur adjoining Chennai city (near Anna Nagar).

The establishment of the industrial estate in 1963 and the subsequent growth of industries in the

region catalysed further development in Ambattur municipality. A number of large industrial units

including Sundaram Clayton, Wheels India etc are present outside of the limits of the Ambattur

Industrial Estate, within Ambattur municipality.

3.3.1 Land-use

Development pattern and trends

This section further details the qualitative dimensions of the development and growth corridors in

Ambattur town.

Residential developments

The south west part of Ambattur (wards 36-52) close to Anna Nagar covering Mogappair area has

become a strong residential development largely due to neighbourhood development by TNHB that

catalysed substantial private residential construction in this area as well. This followed efforts of the

state government, through schemes anchored by the Tamil Nadu Housing Board, to make Mogappair

a residential suburb, primarily for those employed in industrial units in neighbouring areas. Korattur

area around the railway station (24-26) in the central part of the town along the railway station also

was developed by TNHB as a residential settlement. Wards 36 and 50 account for bulk of the slum

population in this part of town. Apart from these areas, development is also noticeable along the

North West part of the town (along wards 10-18) along Ambattur Railway station and Ambattur OT

bus stand.

Developments along the railway line

The Chennai – Tiruvallur – Renigunta railway line traverses through the middle of Ambattur

municipality crossing the town from east to west. Three stations on the Chennai-Arakonam suburban

railway network fall within the municipal limits namely, Korattur, Pattaravakkam and Ambattur.

Commercial developments and residential clusters are seen along the railway stations. Data available

from the municipality also suggests substantial slum population along Pattaravakkam and Ambattur

railway stations. (Wards 6 and 16).

Industrial Estate

Wards 29, 30 and part of 21 form the SIDCO Industrial Estate inside which bulk of the industrial units

of the municipality are housed. The total extent of the land is 1167 acres and the industrial estate has

around 2000 large, medium, small and tiny industries. This area is being managed by SIDCO and all

infrastructure facilities and requirements of this area (except Solid waste management) is being

handled by SIDCO.

CCP cum BP - Ambattur Municipality 13

Areas adjoining Water bodies – Red Hills lakh, Ambattur Eri and Korattur Eri

Wards 1-3 fall along the boundary of Red Hill reservoir and forms part of the catchment area for the

reservoir. These wards are sparsely developed. Similarly the areas around Koratur Eri (Wards 3-8)

and Wards (32-34) south of ambattur eri have not witnessed substantial development. However, these

areas seem to have a substantial slum population (8 wards 3,4,6,7,8 and 32-34 falling in this area

account for approximately 25% of the slum population of the town).

3.3.2 Growth potential

Considering Ambattur’s low population density (77 per hectare) vis-à-vis Chennai (240 per hectare)

and the fact that only the south east part of the town is completely developed, Ambattur offers

substantial development potential. This is also reflected in the growth trend of population and

population projections of the Second Draft Master Plan, which expects the population of the town to

cross 0.75 million in the next two decades. Development of arterial roads covering MTH road, NH

Bypass and the proposed Outer Ring Road and other proposed new road formations could further

boost the developments within Ambattur.

CCP cum BP - Ambattur Municipality 14

4. Rapid urban assessment - services, issues and gaps

This section provides details of the current status of various urban services in Ambattur Municipality

and summarizes key issues. The section also covers an analysis of the projects identified by Ambattur

municipality as part of its Vision Plan and the demand assessment of these projects. Finally, the

section summarizes the normative gaps in infrastructure provisioning in water supply, underground

drainage, roads, streetlights and solid waste management.

The Ambattur Industrial Estate falls within the boundaries of Amb-M. However, infrastructure

services within AIE have been entrusted to a separate Special Purpose Vehicle (SPV). Amb-M

handles only Solid Waste Management activity within the AIE. The remaining urban services in the

Estate including roads, water supply, sanitation and street lights etc are managed by the SPV.

4.1 Water Supply – existing status

Ambattur Municipality does not have an integrated and comprehensive water supply scheme covering

the entire town. Water supply in 11 wards of the municipality is catered to by the Chennai Metro

Water Supply and Sewerage Board. A water supply network designed and developed by the Tamil

Nadu Housing Board (TNHB) in the Korattur area was handed over to Amb-M in 1983 and has been

managed by Amb-M since then. Other parts of the town are yet to have a water supply network in

place and are catered to by a combination of public fountains and Sintex tanks serviced by lorries and

from local wells / bore wells. Exhibit 4.1 provides a summary of the water supply situation is various

wards of the town.

Exhibit 4.1 Water Supply in Amb-M - Ward wise status

Sl. No Agency managing water supply Wards Type

I

CMWSSB (Development and

maintenance)

Source: Puzhal Eri (Red Hills)

11 Wards

35,37,38,43,46-52

House Service Connections,

lorries and Sintex tanks. Charges

collected by CMWSSB

II

CMWSSB (Bulk supply) with Amb-M

maintenance and supply

Source: Puzhal Eri Red Hills, local Hand

pumps and bore wells

21 Wards

6-9,11-21,27,29-

31,33,34

Water Supply through 4 OHTs to

Public Fountains and tankers only.

Charged at Rs. 7 per KL by both

Amb-M and CMWSSB

III

Developed by TNHB and maintained by

Amb-M

Source: Bulk water supply from Puzhal

Eri to Koratur OHT

7 wards

22-24 (HSCs),

4,5, 25-26 (PFs)

~ 2400 House Service

Connections (in wards 22-24) and

Public fountains/ Lorry supply

IV

Amb-M and CMWSSB (Uncovered

Areas)

Source: Puzhal Eri, Red Hills

13 wards

1-3, 17, 28, 39, 40,

41, 42,44,45

Water supply through 7 tanker

lorries and mini power pumps by

both CMWSSB and Amb-M

Source: Note on Water Supply provided by Amb-M. Discussions, IMaCS analysis

CCP cum BP - Ambattur Municipality 15

4.2 CMWSSB network - Anna Nagar Extension and Mogappair area - 11 wards

Water supply in 11 wards (Ward 35, 37, 38, 43, 46-52) is managed by CMWSSB. These wards are

supplied through a combination of House Service Connections and supply through water tanks which

are filled periodically through Lorries by CMWSSB. Protected water supply in these areas through

piped household connections and Sintex tanks is provided by CMWSSB. Water supply in the 11

wards is provided in 4 zones by CMWSSB through a) depot 923 b) depot 924 c) depot 925 and d)

depots 926 & 927. Details of the supply in these four depots is provided in the table below.

Exhibit 4.2 Details of water supply in 11 wards maintained by CMWSSB

Particulars Depot

923

Depot

924

Depot

925

Depot

926 & 927

Total

Areas served Annanagar

west extn. I

Annanagar

West extn II

Mogappair

East

Mogappair

West

-

Source and Volume of Supply

Source of Supply Puzhal lake&

Krishna water

Served by common mains from Veeranam-Porur

lake and Chembarambakkam lake

Current supply volume (MLD) 1.85 2.20 1.97 3.00 9.02

Population served (Lakh) 0.42 0.5 0.5 0.35 1.77

Per capita supply 44 44 39 86 51

Distribution main

Street Length (km) 16.69 26.50 26.30 25.60 95.09 Water pipe length 21.98 22.11 22.70 25.20 91.99

Connections

Number of Connections 1582 2458 6077 4849 14966

Public Fountains - 34 10 - 44

IM-II Hand pumps - 21 87 64 172 Total public supply points - 55 97 64 216

As seen from the above table, Water supply in these wards is to the extent of about 9.02 MLD

implying a daily supply per capita of approximately 50 LPCD which falls below the municipal norm

of 90 LPCD. As per details available for these 11 wards, the number of water connections translate to

roughly 60% of the assessed properties. Apart from the piped connections, there is 1 public

connections (fountains and IM-II hand pumps) for every 820 persons in these 11 wards.

4.3 Water supply in other wards – maintained by Amb-M

4.3.1 Koratur TNHB area - 7 wards

In this zone, water is supplied from Korattur OHT (capacity of 5 lakh litres) and Ground Level

Reservoir (GLR) (capacity of 5 lakh litres). The OHT along with a distribution network in three wards

(Wards 22-24) was originally implemented by Tamil Nadu Housing Board (TNHB) and was handed

over to Amb-M during 1983. Water is supplied through piped connections to 2400 households in this

area. The OHT from this network also serves public fountains in wards 4, 5, 25 and 26. In view of the

CCP cum BP - Ambattur Municipality 16

water shortages, CMWSSB is not supplying water to this area. Amb-M supplies water to this zone

using lorries on hire.

4.3.2 Ambattur area - 21 wards

Venkatapuram, Varadharajpuram, Mannurpet and Athipattu areas have nearly 475 public taps through

which nearly 13 lakh litre of water per day is provided. Water is supplied from 4 Over Head Tanks

through public fountains. At times of shortage nearly 6-7 lakh litres are being provided. The water is

sourced from Puzhal Eri (earlier from Surapet headworks maintained by TWAD). Water supply in 21

wards is provided through this source covering 156,000 people providing 25 LPCD

4.3.3 Water supply through Municipal lorries – Other uncovered wards

Amb-M supplies water through lorries from wells in Dunlop factory. 7 lorries carry 90 loads of water

daily and supply to 120 sintex tanks, serving 45000 people at an average of 12 LPCD.

4.3.4 Water sources

Amb-M meets its water demand through Surface and Sub-Surface sources, through water supply

schemes. Exhibit 4.3 provides details of the sources of water and the total daily supply.

Exhibit 4.3 Water supply in Ambattur - Sources of water and daily supply in MLD

Source: Note on Water Supply provided by Amb-M. Discussions, IMaCS analysis

4.3.5 Storage

Exhibit 4.4 gives details of the storage infrastructure available within Amb-M in terms of Over Head

Tanks (OHTs) and Ground Level Reservoirs (GLRs). There are a total of 5 OHTs with a capacity of

15 lakh litres and 5 GLRs with a capacity of 25 lakh litres, adding up to 40 lakh litres of storage

capacity. However, of these, 4 OHTs are fully damaged and not in usable condition. Therefore,

effective operational storage capacity is 30.5 lakh litres only (5 GLRs plus 1 OHT). The pumping

main of all the OHTs and GLRs are maintained by CMWSSB.

Sl.

No Source / Agency

Daily supply

(MLD)

1 Bore wells with Hand Pump and Open Wells

651 bore wells x 60 x 15 x 2 LPM

1.2

2 Power Pumps

Power pumps in wards 1, 4, 11 and 12 0.6

3 Supply through Lorries by Amb-M 1.26

4 Supply through lorries / Sintex Tanks by CMWSSB (9 wards) 0.3

5 Supply by TWAD to 4 OHTs in Ambattur

From Puzhal Eri 2.0

TOTAL SUPPLY (in MLD) 5.36

CCP cum BP - Ambattur Municipality 17

Exhibit 4.4 Water Supply - Storage infrastructure

Area

OHT /

GLR

Capacity

(Lakh litres)

Year of

construction Remarks

1 Koratur OHT 5.5 1982

(2 Pumps, 20 HP) GLR 5.0 1992

2 Venkatapuram OHT 3.0 1984 Not in use

(3 Pumps, 12.50 HP) GLR 5.0 1998

3 Mannurpet OHT 4.0 1984 Not in use

(3 Pumps, 10 HP) GLR 5.0 1998

4 Opposite TI Cycles OHT 1.5 1984 Not in use

(3 Pumps, 20 HP) GLR 5.0 1998

5 Attipettu OHT 1.5 1984 Not in use.

(2 Pumps, 30 HP) GLR 5.0 1998

Operationally Available Storage (Lakh litres) 30.5 Gap in Storage -

110 Lakh Litres Required (50% of requirement) (Lakh litres) 140.0

Source: Note on Water Supply provided by Amb-M. Discussions, IMaCS analysis

4.3.6 Distribution Network

Only 9 wards in Amb-M out of the total of 52 wards have direct household service connections for

water supply. The distribution line length in Amb-M is about 148.90 km. Seen in the context of the

total road length of Amb-M, which extends over 426 km (including roads managed by State

highways). Therefore less than 35% of road network in Amb-M is covered by distribution network.

4.3.7 House Service Connections

Amb-M municipality manages about 2456 House Service Connections within its limits, for which it

collects user charges at the rate of Rs 60 per month. These fall within the following wards namely, 22,

23 and 24. In addition, CMWSSB provides House Service Connections in about 11 wards in the

municipality. Exhibit 4.5 provides the details of House Service Connections in Amb-M

Exhibit 4.5 House service connections

Managed by No. of connections

CMWSSB 14966

Amb-M 2456

Total connections 17422

Assessed properties 79918

% of Properties 22%

4.3.8 Issues and gaps

Exhibit 4.6 summarises the current status vis-à-vis ultimate population requirements (2026 population

projections assumed as per Chennai II Master Plan document)

CCP cum BP - Ambattur Municipality 18

Exhibit 4.6 Water Supply – Gap analysis

Indicator Unit Norm Existing Gap

Per Capita Water Supply LPCD 90 29 (61)

Storage and Distribution

Storage - % of Current Demand % 50% 22 % (28%)

Distribution Network - % of Road Network % 100% 35% (65%)

Connections / Properties % 70% ~22% 48%

Demand - Supply Gap

Water Demand - Current MLD ~ 35.5

Water Demand – 2026 MLD ~ 120

Water Supply – Current MLD ~ 14.5

Demand Supply Gap – Current MLD ~ (21)

Demand Supply Gap – 2026 MLD ~ (85)

Source: Inputs from Amb-M and CMWSSB, IMaCS analysis

a. Lack of adequate access

Amb-M has 52 wards and had a population of 310,967 during Census 2001. Given municipal norm of

90 Litres per capita per day, demand for water supply in Amb-M was approximately 28 Million

Litres per day (MLD) in 2001. As against this, the total water supplied within Amb-M by various

agencies is only about 5.36 MLD implying that Amb-M is meeting only about 19% of its 2001

requirements currently. As explained in Section 2 earlier, the II Master Plan document for Chennai

prepared by CMDA indicates that population in Amb-M could reach 958,000 by 2026. Even at 110

LPCD, this would imply that Amb-M water demand would go up to 106 MLD by 2026, which is

nearly 3.7 times the demand as of 2001.

b. Mode of supply

Even within the wards where there is access to drinking water, supply is largely through lorries. Only

35% of the road network is covered with a distribution network and large parts of Ambattur are

unserved by piped water network. Water Supply by Lorries is not sustainable and leads to other

problems including traffic congestion and accidents.

c. Need for comprehensive scheme to address Water supply

Ambattur is one of the fasted growing suburbs and the population could potentially double in the next

decade and triple by 2031. Given this context, measures taken in the recent past by CMWSSB and

Amb-M including increase in lorry supplies and additional bore wells and power pumps are adhoc

measures that can alleviate short-term demand at best. There is therefore a need for a comprehensive

plan keeping in mind the ultimate population requirements of the town.

Substantial gap between Water demand and supply in Ambattur Municipality is evident. There

is an urgent need for implementing a comprehensive Water Supply Program on priority.

CCP cum BP - Ambattur Municipality 19

4.4 Sewerage and Sanitation

4.4.1 Underground Drainage (UGD)

Current status

There are two existing Underground Drainage Schemes in Amb-M covering a total of 17 wards.

11 wards managed by CMWSSB

3 wards under Ambattur Eri scheme managed by Amb-M

3 wards under Korattur scheme managed by Amb-M.

Another UGD scheme is under implementation in 19 wards of the municipality. Thus out of 52 wards,

16 wards are uncovered. Amb-M has prepared a feasibility study for undertaking a UGD scheme in

these 16 wards through ASK consultants. This report was submitted to CMWSSB, which is reviewing

and updating the same for implementation. Exhibit 4.7 provides a summary of existing and work-in-

progress UGD schemes in Amb-M.

Exhibit 4.7 UGD schemes - current status

Scheme Wards Connections

UGD

Network

(Km)

Pumping

stations

(Nos.)

STP Location

CMWSSB -

Old Scheme

11 Wards

37,38, 43, 46,47, 48, 50-

52

18490 87.94 3 Koyambedu Treatment

Plant of CMWSSB

Amb-M - Eri

scheme

3 Wards

34-36 1168 ~ 10 km 1

Let out

as waste water.

Koratur

scheme

3 Wards

22,23,24 ~ 2500 1 n.a

CMWSSB -

New Scheme

19 Wards

1-3,6-20 and 31 18,000 148.87 4

Koyambedu Treatment

plant of CMWSSB

Uncovered

Areas

16 Wards

4,5, 25-28, 35-38, 41,

42, 44, 45, 49

Not covered yet.

Source: Presentation on proposed UG scheme given by Amb-M. Discussions. IMaCS analysis

4.4.2 Ongoing UGD scheme

Amb-M is currently executing a UGD scheme covering 19 wards at an outlay of Rs. 39.60 crore. Of

the 40.36 sq.km of Amb-M, the proposed project would cover an area of 10 sq.km. While the current

water supply per capita in this area is 28 LPCD, the project has been assumed to handle 120 LPCD.

About 18000 households are expected to benefit from the proposed scheme. The total length of the

UGD network is 148.87 km with 4 pumping stations. The project was commenced in November 2004

and is expected to fully completed during the current financial year. Exhibit 4.8 provides the details of

the pumping stations and their locations.

CCP cum BP - Ambattur Municipality 20

Exhibit 4.8 Ongoing UGD scheme - Pumping stations

Zone / Wards Location

1-A / Ward 18 Teachers Colony Ward 18

2 / Wards 17 and parts of 12 Nehru Nagar 4th

Street Ward 17

3/ Ward 1-3, 10,11 and 12 Oragadam Ward 10-12

4/ Ward 3, 6-9 13-16, 18-20 and 31 Koratur Ward 23.

Source: Presentation on proposed UG scheme given by Amb-M

4.4.3 Public conveniences (PC)

There are 9 Integrated Sanitary Complexes (ISCs) and 4 public toilets within Ambattur municipality.

In addition there are 2 pay and use toilets. Exhibit 4.9 provides details of PCs in Amb-M.

Exhibit 4.9 Public Conveniences

Details Units

Public Toilets 10

Pay and Use Toilets 2

Integrated Sanitary Complexes 9

Total 21

Source: Amb-M

4.4.4 Storm water drains

Storm water drains carry the wastewater in addition to storm water generated during rains. With a

total length of 134.25 km, the drainage system covers the road network of the town only partially.

Only 31 % of the road network has some form of drains in place. Even in roads covered by drain

network, there are inadequacies relating to poor design, lack of connection to main channels, clogging

and waste accumulation. There is water stagnation in these drains in a number of wards, which are

being used for letting out sullage water from households leading to pollution and poor hygiene

conditions. Exhibit 4.6 provides the details of coverage of storm water drains.

Exhibit 4.9 Storm water drain network

Type Length (km) % of total road network

Kutcha 4.3 1%

Pucca open 125 29%

Pucca closed 4.95 1%

Total Drain length 134.25 31%

Uncovered Road Length 292 69%

Total road length (km) 426 100%

Source: Filled SFC questionnaire. March 2006.

CCP cum BP - Ambattur Municipality 21

4.4.5 Issues and gaps

Specific issues relating to sewerage and sanitation in Ambattur municipality are highlighted below:

1. Incomplete coverage of UGD network - 16 wards are yet to be covered with UGD system.

Though Amb-M has reasonably coverage through septic tanks, an integrated UG system covering

the entire town is critical, given the expected growth of the town.

2. Need for an integrated approach to sanitation - Amb-M has 2 UGD schemes and a new

scheme for 19 wards is under execution. There is also a proposal for executing a UGD scheme for

the remaining 16 wards in the town. While executing the system for the uncovered areas, it is

necessary to undertake an audit of the performance of the existing schemes and address

deficiencies as part of the project to ensure comprehensive coverage.

3. Need to evolve a common user charge policy and connection policy. Since there are multiple

schemes of UGD in the town, there is confusion in terms of issues relating to connection deposits

and user charges. While CMWSSB levies user charges in 11 wards, there are no user charges in

the 3 wards where the UGD scheme is maintained by Amb-M. Amb-M should consider therefore

an integrated policy for sanitation requirements of the town.

4. Need for greater coverage and better maintenance of Public conveniences - Given the

significant proportion of slum population and substantial floating population, there is a need for

providing additional public conveniences and on their upkeep and maintenance. While Amb-M

has initiated steps for construction of ISCs and public toilets, there is scope for greater

improvement in this area.

5. Poor coverage, inadequacies in design and dumping of sullage in Storm water drains - With

the growth in population of the town, the poor coverage of road networks by storm water drains

and the inadequacies in their design without adequate linkages to main channels requires

immediate attention. Dumping of sullage and stagnant pools of water is also visibly disturbing

and leads to pollution and mosquito menace.

4.5 Solid Waste Management (SWM)

Exhibit 4.10 summarizes the status of SWM in Ambattur municipality.

4.5.1 Waste Generation and collection

Ambattur town generates around 196 MT of waste every day. It is estimated4 that nearly 67% of the

waste generated in the town is organic waste, while about 33% is inorganic waste. Solid Waste

Management in 27 wards is managed by the municipality, while SWM in 25 wards (including the

industrial estate areas) has been privatized.

4 Source: Solid waste management Action Plan. Ambattur Municipality

CCP cum BP - Ambattur Municipality 22

Exhibit 4.10 Solid Waste Management - Current status

Particulars Units Values

Generation

Daily Waste Generation MT 196

Daily Waste Collection MT 196

Waste generation per capita gms 433

Collection efficiency % 98%

Transfer Stations / Compost Yard / Dumping Yard

1. Athipet 7.4 acres

Collection / Transfer

Wards with door-to-door collection All Wards

Privatisation of collection 25 wards

Amb-M Private

Number of Wards 27 25 (incl Ind.Est)

Population (2004) 269,887 191,659

Daily Collection (MT) 102 94

Number of Workers 581 294

Primary Collection

Door-to-Door collection Partial Partial

Tricycles in use 75 23

Autos 5

Secondary Collection

Collection points 27

Tipper Lorries 11 13

Dumper Placer 3

Dumper Placer bins 22

Bobcat 1

Compactor – 10 MT capacity 1 -

Compactor Bins 45

4.5.2 Solid Waste Management Action Plan

Exhibit 4.11 gives the process of Garbage Collection and transportation process proposed in the Solid

Waste Management Action Plan of Amb-M. Primary collection is to be done through tricycles and

conveyed to the collection points. As per the proposed action plan, the existing dumping yard at

Athipet is to be converted to a Transfer station. Dumper Placers and compactors would be used to

convey the waste from the collection points to the Transfer station at Athipet. Here the waste is to be

segregated. The biodegradable waste will be sent to a new compost yard being planned at

Kuthambalkam, while the non-biodegradable waste is sent for land fill.

CCP cum BP - Ambattur Municipality 23

Exhibit 4.11 Garbage collection and transportation process – Proposed plan

4.5.3 Primary and secondary collection

Primary collection is handled through 110 tricycles in wards maintained by Amb-M and through 80

tricycles in wards privatized. Apart from this 5 auto rickshaws are also used in the privatized wards.

Collection in Mogappair area, Ambattur O.T area and Industrial estate areas has been privatized.

Apart from this, collection in 2 wards is envisaged through Self-Help groups. Of the total waste

generation of 196 MT, 110 MT is generated in the wards maintained by Amb-M, while the remaining

86 MT is handled in the privatized wards.

The action plan estimates that a total of 320 bins in the privatized wards and a total of 865 bins in

Amb-M maintained wards is required and estimated the additional requirement outlay at Rs. 21 lakh.

The action plan assumes 1 collection point for each ward.

Movement of garbage from collection points to transfer station is handled through tipper lorries in

wards maintained by Amb-M and by a combination of tipper lorries and dumper placers/ bins in the

privatized wards. Given the capacity of 11 tippers and 45 Compactor bins, the total waste collection

capacity at the secondary collection stage works out to 86 MT which falls short of the requirement of

110 MT.

4.5.4 Transfer Station and Compost yard infrastructure

The existing dumping yard at Athipet is envisaged to be converted to a transfer station (at an outlay of

Rs 40 lakh) from which waste will be moved to a newly developed compost yard at Kuthambalkam

Door to Door collection, street

sweeping and mopping

Collection Points

Transfer Station at Athipet

New Compost Yard

Manure

Land Fill

CCP cum BP - Ambattur Municipality 24

4.5.5 Issues and Gaps

Specific issues and gaps in Solid waste management are highlighted below:

1. Need for a comprehensive study - The Solid Waste Management Action Plan prepared earlier

does not factor the potential growth of the town. For example, with the population likely to double

over the next 20 years, the land area is likely to be inadequate. We understand that Amb-M is

already in the process of identifying land for developing scientific disposal facilities. There is a

need to undertake a detailed study on SWM requirements of the town considering future

population requirement.

2. Scope for private participation – While Amb-M has privatized garbage collection in select

wards, there appears to be potential for comprehensive end-to-end management of solid waste

through a public private partnership covering collection, transfer and scientific disposal.

3. Intensifying drive for segregation at source and door-to-door collection in a phased manner

- There is need for increasing awareness on SWM practices at the grassroots. Amb-M should

progressively move towards source level segregation of waste for more efficient disposal and

conversion. It may need to intensify promotion campaigns in this regard.

4.6 Transportation, Bus stands and street lights

4.6.1 Municipal roads

Amb-M maintains a road network of nearly 426 km of which surfaced roads (both B.T. and CC)

constitute nearly 85 %. In addition, nearly 14.5 km of highway roads traverses the Amb-M area.

Exhibit 4.12 provide the details.

Exhibit 4.12 Road network

Type Length in km

Municipal Roads

Cement Concrete 12.51

Bitumen Top roads 363.10

WBM roads 46.09

Earthen roads 4.42

Total 426.12

% of roads surfaced (BT + CC) 84.5%

Roads maintained by other agencies

National Highways 14.5

State Highways

Other Roads

Total 14.5

Total Length of Road 440.67

Source: Amb-M

CCP cum BP - Ambattur Municipality 25

4.6.2 Arterial road connectivity

As mentioned earlier, Ambattur is an important node on one of radial corridors converging at Chennai

along Avadi and Tiruvallur, However, the transportation infrastructure has not kept pace with the

growth of the town leading to fairly visible traffic snarls along the arterial roads.

The Chennai-Tiruvallur Highway (MTH Road or NH 205) is an important arterial road that passes

through Ambattur and strengthening and widening of the same is overdue. A new Chennai Bypass

between Maduravoyal and Madhavaram being developed under the NHDP would pass through

Ambattur IE.

The completed first phase of the Bypass connects NH 45 with NH 4. The second phase, under

construction, connects NH4 with NH5 and NH205 via Ambattur Industrial Estate. Further, the roads

within the industrial estate are being upgraded by the SPV formed for infrastructure development

within the SIDCO industrial estate. These road projects and Two Grade separator / flyover projects,

currently under implementation at the Padi junction and Wheels India junctions are expected to

substantially alleviate the traffic congestion problems within Amb-M.

Apart from the road connectivity, Ambattur falls on the Chennai Central Arakonam railway line.

Suburban trains daily operate from Chennai Central and Chennai Beach to Arakonam, Avadi and

Tiruttani via Ambattur. By rail, Ambattur is 30 minutes from Chennai Central, 20 mins from

Perambur and 10 minutes from Villivakkam. The Draft Second Master Plan proposes quadrupling the

railway line from Pattabiram to Tiruvallur and tripling the line up to Arakonam.

4.6.3 Bus terminus

There are 5 bus stands in the municipality. 2 bus stands are maintained by the municipality while 3 are

maintained by the Chennai Metropolitan Transport Corporation (MTC). The two bus stands

maintained by Amb-M are the Korattur Bus stand (2163 sq.m) and Ambattur OT ( 2132 sq.m) bus

stand. Three bus stands in Mogappair East, Mogappair West and Estate Bus stand are maintained by

MTC.

4.6.4 Strbeet Lights

Ambattur has a fairly good coverage of the roads with street lights. As of 2006, the town has a total of

18396 streetlights of which 19 % is high power tube lights. The town has 43 streetlights per kilometer

of road or an average spacing of 23 meters between lampposts. This coverage is lower than the

municipal norm of one street light every 30 m. Exhibit 4.13 provides details of provision of street

lights. Of the 52 wards, maintenance of streetlights in 17 wards (wards 1-17) have been privatised.

CCP cum BP - Ambattur Municipality 26

Exhibit 4.13 Street Lighting

Type All Wards Managed by

Nos % Amb-M Private

Tube lights 14894 80.96% 8635 6259

Sodium Vapor Lamps 3495 19.00% 2259 1236

Mercury Vapor Lamps 0

High Mast lamps 7 0.04% 7

Total 18396 100% 10901 7495

Average distance between street lights ~ 23 m

Street Lights per km ~ 43 lights

Source: Administrative report FY 2006

4.6.5 Issues and gaps

Specific issues and gaps with respect to roads and street lighting are summarized below:

1. Poor quality and congestion in arterial roads - Though nearly 95% of the road network is in

the surfaced category, a number of roads are in poor condition. The ongoing and planned

transportation infrastructure improvements need to be implemented on priority.

2. Lack of adequate organised parking facilities - Increase in the number of vehicles and

inadequate road networks are leading to traffic congestion. Further, given the high floating

population, there is a need to earmark dedicated parking lots and better traffic planning.

3. Encroachments along the roads - Informal activities along the road margins and illegal

encroachments of pedestrian areas and footpaths are the other causes for traffic congestion in the

town. Many shops along these roads have encroached the road / footpath which creates congestion

in the centre of the town.

4. Need for planning restoration post UGD scheme - With the plans to create an UGD scheme in

the city, the entire road network in the town would need to be restored. So it may be appropriate

to take up any large scale up gradation of the road network in a phased manner after completion

of the UGD scheme.

5. Energy efficiency in street lighting - Amb-M needs to accord priority to improve energy

efficiency and to reduce power costs incurred on street lighting.

4.7 Urban Services for poor

4.7.1 Slum details

A recent survey done in 2005 by Ambattur municipality indicates that there are 63 slums in Ambattur

with a total population of 161378. This is almost double the slum population of 86,692 as per the

2001. The rapid proliferation of slums in Ambattur municipality is a serious cause for concern. Ward

wise details of slums and slum population is provided in exhibit 4.14 below.

CCP cum BP - Ambattur Municipality 27

Exhibit 4.14 Ward wise slum population

35 wards out of the 52 wards in Ambattur have slums. Out of these, wards 3, 16 and 50 have more

than 10,000 people living in slums, while wards 29 and 36 have more than 9000 people. With a total

of 63 slums, the average population per slum works out to more than 2500.

4.7.2 Slum up gradation under BSUP

Amb-M has taken up a comprehensive proposal for up gradation of 12 slums at an outlay of Rs.

475.05 lakh. This project involves the following components:

Building 295 new houses at an outlay of Rs. 236 lakh

Developing and upgrading existing houses at an outlay of Rs. 47.6 lakh

Cement Concrete Roads at an outlay of Rs. 175 lakh

Street lights and sanitation at an outlay of Rs. 16 lakh

With the overall population of Ambattur estimated at 4.01 lakh in 2005, the slum population is

estimated to have gone up to nearly 40% of the population in Ambattur. Provision of urban

services for the poor and slum rehabilitation should be a critical component of Amb-M’s plans.

4.8 Markets and other assets

4.8.1 Markets

As per the vision plan of Amb-M, Amb-M is maintaining 3 markets at Padi, Korattur and Elango

Nagar. Of these markets, the market at Elango Nagar is not operational. Proposals have been prepared

for improvements to buildings, providing amenities to Public viz., Toilet and water supply facilities.

The approximate estimate cost work out to Rs.46.00 lakh for these 3 markets. As part of the Vision

Plan of the municipality prepared in 2005, Amb-M envisaged construction of a new market complex

at TVS colony, Elango nagar in a land are of 50,500 sq.ft with 72 shops. However, these proposals are

still in the concept stage.

0

4000

8000

12000

16000

1 3 5 7 9 11 13 15 17 19 21 23 25 27 29 31 33 35 37 39 41 43 45 47 49 51

Ward

CCP cum BP - Ambattur Municipality 28

4.8.2 Crematoria and burial grounds

There are 20 burial grounds and 1 crematorium within Ambattur municipality. A modern electric

crematorium was proposed to be developed in Officers Colony, as part of the Vision Plan prepared by

the municipality in 2005. In addition, Amb-M also envisaged phased development of its burial

grounds. An outlay of Rs. 170 lakh was envisaged in the Vision plan for these activities.

However, further to the announcement of support for Gasifier crematorium by GoTN, Amb-M is

implementing a Gasifier crematorium at an outlay of Rs. 65.35 lakh. Feasibility study for the same has

been completed and the works for the same is expected to be contracted out shortly. The crematorium

is likely to be located in the burial ground on Vanagaram road

4.8.3 Slaughter house

Amb-M is also envisaging development of a modern Slaughter house at an outlay of Rs. 20 lakh.

4.9 Social infrastructure

4.9.1 Schools

There are 19 schools maintained by Amb-M. Of this, 13 are elementary schools, while 9 are middle

schools. Exhibit 4.15 provides the details of schools and educational institutions within Amb-M.

Exhibit 4.15 Educational institutions

Type Nos.

Municipal Primary Schools 16

Middle Schools 3

Primary Schools 74

Middle schools 23

High Schools 21

Matriculation Schools 27

Noon Meal Centres 75

Colleges 4

ITI – Government 4

ITI – Private 2

TOTAL INSTITUTIONS 249

Source: Amb-M

CCP cum BP - Ambattur Municipality 29

4.9.2 Hospitals and medical facilities

Exhibit 4.16 provides the details of medical institutions maintained by Amb-M and other medical

institutions in Ambattur.

Exhibit 4.16 Medical institutions in Amb-M

Type Nos.

Government

ESI Dispensary 2

Municipal Dispensary 1

Maternity Centres 3

Health Post 5

20 Bed Operation Theatres 2

Private

Hospitals 3

Nursing Homes 26

Clinics 121

Source: Amb-M

4.10 Status of Vision Plan projects

Exhibit 4.17 provides a summary of the projects envisaged as part of the Vision Plan and the current

status of these projects.

Exhibit 4.17 Vision Plan projects and status

Segment Projects Outlay Total Remarks

Water Supply

Purchase of Tanker Lorries

10,000 litres capacity ( 4 Nos) 40

640

Not procured. Jointly managing with

CMWSSB supply

Providing Distribution mains

Works taken up by CMWSSB 400

Ambattur Eri scheme dropped as water

was found non-potable. New DPR for

comprehensive water supply scheme

being prepared by CMWSSB.

New Scheme proposed at

Ambattur Eri 200

Storm Drains 74.24 km of uncovered drains 300

300 Partly done.

SWM

Transfer Station 24

311 Not done yet.

Compost Yard 82

Vehicles 131

Container 73

IEC 1

UGD 19 wards 3,960

3,960 In progress

Hospitals

Building improvement - Padi,

Venkatapuram 3

21 Ongoing Borewell 3

Landscaping / Gardening 6 Nos 1

Providing Adequate lighting 6 1

CCP cum BP - Ambattur Municipality 30

Segment Projects Outlay Total Remarks

Nos

Furniture (Padi, Venkatapuram,

Varadarajapuram) 7

Medical equipment (Padi,

Venkatapuram,

Varadarajapuram, Korattur)

6

Bus terminus Koratur bus stand improvements 55

55 Partially done to be completed

Roads WBM to BT - 50.51 kms 562

562 Ongoing

Schools

New Additional Classroom 15

Works 56

100 Ongoing

Compound Wall 6 Works 12

Improvements of existing building

12 works 4

Pro Water Supply 4 works 2

Pro Toilet facilities 9 works 13

Purchase of Computers and

Furniture 12

Markets Elango Nagar 110

110 Yet to be started

Street Lights 4 high mast lights 20

35

High mast lights done and 200 Energy

saver lamps done 1000 Energy Saver 15

Toilets 12 Vambay toilets 48

48 Done

Parks 7 parks 70

70 Completed

Tree plantation 30000 saplings 10

10 Completed

Burial Grounds Electric crematorium 75

170

Not done yet. Gasifier and slaughter

house projects under progress

20 burial grounds 95 4 nos. being developed currently

TOTAL 6,391 6,391

Completed Partially done / under implementation Not taken up yet

Source: Discussion with municipal officials.

4.11 Service level indicators and demand assessment summary

Exhibit 4.18 below captures the status of core urban services of Ambattur Municipality in terms of

key indicators and summarises key issues and gaps in these areas. The table summarizes the baseline

situation in some critical performance indicators from the analysis presented above and highlights the

critical gaps in the core urban services namely, Water Supply, Sanitation, Roads, Street lighting and

Solid waste Management. In the next phase of the study, these gaps would be analysed in greater

detail to arrive the vision for urban services in Ambattur and to estimate the capital investments

required to address these gaps. Based on consultations, we would then define the Capital Investment

priorities for the town.

CCP cum BP - Ambattur Municipality 31

Exhibit 4.18 Core urban services - Ongoing initiatives, Baseline indicators and gaps

Sl. no Name of the Indicator Value Issues and Gaps

Water Supply:

CMWSSB currently preparing a DPR for comprehensive water supply in all wards in Ambattur town.

1 Daily Per Capita Supply (LPCD) 29 Current supply on a per capita basis is

significantly below municipal norms

Need for significant augmentation of water supply

at source, storage and distribution.

2 Storage Capacity / Daily Supply (%) 22%

3 Distribution Network / Road Length (%) 35%

4 Water connections / Assessed properties (%) 22%

Sanitation:

Ongoing UGD scheme in 19 wards. DPR for uncovered wards being prepared by CMWSSB for comprehensive sanitation and

sewerage program

5 Presence of UGD network (Yes / No) Partial Coverage of UG network inadequate

Storm water drainage coverage in just 31% of

roads

Public convenience network needs augmentation

in view of high floating population.

6 UG connections / assessed properties (%) 27%.

7 Household per Public convenience (nos.) 3506

8 Storm Drain Length / road network (%) 31%

Roads and Street Lights:

Flyovers under implementation and arterial road improvements planned.

9 BT roads / Total (%) 85% Poor condition of Arterial road. Improvements

envisaged in Chennai master plan needs to be

implemented on priority

Municipal roads would require comprehensive up

gradation following water supply and UGD

implementation.

10 Road length per Street Light (m) 23 m

Solid Waste Management:

Collection activity in 27 wards including industrial area privatized. Land procurement for scientific disposal for ultimate

population requirement under evaluation. Closure of dumping at Athipattu and conversion of the location into a transfer station

being examined.

11 Waste generation per capita (gms) 470 Need for a comprehensive program for SWM

Scope for greater private participation covering

end-to-end given the size and scope of the SWM

service requirement.

Composing, Source segregation and Door-to-

door collection needs implementation in a

phased manner.

12 Compost yard area (Acres per 10,000 population) 88%

13 Average vehicle trips n.a

14 Source Segregation and Composting (Yes/No) partial

CCP cum BP - Ambattur Municipality 32

5. Urban governance and management

5.1 Policy oversight and institutional framework – State level

The governance of urban local bodies assumes importance with the adoption of 74th Constitutional

Amendment Act. The Act proposes mandatory elections and greater devolution of functions to the

urban local bodies including Town Corporations. The enactment of the 74th CAA provides an entirely

new framework for the governance of the Urban Local Body. The Act provides for mandatory

elections and a substantially larger devolution of functions to the ULBs, including several new areas

hitherto not under their control. The Tamil Nadu District Municipalities Act (1920) governs the

management of Municipality and Town Panchayats of Tamil Nadu. An amendment to the

Municipalities Act (1920) was made in 2003 to provide impetus for environment improvement

through Rain Water Harvesting.

The Urban sector in Tamil Nadu comes under the oversight of the Department of Municipal

Administration and Water Supply, Government of Tamil Nadu (MAWS). The institutional structure

for the urban sector is presented in Exhibit 2.3 below:

Exhibit 5.1 Urban sector - Institutional framework - State Level

Source: Policy notes, MAWS, Government of Tamil Nadu, IMaCS analysis.

The department of Municipal Administration and Water Supply administers Urban Local Bodies and

also implements development programs for the Urban Local Bodies in the State. The department is

also responsible for planning and implementing water supply and under ground sewerage schemes in

both rural and urban areas in the State.

Government of Tamil Nadu (GoTN)

Department of Municipal Administration and Water Supply (MAWS)

Commissioner of Municipal

Administration (CMA)

Parastatal

agencies

• Tamil Nadu Water and

Drainage Board (TWAD)

• Chennai Metro water Supply

and Sewerage Board

(CMWSSB)

Chennai

Corporation

• 5 Corporations and 152

municipalities under CMA

• 561 Town Panchayats

under DTP

Directorate of Town

Panchayats (DTP)

Financing

Intermediaries

• TNUIFSL / TNUDF

• Tamil Nadu Urban

Finance and Infrastructure

Development Corporation

(TUFIDCO)

CCP cum BP - Ambattur Municipality 33

5.1.1 Municipal Administration

The institutional framework for municipal administration is described below:

Corporations and Municipalities - There are 6 Municipal Corporations, namely, Chennai,

Madurai, Coimbatore, Tiruchirappalli, Salem and Tirunelveli in the State of Tamilnadu. Five

Corporations (except Chennai) and 152 Municipalities including 49 Third Grade

Municipalities are under the oversight of the Commissioner of Municipal Administration.

Recently GoTN has initiated steps to upgrade Erode and Tiruppur municipalities as

Corporations.

Town Panchayats - The Town Panchayats are governed by the Tamil Nadu District

Municipalities Act, 1920. 1920. There are 561 Town Panchayats in the State. Towns have

become drivers of economic growth and offer opportunities for social and economic

development of people. The population of the Town Panchayats is 76,46,386, which

accounts for 12% of the total population of the State as per Census 2001. Town Panchayats

have become service centres drawing huge floating population from adjoining rural areas.

The Directorate of Town Panchayats was created in1981, to look after the affairs of the

Town Panchayats. The Director of Town Panchayats is the Head of the Department and

looks after the affairs of 561 Town Panchayats. The District Collector is the controlling

authority for the Town Panchayats at the District level. Under the Directorate, the

Department has 16 Zonal offices, headed by Assistant Directors of Town Panchayats.

5.1.2 Parastatal agencies

Tamil Nadu Water and Drainage Board - TWAD is a statutory body formed by the

Government of Tamil Nadu, vested with the twin task of providing water supply and

sewerage facilities to the entire state of Tamil Nadu except Chennai Metropolitan Area.

TWAD came into existence on 14-4-1971.

Chennai Metropolitan Water Supply and Sewerage Board - The Board is attending to

the growing needs of and for planned development and appropriate regulation of Water

Supply and Sewerage Services in the Chennai Metropolitan Area with particular reference to

the protection of Public Health and for all matters connected therewith or incidental thereto.

The Board was established under "The CMWSSB Act. 1978' (Act No.28 of 1978) and

commenced functioning from 01.08.1978

5.1.3 Financial Intermediaries

TNUIFSL / TNUDF - The Government of Tamil Nadu established the Tamil Nadu Urban

Development Fund (TNUDF) on a ‘Public-Private Partnership’ mode, with the participation

of ICICI, Housing Development Finance Corporation (HDFC) and Infrastructure Leasing &

Financial Services (IL&FS). The Fund is managed by Tamil Nadu Urban Infrastructure

Financial Services Limited. TNUDF provides various services including project advisory,

financial advisory and consultancy services to various ULBs through its fund manager, viz.

Tamil Nadu Urban Infrastructure Financial Services Limited (TNUIFSL).

CCP cum BP - Ambattur Municipality 34

TUFIDCO - TUFIDCO, a State owned Organization, was incorporated to extend financial

assistance to urban infrastructure schemes in Tamil Nadu. The State Government have also

appointed TUFIDCO as a State level nodal agency for the following centrally sponsored

schemes including Jawaharlal Nehru Urban Renewal Mission (JNNURM) and Urban

Infrastructure Development Scheme for Small and Medium Towns (UIDSSMT)

5.2 Governance structure of Ambattur municipality

Ambattur municipality has two wings, namely, a political wing and an administrative wing. While the

Municipal Council, headed by a Chairperson and constituting ward level council members constitutes

the Political wing and is directly elected by the people, the Executive wing is headed by the

Commissioner and consists of various operational departments.

5.2.1 Political wing

The municipal council with a 52 elected councilors, each representing a ward, forms the political wing

of the municipality. One of the elected representatives is selected by the council as the Chairperson.

Three committees viz., appointment committee, contract committee, tax appeal committee have been

formed consisting of elected representatives and commissioner as members.

Appointment Committee

The committee is responsible for all appointments in the municipality. It consists of three members

including the Chairman and the Commissioner.

Contract Committee

The three member contract committee is responsible for approval of all contracts costing up to

Rs.5000. Works above Rs.5000 is approved by the municipal council through a sealed tender.

Tax Appeal Committee

This committee addresses appeals filed by the public against orders on revision of taxes. The

committee consists of six members comprising of the commissioner, chairman and four councilors.

5.2.2 Administrative Wing

The administrative wing is responsible for the day-to-day functioning of the corporation and assists

the deliberative wing in the decision-making process. The Municipal Commissioner heads the

executive wing of the ULB, and various officers in charge of different departments or sections assist

the Commissioner in managing the ULB. Apart from its own employees, the ULB also employs daily

wage basis workers or contractual workers for services such as street lighting, and sanitation and

water supply. These include electricians, watchmen, water boys, drivers, valve operators etc. Certain

jobs like sanitary works and garbage clearance are done through contracts, where the usual procedure

followed is selection through tenders.

CCP cum BP - Ambattur Municipality 35

The Municipal Commissioner heads the administrative wing of the municipality. The functions of

the administrative wing include:

All executive functions with the Administrative Head (Commissioner)

Establishment matters such as appointment, transfers, Pay and allowances, etc.,

correspondence with Government and other departments,

Public relations, redressal of public grievances, Legal matters etc.

Sanctioning of estimates and approval of contracts, payments, etc.

5.2.3 Departments of municipality

Various departments under the ULB, share the responsibility of service delivery within the

Corporation. The functions of various officials/departments, under the Administrative wing, are

elucidated hereunder:

a) Commissioner. The Commissioner is at the apex of this structure and is responsible for all

activities carried out by the ULB. The Commissioner is responsible for preparation and

certification of all periodical records, returns and furnishes all information as may from time to

time be required by the Municipal Council or the Standing committees. He is also responsible for

preparation of accounts. At each general meeting, the Commissioner along with some other key

officials, discuss various issues with the elected representatives.

b) General Administration Department. - This department is responsible for establishment, other

essential matters relating to office, officers, staff and their welfare like preparation of staff pay

bills, maintenance of registers for advances, GPF, pension, PF’s etc.

c) Engineering and Water Supply Department. This department looks after all the works relating to

execution and maintenance of basic amenities like Water Supply, Drainage, Sewerage, Storm

water drains, Roads, Street lights, etc. The Engineering department is also responsible for

ensuring the quality of works and their execution within the time frame.

d) Accounts Department : The Accounts Section is responsible for supervising all financial

transactions related to the CMC, advising the Commissioner on all internal financial matters,

updating financial receipts and expenditure details in accordance with the utilization of funds,

reporting deviations in expenditure of funds in any of the allocated schemes, assisting preparation

of the CMC budget, maintenance of accounts regarding stamp duty, SFC Grants, MP Grants,

maintenance of petty cash book and general cash book and attending to audit requirements and

other such accounts-related duties.

e) Revenue Department: Revenue Officer, heading the Revenue Section, is responsible for collecting

taxes such as, trade tax, house tax, advertisement tax, and entertainment tax; development

charges; transfer of properties; collection of duty; issuing notices for recovery of tax; and

monitoring revenue collections of the ULB.

f) Public Health Department. The is responsible for ULB services such as Solid waste management,

public health related works like malaria control, family planning, mother and child health care,

birth and death registration etc, and other government assisted programs related to health and

poverty reduction and awareness programs. Besides, this department is responsible for the

enforcement of the Public Health Act. The department is also involved in promotion of health

CCP cum BP - Ambattur Municipality 36

awareness programs and implements various State and Central assisted schemes like pulse polio

project, SJSRY etc.

g) Town Planning Department. The major function of this department is issue of building license,

preparation and implementation of development plans and eviction of encroachments, urban

planning and building regulation.

5.3 Manpower position

Exhibit 5.2 provides the manpower position vis-à-vis sanctioned posts as of October 2007.

Exhibit 5.2 Manpower status (as of October 2007)

No. of posts

sanctioned

Staff in position Posts vacant Perma-

nent Consoli-

dated Pay NMRs

A General Administration

1 Commissioner 1 1 -

2 PA to Commissioner 1 1 -

3 Manager 1 1 -

4 Assistant 4 4 -

5 Junior Assistant 19 19 -

6 Typist 3 3 -

7 Record clerk 2 2 -

8 Office Assistant 4 4 -

9 Asst. Programmer 1 1 -

10 Data Entry Operator 1 1 -

11 Night watchman 1 1 -

B Accounts Department -

1 Accountant 1 1 -

C Revenue Section -

1 Revenue Officer 1 1 -

2 Asst. Revenue Officer 2 2 -

3 Revenue Inspectors 4 4 -

4 Bill Collectors 21 21 -

D Engineering Wing -

1 Municipal Engineer (E.E.) 1 1 -

2 Asst. Executive Engineer 2 2 -

3 Assistant Engineer 4 4 -

4 Overseer 1 1 -

5 Work Inspector 4 4 -

E Street Lighting -

1 Wireman 10 10 -

2 Helper 22 22 -

F Water Supply -

1 Electrician Gr-II 1 1 -

2 Switch Board Operator 3 3 -

3 Fitters 1 1 -

4 Pump room attender 4 4 -

5 Driver 11 11 -

6 Cleaner -

7 NMR 6 6 -

G Public Health -

CCP cum BP - Ambattur Municipality 37

No. of posts

sanctioned

Staff in position Posts vacant 1 Health Officer 1 1 -

2 Sanitary Inspector 9 9 -

3 Supervisor 15 15 -

4 Conservancy staff 580 580 -

5 Drivers 15 15 -

6 Cleaner 6 6 -

H MEDICAL SERVICE & IPPV -

1 Medical Officer 7 7 -

2 Staff nurse 6 6 -

3 Pharmacist 1 1 -

4 Mat. Assistant 5 5 -

5 Mat. Ayah 6 6 -

6 Health Visitor 6 6 -

7 Computer cum clerk 5 5 -

8 M.P.H. Worker 20 20 -

9 Female Attendant 5 5 -

10 Watchman 2 2 -

11 Ward attender 1 1.00

12 Theatre attender 1 1.00

I Town Planning -

1 Town Planning Officer 1 1 -

2 Town Planning Inspector 3 3 -

5 Chainman 4 4 -

J Parks & Gardens -

1 Gardener 1 1 -

2 Gang Mazdoor 4 4 -

K Other Staff -

1 Community Organiser (NM) 20 20 -

2 Community Ayah(NM) 20 20 -

3 Cook 20 20 -

4 Assistant 20 20 -

TOTAL 921 913 0 6 2

Source: Amb-M

As seen from the table, Amb-M however, appears well placed in terms of availability of staff vis-à-vis

the sanctioned manpower.

5.4 Role of other agencies

The State Government’s line departments continue to play a crucial role in urban basic service

delivery. Sectors and agency involvement include:

a) Water Supply & Sewerage. CMWSSB is responsible for creation of water and sewerage

infrastructure in ChMA. It is managing water supply network in 11 wards within Amb-M and is

in the process of preparing a DPR for water supply and sanitation covering the entire town.

b) Master Plan. Chennai Metropolitan Development Authority (CMDA) prepares the Master Plan

and Comprehensive Development Plan (CDP) for the city/town, and the mandate of implementing

the Master Plan lies with the ULB.

CCP cum BP - Ambattur Municipality 38

c) Roads and Highways. Department of Highways, Government of Tamil Nadu maintains the

National, State Highways and select arterial roads that pass through the city. Municipal roads are

however created and maintained by the ULB.

d) Environmental Protection. The Tamil Nadu Pollution Control Board (TNPCB) is responsible for

environmental protection and enforcement of rulings related to the same.

e) Slum Upgradation. The Tamil Nadu Slum Clearance Board (TNSCB) develops improvement

schemes for notified/regularized slum settlements in the city/town.

5.5 Reforms undertaken by Ambattur municipality

5.5.1 Accrual accounting

Fund based accrual accounting has been implemented in the urban local bodies in Tamil Nadu under

TNUDP-II and Ambattur municipality has also been following the system for the last 4-5 years.

5.5.2 E-Governance

E-Governance of Ambattur Municipality is aimed to provide online citizen services and information

to all hierarchies and monitoring performance of Municipality. All Municipal records are

computerised and information stored in a central server and connected to an uplink which online on

the internet. Property tax, Water Charges, Nontax, Profession Tax and trader license fees and Birth

and Death certificate may be obtained from the computerized civic center at the municipal premises.

Through the e-governance program, Ambattur Municipality hopes to provide easy access to the

municipality and municipal records to its citizens.

5.5.3 Citizen's Charter

As per the directions of the Government of Tamil Nadu, the Ambattur Municipality has published its

‘Citizen’s Charter’ during 1998 to bring ULBs function closer to the people. The main focus of this

charter is to introduce transparency, responsibility and user friendliness in its service provision and

maintenance. Its basic objectives were to:

Provide fast and quality service to the citizens.

Inform the public about time limits to address the problems, and

Provide transparency in administration.

This publication of citizen's charter brings people and administration closer and to let people know

how much time is required to get works done. If the work is not attended to even after stipulated

time, they can approach the Commissioner/ Chairperson. Thus, people’s rights are made known to

them. This also reduces time on the part of public, as they need not follow the movement of their

applications at the municipal office. Further, through this charter, they also create awareness about

sanitation, town improvement, tax payment and the like. Based on the time frame given for

understanding / compliance, various works/ activities can be evaluated either by citizens or by Amb-

M, paving the way for improving performance. Specific interventions in human resource development

and systems dealt with in the section 9 - Reform agenda subsequently in the report.

CCP cum BP - Ambattur Municipality 39

6. Analysis of financials

This section provides a summary analysis of the financial performance of Ambattur Municipality.

6.1 Income and Expenditure summary of Ambattur Municipality

Exhibit 6.1 provides a summary of the income and expenditure of Ambattur Municipality. This

summary has been prepared based on information provided by Ambattur Municipality covering

audited accounts for FY 2003 to 2005 and unaudited accounts for 2006.

Exhibit 6.1 Consolidated Income and Expenditure trend

2002-03 2003-04 2004-05 2005-06 CAGR%

INCOME (Rs in lacks)

OWN INCOME 1393 1516 1888 2038 14%

Property tax 886 956 1096 1030 5%

Profession tax 143 167 224 271 24%

Water & Sewerage Charges 104 101 118 106 1%

Other Service Charges & Fees 60 74 105 96 17%

Other Income 200 218 346 536 39%

ASSIGNED REVENUE 618 1281 1343 598 -1%

DEVOLUTION FUND 506 712 512 534 2%

GRANTS & CONTRIBUTIONS 67 - - - -100%

PRIOR PERIOD INCOME 56 54 233 144 37%

TOTAL 2640 3563 3976 3314 8%

EXPENDITURE ( Rs in lacks )

Salaries 503 504 499 504 0%

Operating Expenses 376 411 569 577 15%

Program Expenses 0 56 294 329

Administrative Expenses 39 59 80 42 3%

Finance Expenses 173 181 244 174 0%

Depreciation 1304 1241 527 1192 -3%

Prior Period Expenses 19 1 39 6 -32%

TOTAL 1110 1212 1724 1632 14%

SURPLUS - (Excl.Depr) 1529 2351 2252 1682 3%

Operational Ratio (All are in percentage)

TE / TR incl Depreciation 91% 69% 57% 85% 76%

TE / TR excl. Depreciation 42% 34% 43% 49% 42%

Debt servicing (Rs in lacks)

Loan repayments - Interest 96.54 94.35 71.20 52.43 314.52

Loan repayments - Principal 70.10 195.17 87.76 88.47 441.51

DS / TR 6% 8% 4% 4% 6%

Source: Amb-M, IMaCS analysis

Income growth (CAGR of 8%) has lagged expenditure (CAGR of 14%). The municipality has

observed a positive cash balance and overall surplus over past four years. Annexure V provides the

consolidated Income Expenditure statement, Balance Sheet for 2002-06 and DCB statements for

2002-2007.

CCP cum BP - Ambattur Municipality 40

6.2 Revenue streams of ULB in Tamil Nadu

Revenue of ULBs in Tamil Nadu can be categorised along three areas:

Own Revenue - comprising taxes (property tax and professional tax), user charges (water,

sewerage, solid waste etc.) and other non-tax income (lease and rents, sale & hire charges etc)

Assigned Revenue - Income generated revenues shared with the ULB

Grants and Contributions - Grants and transfers made by GoTN

Exhibit 6.2 provides a detailed classification of the revenue streams.

Exhibit 6.2 Revenue streams - ULBs in Tamil Nadu

Exhibit 6.3 provides details of revenue of Ambattur Municipality along various heads between FY

2003 and FY 2006. These are based on information provided by Ambattur Municipality.

ULB-Income

Assigned

Revenue

Entertainment

Tax

Stamp Duty

Own Income

Non- Tax Income

Other Charges

Other Income

Water Charges

Tax Income

Other Taxes

Profession Tax

Property Tax

Transfer from

Govt

Devolution Fund

Grants and

Contribution

CCP cum BP - Ambattur Municipality 41

Property & Professional taxes

0

500

1000

1500

2002-03 2003-04 2004-05 2005-06

Rs.

Lak

h

0%

10%

20%

30%

40%

perc

enta

ge

Prop TaxProf. TaxProperty tax%of Total IncomeProfession tax % of Total Income

Exhibit 6.3 Analysis of Revenues of Ambattur Municipality

6.2.1 Tax Income

Tax income has grown at a CAGR of 7 % over the

last four years aided by a 19% growth in

Professional tax. Property Tax has grown at 5 %

during this period. As a result, while share of

property tax in overall revenue has declined from

34% to 31% of income, share of professional tax in

revenue has increased from 5% to 7%.

6.2.2 Property Tax

Property tax alone accounted for almost a third of income of Ambattur Municipality in FY 2006 and

is an important contributor of revenues to Ambattur Municipality. Following are the key issues /

observations with respect to property tax. Exhibit 6.4 provides a summary.

Exhibit 6.4 Property tax - analysis of key revenue drivers

Year Collection Efficiency Properties Growth

Rate Of properties

Growth Rate of Current Demand Arrears Current Total Numbers Tax/property

2002-03 26% 54% 38% 65569 1447 NA NA

2003-04 24% 58% 39% 68206 1507 4% 8%

2004-05 19% 55% 35% 73286 1599 7% 14%

2005-06 29% 59% 41% 78675 1505 7% 1%

2006-07 29% 64% 44% 79365 1578 1% 6%

Source: Amb-M

CCP cum BP - Ambattur Municipality 42

a) Decline in share of property tax - Even though the property tax has increased in absolute

terms, its share in total income has declined from 34% to 31 % over the last four years.

b) Demand per assessment - There has been an overall increase of 5.7% in the number of

assessments and the average demand per property assessed has shown a 5.1% increase.

During FY 2003 to FY 2005, the average demand per property assessed has increased from

Rs. 1477 per property to Rs 1600 per property. Last revision of property tax was undertaken

in October 1998. Quinquennial revision due in 2003 has not been undertaken yet.

c) Low collection efficiencies - Collection efficiency is a cause for concern. While collection

efficiency in current demand has grown from 54% to 59% (which itself is very low), recovery

of arrears is even low. In FY 2005, arrears collection efficiency dipped to 19%.

d) Aging of arrears - 18% of the arrears are outstanding for more than five years. Ambattur

Municipality may need to review the arrears, as some of these may not be collectable and

would require provisioning.

e) Break-up of assesses - Residential segment contributes more than 76% of the total

assessments and about 51% of the total property tax demand. Exhibit 6.5 below gives the

detailed break-up of assesses for property tax.

Exhibit 6.5 Property Tax - breakup of assessees (2005)

Category of Property Number of

Assessments

% Annual Tax

Demand (Rs. lakh)

%

Residential 55978 76.4 553.56 50.7

Commercial 14437 19.7 215.44 19.7

Industrial 2864 3.9 320.35 29.4

State Government Properties 7 0.01 2.06 0.2

Total 73286 100% 1091.41 100%

6.2.3 Professional tax

Exhibit 6.6 provides an analysis of key drivers for professional tax revenue.

Exhibit 6.6 Professional Tax - revenue drivers

Year Collection Efficiency Assesses Growth rate of

Assesses

Growth Rate of Current Demand

Arrears Current Total Numbers Tax

demand/assessee

2002-03 11% 64% 37% 15712 910 NA NA

2003-04 22% 69% 46% 17510 954 11% 17%

2004-05 20% 75% 50% 17970 1247 3% 34%

2005-06 22% 82% 55% 17450 1387 -3% 8%

2006-07 18% 75% 49% 17646 1410 1% 3%

Source: Amb-M

CCP cum BP - Ambattur Municipality 43

User / Service Charges

0

50

100

150

2002-03 2003-04 2004-05 2005-06

Rs.

Lak

h

0%

1%

2%

3%

4%

5%

pe

rce

nta

ge

Water & Sewerage ChargesOther Service Charges and FeesWater & Sewerage charge%of Total IncomeOther Service Charges and Fees % of Total Income

a) Share of professional tax in total income has increased from 5% to 7% of total income

b) Demand per assessment has increased from Rs 910 in FY2003 to Rs 1244 in FY2005.

c) Collection efficiency was 55% in FY 2006, aided by improvement in current collection.

While current collections are high at around 82%, there is still a scope for improvement. An

ageing analysis reveals that nearly 27% of arrears are more than 5 years old.

d) Composition of professional tax assessments - Exhibit 6.7 below shows the composition of

assessments. Only about 1.7% of the traders file returns and hence Ambattur Municipality

should take steps to widen its tax base through a closer scrutiny of traders.

Exhibit 6.7 Professional Tax – assessee break up (2005)

Category Number of

Assessments

% Return

filed

Assessment

Gap

Annual Tax demand

(Rs in Lakh)

%

State/Central/Quasi Govt.

Employees

8455 47% 8455 0 31.70 10%

Traders 4805 27% 80 4725 115.39 36%

Self-employed professionals 1710 10% 1710 0 27.69 9%

Private employers/ Companies 1500 8% 500 1000 138.30 43%

Private employees 1500 8% 1500 0 10.45 3%

Total 17970 100% 12245 5725 323.53 100%

6.2.4 User Charges / Fees

User charges have also grown by 2%, aided by

marginal increase in collection of water charges

and other fee income including lease and rents.

Share of other service charges and fees in total

income has declined from 6% in FY2003 to 5%

in FY2006. Share of water charges has remained

constant at around 1% of total income across the

period. As a result the share of total user

charges/fees has declined from 7% of revenue to

6% of revenue over the last four years.

6.2.5 Water charges

Exhibit 6.8 provides an analysis of key drivers for water charges.

CCP cum BP - Ambattur Municipality 44

Assigned Revenue

0

500

1000

1500

2002-032003-042004-052005-06

Rs.

Lak

h

0%

10%

20%

30%

40%

pe

rce

nta

ge

Assign Revenue

Assigned Revenue%of Total Income

Devolution fund

0

200

400

600

800

2002-03 2003-04 2004-05 2005-06

Rs.

Lak

h

0%

10%

20%

30%

pe

rce

nta

ge

Devolution fund

Devalution fund %of Total Income

Exhibit 6.8 Water charges - revenue drivers

Year Collection Efficiency Connections Growth rate of

Connections

Growth Rate of Current Demand

Arrears Current Total Numbers water charges per assessee

2002-03 18% 15% 17% 2290 785 NA NA

2003-04 16% 20% 17% 2351 785 3% 3%

2004-05 7% 11% 8% 2374 783 1% 1%

2005-06 13% 24% 16% 2373 784 0% 0%

2006-07 12% 22% 14% 2373 784 0% 0%

Source: Amb-M

a) No. of connections - There has been a marginal increase in number of connections from 2290

in FY2003 to 2373 in FY2006. None of the water connections are metered. There are 2371

residential unmetered connections. Thus, there exist a lot of scope for the municipality to

increase its revenue by converting unmetered connections to metered connections.

b) Water tariff / connection has remained constant at around Rs 785 over period from FY2003

to FY2005.

c) Collection efficiency - Current collection efficiencies have ranged from a low of 11% (FY

2005) to a high of only 24% (FY 2006). Arrears collection efficiency has also been very low

and has ranged between 7% and 18%. The overall collection efficiency of 16% is quite low

and needs significant improvement. This improvement cannot be achieved until the

municipality converts its water connections into metered connections.

6.2.6 Assigned Revenue

Assigned Revenue (which includes transfers of stamp duty

and entertainment tax) increased from Rs 618 lakh in

FY2003 to Rs 1343 lakh in FY2005 and then declined to

nearly Rs 600 lakh in FY2006. Share of assigned revenue

in total income declined from 23% of revenue in FY 2003

to 18% of revenue in FY 2006.

6.2.7 Devolution Fund

Devolution fund increased marginally from slightly more

than Rs 500 lakh in FY2003 to nearly Rs 535 lakh in

FY2006. Share of this fund in total revenue of the

municipality has declined from 19% to 16% in respective

years.

CCP cum BP - Ambattur Municipality 45

Ot her Income

0

100

200

300

400

500

600

2002-03 2003-04 2004-05 2005-06

Rs.

Lak

h

0%

5%

10%

15%

20%

pe

rce

nta

ge

Other Income Other income %of Total Income

Salary & wages

496

498

500

502

504

506

2002-03 2003-04 2004-05 2005-06

Rs.

La

kh

0%

5%

10%

15%

20%

pe

rce

nta

ge

Salary &Wages Salary & Wages %of Total Income

6.2.8 Other Income

Other Income, which includes sale and hire charges, has

increased from Rs 190 lakh in FY2003 to slightly above Rs

580 lakh in FY2006. Its share in total income of the

municipality has more than doubled from nearly 7% in FY2003 to

around 18% in FY2006.

6.3 Analysis of Costs

Exhibit 6.9 provides details of costs of Ambattur Municipality along various heads between FY2003

and FY2006. Total expenditure has shown an upward trend, except for a dip in FY2005. This decline

in total expenditure in FY2005 is due to decline in depreciation by more than half. Operating

expenditure has shown a steady upward trend over the period.

Exhibit 6.9 Costs (as a % of income) – FY 2003 and FY 2006

6.3.1 Salary and wages

While salary and wages account for almost a fifth

of total expenditure incurred by the municipality,

it has fluctuated marginally around Rs 500 lakh

over this period.

CCP cum BP - Ambattur Municipality 46

6.3.2 Operations and Maintenance

Repairs and maintenance form the other major component of total expenditure. In absolute terms,

repairs and maintenance expenditure has increased steadily over the last four years, growing from Rs

375 lakh in FY2003 to Rs 575 lakh in FY2006. Its share in total expenditure has increased from 16%

to 20% in FY2003 and FY2006, respectively. Exhibit 6.10 provides details of sector wise

composition. Though streetlights form the major proportion of operating expenses, there has been a

downward trend in expenditure between FY 2003 to FY 2006. Expenditure on water and sewerage

has increased marginally by 1% over past four years. Overall repairs and maintenance has grown at a

CAGR of more than 15% over the period.

Exhibit 6.10 Repair and maintenance expenditure - Sector wise break up

Item FY2002 % FY2003 % FY2004 % FY2005 %

Roads 60.63 16% 58.95 14% 90.70 16% 86.75 15%

Water & Sewerage 109.56 29% 153.99 37% 226.75 40% 246.79 43%

Street Lights 159.28 42% 154.63 38% 203.92 36% 189.80 33%

Others 46.35 12% 43.34 11% 47.29 8% 53.75 9%

Total 375.83 100% 410.91 100% 568.67 100% 577.09 100%

6.3.3 Power costs

Exhibit 6.11 gives the details of power costs out of the total repair and maintenance expenditure

relating to Water & Sewerage and Street lights. Power costs have grown at a CAGR of 10%.

Exhibit 6.11 Power costs - Water & Sewerage and Street Lights (Rs in Lakh)

Item FY2002 % FY2003 % FY2004 % FY2005 %

Water 7 100% 33 100% 161 100% 110 100%

Power 0 0% 0 0% 0 0% 0 0%

Non Power 6.74 100% 32.83 100% 161.11 100% 109.96 100%

Street Lights 159 100% 155 100% 204 100% 190 100%

Power 118 74% 128 83% 134 66% 154 81%

Non Power 40.93 26% 26.30 17% 70.27 34% 35.53 19%

Total 166 187 365 300

Power costs account for nearly 80% of repair & maintenance costs of operating streetlights.

6.4 Trends in Capital Expenditure

Exhibit 6.12 gives details of capital expenditure by Ambattur Municipality over the last five years.

CCP cum BP - Ambattur Municipality 47

Exhibit 6.12 Capital Expenditure (Rs in Lakh) - Last five years

6.5 Loans and Finance charges

Exhibit 6.13 gives the details of outstanding loans of Ambattur Municipality at the end of year 2006.

Exhibit 6.13 Loan Statement (Rs in Lakh)

Lending Agency Outstanding Balance Years

Instalment

(Rs in lakh)

Rate of Interest (%)

Year of drawal

Repayment period

WSPF (TNUDF) 53.85 9 6 9% 2000 15

TUFIDCO 66.26 3.5 19 9% 2000 9.5

TUFIDCO (99-67c) 202.25 8.5 24 5% 2000 14.5

TUFIDCO (Own fund) 224.17 10 22 13% 2001 15

TUFIDO (take over finance) 102.16 4 26 9% 2003 7

TUFIDCO 528.57 4 132 9% 2000 10

TNUDF 115 4 29 9% 2000 10

TOTAL 1292

Source: Amb-M

Sector

Actuals

2000-01 2001-02 2002-03 2003-04 2004-05

Roads 236.28 407.53 145.34 207.89 222.26

Storm water drains 40.00 10.47 25.18 33.03 154.48

Water supply 22.20 75.50 55.04 91.55 221.05

Total 298.48 493.50 225.56 332.47 597.79

CCP cum BP - Ambattur Municipality 48

7. Vision & Strategic plan, CIP and Asset Management plan

This section articulates a strategic plan for urban development in Ambattur town and crystallizes the Capital

Investment Plan (CIP) for urban infrastructure needs of the town in the short term (5 years) and long term (20

years). The strategic plan and CIP follow from an analysis and articulation of the potential themes for economic

development for the town, a SWOT analysis of the current status of the town and the expectations elucidated by

stakeholders of the town namely, elected municipal council representatives and public stakeholders during our

consultations with them.

7.1 Potential themes for economic development

The key economic development themes for Ambattur town are articulated below:

7.1.1 Invest in industrial infrastructure to reinforce Ambattur’s position as a

premier industrial hub

The Ambattur Industrial Estate is one of the largest industrial areas in Asia and employs nearly 1 lakh

employees. The maintenance of infrastructure services within the Ambattur Industrial Estate has been

entrusted to a Special Purpose Vehicle called the ‘Chennai Auto Ancillary Industrial Infrastructure Up

gradation Company (CAAIIUC)’. CAAUIUC has been formed to improve infrastructure facilities in

the Ambattur Industrial estate. Ambattur municipality only provides Solid Waste management

services in the Industrial estate. Other infrastructure services have been entrusted to CAAIIUC.

The areas identified for improvement as part of this initiative5 include roads, common facilities, flood

management and storm drains, water supply, sewage treatment, street lighting, Logistics services,

public amenities and landscaping. There is a need for expediting the project in view of poor

infrastructure conditions that continue to plague this estate. In particular, a truck terminal and a multi-

level car park are required given the transportation requirements emerging from the industrial area.

7.1.2 Guide the ongoing services/IT developments in a planned manner

In spite of being a largely manufacturing oriented industrial estate, there is a s significant presence of

IT and ITES industries in Ambattur. A number of leading players including HCL and Perot systems

already have presence in Ambattur and this trend of IT-ITES companies setting up base in Ambattur

is expected to intensify. In this regard, there is a need to review the master plan for the town and the

land use to support this likely trend to facilitate an orderly development of the industry in Ambattur.

7.1.3 Address glaring gaps in physical infrastructure on priority

In spite of being a large growing city with a population of nearly 0.4 million, there are serious gaps in

urban service provisioning in Ambattur, which is likely to constrain growth of the town in an orderly

manner. Water supply and sanitation are almost non-existent while arterial roads continue to be

5 www.caauiic.com

CCP cum BP - Ambattur Municipality 49

congested. While ongoing and proposed projects on the arterial roads could lead to easing of

congestion, the town’s water supply and sanitation problems are more acute. In particular, the delay

ongoing UGD scheme in 19 wards has caused severe inconvenience among the local public and has

severely dented the credibility of the municipality among public stakeholders as evident from our

consultations. Therefore water supply and sanitation infrastructure needs to be addressed on a fast-

track basis. We understand that Chennai Metro Water Supply and Sewerage Board (CMWSSB) has

completed the DPR for underground sewage systems for the uncovered areas and is preparing a DPR

for comprehensive water supply for Ambattur.

Similarly while ongoing arterial road projects including flyovers and bypass road being developed by

NHAI are expected to relieve congestion from the current levels, there is a need to address further

traffic and transportation improvements covering linkages to the bypass roads, new road formation

along MTH road/railway stations and other junction improvements in the city (some specific

interventions are addressed in subsequent sections).

7.1.4 Plan investments in social infrastructure in line with the population growth

The potentially explosive growth in the population would require a combination of

private/Government investments to address future requirements in education and health infrastructure.

A Government High School and Government Hospital figured high on the list of felt needs in our

interactions with both the Council and the public stakeholders. GoTN through CMDA and Amb-M

should immediately map land-use to identify and ring-fence public land (including a specific strategy

for minimising slum proliferation and removal of encroachments from public spaces) for this purpose.

Public stakeholders in particular cited the need to utilise the land available in Century Nagar in

Athipattu area for specific social asset development such as a) Engineering or Medical College, b)

Integrated Sports complex, c) Modern Government Hospital for the region or d) Government Boys

high school. Restoration of water bodies (particularly Ambattur and Korattur eris) and provision of

parks/jogging tracks around decaying and polluted water bodies figured high in the list of felt needs.

7.1.5 Plan for world-class connectivity between Ambattur and Chennai and the

growth centres of Sriperumbudur and Tiruvallur

Ambattur is strategically located between Chennai and the rapidly urbanizing regions of

Sriperumbudur and Maraimalainagar. Consultations as well as evidence on the ground point to

significant growth in both residential settlements and industrial developments along the Ambattur-

Avadi-Tiruvallur corridor and the Ambattur-Poonamallee-Sriperumbudur corridors. This is also

expected to get accelerated with the completion of the bypass sections connecting National Highway

corridors (Bypass-Phase I is already completed and Phase II is under progress). Completion of the

proposed and ongoing road connectivity projects and strengthening and widening of MTH road (NH

205) are clearly important priorities in this direction.

CCP cum BP - Ambattur Municipality 50

In terms of railway connectivity, Ambattur is already on the suburban railway line from Chennai

Central to Arakonam. Para-transit facilities should be planned between the proposed Chennai metro

and this railway line to provide seamless connectivity. Further, the recent proposal for evaluating the

feasibility of railway connectivity between Ambattur and Sriperumbudur is also a positive step in this

direction and should be expedited.

7.2 SWOT analysis

A brief SWOT analysis of the town is presented below:

Strengths

Vibrant industrial centre and emerging as a

services hub as well

One of the largest and fastest growing suburbs

Strategically located between Chennai and the

rapidly industrializing regions to its west

Well connected by road and rail

Weakness

Significant gaps in basic infrastructure services

– roads, water supply and sanitation

Growing slum population

Jurisdiction of Multiple authorities (SIDCO

manages the industrial estate area)

Opportunities

Potential to emerge as a leading industrial and

services hub

Emerging as a rapidly growing residential area

Improvements in arterial road connectivity and rail

connectivity and basic infrastructure could enable

it emerge as an important extended area

Proposed move to carve out a Corporation out of

Ambattur and adjoining areas could facilitate

greater focus and planning for orderly growth in

the region.

Threats

Town requires significant investments in basic

infrastructure

Rampant encroachment of public land and

weak town and layout planning

Inability to address infrastructure deficiencies

could constrain growth

Slum proliferation.

7.3 Strategic plan – focus areas and time horizon

The focus of the City Corporate Plan exercise and the strategic plan is on provisioning of urban

services in 8 areas including

a) Water Supply

b) Sewerage and Sanitation

c) Roads, Transportation and street lighting

d) Solid Waste Management

e) Urban services for the Poor

f) Social infrastructure and other urban amenities

The strategic plan for urban service delivery involves identification of interventions to address the

gaps in service delivery between the prevailing levels and the required levels of services in the short

term (covering a period of 5 years starting 2007-08 up to 2011-12) and long term (covering a period

of 15 years starting 2012-13 up to 2026-27). The geographical coverage of the plan includes the area

under the jurisdiction Ambattur municipality as of March 2007.

CCP cum BP - Ambattur Municipality 51

7.4 Population projections underlying the strategic plan

Exhibit 2.1 provides the population projections that form the basis of arriving at the sector wise

service delivery gaps, interventions required and capital investment estimates.

Exhibit 7.1 Population projections and related estimates - Ambattur town

Unit Baseline Projected

2007 2012 2017 2027

Population nos 394,090 470,806 577,309 866,535

Households (Estd.) nos 97,646 117,701 144,327 216,634

Assessed Properties nos 79,365 103,577 132,781 199,303

Road length km 426 426 494 587

The population projections have been arrived at as an average of the population projected based on

Arithmetical Increase Method, Geometric Increase Method and Incremental Increase Method. A

household size of 4.0 is assumed (in line with Census 2001), while property tax assessments are

assumed to be 20% of population by 2012, gradually going up to 23 % of population by 2027

(reflecting a 5% annual growth in number of properties vis-à-vis a population growth of 4.2%)

7.5 Water Supply

7.5.1 Service Goals and Reform targets

Exhibit 7.2 provides the service goal/outcomes and reform targets for 2008-12. As observed, Amb-M

is significantly deficient in all parameters of service delivery including supply, storage infrastructure,

distribution network and house service connections. Thus substantial investments are required to meet

the JNNURM norm of 135 LPCD. Exhibit 7.2 also provides a roadmap and targets for reform agenda

in water supply provision. Apart from initiating projects to address service level gaps, Amb-M should

focus on five areas for reform in order to translate better service levels into increased revenue and to

encourage water conservation.

Exhibit 7.2 Water supply - Service Goals and Reform Targets

FACTOR Unit

Baseline Target

2007 2012 2017 2027

Service Goals

Per capita supply at doorstep LPCD 29 135 135 135

Storage capacity / Total demand % 28% 50% 50% 50%

Distribution network / Road length % 55% 80% 80% 90%

Frequency of supply hours/day < 1 2 2 24X7

Reform targets

Current collection efficiency % 22% 90% 90% 95%

House Service Connections / Assessed Properties % 22% 50% 60% 70%

Population per water fountain nos. 224 200 200 200

Implementation of graded / metered tariff Yes / No No Yes Yes Yes

User charge collection - % of O&M plus debt servicing % N.A 60% 100% 100%

CCP cum BP - Ambattur Municipality 52

7.5.2 Baseline status and requirements – short term & long term

Exhibit 7.3 provides additional details in terms of the current status of water supply infrastructure and

the requirements and gaps in the short, medium and long term. As against a requirement of 64 MLD

in 2012 and 117 MLD in 2026, Amb-M is currently servicing requirements to the tune of about 14

MLD only. Similarly there exists significant gaps in both storage and distribution network vis-à-vis

even current requirements.

Exhibit 7.3 Water Supply - Baseline status and gaps (short term and long term)

Unit Baseline

Required / Target Incremental requirement

2012 2017 2027 2012 2017 2027

Gross Water Supply MLD 14 64 78 117 49 14 39

Storage Capacity ML 4 32 39 58 28 7 20

Distribution network km 241 320 396 528 79 76 133

HSCs Nos. 17,422 58,851 86,596 151,644 41,429 27,746 65,047

Public fountains Nos. 1,756 2,354 2,887 4,333 598 533 1,446

7.5.3 Interventions - short term

CMWSSB is currently preparing a Detailed Project Report for comprehensive water supply covering

all wards in Amb-M to provide 135 LPCD. Preliminary estimates provided to Amb-M indicate a

capital outlay of the order of Rs. 125 crore for carrying out this project. The DPR is expected to be

ready shortly. Officials at Amb-M indicate that this project will be taken up on priority with

JNNURM funding given the poor water service levels in the municipality. Amb-M expects that this

project will be completed within the next 3-4 years. The description of this project and the

components are described below.

a) Implementation of comprehensive protected water supply in all wards (DPR currently

under preparation) at an estimated outlay of Rs. 125 crore. This outlay is based on initial

estimates provided by CMWSSB to Amb-M and exact details of the scope of the DPR are not

available. An assessment of normative gaps that need to be addressed are highlighted below.

Supply augmentation, Transmission and primary storage for supply of at least 49 MLD

(by 2012) and 117 MLD (by 2027)

Local storage and pumping - Additional 28 ML of storage capacity by 2012 and another 20

MLD by 2027.

Investments in pumping and distribution network - Comprehensive provision of

protected piped water supply in all wards covering about 320 km of roads in the short term.

Rapid scale up in House service connections – which would potentially need to increase

nearly 8-fold in the next 5 years to more than 150,000 connections

CCP cum BP - Ambattur Municipality 53

7.5.4 Interventions – Long term

The proposed water supply scheme and the capital investment estimates are expected to address

ultimate population requirements for in supply augmentation. Amb-M is expected to source bulk

water from CMWSSB to meet ultimate population requirements and we have not factored any capital

investments for the long term. However, we have provided for addition of distribution network

(estimated at 77 km) considering the scope for new roads/layout formation and for additional storage

requirements. Amb-M should strive towards 24x7 water supply in the medium to long term. This

would require comprehensive metering of all HSC connections and implementing user charges on the

basis of consumption. Given that Amb-M is yet to even meet access targets, we have provided for

investments in metering only during 2018-27.

7.5.5 Investment summary - Water supply

The total outlay and phasing of investments for water supply is given in Exhibit 7.4 below.

Exhibit 7.4 Water Supply - Capital Investment outlay and phasing

Rs. Lakh

CAPEX PLAN AND PHASING 2008 2009 2010 2011 2012 2008-

12

2013-

17

2018-

27 TOTAL

PRIORITY PROJECT

Comprehensive Water supply scheme - 4,167 4,167 4,167 - 12,500 12,500

LONG TERM NEEDS

Storage capacity augmentation 359 976 1,336

Public fountains 50 50 50 150 164 398 712

Metering - - 3,033 3,033

Pumping and Distribution network - 133 362 495

TOTAL CAPEX - Water supply - 4,167 4,217 4,217 50 12,650 656 4,769 18,075

7.6 Sanitation

7.6.1 Service Goals and Reform targets

Exhibit 7.5 provides the service goal/outcomes and reform targets for 2008-12. As can be seen from

the above, there are significant gaps in sewerage and sanitation services in Amb-M. Amb-M has a

partial coverage of UGD with the sewer network covering only 22% of the road length. Underground

Sewerage connections account of about 28% of assessed properties.

CCP cum BP - Ambattur Municipality 54

Exhibit 7.5 Sanitation - Service Goals and Reform Targets

Unit

Baseline Target

2007 2012 2017 2027

SERVICE GOALS

UGD Network

Availability Yes/no Partial Yes Yes Yes

Design capacity lpcd - 120 120 120

Sewer network - % of road length % 22% 80% 80% 80%

Storm Water Drains

Drain length / Road length % 30% 70% 80% 100%

Public Conveniences

Slum population per PC seat Nos. 289 300 200 200

REFORM TARGETS

Sanitation coverage - % of population % 60% 100% 100% 100%

Current collection efficiency % n.a 70% 90% 90%

Connections / Assessed Properties % 28% 50% 60% 75%

7.6.2 Baseline status and gaps

Exhibit 7.6 provides the baseline status on sanitation and the requirements and gaps in the short,

medium and long term. There are significant gaps in sanitation particularly in storm drain coverage.

Public conveniences also require improvement given the increase in slum population in the town.

Exhibit 7.6 Sanitation- Baseline status and gaps (short term and long term)

Unit

Baseline + Ongoing

Required Gap

2012 2017 2027 2012 2017 2027

Sewerage Treatment Capacity To be addressed

56 69 104 - - -

Sewer Length 341 396 470 55 74

Storm Water Drains km 134 298 396 587 164 97 191

Public convenience seats nos 400 471 722 867 71 251 145

Household connections nos 22,158 58,851 86,596 162,475 36,693 27,746 75,879

7.6.3 Ongoing / Proposed projects

UGD scheme

An Underground sewerage scheme is currently under implementation in 19 wards of the town being

implemented at an outlay of Rs. 39.60 crore. This project has been substantially delayed with the

existing contractor renegotiating for price escalation in view of increase in input prices. Apart from

this, there are 16 wards that are uncovered. CMWSSB has recently completed DPR for a

comprehensive Underground Drainage scheme for the uncovered areas at an outlay of Rs. 130 crore.

Exhibit 2.6 provides a summary of the various cost components of this project.

CCP cum BP - Ambattur Municipality 55

Exhibit 7.7 UGD scheme for uncovered areas – cost break-up

Sl. No Description Cost (Rs. Lakh)

1 Providing Sewerage facilities to Amb-M (Phase III)

consisting of Collection system, pumping station and

Force Main in 9 zones

7531.34

2 Strengthening of Villivakkam Sector A pumping station 113.55

3 Base Cost 7444.89

4 Centage cost (3%) 230.10

5 Proportionate cost for 900mm dia DI main to STP 2208.00

6 Consultancy services 75.45

7 Road restoration 2784.44

8 TNEB service connection 20.03

9 Third Party Inspection 13.09

10 Railway crossing 49.00

TOTAL 13025.00

Discussions with Amb-M indicate that there are a number of uncovered areas even in the wards that

are currently covered with an UGD scheme. Amb-M has requested CMWSSB to address these

uncovered areas as part of the ongoing DPR. Amb-M officials estimate the cost of coverage and price

escalation in ongoing project to be of the order of Rs. 20 crore. Therefore the estimates for

comprehensively addressing the UGD requirements is of the order of Rs. 150 crore

Storm water drains, water bodies and public conveniences

Storm water drains account for just 30% of road length and there are significant gaps. Amb-M has

identified a list of flood prone low lying areas which require immediate attention. Exhibit 7.8 gives a

list of areas identified by Amb-M. Amb-M has identified damaged roads (38 works – 14.94 km) and

storm water drains (10 works – 1.05 km) at an estimated outlay of Rs. 183.80 lakh.

Exhibit 7.8 Low lying / flood prone areas in Amb-M

Sl. No Location Houses Population Depth of

water

Remarks

1 Ram Nagar 200 600 0.8 Low lying

2 Lakshmiamman nagar 150 680 0.95 Low lying

3 Gnanamoorthy nagar 475 1400 1.15 Low lying

4 Srinivasapuram 150 700 1.10 Low lying

5 Balaji nagar and Annai flats 200 750 1.20 Low lying

6 Golden George nagar 175 540 1.20 Low lying

7 Nakeeran Salai 300 900 0.45 Low lying

8 Paneer nagar 106 530 0.90 Low lying

9 Annaisathya nagar 226 1130 1.50 Ambattur Eri

surplus weir

outlet

A list of 34 water bodies (along with the area as per municipal records) within Amb-M is enclosed in

Annexure VIII. Interaction with residents and reconnaissance visits indicate that many of these lakes

have been encroached and are in very poor condition.

CCP cum BP - Ambattur Municipality 56

As per records, Ambattur lake and Koratur lake account for almost 90% of the land area with the top

15 lakes/ponds accounting for nearly 98% of the total land area. There is a need for restoring these

water bodies on priority. Amb-M along with PWD and other government agencies should remove

encroachments of Ambattur and Koratur lake initially and another 10 large / restorable water bodies in

the town from the list enclosed and undertake desilting and undertaking protective works (including

lining of tanks) of all the water bodies.

7.6.4 Interventions - Immediate priorities

There are significant gaps in sanitation in the immediate term and the following projects are required

within the next 5 years.

a) Comprehensive Underground Drainage scheme (Estd. Outlay – Rs. 150 crore) covering the

following components

Provision of UGD scheme in 16 wards ~ Rs. 130 crore

Provision of existing UGD in uncovered areas in wards with UGD scheme ~ Rs. 10 core

Completion of UGD in 19 wards (ongoing project) ~ Rs. 10 crore

Provision of additional 36000 household connections in 5 years and additional sewer

network of approximately 165 km.

b) Phased implementation of pucca Storm water drainage – Rs. 3281 lakh

Storm water drains (10 works – 1.05 km) in areas identified by Amb-M at an estimated

outlay of Rs. 183.80 lakh.

Coverage of all parts of the town in a phased manner to cover the normative gap of 164 km

of new storm drain construction and rehabilitation of existing network of about 134 km.

c) Restoration of Water bodies

Restoration and beautification 10 other lakes at an estimated outlay of Rs.200 lakh (Rs. 20

lakh per water body for 10 water bodies) with

Restoration of Ambattur and Korattur Eri (estimated at Rs. 400 lakh) is envisaged to be

handled by PWD.

7.6.5 Interventions – Long term

The proposed investments in UGD and storm water drains recommended in 7.6.4 above will take care

of the sanitation requirements in the medium to long term as well. However, additional investments

will required to take care of growing population and increase in road length due to new formations /

layouts in the areas of public conveniences, addition to sewer and storm drain network. We have

provided for investments in these areas on a normative basis, depending on the demand emerging

from Exhibit 7.6 above. The restoration of water bodies will continue into the medium term as well.

7.6.6 Project components and Capital Investment

Exhibit 7.9 provides a summary of the project components, capital outlay and phasing for sanitation.

CCP cum BP - Ambattur Municipality 57

Exhibit 7.9 Sanitation - Capital Investment outlay and phasing

Rs. lakh

2008 2009 2010 2011 2012 2008-12 2013-17 2018-27 TOTAL

ONGOING/PROPOSED

UGD Scheme - 5,000 5,000 5,000 15,000 15,000

OTHERS

Sewer length - 328 444 772

Storm water drain construction 820 820 820 820 3,281 1,945 3,828 9,053

Storm water drain renovation 448 448 448 1,343 - - 1,343

Public convenience construction - 8 72 80

Restoration of water bodies 100 100 200 200 200 600

TOTAL 448 6,368 6,368 5,820 820 19,823 2,480 4,545 26,848

7.7 Solid Waste Management

7.7.1 Service goals and reform targets

Exhibit 7.10 provides the service goal/outcomes and reform targets in SWM during 2008-27.

Exhibit 7.10 Solid Waste Management - Service Goals and Reform Targets

Unit

Baseline Target

2007 2012 2017 2027

Collection efficiency % 98% 95% 100% 100%

Door-to-door collection % Partial 100% 100% 100%

Source Segregation % Partial 60% 100% 100%

Mode of disposal % Dumping Scientific Scientific Scientific

Conservancy fee Yes / no No yes yes yes

7.7.2 Baseline status and gaps – short term & long term

Exhibit 7.11 provides the baseline status in solid waste management and the requirements and gaps in

the short, medium and long term. As can be seen, Amb-M has a significant gap in terms of land

available for disposal vis-à-vis municipal norm of 1 acre per 10000 population (2020).

Exhibit 7.11 Solid Waste Management - Baseline status and gaps (short term and long term)

Unit

Baseline Required Incremental gap

2012 2017 2027 2012 2017 2027

Waste Generated MT 196 235 318 520

Primary collection

Number of trips nos 2.17 3 3 3

Vehicle capacity (per tricycle equivalent) MT 0.20 0.20 0.20 0.20

Number of Tricycle equivalent nos. 210 392 529 867 182 137 337

Replacement - Tricycle equivalents nos. 210 392 210 392

Secondary collection / Transfer

Number of trips nos. 3.70 2 2 2

Vehicle capacity MT 28 118 159 260 90 41 101

Replacement - tonnage equivalent MT 28 118 - 28 118

Disposal

CCP cum BP - Ambattur Municipality 58

Unit

Baseline Required Incremental gap

2012 2017 2027 2012 2017 2027

Land acres 7 87 79

Compost yard acres - 26 26

Processing yard acres - 61 61

The gaps in primary collection and secondary collection have been arrived at on a normative basis in

terms of tricycle equivalents for primary collection and tonnage requirement for secondary collection,

based on assumptions on waste generation per capita and the no. of trips.

7.7.3 Interventions required – immediate priorities

The following projects have been identified for implementation within the next 5 years.

a) Land Acquisition and Compost yard development – Rs. 900 lakh

Acquisition of 40 acres land at Kuthambalkam village at an outlay of Rs. 500 lakh

Development of a processing and compost yard at Kuthambalkam - Rs. 400 lakh

b) Transfer station development – Rs. 750 lakh

Clearing existing dumped waste from dumping yard, closing dumping activities and

converting the same into a Transfer station – Rs. 600 lakh

Amenities (Equipment, compound wall, water connection, roads) – Rs. 150 lakh

c) Equipment procurement – Rs. 401 lakh

Requirements have been arrived at on the basis of normative gaps shown in Exhibit 7.11.

Amb-M intends to privatise SWM collection and transfer activities in the 25 wards that are

currently handled by it (Collection in the other 27 wards is already being handled by private

agencies) and hence all the capital investment on equipment is envisaged to be financed by

private operator.

7.7.4 Interventions required – long term

Normative gaps in the long term indicate that, Ambattur would require an additional 39 acres land

over and above the 40 acres acquired recently and we have factored that this would be acquired during

2013-17. Further in addition to the compost facility, we have assumed that the new land acquired

would be developed as a sanitary land fill facility. Capital investments for equipment requirements

have been arrived at on the basis of normative gaps.

7.7.5 Project components and Capital Investment

Exhibit 7.12 provides a summary of the project components, capital outlay and phasing for Solid

Waste Management in Ambattur town.

CCP cum BP - Ambattur Municipality 59

Exhibit 7.12 Solid Waste Management - Capital Investment outlay and phasing

Rs. lakh

2009 2010 2011 2012 2008-

12 2013-

17 2018-

27 TOTAL

ONGOING

Land Acquisition 500 - - - 500 - - 500

Transfer station development 300 450 - - 750 - - 750

Compost yard development 400 400 400

NEW PROJECT COMPONENTS - -

Primary collection 23 23 46 87 182 315

Secondary collection 180 180 361 274 876 1,511

Land acquisition - 196 - 196

Processing facilities development - 785 - 785

SOLID WASTE MANAGEMENT 823 1,053 180 - 2,056 1,342 1,058 4,457

7.8 Roads, Transportation and Streetlights

7.8.1 Service goals and reform targets

Exhibit 7.13 provides the service goal/outcomes and reform targets for the horizon period.

Exhibit 7.13 Transportation and street lighting - Service Goals and Reform Targets

SERVICE LEVEL GOALS AND OUTCOMES Unit

Baseline Target

2007 2012 2017 2027

Municipal roads as % of Total Area % 10% 10% 11% 13%

Surfaced roads to Total roads % 88% 100% 100% 100%

Pedestrian walkways to Total road length % Negligible 20% 40% 40%

Street Lights - Distance between streetlights M 24 30 30 30

Street Lights - Proportion of high power lamps % 19% 25% 25% 25%

Street Lights - Proportion of lights with energy saving devices % 1% 25% 25% 25%

7.8.2 Baseline status and gaps

Exhibit 7.14 provides the baseline status and interventions in transportation and street lighting in the

short term and long term.

Exhibit 7.14 Transportation- Interventions - Physical

Unit

Total Phasing (outcome)

up to 2012 2013-17 2018-27

Municipal road network

Upgrading non-surfaced roads to BT roads km 51 51

Restoring roads after UGD completion km 303 303

New road formation / Surfacing km - 68 93

Re-laying all roads once between 2018-27 km 587

Road facilities

Bus shelters up gradation nos 20 20

Pedestrian walkways km 85 113 122

Bus terminus up gradation nos 1 1

New bus stand nos 1 1

CCP cum BP - Ambattur Municipality 60

88% of the total road network is surfaced. However, there is a need for substantial investment in the

road network even in the short term given the ongoing and proposed capital works in water supply

and sewerage projects in the town.

7.8.3 Interventions required – immediate term

The investment in road up gradation has been arrived at through a combination of normative

assessment and discussion with Amb-M and public consultations on specific interventions required.

The key investment components in roads and transportation in Amb-M and the basis for the same are

detailed below:

a) Conversion of Non BT to BT surface – Rs. 758 lakh

Based on normative gaps of 51 km of non-BT roads to be upgraded to BT surface @ Rs. 15

lakh per km.

b) Road up gradation, surfacing and restoration – Rs. 3637 lakh

Of the 426 km of roads, 363 km are BT roads. In 19 wards where sewerage project is being

undertaken, Amb-M has already identified 148 km of roads to be restored, of which work in

60 km has been completed. 303 km of roads to be restored and upgraded with new BT

surface @ Rs. 12 lakh per km.

Specific junction improvements. These need to be examined by the Highways department

and NHAI and Amb-M for implementation. A diagrammatic representation of the suggested

improvements is enclosed in Annexure III along with the minutes of public consultations.

Widening and strengthening of MTH road and widening the bridge between Ambattur OT

and Ambattur municipal office to 60 m as shown in CMDA master plan.

Feasibility and implementation of an alternate new road formation along the MTH road

Provision of access to the elevated corridors of the bypass roads being implemented by

NHAI at Menambedu.

Need for a box-type underpass for Gyanamurthy nagar and Bharathy salai.

Strengthening / widening roads and removal of encroachments on either side of proposed

Pattravakam railway station ROB

c) Road facilities – Rs. 956 lakh

Amb-M maintains 2 bus stands (at Korattur and Ambattur OT). Amb-M proposes to provide

bitumen road at Korattur bus stand at Rs. 10 lakh and intends to set up a new bus stand in a

10 acres plot at Kallikuppam near Ambattur OT at an outlay of Rs. 500 lakh.

Remaining investments pertain to development of bus shelter and pedestrian walkways as

shown in Exhibit 7.14 and 7.15.

d) Roads maintained by Highways Department and National Highways Authority of India –

Amb-M has about 14.5 km of roads maintained by NHAI. NHAI is currently preparing a

Detailed Project Report for an 81 km stretch of NH 205 – Chennai Tiruvallur Road, starting

from Madhavaram to Tiruttani. Nearly 15 km of this road passes through Ambattur

municipality. Further, NHAI’s proposed bypass road connecting NH 5 with NH 4 through

NH 205 also traverses Amb-M. While the NH 5 – NH 205 part is completed, phase II of this

project connecting NH 5 and NH 4 is under implementation. The 13-km Chennai bypass

CCP cum BP - Ambattur Municipality 61

phase-II will start at Maduravoil junction on National Highway-45 (connecting Chennai-

Dindigul), where a full cloverleaf structure has been provided, and join the NH-5 (Chennai-

Kolkata) near Madhavaram, where provision for a trumpet interchange has been made. A

3.2-km-long elevated highway is being provided for the bypass through the Ambattur

Industrial Estate. A four-lane rotary flyover linking Inner Ring Road and Chennai-Tiruvallur

High Road is being constructed at Padi a cost of Rs.65 crore. The flyover will have a six-lane

passageway for each of its four arms. The average daily traffic at the Padi junction is

1,42,735 passenger car units (PCU) with peak hour traffic being 8,869 PCUs. The existing

arterial roads passing within town also need to be widened and strengthened after removing

all encroachments.

7.8.4 Capital outlay and phasing

Exhibit 7.15 provides the details of the capital outlay for transportation and street lighting

requirements

Exhibit 7.15 Transportation and Street lighting - Capital Investment outlay and phasing

Rs. lakh

Phasing (Outlay) Total

up to 2012 2013-17 2018-27

Municipal road network

Upgrading non-surfaced roads to BT roads 758 - - 758

Re-surfacing of roads after UGD implementation 3,637 - - 3,637

New road formation / Surfacing - 1,707 2,313 4,020

Re-laying all roads once between 2018-27 - - 8,804 8,804

Road facilities -

Bus shelters up gradation 150 150

Pedestrian walkways 256 338 367 960

Subways - -

Bus terminus up gradation - Korattur 10 10

New bus stand @ Kallikuppam - Land acquisition 1,000 1,000

New bus stand @ Kallikuppam - development 500 500

TOTAL 6,311 2,045 11,484 19,839

Street lights

Phasing (Outlay)

TOTAL up to 2012 2013-17 2018-27

Street lights

High power lamps 15 171 231 417

Tube lights - - - -

Lights with Energy savers 168 28 39 235

TOTAL 182 199 270 651

7.9 Urban services for the poor

In Ambattur Municipality there are 63 notified slums. As per a presentation made by Amb-M for

funds access under BSUP, the population of the slums is 115721 with 21480 households.

CCP cum BP - Ambattur Municipality 62

7.9.1 Service levels goals and outcomes

Exhibit 7.16 gives a snapshot of the service level goals and outcomes of Amb-M with respect to

provision of urban services for the poor.

Exhibit 7.16 Urban Services for poor – Service level goals and outcomes

Unit

Target

2012 2017 2027

Road Coverage for slum household % 100% 100% 100%

Sanitation coverage for slum households % 100% 100% 100%

Streetlights % 100% 100% 100%

Pucca houses for all slum households % 100% 100% 100%

7.9.2 Proposed projects

Amb-M has taken up a comprehensive proposal for up gradation of 12 slums at an outlay of Rs.

475.05 lakh under BSUP in 2006.

7.9.3 Capital outlay and phasing

Exhibit 7.17 provides the summary of capital outlay and phasing of investments for provision of

urban services for the poor.

Exhibit 7.17 Urban Services for the poor – Slum details Capital outlay and phasing

Unit

Baseline Estimated

2007 2012 2017 2027

No. of slums nos 63

Slum Population nos 115721 141242 144,327 173307

Slum Households nos 21480 28248 28865 34661

Rs. lakh

2008 2009 2010 2011 2012 2008-12 2013-

17 2018-27 TOTAL

Ongoing BSUP 158 158 158 - - 475 475

Comprehensive slum rehabilitation and development - - - - 4,242

4,242 21,210 - 25,452

TOTAL 158 158 158 - 4,242 4,717 21,210 - 25,927

CCP cum BP - Ambattur Municipality 63

7.10 Social infrastructure and other urban amenities

Exhibit 7.18 provides the summary of interventions, capital outlay and phasing of investments for

provision of other urban service amenities in Amb-M.

Exhibit 7.18 Social infrastructure and other urban amenities – Capital outlay and phasing

Rs. lakh

Segment

Phasing

Outlay 2008 2009 2010 2011 2012

2008-12

2013-17

2018-27

Healthcare

6 Health posts to be converted to Urban primary health centres @ Rs. 50 lakh over 10 years 75 75 150 150 300

Schools

Rs. 10 lakh/school every 5 years 100 100 200 200 400 800

Remunerative assets -

Slaughter House 28 28 100 50 178

Gasifier crematorium 65 65 65

Shops at Koratur 20 20

Shops at Ram nagar 20 20 250 250 520

Shops at Padi 14 14

Parks and beautification -

26 parks @ 10 lakh every 10 years 130 130 260 130 260 650

TOTAL 147 100 230 205 75 757 830 960 2,513

7.11 Capital Investment Plan

7.11.1 Summary of priority projects

The critical priority projects to be implemented by Amb-M in the short term (2008-12) are

summarized below in Exhibit 7.19.

Exhibit 7.19 Priority projects - FY 2008-12

Sl. No

Sector Project Cost Rs.

Lakh

Status DPR needed

1 Water Supply Implementation of comprehensive scheme for protected water supply in all wards

12500 DPR under preparation by CMWSSB

Yes

2 Sanitation UGD scheme for uncovered areas 15000 DPR ready. Under TS

-

3 Sanitation Restoration of water bodies 200 Proposed Yes

4 Sanitation Storm water drains 3800 Proposed Yes

5 SWM Land acquisition and compost yard development

900 In progress Yes

6 SWM Development of Transfer station 750 Phase I to be started

-

7 Transportation Road up gradation and restoration 4811 Proposed Yes

CCP cum BP - Ambattur Municipality 64

Sl. No

Sector Project Cost Rs.

Lakh

Status DPR needed

8 Transportation Category A Bus stand at Kallikuppam 600 Resolution adopted

Yes

9 Social Development of 26 parks 260 Proposed -

10 Social Gasifier crematorium and Slaughter house

93 Ongoing projects -

7.11.2 CIP summary

Exhibit 7.20 provides a summary of sector wise phasing of investment needs of Amb-M.

Exhibit 7.20 Capital Investment Plan summary

Segment 2008 2009 2010 2011 2012 2008-

12 2013-

17 2018-

27 TOTAL

Water Supply - 4,167 4,217 4,217 50 12,650 656 4,769 18,075

Sanitation 448 6,368 6,368 5,820 820 19,823 2,480 4,545 26,848

Solid Waste Management - 823 1,053 180 - 2,056 1,342 1,058 4,457

Transportation and street lights - 2,149 2,149 2,149 46 6,493 2,244 11,754 20,490

Urban Services for the poor 158 158 158 - 4,242 4,717 21,210 - 25,927

Others 147 100 230 205 75 757 830 960 2,513

TOTAL 753 13,765 14,175 12,571 5,233 46,496 28,762 23,085 98,309

7.11.3 Technical assistance

A list of project / sector specific technical assistance requirements needed from CMA/TNUISFL is

given below:

1. Comprehensive GIS for the town with updated information on all urban assets including roads,

water supply, sanitation etc.

2. Support for digitization of layout records and town planning information

3. Roadmap for 135 LPCD water and 24x7 supply

4. DPR for restoration of water bodies and flood management measures covering storm water drain

and canal network design.

5. DPR for Traffic and Transportation improvement plan for the town including feasibility of

specific junction improvements and road strengthening suggested in section 7.8.3.

6. DPR for solid waste management with focus on scientific disposal and mechanised handling of

waste with private sector participation

CCP cum BP - Ambattur Municipality 65

7.11.4 Interventions required from other agencies/departments of GoTN

Specific initiatives required from departments and agencies of GoTN (other than Amb-M) are detailed

below:

1. State Highways/National highways – a) Feasibility study for widening and strengthening MTH

road (NH 205) including widening of bridge on MTH road

2. CMDA – Review of master plan and land-use and roadmap for extension of city limits.

3. Chennai Metro Water / CMA – Comprehensive plan for water supply and sanitation for

Ambattur municipality

4. PWD – a) Restoration and development of Ambattur and Korattur lakes.

5. Department of Education, GoTN – a) Feasibility for setting up a Government High School for

boys and b) Feasibility for setting up an Engineering or Medical college in Ambattur.

6. Department of Youth welfare and Sports – a) Feasibility study for setting up an integrated

sports complex in Ambattur.

7.11.5 Reform targets

Exhibits 7.21 and 7.22 summarize reform targets and asset management plan for Amb-M respectively.

Exhibit 7.21 Service level and reform targets – a summary

FACTOR Unit Baseline Target

2007 2012 2017 2027

WATER SUPPLY

Service Goals

Per capita supply at doorstep LPCD 29 135 135 135

Storage capacity / Total demand % 28% 50% 50% 50%

Distribution network / Road length % 55% 75% 80% 90%

Frequency of supply hours/day < 1 2 2 24X7

Reform targets

Current collection efficiency % 22% 90% 90% 95%

House Service Connections / Assessed Properties % 22% 50% 60% 70%

Population per water fountain nos. 224 200 200 200

Implementation of graded / metered tariff Yes / No No Yes Yes Yes

User charge collection - % of O&M plus debt servicing % N.A 60% 100% 100%

SANITATION

Service Goals

UGD Network

Availability Yes/no Partial Yes Yes Yes

Design treatment capacity per capita lpcd - 120 120 120

Sewer network - % of road length % 22% 80% 80% 80%

Storm Water Drains

Drain length / Road length % 30% 70% 80% 100%

Public Conveniences

Slum population per PC seat Nos. 289 300 200 200

Reform targets

CCP cum BP - Ambattur Municipality 66

FACTOR Unit Baseline Target

2007 2012 2017 2027

Sanitation coverage - % of population % 60% 100% 100% 100%

User charges - Current collection efficiency % n.a 70% 90% 90%

Household connections / Assessed Properties % 28% 50% 60% 75%

SOLID WASTE MANAGEMENT

Collection efficiency % 98% 95% 100% 100%

Door-to-door collection % Partial 100% 100% 100%

Source Segregation % Partial 60% 100% 100%

Mode of disposal % Dumping Scientific Scientific Scientific

Conservancy fee Yes / no No yes yes yes

TRANSPORTATION AND STREET LIGHTS

Municipal roads as % of Total Area % 10% 10% 11% 13%

Surfaced roads to Total roads % 88% 100% 100% 100%

Street Lights - Distance between streetlights M 24 30 30 30

Street Lights - Proportion of high power lamps % 19% 25% 25% 25%

Street Lights - Proportion of lights with energy savers % 19% 25% 25% 25%

URBAN SERVICES FOR POOR

Road Coverage for slum household % 100% 100% 100% 100%

Sanitation coverage for slum households % 100% 100% 100% 100%

Streetlights % 100% 100% 100% 100%

Pucca houses for all slum households % 100% 100% 100% 100%

7.12 Asset Management Plan

This section details the asset management plan for various urban service areas and assets owned by

Amb-M and follows from a review of the asset register of the municipality particularly relating to its

land and buildings and open space areas (such as parks and water bodies).

In the following paragraphs we analyse the information provided to us on land and building assets

available with Amb-M and outline specific observations and suggestions on maintaining and updating

these assets. The Asset Management Plan for core services areas namely Water Supply, Sanitation,

Solid Waste Management and Transportation follows largely from the Capital Investment Plan

outlined in the earlier paragraphs and is outlined below under sections 7.12.2 to 7.12.5 below.

Specific actions relating to asset management and reform steps in these areas are also summarized in

Exhibit 7.24.

7.12.1 Land and building assets of Amb-M

Details of information on assets of Amb-M have been compiled and enclosed as Annexures as shown

below:

Annexure VI – List of parks and playfield sites

Annexure VII – List of parks

Annexure VIII – List of Water bodies

Annexure IX – Ward wise details of road assets

CCP cum BP - Ambattur Municipality 67

Annexure X – Details of OSR sites

Annexure XI – Land details as per Schedule I of asset register

Annexure XII - Building details as per Schedule II of asset register

Annexure XIII - List of SWM equipment

Exhibit 7.22 and 7.23 summarises the details of land and building assets in Amb-M as shown in

schedule I and II of the asset register of the municipality.

Exhibit 7.22 Land assets summary

Land use (as shown) No of sites Area in sq. m

Basic Amenities 23 227870

Water bodies 7 66267

Public conveniences 16 161603

Social 6 71378

Burial Grounds 1 3228

Library 1 1614

Kalayana mandapams 2 40,636

Hospitals / Maternity centre 2 25900

Schools 5 27400

Schools & Noon Meal Centre 12 99860

Noon Meal Centre 23 40348

Office Places 3 179068

Open Places / Vacant sites 8 478097

Parks 17 397874

Play ground 7 128449

Others 2 4048

Total 106 16,54,392

Exhibit 7.23 Building assets summary

Description

Area in sq. m

No of sites Total area Plinth Area

Basic Amenities 21 2534.77 2142.23

Public Conveniences 21 2534.77 2142.23

Social 17 6521.26 2601.56

Burial Ground 7 671.98 252.13

Library 1 150 150

Kalayana mandapam 1 672 672

Hospital / Maternity Centre 6 2880.3 1419.3

Parks 2 2146.98 108.13

Play Ground 0 0 0

Schools 11 950 810.58

Noon Meal Centre 29 6891.05 1787.55

Office Buildings 11 3746.23 2807.97

Others 11 3746.23 2807.97

Total 100 24389.54 12957.86

CCP cum BP - Ambattur Municipality 68

We observe that the asset register of Amb-M has not been updated. Several items in the asset register

reflect status as of year 2000, when the asset register was initially created. For instance, the land in

which municipal office building which has been constructed in the last few years continues to be

shown as vacant land. We recommend the following actions in terms of managing the land and

building assets of Amb-M

1. There are several discrepancies between the land details shown in land schedule and in the

buildings schedule. We therefore strongly suggest a zero base validation and updation exercise

covering the asset register be taken up on priority.

2. Amb-M should prepare and implement an annual maintenance plan (along with an assessment of

cost implications) for all land and building assets. This maintenance plan should precede budget

preparation process and should feed into the budget, so that the plan is adequately funded.

3. Amb-M should progressively move towards achieving revenue realisations in line with market

trends from all its remunerative assets including shops, markets etc. This is achievable through a

combination of a) developing a framework for enabling periodic increases in rates charged and b)

improvement and better maintenance of the assets through periodic and planned maintenance.

Specific actions relating to management of assets in water supply, sanitation, solid waste management

and roads are outlined below and are summarized in Exhibit 7.24

7.12.2 Water supply

As explained in section 4, Water supply is being handled in Amb-M limits by both Amb-M and

CMWSSB. While CMWSSB handles O&M for water supply in 11 wards, Amb-M handles water

supply in Koratur and other areas. Bulk water supply to the areas serviced by Amb-M is catered to by

CMWSSB. Amb-M intends to handle operations and maintenance of the water supply project for the

entire town once the proposed water supply scheme is completed. While this would enable focused

accountability, it is important that CMWSSB and CMA prepare a roadmap and take the necessary

steps for smooth handover of the water supply network during the next 5 years, when implementation

of the proposed water supply scheme is completed. This would entail capacity building within Amb-

M to ensure appropriate upkeep of the network. Specific Asset management activities relating to the

water supply assets and network are listed below along with priority.

Short term

a) Establish timelines for implementing the proposed water supply scheme along with CMA and

CMWSSB and set up a monitoring committee to review progress and expedite the project.

b) Create a baseline asset register comprising all components of existing water supply components in

i) Amb-M maintained areas ii) Areas being maintained by CMWSSB and c) areas to be addressed

by the new project, prior to complete hand over of the water supply network to Amb-M.

Medium term

a) Establish accountability and processes for updating asset register with capital works undertaken.

b) Provide a ward wise report on capital works undertaken online on a quarterly basis.

CCP cum BP - Ambattur Municipality 69

c) Undertake an independent study to assess loss levels in transmission, storage points and

distribution and develop a roadmap for providing 24x7 water supply.

d) Conduct periodic IEC campaigns on water conservation and rainwater harvesting practices.

e) Review losses and illegal connections and widen the base of house service connections.

Long term

a) Undertake a comprehensive GIS mapping of the water supply network of the town.

b) Implement metering and metering-based-tariff /graded water tariff at household level

c) Implement 24x7 water supply on a pilot basis in select zones / wards and replicate the same in a

phased manner within a ten-year timeframe.

7.12.3 Sanitation

Underground drainage is being handled in Amb-M limits by both Amb-M and CMWSSB. While

CMWSSB handles O&M for UGD in 11 wards, Amb-M handles UGD in Koratur area and will be

handling 19 other wards where UGD scheme is under execution. Amb-M intends to take over

operations and maintenance of the entire UGD scheme for the town, once the proposed UGD scheme

is completed.

While this would enable focused accountability, it is important that CMWSSB and CMA prepare a

roadmap and take the necessary steps for smooth handover of the UGD network during the next 5

years, when implementation of the proposed water supply scheme is completed. This would entail

capacity building within Amb-M to ensure appropriate upkeep of the network. Given this backdrop,

Amb-M would need to undertake the following activities.

a) Establish timelines for implementing the proposed UGD scheme along with CMA and CMWSSB

and set up a monitoring committee to review progress and expedite the project.

b) Create a baseline asset register comprising all components of existing UGD components in i)

Amb-M maintained areas ii) Areas being maintained by CMWSSB and iii) areas to be addressed

by the new project, prior to complete hand over of the water supply network to Amb-M.

Subsequently, Amb-M should

a) Establish processes and accountability for periodic updation and dissemination.

b) Conduct IEC campaigns and public consultations to educate citizens on the benefits of

Underground drainage scheme.

c) Ensure adequate upkeep of sanitation assets including public conveniences and storm water drains

through encouraging community level participation and feedback

d) Disseminate information on tariffs a transparent manner and undertake a focused program to

mobilise connection deposits

e) Use a combination of incentives and penalties to encourage timely payment of user charges.

It would be prudent in the medium term for Amb-M to incorporate the sanitation asset details as part

of a wider GIS implementation program in the medium to long term. Further, tariffs can be structured

on a slab rate structure with property tax assessments as the basis.

CCP cum BP - Ambattur Municipality 70

Exhibit 7.24 Asset Management Plan and timeline

Sl.No ASSET MANAGEMENT / DEVELOPMENTAL ACTIVITIES Responsibility

Short Term

Medium term Long Term

2007-12 2013-17 2018-27

WATER SUPPLY

1 Monitoring committee for expediting water supply project Amb-M/CMWSSB/CMA

2 Baseline asset register comprising all components in a) Amb-M maintained areas b) Areas being maintained by CMWSSB and c) areas to be addressed by the new project

Amb-M/CMWSSB

3 Accountability and computerisation of updation / dissemination of asset register Amb-M/CMWSSB

4 IEC campaigns for water conservation and rainwater harvesting Amb-M

5 Leak detection plan / Losses assessment Amb-M/CMWSSB

6 Implementation of usage based / graded tariffs Amb-M/CMWSSB

7 Incentives / penalties to encourage timely payment of water charges Amb-M/CMWSSB/CMA

8 GIS mapping of water supply assets/connections Amb-M/CMWSSB/CMA

9 Roadmap for 24x7 water supply Amb-M/CMWSSB

10 Metering at household level and usage based tariffs Amb-M/CMWSSB

11 Piloting 24x7 water supply Amb-M/CMWSSB

12 Implementation of 24x7 water supply Amb-M/CMWSSB

SANITATION

1 Monitoring committee for expediting UGD coverage in unserved areas Amb-M/CMWSSB/CMA

2 Baseline asset register comprising all components in a) Amb-M maintained areas b) Areas being maintained by CMWSSB and c) areas to be addressed by the new project

Amb-M/CMWSSB

2 Accountability and computerisation of updation / dissemination of asset register Amb-M

3 IEC campaigns and public consultations on UGD benefits Amb-M

4 Mobilisation of public deposits Amb-M

5 Initiate and encourage Community participation for upkeep of sanitation assets Amb-M

6 Incentives / penalties to encourage timely payment of water charges Amb-M/CMA `

CCP cum BP - Ambattur Municipality 71

Sl.No ASSET MANAGEMENT / DEVELOPMENTAL ACTIVITIES Responsibility

Short Term

Medium term Long Term

2007-12 2013-17 2018-27

7 Implementation of graded tariffs Amb-M

8 GIS mapping of sanitation assets/connections Amb-M/CMWSSB/CMA

SOLID WASTE MANAGEMENT

1 IEC activities Amb-M

2 Review and updation of SWM action plan Amb-M/CMA/TNUIFSL

3 Door to Door Collection Amb-M

4 Source Segregation Amb-M

5 Identified transfer / collection points Amb-M

6 Synchronisation of primary/secondary collection Amb-M

7 Development and operationalisation of compost yard Amb-M

8 Conservancy fee for primary collection Amb-M

9 Commercial exploitation of waste Amb-M

10 Increased mechanisation of handling waste Amb-M

11 Development of scientific landfill site Amb-M/CMA/TNUIFSL

TRANSPORTATION

1 Baseline data on road assets Amb-M

2 Accountability and process for periodic updation / dissemination Amb-M

3 Policy on road digging and right of way Amb-M/CMA

4 Stakeholder coordination mechanism for synchronized road development Amb-M

5 Energy saving in street lights Amb-M

6 Study on specific transportation interventions for Amb-M Amb-M/CMA/TNUIFSL

Interventions requiring technical assistance/support in DPR preparation

CCP cum BP - Ambattur Municipality 72

7.12.4 Solid Waste Management

Short term

a) Amb-M has taken a right first step in this regard by initiating steps to acquire land for creating a

processing facility/compost yard. It intends to convert the existing land available at Athipet into a

transfer station and segregation centre and has initiated a project in this regard

b) While we have arrived at the investment estimates based on normative gaps and ongoing projects,

Amb-M should prepare a detailed project report for its solid waste management requirements

along the entire value chain from generation to disposal to ascertain. This is required considering

the significant changes in requirements and disposal challenges in the last few years.

c) Being an adjacent urban area within the Chennai Metropolitan Area, Amb-M faces significant

challenges with respect to safe disposal of waste. It is highly constrained in terms of availability

of land for disposal / waste processing facility. While it has undertaken steps to acquire land (40

acres) to meet its immediate and medium term requirements, Amb-M will still face shortage of

land (of 39 acres) to meet its 2027 population requirements. This is not just a situation for Amb-M

but for all other ULBs in the region and hence there is a need to explore sustainable approach to

Solid waste disposal in an integrated manner. All ULBs including Amb-M should initiate steps to

segregate waste, so that the bio-degradable waste is processed within respective towns in a self-

sufficient sustainable manner. A common shared landfill facility should be created in the region

for safe systematic land fill of non-biodegradable waste instead of indiscriminate dumping that is

prevalent currently. We understand that TNUIFSL is undertaking a feasibility study for setting up

engineered landfills in various city clusters. We recommend that the study should be taken up for

municipalities in the Tiruvallur district coming under the Chennai Metropolitan Area.

Other asset management and developmental activities to be taken up Amb-M in the short term include

the following:

a) Conduct IEC activities to back other initiatives like door-to-door collection to facilitate effective

segregation of waste at source.

b) Implement door-to-door collection and source segregation in all wards.

c) Identify transfer points / collection points for every ward and streamline primary and secondary

collection trips in synchrony with the proposed disposal / waste processing plans.

Long term

a) Amb-M should progressively enable greater mechanisation of waste handling and faster adoption

of modern waste management practices

b) Amb-M could consider implementing a conservancy fee for primary collection.

c) In the medium to long term, Amb-M could focus on commercial exploitation opportunities for

revenue enhancement by exploring scope for privatising compost yard management and other

options including bio-gas and sale of scrap/recyclable material in a formal manner.

CCP cum BP - Ambattur Municipality 73

7.12.5 Roads and Transportation

The related asset management and developmental activities in transportation and street lights include

the following:

a) Considering the significant growth of the town and its location connecting Chennai and other

western suburbs such as Avadi, Ambattur is witnessing a significant growth in floating population

and through traffic. In this regard there is a need to prepare a Detailed Project Report on arterial

road improvements and road facilities in Amb-M. Further, we understand that the Ministry of

Railways, Government of India is contemplating a railway link between Ambattur and the

rapidly industrialising Sriperumbudur-Oragadam region. The proposal should be taken forward

and a detailed feasibility study should be undertaken in this regard.

b) Create a baseline database on road assets at a ward level covering street wise details of length of

road, road assets (storm drains, culverts etc), surface and condition

c) Establish process and accountability for periodically updating this database with details of works

done on these roads and disseminating information on the same on Amb-M’s website.

d) Clarify policy on road digging and repair and communicate the same to all agencies. Take stern

action on agencies digging without prior permission from the ULB.

e) Create a coordination committee comprising ‘right of way’ users including telecom companies,

Tamil Nadu Electricity Board, TV cable operators, Traffic police and ULB officials to plan

development and maintenance of road assets in a synchronised manner.

f) Provide ducts for cables and other utilities along all arterial and major roads to minimise road

digging.

g) Adopt energy saving measures including implementation of energy savers in all high power street

lights.

CCP cum BP - Ambattur Municipality 74

8. Project profiles, analysis of risks and ESA considerations

This section follows from the Capital Investment Needs identified in the previous section and provides brief

profiles of select priority projects that need to be executed by Amb-M in the short term. These project profiles

provide a) Need for the project b) Project cost and phasing c) current status and technical assistance

requirements d) possible financial mix and risk factors and e) illustrative classification based on environmental

and social framework adopted by TNUDF.

8.1 Water supply

Project Description Comprehensive water supply scheme for piped water supply in all wards

Project Status DPR under preparation by CMWSSB.

Need for the project Water supply is only 29 LPCD while less than 22% of assessed properties have

house service connections, indicating the significant gaps in water supply service

levels and coverage. Therefore this project needs to be addressed on priority

Project

Components

This outlay is based on initial estimates provided by CMWSSB to Amb-M and exact

components and scope of DPR are not available. An assessment of normative

gaps that need to be addressed are highlighted below.

Supply augmentation, Transmission and primary storage for supply of at

least 49 MLD (by 2012) and 117 MLD (by 2027)

Local storage and pumping - Additional 28 ML of storage capacity by 2012

and another 20 MLD by 2027.

Investments in pumping and distribution network - Comprehensive

provision of protected piped water supply in all wards covering about 320 km

of roads in the short term.

Rapid scale up in House service connections – which would potentially

need to increase nearly 8-fold in the next 5 years to more than 150,000

connections

Project Cost and

basis

Estimated at Rs. 125 crore.

Based on discussions with Amb-M, initial estimate provided by CMWSSB of Rs.

100 crore, but is likely to get escalated.

Revenue impact Direct incremental revenue impact as Amb-M intends to levy house connection

deposits and user charges. However, it has still not been decided whether Amb-M

or CMWSSB would be handling the maintenance of water supply

Financing mix Would be structured as a combination of grant, loan and own funds based on a

detailed appraisal of potential revenues and other possible credit enhancements

including escrow of part of property tax receivables and user charges and creation

of debt service reserve. JNNURM grants likely to be accessed.

Risk factors and

other remarks.

Given the large size and the complexity of the project, it is important to follow best

practices in contracting out this project. Stringent quality considerations must be

adopted in selecting contractors. The contract could be structured on a BOT format

where the contractor is also responsible for maintaining the network, so that that

the risk of non-performance is shared. Further incentives and penalties should be

built into the contract to ensure timely completion of the project. To ensure

scalability, CMWSSB should ideally make the design amenable for 24x7 supply in

the future, even it does not envisage 24x7 supply in the short term.

ESA analysis and

tentative rating

E2 -Expected to have only moderate environmental issues. Mostly generic impacts

in nature

S3 - No social issues expected. Hence socially benign no social mitigation

measures required, need to submit SSR

CCP cum BP - Ambattur Municipality 75

8.2 Sanitation

Sector Sanitation

Project Description UGD scheme (ongoing – 19 wards) and uncovered areas (16 wards)

Project Status DPR already prepared by CMWSSB and under updation.

Need for the

project

Only 14 wards out of 52 have some Underground Drainage system in place. While

the project to cover 19 wards has been delayed for a long time, CMWSSB has

also prepared a DPR for the uncovered areas. Therefore there is significant gaps

in sanitation that need to be rectified on priority.

Project

Components

Comprehensive Underground Drainage scheme (Estd. Outlay – Rs. 180

crore) covering the following components

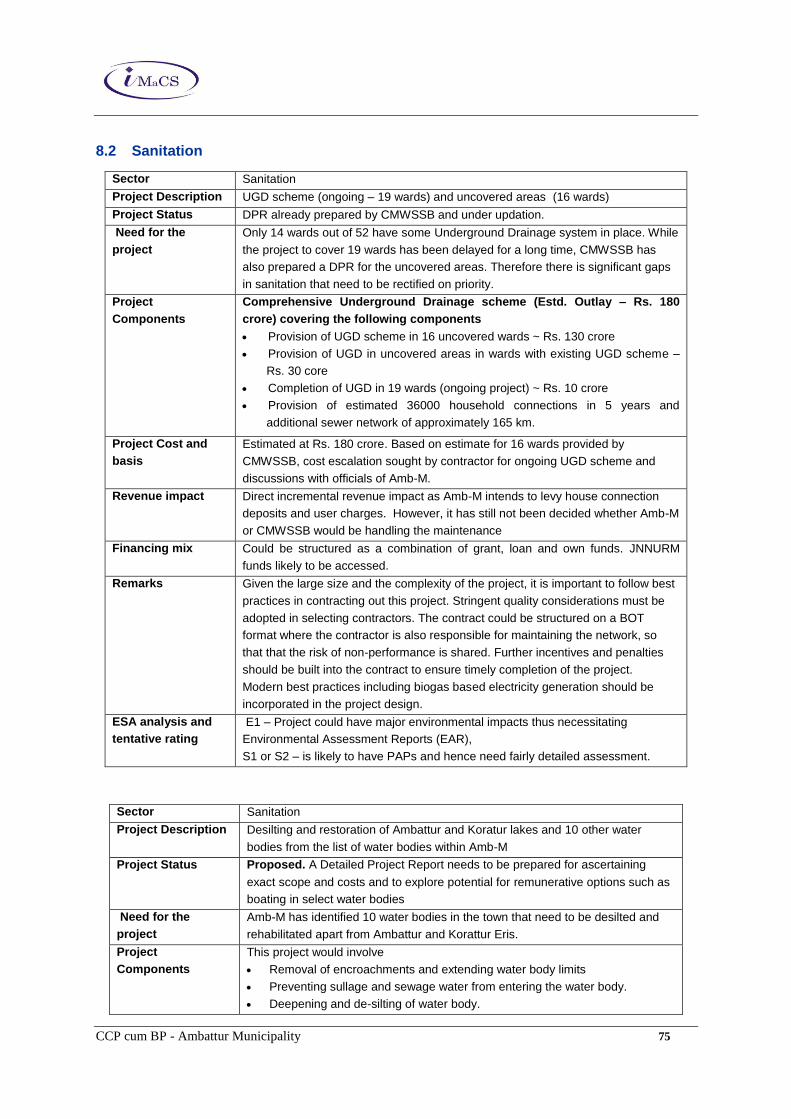
Provision of UGD scheme in 16 uncovered wards ~ Rs. 130 crore

Provision of UGD in uncovered areas in wards with existing UGD scheme –

Rs. 30 core

Completion of UGD in 19 wards (ongoing project) ~ Rs. 10 crore

Provision of estimated 36000 household connections in 5 years and

additional sewer network of approximately 165 km.

Project Cost and

basis

Estimated at Rs. 180 crore. Based on estimate for 16 wards provided by

CMWSSB, cost escalation sought by contractor for ongoing UGD scheme and

discussions with officials of Amb-M.

Revenue impact Direct incremental revenue impact as Amb-M intends to levy house connection

deposits and user charges. However, it has still not been decided whether Amb-M

or CMWSSB would be handling the maintenance

Financing mix Could be structured as a combination of grant, loan and own funds. JNNURM

funds likely to be accessed.

Remarks Given the large size and the complexity of the project, it is important to follow best

practices in contracting out this project. Stringent quality considerations must be

adopted in selecting contractors. The contract could be structured on a BOT

format where the contractor is also responsible for maintaining the network, so

that that the risk of non-performance is shared. Further incentives and penalties

should be built into the contract to ensure timely completion of the project.

Modern best practices including biogas based electricity generation should be

incorporated in the project design.

ESA analysis and

tentative rating

E1 – Project could have major environmental impacts thus necessitating

Environmental Assessment Reports (EAR),

S1 or S2 – is likely to have PAPs and hence need fairly detailed assessment.

Sector Sanitation

Project Description Desilting and restoration of Ambattur and Koratur lakes and 10 other water

bodies from the list of water bodies within Amb-M

Project Status Proposed. A Detailed Project Report needs to be prepared for ascertaining

exact scope and costs and to explore potential for remunerative options such as

boating in select water bodies

Need for the

project

Amb-M has identified 10 water bodies in the town that need to be desilted and

rehabilitated apart from Ambattur and Korattur Eris.

Project

Components

This project would involve

Removal of encroachments and extending water body limits

Preventing sullage and sewage water from entering the water body.

Deepening and de-silting of water body.

CCP cum BP - Ambattur Municipality 76

Beautification and provision of amenities including jogging track garden

wherever feasible.

Project Cost Rs. 200 lakh

The costs for Ambattur and Koratur lakes have not been considered for Amb-M’s

budget as these come under the management of PWD. We have considered an

outlay of Rs. 20 lakh per water body in the short term.

Revenue impact Most of the projects are likely to be non-remunerative. However, Amb-M should

explore scope for remunerative options including boating and tap commercial

opportunities wherever possible, particularly in development of Ambattur and

Korattur lakes.

Financing mix Given the size of the project and the non-remunerative of the project proposals,

implementation of the project would require significant grant support.

Remarks There is a need for a clear O&M strategy involving local community participation

at the project implementation stage itself.

ESA analysis and

tentative rating

E1 – Project could have major environmental impacts thus necessitating

Environmental Assessment Reports (EAR),

S1 or S2 – is likely to have PAPs and hence need fairly detailed assessment.

Sector Sanitation

Project Description Implementation of pucca storm water drains and flood management measures.

Project Status Proposed.

A Detailed Project Report needs to be prepared covering

a) identification of potential water catchment points (including restoration of

water bodies),

b) Identify arterial canal networks that need to be developed/strengthened

based on a review of flooding and water flow patterns and

c) specify ward level guidelines for storm water drain construction in terms of

linkages and gradient of local storm water drain construction initiatives.

Need for the

project

Amb-M has a number of flood-prone and low-lying areas as identified in section 7.6.3 of the report. Low lying areas are primarily along wards 4,5,6,7,12,35 and areas covering New nagar (Padi) and Annai satya nagar

Project

Components

This project would involve

Construction of new Pucca concrete storm water drains along the road

along with interlinking to water bodies in uncovered areas in an estimated

length. Cost estimated arrived at based on a normative length of 164 km of

existing storm water drains.

Rehabilitation and desilting of existing storm water drains. Cost estimate

arrived at based on an additional length of 164 km needed to meet 70% of

road length.

Project Cost Rs. 3281 lakh

Revenue impact The project is likely to be non-remunerative.

Financing mix Given the size of the project and the non-remunerative of the project proposals,

implementation of the project would require significant grant support.

Remarks There is a need for a clear O&M strategy involving local community participation

at the project implementation stage itself to ensure appropriate upkeep and

maintenance of the asset. Further, the construction of storm water drains should

be done in conjunction with road restoration/development to ensure appropriate

alignment and flow patterns.

CCP cum BP - Ambattur Municipality 77

ESA analysis and

tentative rating

E1 – Project could have major environmental impacts thus necessitating

Environmental Assessment Reports (EAR),

S1 or S2 – is likely to have PAPs and hence need fairly detailed assessment.

8.3 Solid waste management

Sector Solid waste management

Project Description Land acquisition and compost yard development

Project Status Proposed.

Need for the

project

Amb-M has shortage of land for disposal and has decided to acquire 40 acres of land in Kuthambalkam village for development of an integrated compost yard.

Project

Components

This project would involve

Acquisition of land at a cost of Rs. 500 lakh

Development of compost yard at Rs. 400 lakh

Project Cost Rs. 900 lakh

Revenue impact The project could enable earnings through sale of compost manufactured.

Financing mix The project should be implemented with private sector participation on a BOT

basis. This will reduce the capital investment from Amb-M and at the same time

enable Amb-M to insist and enforce service levels.

Remarks The project could be clubbed with collection and transfer responsibility in select

wards.

ESA analysis and

tentative rating

E1 or E2 – Project could have major environmental impacts thus necessitating

Environmental Assessment Reports (EAR), particularly if dumping of non-

biodegradable waste is also being done in the location.

S1 or S2 – may have PAPs and hence need fairly detailed assessment.

8.4 Transportation

Sector Roads

Project Description Upgradation of road network post UGD implementation

Project Status Ongoing – to be implemented in a phased manner to cover all wards.

Need for the

project

Since UGD scheme is expected to be implemented over the next few years,

there is a need to restore the entire road network post implementation

Project components Details have already been outlined in section 7.8.3 under the following

components

Conversion of Non-BT to BT surface (51 km @ Rs. 758 lakh)

Road up gradation and restoration after UGD implementation (303 km @

Rs. 3637 lakh)

Road facilities at Rs. 406 lakh

Project Cost Rs. 4801 lakh

Revenue impact Non-remunerative project

Financing mix Combination of loans (30%), grant (50%) and own funds

Remarks The road network up gradation should comprehensively take into account storm

water drain design and other road assets including pedestrian foot paths,

signage and road medians as appropriate.

ESA analysis and

tentative rating

E2 -Expected to have only moderate environmental issues. Mostly generic

impacts in nature

S3 - No social issues expected. Hence socially benign no social mitigation

measures required, need to submit SSR

CCP cum BP - Ambattur Municipality 78

Sector Transportation

Project Description Development of A class bus terminus in Kallikuppam

Project Status Concept stage.

Need for the

project

The existing Ambattur OT bus stand area is very congested and it has been

proposed to shift the bus stand to a new developed bus stand at Kallikuppam

Project components Details have already been outlined in section 7.8.3 under the following

components

Land acquisition – Rs. 1000 lakh

Development of new bus stand – Rs. 500 lakh

Project Cost Rs. 1500 lakh

Revenue impact Can be structured as a remunerative project

Financing mix Implementation should be attempted on PPP mode.

Remarks Project would require a DPR to ensure appropriate routing of buses to avoid

congestion. Provision for commercial activities should be provided to facilitate

revenue augmentation and steps to keep the bus stand encroachment free

should be planned and enforced.

ESA analysis and

tentative rating

E2 -Expected to have only moderate environmental issues. Mostly generic

impacts in nature

S3 - No social issues expected. Hence socially benign no social mitigation

measures required, need to submit SSR

CCP cum BP - Ambattur Municipality 79

9. Reform agenda and Technical assistance

This section outlines the reform agenda for Amb-M in the areas of a) capacity building and systems b) measures

for improving financial performance and c) summary of targets on select operational and financial indicators

9.1 Urban sector reform in Tamil Nadu – an overview

Tamil Nadu is considered a pioneer in the area of urban reforms. Tamil Nadu has constituted three

successive State Finance Commissions for improving resources of local bodies and devolution of

funds from the State to Urban Local Bodies and has conducted three successive elections to Urban

Local Bodies on due dates. Apart from this, other key reform initiatives undertaken by Tamil Nadu in

the urban sector are given below:

1. Reduction in stamp duty on transfer of property from 15 to 8 percent.

2. Implementation of accrual accounting system in all Urban local bodies

3. Introduction of modified area based property tax system

4. Computerization of sub-registrar’s offices

5. Repeal of the Land Ceiling Act, while a reformed Rent Control Act is being considered

6. Commitment to levy user charges and improvement in collections for water and sanitation

services.

7. Creation of TNUDF to provide access to capital markets in a non-guarantee mode.

Apart from setting in motion a process for financial devolution through creation of SFC, Tamil Nadu

has also moved a fair bit towards delegating a number of functions to the ULBs. The 12th Schedule of

the Constitution provides for 18 functions to be undertaken by ULBs.

1. Urban planning, including town planning;

2. Regulation of land-use and construction of buildings;

3. Planning for economic and social development;

4. Provision of roads and bridges;

5. Provision of water supply for domestic, industrial, and commercial purposes;

6. Provision of public health, sanitation conservancy, and solid waste management;

7. Provision of fire services;

8. Promotion of urban forestry, protection of the environment, and promotion of ecology;

9. Safeguarding of the interests of weaker sections of society, including the handicapped and

mentally retarded;

10. Slum improvement and upgrading;

11. Urban poverty reduction;

12. Provision of urban amenities and facilities such as parks, gardens, and playgrounds

13. Provision of cultural, educational and aesthetic aspects

14. Provision of burials and burial grounds, and cremations, cremation grounds, and electric

crematoriums;

15. Provision of cattle pounds, and prevention of cruelty to animals

16. Recording of vital statistics including registration of births and deaths

CCP cum BP - Ambattur Municipality 80

17. Provision of public amenities including street lighting, parking lots, bus stops and public

conveniences

18. Regulation of slaughterhouses and tanneries.

While not mandatory, the provisions direct state governments to decide the powers and functions to

be devolved to local bodies. Tamil Nadu has delegated functions 2 to 6 and 8 to 18 to ULBs6. Though

Urban Planning as a function is vested with the Department of Town and county planning, both the

political and administrative heads namely the Chairman and the commissioner are typically involved

in the process of preparing master plans.

9.2 Reform agenda – interventions required at the state level

As observed above, GoTN has ushered in a number of reforms in the urban sector. However, there is a

need to persist with this direction. The stage is set for the state to usher in a set of second generation

reform that furthers the vision of the 74th Constitutional amendment in empowering and strengthening

local governance. In this regard, we have outlined below a set of possible reform areas and

interventions below:

1. Implement recommendations of the Third State Finance Commission – The

recommendations relating to the revenue buoyancy of the ULBs including property tax reform

and devolution income and transfer are particularly critical for the financial stability of the ULBs

and need to implemented on priority.

2. Maintain reasonable stability of tenure of key officials – We recommend that except for

extraordinary circumstances, there should be a minimum tenure of at least 2 years for all the key

positions including Commissioner, Municipal Engineer, Manager, Town Planning Inspector,

Sanitary and public health head and Accountant. Further, guidelines need to be clarified and

enforced for formal charge handover whenever there is a transfer of officials to ensure continuity

of city level vision, projects and streamlined service delivery.

3. Carry out an Independent assessment of skill gaps and manpower needs of Amb-M - There

is a need for an independent review of the skill requirements in various grades of municipal

bodies to ascertain the appropriate manpower plan in terms of skill sets and experience/seniority.

This is particularly relevant given the recent developments and the growing service delivery

expectations in the urban sector specifically in urban planning, municipal accounting and systems,

e-governance and modern practices in infrastructure service delivery including potential for

public-private partnerships.

4. Address critical operational areas through focused training and capacity building

interventions - Three areas stand out in terms of criticality and the need for significant training

interventions. These include:

6 Source: Local Governments Finances and Bond Markets. ADB. 2003

CCP cum BP - Ambattur Municipality 81

Engineering and project development – A number of new grant and loan schemes (both

central and state) including the UIDSSMT are available for ULBs to tap into for meeting

their asset creation requirements. However, there seems to be very little understanding of the

scope and potential of using these schemes for implementing local level projects. GoTN and

CMA should conduct periodic training and awareness programs for senior management

personnel including Commissioners, Managers and Engineering staff. This would enable

them work towards developing projects that can leverage such schemes. Agencies like

TNUIFSL and TUFIDCO should also take the lead in organising such awareness programs.

Accounting and Finance – Though accrual accounting has been implemented in Amb-M

and is under operation for more than 5 years. Computerised Financial and Administrative

systems are in place or are in various stage of implementation/up gradation. There is a

therefore a need for continued emphasis on training to bring the accounting and finance staff

up to speed on these developments.

Use of CAD/GIS applications in Town Planning/Engineering – CMA and GoTN should

initiate a state-wide program to train Town planning and engineering staff on CAD and GIS

applications.

5. Build on GoTN’s pioneering position in implementing accrual accounting by launching a

drive improve the timeliness and quality of information dissemination - While all ULBs in

Tamil Nadu have implemented a double entry accounting system, there is scope for improvement

in the quality of accounting in the areas of classification and recording, consolidation and

dissemination of information. Several ULBs have redundant systems involving manual and

computerised book keeping and errors often creep into MIS. Often, the DCB statements and

accounting statements are not reconciled. The recent initiative of the setting up of the Debt

Monitoring Cell at the CMA level is a positive step in getting the loan records at the ULB right. It

still takes significantly long time for accounts to be closed and this need to be remedied. GoTN

and CMA should continue its thrust in this area to ensure that the real advantages of accrual

accounting is realised. In this regard, we recommend that

CMA, GoTN should continue its focus on technical assistance to ULBs to improve their

accounting systems and practices. Proper training should be given to the staff on the

concepts of double entry book keeping. Apart from the municipal staff, the LFA should also

be given training in auditing the new computerised systems being implemented. Currently

there is a dual system in operation and this seems to be creating significant reconciliation

issues.

CMA, GoTN should insist and implement closing of accounts and audit of the same

within a fixed time period subsequent to the completion of financial year.

TNUDF could consider a grading system to categorise ULBs on the basis of quality of

accounting and reporting practices.

6. Create technical standards with specific applicability to municipal projects construction and

execution. These are particularly required in 2 areas:

Integrated road asset creation and management – The quality of road construction

particularly in urban areas is inconsistent ranging from well-laid roads in select areas to

CCP cum BP - Ambattur Municipality 82

poorly designed roads that does not last even a single monsoon season. In this regard CMA

along with the State Highways department should

Standards - Define standards for urban roads construction covering technical

specifications (construction material, equipment use, process for road construction)

Procurement guidelines - Review procurement guidelines for empanelment / selection of

contractors including incentives and penalties to ensure adequate accountability

Showcase project - Identify one major arterial high-density road corridor (typically

maintained by the State Highways department) in all district headquarters for

development in an integrated manner covering strengthening/widening, encroachment

removal, de-bottlenecking through junction improvements and grade separators,

streamlining parking, guidelines for right of way for road users (such as TNEB, BSNL

etc) and aesthetics/signage. Implementation of such projects could potentially have a

demonstration effect and could contribute to widespread replication and adoption.

Flood management and interlinked storm drains – Storm water drains are among the

most expensive assets to be created by ULBs and yet least priority gets accorded to

maintaining storm drains and keeping them clean. Further there is inadequate planning and

sub-optimal drain construction in an isolated manner without a detailed review of

interlinking needs with arterial canals and water bodies. In this regard, we recommend that

TNUIFSL and CMA should considering initiating a technical assistance study at a city

level for all the district headquarters and other flood-prone and coastal towns (such as

Ambattur) in Tamil Nadu in a phased manner to develop a blueprint for an integrated

water and flood management plan covering a) identification of potential water catchment

points (including restoration of water bodies), b) Identify arterial canal networks that need

to be developed/strengthened based on a review of flooding and water flow patterns and

c) specify ward level guidelines for storm water drain construction in terms of linkages

and gradient of local storm water drain construction initiatives.

7. PPPs - It is necessary to encourage a deeper involvement of private sector (beyond financing) in

the areas of design, development and operation of infrastructure. PPPs have been found to be very

effective in addressing efficiency and asset management (through pre-defined service levels and

accountability for operations and maintenance) aspects of infrastructure development. In this

regard,

CMA, GoTN should develop a framework for PPP including specific policies and guidelines

in urban infrastructure and in land development / remunerative projects.

TNUIFSL should provide comprehensive assistance covering necessary capacity building (in

terms of evaluating mechanisms - BOT, SPV etc) and financing for developing projects

through private sector participation.

CMA, GoTN along with TNUIFSL should develop model concessions involving Private

sector in various areas including Solid waste, STP O&M, Maintenance of head works for

water supply, Street light maintenance and remunerative projects

CCP cum BP - Ambattur Municipality 83

8. Initiate formal and independent Information Systems and Security Audits, given the

implemented and ongoing e-governance initiatives of ULBs in Tamil Nadu –

ULBs should be required to establish the practices of an independent system audit to be

conducted annually. This would enable ULBs to establish greater accountability and build in

robust processes for disaster recovery and security of the IT architecture of the ULB

9. Facilitate creation of a formal institutional mechanism to manage functional overlaps

among nodal agencies/state level agencies and the ULB – As described earlier in section 5.4 –

role of other agencies, ULBs shares responsibility for a number of service delivery areas with

other agencies/departments of the state including Department of Town Planning, Department of

Highway, Tamil Nadu Electricity Board, Tamil Nadu Water and Drainage Board, Road Transport

Corporations etc.

In order to overcome the limitations of these overlaps and to enable operation of these

various organs of the state in a coordinated manner, each ULB should be mandated to

facilitate creation of a formal steering committee at the city level comprising of 8-10

officials from all government departments/agencies. This committee could meet regularly

(once every 2-3 months) to discuss and share information on respective projects/areas and

could pave the way for better communication and effective service delivery.

9.3 Suggestions for improving financial performance and collection efficiency

Overall income of Amb-M grew at a 14.5 % CAGR, driven largely by significant growth in

Devolution fund income. Own income of the municipality grew at a moderate 4.4 %, while

expenditure actually declined during the period at a CAGR of – 6.8% due to a steep decline in

operating expenses and finance expenditure. However, this presents only part of the picture. Current

collection efficiencies in property tax and water user charges are abysmally low at 59% and 35%

respectively.

Amb-M’s ability to improve on its financial performance hinges primarily on its ability to sustain and

improve on the revenue growth noticeable in recent years. While there is potential for expenditure

control in certain areas (as in the case of energy costs), the focus of cost management should be to

shift expenditure from administration to better asset management and O&M. The following

paragraphs outline select interventions for improvement of financial and operating performance.

9.3.1 Revenue enhancement

Property tax

Specific recommendations for improving property tax revenue and collections are detailed below.

Recommendations in bold are actions that can be implemented immediately by the municipality

without any significant investment and can enable the municipality to show immediate results

CCP cum BP - Ambattur Municipality 84

Issues Recommended Interventions

Rate of

taxation and

monitoring

1. Implementation of quinquennial ARV revision as recommend by SFC and

removal of distortions in rates wherever existent.

2. Apart from collection efficiency, the ratio of assessments to population

and growth of assessments should also be tracked and monitored at

the highest level.

3. There should be changes instituted to the policy of Vacant Land tax to

introduce steep step up in taxes for vacant land particularly in peri-urban

areas to incentivise development. Vacant land are often prone to abuse in

the form of encroachments, poor maintenance and dumping of garbage.

Therefore an increase in Vacant land tax can be ploughed back for

supporting the costs municipalities often incur in managing and preventing

such abuses.

4. Property tax information of various residential units should be published

online in the same manner as the guideline values that are published

Increasing

assessments

5. Move to GIS-based database to track, update and retrieve property tax

information

6. It should be made compulsory for all new building constructions to

display the building permission details obtained from the municipality

for construction. The municipality should actively encourage its citizens to

report unauthorised buildings construction and should disseminate online

information on action taken on such constructions to dissuade such activity.

Capturing information on unauthorised construction at the initial stages

through such efforts would go a long way in preventing the rampant growth

of unauthorised and unassessed constructions in our towns and cities.

7. Conduct a one-time survey to compile database of properties and initiate

sample checks in all wards on an ongoing basis. The Commissioner

should undertake ‘surprise checks’ on a regular basis in various wards

to provide a sense of enforcement both to the municipal officials and to

citizens for encouraging compliance.

8. Reconcile and link assessment information with building permissions

issued and initiate a drive to bring unassessed properties under the tax

net.

9. Reconcile manual and computerised registers to identify and bring in

left-out assessments into the tax net.

10. Blanket exemptions should be reviewed. Revenue loss due to exemptions

should be compensated by GoTN.

11. A strong coordination between departments within the municipality by

itself bring significant increase in assessment base and collection

efficiency. The Revenue department should reconcile its information across

various databases on households and other commercial properties available

within the municipality. Specific suggestions in this regard are listed below:

o The Property tax database should be regularly updated based on the

status of Building permissions issued by Town Planning department

o Whenever the Engineering department provides water and sewage

CCP cum BP - Ambattur Municipality 85

Issues Recommended Interventions

connections, it should check with the Revenue department for compliance

of those assesses with respect to property tax dues. The water and

sewage assesses databases should be regularly updated and

reconciled with the property tax database.

o Whenever, the Health Department issues D&O and Trade licenses, they

should check on the status of property tax assessment and professional

tax assessment status for these license.

o The D&O licenses and Trade licenses should only be provided for

applicants with a clear property tax assessment status and compliance.

12. E-governance efforts should be undertaken towards creation of an integrated

database that provides for access of information across various departments

would enable effective reconciliation of information.

13. Along with the above internal coordination, Amb-M should also coordinate

with other GoTN departments including TNEB and Commercial taxes

department for improving assessment information. This can be done by

obtaining and reconcile addresses and properties data of such departments

with that of the municipality to identify and update missing data in the

property tax database. Apart from improving property tax assessment, such

cross-department interaction would facilitate mutual benefits and aid

effective working relationships among them.

14. There is a need for greater recognition of effort and contributions to

improvement in assessment increase and collection efficiency.

Municipal officials should be given targets and appreciated with

monetary and non-monetary recognition for contribution.

15. Similarly, the municipal council should be encouraged to contribute to

improvement in collection efficiency. Top 20 default cases in each ward

should be brought to notice of individual council members and Council

members contributing to improvement in collection efficiency could be

recognised through resolutions praising their efforts.

Improving

collection

efficiency

16. Draw a systematic plan for sending demand notices and ensure

despatch of demand notices on time.

17. Conducts ward wise analysis of collection efficiency to focus more on

troublesome wards/ areas.

18. Involve council members and resident welfare associations / NGOs as

pressure groups to act against wilful defaulters.

19. Simplify payment of property tax dues by providing multiple options; a)

payment through banks b) additional facilitation / e-governance counters, c)

mobile vans and door-to-door collection drives, d) online payment option and

e) payment through credit cards etc.

20. Make it compulsory for clearing property tax dues for provision of

water and sewerage connections.

21. Initiate a One-time drive and settlement scheme for arrears.

22. Prepare a list of top100 defaulters and disseminate the information

online and through other media to put pressure on such defaulters.

CCP cum BP - Ambattur Municipality 86

Issues Recommended Interventions

23. Municipalities should be made to report details of Litigation cases on a

quarterly basis to CMA and the actions taken on them. Municipal officials

should be given targets for settlement of litigation cases in a time-bound

manner.

24. Moot creation of a special tribunal for speedy completion of litigation cases.

25. Wherever possible initiate steps for out-of-court settlement to facilitate

speedy clearance of such cases.

26. Make provisions and take steps for writing off bad debts to clear up arrears

history and database

27. Encourage greater accountability among bill collection staff by

introducing targets and incentivise the same by recognition of top

performers.

28. The linking of grants to improvement in collection efficiency as in the case of

JNNURM and UIDSSMT should be institutionalised for receipt of state

government grants too.

Incentivise

on-time

payment

29. Implement Payment Due Date and penalties to incentivise on-time payment

30. Encourage self-disclosure and payment.

Professional Tax

Professional tax has grown at 19% over the last five years and is becoming an important revenue

stream. It is also a visible revenue stream, yet collection efficiency (especially on current demand) has

been only about 82%. Amb-M should improve collection efficiency to more than 95% and should

explore options for enhancing revenues by taking the following steps.

31. Amb-M should focus on widening its professional tax base by bringing more traders and

independent professionals within the ambit of professional tax. Specifically, Amb-M should

consider tapping into databases of potential professional tax assesses including

Professional associations including Institute of Chartered Accountants of India (ICAI), the Bar

Council, Medical Council etc.

Databases of Commercial Taxes Department, GoTN to get details of sales tax registrations

within Amb-M.

Yellow pages and other local commercial directories to identify and bring in more

professionals within the ambit of professional tax.

32. A Targeted approach should be followed to widen the tax base for professional tax. In

particular, the municipality should focus on gathering information on the following groups

that could potentially add to the professional tax assessment base.

Banks (Commercial and Cooperative)

Government Staff

Doctors

Engineers

Surveyors

Contractors

Advocates

Architects

Chartered Accountants (Firms)

Income Tax Practitioners

Computer Hardware Shops

Computer Education Institutes

Medical Shops

Private Companies

CCP cum BP - Ambattur Municipality 87

Business Entities (other than companies)

Stock Broking concerns

Hospitals

Schools and other educational institutions

Cinema Theatres

Clubs

Chit Funds

Pawn Brokers

Laboratories

Internet Browsing Centres

Stockists and Distributors

User charges

With the proposed UGD system in uncovered areas and proposed implementation of the Combined

Water supply scheme, user charges would need increased monitoring and follow-up given their

potential to contribute to Amb-M’s revenue. Specifically Amb-M should

33. Increase penetration of connections for water supply. As of FY 2006, Amb-M has about

17000 connections (including connections in CMWSSB managed wards), which accounts for only

22% of the properties assessed. Amb-M should target to increase this to at least 60 % in the next

5 years progressively going up to 70% in the next decade.

34. Providing water fountains only in areas with a predominantly low income population to

minimise revenue loss.

35. Improve revenue per connection through implementation of either a graded water tariff

scheme (as is being considered by CMA, GoTN) or a metering based tariff. While the

metering based system would a better system in principle (charges on the basis of usage) and in

terms of incentivising water conservation, ULBs have faced resistance in implementation of

metered tariffs. Amb-M could also consider implementation of meter based tariffs through

involvement of Self Help Groups as meter readers.

36. Adopt measures to improve collection efficiency. Amb-M should consider stiff penalties for

non-payment of user charges. Specifically Amb-M should consider implementation of late

payment fines and in case of extreme overdue situations, disconnecting supply.

Recommendations 8-14 given above under Property tax apply for improving collection efficiency

in user charges as well.

Public private partnerships (PPP)

Well-structured PPPs apart from relieving ULBs of some investment burden could also be a potential

revenue enhancement option, particularly in structuring remunerative projects. In particular, Amb-M

could take the following measures.

37. Evaluate PPP options for development of proposed remunerative projects including a)

development of Uzhavar Sandhai and other markets and b) Development of sports complex

38. Actively encourage corporate / NGO partnerships for city beautification and asset

management in areas covering bus stops, street lighting, medians, parks and road

junctions. Given that Ambattur has a number of large industrial houses, Amb-M could encourage

them to adopt specific municipal assets and maintain them as part of Corporate Social

Responsibility.

39. Further Amb-M should also regulate posters and hoardings and outdoor advertising rights

available to it to incentivise maintenance of above mentioned municipal assets by corporates that

depend on outdoor advertising including banks, consumer goods and retail companies.

CCP cum BP - Ambattur Municipality 88

9.3.2 Measures for cost management

Energy efficiency

Amb-M needs to take steps to address its power costs which have shown a steep increase over the last

three years. The following steps are needed in this direction:

40. Amb-M should conduct a comprehensive energy audit to identify areas for reducing power

consumption and related costs.

41. Amb-M should implement automatic time based dimmers on street light network and ensure

that all pumps / motors are energy efficient.

42. A focused study is needed to assess the level of leakages in water supply and to recommend

measures to minimise the same.

CCP cum BP - Ambattur Municipality 89

10. Sustainable financial and operating plan

10.1 Financial and Operating Plan (FoP)– time horizon, basis and assumptions

10.1.1 Time-horizon

The FOP has been prepared for a 20-year period i.e., FY 2008-2027.

10.1.2 Demographic projections

Exhibit 10.1 provides the population projections that form the basis of developing the Capital

Investments and other revenue and cost projections for the municipality.

Exhibit 10.1 Population projections and related estimates - Ambattur town

Unit

Baseline Projected

2007 2012 2017 2027

Population nos 394090 470806 577309 866535

Households nos 97646 117701 144327 216634

Slum population nos 115721 141242 144327 173307

Slum households nos 21480 21480 21480 21480

Assessed Properties nos 79365 103577 132781 199303

Road length km 426 426 494 587

10.1.3 Revenues

Exhibit 10.2 provides details of the assumptions for projecting revenues for Ambattur

Exhibit 10.2 Revenue related assumptions

Segment Revenue driver Basis / Assumptions

Property Tax Baseline property tax / property (2006) Rs. 1505 per year

Growth in tax rate 30% once in 5 years 2008 onwards

Assessments growth Population growth. As per trend

captured in Exhibit 10.1

Professional Tax Baseline tax / assessee (2006) Rs. 1387 per year

Growth in tax rate - 30% every 5 years from 2008

Growth in assessments - Population growth

Water charges Penetration (Connections / properties) Baseline – 22%. Connections growth

assumed to reach 60% by 2013 and

80% by 2027.

Deposit and user charges Connection deposit assumed at Rs.

3000 and Rs. 8000 for household and

commercial connections respectively

and user charges assumed at Rs. 100

per month and Rs. 200 per month for

residential and commercial

connections respectively. Tariffs are

CCP cum BP - Ambattur Municipality 90

Segment Revenue driver Basis / Assumptions

escalated at 5% annually

Sewerage charges Penetration (Connections / properties) Connections growth assumed to

reach 50% by 2011 and 80% by

2027.

Deposit and user charges Connection deposit assumed at Rs.

3000 and Rs. 8000 for household and

commercial connections respectively

and user charges assumed at Rs. 75

per month and Rs. 250 per month for

residential and commercial

connections respectively. Tariffs are

escalated at 5% annually

Devolution Income State sales tax States’ sales tax projections assumed

to grow at 5%. 10% of sales tax

receipts assumed to devolve to ULBs

and to the municipality based on 2001

population base.

Assigned revenue

and other income

Growth over baseline income (2006) 6% growth during projection period

10.1.4 Expenditure

Exhibit 10.2 provides details of the assumptions for projecting expenditures for Ambattur

Exhibit 10.3 Expenditure related assumptions

Segment Revenue driver Basis / Assumptions

Staff Costs Growth over base salary 10% annually

Operating

Expenditure

Existing asset base – Growth on base

O&M expenditure of 2006

Assumed to grow at

5% annually

For new capital investments – O&M has been assumed as a

% of capital costs given in Exhibit 10.4 CIP

Water Supply 3.00%

Sewerage and Sanitation 3.00%

Solid Waste Management 8.00%

Transportation & Street lighting 20.00%

Urban services for poor 2.00%

Others 2.00% Administrative

expenditure

Growth over average base expenditure

during 2002-06 4%

Interest

expenditure Refer section 10.1.6 below.

CCP cum BP - Ambattur Municipality 91

10.1.5 Assets

The addition to assets is as per the Capital Investment Plan given below

Exhibit 10.4 Capital Investment Plan

10.1.6 Liabilities

The Financial and Operating Plan allows for 3 types of loan – short, medium and long term. The

assumptions relating to loans are given below:

Exhibit 10.5 Loan related assumptions

Segment Type of loan

Water Supply Medium term

Sewerage and Sanitation Long term

SWM Medium term

Lighting Short term

Urban Services to poor Long term

Others Medium term

Type of loan Tenure years

Moratorium years

Interest rate %

Long 20 5 9

Medium 10 3 10.5

Short 8 2 10.5

10.2 Estimation of borrowing capacity and investment capacity

We have arrived at the borrowing capacity based on the Income and expenditure projections including

debt servicing of existing loans as of FY ending 2005. We have arrived at the borrowing capacity of

Ambattur as the minimum of

NPV of 30% of revenue projections and

NPV of 50% of operating Surplus projections.

Segment Outlay Phasing

2008 2009 2010 2011 2012 2013-17 2018-27

Water Supply - Project 12500 0 4167 4167 4167 0 0 0

Water Supply - Balance 6008 0 0 50 50 50 656 5202

Sewerage & Sanitation - Project 15000 0 5000 5000 5000 0 0 0

Sewerage & Sanitation - Net 11848 448 1368 1368 820 820 2480 4545

SWM 4457 0 823 1053 180 0 1342 1058

Transportation and Street lighting 20490 0 2149 2149 2149 46 2244 11754

Urban services for poor 25927 158 158 158 0 4242 21210 0

Others 2547 147 100 230 205 75 830 960

TOTAL 98776 753 13765 14175 12571 5233 28762 23518

CCP cum BP - Ambattur Municipality 92

10.3 Project specific cash flows

As part of the FoP, we have also prepared project specific cash flow projections for the proposed

water supply and underground drainage projects, apart from consolidated financial projections. A

summary of the assumptions and the computations for water supply and Underground drainage

scheme is enclosed below:

10.3.1 Water Supply

Based on preliminary information available we evaluated the financial viability and potential returns

(measured by DSCR and DS/TR) for the comprehensive water supply scheme in Amb-M. Data and

underlying assumptions into the model are listed below:

a) Project Scope: Comprehensive water supply covering all wards to provide residential and

commercial house service connections. The project is to be completed during 2009-11.

b) Investment assumed at Rs. 125 crore. This is based on the estimates provided to Amb-M by

CMWSSB which is in the process of preparing the DPR for the project. We do not have access to the

DPR and project components of the project and this is a preliminary estimate arrived at based on our

assessment and discussions with Amb-M. Capital structure is assumed at 50% debt, 20% Equity and

30% Grant. Debt assumed to be for 20 years (5 year moratorium) and 10% interest rate.

c) Residential user charge realization and connection deposits assumed at Rs. 100 per month and

Rs. 3000 initially escalated at 5 % and 2% annually respectively. Commercial user charge

realization and connection deposits assumed at Rs. 200 per month and Rs. 8000 initially escalated at

5% and 2% annually respectively. In addition, 50% of the property tax allocated to water supply and

drainage account (20% of total property tax assumed to be allocated to water supply and drainage

account) is assumed to be available for debt servicing and O&M for the project.

d) Connections are assumed to increase to 42,726 by 2012 and to 1, 19,582 by 2027 for the whole of

Amb-M. Of this only 75% connections are assumed to accrue revenues to Amb-M considering that 12

wards are being managed by CMWSSB.

e) O&M costs are assumed at 3% of capital costs with a 5% annual escalation and bulk water would

be supplied to the concessionaire at Rs. 4.5 per KL by CMWSSB. This is in addition to the base

O&M costs and has been assumed to increase at 5% annually during the projection period.

Results

The cash flows based on the above assumptions translate to an average DSCR of 1.18 and average

DS/TR of 25%. TE/TR for the project works out to about 38.35%. However, Amb-M would need to

substantially improve its connection penetration (currently at 22%) and its collection efficiency in

order to service the debt on the project. The debt servicing under the above conditions is extremely

sensitive to both these parameters.

CCP cum BP - Ambattur Municipality 93

10.3.2 Underground Drainage scheme

Based on preliminary information available we evaluated the financial viability and potential returns

(measured by DSCR and DS/TR) for the comprehensive Underground Drainage scheme in Amb-M.

Data and underlying assumptions into the model are listed below:

a) Project Scope: Comprehensive Underground Drainage scheme covering all wards to provide

residential and commercial house service connections. The project is expected to be completed during

a three year period from 2009-11.

b) Investment assumed at Rs. 150 crore. This is based on the estimates provided to Amb-M by

CMWSSB which is in the process of preparing the DPR for the project. Capital structure is assumed

at 50% debt, 20% Equity and 30% Grant (under JNNURM). Debt assumed to be for 20 years (with a

5 year moratorium) and 10% interest rate.

c) Residential user charge realization and connection deposits assumed at Rs. 75 per month and

Rs. 3000 initially escalated at 5 % and 2% annually respectively. Commercial user charge

realization and connection deposits assumed at Rs. 250 per month and Rs. 8000 initially escalated at

5% and 2% annually respectively. In addition, 50% of the property tax allocated to water supply and

drainage account (20% of total property tax assumed to be allocated to water supply and drainage

account) is assumed to be available for debt servicing and O&M for the project.

d) Connections are assumed to increase to 46,610 by 2012 and to 1, 19,582 by 2027. Of this only

75% connections are assumed to accrue revenues to Amb-M considering that 11 wards are being

managed by CMWSSB.

e) O&M costs are assumed at 3% of capital costs with a 5% annual escalation. This is in addition to

the base O&M costs that are incurred currently and have been assumed to increase at 5% annually

during the projection period.

Results

The cash flows based on the above assumptions translate to an average DSCR of 1.28 and average

DS/TR of 43%. TE/TR for the project works out to about 54.78%. However, Amb-M would need to

substantially improve its connection penetration and its collection efficiency in order to service the

debt on the project. The debt servicing under the above conditions is extremely sensitive to both these

parameters.

10.4 Possible financing mix for achieving full investments

Based on these criteria, the borrowing capacity of Ambattur works out to Rs. 33,070 lakh. At an

aggregate level, assuming loans to be equivalent to 50% of investment, sustainable investment

capacity works out to Rs. 66,141 lakh, which translates to about 67 % of the total investment

requirement (including slum rehabilitation).

CCP cum BP - Ambattur Municipality 94

If we exclude slum rehabilitation and urban services for poor projects which are largely grant funded,

the borrowing capacity translates to 91% of the total investment requirement. Hence Amb-M is well

placed to meet its capital investment requirements. Exhibit 10.6 provides a possible financing mix.

Exhibit 10.6 Possible financing mix

Segment

Outlay

Suggested Financing % Sustainable structure

Loan Grant/Private Own Loan Grant Own/Private

Water Supply - Project 12500 50% 20% 30% 6,250 2,500 3,750

Water Supply - Net 6008 30% 40% 30% 1,802 2,403 1,802

Sewerage & Sanitation - Project 15000 50% 17% 33% 7,500 2,501 5,000

Sewerage & Sanitation - Net 11848 30% 40% 30% 3,554 4,739 3,554

SWM 4457 40% 30% 30% 1,783 1,337 1,337

Transportation and Street lighting 20490 30% 40% 30% 6,147 8,196 6,147

Urban services for poor 25927 0% 80% 20% - 20,742 5,185

Others 2547 0% 90% 10% - 2,292 255

TOTAL 98776 27% 45% 27% 27,036 44,710 27,030

10.5 Financial and Operating Plan

Exhibit 10.7 below provides a summary of the financial projections for 10 years.

Exhibit 10.7 FOP projections

FY ending

Actual Estd. Projections

2006 2007 2008 2009 2010 2011 2012 2012 2014 2015 2016 2017

INCOME

Own income 2,030 2,217 2,800 2,913 3,027 4,498 5,213 6,888 7,261 7,802 8,627 8,551

Property Tax 1,184 1,305 1,756 1,815 1,875 1,935 2,026 2,879 3,003 3,128 3,252 3,377

Profession Tax 242 273 368 380 393 405 424 692 722 752 782 812

Water Charges 102 113 124 136 150 870 1,017 1,343 1,444 1,624 2,071 1,861

Sewerage Charges - - - - - 648 1,073 1,269 1,351 1,520 1,704 1,644

Service charges/fees 165 173 182 191 200 210 221 232 243 255 268 282

Other Income 337 354 372 390 410 430 452 474 498 523 549 576

Assigned Revenue 960 1,018 1,079 1,143 1,212 1,285 1,362 1,443 1,530 1,622 1,719 1,822

Devolution Fund 1,101 1,206 1,326 1,456 1,586 1,727 1,890 2,068 2,264 2,477 2,711 2,967

Total Income 4,091 4,441 5,205 5,512 5,825 7,510 8,465 10,400 11,055 11,901 13,057 13,340

Expenditure Salaries 504 554 610 671 738 812 893 982 1,080 1,188 1,307 1,438

Operations 577 606 658 1,242 1,304 2,078 1,797 1,996 2,101 2,217 2,344 2,483

Programme 179 24 25 25 26 26 27 28 28 29 29 30

Administrative 183 180 187 193 200 207 215 223 231 239 247 256

Finance 174 83 82 648 1,281 1,914 2,196 2,490 2,797 3,037 3,212 3,323

Total Expenditure 1,623 1,766 1,904 3,555 4,771 6,656 6,911 7,683 8,383 9,037 9,647 10,219

Surplus 2,468 2,675 3,301 1,957 1,054 854 1,555 2,718 2,672 2,865 3,410 3,121

CCP cum BP - Ambattur Municipality 95

10.5.1 Summary

Exhibit 10.8 below provides a summary of the results of the Financial and Operating Plan.

Exhibit 10.8 FOP summary

Estd. Revenues – FY 2008 (Rs. Lakh) 5,205

Estd. Revenues – FY 2016 (Rs. Lakh) 13,057

Estd. Revenues - FY 2027 (Rs. Lakh) 31,434

Revenue CAGR % - FY 2008-17 11.0%

Revenue CAGR % - FY 2008-27 9.9%

Average TE (excluding depreciation)/TR (%) 53%

Average DS/TR (%) 29%

Average DSCR 1.88

Borrowing Capacity 33070

Investment Requirement 98,776

Investment Capacity (at 50% loan) 66,141

IC/IR (including Urban Service for Poor) 67%

IC/IR (without USP investment) 91%

CCP cum BP - Ambattur Municipality 96

For information about this report, please contact:

ICRA Management Consulting Services Ltd

Building No. 8,

2nd Floor, Tower - A,

DLF Cyber City, Phase - II,

Gurgaon - 122002

Ph: 91 124 4545 800

Fax: 91 124 4545 850

Disclaimer: The report is based on information collected by IMaCS from sources believed to be

reliable. While all reasonable care has been taken to ensure that the information contained herein

is not untrue or misleading, IMaCS is not responsible for any losses that the client may incur

from the use of this report or its contents. The assessment is based on information that is currently

available and is liable to change. The analysis that follows should not be construed to be a credit

rating assigned by ICRA’s Rating Division for any of the company’s debt instruments. IMaCS is

not a legal firm and our advice/recommendations should not be construed as legal advice on any

issue.


Recommended