Page 1
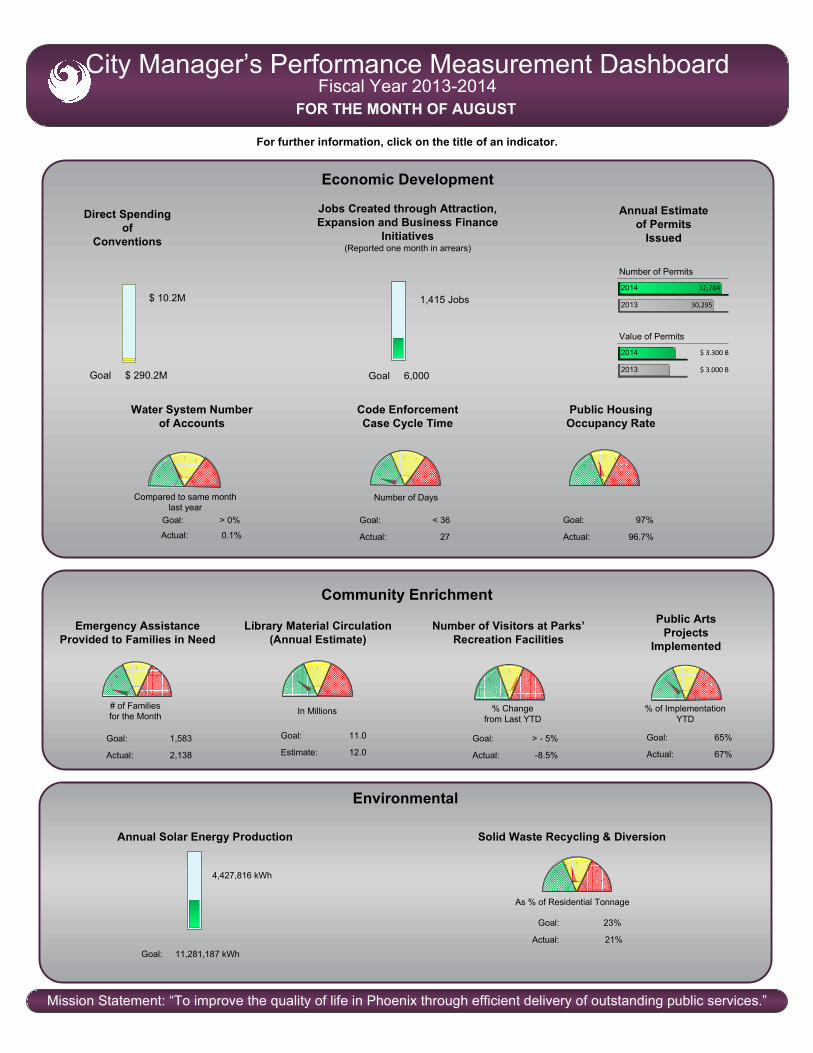
City Manager’s Performance Measurement Dashboard
FOR THE MONTH OF AUGUST
Mission Statement: “To improve the quality of life in Phoenix through efficient delivery of outstanding public services.”
Fiscal Year 2013 - 2014
Actual: -0.07%
Goal: > - 1.9%
Actual: -0.3%
Goal: > - 1.9%
Sr Lien Airport Revenue
AA-
Jr Lien Water Revenue
AAA
Sr Lien Excise Tax Revenue
AAA
General Obligation
AAA
General Government
General Fund
Operating Expenditures
Total General
Fund Revenue
(Reported one month in arrears)
General Fund
City Sales Tax
(Reported one month in arrears)
Innovation & Efficiency
Savings
Bond Ratings
(S&P)
Phoenix is a Good Place
to Live
As % of Estimate As % of EstimateAs % of Estimate
93%
Since FY 2011
$ 76.7M
Actual: -1.8%
Goal: < 0%
Public Safety & Criminal Justice
Paramedic
Response Times
UCR Part I Crime StatisticsMunicipal Court Case
Load Clearance Rate
Actual: 100%
Goal: 100%
Actual: 99%
Goal: 90%
% within 9 Minutes
713
1,021
Part I Violent Crime Thru
July
FY13/14
3-yr avg
FY13/14
3-yr avg
Goal: Crime below 3-yr avg
Transportation
Commercial Aircraft
Passengers(Reported one month in arrears)
Street Maintenance
Rapid Response Rate
Actual: 100%
Goal: 95%
Response within 24 Hours
3.5759 M
3.4820 M
YTD through July
3.5759 M
3.4820 M
Month of July
2014
2013
2014
2013
For further information, click on the title of an indicator.
FOR THE MONTH OF AUGUST
Number of Positions by
Fiscal Year (in 000s)
Full Time Employees
per 1,000 Residents
9
10
11
12
13
FY 91 FY01 FY 11 FY 13 FY14
13
14
15
16
17
18
FY10 FY 11 FY 12 FY 13 FY 14
Compared to Prior YTD Compared to Prior YTD
Actual: 2.4%
Goal: > 0%
Ridership
Light RailBus
Actual: -0.3%
Goal: > 0%
FY13/143-yr avg 5,928
6,164
Total Part I Crime Thru
July
5,215
5,143
Part I Property Crime Thru
July
Goal: $ 100M
Page 2
FOR THE MONTH OF AUGUST
Mission Statement: “To improve the quality of life in Phoenix through efficient delivery of outstanding public services.”
City Manager’s Performance Measurement Dashboard
FOR THE MONTH OF AUGUST
Fiscal Year 2013-2014
Actual: 96.7%
Goal: 97%
Actual: 27
Goal: < 36
$ 10.2M
Goal $ 290.2M Goal 6,000
1,415 Jobs
2013 $ 3.000 B
2014 $ 3.300 B
Value of Permits
2013 30,295
2014 32,784
Number of Permits
Economic Development
Public Housing
Occupancy Rate
Code Enforcement
Case Cycle Time
Direct Spending
of
Conventions
Annual Estimate
of Permits
Issued
Jobs Created through Attraction,
Expansion and Business Finance
Initiatives(Reported one month in arrears)
Number of Days
Water System Number
of Accounts
Actual: 0.1%
Estimate: 12.0
Goal: 11.0
Public Arts
Projects
Implemented
Library Material Circulation
(Annual Estimate)
Number of Visitors at Parks’
Recreation Facilities
Emergency Assistance
Provided to Families in Need
Actual: -8.5%
Goal: > - 5%
Actual: 2,138
Goal: 1,583
Actual: 67%
Goal: 65%
In Millions % Change from Last YTD
# of Familiesfor the Month
% of ImplementationYTD
Community Enrichment
Environmental
Annual Solar Energy Production Solid Waste Recycling & Diversion
4,427,816 kWh
For further information, click on the title of an indicator.
Goal: 11,281,187 kWh
Actual: 21%
Goal: 23%
As % of Residential Tonnage
Goal: > 0%
Compared to same monthlast year
Page 3
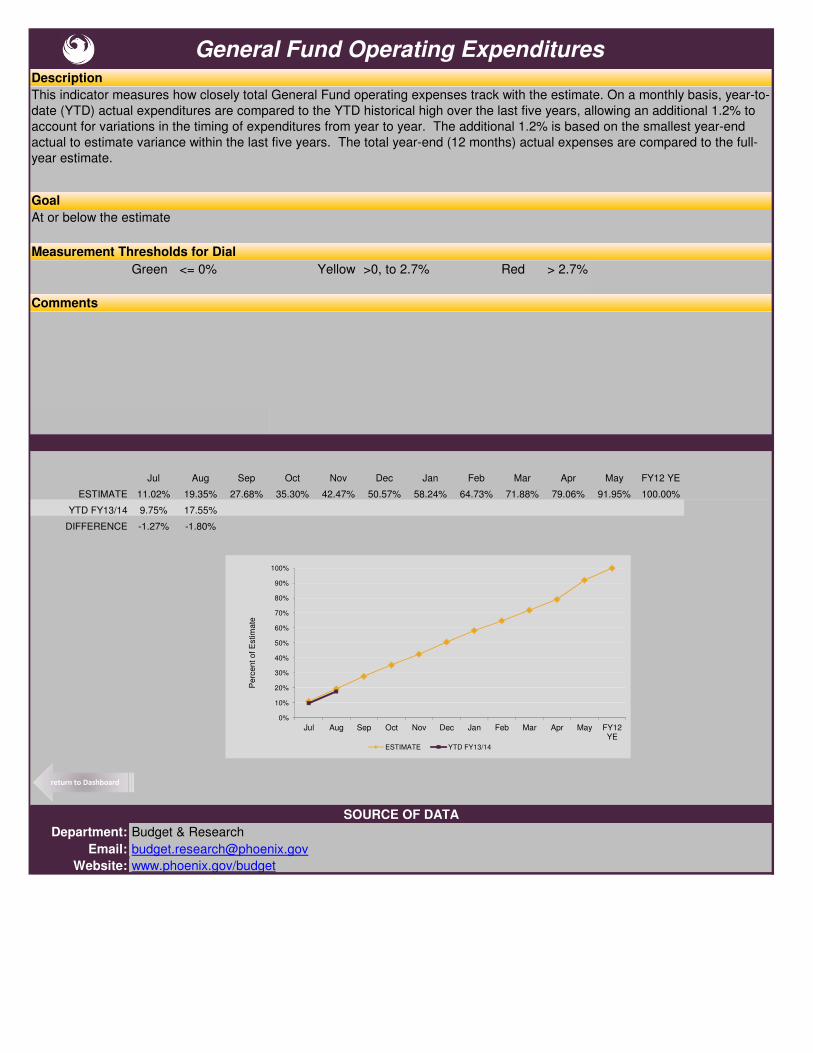
Green <= 0% Yellow >0, to 2.7% Red > 2.7%
Jul Aug Sep Oct Nov Dec Jan Feb Mar Apr May FY12 YE
ESTIMATE 11.02% 19.35% 27.68% 35.30% 42.47% 50.57% 58.24% 64.73% 71.88% 79.06% 91.95% 100.00%
YTD FY13/14 9.75% 17.55%
DIFFERENCE -1.27% -1.80%
Department: Budget & Research
Email: [email protected]
Website: www.phoenix.gov/budget
General Fund Operating ExpendituresDescription
Goal
Measurement Thresholds for Dial
Comments
SOURCE OF DATA
At or below the estimate
This indicator measures how closely total General Fund operating expenses track with the estimate. On a monthly basis, year-to-
date (YTD) actual expenditures are compared to the YTD historical high over the last five years, allowing an additional 1.2% to
account for variations in the timing of expenditures from year to year. The additional 1.2% is based on the smallest year-end
actual to estimate variance within the last five years. The total year-end (12 months) actual expenses are compared to the full-
year estimate.
0%
10%
20%
30%
40%
50%
60%
70%
80%
90%
100%
Jul Aug Sep Oct Nov Dec Jan Feb Mar Apr May FY12
YE
Perc
ent of
Estim
ate
ESTIMATE YTD FY13/14
return to Dashboard
Page 4
Green > -1.9% Yellow -2% to -4.5% Red < -4.5%
Jul Aug Sep Oct Nov Dec Jan Feb Mar Apr May Jun
YTD FY12/13 -4.5% -3.5% -4.4% -4.4% -3.9% -3.9% 0.0% -0.2% -1.1% -1.8% -1.7% -1.3%
YTD FY13/14 -0.3%
Department: Budget & Research
Email: [email protected]
Website: www.phoenix.gov/budget
SOURCE OF DATA
General Fund City Sales Tax
City Sales Tax is the single largest source of General Fund revenue, accounting for more than 40 percent of the total. This
indicator measures how closely General Fund City Sales Tax revenue tracks with the estimate. Estimates are developed
during the budget preparation process each fiscal year and may be adjusted during the fiscal year depending on actual
collections and other economic considerations.
At or above -1.9% of the estimate
Description
Goal
Measurement Thresholds for Dial
Comments
Monthly revenues are reported mid-month, therefore total GF reporting will be one month behind. City sales tax can be
somewhat volatile and is affected by monthly adjustments from year to year. Although the current year-to-date actual revenue
is behind the pace needed for the full-year and the estimate may need to be adjusted, sales tax revenue for the full year may
meet projections. Revenues are closely monitored, and spending levels may be reduced to ensure expenses do not exceed
revenue.
-10%
-8%
-5%
-3%
0%
3%
5%
8%
10%
Jul Aug Sep Oct Nov Dec Jan Feb Mar Apr May Jun
Perc
ent of
Estim
ate
YTD FY13/14 YTD FY12/13
return to Dashboard
Page 5
Green > -1.9% Yellow -2% to -2.4% Red < -2.5%
Jul Aug Sep Oct Nov Dec Jan Feb Mar Apr May FY12 YE
3-Year Avg 5.5% 13.7% 20.5% 28.6% 39.1% 48.1% 56.9% 64.2% 71.6% 79.8% 89.8% 100.00%
YTD FY13/14 5.4%
DIFFERENCE -0.1%
Department: Budget & Research
Email: [email protected]
Website: www.phoenix.gov/budget
Total General Fund Revenue
An accurate revenue estimate is crucial to achieving a balanced budget. This indicator measures how closely Total General
Fund revenue tracks with the estimate. On a monthly basis, year-to-date (YTD) actual revenue is compared to a three-year
historical YTD average. The total year-end actual revenue is compared to the full-year estimate.
At or above -1.9% of the estimate
SOURCE OF DATA
Description
Goal
Measurement Thresholds for Dial
Comments
Monthly revenues are reported mid-month, therefore total GF reporting will be one month behind.
0%
10%
20%
30%
40%
50%
60%
70%
80%
90%
100%
Jul Aug Sep Oct Nov Dec Jan Feb Mar Apr May FY12
YE
Perc
ent of
Estim
ate
3-Year Avg YTD FY13/14
return to Dashboard
Page 6
Savings:
FY2014 YTD $10.808 M
Since FY 2011 $76.713 M
Department: Budget & Research
Email: [email protected]
Website: www.phoenix.gov/budget
The City is committed to continuous innovation and efficiency efforts. These initiatives reduce costs and help provide the best
possible services, by optimizing the use of resources, while maintaining the lowest costs to the community.
Innovation & EfficiencyDescription
Comments
Prior year savings reflect departmental updates for projects spanning multiple years.
SOURCE OF DATA
For additional information please visit Phoenix Innovation and Efficiency at
phoenix.gov/citygovernment/efficiency
return to Dashboard
Page 7
Bond: Rating:
General Obligation AAA
Senior Lien Excise Tax Revenue AAA
Junior Lien Water Revenue AAA
Senior Lien Airport Revenue AA-
For additional information please visit City of Phoenix Investor Information at
http://www.phoenix.gov/webcms/groups/internet/@inter/@dept/@fin/documents/web_content/079277.pdf
Department: Finance
Email: [email protected]
Website: www.phoenix.gov/finance
Bond RatingsDescription
The City seeks to maintain high bond ratings. A high bond rating means the City has a strong capacity to meet its financial
commitments, which translates to lower interest rates and savings to City taxpayers.
SOURCE OF DATA
Comments (if, any):
return to Dashboard
Page 8
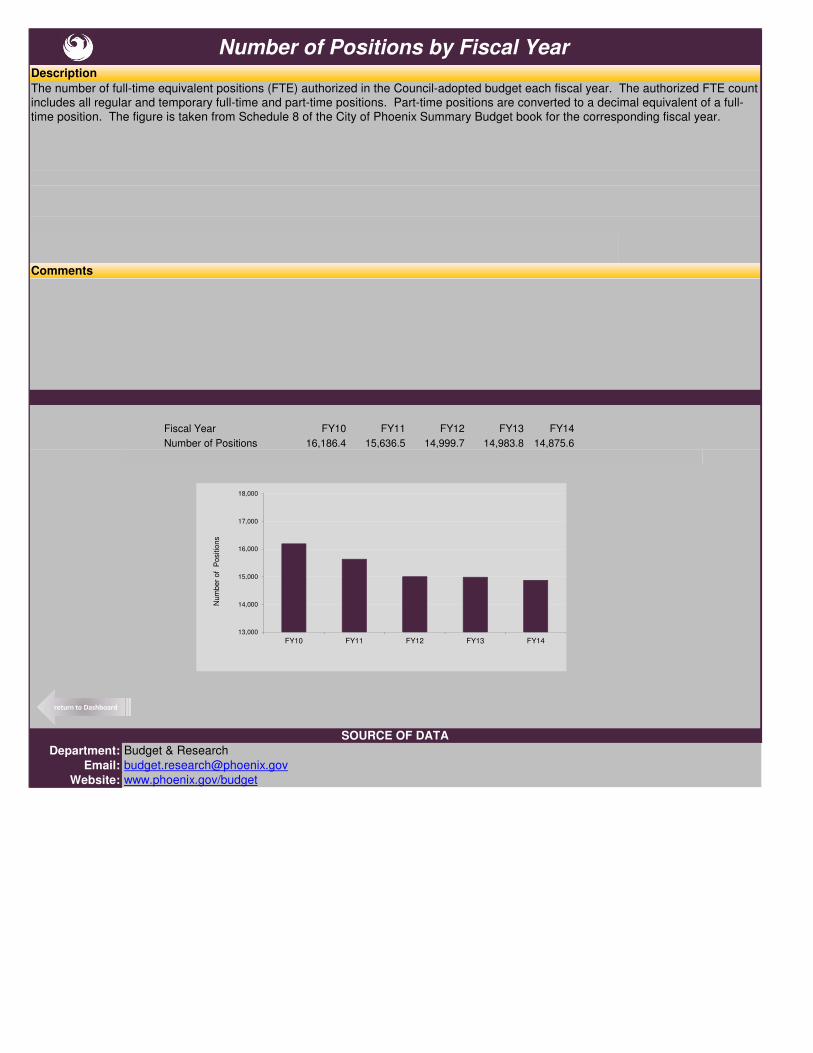
Fiscal Year FY10 FY11 FY12 FY13 FY14
Number of Positions 16,186.4 15,636.5 14,999.7 14,983.8 14,875.6
Department: Budget & Research
Email: [email protected]
Website: www.phoenix.gov/budget
SOURCE OF DATA
Number of Positions by Fiscal Year
The number of full-time equivalent positions (FTE) authorized in the Council-adopted budget each fiscal year. The authorized FTE count
includes all regular and temporary full-time and part-time positions. Part-time positions are converted to a decimal equivalent of a full-
time position. The figure is taken from Schedule 8 of the City of Phoenix Summary Budget book for the corresponding fiscal year.
Description
Comments
13,000
14,000
15,000
16,000
17,000
18,000
FY10 FY11 FY12 FY13 FY14
Num
ber
of P
ositio
ns
return to Dashboard
Page 9
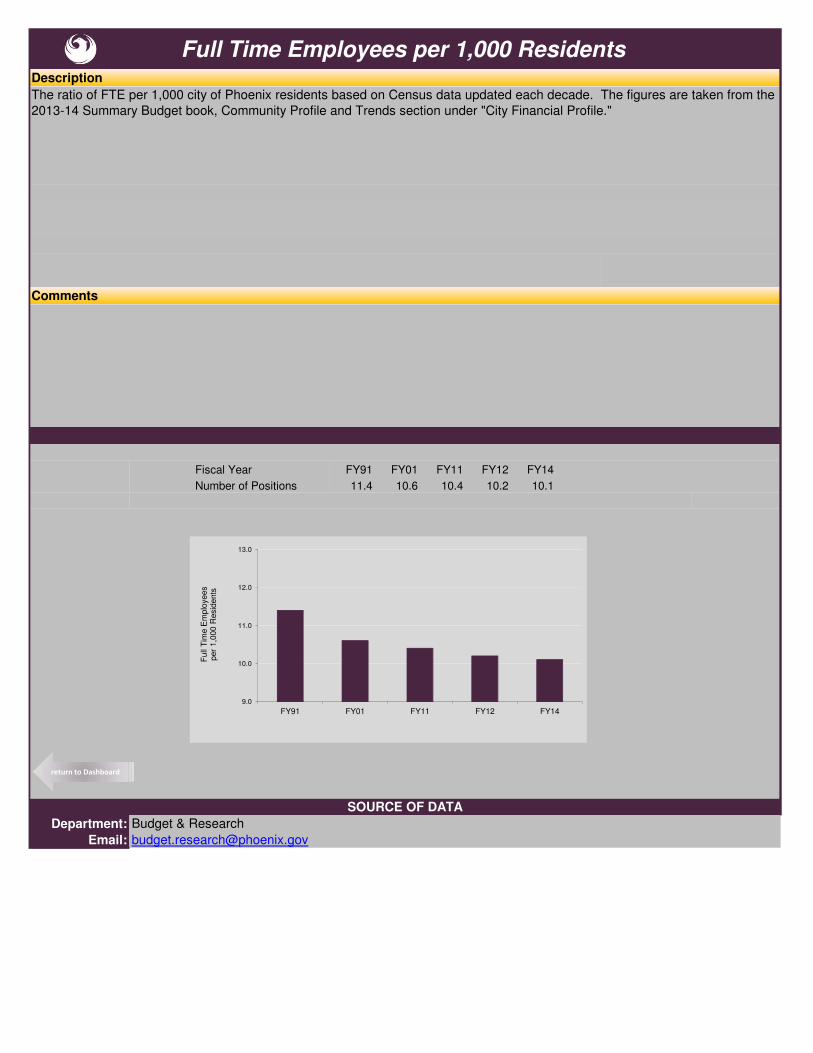
Fiscal Year FY91 FY01 FY11 FY12 FY14
Number of Positions 11.4 10.6 10.4 10.2 10.1
Department: Budget & Research
Email: [email protected]
Comments
SOURCE OF DATA
Full Time Employees per 1,000 ResidentsDescription
The ratio of FTE per 1,000 city of Phoenix residents based on Census data updated each decade. The figures are taken from the
2013-14 Summary Budget book, Community Profile and Trends section under "City Financial Profile."
9.0
10.0
11.0
12.0
13.0
FY91 FY01 FY11 FY12 FY14
Full T
ime E
mplo
yees
per
1,0
00 R
esid
ents
return to Dashboard
Page 10
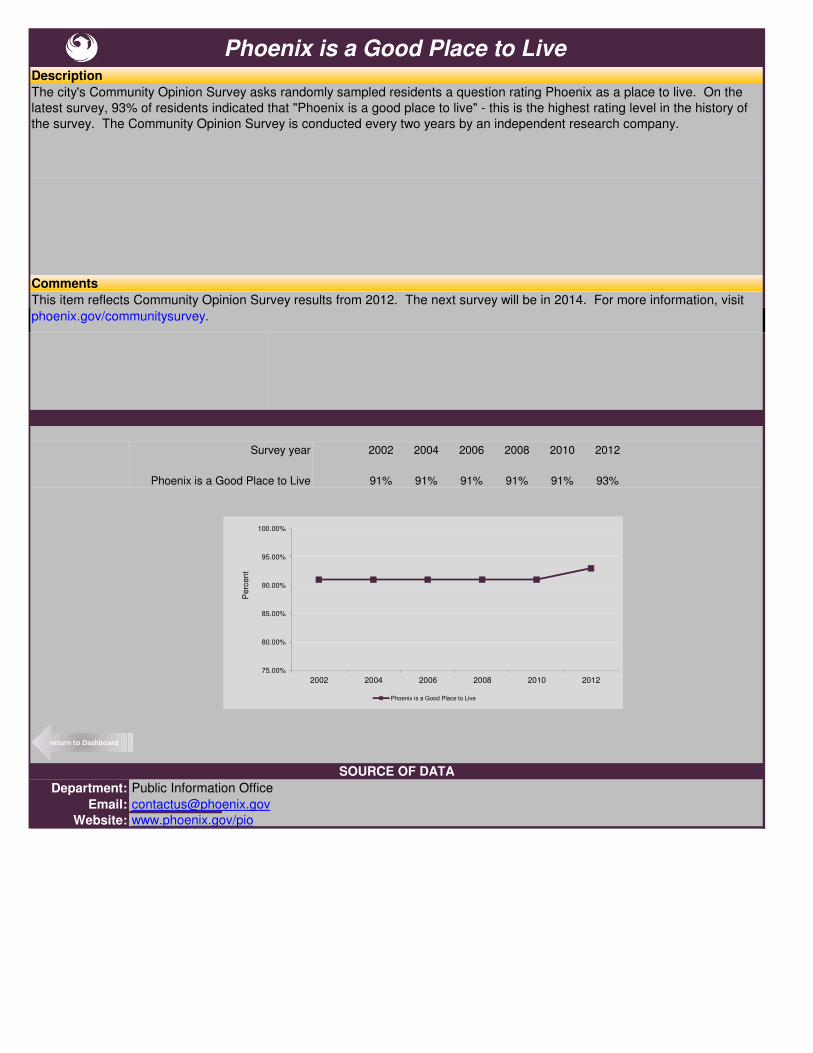
phoenix.gov/communitysurvey.
Survey year 2002 2004 2006 2008 2010 2012
Phoenix is a Good Place to Live 91% 91% 91% 91% 91% 93%
Department: Public Information Office
Email: [email protected]
Website: www.phoenix.gov/pio
Phoenix is a Good Place to Live
The city's Community Opinion Survey asks randomly sampled residents a question rating Phoenix as a place to live. On the
latest survey, 93% of residents indicated that "Phoenix is a good place to live" - this is the highest rating level in the history of
the survey. The Community Opinion Survey is conducted every two years by an independent research company.
SOURCE OF DATA
Description
Comments
This item reflects Community Opinion Survey results from 2012. The next survey will be in 2014. For more information, visit
return to Dashboard
75.00%
80.00%
85.00%
90.00%
95.00%
100.00%
2002 2004 2006 2008 2010 2012
Perc
ent
Phoenix is a Good Place to Live
Page 11
Green > 90% Yellow 85% to 90% Red < 85%
Jul Aug Sep Oct Nov Dec Jan Feb Mar Apr May Jun YTD
FY 12/13 98.40% 98.26% 98.37% 98.44% 98.28% 98.08% 98.16% 98.27% 98.31% 97.78% 98.12% 98.03% 98.21%
FY 13/14 98.40% 98.60% 98.50%
Department: Fire
Email: [email protected]
Website: www.phoenix.gov/fire
SOURCE OF DATA
Comments
Paramedic Response Times
The City is committed to providing appropriate paramedic resources to comply with national standards. This
measure tracks paramedic response times with an arrival goal of nine minutes or less.
90% within 9 minutes or less
Description
Goal
Measurement Thresholds for Dial
85%
90%
95%
100%
Jul Aug Sep Oct Nov Dec Jan Feb Mar Apr May Jun
Perc
ent
within
9 m
inute
s
FY 12/13 FY 13/14
return to
Dashboard
Page 12
Jul Aug Sep Oct Nov Dec Jan Feb Mar Apr May Jun
3-Year Avg 5,928 6,086 5,996 6,237 6,046 6,332 6,321 5,296 5,830 5,690 5,738 5,929
FY13/14 6,164
Department: Police
Email: [email protected]
Website: www.phoenix.gov/police
Comments
SOURCE OF DATA
UCR Part I Crime StatisticsDescription
The City is committed to reducing crime and enhancing community safety. This measure compares monthly Uniform Crime
Reporting (UCR) Part I crime totals to the three-year average of Part I crimes reported for that month. Part I crime statistics
represent the combined sum of UCR Violent Crime and UCR Property Crime totals.
Crime statistics reported by the Phoenix Police Department conform to the Federal Bureau of Investigation’s (FBI) UCR
guidelines. The UCR standard is the most widely used crime statistics source for examining trends in serious crimes reported
to law enforcement. More information about the UCR Program can be found at www.fbi.gov.
Goal
Crime below 3-year avg
0
1,000
2,000
3,000
4,000
5,000
6,000
7,000
Jul Aug Sep Oct Nov Dec Jan Feb Mar Apr May Jun
Num
ber
of P
ropert
y C
rim
es
3-Year Avg FY13/14
return to Dashboard
Page 13
Jul Aug Sep Oct Nov Dec Jan Feb Mar Apr May Jun
3-Year Avg 5,215 5,335 5,267 5,460 5,310 5,573 5,594 4,667 5,017 4,859 4,889 5,093
FY13/14 5,143
Department: Police
Email: [email protected]
Website: www.phoenix.gov/police
FY 13/14: July 2013
SOURCE OF DATA
Comments
Crime Statistics - Property Crimes
The City is committed to reducing crime and enhancing community safety. This measure compares monthly UCR Property
Crime totals to the three-year average of property crimes reported for that month. UCR Property Crime is comprised of the
following four offense classifications: Burglary, Larceny/Theft, Motor Vehicle Theft, and Arson. In terms of overall volume,
Property Crime generally accounts for more than 80 percent of the total UCR Part I crime statistics.
Crime below 3-year avg
Description
Goal
0
1,000
2,000
3,000
4,000
5,000
6,000
7,000
Jul Aug Sep Oct Nov Dec Jan Feb Mar Apr May Jun
Num
ber
of P
ropert
y C
rim
es
3-Year Avg FY13/14
return to Dashboard
Page 14
Jul Aug Sep Oct Nov Dec Jan Feb Mar Apr May Jun
3-Year Avg 713 751 729 776 736 759 727 629 813 831 849 836
FY13/14 1,021
Department: Police
Email: [email protected]
Website: www.phoenix.gov/police
FY 13/14: July 2013.
2009-10 was a historically low year for Phoenix and the last few years have shown increases from that historic low. Violent
crime trends are being closely monitored and evaluated, and enforcement efforts directed based on patterns identified, with
specific efforts focused on targeting the crime types showing increases.
Comments
SOURCE OF DATA
Crime Statistics - Violent Crimes
The City is committed to reducing crime and enhancing community safety. This measure compares monthly UCR Violent
Crime totals to the three-year average of violent crimes reported for that month. UCR Violent Crime is comprised of the
following four offense classifications: Murder/Non-negligent manslaughter, Forcible Rape, Robbery, and Aggravated Assault. In
terms of overall volume, Violent Crime generally accounts for less than 20 percent of the total UCR Part I crime statistics.
Crime below 3-year avg
Description
Goal
0
1,000
2,000
3,000
4,000
5,000
6,000
7,000
Jul Aug Sep Oct Nov Dec Jan Feb Mar Apr May Jun
Num
ber
of V
iole
nt
Crim
es
3-Year Avg FY13/14
return to Dashboard
Page 15
Green > 90% Yellow 80% to 90% Red < 80%
Jul Aug Sep Oct Nov Dec Jan Feb Mar Apr May Jun YTD
FY 12/13 105.0% 100.5% 99.3% 104.8% 102.9% 98.6% 97.6% 94.3% 97.7% 102.3% 103.1% 99.6% 100.5%
FY 13/14 104.5% 97.0% 100.0%
Department: Municpal Court
Email: [email protected]
Website: www.phoenix.gov/court
SOURCE OF DATA
Municipal Court Case Load Clearance Rate
The Phoenix Municipal Court provides equal access to justice, professional and impartial treatment, and the fair
and timely resolution of all court matters. This measure tracks caseload clearance rates.
Clearance rate of 100%
Description
Goal
Measurement Thresholds for Dial
Comments
60.00%
70.00%
80.00%
90.00%
100.00%
110.00%
Jul Aug Sep Oct Nov Dec Jan Feb Mar Apr May Jun
Perc
ent
of
Outg
oin
g C
ases
FY 12/13 FY 13/14
return to
Dashboard
Page 16
Green > 0% Yellow 0% to -5% Red < -5%
In Millions Jul Aug Sep Oct Nov Dec Jan Feb Mar Apr May Jun YTD
FY 12/13 2.773 3.446 3.368 3.816 3.434 3.184 3.364 3.290 3.350 3.441 3.335 2.772 39.573
FY 12/13 YTD 2.773 6.219 9.587 13.403 16.837 20.021 23.385 26.675 30.025 33.466 36.801 39.573
FY 13/14 2.807 3.394 6.201
FY 13/14 YTD 2.807 6.201
YTD % Change 1.2% -0.3%
Department: Public Transit
Email: [email protected]
Website: www.phoenix.gov/publictransit
Ridership - BusDescription
Goal
Measurement Thresholds for Dial
Comments
Ridership = number of boardings. Light Rail includes Phoenix portion of all Light Rail boardings. Bus includes Phoenix
contracted bus, includes circulators, excludes Dial-A-Ride (DAR) and excludes Reserve-A-Ride (RAR). Ridership reporting for
the new 19C connector begins March 2013. This is the third month to include the 19C connector into the bus rider total,
adding an additional 112,570 riders.
The city strives toward improving and expanding quality transit services for residents. This measure tracks bus ridership
through the number of passenger boardings.
SOURCE OF DATA
0% decrease compared to same month prior year.
1.0
2.0
3.0
4.0
Jul Aug Sep Oct Nov Dec Jan Feb Mar Apr May Jun
Board
ing
s
(in m
illions)
FY 12/13 FY 13/14return to Dashboard
Page 17
Green > 0% Yellow 0% to -5% Red < -5%
In Millions Jul Aug Sep Oct Nov Dec Jan Feb Mar Apr May Jun YTD
FY 12/13 0.635 0.748 0.751 0.831 0.756 0.702 0.741 0.730 0.779 0.827 0.779 0.644 8.923
FY 12/13 YTD 0.635 1.383 2.134 2.965 3.721 4.423 5.164 5.894 6.673 7.500 8.279 8.923
FY 13/14 0.660 0.756 1.416
FY 13/14 YTD 0.660 1.416
YTD % Change 3.9% 2.4%
Department: Public Transit
Email: [email protected]
Website: www.phoenix.gov/publictransit
Measurement Thresholds for Dial
Ridership - Light RailDescription
The city strives toward improving and expanding quality transit services for residents. This measure tracks light rail ridership
through the number of passenger boardings.
Goal
0% decrease compared to same month prior year.
Comments
Ridership = number of boardings. Light Rail includes Phoenix portion of all Light Rail boardings. Bus includes Phoenix contracted
bus, includes circulators, excludes Dial-A-Ride (DAR) and excludes Reserve-A-Ride (RAR). Ridership reporting for the new 19C
connector begins March 2013.
SOURCE OF DATA
0.500
0.600
0.700
0.800
0.900
Jul Aug Sep Oct Nov Dec Jan Feb Mar Apr May Jun
Board
ings
FY 12/13 FY 13/14return to Dashboard
Page 18
In Millions Jul Aug Sep Oct Nov Dec Jan Feb Mar Apr May Jun YTD
FY 12/13 3.576 3.397 3.092 3.375 3.310 3.394 3.219 3.060 3.903 3.405 3.471 3.486 40.688
FY 12/13 YTD 3.576 6.973 10.065 13.440 16.750 20.144 23.363 26.423 30.326 33.731 37.202 40.688
FY 13/14 3.482 3.482
FY 13/14 YTD 3.482
Department: Aviation
Email: [email protected]
Website: www.phoenix.gov/aviation
Sky Harbor International Airport is the State’s largest economic engine and a major community asset. This measure tracks total monthly
passengers utilizing the airport compared to prior year monthly actuals.
Comments
Commercial Aircraft Passengers
SOURCE OF DATA
Description
Data is reported one month in arrears.
2.5
3.0
3.5
4.0
4.5
Jul Aug Sep Oct Nov Dec Jan Feb Mar Apr May Jun
Passeng
ers
(in
millions)
FY 12/13 FY 13/14
return to Dashboard
Page 19
Green > 94% Yellow 94% to 86% Red < 86%
Jul Aug Sep Oct Nov Dec Jan Feb Mar Apr May Jun YTD
FY12/13 99% 94% 88% 91% 89% 93% 98% 100% 100% 100% 100% 100% 96%
FY13/14 100% 99% 100%
Department: Street Transportation
Email: [email protected]
Website: www.phoenix.gov/streets
SOURCE OF DATA
Comments
Street Maintenance Rapid Response Rate
The City strives to complete 95% of all streets Rapid Response requests within 24 hours, addressing urgent issues such as
roadway obstructions, potholes on major streets, and sidewalk tripping hazards. Prompt attention keeps traffic flowing and
protects the public.
95% response within 24 hours
Description
Goal
Measurement Thresholds for Dial
70.00%
80.00%
90.00%
100.00%
Jul Aug Sep Oct Nov Dec Jan Feb Mar Apr May Jun
Perc
ent T
imely
FY12/13 FY13/14
return to Dashboard
Page 20
Jul Aug Sep Oct Nov Dec Jan Feb Mar Apr May Jun YTD
FY 12/13 $10.66 $13.78 $17.27 $22.28 $8.38 $6.15 $34.74 $17.00 $34.25 $8.56 $18.43 $25.03 $216.53
FY 13/14 $7.26 $2.90 $10.16
Department: Phoenix Convention Center
Email: [email protected]
Website: www.phoenix.gov/conventioncenter
SOURCE OF DATA
Comments
Direct Spending of Conventions
The Phoenix Convention Center is committed to the vitality, culture and positive economic activity in downtown Phoenix by
hosting an optimum mix of conventions, trade shows, meetings and performing arts events with exceptional and memorable
guest experiences. This measure tracks the economic impact of the Phoenix Convention Center by tracking convention
delegate spending.
$290.2M for FY 2014
Source: Greater Phoenix Convention and Visitors Bureau. Estimated direct spending of conventions may be revised later when
final delegate attendance numbers are confirmed.
Description
Goal
$0
$25
$50
$75
$100
Jul Aug Sep Oct Nov Dec Jan Feb Mar Apr May Jun
Convention S
pendin
g
(in
millions)
FY 12/13 FY 13/14
return to Dashboard
Page 21
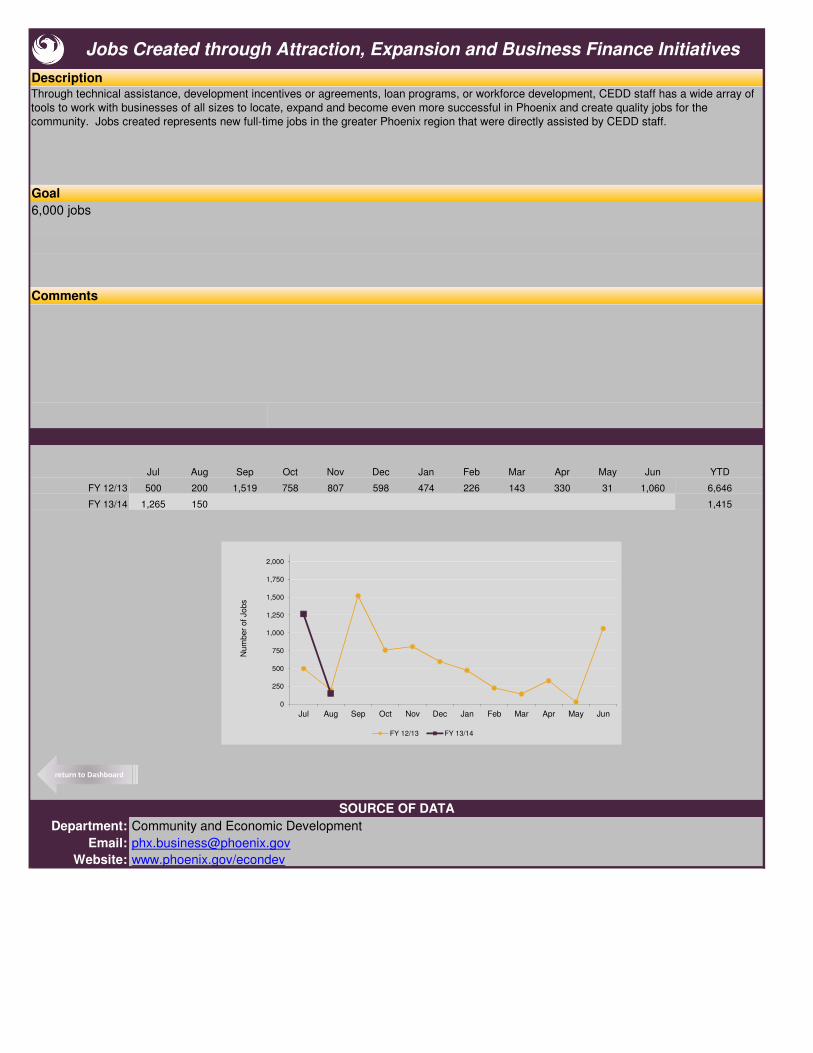
Jul Aug Sep Oct Nov Dec Jan Feb Mar Apr May Jun YTD
FY 12/13 500 200 1,519 758 807 598 474 226 143 330 31 1,060 6,646
FY 13/14 1,265 150 1,415
Department: Community and Economic Development
Email: [email protected]
Website: www.phoenix.gov/econdev
Jobs Created through Attraction, Expansion and Business Finance Initiatives
Through technical assistance, development incentives or agreements, loan programs, or workforce development, CEDD staff has a wide array of
tools to work with businesses of all sizes to locate, expand and become even more successful in Phoenix and create quality jobs for the
community. Jobs created represents new full-time jobs in the greater Phoenix region that were directly assisted by CEDD staff.
6,000 jobs
Description
SOURCE OF DATA
Goal
Comments
0
250
500
750
1,000
1,250
1,500
1,750
2,000
Jul Aug Sep Oct Nov Dec Jan Feb Mar Apr May Jun
Num
ber
of Jobs
FY 12/13 FY 13/14
return to Dashboard
Page 22
Jul Aug Sep Oct Nov Dec Jan Feb Mar Apr May Jun Actual YTD
FY 12/13 2,297 2,915 2,274 2,560 2,299 2,215 2,425 2,186 2,672 2,953 3,016 2,483 30,295
FY 13/14 2,714 2,750 5,464
FY 13/14 Estimated YTD: 32,784
Department: Planning & Development
Email: [email protected]
Website: www.phoenix.gov/pdd
Comments
The data below represents the actual number of permits issued per month.
SOURCE OF DATA
Annual Estimate of Permits IssuedDescription
The City is committed to managing planning, development and historic preservation for a better Phoenix. This measure tracks
the total number of construction permits issued compared to the prior year.
0
500
1,000
1,500
2,000
2,500
3,000
Jul Aug Sep Oct Nov Dec Jan Feb Mar Apr May Jun
Actu
al
Num
ber
of
Perm
its
FY 12/13 FY 13/14
return to Dashboard
Page 23
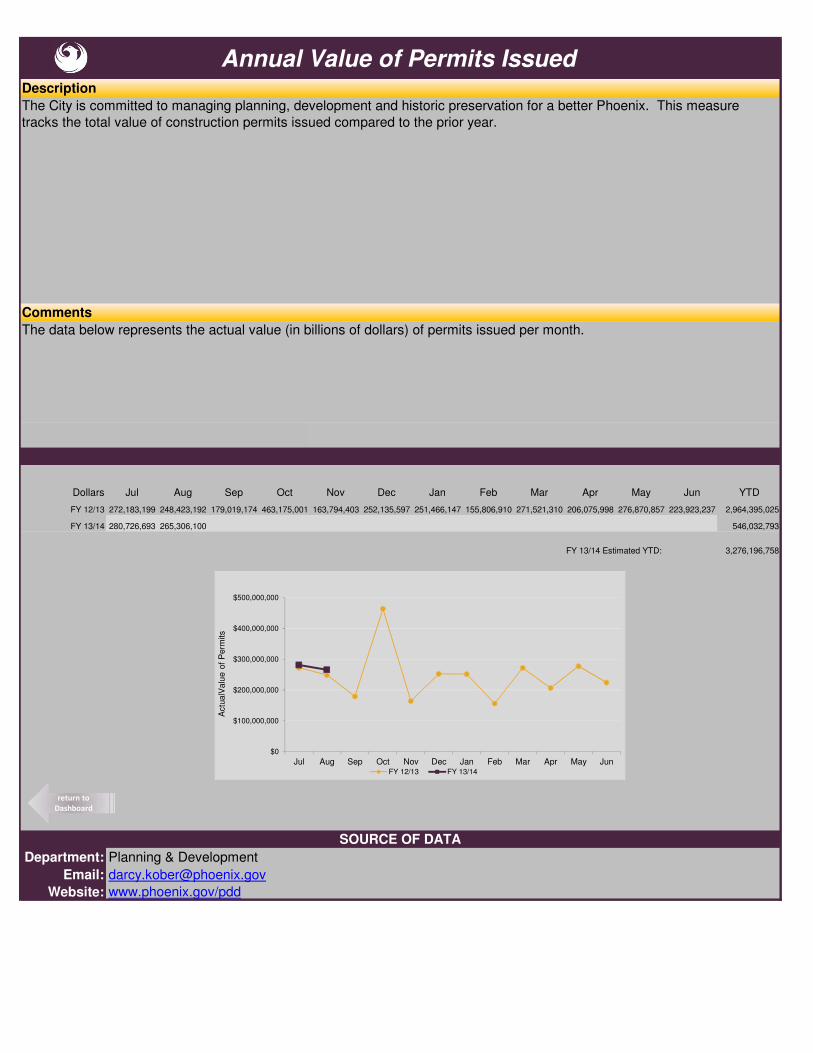
Dollars Jul Aug Sep Oct Nov Dec Jan Feb Mar Apr May Jun YTD
FY 12/13 272,183,199 248,423,192 179,019,174 463,175,001 163,794,403 252,135,597 251,466,147 155,806,910 271,521,310 206,075,998 276,870,857 223,923,237 2,964,395,025
FY 13/14 280,726,693 265,306,100 546,032,793
FY 13/14 Estimated YTD: 3,276,196,758
Department: Planning & Development
Email: [email protected]
Website: www.phoenix.gov/pdd
SOURCE OF DATA
Annual Value of Permits IssuedDescription
The City is committed to managing planning, development and historic preservation for a better Phoenix. This measure
tracks the total value of construction permits issued compared to the prior year.
Comments
The data below represents the actual value (in billions of dollars) of permits issued per month.
$0
$100,000,000
$200,000,000
$300,000,000
$400,000,000
$500,000,000
Jul Aug Sep Oct Nov Dec Jan Feb Mar Apr May Jun
Actu
alV
alu
e o
f P
erm
its
FY 12/13 FY 13/14
return to
Dashboard
Page 24
Green > .5% * Yellow .5% to 0% * Red < 0% *
Jul Aug Sep Oct Nov Dec Jan Feb Mar Apr May Jun
FY 12/13 409,667 410,615 411,480 411,957 412,020 411,965 412,176 412,464 413,088 413,686 413,964 414,188
FY 13/14 414,497 414,783
% change from
prior FY end 0.1% 0.1%
Department: Water Services
Email: [email protected]
Website: www.phoenix.gov/waterservices
* increase over prior FY end
SOURCE OF DATA
Water System Number of Accounts
The City is committed to providing high quality, reliable and cost-effective water services that meet the public’s needs and
maintain public support. This indicator measures the number of residential, commercial, industrial and institutional accounts and
the difference between the forecasted and actual number of accounts, which impacts water revenue.
407,902 accounts
Goal
Description
Measurement Thresholds for Dial
Comments
400,000
405,000
410,000
415,000
420,000
Jul Aug Sep Oct Nov Dec Jan Feb Mar Apr May Jun
Num
ber
of A
ccounts
FY 12/13 FY 13/14
return to Dashboard
Page 25
Green < 36 days Yellow 36 - 40 days Red > 40 days
Jul Aug Sep Oct Nov Dec Jan Feb Mar Apr May Jun YTD Average
FY 12/13 36 32 32 31 35 38 38 32 23 24 28 29 32
FY 13/14 28 27 28
Department: Neighborhood Services
Email: [email protected]
Website: www.phoenix.gov/nsd
Code Enforcement Case Cycle TimeDescription
Timely compliance at properties reported with code violations reduces neighborhood blight. Code enforcement case cycle time
reflects the number of calendar days from when a violation is reported to when City staff resolves the case on all standard cases.
Goal
SOURCE OF DATA
36 calendar days
Measurement Thresholds for Dial
Comments
20
30
40
50
60
Jul Aug Sep Oct Nov Dec Jan Feb Mar Apr May Jun
Num
ber
of D
ays
FY 12/13 FY 13/14
return to Dashboard
Page 26
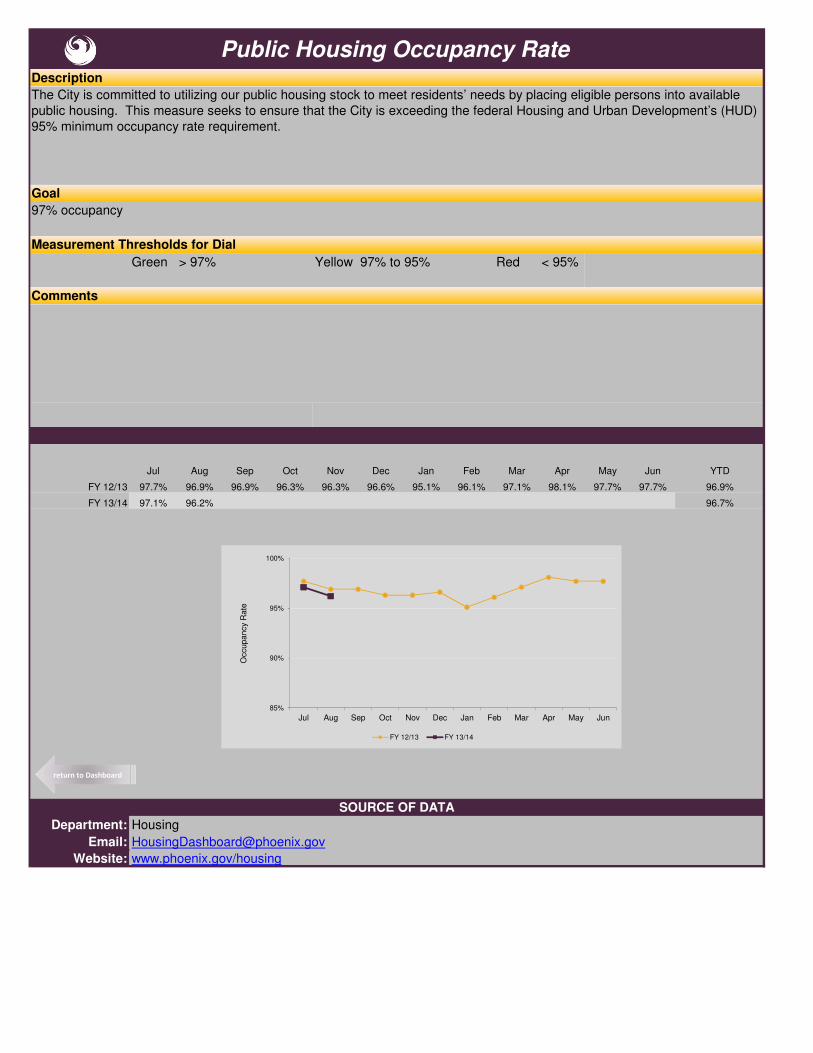
Green > 97% Yellow 97% to 95% Red < 95%
Jul Aug Sep Oct Nov Dec Jan Feb Mar Apr May Jun YTD
FY 12/13 97.7% 96.9% 96.9% 96.3% 96.3% 96.6% 95.1% 96.1% 97.1% 98.1% 97.7% 97.7% 96.9%
FY 13/14 97.1% 96.2% 96.7%
Department: Housing
Email: [email protected]
Website: www.phoenix.gov/housing
SOURCE OF DATA
Comments
Public Housing Occupancy Rate
The City is committed to utilizing our public housing stock to meet residents’ needs by placing eligible persons into available
public housing. This measure seeks to ensure that the City is exceeding the federal Housing and Urban Development’s (HUD)
95% minimum occupancy rate requirement.
97% occupancy
Description
Goal
Measurement Thresholds for Dial
85%
90%
95%
100%
Jul Aug Sep Oct Nov Dec Jan Feb Mar Apr May Jun
Occupancy R
ate
FY 12/13 FY 13/14
return to Dashboard
Page 27
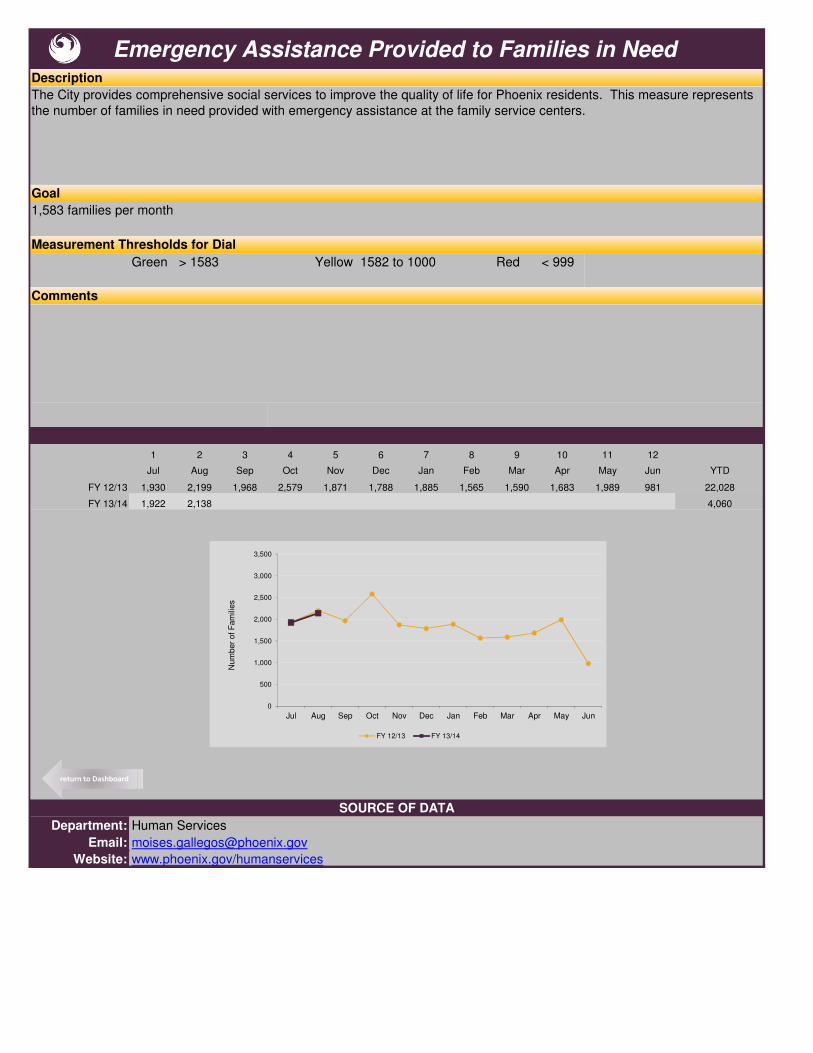
Green > 1583 Yellow 1582 to 1000 Red < 999
1 2 3 4 5 6 7 8 9 10 11 12
Jul Aug Sep Oct Nov Dec Jan Feb Mar Apr May Jun YTD
FY 12/13 1,930 2,199 1,968 2,579 1,871 1,788 1,885 1,565 1,590 1,683 1,989 981 22,028
FY 13/14 1,922 2,138 4,060
Department: Human Services
Email: [email protected]
Website: www.phoenix.gov/humanservices
Emergency Assistance Provided to Families in Need
SOURCE OF DATA
The City provides comprehensive social services to improve the quality of life for Phoenix residents. This measure represents
the number of families in need provided with emergency assistance at the family service centers.
1,583 families per month
Description
Goal
Measurement Thresholds for Dial
Comments
0
500
1,000
1,500
2,000
2,500
3,000
3,500
Jul Aug Sep Oct Nov Dec Jan Feb Mar Apr May Jun
Num
ber
of F
am
ilie
s
FY 12/13 FY 13/14
return to Dashboard
Page 28
Green > 11M Yellow 11M to 9M Red < 9M
Jul Aug Sep Oct Nov Dec Jan Feb Mar Apr May Jun Annual Estimate
FY 12/13 1.078 2.072 3.041 4.005 4.870 5.699 6.629 7.554 8.342 9.226 10.150 11.159
FY 13/14 1.030 2.008 12.048
Department: Library
Email: [email protected]
Website: www.phoenix.gov/library
Library Material Circulation (Annual Estimate)
Phoenix Public Library systems provide customers with access to information resources via the web. This measure tracks
customers’ use of library materials. The annual estimate is calculated by taking the year-to-date circulation, dividing it by the
number of months so far in the fiscal year, then multiplying it by 12.
Description
Goal
SOURCE OF DATA
Circulation of over 11.3 million books, DVDs and CDs
Measurement Thresholds for Dial
Comments
0.0
3.0
6.0
9.0
12.0
15.0
Jul Aug Sep Oct Nov Dec Jan Feb Mar Apr May Jun
Lib
rary
Mate
rial C
ircula
tion
(in m
illions)
FY 12/13 FY 13/14
return to Dashboard
Page 29
Green > -5% Yellow -5% to -9% Red < -9%
Jul Aug Sep Oct Nov Dec Jan Feb Mar Apr May Jun
FY 12/13 59,460 50,436 42,523 52,786 42,049 36,514 47,157 46,556 49,899 47,695 49,231 59,554
FY 12/13 YTD 59,460 109,896 152,419 205,205 247,254 283,768 330,925 377,481 427,380 475,075 524,306 583,860
FY 13/14 57,110 43,466
FY 13/14 YTD 57,110 100,576
YTD % Change from
last year -4.0% -8.5%
Department: Parks and Recreation
Email: [email protected]
Website: www.phoenix.gov/parks
SOURCE OF DATA
Comments
Number of Visitors at Parks' Recreational Facilities
The City is committed to building healthy communities through parks, recreational programs and partnerships. This measure
seeks to ensure maximum usage of Parks recreational facilities and compares the number of monthly visitors to the prior year.
> -5% change from prior YTD
In FY 2013 the requirement to have a pass at some locations has been eliminated resulting in a lower recorded number of
monthly visitors.
Description
Goal
Measurement Thresholds for Dial
0
10,000
20,000
30,000
40,000
50,000
60,000
70,000
80,000
Jul Aug Sep Oct Nov Dec Jan Feb Mar Apr May Jun
Num
ber
of V
isitors
FY 12/13 FY 13/14
return to Dashboard
Page 30
Green > 65% Yellow 65 to 60% Red < 60%
Jul Aug Sep Oct Nov Dec Jan Feb Mar Apr May Jun
FY 12/13 73% 73% 73% 75% 76% 73% 78% 76% 80% 69% 64% 69%
FY 13/14 64% 67%
Department: Office of Arts & Culture
Email: PHX-A&[email protected]
Website: www.phoenix.gov/arts
SOURCE OF DATA
Comments
Public Arts Projects Implemented
One percent of the City’s Capital Improvement Program is allocated to public art. This measure represents the City’s progress
towards implementing public art projects in the annual public art plan to enhance the City’s built environment through public art.
65% of projects implemented
Description
Goal
Measurement Thresholds for Dial
0%
10%
20%
30%
40%
50%
60%
70%
80%
90%
100%
1 2 3 4 5 6 7 8 9 10 11 12
Perc
ent of
Imple
menta
tion
FY 12/13 FY 13/14
return to Dashboard
Page 31
Jul Aug Sep Oct Nov Dec Jan Feb Mar Apr May Jun YTD
FY 12/13 1,076,681 971,207 913,525 855,915 667,329 601,146 1,375,124 1,548,750 1,953,851 2,263,200 2,429,820 2,261,463 16,918,011
FY 13/14 2,252,418 2,175,398 4,427,816
Department: Public Works
Email: [email protected]
Website: www.phoenix.gov/publicworks
SOURCE OF DATA
Description
Goal
Comments
Annual Solar Energy Production
The City is committed to securing environmental and economic livability for future generations in the region, with an emphasis on solar
energy production. This indicator measures solar energy produced at City facilities on a monthly basis.
11,281,187 kWh
0
200,000
400,000
600,000
800,000
1,000,000
1,200,000
1,400,000
1,600,000
1,800,000
2,000,000
2,200,000
2,400,000
Jul Aug Sep Oct Nov Dec Jan Feb Mar Apr May Jun
kW
h
FY 12/13 FY 13/14
return to Dashboard
Page 32
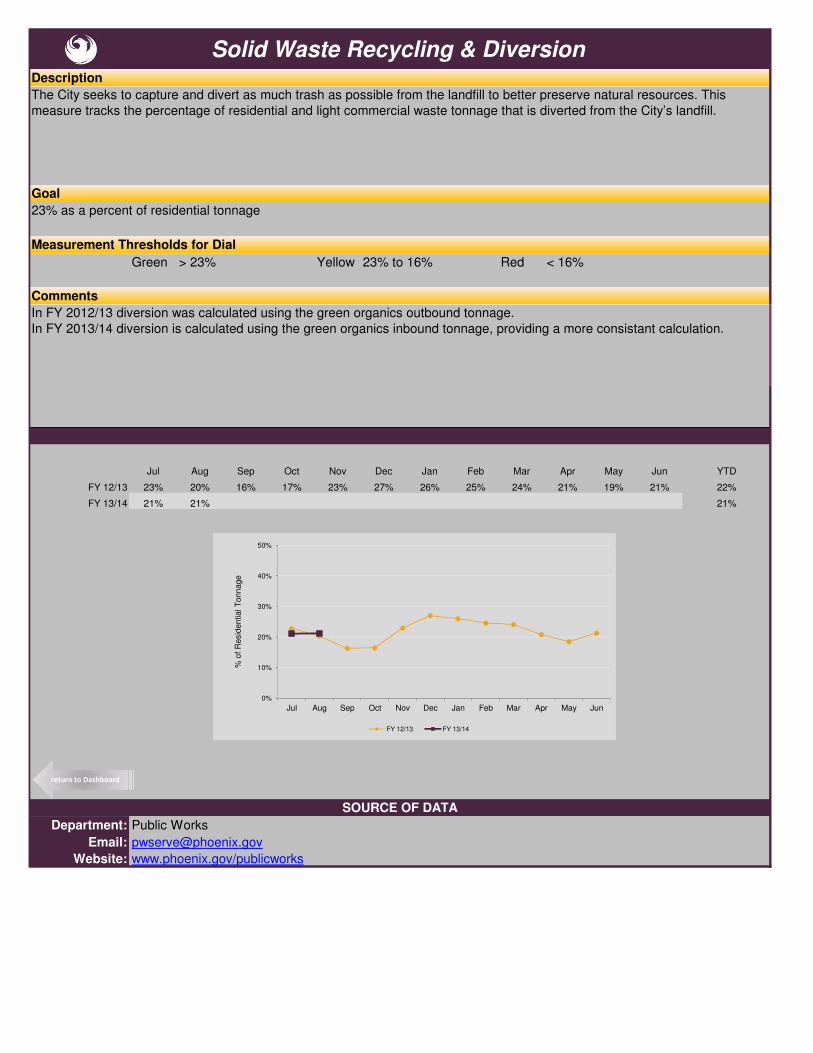
Green > 23% Yellow 23% to 16% Red < 16%
Jul Aug Sep Oct Nov Dec Jan Feb Mar Apr May Jun YTD
FY 12/13 23% 20% 16% 17% 23% 27% 26% 25% 24% 21% 19% 21% 22%
FY 13/14 21% 21% 21%
Department: Public Works
Email: [email protected]
Website: www.phoenix.gov/publicworks
Solid Waste Recycling & Diversion
The City seeks to capture and divert as much trash as possible from the landfill to better preserve natural resources. This
measure tracks the percentage of residential and light commercial waste tonnage that is diverted from the City’s landfill.
23% as a percent of residential tonnage
In FY 2012/13 diversion was calculated using the green organics outbound tonnage.
In FY 2013/14 diversion is calculated using the green organics inbound tonnage, providing a more consistant calculation.
SOURCE OF DATA
Description
Goal
Measurement Thresholds for Dial
Comments
0%
10%
20%
30%
40%
50%
Jul Aug Sep Oct Nov Dec Jan Feb Mar Apr May Jun
% o
f R
esid
ential T
onnage
FY 12/13 FY 13/14
return to Dashboard