City of Annapolis Police and Fire Retirement Plan Commission Meeting 145 Gorman Street, 3 rd Floor Conference Room, Annapolis, MD January 31, 2018 – 8:30 am 1. December 31 Market Environment Review with update as of January 26 th 2. December 31 Flash Retirement Plan Performance Report 3. Review Revised Investment Policy Statement – Lazard Core Plus Fixed Income 4. EnTrust Special Opportunities Fund II - Annual New Issue Eligibility Certification 5. Review status of EnTrust Special Opportunity Fund IV fund raising 6. Review status of EnTrustPermal Blue Ocean Fund due diligence 7. Interview Edgar Lomax - Large Cap Equity 8. Interview Grosvenor Capital Management -- Grosvenor Institutional Partners
1. December 31 Market Environment Review with update as of January 26th
2. December 31 Flash Retirement Plan Performance Report
3. Review Revised Investment Policy Statement – Lazard Core Plus Fixed Income
4. EnTrust Special Opportunities Fund II - Annual New Issue Eligibility Certification
5. Review status of EnTrust Special Opportunity Fund IV fund raising
6. Review status of EnTrustPermal Blue Ocean Fund due diligence
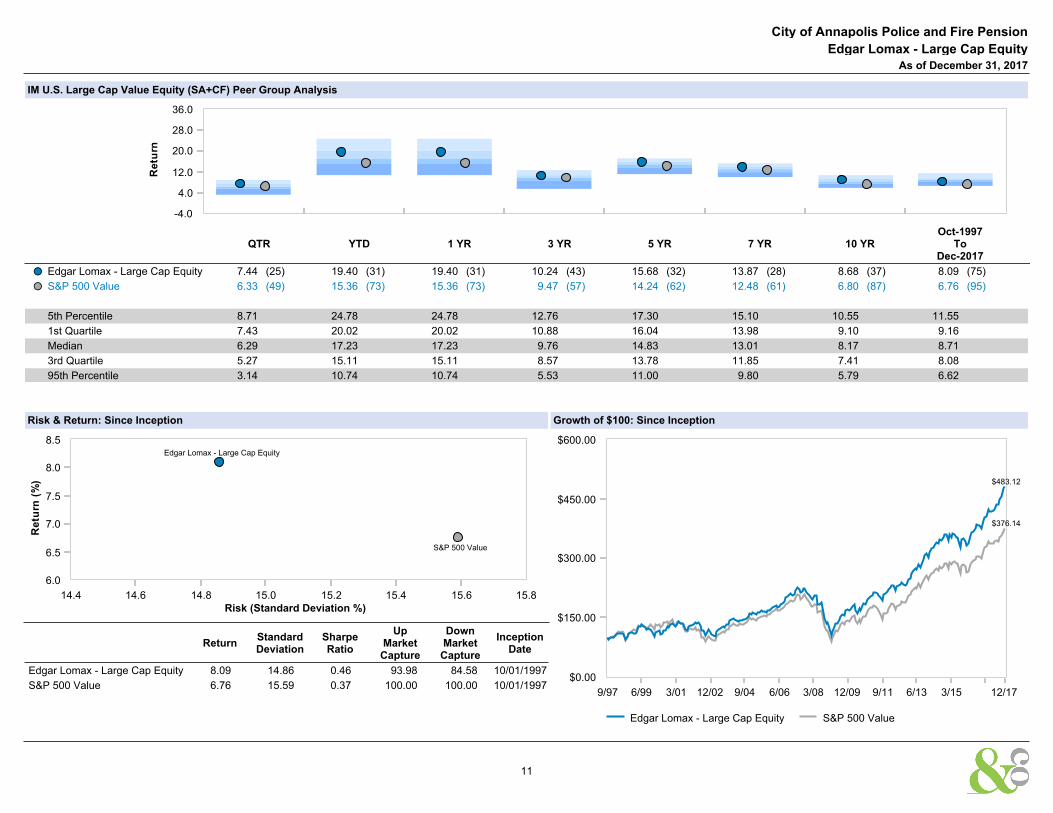
7. Interview Edgar Lomax - Large Cap Equity
8. Interview Grosvenor Capital Management -- Grosvenor Institutional Partners
1
2018 Market Environment January 26, 2018
Source: JP Morgan
Investment Performance Review
Period Ending December 31, 2017
City of Annapolis Police and FirePension
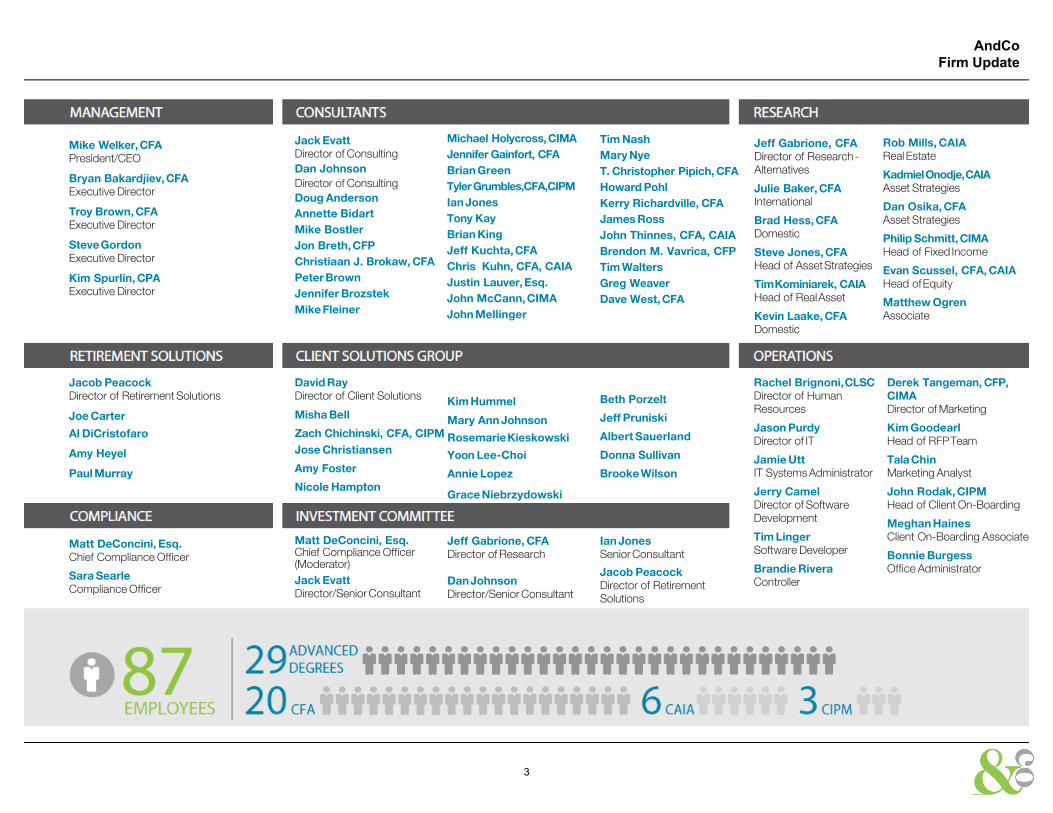
AndCoFirm Update
As we embark on a New Year together we first wanted to say, “Thank you” toour clients for giving us the opportunity to work with you. Our mission is torepresent the sole interests of our clients by redefining independence. Thismission means everything to us. We want to demonstrate this mission everyday by maintaining your trust in an evolving financial world. We are extremelygrateful to be your consultant and will continue to work tirelessly to uphold yourtrust and confidence.
As we enter 2018, AndCo has never been stronger and more committed todelivering high quality service. We are 87 people strong, all collectively strivingto serve our clients each day. Since most clients do not have the opportunity tointeract with our entire firm, we have attached a page which outlines ourcurrent organizational structure and illustrates our continued reinvestment inprofessionals to better serve you. Our steadfast focus on one line of business,general consulting, will remain our singular focus going forward.
Each January, we hold a Firmwide retreat to discuss the previous year’ssuccesses and challenges, as well as outline our Strategic plan, includingreinforcement of our Mission, Vision and Values. It’s a great time for ouremployees to spend time together and get a better understanding of where thecompany is going, why we’re headed in that direction, and more importantly,the critical role they each play in making it a success. Starting last year, alongwith this strategic review, we also started the process of announcing newpartners at the firm. Since the firm was founded in 2000 by Joe Bogdahn, itsfoundational goal was to make the firm a multigenerational organization led bythe employees. That succession plan was put into place in 2015 and lastJanuary we announced 6 new partners – Donna Sullivan, David Ray, JasonPurdy, Bryan Bakardjiev, Steve Gordon and Troy Brown.
This year, we added one new partner – Dan Johnson. Dan has been with thefirm for almost 10 years and has worked tirelessly serving his clients andevolving the firm in multiple areas. Dan believes in what we are doing and thevalue of the independent service model. Dan has continuously demonstratedhis willingness to drop everything to help others and help the firm better serveour clients, each other, and the community. As a testament to his contributions,when his name was announced Dan received a standing ovation from hispeers. We are honored to have Dan at our firm and part of our ownership team.
At AndCo, we believe in order to continue growing over time, and aligninterests of all employees, we must continue to recycle equity opportunitiesback into the organization. This belief embodies our commitment to remainemployee owned and managed, as well as reward those team members thathave helped make the company what it is today and what it will be goingforward. This shared belief also ensures legacy partners will eventually transfertheir units to new members.
As such, since Joe initially transferred units back to the firm, I have grantedunits to new members. I am also happy to acknowledge Dave West as themost recent 1st generation partner to voluntarily recycle his ownership unitsback into the company. Dave was one of our initial partners and was aninstrumental collaborator in the development of the early philosophies anddeliverables of the organization. Dave will continue to support the firm byserving our clients with the same passion and enthusiasm into the future asone of our most tenured senior consultants.
So, this New Year we want to say “Thank you” twice: once to you, our valuedclients, and once to Dave West for his support, belief and understanding of theAndCo way. We embark on 2018 stronger than ever thanks to your trust,people like Dave, and the rest of our tremendous, growing team.
On behalf of everyone at AndCo, thank you for your partnership.
Mike Welker, CFA®
President/CEO
1
2
AndCoFirm Update
Mike Welker,CFAPresident/CEO
Bryan Bakardjiev,CFAExecutive Director
Troy Brown, CFAExecutive Director
SteveGordonExecutive Director
Kim Spurlin, CPAExecutive Director
Jeff Gabrione, CFA Director of Research-Alternatives
Julie Baker, CFAInternational
Brad Hess, CFADomestic
Steve Jones,CFAHead of AssetStrategies
TimKominiarek, CAIAHead of RealAsset
Kevin Laake, CFADomestic
Rob Mills, CAIARealEstate
KadmielOnodje,CAIAAsset Strategies
Dan Osika, CFAAsset Strategies
Philip Schmitt, CIMAHead of Fixed Income
Evan Scussel, CFA, CAIAHead ofEquity
Matthew OgrenAssociate
David RayDirector of Client Solutions
Misha Bell
Jose Christiansen
Amy Foster
Nicole Hampton
Kim Hummel
Mary Ann JohnsonZach Chichinski, CFA, CIPM RosemarieKieskowski
Yoon Lee-Choi
Annie Lopez
Grace Niebrzydowski
Beth Porzelt
Jeff Pruniski
Albert Sauerland
Donna Sullivan
Brooke Wilson
Jacob PeacockDirector of Retirement Solutions
Joe Carter
Al DiCristofaro
Amy Heyel
Paul Murray
Rachel Brignoni,CLSC Director of Human Resources
Jason PurdyDirector of IT
Jamie UttIT Systems Administrator
Jerry Camel Director of Software Development
Tim LingerSoftware Developer
Brandie RiveraController
Derek Tangeman, CFP, CIMADirector of Marketing
Kim GoodearlHead of RFPTeam
Tala ChinMarketing Analyst
John Rodak,CIPMHead of Client On-Boarding
Meghan HainesClient On-Boarding Associate
Bonnie BurgessOffice Administrator
Matt DeConcini, Esq.Chief Compliance Officer
Sara SearleCompliance Officer
Matt DeConcini, Esq. Chief Compliance Officer (Moderator)Jack EvattDirector/Senior Consultant
Jeff Gabrione, CFADirector of Research
DanJohnsonDirector/Senior Consultant
Ian JonesSenior Consultant
Jacob PeacockDirector of RetirementSolutions
Jack EvattDirector of ConsultingDan Johnson Director of Consulting Doug AndersonAnnette Bidart Mike Bostler Jon Breth,CFPChristiaan J. Brokaw, CFA Peter BrownJennifer Brozstek Mike Fleiner
Michael Holycross,CIMA Jennifer Gainfort, CFA Brian GreenTylerGrumbles,CFA,CIPM Ian JonesTony Kay Brian KingJeff Kuchta, CFAChris Kuhn, CFA, CAIA Justin Lauver,Esq.John McCann,CIMAJohn Mellinger
Tim Nash Mary NyeT. Christopher Pipich, CFA Howard PohlKerry Richardville, CFA James RossJohn Thinnes, CFA, CAIABrendon M. Vavrica, CFPTim WaltersGreg Weaver Dave West, CFA
3
Market Update
Russell Indices Style Returns
Equities Month 3 M YTD 1 Year 3 Yr
Ann
5 Yr
Ann V B G V B G
S&P 500 Total Return 1.11 6.64 21.83 21.83 11.40 15.78
Russell Midcap Index 0.92 6.05 18.50 18.50 9.56 14.95
Russell 2000 Index (0.41) 3.33 14.63 14.63 9.93 14.11
Russell 1000 Growth Indx 0.78 7.86 30.21 30.21 13.77 17.31
Russell 1000 Value Index 1.44 5.31 13.64 13.64 8.63 14.03
Russell 3000 Index 0.99 6.33 21.12 21.12 11.10 15.57
MSCI EAFE NR 1.61 4.23 25.03 25.03 7.79 7.89
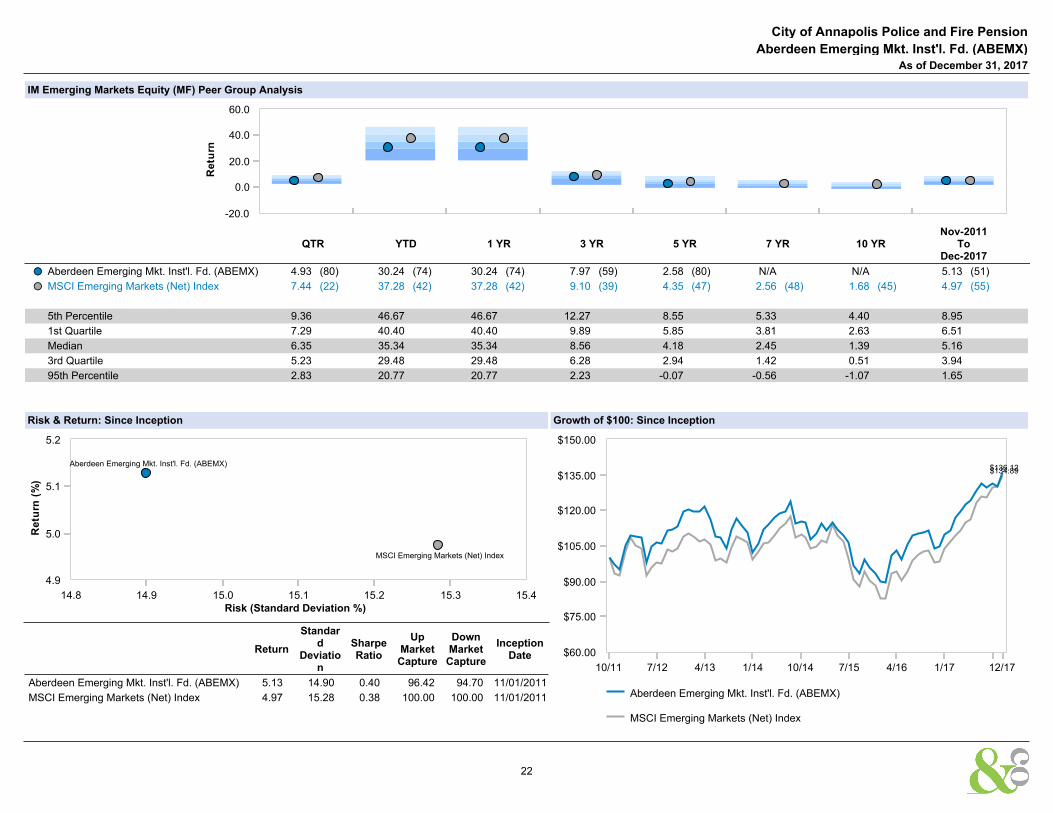
MSCI EM NR 3.59 7.44 37.28 37.28 9.09 4.35
Fixed Income Month 3 M YTD 1 YearMod. Adj.
Duration
Yield to
WorstCurrencies 12/31/17 12/31/16 12/31/15
U.S. Aggregate 0.46 0.39 3.54 3.54 5.98 2.71 Euro Spot 1.20 1.05 1.09
U.S. Corporate Investment Grade 0.91 1.17 6.42 6.42 7.58 3.25 British Pound Spot 1.35 1.23 1.47
U.S. Corporate High Yield 0.30 0.47 7.50 7.50 3.86 5.72 Japanese Yen Spot 112.69 116.96 120.22
Global Aggregate 0.35 1.08 7.39 7.39 6.99 1.66 Swiss Franc Spot 0.97 1.02 1.00
90 Day U.S. Treasury Bill 0.29 0.11 N/A 2.47 -0.67 12/01/2013
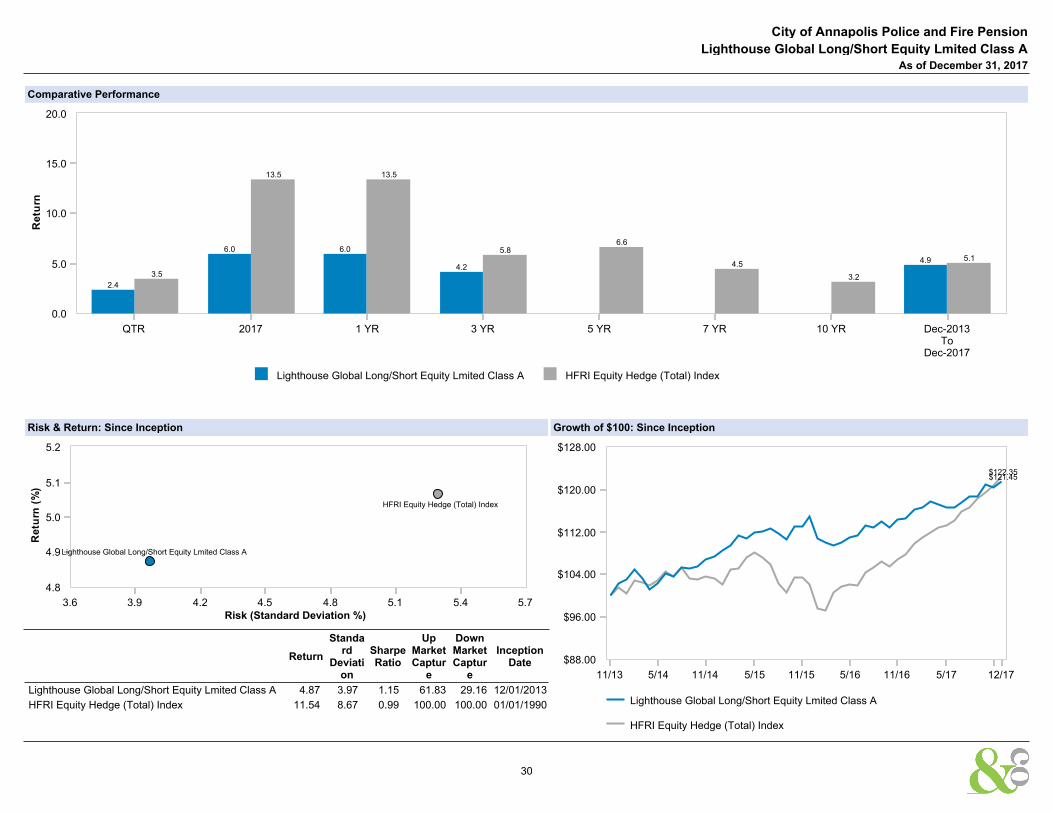
City of Annapolis Police and Fire Pension
Lighthouse Global Long/Short Equity Lmited Class AAs of December 31, 2017
30
Private Equity Summary of Partnership
PartnershipsValuation
DateVintage
YearInvestment
Strategy
CapitalCommitment
$
DrawnDown
$
MarketValue
$
Distributed$
RecallableCapital
Capital ReturnedEx-Recallable
RemainingCommitment
IRR(%)
TVPIMultiple
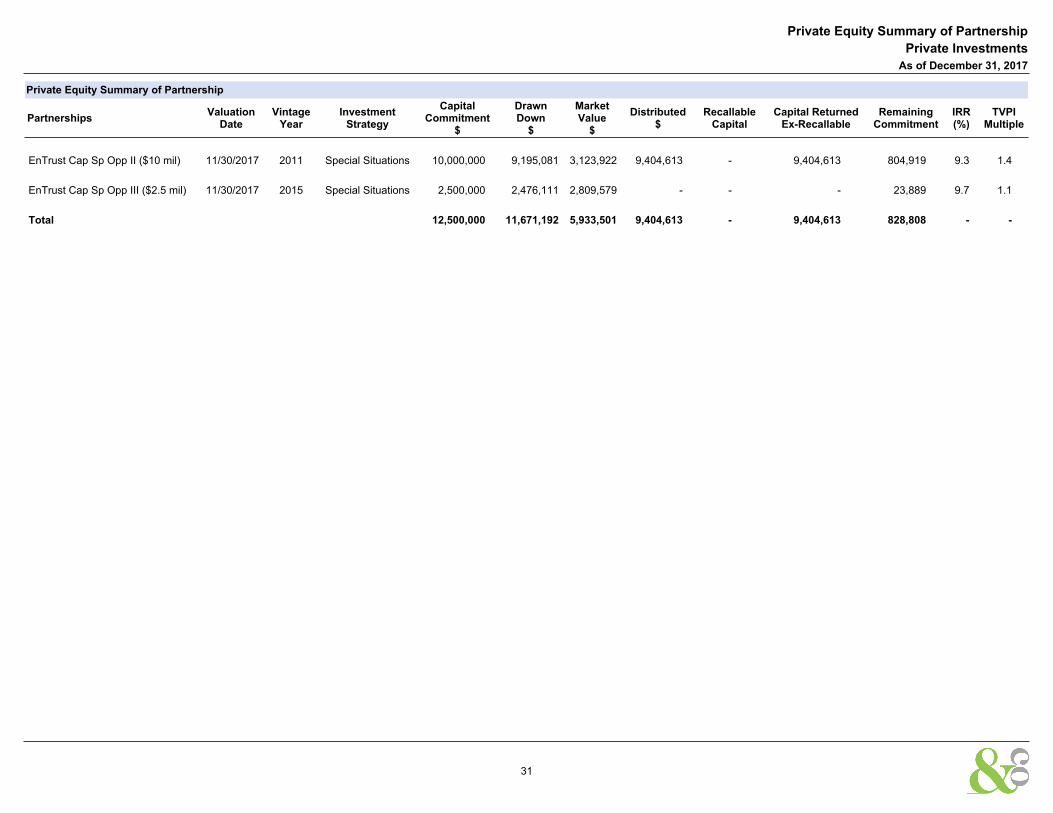
EnTrust Cap Sp Opp II ($10 mil) 11/30/2017 2011 Special Situations 10,000,000 9,195,081 3,123,922 9,404,613 - 9,404,613 804,919 9.3 1.4
EnTrust Cap Sp Opp III ($2.5 mil) 11/30/2017 2015 Special Situations 2,500,000 2,476,111 2,809,579 - - - 23,889 9.7 1.1
Total 12,500,000 11,671,192 5,933,501 9,404,613 - 9,404,613 828,808 - -
Private Equity Summary of Partnership
Private Investments
As of December 31, 2017
31
Fund Information
Type of Fund: Fund Of Funds Vintage Year: 2011
Strategy Type: Special Situations Management Fee: 1.25%
Size of Fund: 498,400,000 Preferred Return: 10% of the net increase subject to an annual 7.5% hurdle rate
Inception: 09/01/2011 General Partner: EnTrustPermal Partners Offshore LP
Final Close: 12/1/2011
Investment Strategy: The EnTrustPermal Special Opportunities Funds (the “Funds”) are comprised of our managers’ high conviction ideas that are a result of market dislocations or manager-led, catalyst-driveninvestments.
The Funds employ a committed capital and drawdown structure, charging fees only on invested capital. This structure, which has been employed by all of the Funds, allows for quickexecution on investments, while enabling investors to reserve liquidity for potential dislocation opportunities. The commitment period for the Funds is three years plus an additional year atEnTrustPermal’s discretion, during which time EnTrustPermal may recycle capital into new investments in the Fund.
While the Funds are agnostic in terms of asset class, geography and strategy, with respect to duration, they generally target investments with a 2-5 year investment horizon – a point on theliquidity spectrum that exists in between the longer horizon of traditional private equity funds and the shorter horizon of most hedge funds and public market institutional investors. As such,the opportunities we pursue for the Funds tend to be less crowded and therefore, we believe, priced less efficiently, which can allow our investors to optimize their liquidity while earning apremium.
EnTrust Capital Special Opportunities Fund II ($10 mil)
As of December 31, 2017
32
Fund Information
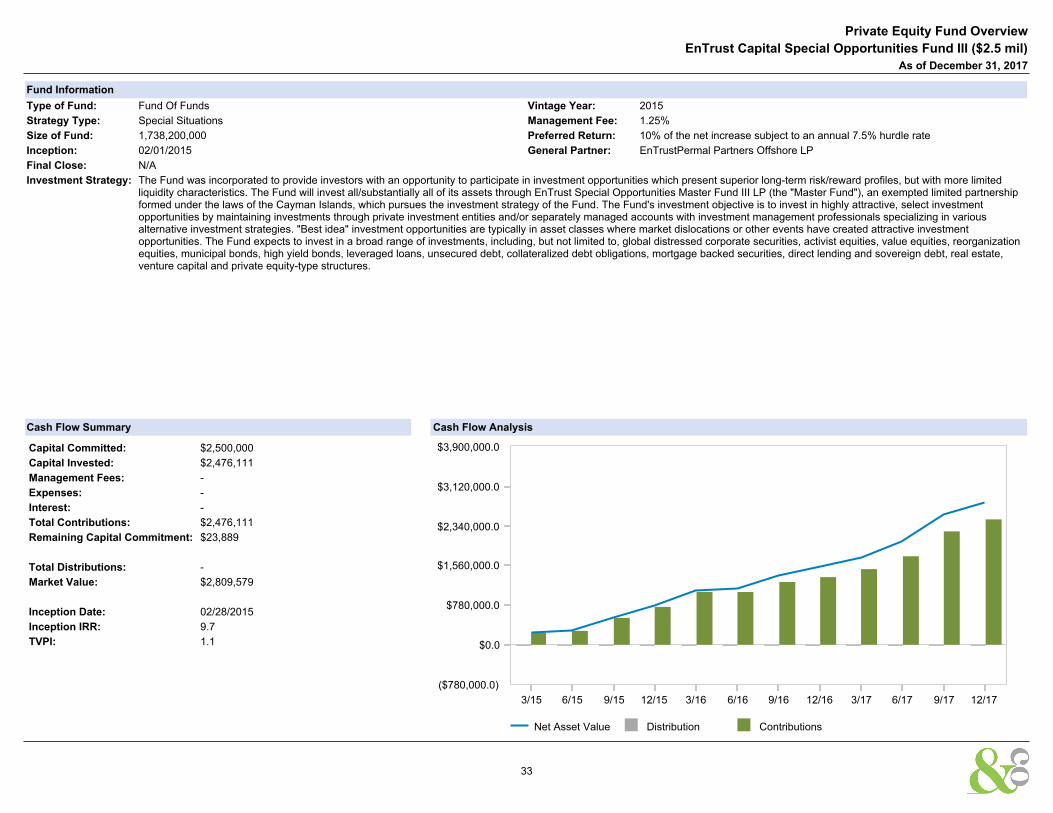
Type of Fund: Fund Of Funds Vintage Year: 2015
Strategy Type: Special Situations Management Fee: 1.25%
Size of Fund: 1,738,200,000 Preferred Return: 10% of the net increase subject to an annual 7.5% hurdle rate
Inception: 02/01/2015 General Partner: EnTrustPermal Partners Offshore LP
Final Close: N/A
Investment Strategy: The Fund was incorporated to provide investors with an opportunity to participate in investment opportunities which present superior long-term risk/reward profiles, but with more limitedliquidity characteristics. The Fund will invest all/substantially all of its assets through EnTrust Special Opportunities Master Fund III LP (the "Master Fund"), an exempted limited partnershipformed under the laws of the Cayman Islands, which pursues the investment strategy of the Fund. The Fund's investment objective is to invest in highly attractive, select investmentopportunities by maintaining investments through private investment entities and/or separately managed accounts with investment management professionals specializing in variousalternative investment strategies. "Best idea" investment opportunities are typically in asset classes where market dislocations or other events have created attractive investmentopportunities. The Fund expects to invest in a broad range of investments, including, but not limited to, global distressed corporate securities, activist equities, value equities, reorganizationequities, municipal bonds, high yield bonds, leveraged loans, unsecured debt, collateralized debt obligations, mortgage backed securities, direct lending and sovereign debt, real estate,venture capital and private equity-type structures.
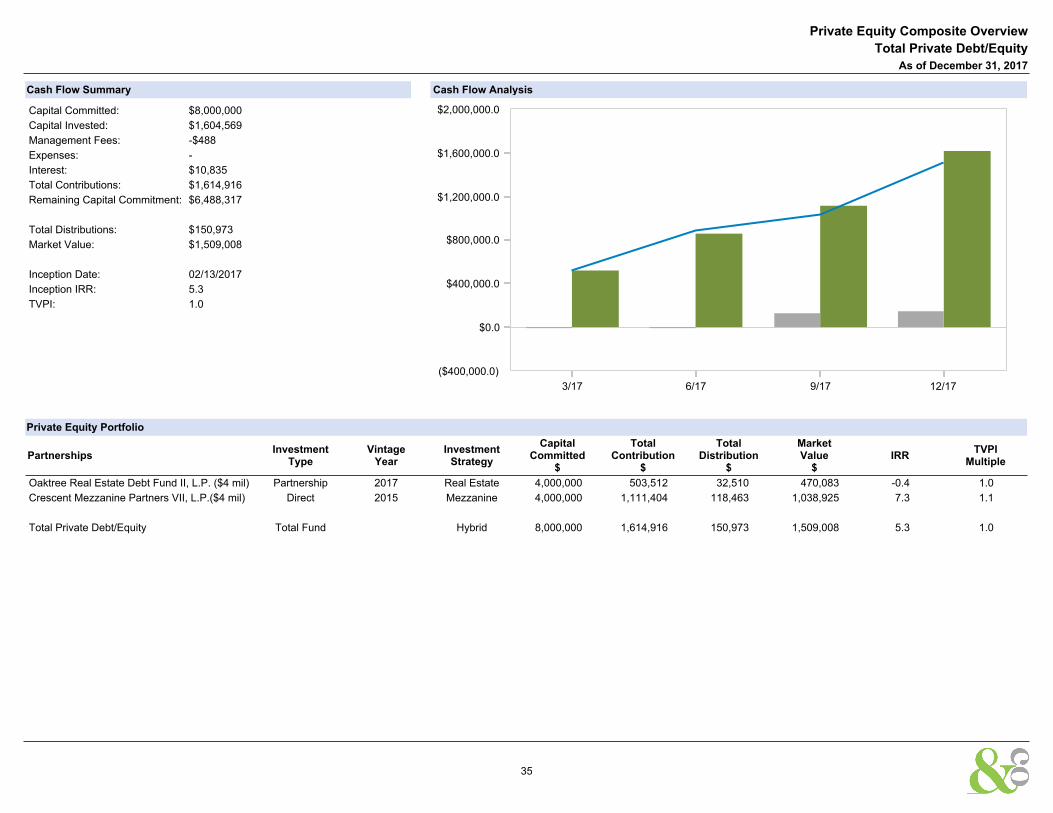
Total Private Debt/Equity Total Fund Hybrid 8,000,000 1,614,916 150,973 1,509,008 5.3 1.0
Private Equity Composite Overview
Total Private Debt/Equity
As of December 31, 2017
35
Fund Information
Type of Fund: Direct Vintage Year: 2015
Strategy Type: Mezzanine Management Fee: 0.75%
Size of Fund: - Preferred Return:
Inception: 12/01/2016 General Partner: Crescent Mezzanine Partners VII, L.P.
Final Close: Number of Funds:
Investment Strategy: The Partnership’s primary objective will be to invest in Mezzanine Securities.The Partnership shall have the power, to purchase, hold, dispose of, or otherwise deal with Mezzanine Securities for its own account and otherwise carry out the terms of this Agreementand engage or participate in any other lawful investment activities incidental or related to the foregoing in which limited partnerships formed under the Delaware Partnership Act may engageor participate.
Cash Flow Summary
Capital Committed: $4,000,000
Capital Invested: $1,100,569
Management Fees: -
Expenses: -
Interest: $10,835
Total Contributions: $1,111,404
Remaining Capital Commitment: $2,992,317
Total Distributions: $118,463
Market Value: $1,038,925
Inception Date: 03/31/2017
Inception IRR: 7.1
TVPI: 1.1
Cash Flow Analysis
Net Asset Value Distribution Contributions
$0.0
$320,000.0
$640,000.0
$960,000.0
$1,280,000.0
$1,600,000.0
($320,000.0)
3/17 6/17 9/17 12/17
Private Equity Fund Overview
Crescent Mezzanine Partners VII, L.P.($4 mil)
As of December 31, 2017
36
Fund Information
Type of Fund: Partnership Vintage Year: 2017
Strategy Type: Real Estate Management Fee: <$100mm: 100bps on invested capital; $100mm and greater: 80bps on investedcapital
Size of Fund: - Preferred Return: 6% ; GP Carried Interest: 15% with 50/50 catch-up
Inception: 10/04/2016 General Partner: Oaktree Real Estate Debt Fund II GP, L.P.
Final Close: Number of Funds:
Investment Strategy: Oaktree Real Estate Debt Fund II seeks to generate attractive risk-adjusted returns and current income by combining a diversified portfolio of performing real estate debt investments withmodest leverage in a closed-end investment structure. Potential investments include: mezzanine loans, commercial mortgage-backed securities (“CMBS”), real estate-related corporatedebt, commercial first mortgages, subordinated secured debt and residential first mortgages. Target levered returns of 14% gross (10% net net) with 6 to 7% current income.
Cash Flow Summary
Capital Committed: $4,000,000
Capital Invested: $504,000
Management Fees: -$488
Expenses: -
Interest: -
Total Contributions: $503,512
Remaining Capital Commitment: $3,496,000
Total Distributions: $32,510
Market Value: $470,083
Inception Date: 03/31/2017
Inception IRR: -0.4
TVPI: 1.0
Cash Flow Analysis
Net Asset Value Distribution Contributions
$0.0
$140,000.0
$280,000.0
$420,000.0
$560,000.0
$700,000.0
($140,000.0)
3/17 6/17 9/17 12/17
Private Equity Fund Overview
Oaktree Real Estate Debt Fund II, L.P. ($4 mil)
As of December 31, 2017
37
Asset Allocation & Performance
Performance(%)
2016 2015 2014 2013 2012 2011 2010 2009 2008 2007
Total Fund Composite 5.85 1.17 5.85 17.99 9.94 0.78 11.76 18.00 -24.54 5.52
Total Fund Policy 7.42 -0.52 6.64 13.25 9.97 1.31 11.64 17.12 -22.04 7.55
Total Fund - Excluding Illiquid Investments 5.76 1.48 5.67 17.40 9.88 0.78 11.76 18.00 -24.54 5.52
Total Equity 9.46 0.81 8.05 32.68
Total Domestic Equity 12.55
Total Large Cap Equity 11.06 4.68 13.48 37.53 9.18 6.31 13.80 28.28 -33.66 4.14
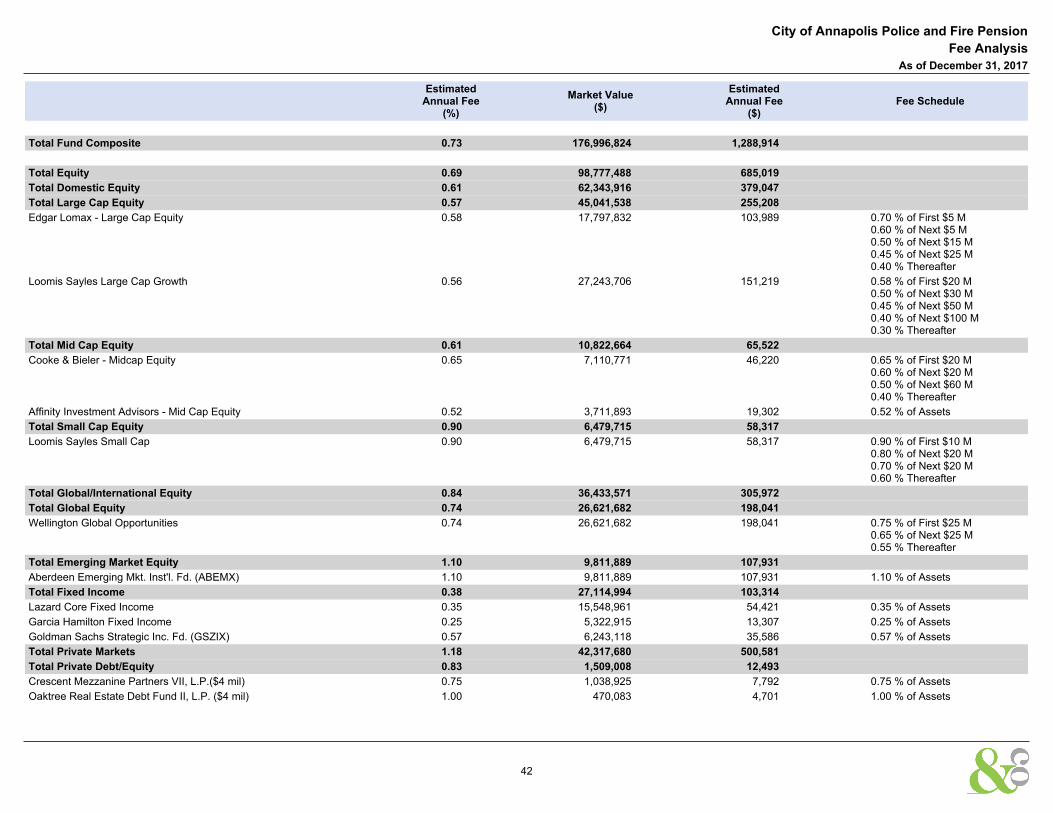
Edgar Lomax - Large Cap Equity 0.58 17,797,832 103,989 0.70 % of First $5 M0.60 % of Next $5 M0.50 % of Next $15 M0.45 % of Next $25 M0.40 % Thereafter
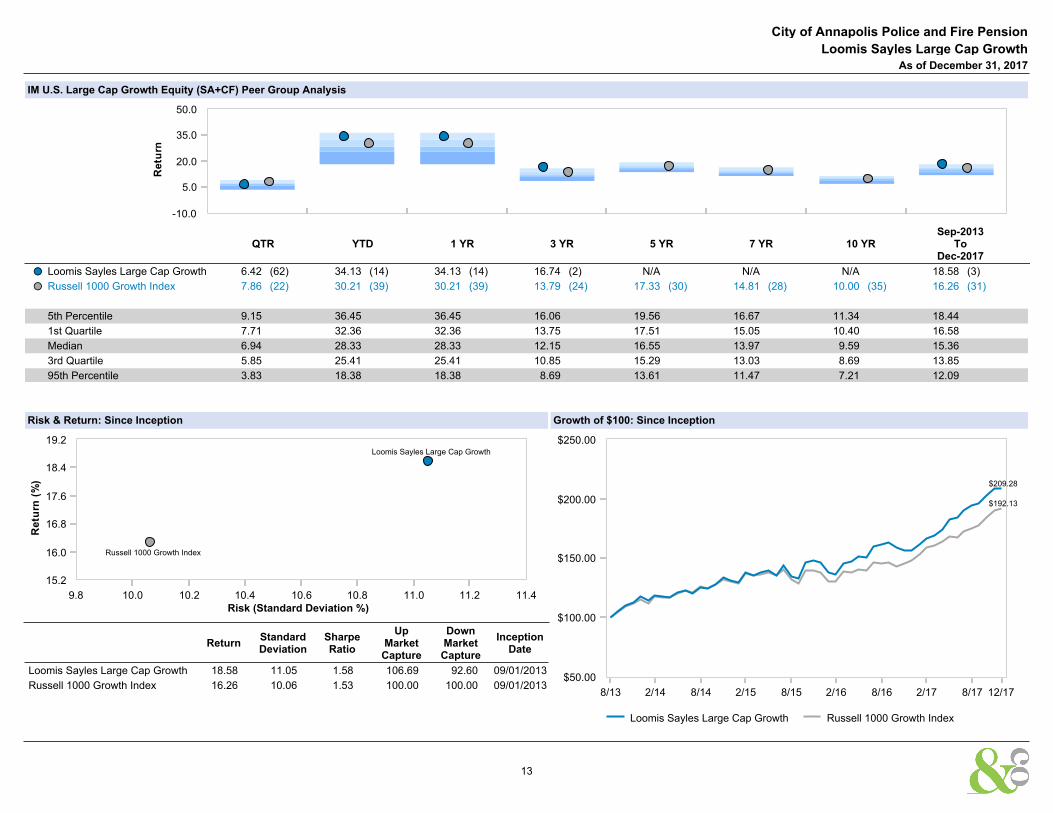
Loomis Sayles Large Cap Growth 0.56 27,243,706 151,219 0.58 % of First $20 M0.50 % of Next $30 M0.45 % of Next $50 M0.40 % of Next $100 M0.30 % Thereafter
Total Mid Cap Equity 0.61 10,822,664 65,522
Cooke & Bieler - Midcap Equity 0.65 7,110,771 46,220 0.65 % of First $20 M0.60 % of Next $20 M0.50 % of Next $60 M0.40 % Thereafter
Affinity Investment Advisors - Mid Cap Equity 0.52 3,711,893 19,302 0.52 % of Assets
Total Small Cap Equity 0.90 6,479,715 58,317
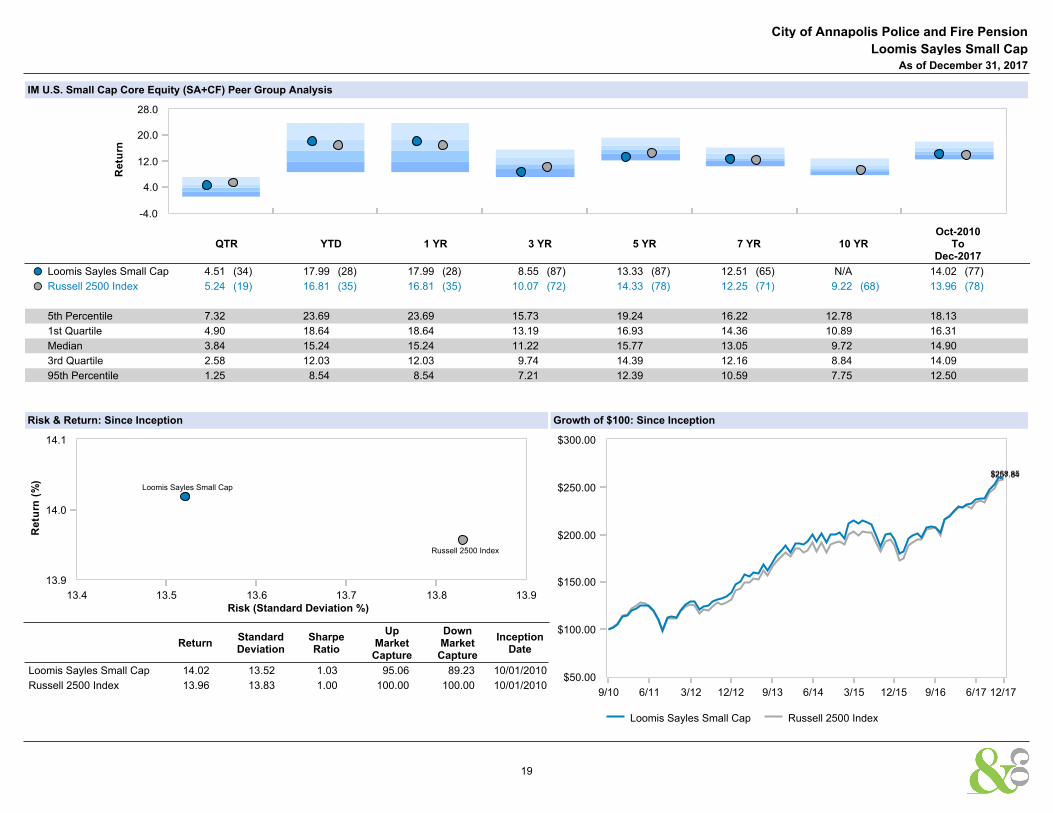
Loomis Sayles Small Cap 0.90 6,479,715 58,317 0.90 % of First $10 M0.80 % of Next $20 M0.70 % of Next $20 M0.60 % Thereafter
Total Global/International Equity 0.84 36,433,571 305,972
Total Global Equity 0.74 26,621,682 198,041
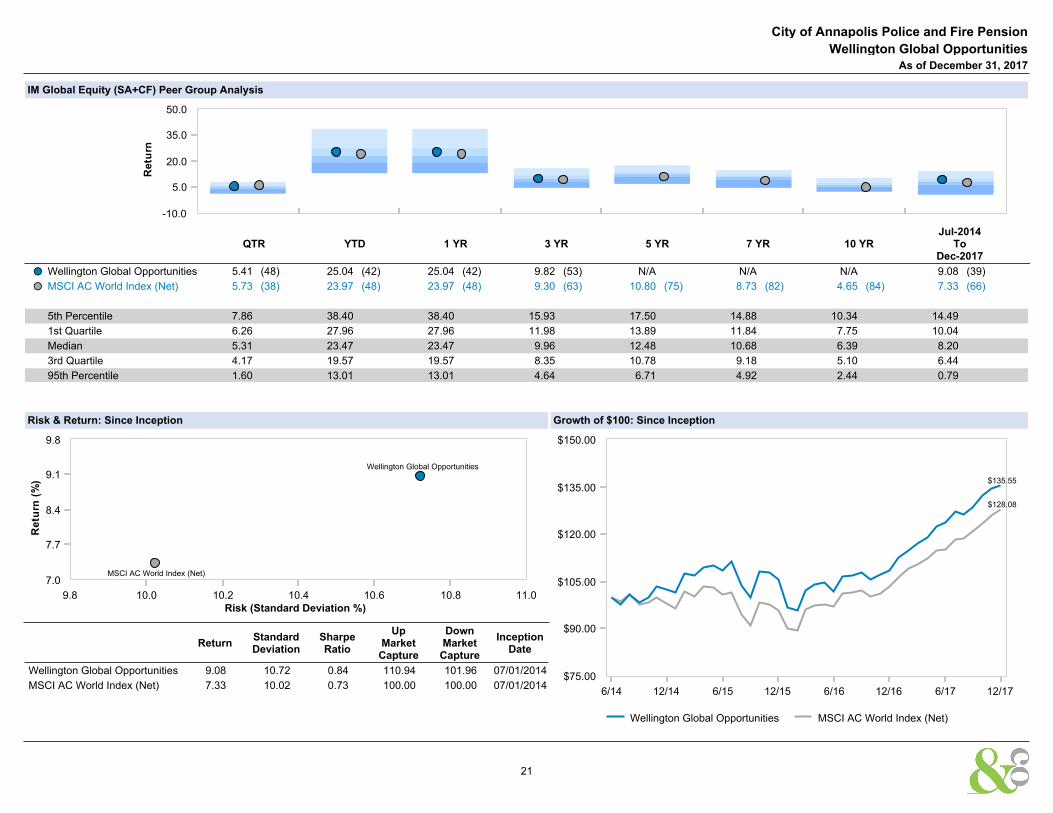
Wellington Global Opportunities 0.74 26,621,682 198,041 0.75 % of First $25 M0.65 % of Next $25 M0.55 % Thereafter
Total Emerging Market Equity 1.10 9,811,889 107,931
Oaktree Real Estate Debt Fund II, L.P. ($4 mil) 1.00 470,083 4,701 1.00 % of Assets
City of Annapolis Police and Fire Pension
Fee Analysis
As of December 31, 2017
42
City of Annapolis Police and Fire Pension
Fee Analysis
As of December 31, 2017
EstimatedAnnual Fee
(%)
Market Value($)
EstimatedAnnual Fee
($)Fee Schedule
Total Real Estate 0.96 9,756,536 93,175
UBS - Trumbull Property Fund 0.96 4,825,257 46,081 0.96 % of First $10 M0.83 % of Next $15 M0.81 % of Next $25 M0.79 % of Next $50 M0.67 % of Next $150 M0.60 % of Next $150 M0.56 % of Next $200 M0.52 % Thereafter
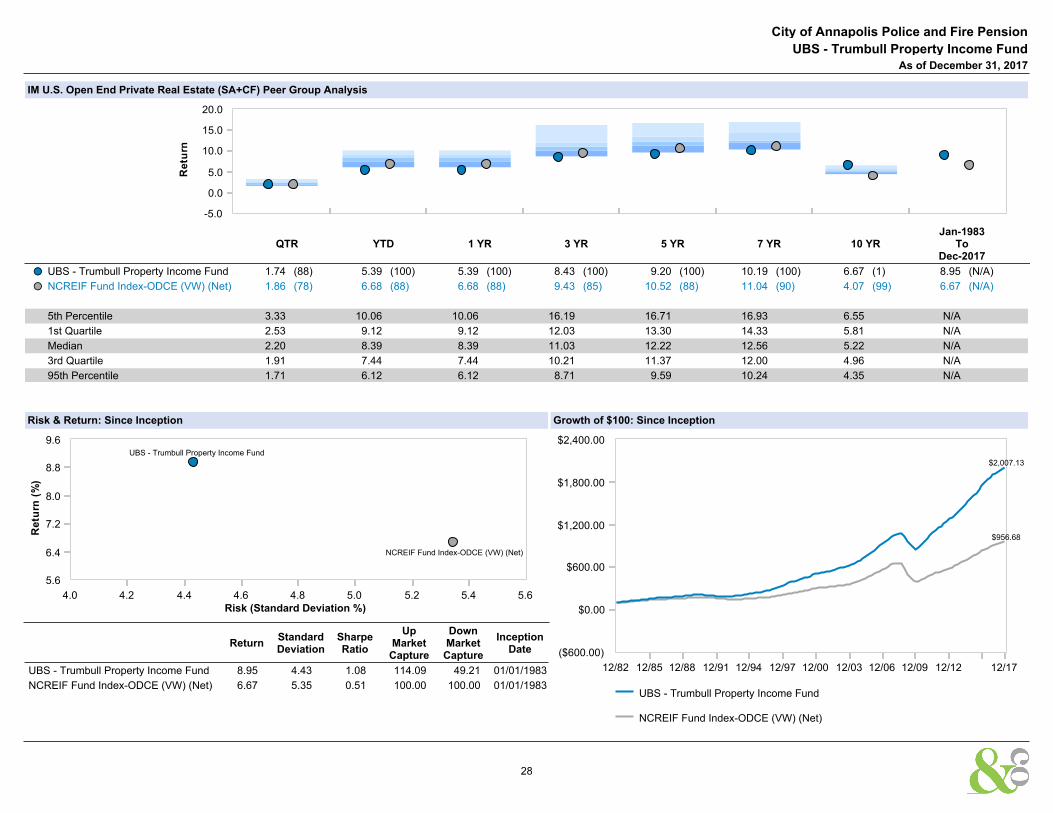
UBS - Trumbull Property Income Fund 0.96 4,931,279 47,094 0.96 % of First $10 M0.83 % of Next $15 M0.81 % of Next $25 M0.79 % of Next $50 M0.67 % of Next $150 M0.60 % of Next $150 M0.56 % of Next $200 M0.52 % Thereafter
Total Fund of Hedge Funds and Co-Investments 1.27 31,052,136 394,913
Grosvenor Institutional Partners, L.P. 1.15 16,009,946 184,114 1.15 % of First $25 M1.00 % of Next $25 M0.80 % of Next $50 M0.60 % Thereafter
EnTrust Capital Special Opportunities Fund II ($10 mil) 1.25 3,123,922 39,049 1.25 % of Assets
EnTrust Capital Special Opportunities Fund III ($2.5 mil) 1.25 2,809,579 35,120 1.25 % of Assets
Total Long/Short Equity 1.50 9,108,689 136,630
Lighthouse Global Long/Short Equity Lmited Class A 1.50 9,108,689 136,630 1.50 % of Assets
Total Commodity - -
Total Cash 8,786,663 -
Cash Account/Administrative Reserve 8,785,762 -
Cash Account (Mutual Funds/Wellington) 811 -
Cash Account (Alternatives) 89 -
43
Historical Hybrid Composition
Allocation Mandate Weight (%)
Jul-2017
S&P 500 Index 23.00
Russell Midcap Index 8.00
Russell 2500 Index 5.00
MSCI AC World Index (Net) 13.00
MSCI Emerging Markets (Net) Index 5.00
Bloomberg Barclays Intermed Aggregate Index 20.00
HFRI Fund of Funds Composite Index 17.00
NCREIF Fund Index-ODCE (EW) (Net) 6.00
BB Agg + 5% 1.00
90 Day U.S. Treasury Bill 2.00
Jul-2015
S&P 500 Index 24.00
Bloomberg Barclays Intermed Aggregate Index 29.00
Russell Midcap Index 5.00
Russell 2000 Index 3.00
Bloomberg Commodity Index Total Return 3.00
NCREIF Property Index 4.00
Wilshire U.S. REIT Index 2.00
HFRI Fund of Funds Composite Index 7.00
MSCI AC World Index (Net) 12.00
MSCI Emerging Markets (Net) Index 4.00
90 Day U.S. Treasury Bill 2.00
HFRI Equity Hedge (Total) Index 5.00
Jul-2014
S&P 500 Index 25.00
Bloomberg Barclays Intermed Aggregate Index 29.00
Russell Midcap Index 3.00
Russell 2000 Index 4.00
Bloomberg Commodity Index Total Return 3.00
NCREIF Property Index 4.00
Wilshire U.S. REIT Index 2.00
HFRI Fund of Funds Composite Index 7.00
MSCI AC World Index (Net) 12.00
MSCI Emerging Markets (Net) Index 4.00
90 Day U.S. Treasury Bill 2.00
HFRI Equity Hedge (Total) Index 5.00
Allocation Mandate Weight (%)
Dec-2013
S&P 500 Index 25.00
Bloomberg Barclays Intermed Aggregate Index 22.00
Russell Midcap Index 3.00
Russell 2000 Index 4.00
Bloomberg Commodity Index Total Return 3.00
NCREIF Property Index 4.00
Wilshire U.S. REIT Index 2.00
HFRI Fund of Funds Composite Index 7.00
MSCI World (net) 9.00
MSCI Emerging Markets (Net) Index 4.00
Pyrford Blended Index 10.00
90 Day U.S. Treasury Bill 2.00
HFRI Equity Hedge (Total) Index 5.00
Sep-2013
S&P 500 Index 26.00
Bloomberg Barclays Intermed Aggregate Index 25.00
Russell Midcap Index 3.00
Russell 2000 Index 4.00
Bloomberg Commodity Index Total Return 3.00
NCREIF Property Index 4.00
Wilshire U.S. REIT Index 2.00
HFRI Fund of Funds Composite Index 6.00
MSCI World (net) 8.50
MSCI Emerging Markets (Net) Index 4.00
Pyrford Blended Index 12.50
90 Day U.S. Treasury Bill 2.00
Apr-2012
S&P 500 Index 28.00
Bloomberg Barclays Intermed Aggregate Index 19.00
Russell 2000 Index 4.00
Bloomberg Commodity Index Total Return 3.00
NCREIF Property Index 4.00
Wilshire U.S. REIT Index 2.00
HFRI Fund of Funds Composite Index 6.00
MSCI World (net) 8.00
MSCI Emerging Markets (Net) Index 4.00
Pyrford Blended Index 20.00
90 Day U.S. Treasury Bill 2.00
Historical Hybrid Composition
Total Fund Policy
As of December 31, 2017
44
Historical Hybrid Composition
Total Fund Policy
As of December 31, 2017
Allocation Mandate Weight (%)
Jan-2009
S&P 500 Index 29.00
Bloomberg Barclays Intermed Aggregate Index 33.00
MSCI EAFE (Net) Index 6.00
Russell 2000 Index 5.00
Bloomberg Commodity Index Total Return 3.00
NCREIF Property Index 4.00
Wilshire U.S. REIT Index 2.00
HFRI Fund of Funds Composite Index 8.00
MSCI World (net) 8.00
90 Day U.S. Treasury Bill 2.00
Jun-2008
S&P 500 Index 40.00
Bloomberg Barclays Intermediate US Govt/Credit Idx 32.00
MSCI EAFE (Net) Index 8.00
Russell 2000 Index 5.00
Bloomberg Commodity Index Total Return 5.00
NCREIF Property Index 6.00
90 Day U.S. Treasury Bill 4.00
Jan-2007
S&P 500 Index 41.00
Bloomberg Barclays Intermediate US Govt/Credit Idx 35.00
MSCI EAFE (Net) Index 8.00
Russell 2000 Index 5.00
Bloomberg Commodity Index Total Return 5.00
NCREIF Property Index 6.00
Jan-1997
S&P 500 Index 50.00
Bloomberg Barclays Intermediate US Govt/Credit Idx 35.00
MSCI EAFE (Net) Index 10.00
Russell 2000 Index 5.00
Jan-1973
S&P 500 Index 50.00
Bloomberg Barclays Intermediate US Govt/Credit Idx 40.00
MSCI EAFE (Net) Index 10.00
45
0
Investment Policy Statement
1
Investment Policy Statement
December 2017
Re: Annual New Issue Eligibility Certification
Dear Investor:
In order to comply with the Financial Industry Regulatory Authority (“FINRA”) Rule 5130,
formerly NASD Rule 2790 (Restrictions on the Purchase and Sale of IPO Equity Securities)
and Rule 5131 respectively, (collectively, “the FINRA Rules”), each year we are required
to have Shareholders of EnTrust Special Opportunities Fund II Ltd. re-certify their eligibility
to participate in the profits and losses associated with “new issues” of equity securities.
According to our records your investment is classified as either restricted or not
restricted1. If your status under the FINRA Rules has not changed, you do not need to
respond to this letter. However, if your status has changed, or if you have a question
concerning your status, please complete and return the enclosed New Issue Eligibility
Certifications. If we do not receive updated Certifications by December 29, 2017, we will
assume that there has been no change to your status under the FINRA Rules.
In addition, enclosed please find a copy of our Form ADV, Parts 2A and 2B and Privacy
Policy.
If you have any questions concerning your status under the FINRA Rules or the enclosed
Certification, please do not hesitate to contact Bruce Kahne at (212) 224-5548.
Sincerely,
Jill Zelenko
Chief Financial Officer
1 The term “restricted” indicates that you are a “Restricted Person” under Rule 5130 and/or Rule
5131 and that your participation in profits and losses from new issues is limited to the extent
permitted by each such Rule. The term “not restricted” indicates that you are eligible to
participate in profits and losses from new issues.
EnTrust Special Opportunities Fund II Ltd. (the “Fund”)
The investor named above (“Investor”) must complete this Certification in order
for the Fund to be able to determine the extent to which the Investor may participate in
“new issue” securities. Pursuant to Rule 5130 of the U.S. Financial Industry Regulatory
Authority (“FINRA”), “restricted persons” are limited in their ability to purchase or
otherwise participate in the profits associated with new issues, i.e., initial public offerings
of equity securities. Restricted persons include broker/dealers, certain persons
associated with or related to broker/dealers, portfolio managers (including managers of
hedge funds), and certain other persons. Rule 5130, however, provides several limited
exemptions from this prohibition. While the Investor acknowledges that the Fund may not
actually invest in “new issues” and is under no obligation to do so, the Investor hereby
makes the appropriate certification below and further agrees to furnish whatever
information or documentation the Fund may require in order to demonstrate to the
Fund’s satisfaction that the beneficial owner of the Interests either qualifies for one of the
available exemptions from Rule 5130’s prohibition or is otherwise not a “restricted
person.” If the Investor is a corporation, partnership, limited liability company, trust or any
other entity or a nominee for another person, the person completing this Certification
with respect to the Investor MUST be the beneficial owner(s), a person authorized to
represent the beneficial owner(s), or a bank, foreign bank, broker-dealer, investment
adviser or other conduit acting on behalf of the beneficial owner(s).
INSTRUCTIONS: Please check items (1), (2), or (3) below, as applicable, to confirm
your status under Rule 5130 (please check all that apply):
(1) [_] The Investor is a “restricted person” for purposes of
Rule 5130 because the Investor is (Please check all
of sub-items (a) through (f) below that apply.):
(a) [_] A member of FINRA (a “FINRA member”) or
any other broker/dealer;
(b) [_] An officer, director, general partner,
associated person or employee of a FINRA
member or any other broker/dealer (other
than a limited business broker/dealer1); or
1. “Limited business broker/dealer” means any broker/dealer whose authorization to engage in
the securities business is limited solely to the purchase and sale of investment
company/variable contracts securities and direct participation program securities.
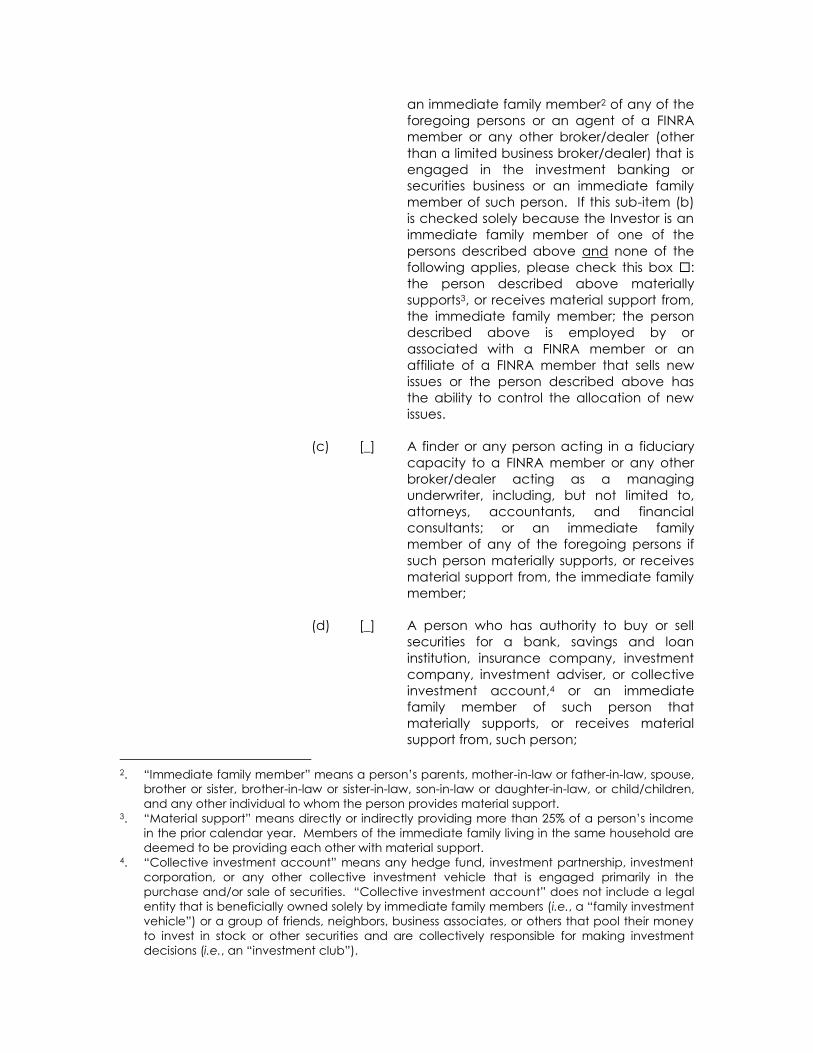
an immediate family member2 of any of the
foregoing persons or an agent of a FINRA
member or any other broker/dealer (other
than a limited business broker/dealer) that is
engaged in the investment banking or
securities business or an immediate family
member of such person. If this sub-item (b)
is checked solely because the Investor is an
immediate family member of one of the
persons described above and none of the
following applies, please check this box :
the person described above materially
supports3, or receives material support from,
the immediate family member; the person
described above is employed by or
associated with a FINRA member or an
affiliate of a FINRA member that sells new
issues or the person described above has
the ability to control the allocation of new
issues.
(c) [_] A finder or any person acting in a fiduciary
capacity to a FINRA member or any other
broker/dealer acting as a managing
underwriter, including, but not limited to,
attorneys, accountants, and financial
consultants; or an immediate family
member of any of the foregoing persons if
such person materially supports, or receives
material support from, the immediate family
member;
(d) [_] A person who has authority to buy or sell
securities for a bank, savings and loan
institution, insurance company, investment
company, investment adviser, or collective
investment account,4 or an immediate
family member of such person that
materially supports, or receives material
support from, such person;
2. “Immediate family member” means a person’s parents, mother-in-law or father-in-law, spouse,
brother or sister, brother-in-law or sister-in-law, son-in-law or daughter-in-law, or child/children,
and any other individual to whom the person provides material support. 3. “Material support” means directly or indirectly providing more than 25% of a person’s income
in the prior calendar year. Members of the immediate family living in the same household are
deemed to be providing each other with material support. 4. “Collective investment account” means any hedge fund, investment partnership, investment
corporation, or any other collective investment vehicle that is engaged primarily in the
purchase and/or sale of securities. “Collective investment account” does not include a legal
entity that is beneficially owned solely by immediate family members (i.e., a “family investment
vehicle”) or a group of friends, neighbors, business associates, or others that pool their money
to invest in stock or other securities and are collectively responsible for making investment
decisions (i.e., an “investment club”).
(e) [_] A person that (Please check all of sub-items
(i) through (vi) below that apply.):
(i) [_] is listed, or required to be listed, in
Schedule A of a Form BD (other than
with respect to a limited business
broker/dealer), except persons
identified by an ownership code of
less than 10%,
(ii) [_] is listed, or required to be listed, in
Schedule B of a Form BD (other than
with respect to a limited business
broker/dealer), except persons
whose listing on Schedule B relates to
an ownership interest in a person
listed on Schedule A identified by an
ownership code of less than 10%,
(iii) [_] is listed, or required to be listed, in
Schedule C of a Form BD, which
person meets the criteria described
in (i) or (ii) above,
(iv) [_] directly or indirectly owns 10% or
more of a public reporting company
listed, or required to be listed, in
Schedule A of a Form BD (other than
a reporting company that is listed on
a national securities exchange or is
traded on the Nasdaq National
Market or other than with respect to
a limited business broker/dealer),
(v) [_] directly or indirectly owns 25% or
more of a public reporting company
listed, or required to be listed, in
Schedule B of a Form BD (other than
a reporting company that is listed on
a national securities exchange or is
traded on the Nasdaq National
Market or other than with respect to
a limited business broker/dealer), or
(vi) [_] is an immediate family member of a
person specified in any of items (i)
through (v) above.
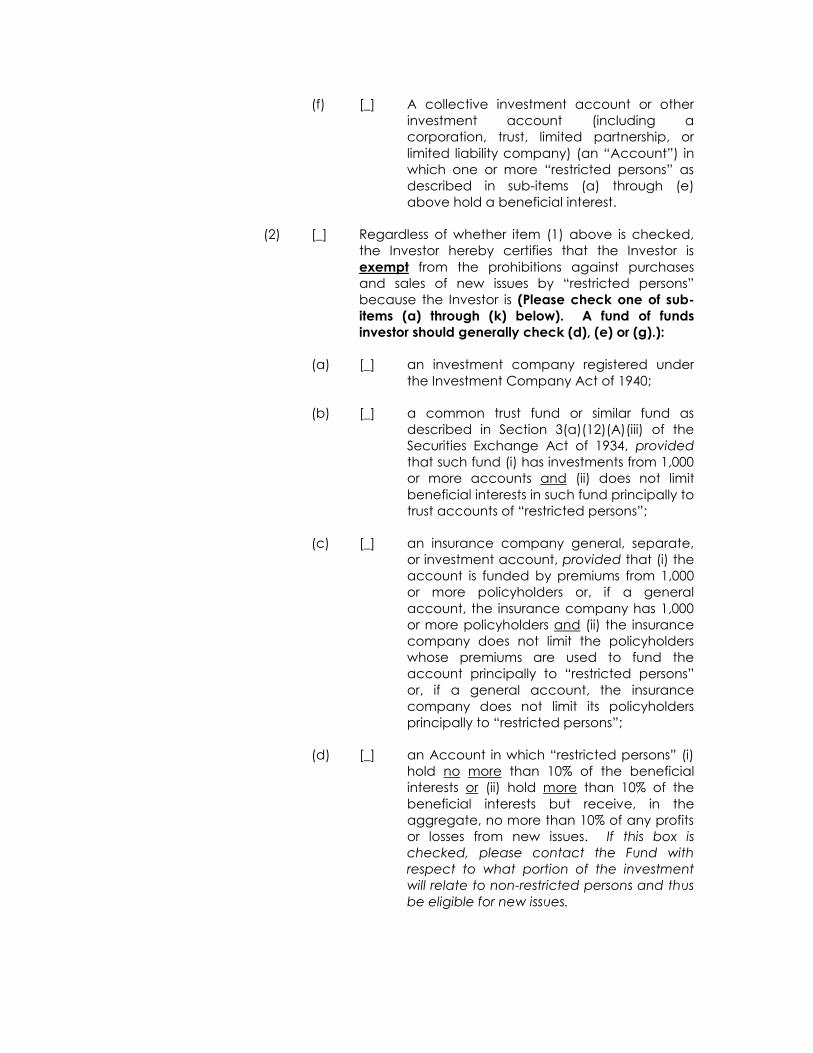
(f) [_] A collective investment account or other
investment account (including a
corporation, trust, limited partnership, or
limited liability company) (an “Account”) in
which one or more “restricted persons” as
described in sub-items (a) through (e)
above hold a beneficial interest.
(2) [_] Regardless of whether item (1) above is checked,
the Investor hereby certifies that the Investor is
exempt from the prohibitions against purchases
and sales of new issues by “restricted persons”
because the Investor is (Please check one of sub-
items (a) through (k) below). A fund of funds
investor should generally check (d), (e) or (g).):
(a) [_] an investment company registered under
the Investment Company Act of 1940;
(b) [_] a common trust fund or similar fund as
described in Section 3(a)(12)(A)(iii) of the
Securities Exchange Act of 1934, provided
that such fund (i) has investments from 1,000
or more accounts and (ii) does not limit
beneficial interests in such fund principally to
trust accounts of “restricted persons”;
(c) [_] an insurance company general, separate,
or investment account, provided that (i) the
account is funded by premiums from 1,000
or more policyholders or, if a general
account, the insurance company has 1,000
or more policyholders and (ii) the insurance
company does not limit the policyholders
whose premiums are used to fund the
account principally to “restricted persons”
or, if a general account, the insurance
company does not limit its policyholders
principally to “restricted persons”;
(d) [_] an Account in which “restricted persons” (i)
hold no more than 10% of the beneficial
interests or (ii) hold more than 10% of the
beneficial interests but receive, in the
aggregate, no more than 10% of any profits
or losses from new issues. If this box is
checked, please contact the Fund with
respect to what portion of the investment
will relate to non-restricted persons and thus
be eligible for new issues.
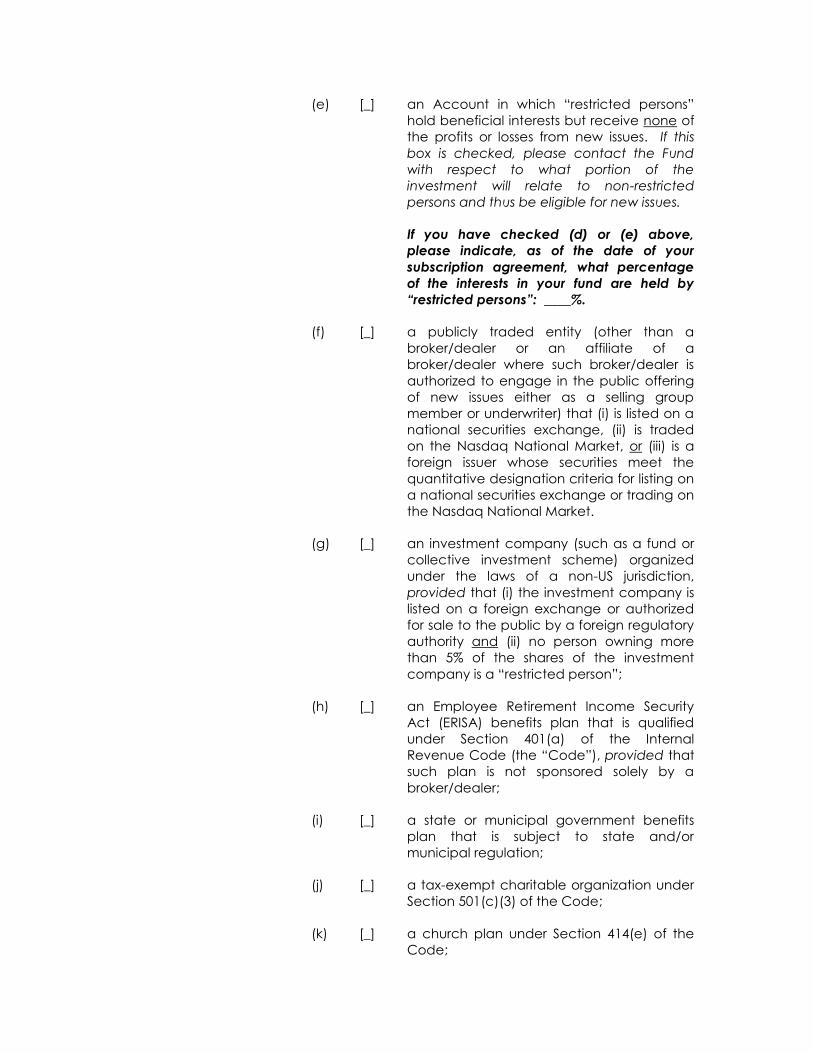
(e) [_] an Account in which “restricted persons”
hold beneficial interests but receive none of
the profits or losses from new issues. If this
box is checked, please contact the Fund
with respect to what portion of the
investment will relate to non-restricted
persons and thus be eligible for new issues.
If you have checked (d) or (e) above,
please indicate, as of the date of your
subscription agreement, what percentage
of the interests in your fund are held by
“restricted persons”: ____%.
(f) [_] a publicly traded entity (other than a
broker/dealer or an affiliate of a
broker/dealer where such broker/dealer is
authorized to engage in the public offering
of new issues either as a selling group
member or underwriter) that (i) is listed on a
national securities exchange, (ii) is traded
on the Nasdaq National Market, or (iii) is a
foreign issuer whose securities meet the
quantitative designation criteria for listing on
a national securities exchange or trading on
the Nasdaq National Market.
(g) [_] an investment company (such as a fund or
collective investment scheme) organized
under the laws of a non-US jurisdiction,
provided that (i) the investment company is
listed on a foreign exchange or authorized
for sale to the public by a foreign regulatory
authority and (ii) no person owning more
than 5% of the shares of the investment
company is a “restricted person”;
(h) [_] an Employee Retirement Income Security
Act (ERISA) benefits plan that is qualified
under Section 401(a) of the Internal
Revenue Code (the “Code”), provided that
such plan is not sponsored solely by a
broker/dealer;
(i) [_] a state or municipal government benefits
plan that is subject to state and/or
municipal regulation;
(j) [_] a tax-exempt charitable organization under
Section 501(c)(3) of the Code;
(k) [_] a church plan under Section 414(e) of the
Code;
(3) [_] The Investor has not checked item (1) and/or item
(2) above, and the Investor hereby certifies that the
prospective beneficial owner of the Interests
subscribed for in this subscription application is not
a “restricted person.” (N.B. If two or more persons
would be joint beneficial owners of such Interests,
this certification may be made only if true with
respect to each joint beneficial owner.)
The undersigned Investor acknowledges that in making representations to brokers or
underlying funds, the Fund will be relying upon the information provided by the Investor in
this Certification and agrees to notify the Fund promptly when any representation made
herein is no longer accurate. If the Investor is a corporation, partnership, limited liability
company, trust or other entity, the person signing this Certification (i) is authorized to
represent the Investor, and (ii) has the full power and authority under the Investor’s
IF YOUR NEW ISSUES STATUS HAS CHANGED UNDER FINRA RULE 5131(B), WE
REQUEST THAT YOU COMPLETE AND SIGN THIS QUESTIONNAIRE IN CONNECTION WITH THE
REQUIREMENTS OF THE RULE.
INSTRUCTIONS: Each limited partner or shareholder, as applicable, of a Fund listed
above (each, an “Investor”) should complete this Questionnaire by reviewing the
information set forth below and checking the box next to all applicable categories under
“Item I. Determination of Restricted Investor Status” or “Item II. Determination of
Unrestricted Investor Status,” and provide any additional information requested.
Item I. DETERMINATION OF RESTRICTED INVESTOR STATUS:
Please check all appropriate boxes.
The Investor is:
(a) an executive officer or director of a Public Company. A “Public
Company” is any company that is registered under Section 12 of
the Securities and Exchange Act of 1934, as amended (the
“Exchange Act”), or any company that files periodic reports
pursuant to Section 15(d) of the Exchange Act.
Name(s) of Public Company/ies:
_____________________________________
_____________________________________
_____________________________________
(b) an executive officer or director of a Covered Non-Public
Company. A “Covered Non-Public Company” means any non-
public company with:
1. income of at least $1 million in the last fiscal year or in two
of the last three fiscal years and shareholders’ equity of at
least $15 million; or
2. shareholders’ equity of at least $30 million and a two-year
operating history; or
3. total assets and total revenue of at least $75 million in the
latest fiscal year or in two of the last three fiscal years.
Name(s) of Covered Non-Public Company/ies:
____________________________________________
____________________________________________
____________________________________________
(c) a person materially supported by an executive officer or director
of a Public Company or a Covered Non-Public Company.
“Material support” means directly or indirectly providing more than
25% of a person’s income in the prior calendar year. Persons living
in the same household are deemed to be providing each other
with material support.
Name(s) of Public Company/ies or Covered Non-Public
Company/ies:
____________________________________________
____________________________________________
____________________________________________
(d) a foreign or domestic account or investment fund (for example, a
limited partnership, limited liability company or trust) in which
persons included in any of paragraphs (a)-(c) above have a
beneficial interest2 (each, a “Restricted Participant”).
If this item is checked, indicate the company or companies on
whose behalf such executive officers or directors serve and the
percentage share of profits or losses attributable to new issues to
be received by all Restricted Participants related to each such
company:
Name of Company Share of profits
__________________________ _____________________
__________________________ _____________________
__________________________ _____________________
__________________________ _____________________
An Investor that is a Restricted Investor under this Item I(d) may still
be able to participate in new issue investments if it indicates below
that it is an Unrestricted Investor.
Item II. DETERMINATION OF UNRESTRICTED INVESTOR STATUS:
The Investor is:
(a) a foreign or domestic account or investment fund (for example, a
limited partnership, limited liability company or trust) in which
persons included in any of Item I paragraphs (a)-(c) have a
beneficial interest2 (each, a “Restricted Participant”), but the
Investor hereby represents and warrants that such Restricted
Participants affiliated with the same Public Company or Covered
Non-Public Company in the aggregate (as to each such Public
Company or Covered Non-Public Company) are allocated no
more than 25% of any profits or losses attributable to new issues
received by the Investor.
If this item is checked, indicate the company on whose behalf
such executive officer or director serves and the percentage share
2 The term “beneficial interest” means any economic interest such as the right to share in gains or losses. The receipt of a
management or performance based fee for operating a collective investment account, or other fee for acting in a fiduciary capacity, is not considered a beneficial interest in the account; however, if such fee is subsequently invested into the account (as a deferred
fee arrangement or otherwise), it is considered a beneficial interest in that account.
of profits or losses attributable to new issues to be received by all
Restricted Participants:
Name of company Share of profits
__________________________ _____________________
__________________________ _____________________
__________________________ _____________________
__________________________ _____________________
(b) a publicly-traded entity (other than a broker-dealer or an affiliate
of a broker-dealer, where such broker-dealer is authorized to
engage in the public offering of new issues either as a selling group
member or underwriter) that is listed on a national securities
exchange or is a foreign issuer whose securities meet the
quantitative designation criteria for listing on a national securities
exchange.
(c) an investment company registered under the Investment
Company Act of 1940, as amended.
(d) an investment company organized under the laws of a foreign
jurisdiction, provided that:
(A) the investment company is listed on a foreign exchange for
sale to the public or authorized for sale to the public by a foreign
regulatory authority; and
(B) no person owning more than 5% of the shares of the investment
company is a restricted person (under FINRA Rule 5130).
(e) (A) an employee benefits plan under the U.S. Employee
Retirement Income Security Act of 1974, as amended, that is
qualified under Section 401(a) of the U.S. Internal Revenue Code
of 1986, as amended and such plan is not sponsored solely by a
broker-dealer, (B) a state or municipal government benefits plan
that is subject to state and/or municipal regulation or (C) a church
plan under Section 414(e) of the Code.
(f) a tax exempt charitable organization under Section 501(c)(3) of
the Code.
(g) a common trust fund or similar fund as described in Section
3(a)(12)(A)(iii) of the U.S. Securities Exchange Act of 1934, as
amended, provided that the fund:
(A) has investments from 1,000 or more accounts, and
(B) does not limit beneficial interests (as defined above) in the fund
principally to trust accounts of restricted persons (under FINRA Rule
5130).
(h) an insurance company general, separate or investment account,
provided that:
(A) the account is funded by premiums from 1,000 or more
policyholders, or, if a general account, the insurance company
has 1,000 or more policyholders, and
(B) the insurance company does not limit the policyholders whose
premiums are used to fund the account principally to restricted
persons (under FINRA Rule 5130), or, if a general account, the
insurance company does not limit its policyholders principally to
restricted persons (under FINRA Rule 5130).
(i) None of the paragraphs in Item I or Item II above apply to the
Investor.
If Item I(d) above applies to you, and no paragraph of Item II also applies, then you are
a “Restricted Investor” and must represent yourself as such by checking the applicable
box below.
If you checked any of Item II paragraphs (a) to (h) above, you are an “Unrestricted
Investor” under Rule 5131 and must represent yourself as such by checking the
applicable box below.
The Investor is: a Restricted Investor.
an Unrestricted Investor.
The undersigned Investor acknowledges and agrees that, if (i) the Fund determines,
based upon information provided by the Investor or otherwise, that the Investor or any of
its beneficial owners is a Restricted Investor or (ii) the Investor does not fully complete this
Questionnaire, or provide all information requested in any annual representation or
otherwise requested by the Fund regarding the Investor’s status as a Restricted Investor,
the Fund may deem the Investor to be a Restricted Investor.
The undersigned Investor acknowledges that in making representations to broker-
dealers, the Fund will be relying upon the information provided by the Investor in this
Questionnaire and represents and warrants that such information may be relied upon by
the Fund, its advisers, its broker-dealers and any entities or investment managers with
which the Fund invests in complying with FINRA Rule 5131(b).
The undersigned Investor agrees to notify the Fund promptly when any response or
representation made herein is no longer accurate.
If the undersigned Investor is a corporation, partnership, limited liability company, trust or
any other entity, the person signing this Questionnaire (i) is authorized to represent the
Investor and (ii) has the full power and authority under the Investor’s governing
instruments to do so.
The Investor has executed this Questionnaire this ____ day of _________, 20__.