477
| Date post: | 01-May-2018 |
| Category: |
Documents |
| Upload: | dangkhuong |
| View: | 215 times |
| Download: | 1 times |


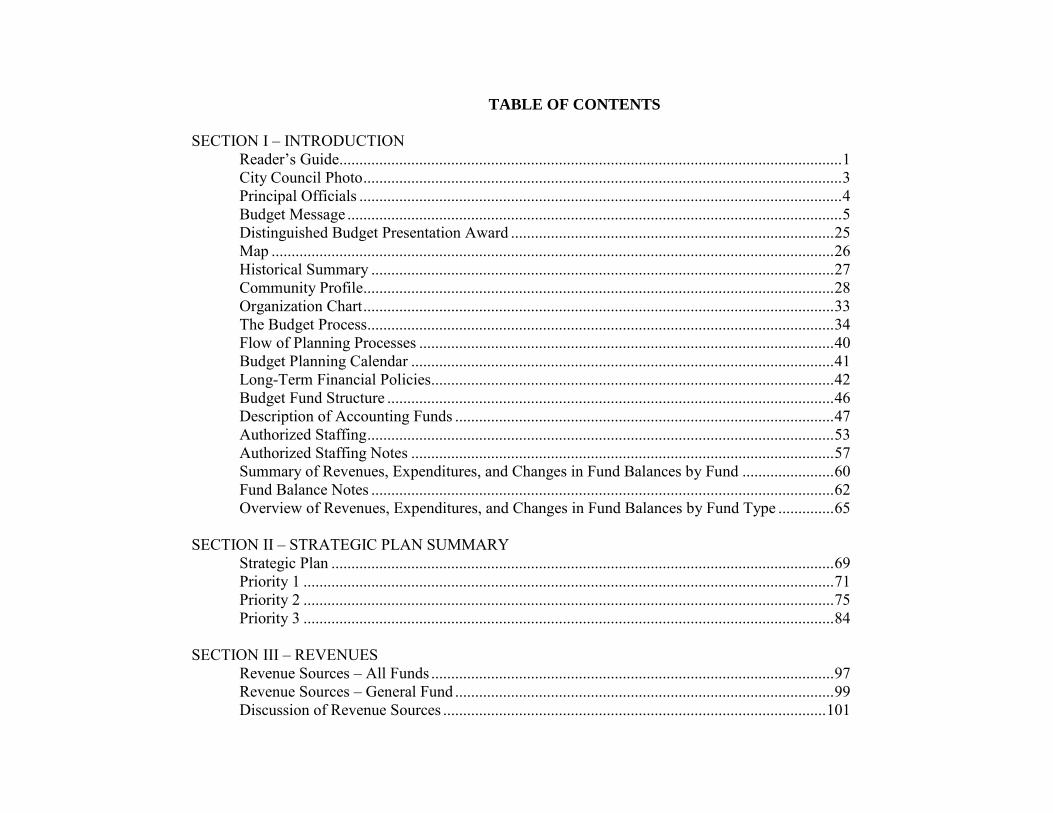
TABLE OF CONTENTS
SECTION I – INTRODUCTION Reader’s Guide.............................................................................................................................. 1 City Council Photo ........................................................................................................................ 3 Principal Officials ......................................................................................................................... 4 Budget Message ............................................................................................................................ 5 Distinguished Budget Presentation Award ................................................................................. 25 Map ............................................................................................................................................. 26 Historical Summary .................................................................................................................... 27 Community Profile...................................................................................................................... 28 Organization Chart ...................................................................................................................... 33 The Budget Process..................................................................................................................... 34 Flow of Planning Processes ........................................................................................................ 40 Budget Planning Calendar .......................................................................................................... 41 Long-Term Financial Policies..................................................................................................... 42 Budget Fund Structure ................................................................................................................ 46 Description of Accounting Funds ............................................................................................... 47 Authorized Staffing ..................................................................................................................... 53 Authorized Staffing Notes .......................................................................................................... 57 Summary of Revenues, Expenditures, and Changes in Fund Balances by Fund ....................... 60 Fund Balance Notes .................................................................................................................... 62 Overview of Revenues, Expenditures, and Changes in Fund Balances by Fund Type .............. 65 SECTION II – STRATEGIC PLAN SUMMARY Strategic Plan .............................................................................................................................. 69 Priority 1 ..................................................................................................................................... 71 Priority 2 ..................................................................................................................................... 75 Priority 3 ..................................................................................................................................... 84 SECTION III – REVENUES Revenue Sources – All Funds ..................................................................................................... 97 Revenue Sources – General Fund ............................................................................................... 99 Discussion of Revenue Sources ................................................................................................ 101
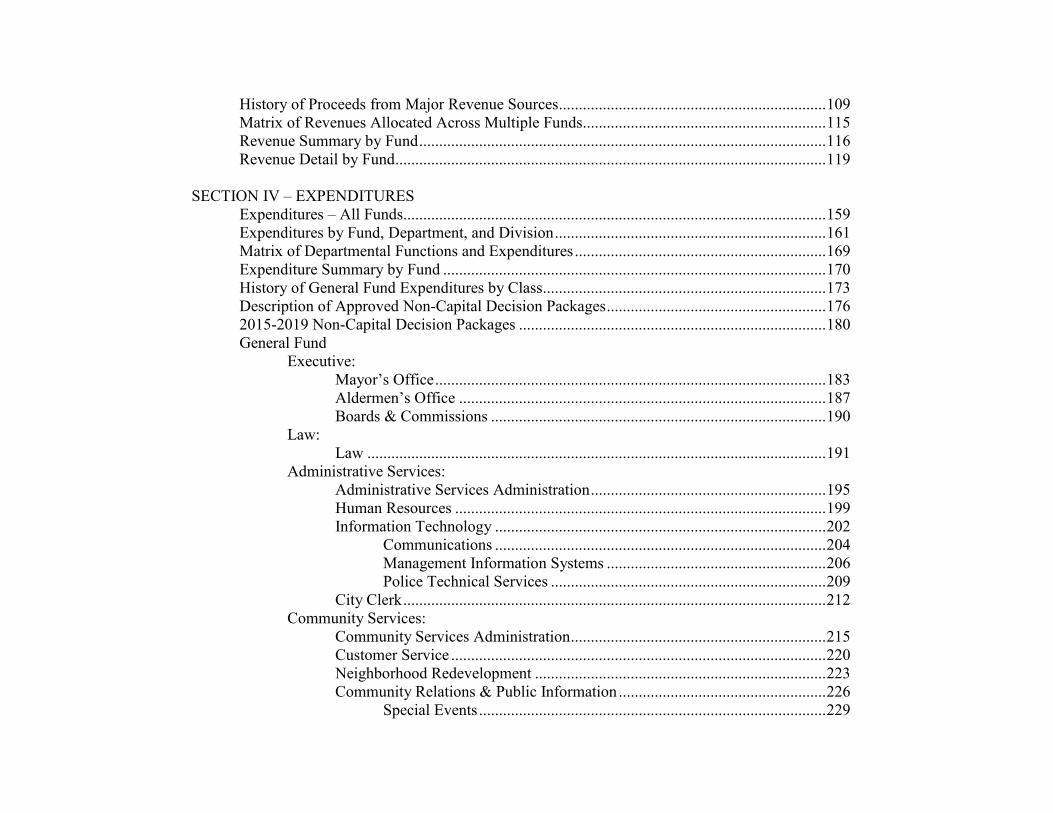
History of Proceeds from Major Revenue Sources................................................................... 109 Matrix of Revenues Allocated Across Multiple Funds............................................................. 115 Revenue Summary by Fund ...................................................................................................... 116 Revenue Detail by Fund............................................................................................................ 119 SECTION IV – EXPENDITURES Expenditures – All Funds.......................................................................................................... 159 Expenditures by Fund, Department, and Division .................................................................... 161 Matrix of Departmental Functions and Expenditures ............................................................... 169 Expenditure Summary by Fund ................................................................................................ 170 History of General Fund Expenditures by Class ....................................................................... 173 Description of Approved Non-Capital Decision Packages ....................................................... 176 2015-2019 Non-Capital Decision Packages ............................................................................. 180 General Fund Executive: Mayor’s Office .................................................................................................. 183 Aldermen’s Office ............................................................................................ 187 Boards & Commissions .................................................................................... 190 Law: Law ................................................................................................................... 191 Administrative Services: Administrative Services Administration ........................................................... 195 Human Resources ............................................................................................. 199 Information Technology ................................................................................... 202 Communications ................................................................................... 204 Management Information Systems ....................................................... 206 Police Technical Services ..................................................................... 209 City Clerk .......................................................................................................... 212 Community Services: Community Services Administration ................................................................ 215 Customer Service .............................................................................................. 220 Neighborhood Redevelopment ......................................................................... 223 Community Relations & Public Information .................................................... 226 Special Events ....................................................................................... 229
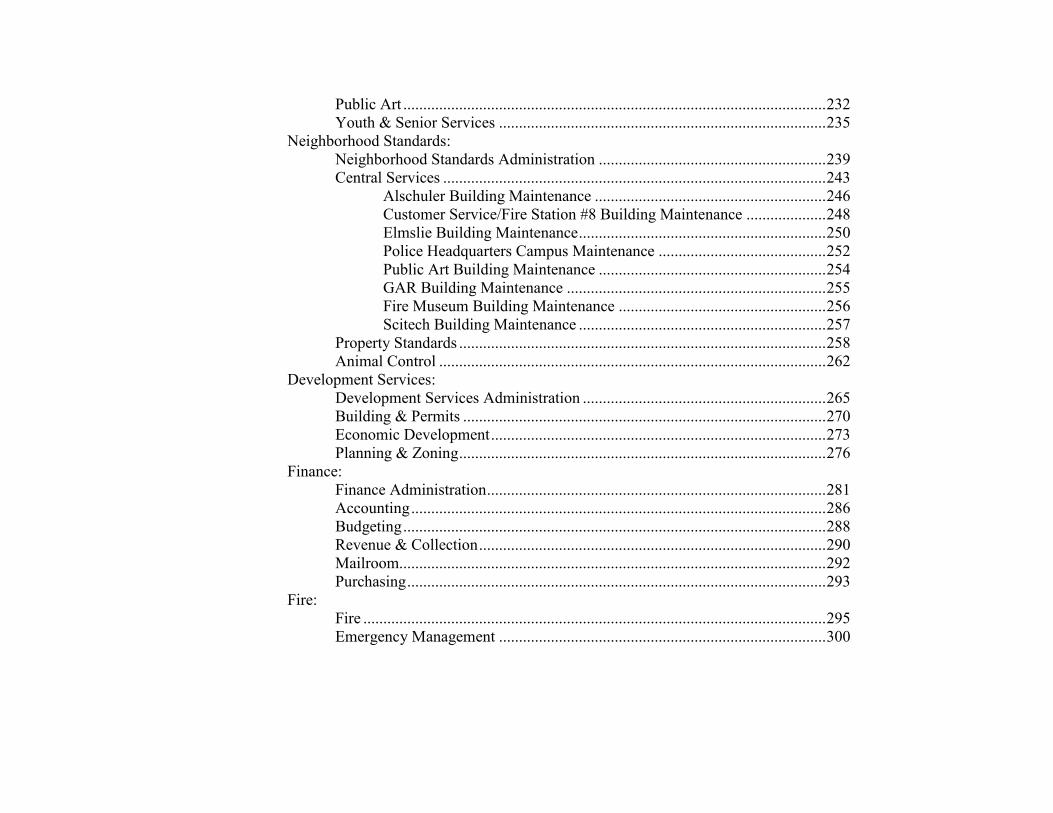
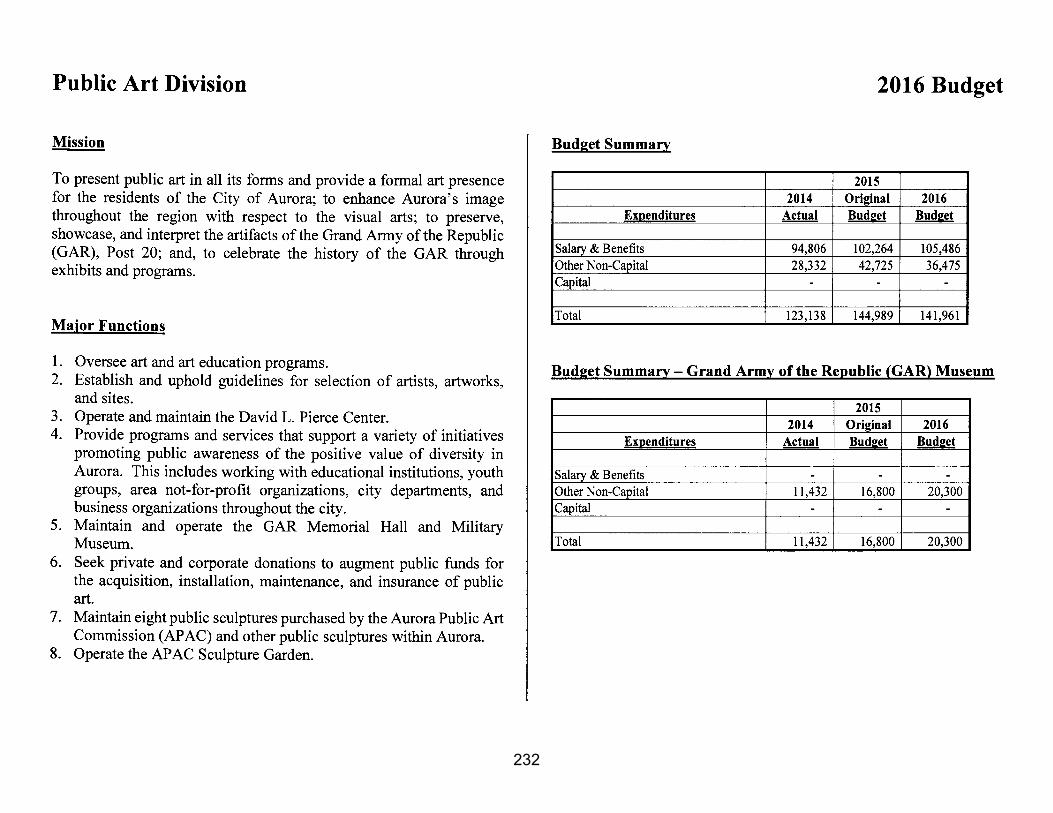
Public Art .......................................................................................................... 232 Youth & Senior Services .................................................................................. 235 Neighborhood Standards: Neighborhood Standards Administration ......................................................... 239 Central Services ................................................................................................ 243 Alschuler Building Maintenance .......................................................... 246 Customer Service/Fire Station #8 Building Maintenance .................... 248 Elmslie Building Maintenance .............................................................. 250 Police Headquarters Campus Maintenance .......................................... 252 Public Art Building Maintenance ......................................................... 254 GAR Building Maintenance ................................................................. 255 Fire Museum Building Maintenance .................................................... 256 Scitech Building Maintenance .............................................................. 257 Property Standards ............................................................................................ 258 Animal Control ................................................................................................. 262 Development Services: Development Services Administration ............................................................. 265 Building & Permits ........................................................................................... 270 Economic Development .................................................................................... 273 Planning & Zoning ............................................................................................ 276 Finance: Finance Administration ..................................................................................... 281 Accounting ........................................................................................................ 286 Budgeting .......................................................................................................... 288 Revenue & Collection ....................................................................................... 290 Mailroom........................................................................................................... 292 Purchasing ......................................................................................................... 293 Fire: Fire .................................................................................................................... 295
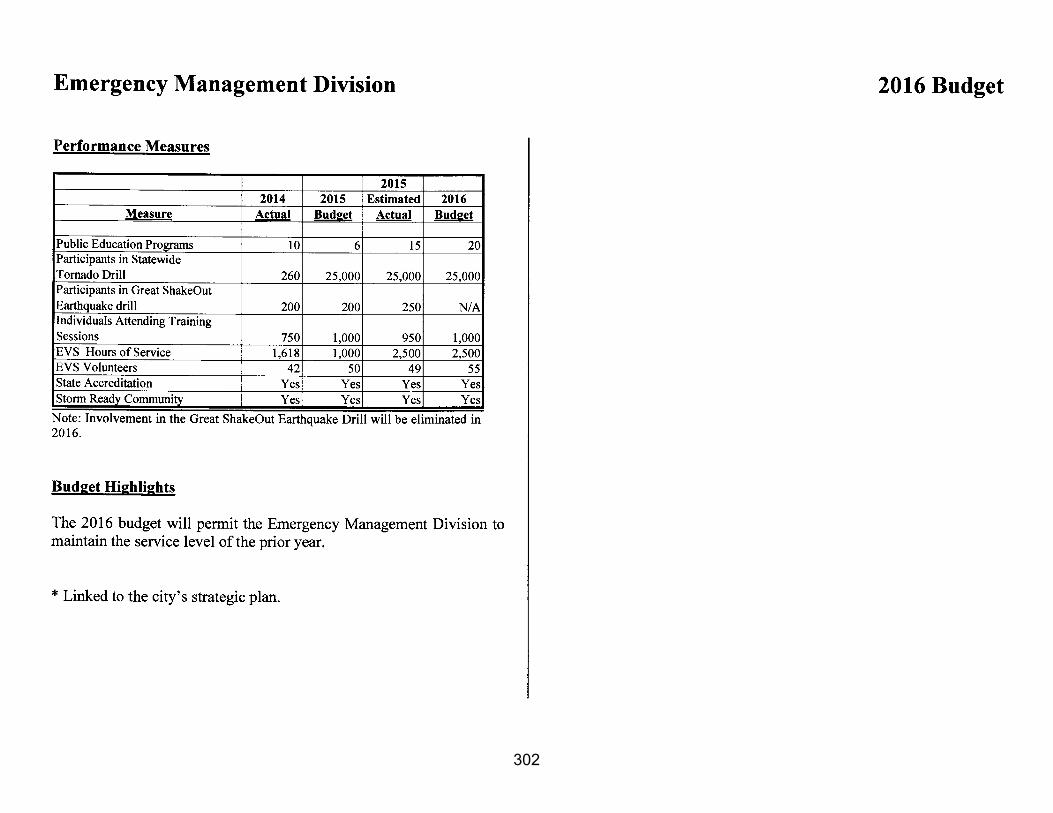
Emergency Management .................................................................................. 300

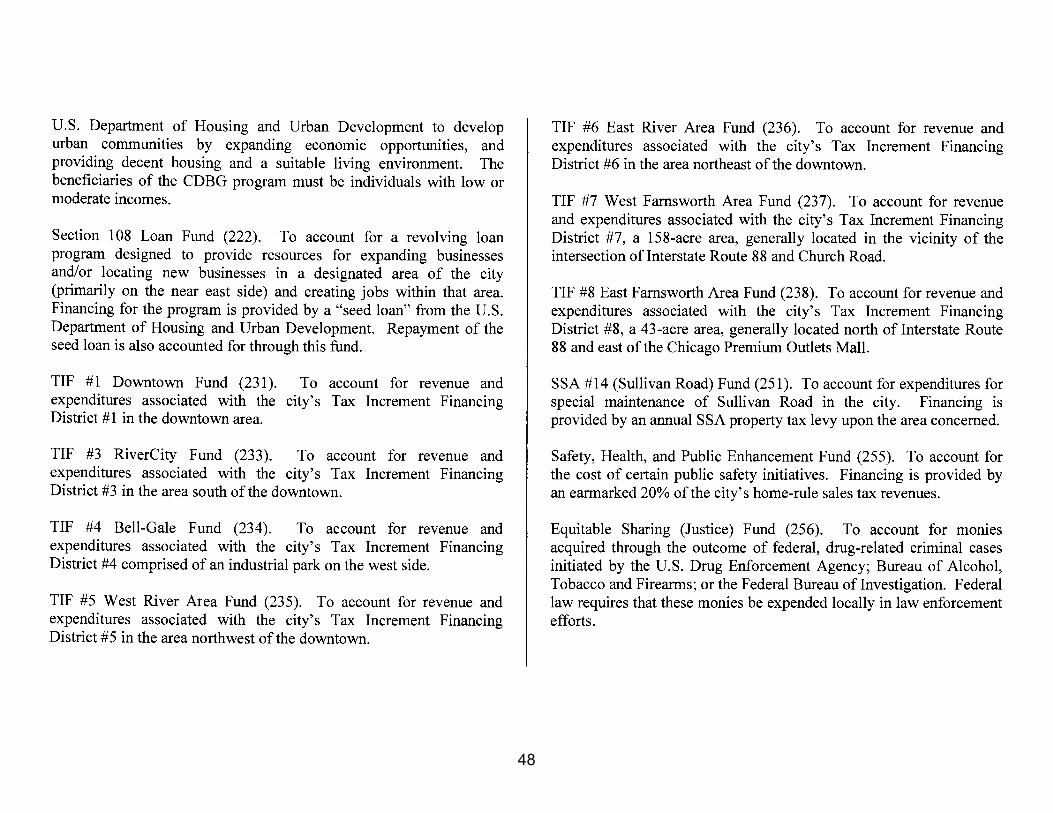
Police: Police................................................................................................................. 303 E911 Center ...................................................................................................... 308 Public Works: Public Works Administration ........................................................................... 311 Electrical Maintenance...................................................................................... 315 Engineering ....................................................................................................... 317 Public Properties: Public Properties Administration ...................................................................... 319 Maintenance Services ....................................................................................... 323 Parks & Recreation ........................................................................................... 326 Phillips Park Zoo................................................................................... 329 Street Maintenance............................................................................................ 331 Non-Departmental......................................................................................................... 333 Special Revenue Funds: Motor Fuel Tax Fund .................................................................................................... 335 Sanitation Fund ............................................................................................................. 336 Hotel-Motel Tax Fund .................................................................................................. 336 Wireless 911 Surcharge Fund ....................................................................................... 337 Municipal Motor Fuel Tax Fund................................................................................... 337 HOME Program Fund ................................................................................................... 338 Neighborhood Stabilization Fund ................................................................................. 338 Gaming Tax Fund ........................................................................................................ 339 Federal Asset Forfeiture Fund ...................................................................................... 344 State Asset Forfeiture Fund .......................................................................................... 344 Foreign Fire Insurance Tax Fund .................................................................................. 345 Block Grant Income Fund ............................................................................................. 345 Block Grant Fund .......................................................................................................... 346 Section 108 Loan Fund ................................................................................................. 347 TIF District #2 (Farnsworth Area) Fund ....................................................................... 349 TIF District #3 (RiverCity) Fund .................................................................................. 350 TIF District #4 (Bell Gale) Fund .................................................................................. 351 TIF District #5 (West River Area) Fund ....................................................................... 351 TIF District #6 (East River Area) Fund ........................................................................ 352

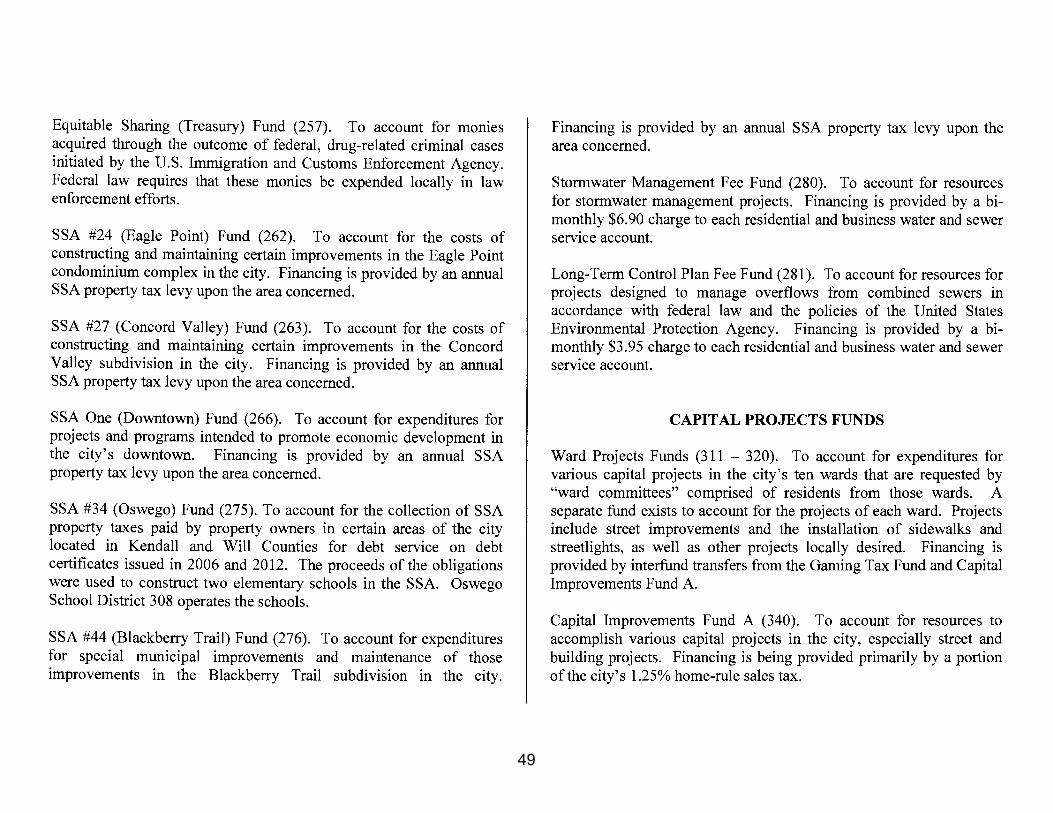
TIF District #7 (West Farnsworth Area) Fund ............................................................. 353 TIF District #8 (East Farnsworth Area) Fund ............................................................... 354 Special Service Area Fund (14) .................................................................................... 354 Safety, Health, and Public Enhancement Fund ............................................................. 355 Equitable Sharing-Justice Fund ....................................................................................356 Special Service Area Funds (24, 27, 1, 34, 44)............................................................. 357 Stormwater Management Fee Fund .............................................................................. 360 Long-Term Control Plan Fee Fund ............................................................................... 361 Capital Projects: Capital Projects Summary............................................................................................. 363 2016-2025 Capital Improvement Plan Summary ......................................................... 367 2016-2025 Capital Improvement Plan Projects by Category ....................................... 369 Operating Impact of Capital Expenditures ................................................................... 376 Ward Projects Funds ..................................................................................................... 382 Capital Improvements Fund A ...................................................................................... 393 2008A Tax Increment Financing Bond Project Fund ................................................... 398 Kane/DuPage Fire Impact Fee Fund ............................................................................. 398 Kendall/Will Fire Impact Fee Fund .............................................................................. 399 Public Works Impact Fee Fund..................................................................................... 399 2009 GO Bond Project Fund......................................................................................... 400 2015 GO Bond Project Fund......................................................................................... 400 Debt Service Fund: Discussion of Long-Term Debt .................................................................................... 401 Annual Principal Requirements .................................................................................... 403 Annual Debt Service Requirements .............................................................................. 404 Bond and Interest Fund ................................................................................................. 405 Proprietary Funds: Equipment Services Fund ............................................................................................. 409 Airport Fund ................................................................................................................. 411 Water & Sewer Fund .................................................................................................... 413 Motor Vehicle Parking System Fund ............................................................................ 425 Transit Centers Fund ..................................................................................................... 431 Golf Operations Fund ................................................................................................... 435 Property & Casualty Insurance Fund ............................................................................ 444
Employee Health Insurance Fund ................................................................................. 442 Employee Compensated Benefits Fund ........................................................................ 443 Trust Funds: Police Pension Fund ...................................................................................................... 445 Firefighters’ Pension Fund ............................................................................................ 446 Retiree Health Insurance Trust Fund ............................................................................ 447 Public Library Funds: Library General Fund .................................................................................................... 449 Library Capital Projects & Technology Fund ............................................................... 454 2012A GO Bond Project Fund ...................................................................................... 454 Library Bond & Interest Fund....................................................................................... 455 SECTION V – MISCELLANEOUS Glossary .................................................................................................................................... 457 Budget Ordinance ..................................................................................................................... 467

1

2
3
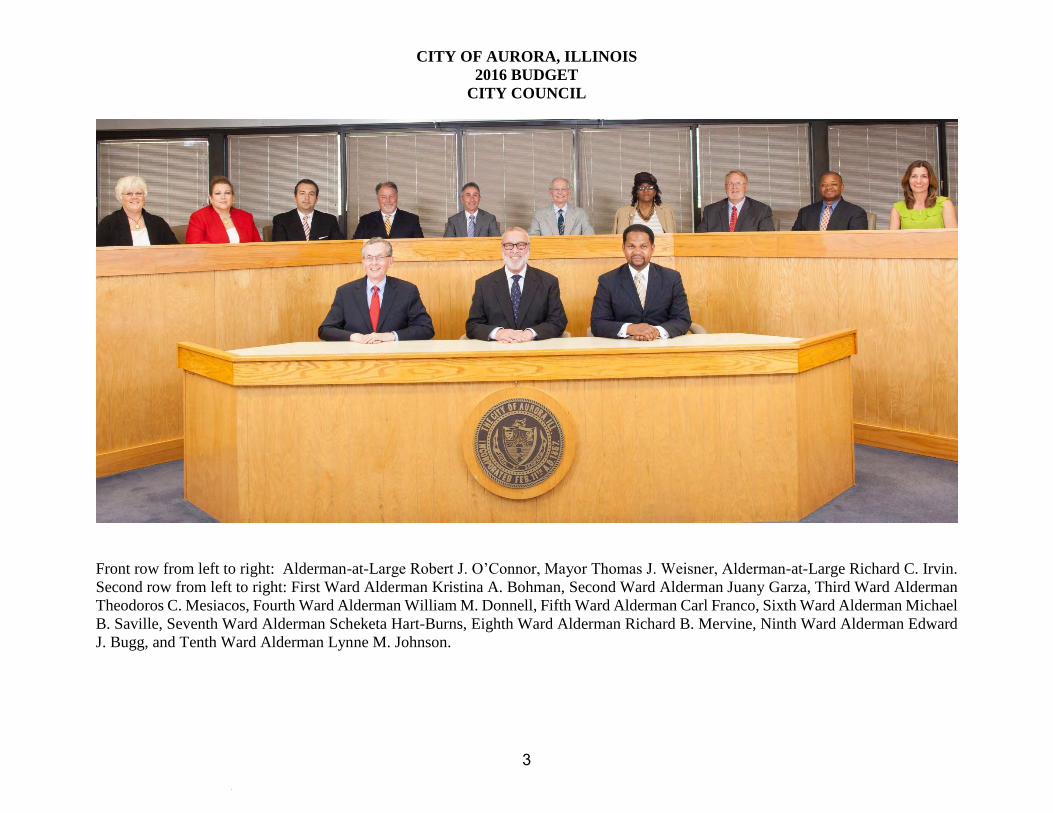
CITY OF AURORA, ILLINOIS 2016 BUDGET
CITY COUNCIL
Front row from left to right: Alderman-at-Large Robert J. O’Connor, Mayor Thomas J. Weisner, Alderman-at-Large Richard C. Irvin. Second row from left to right: First Ward Alderman Kristina A. Bohman, Second Ward Alderman Juany Garza, Third Ward Alderman Theodoros C. Mesiacos, Fourth Ward Alderman William M. Donnell, Fifth Ward Alderman Carl Franco, Sixth Ward Alderman Michael B. Saville, Seventh Ward Alderman Scheketa Hart-Burns, Eighth Ward Alderman Richard B. Mervine, Ninth Ward Alderman Edward J. Bugg, and Tenth Ward Alderman Lynne M. Johnson.
4


6
7
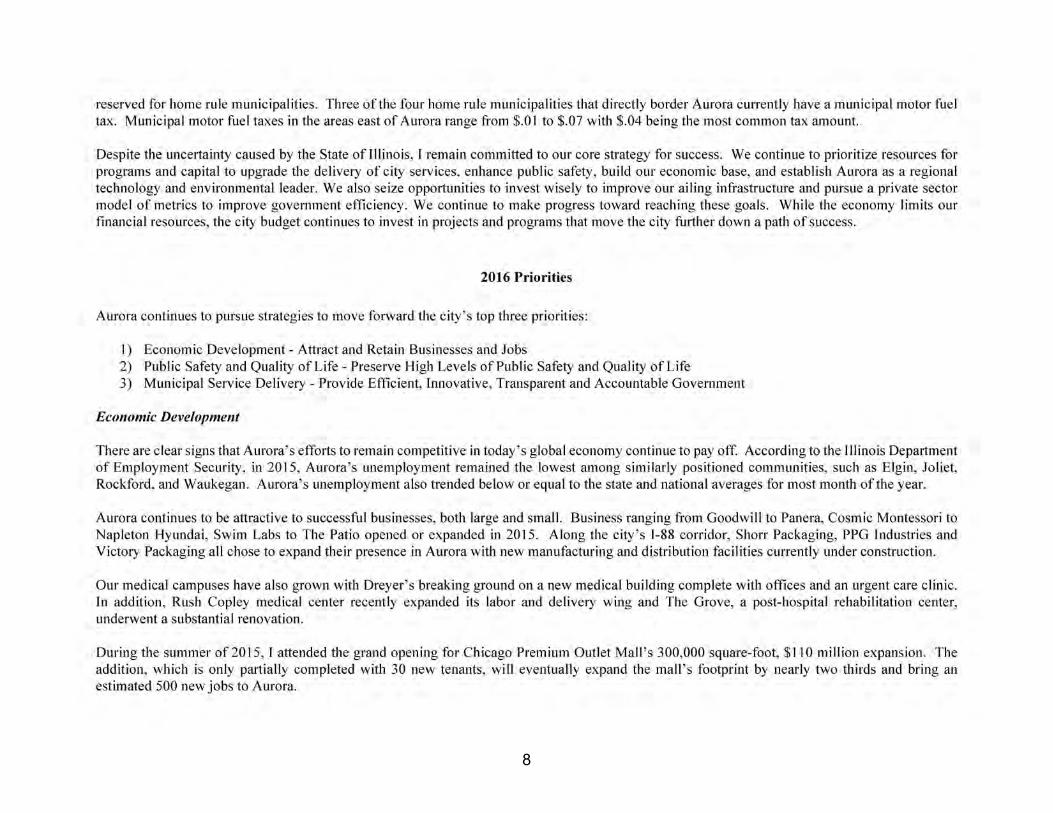
8
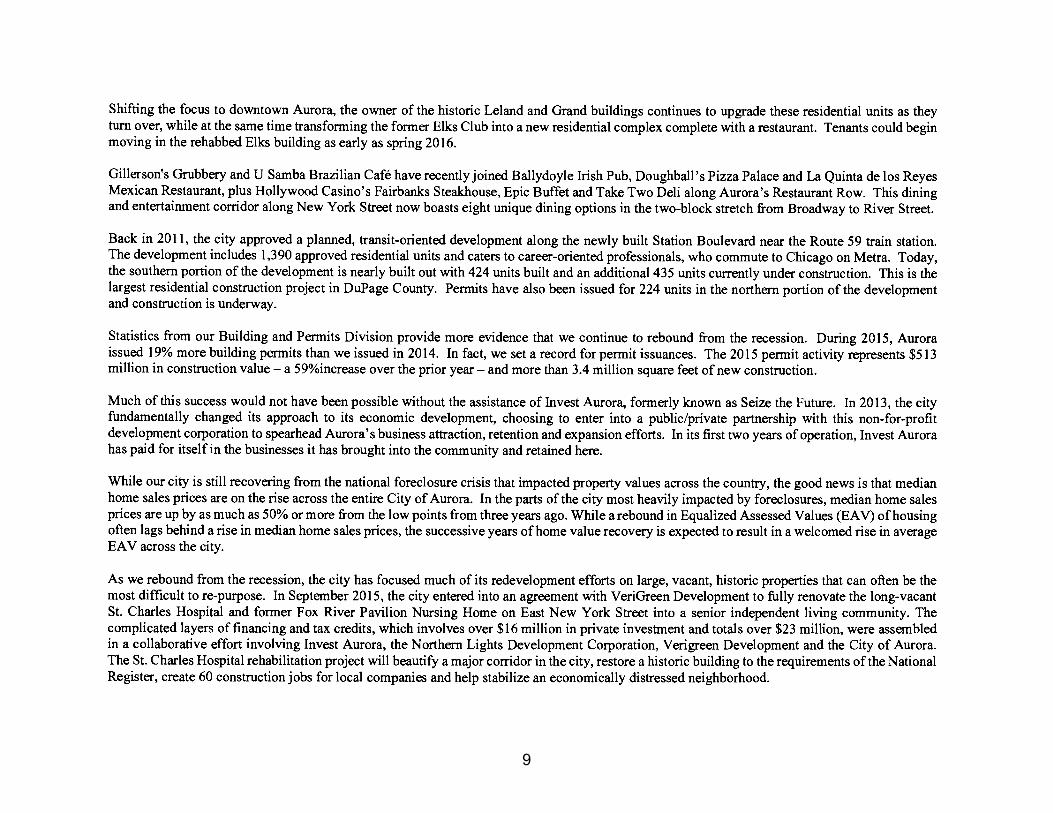
9

10

11

12

13

14

15
16

17

18
Revenue Projections for 2016
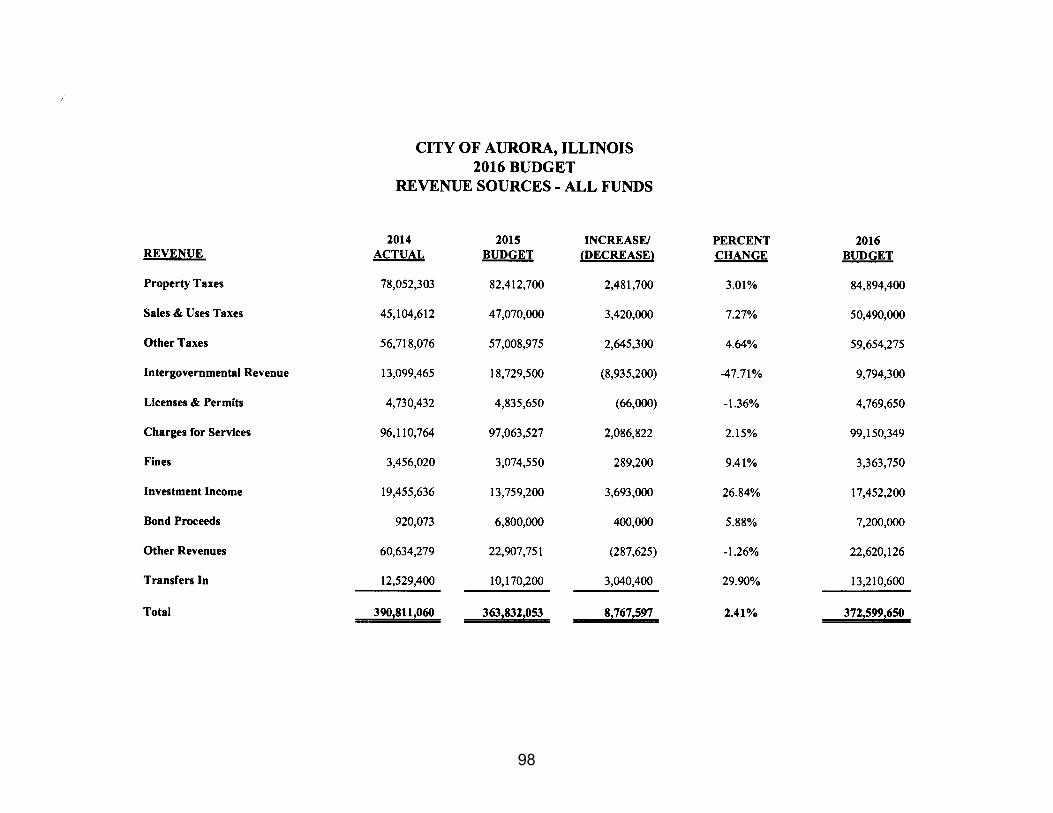
Total revenues projected for 2016 are $372.6 million. This is $8.8 million or 2.4% higher than the budgeted 2015 amount. The increase in total revenues is attributable to three items. First, sales tax revenues are expected to rise in 2016 as described below. Second, property tax revenues are expected to be slightly higher because of a $1.2 million increase in the General Fund levy to support general municipal operations. Finally, a new municipal motor fuel tax will contribute to the city’s revenue base.
The primary General Fund revenue sources are sales taxes, income taxes, and property taxes.
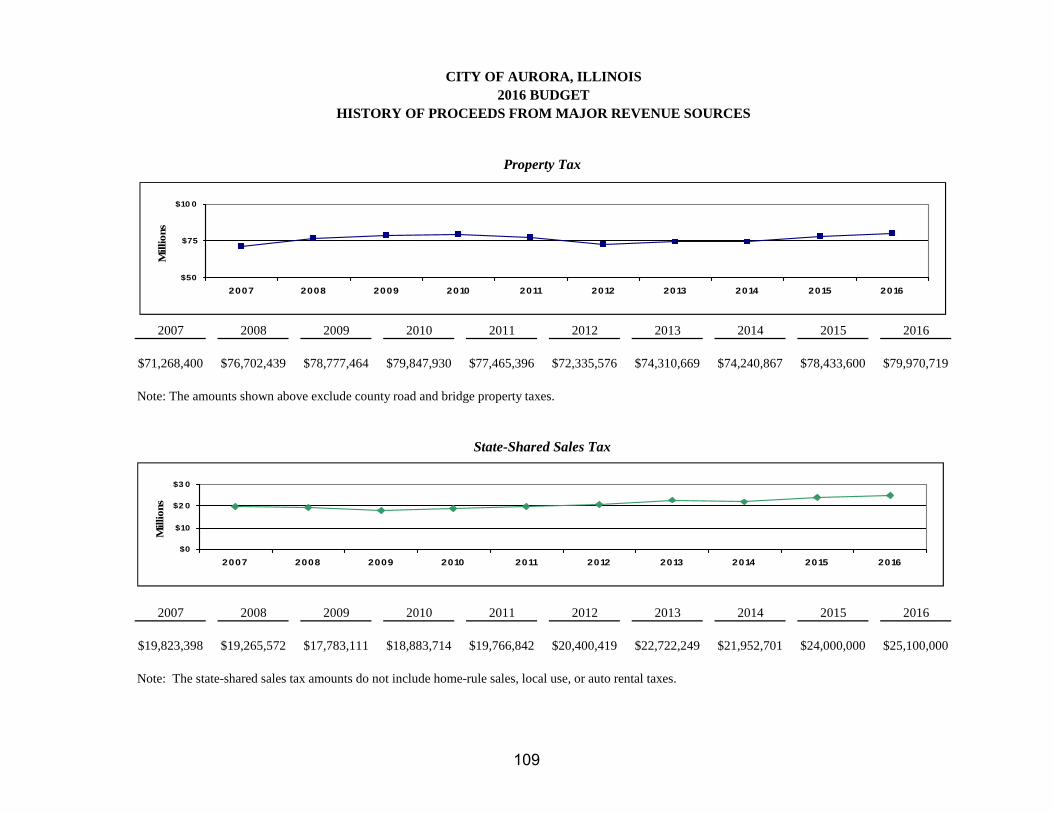
The city receives the equivalent of a 1% sales tax from the proceeds of a statewide sales tax that is distributed based upon point of sale by the Illinois Department of Revenue. During 2016, we project that state-shared sales tax revenue will be $25.1 million. This figure considers additional taxes now being generated by the new portion of the outlet mall near Interstate Route 88 and Farnsworth Avenue, the completion of the Route 59 road improvement project in another of the city’s retail corridors, and a general 2.0% increase in the other components of the city’s sales tax base. The graph below presents the trend in state-shared and home-rule sales tax since 2007.
*2015 and 2016 amounts are projected.
$16,000,000
$18,000,000
$20,000,000
$22,000,000
$24,000,000
$26,000,000
2007 2008 2009 2010 2011 2012 2013 2014 2015*2016*
City Sales Tax Revenues
State-SharedSales Tax
Home-RuleSales Tax

19

20
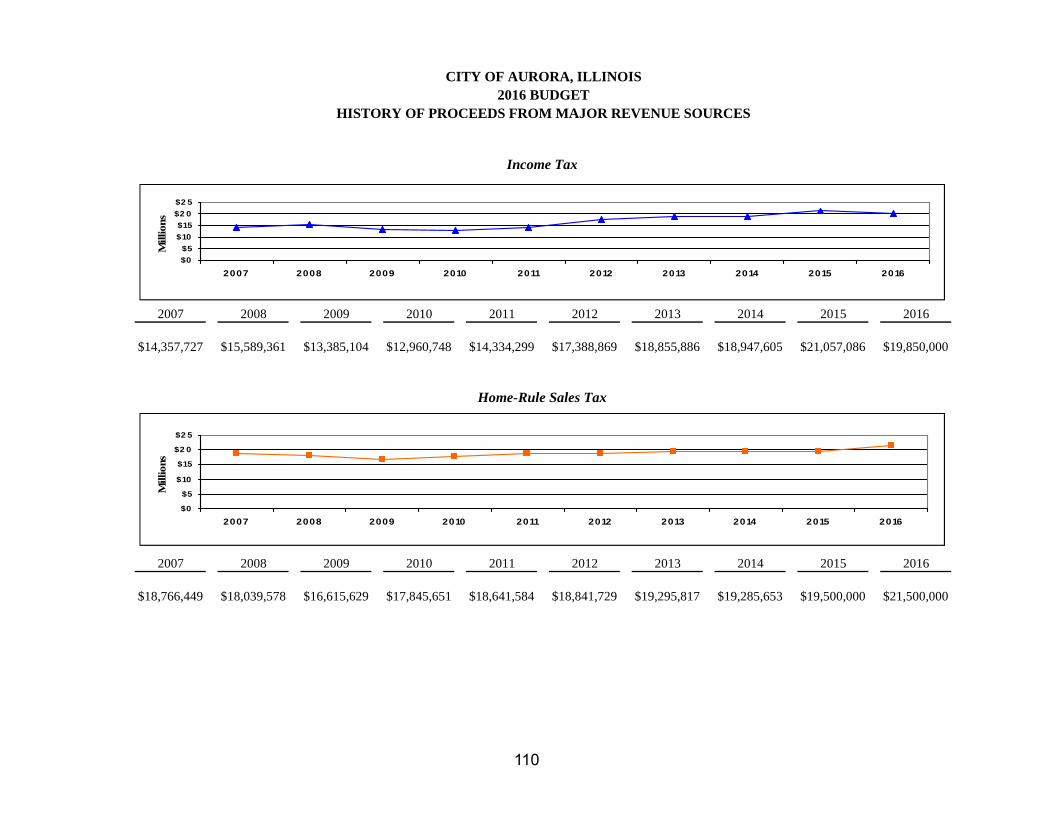
Income taxes are distributed by the State of Illinois based upon a statewide per capita formula. Thus, the state’s economy does affect the income tax revenues of the city. We estimate that those revenues will be $19.9 million in 2016, a modest increase from $19.5 million of revenues expected in 2015. Our 2016 estimate is based upon the distribution forecast of the Illinois Municipal League.
In recent months, elected officials of the State of Illinois have discussed certain proposals that would reduce the amount of income tax revenues distributed to Illinois municipalities. The city’s 2016 forecast for income tax revenues assumes that the state does not reduce the municipal share of this key revenue source.
The 2010 census recognized an increase in Aurora’s population from 164,681 to 197,899. The impact of the population increase was first seen in income tax revenues beginning in mid-2011.
*The 2015 and 2016 amounts are projected.
Property taxes (from the 2015 tax levy) are expected to generate a total of $70.4 million in 2016 for the city (excluding the library levy), compared to $69.5 million in 2015. Recognizing the financial hardship inflicted upon many city residents and businesses by the Great Recession, the city reduced its levy for general municipal operations from about $48.5 million in 2008 (taxes payable in 2009) to $40.9 million in 2014 (taxes payable in 2015) – a decrease of $7.6 million or over 15%. The property tax levy for the General Fund in 2014 (taxes payable in 2015) was actually lower than the levy in 2005. However, the diminished level of the General Fund levy cannot be maintained as the cost of goods and services rise under normal inflationary pressure. Therefore, the 2016 budget includes a $1.2 million increase in the 2015 levy for the General Fund.
The graph below presents the trend of the city’s property tax extensions for General Fund purposes since 2007 (2006 property tax levy).
$12,000,000
$14,000,000
$16,000,000
$18,000,000
$20,000,000
Income Taxes

21
*2016 amount is projected.
Prior to 2011, the city’s extension for its contributions to the Illinois Municipal Retirement Fund (IMRF) were actually included in the extension for the General Fund. The estimated IMRF extensions have been subtracted from the pre-2011 amounts included in the graph above to enhance comparability.
Pursuant to state law and actuarial valuations, the levies for the city’s pension funds will decrease by a combined total of about $320,000. As in the prior 10 years, the 2015 property tax levy will include a $4.0 million component to help pay the debt service on general obligation bonds issued to finance the construction of the new police headquarters. In addition, $9.6 million will be levied to support the operations of the Aurora Public Library (including library debt service).
$40,000,000
$42,000,000
$44,000,000
$46,000,000
$48,000,000
$50,000,000
2007 2008 2009 2010 2011 2012 2013 2014 2015 2016*
Property Tax Extensions for the City General Fund

22
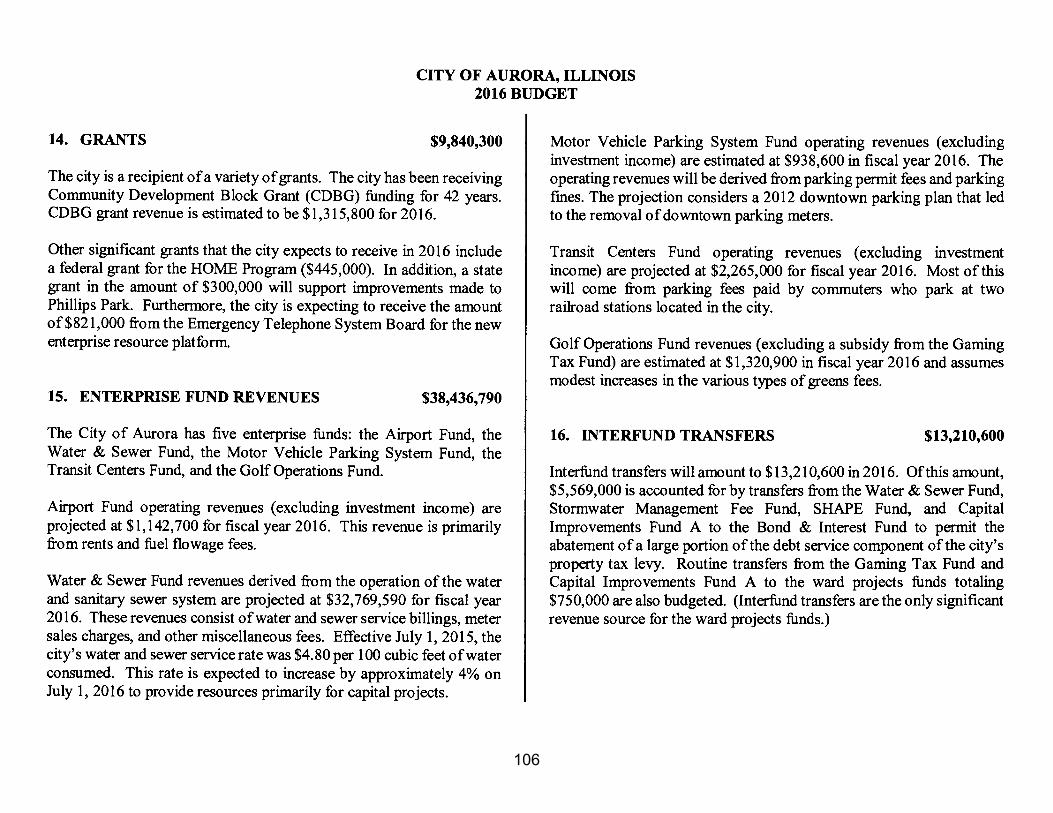
Casino gaming taxes, generated from Aurora’s riverboat casino are projected to be $7.2 million in 2016. This is approximately the same amount expected to be received in 2015. Gaming taxes are deposited into a separate special revenue fund of the city and used primarily for economic development initiatives and certain non-core services.
Gaming taxes have proven to be a revenue source that can vary significantly from year to year. Over the past ten years, casino gaming taxes have been affected by tax law changes, an indoor smoking ban in public places, economic downturns, the opening of other casinos in Illinois and the approval of video gaming.
Four rate increases are included in the revenue projections:
Property Tax. The amount to be included in the property tax levy for the General Fund as discussed above will increase the city property tax rate by about $0.04 per $100 of equalized assessed valuation (EAV). Disregarding any possible change in the city’s EAV from 2014 to 2015, the resultant tax rate will be approximately $2.31 per $100 of EAV.
Municipal Motor Fuel Tax (MMFT). To provide a stable source of funding for the city’s Neighborhood Street Resurfacing Program, a 4¢-per-gallon MMFT will be imposed. The tax is expected to generate about $3.2 million for the annual street program.
*The 2015 and 2016 amounts are projected.
Water and Sewer Service Fee. An aggregate water and sewer rate increase of approximately 4%, to be effective July 1, 2016, istaken into account. This water and sewer rate increase is in keeping with the city’s policy of imposing moderate increases on anannual basis so as to avoid large increases at irregular intervals. The rate change will offset increases in the cost of operating the water and sanitary sewer system and provide continued funding for water/sewer-related capital projects.
$6,000,000
$8,000,000
$10,000,000
$12,000,000
$14,000,000
$16,000,000
Casino Gaming Taxes

23

24

25

26SOURCE: MIS DIV. CITY OF AURORA, AURORA, IL., 2016
CITY OF AURORA, ILLINOIS 2016 BUDGET - LOCAL MAP
Bl.
Jericho
Rd.
Edge
law
n
Rd.
Dr.
St.
Lake
St.
Aurora
Montgomery
Oswego
SugarGrove
North Aurora
Naperville
IL RT 47
Eol
a
IL RT
25
Galena
Ran
dall
Rd.
Prairie
U.S. Route 30
E New York St
Ogden Av
Oak St
Route 30
Farn
swor
th
Butterfield Rd
Route 56
IL R
T 56
Rd.
Montgomery
Sullivan Rd.
Route 30
95th St
North Aurora RdSheffer Rd
Route 59
Hill
Av
Av.
IL.
Rou
te 5
9
I - 88
W.
IL
RT
31
IL RT 71
IL. Route 34
Indian Trail
Broadway
Mad
ison
St
Main St
East - West Tollway
Orc
hard
Rd.
´
27

28

29

30
31

32
33

34

35
36
37
38

39
40

41

42
43

44

45
46

47
48
49

50

51

52
53

54
55
56
57

58

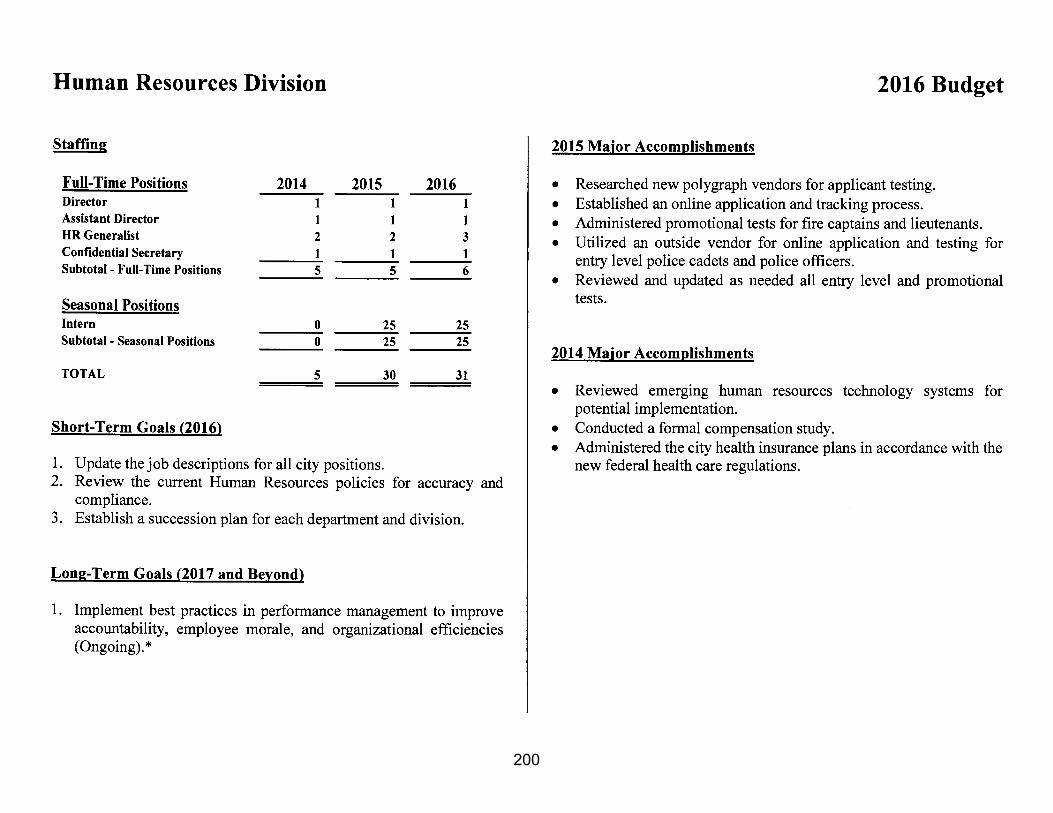
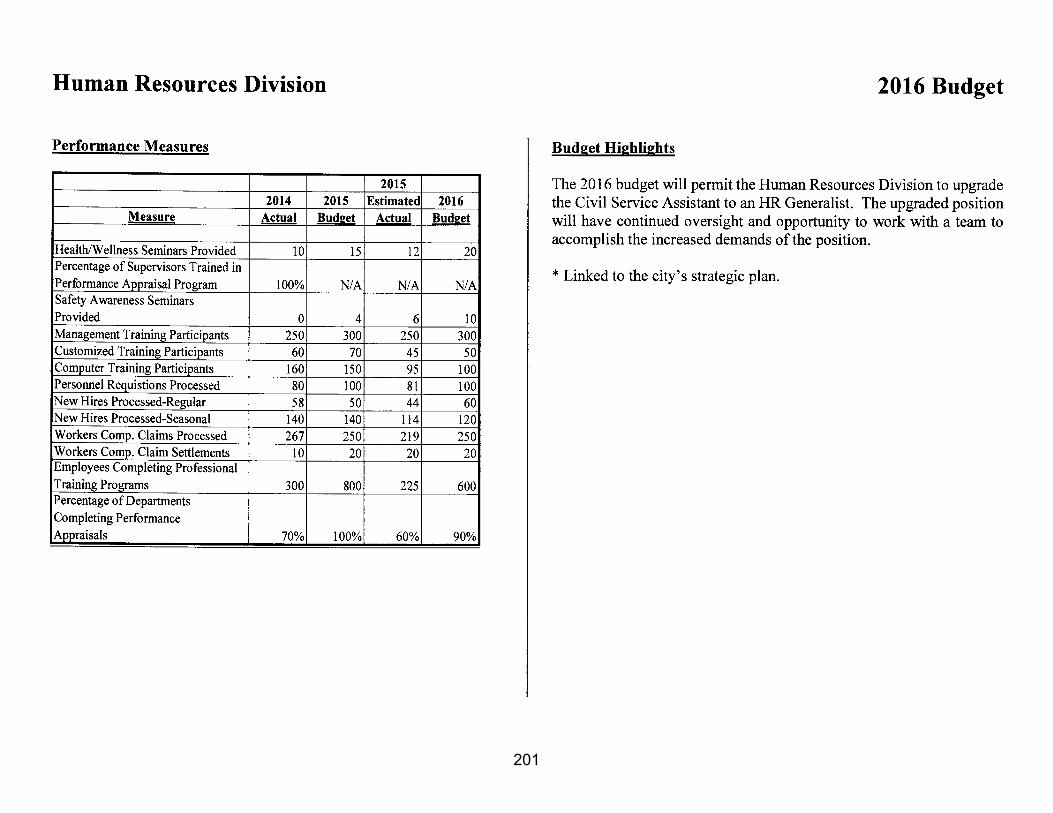
59

60
61
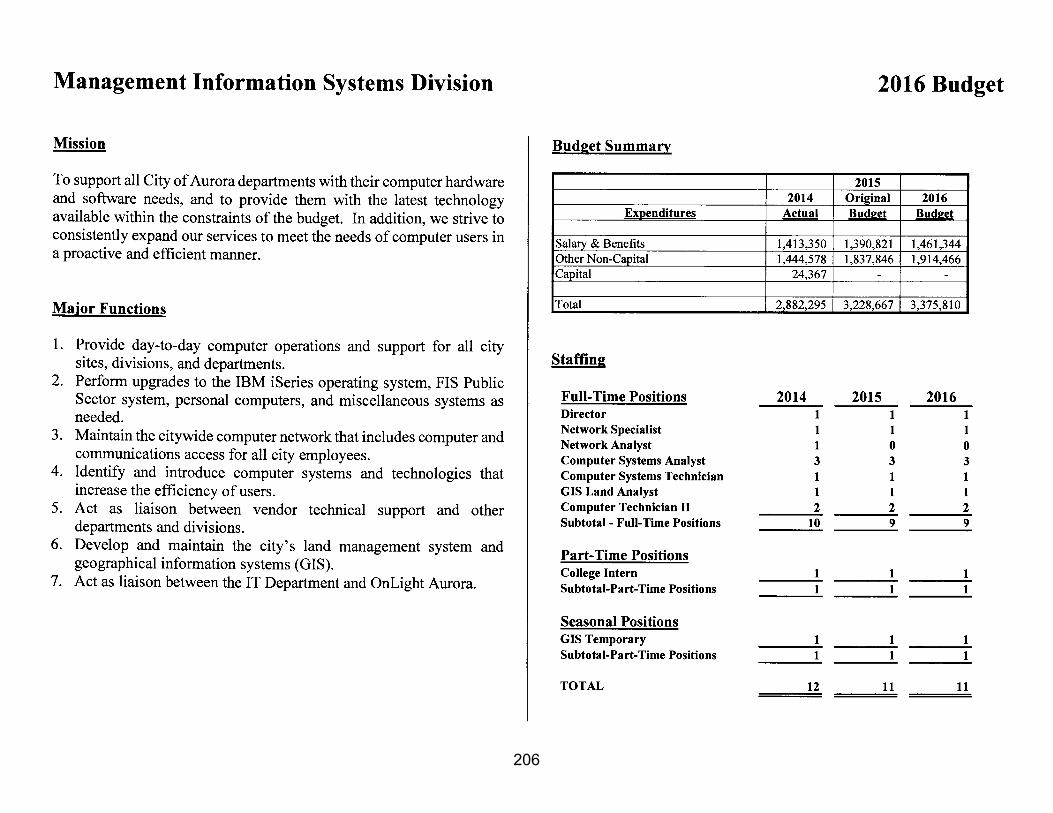
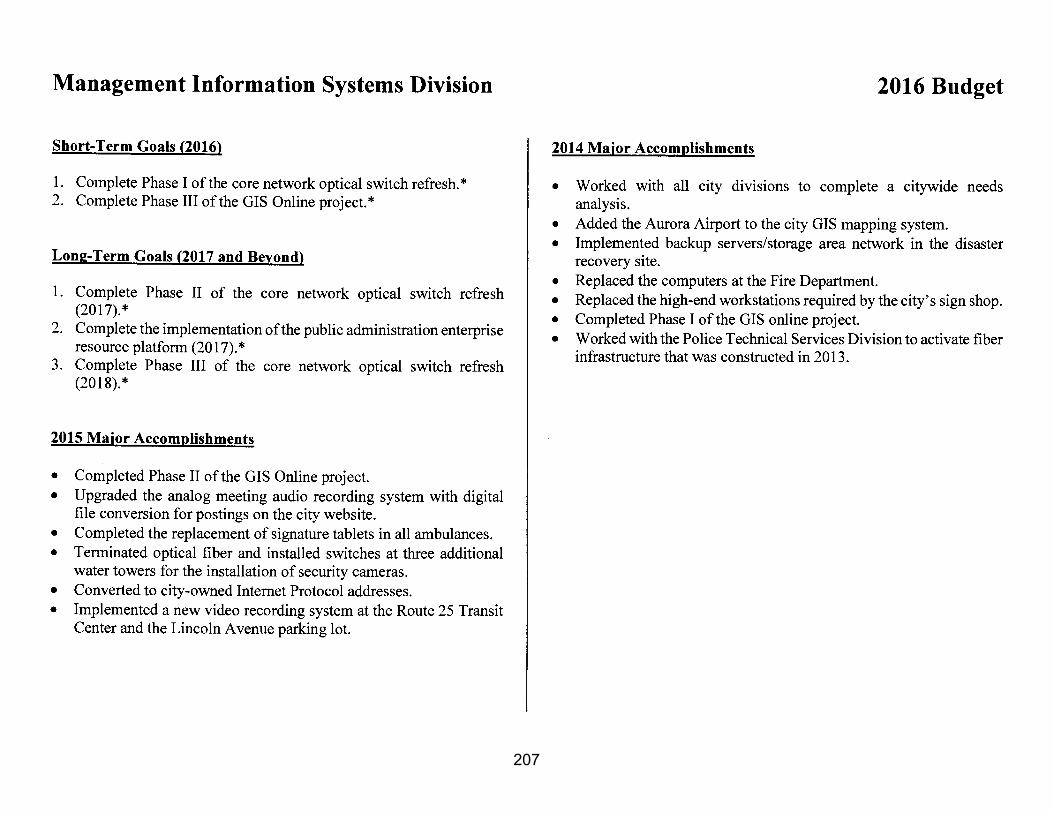
62
63

64
65

66

67

68

69

70
71

72
73

74

75

76
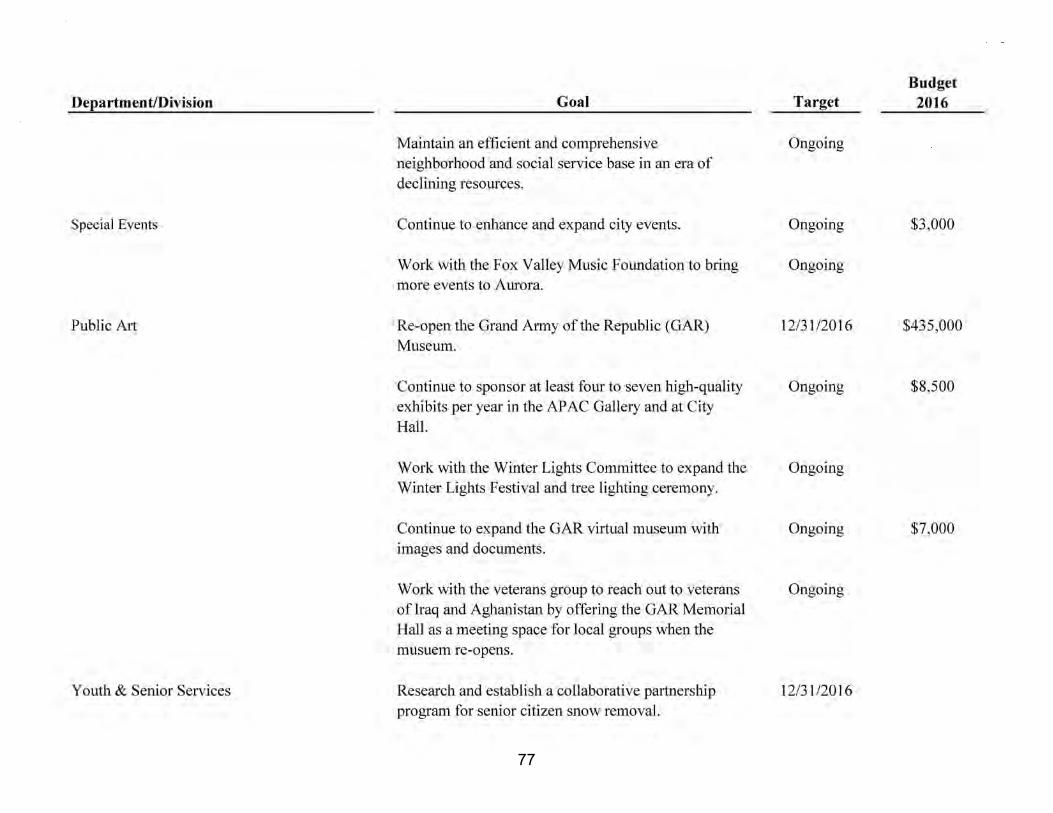
77

78

79

80
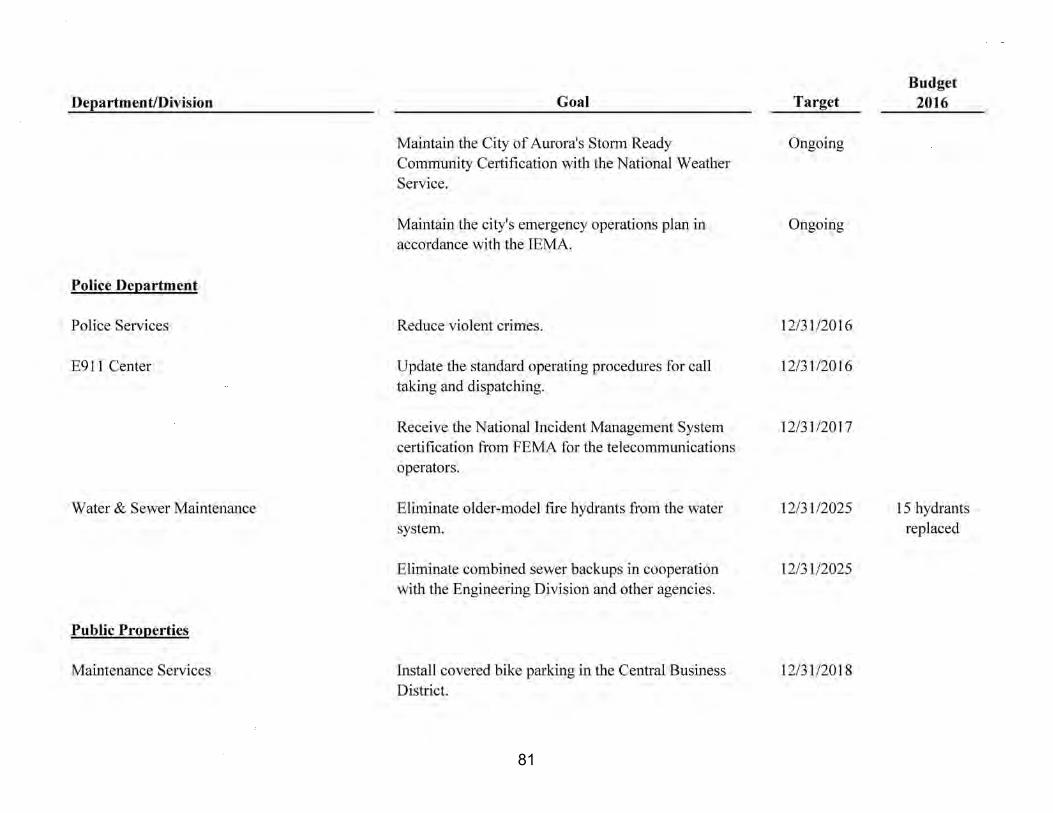
81
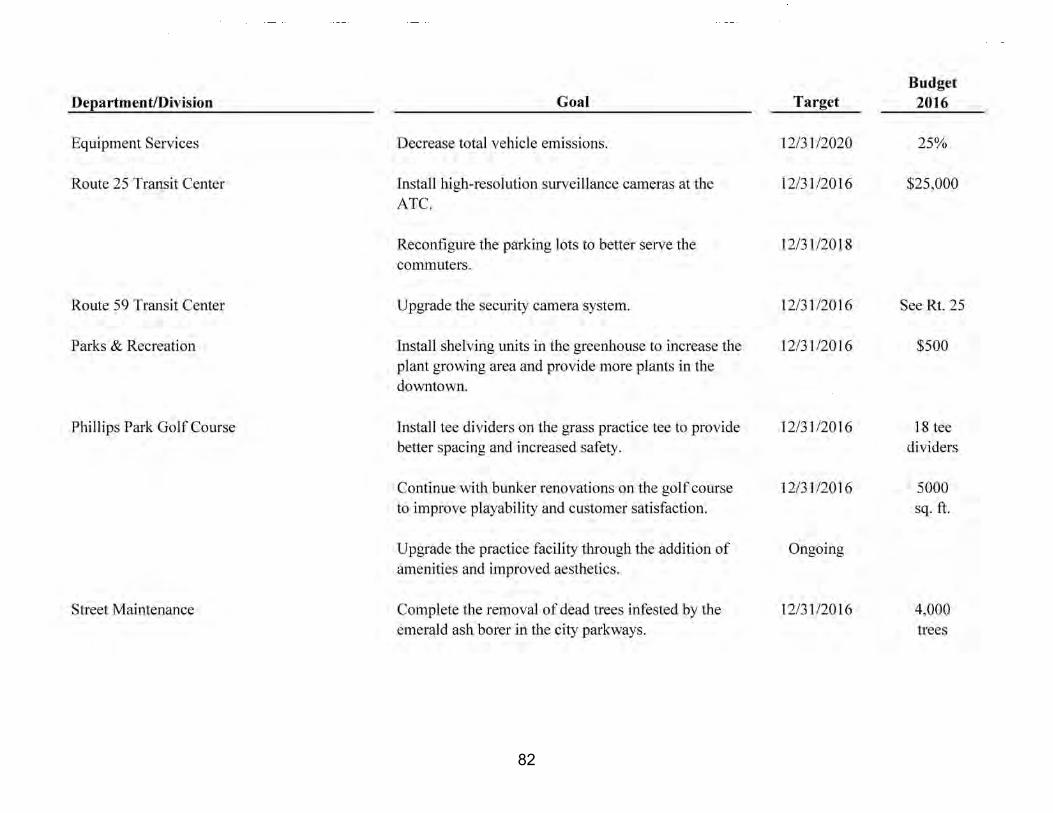
82
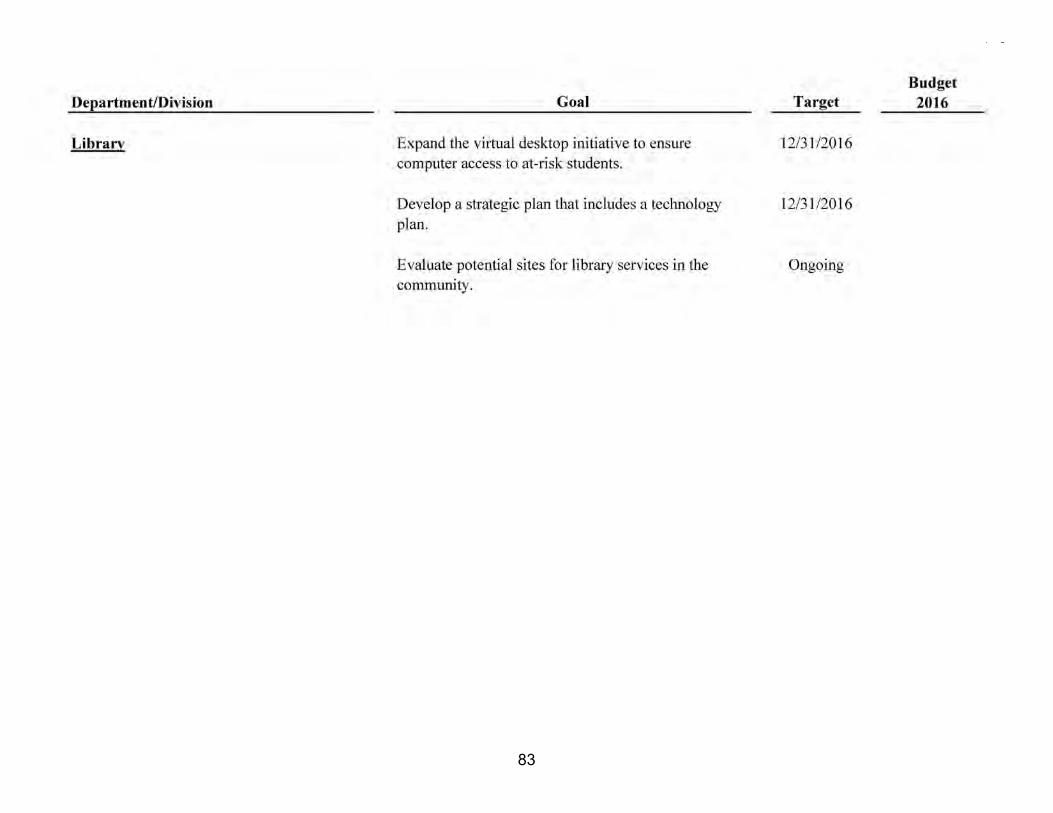
83

84
85

86
87
88
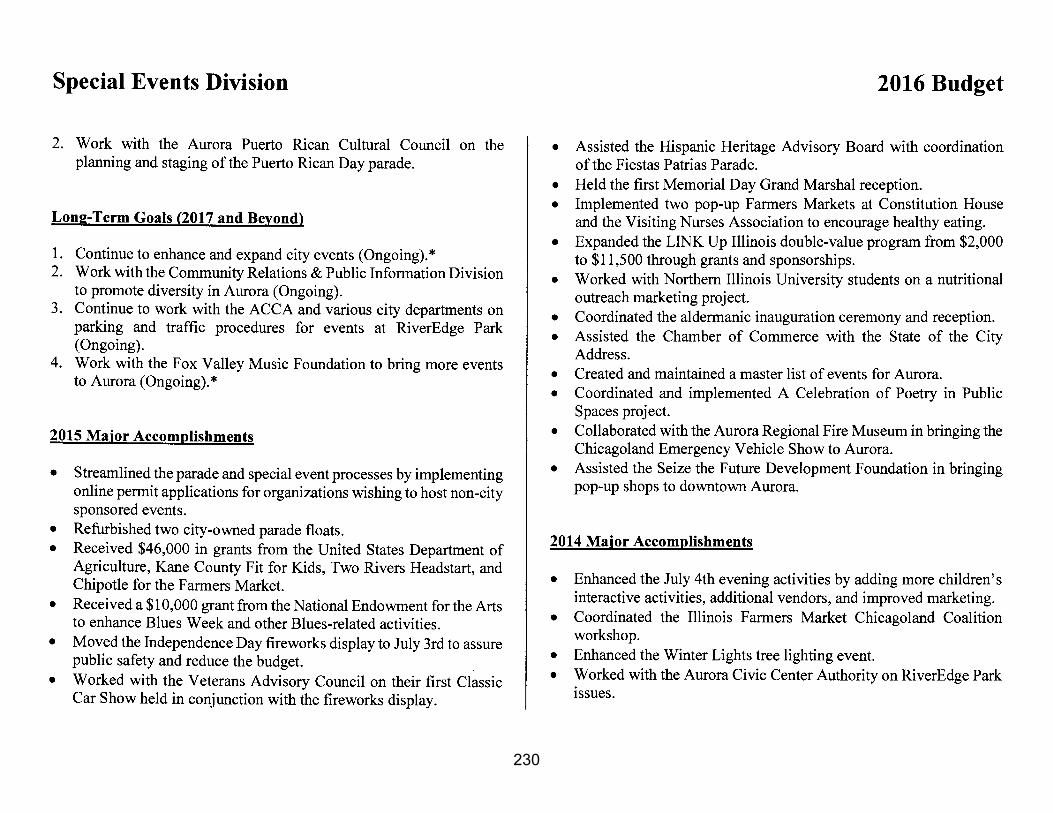
89

90
91
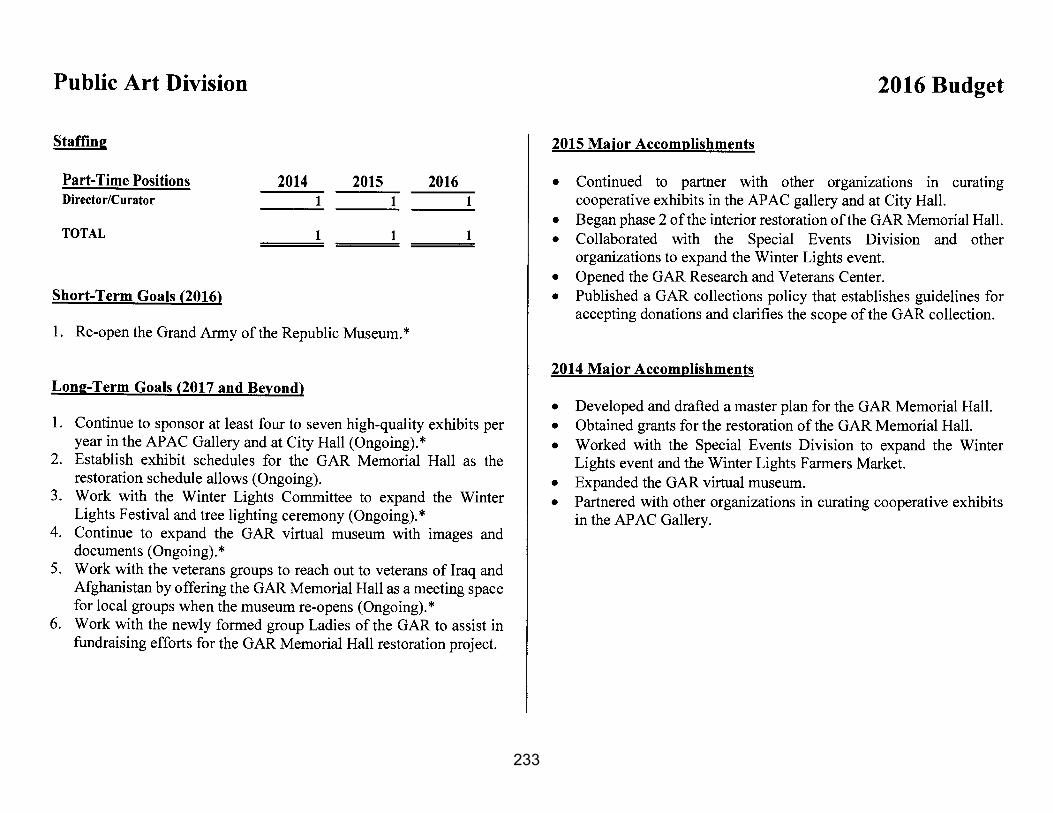
92
93

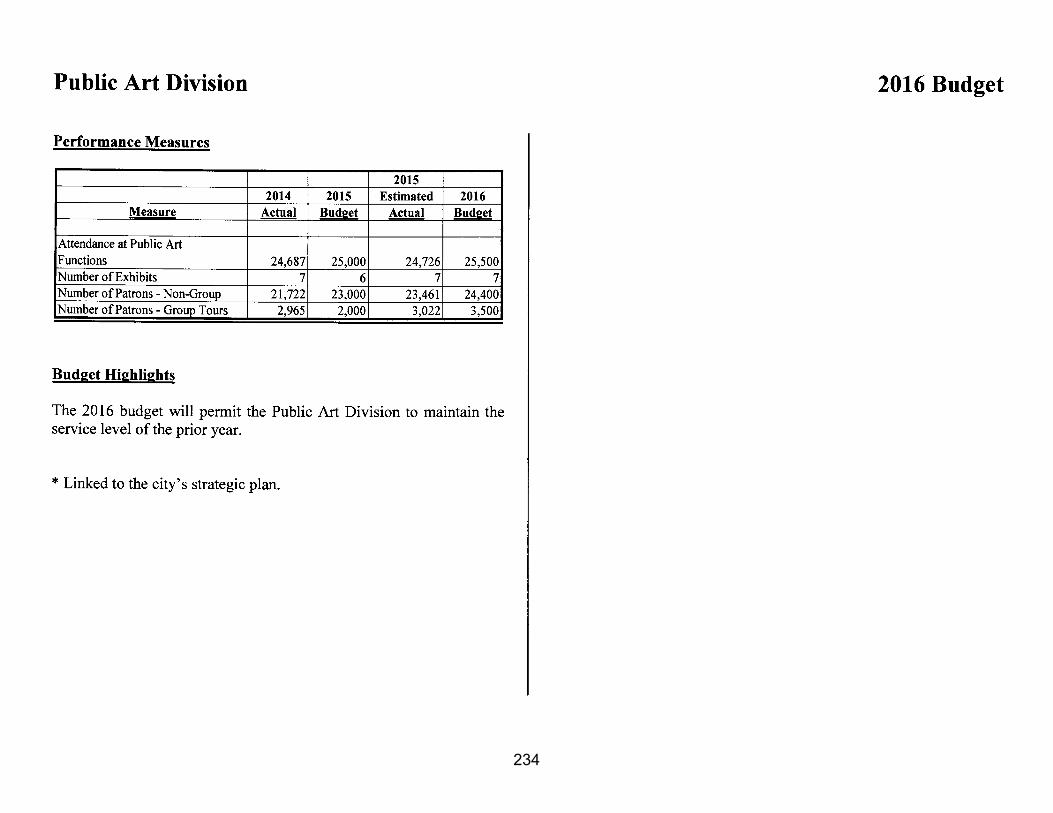
94

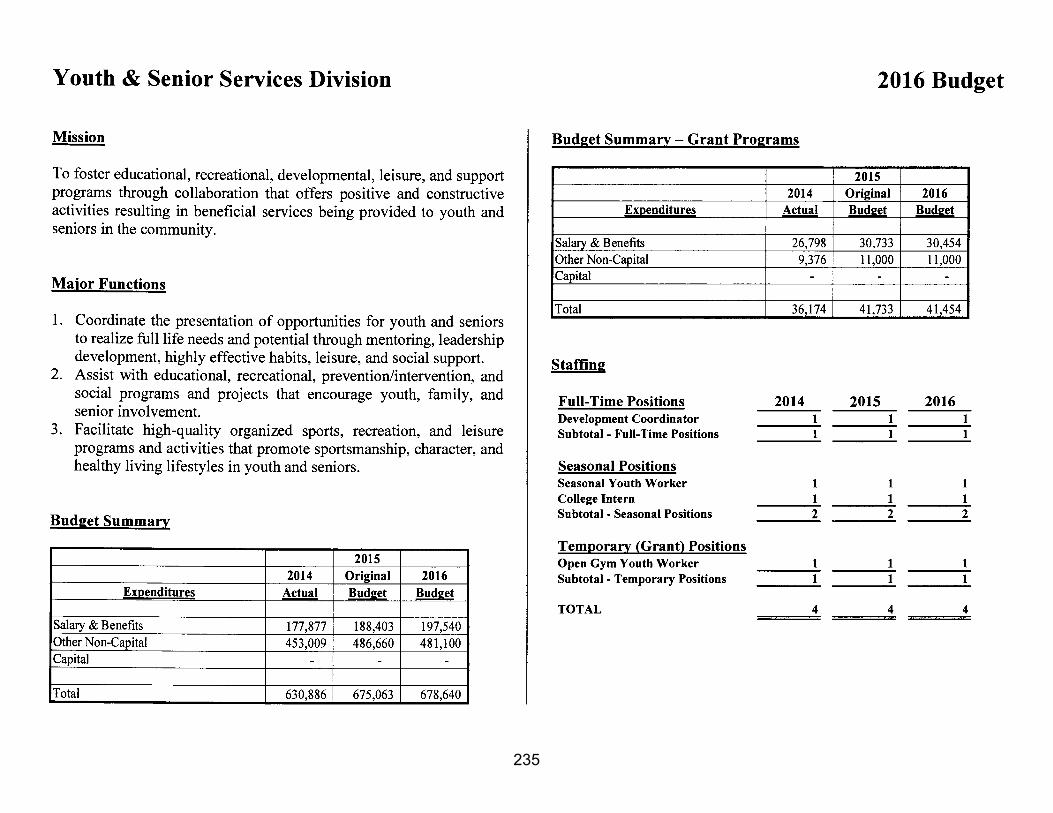
95
96

97
2016REVENUE BUDGET
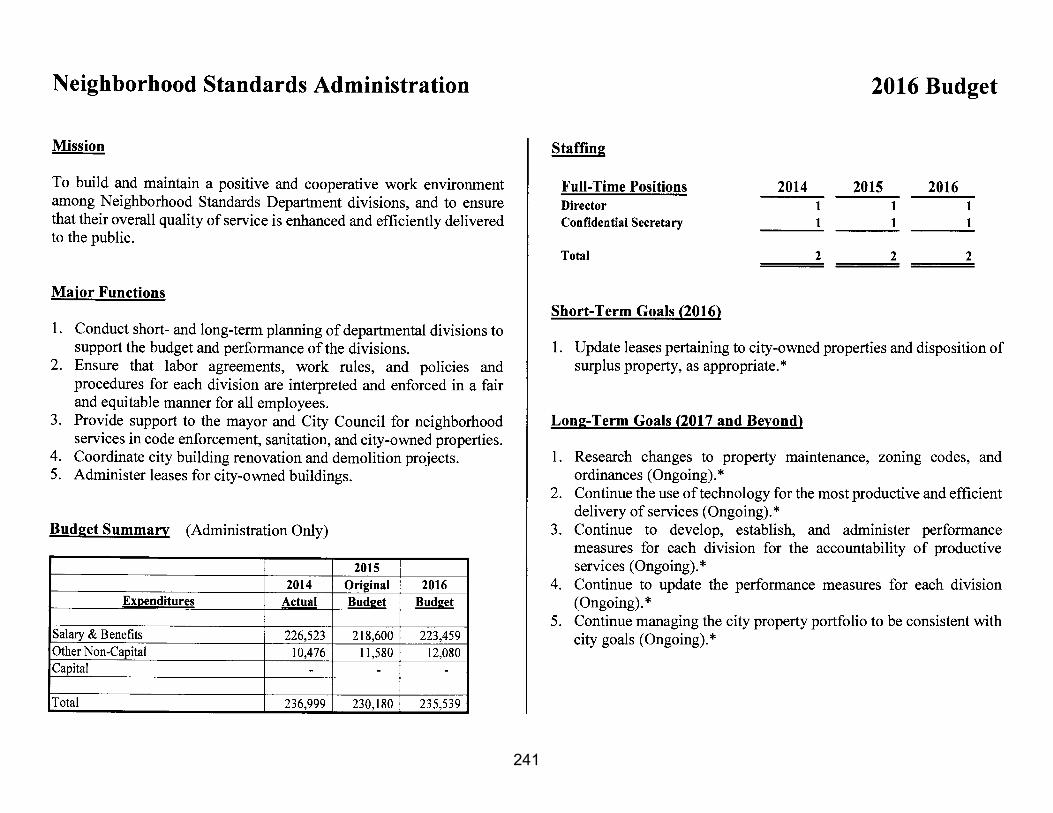
Property Taxes 84,894,400$
Sales & Use Taxes 50,490,000
Other Taxes 59,654,275
Intergovernmental Revenue 9,794,300
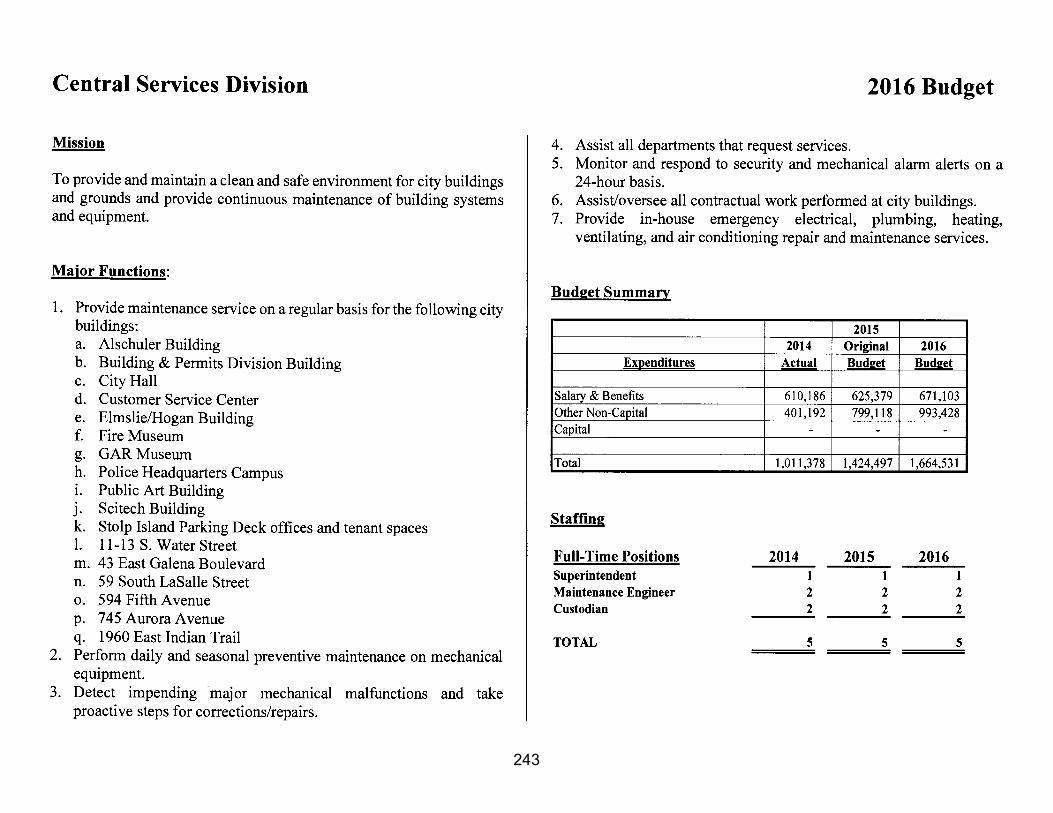
Licenses & Permits 4,769,650
Charges for Services 99,150,349
Fines 3,363,750
Investment Income 17,452,200
Bond Proceeds 7,200,000
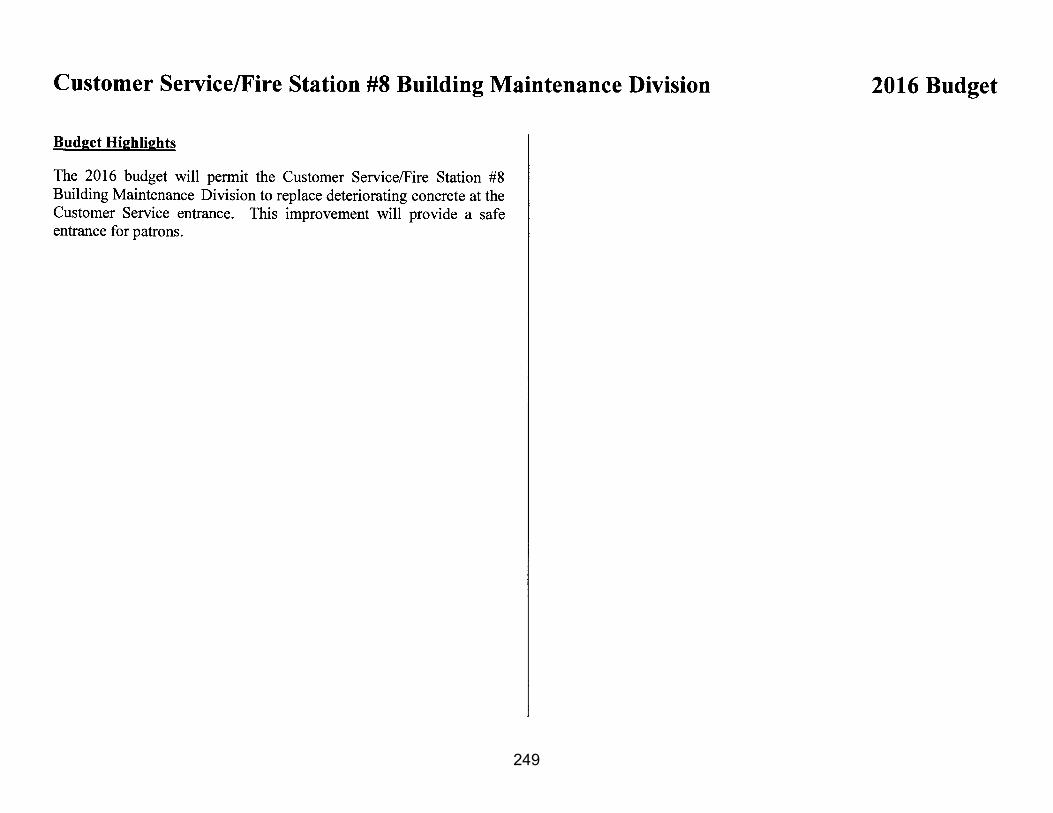
Other Revenues 22,620,126
Transfers In 13,210,600
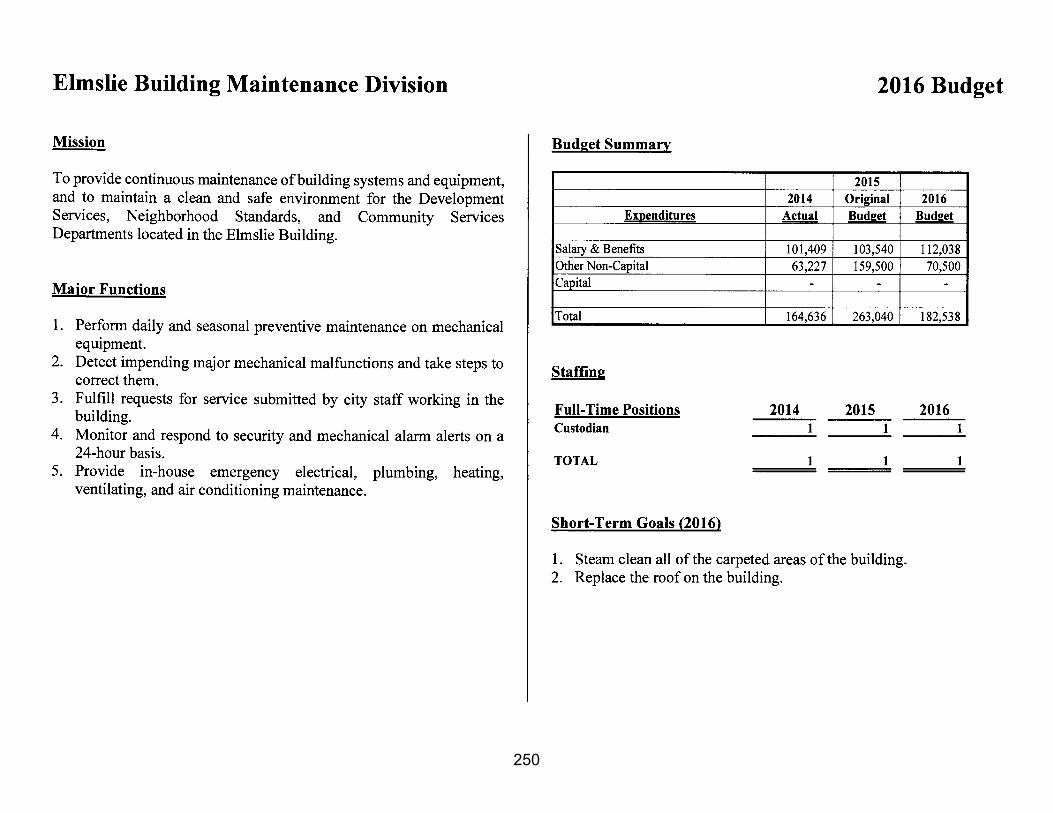
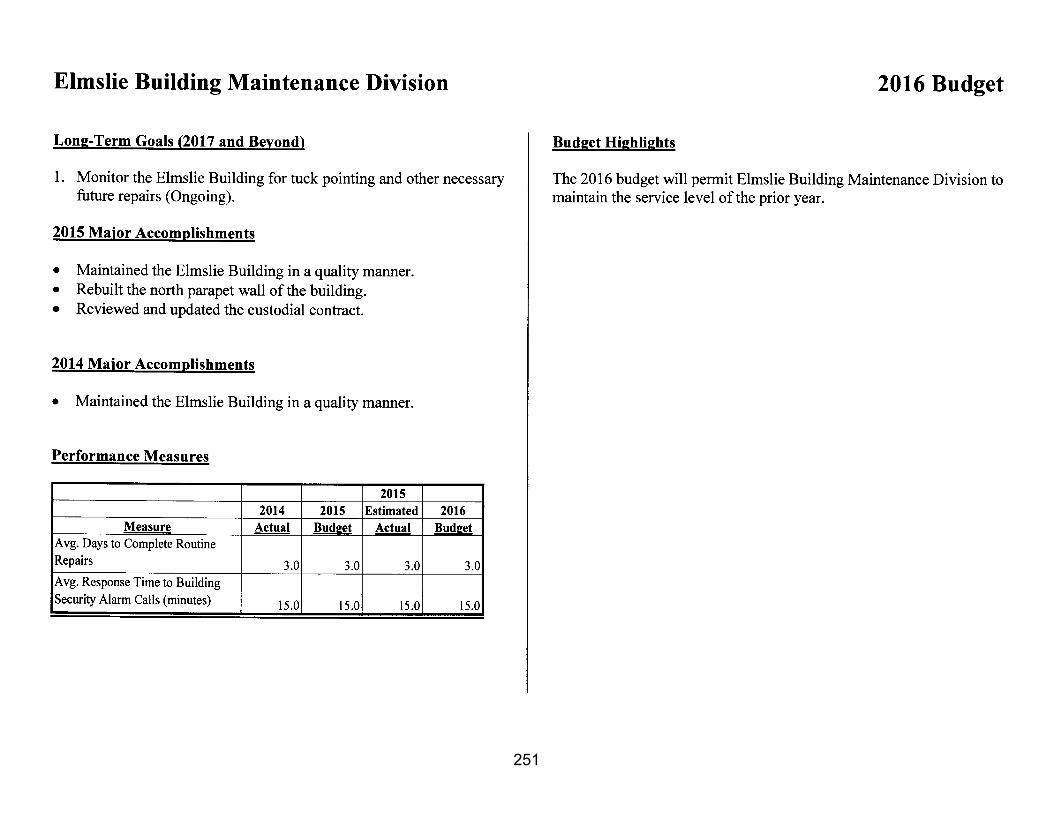
Total 372,599,650$
CITY OF AURORA, ILLINOIS2016 BUDGET
REVENUE SOURCES - ALL FUNDS
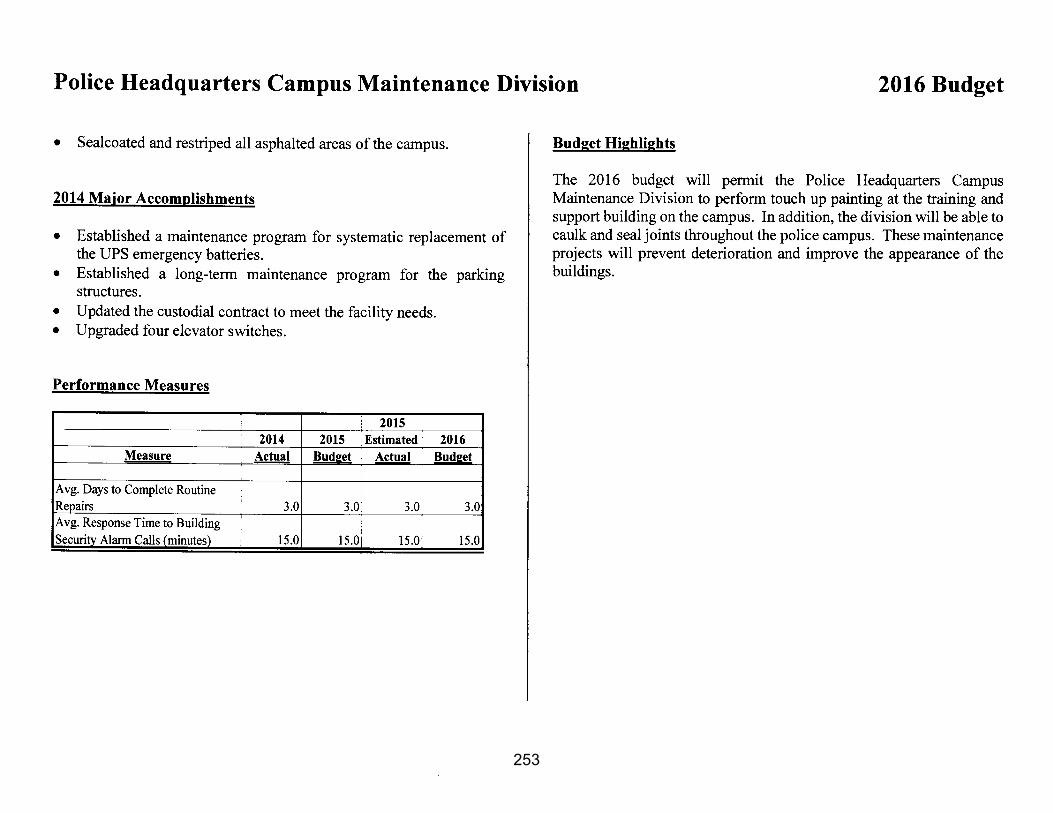
Other Revenues6%
Transfers In3%
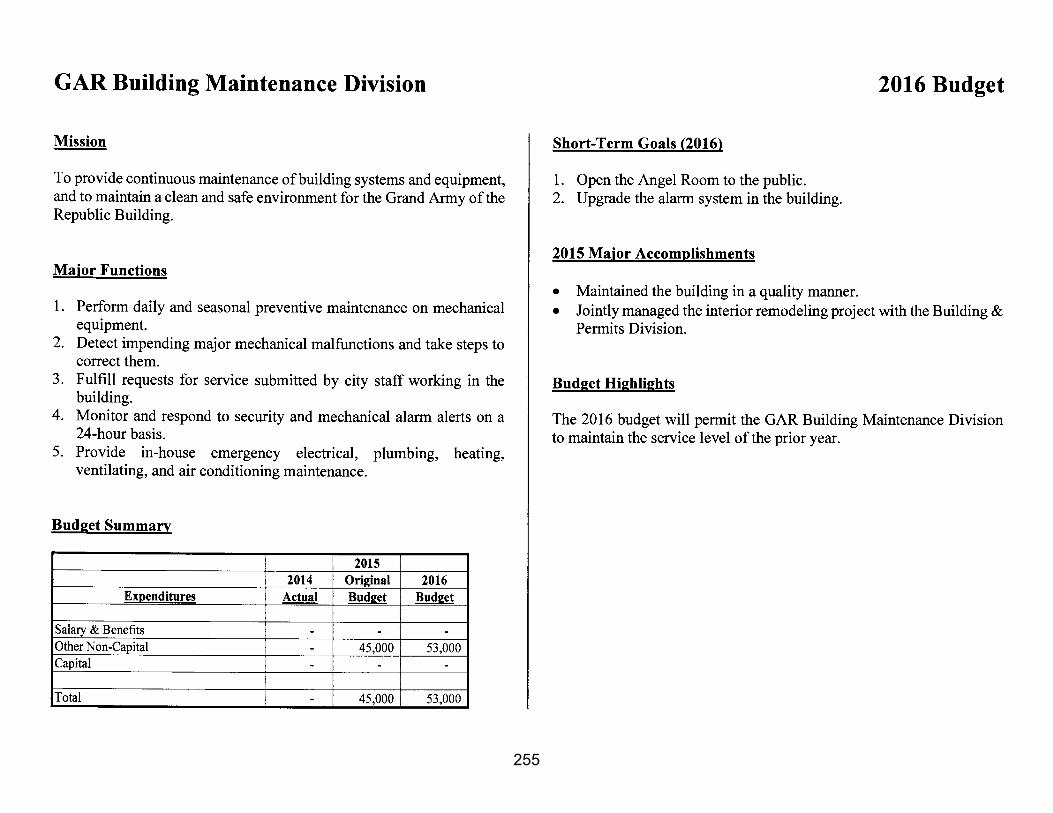
Sales & Use Taxes13%
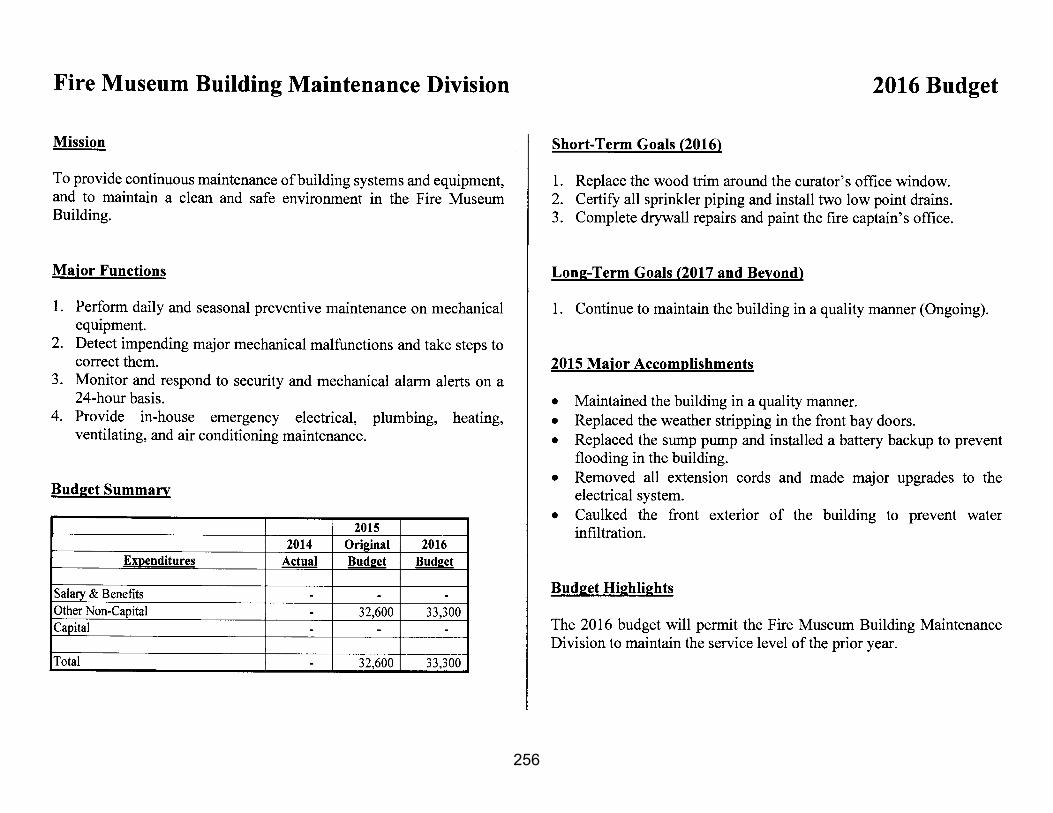
Intergovernmental Revenue3%
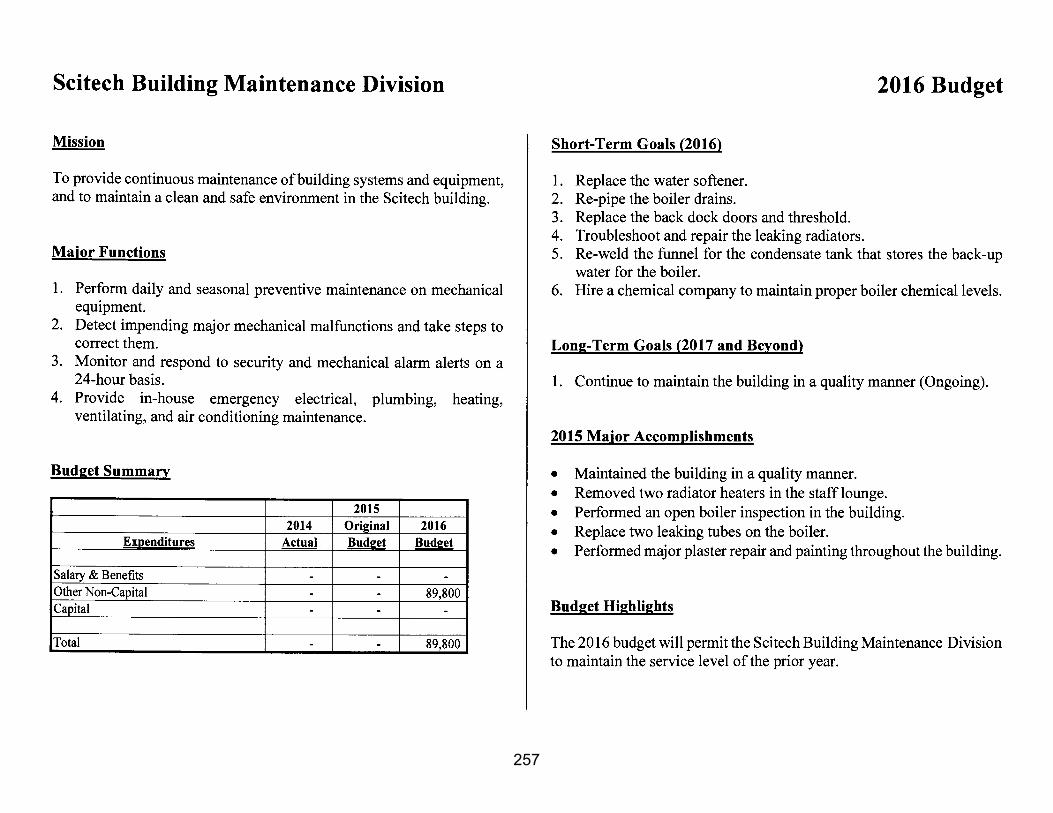
Licenses & Permits
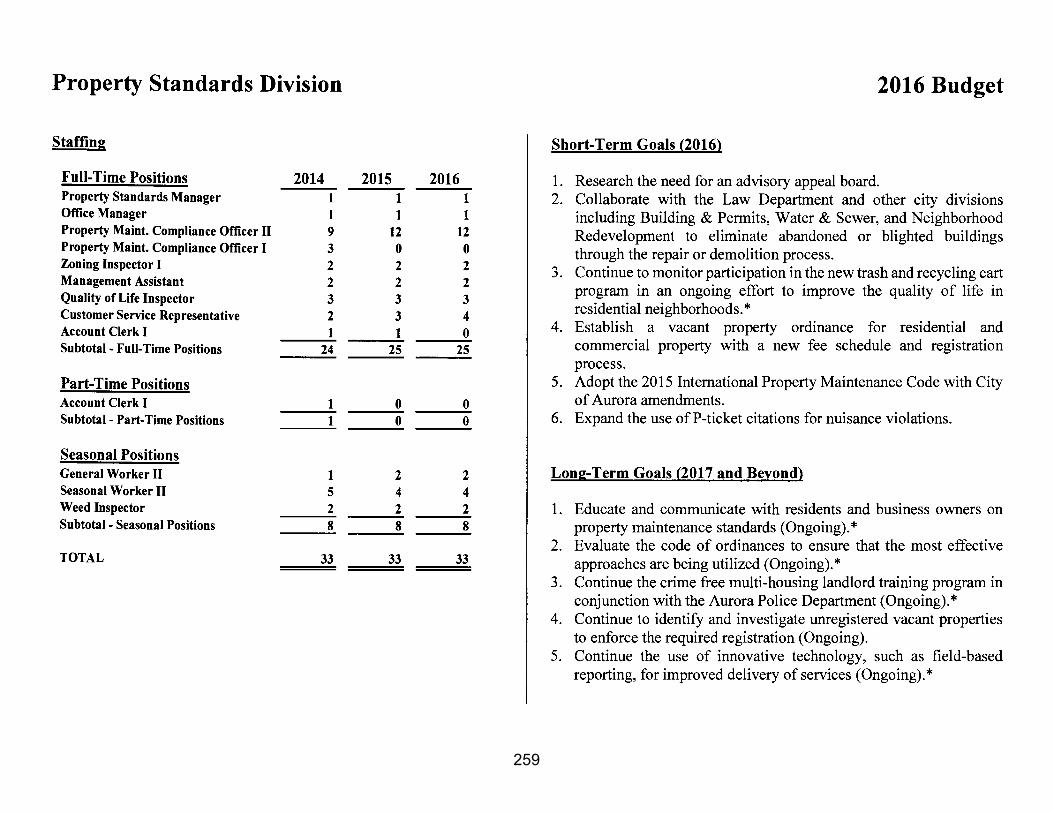
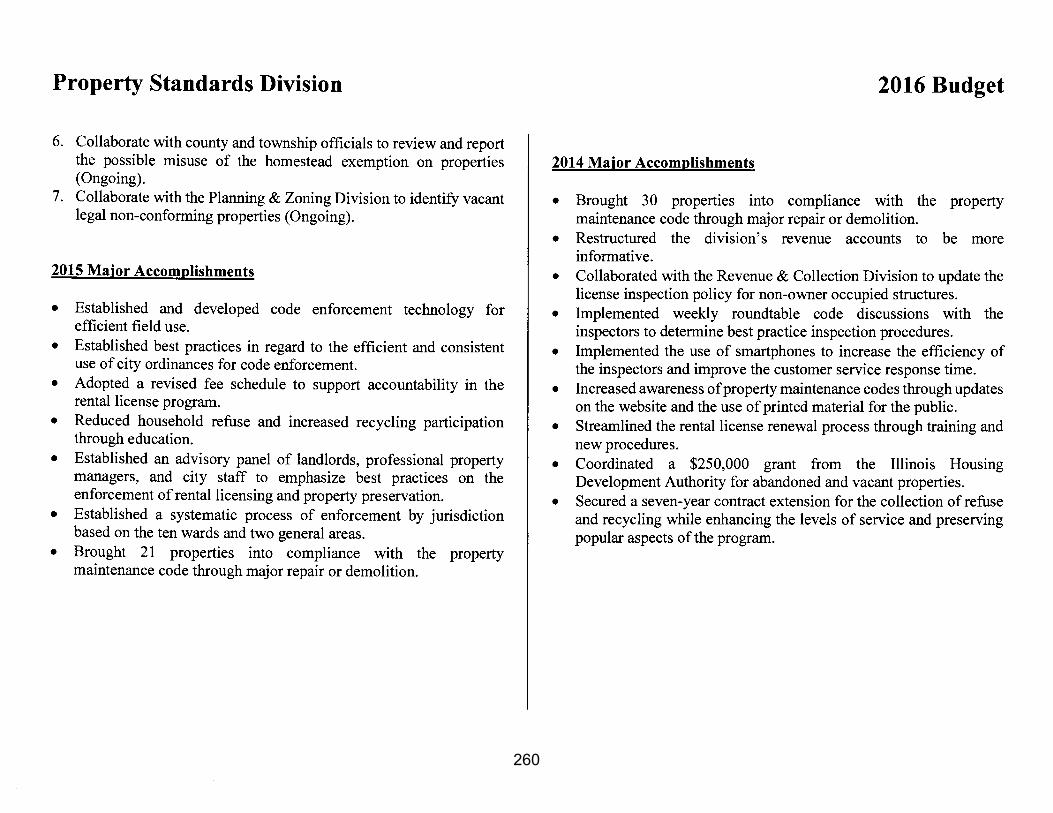
1%
Charges for Services
27%Fines1%
Investment Income
5%
Property Taxes23%
Other Taxes16%
Bond Proceeds2%
98
99
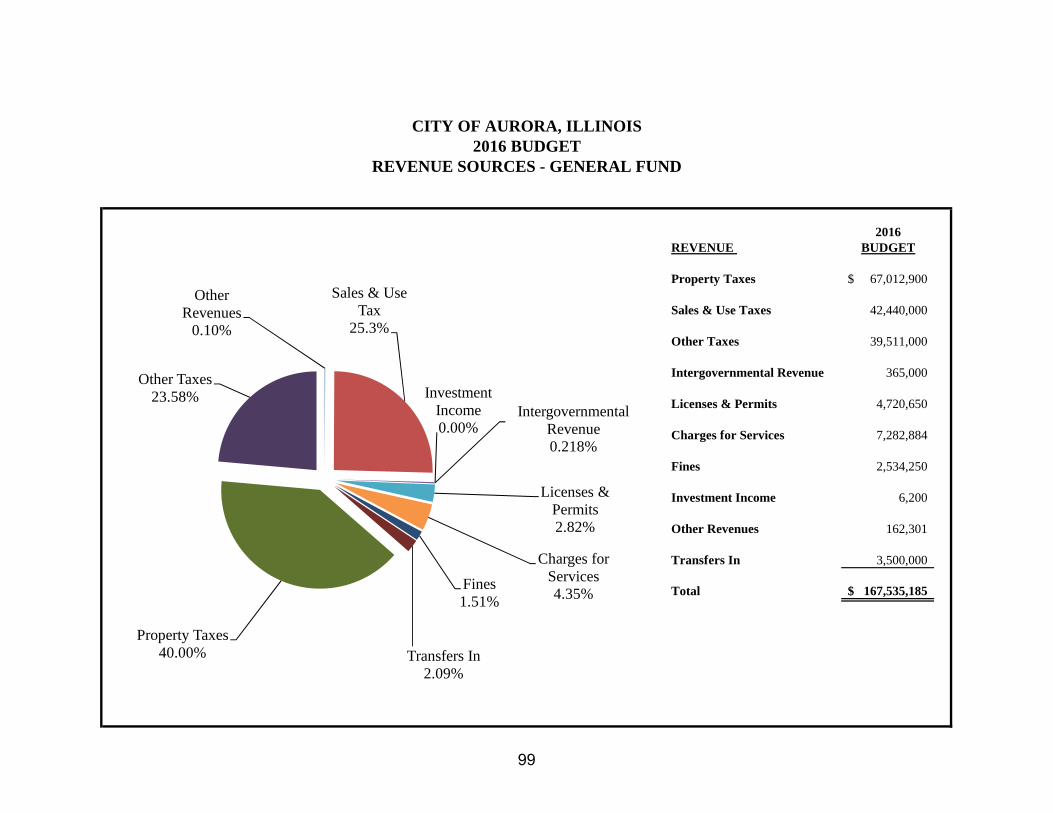
2016REVENUE BUDGET
Property Taxes 67,012,900$
Sales & Use Taxes 42,440,000
Other Taxes 39,511,000
Intergovernmental Revenue 365,000
Licenses & Permits 4,720,650
Charges for Services 7,282,884
Fines 2,534,250
Investment Income 6,200
Other Revenues 162,301
Transfers In 3,500,000
Total 167,535,185$
2016 BUDGETREVENUE SOURCES - GENERAL FUND
CITY OF AURORA, ILLINOIS
Other Revenues
0.10%
Sales & Use Tax
25.3%
Investment Income0.00%
Intergovernmental Revenue0.218%
Licenses & Permits2.82%
Charges for Services4.35%
Fines1.51%
Transfers In2.09%
Property Taxes40.00%
Other Taxes23.58%

100

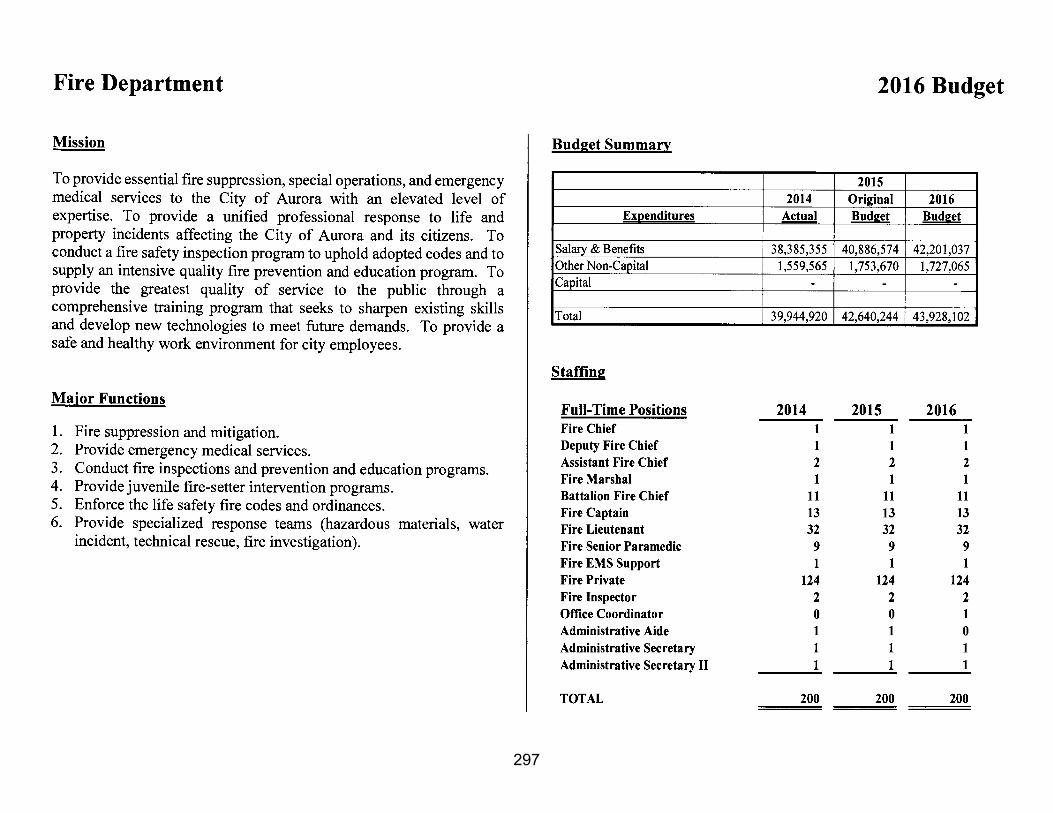
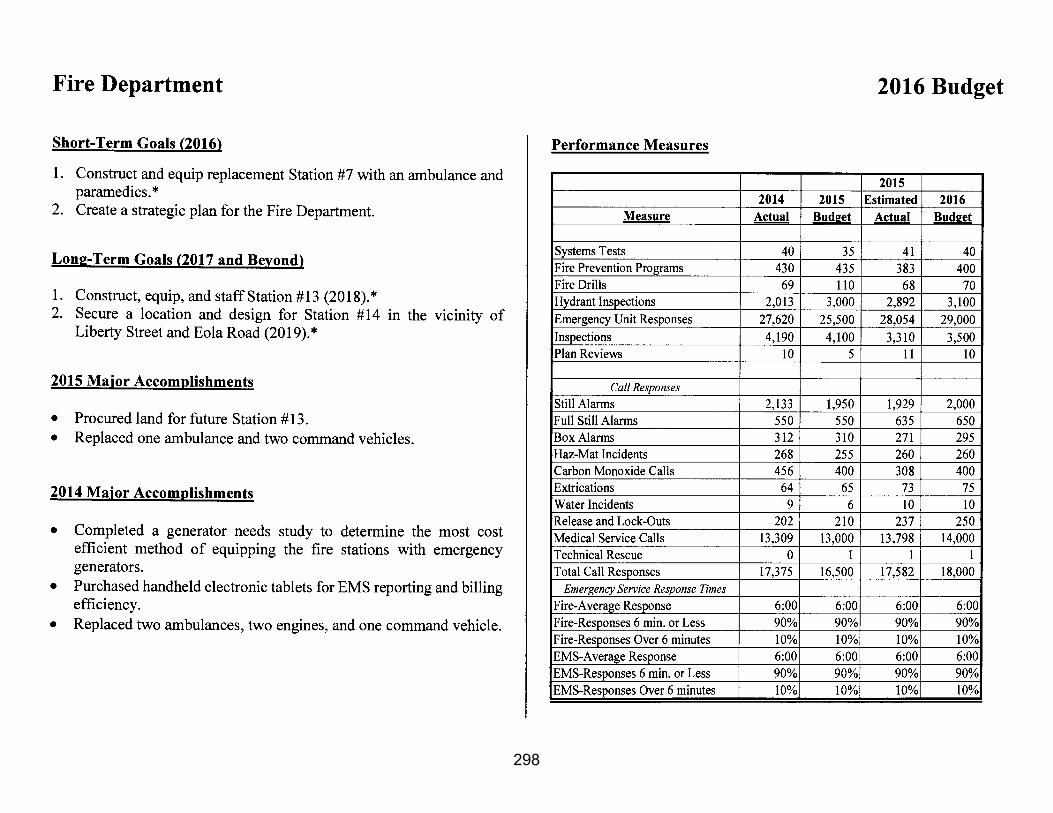
101
CITY OF AURORA, ILLINOIS 2016 BUDGET
DISCUSSION OF REVENUE SOURCES
ALL FUNDS
The 2016 budget relies on a wide variety of revenue sources. These revenue sources include real estate taxes, state income taxes, sales taxes, motor fuel taxes, utility taxes, licenses and fees, as well as various enterprise revenues. Below is a discussion of the major revenue classifications for fiscal year 2016.
1. GENERAL PROPERTY TAXES $79,970,719
The total 2015 levy (payable in 2016) was $79,970,719. The 2015 real estate tax levy for the city (excluding the library) includes an increase of $878,833 or 1.26%. The modest increase is required to support higher operational cost. Property taxes are collected to support the General Fund (including the city’s contribution to the Illinois Municipal Retirement Fund), the Aurora Public Library Fund, and Police and Firefighters’ Pension Funds. (The city imposes a separate levy to support the Aurora Public Library General Fund at a rate of $0.245 per $100 of equalized assessed value [EAV].) Included in the 2015 property tax levy are provisions of $4,000,000 and $1,246,819 for city and library debt service, respectively.
Information on the city’s 2015 EAV (the basis for property taxes payable in 2016) is not yet available. However, due to the depression of the real estate market over the past few years, the city’s EAV has declined. The high point of the city’s EAV--$4.2 billion--came in 2008. In 2014, Aurora’s EAV was about $3.1 billion (a reduction of 26%). The property tax rate is determined by dividing the tax levy extension
by the EAV. The following charts show the trends in the city’s property tax levies/extensions and assessed valuation since 2009.
$70
$72
$74
$76
$78
$80
$82
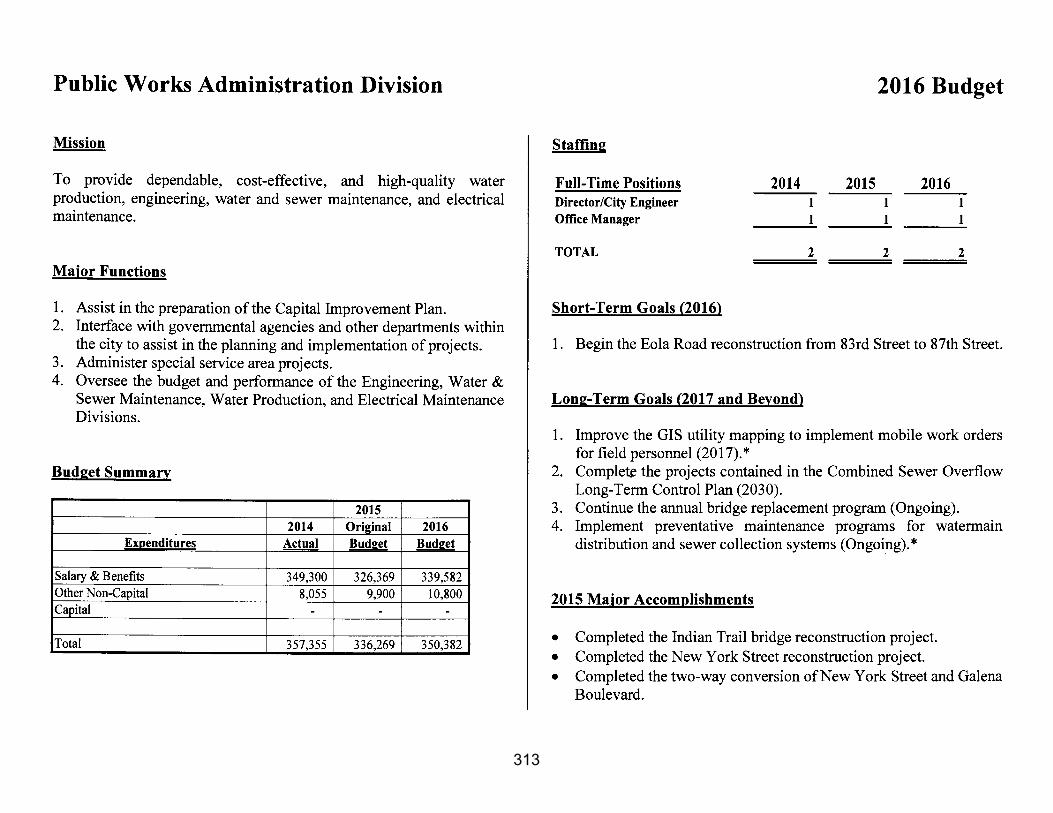
2009 2010 2011 2012 2013 2014 2015
In M
illio
ns o
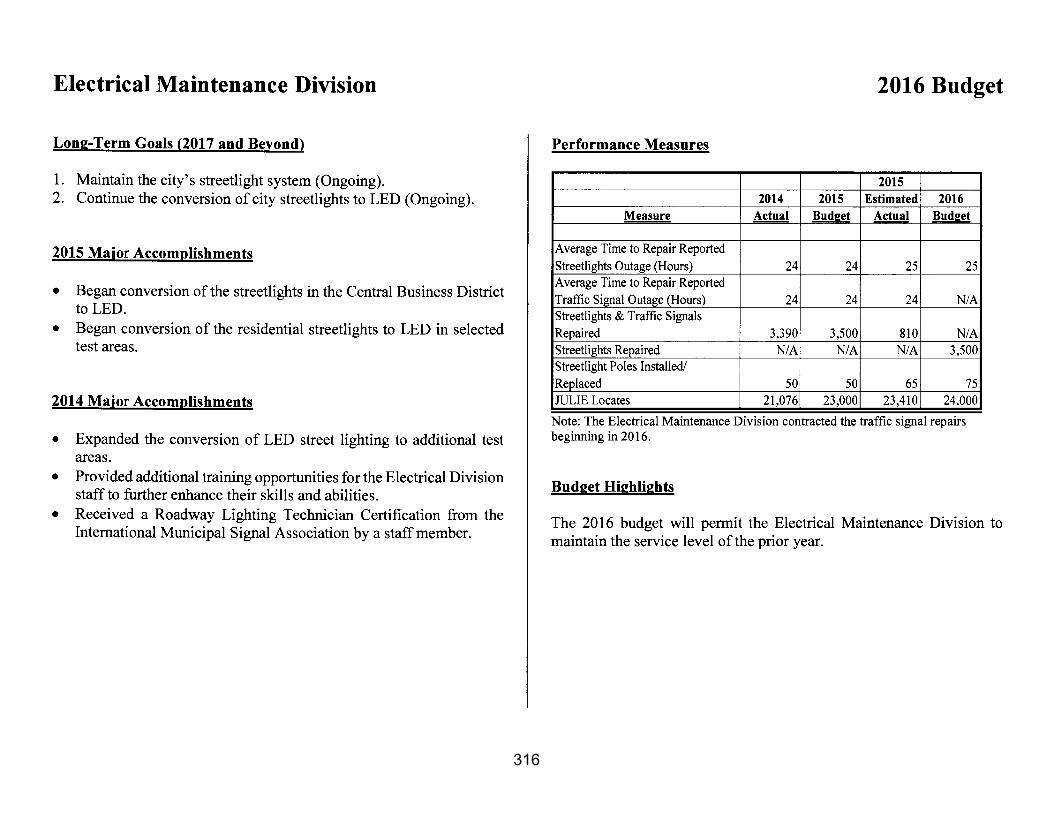
f D
olla
rs
Total City and Library Property Tax Extensions/Levies
$1
$2
$3
$4
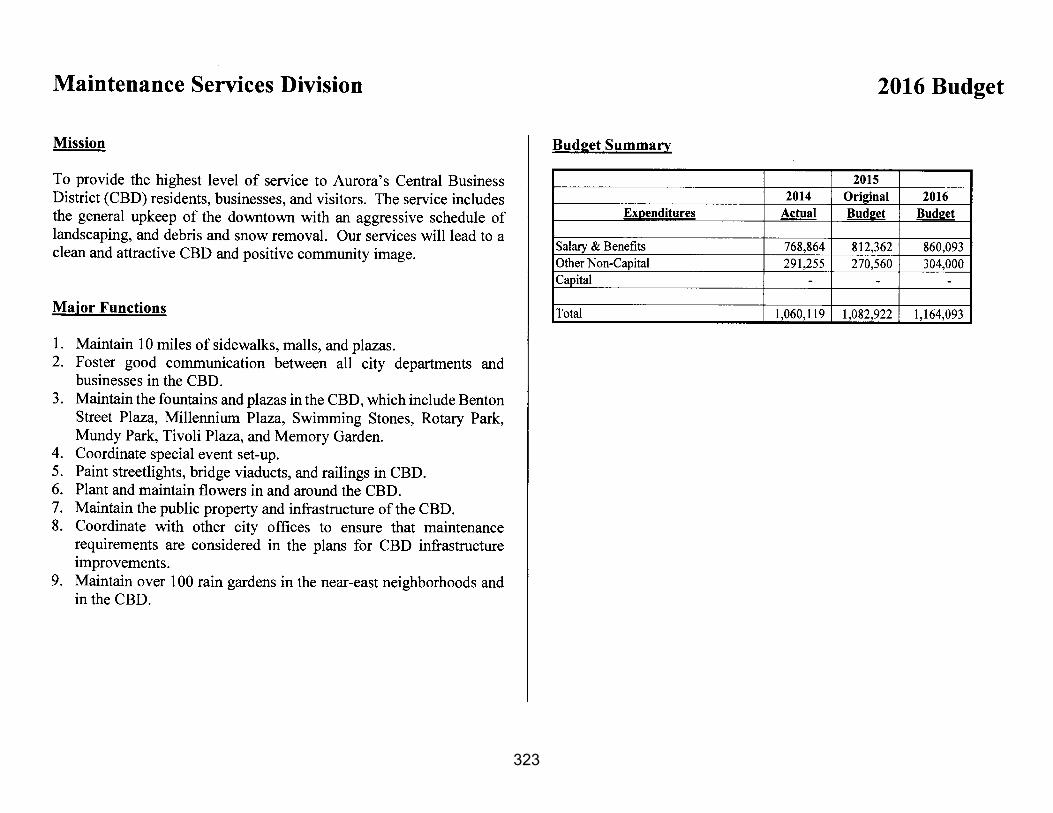
$5
2009 2010 2011 2012 2013 2014
In B
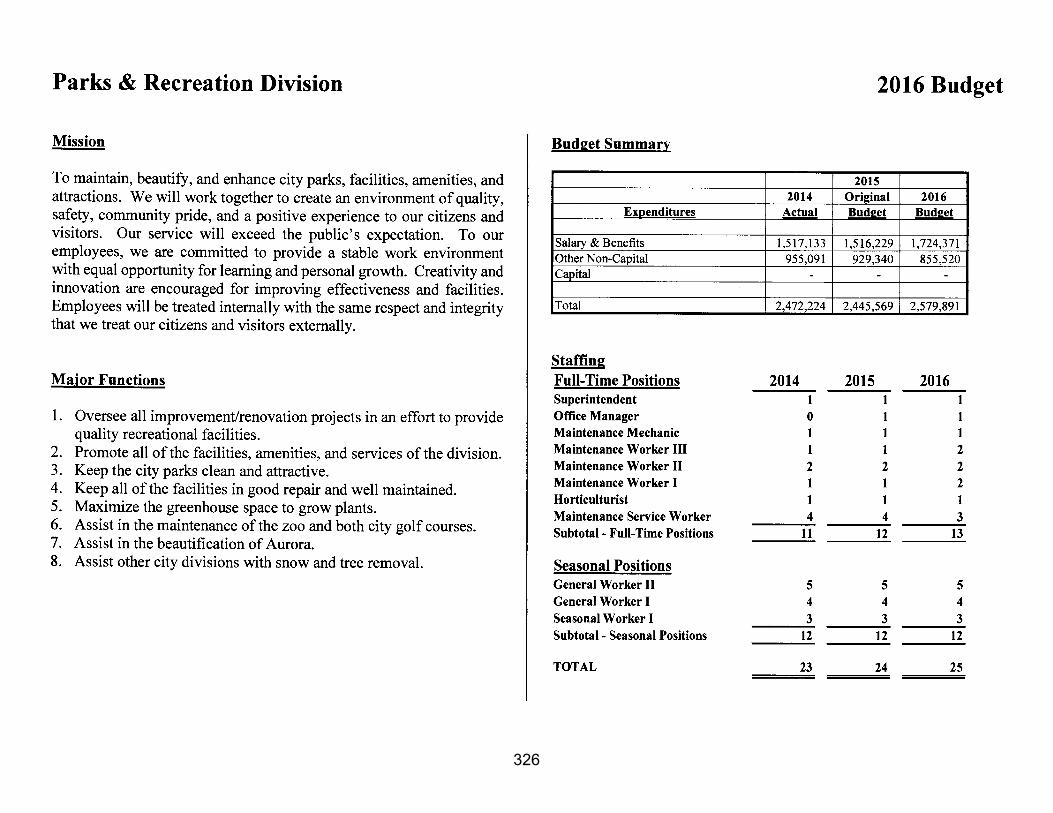
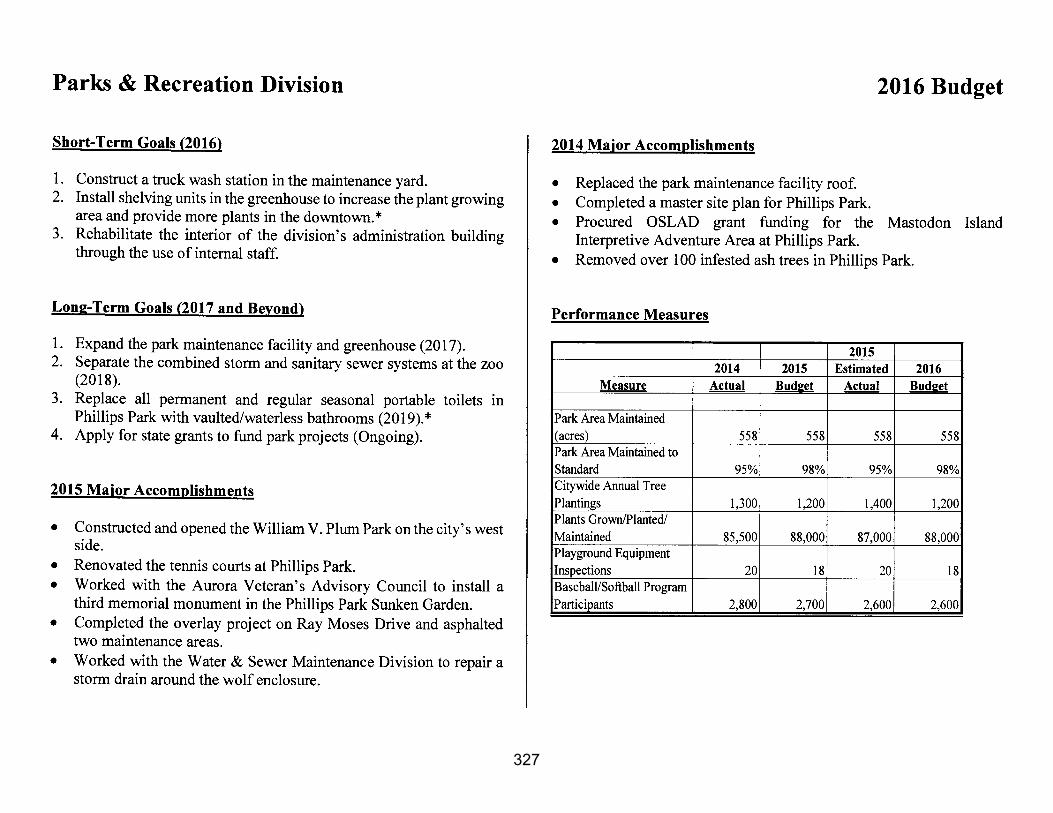
illio
ns o
f D
olla
rs
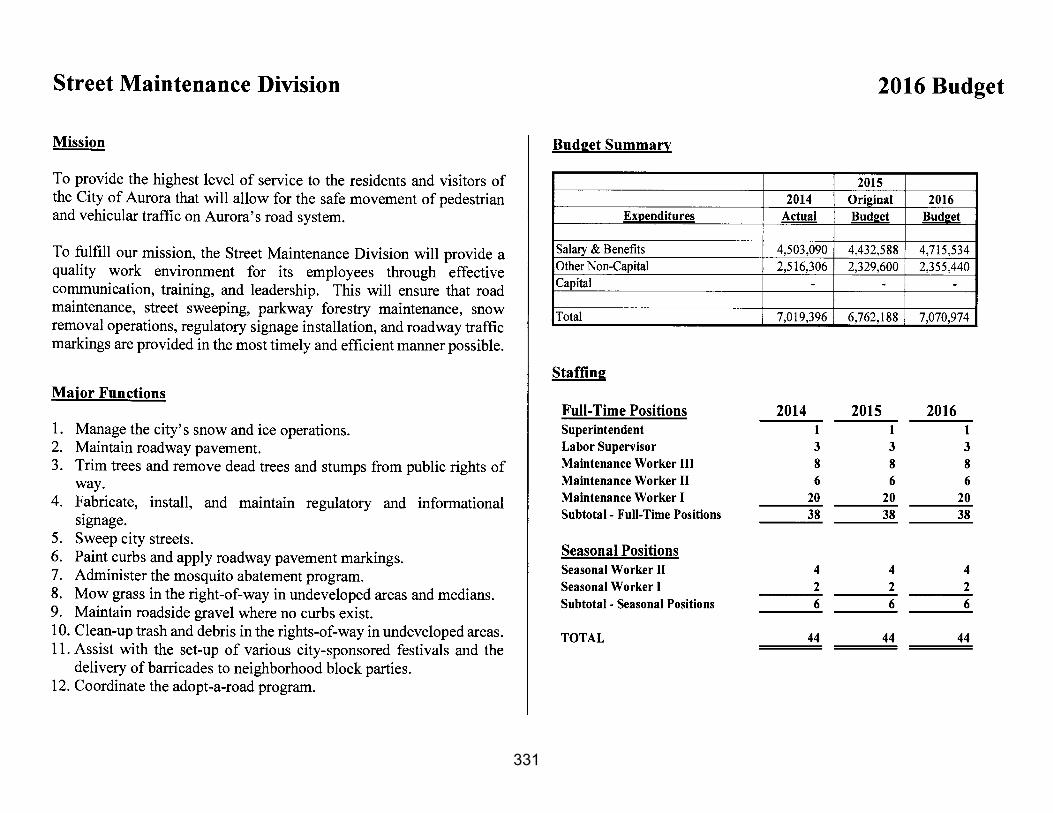
Equalized Assessed Value

102
CITY OF AURORA, ILLINOIS 2016 BUDGET
2. GENERAL SALES AND USE TAXES $28,990,000
The city receives a 1% sales tax that is collected by the Illinois Department of Revenue (IDOR) on the purchase of most goods in Aurora. Sales tax receipts are remitted to the city on a monthly basis. Fiscal year 2016 estimates of $25,100,000 assumes a 2% increase from the 2015 estimated actual amount, after considering additional taxes generated by the expansion of the outlet mall in the city and commercial recovery following the completion of roadway construction on Illinois Route 59.
Local use sales taxes of $3,890,000 are included in this revenue classification. These taxes are collected by the IDOR and remitted to the city based on a per capita state rate. Fiscal year 2016 projections for these revenues are based upon economic forecasts published by the Illinois Municipal League (IML). The IML forecast predicted an increase from $17.80 per capita in 2015 to $18.50 per capita for 2016. This was an increase of 3.9% for use tax.
3. STATE INCOME TAX $19,850,000
The City of Aurora receives a number of shared revenues from the State of Illinois based on population. The largest of these is state income tax revenue (SIT). In the 2010 census, the city’s population was found to be 197,899. SIT projections for 2016 are based on an economic analysis released by the IML in January 2015. The 2015 per capita amount was $97.80 and decreased to $97.00 per capita for the 2016 estimate.
4. PERSONAL PROPERTY REPLACEMENT TAX $4,548,000
The city receives a personal property replacement tax (PPRT) from the State of Illinois. The replacement tax revenue comes from a corporate income tax and an invested capital tax on public utilities. The PPRT serves to replace Aurora’s share of revenue lost due to the abolition of the personal property tax in 1977. The funds are distributed to local taxing bodies based on the relative amounts of corporate personal
$21,000,000
$22,000,000
$23,000,000
$24,000,000
$25,000,000
$26,000,000
$27,000,000
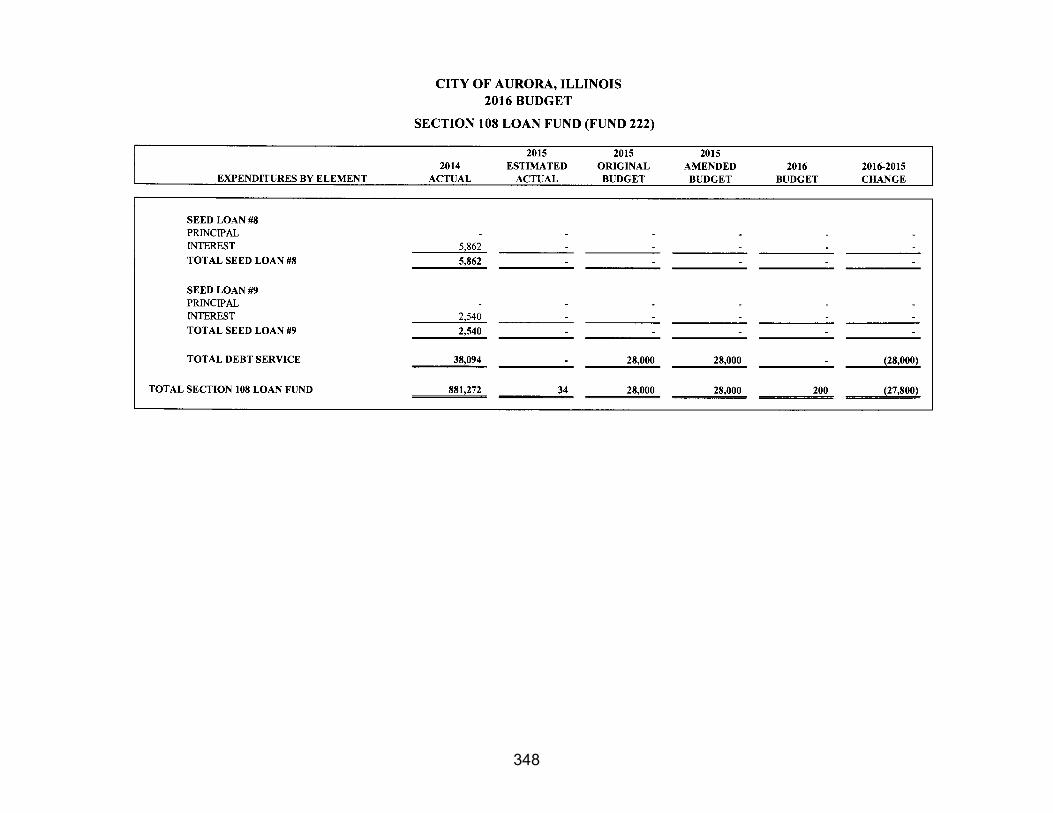
$28,000,000
$29,000,000
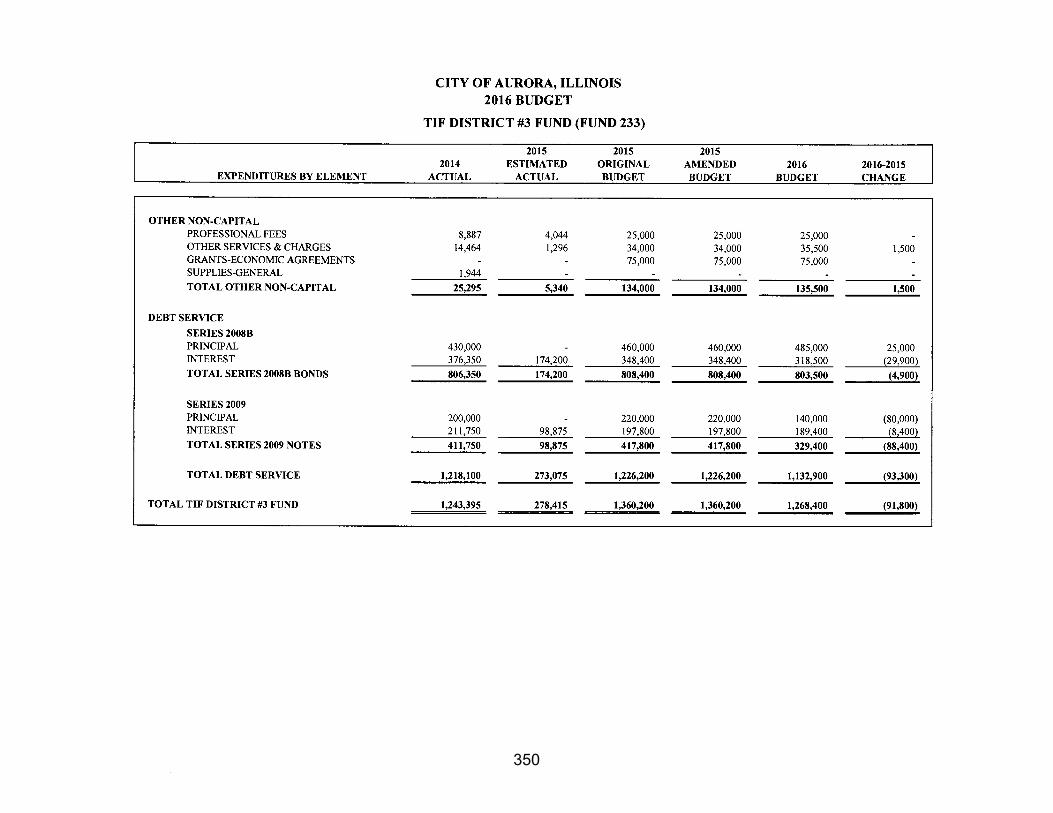
$30,000,000
2011 2012 2013 2014 2015 2016
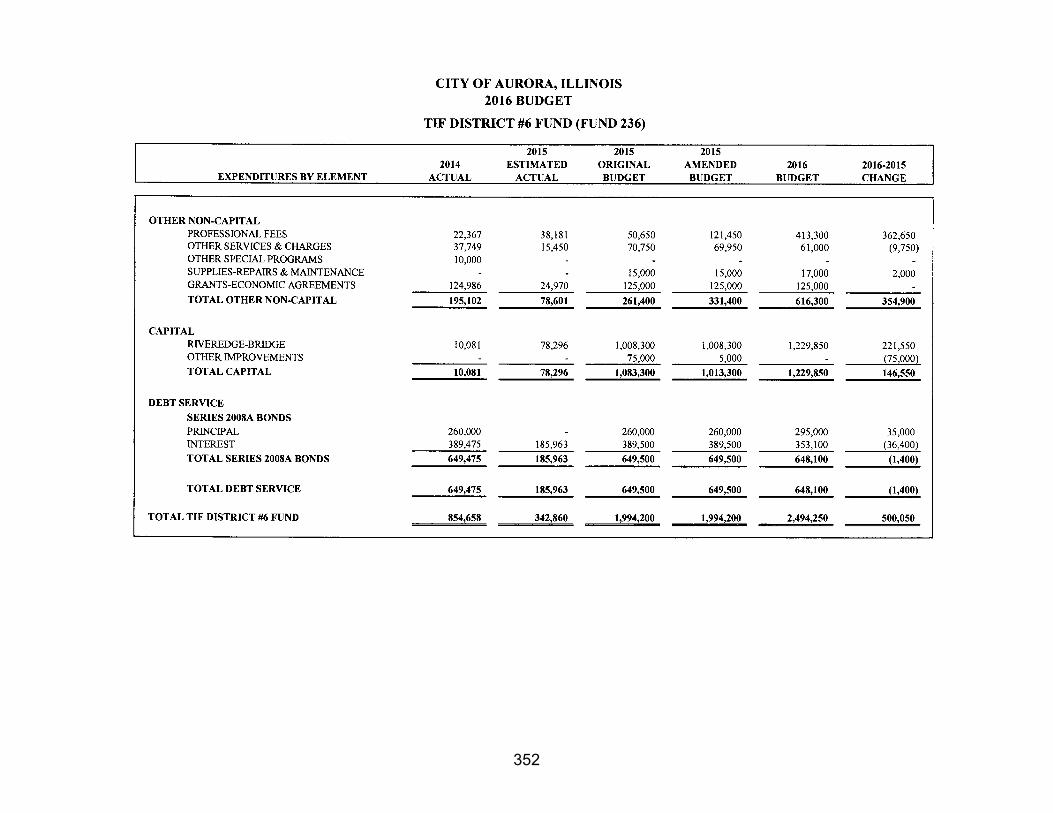
Sales and Use Tax Receipts
$5,000,000
$7,000,000
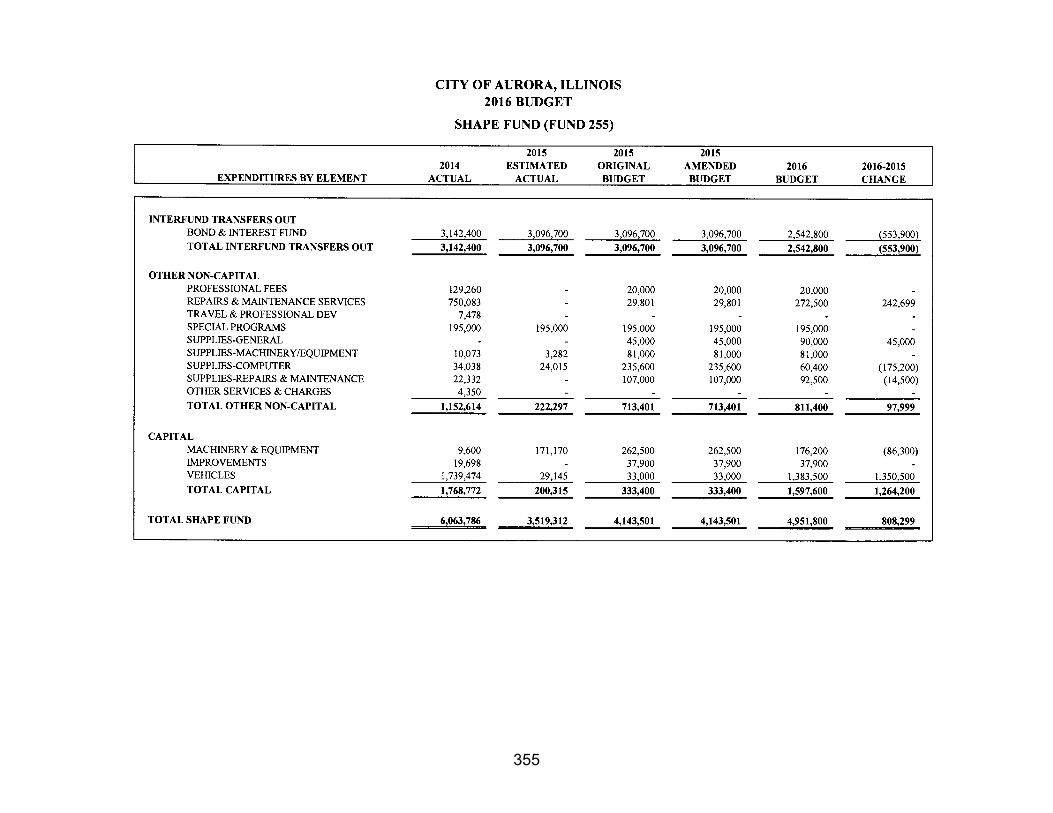
$9,000,000
$11,000,000
$13,000,000
$15,000,000
$17,000,000
$19,000,000
$21,000,000
2011 2012 2013 2014 2015 2016
State Income Tax

103
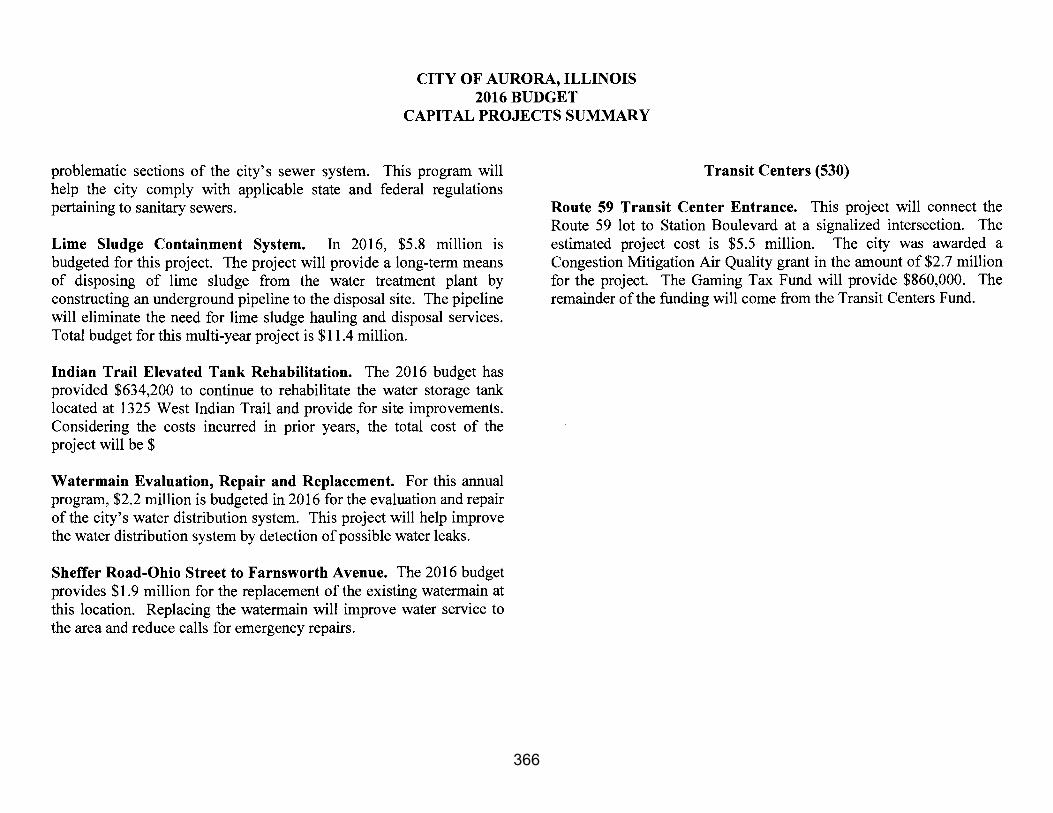
CITY OF AURORA, ILLINOIS 2016 BUDGET
property tax that was lost. The city’s projections for fiscal year 2016 are based on estimates provide by the IDOR.
5. HOME-RULE SALES TAX $21,500,000
The city’s home-rule sales tax rate is 1.25%. In general, the tax applies to the retail sales of all goods except automobiles, drugs, and groceries. The IDOR collects, administers, and enforces the home-rule municipal retailers’ occupation tax and home-rule service occupation tax in accordance with the provisions of Section 8-11-1 and 8-11-5 of the Illinois Municipal Code (65 ILCS 5/8-11-1 and 5/8-11-5).
The city’s estimated revenues of $21,500,000 for FY 2016 reflect the same assumption of a 2% increase over the 2015 estimated actual amount as with state-shared sales taxes. In 2016, revenue from the home-rule sales tax will support the General Fund, SHAPE Fund, Capital Improvements A Fund, Airport Fund, and MVPS Fund.
Historically, the city has allocated home-rule sales tax revenue between the General Fund, Capital Improvements A Fund, and certain other funds. The allocation of home-rule sales taxes since 2011 is shown on the right.
6. FOOD & BEVERAGE TAX $4,400,000
Since July 1, 2005, the city’s food and beverage tax rate has been 1.75%. The food and beverage tax is imposed on the sale of food and beverages consumed on the premises where sold. It is collected by the local establishments and remitted directly to the city. Revenue from this tax is projected to be $4,400,000 in fiscal year 2016. This projection assumes that 2016 food and beverage tax revenues will be approximately 3% higher than the 2015 estimated actual amount.
$-
$5,000,000
$10,000,000
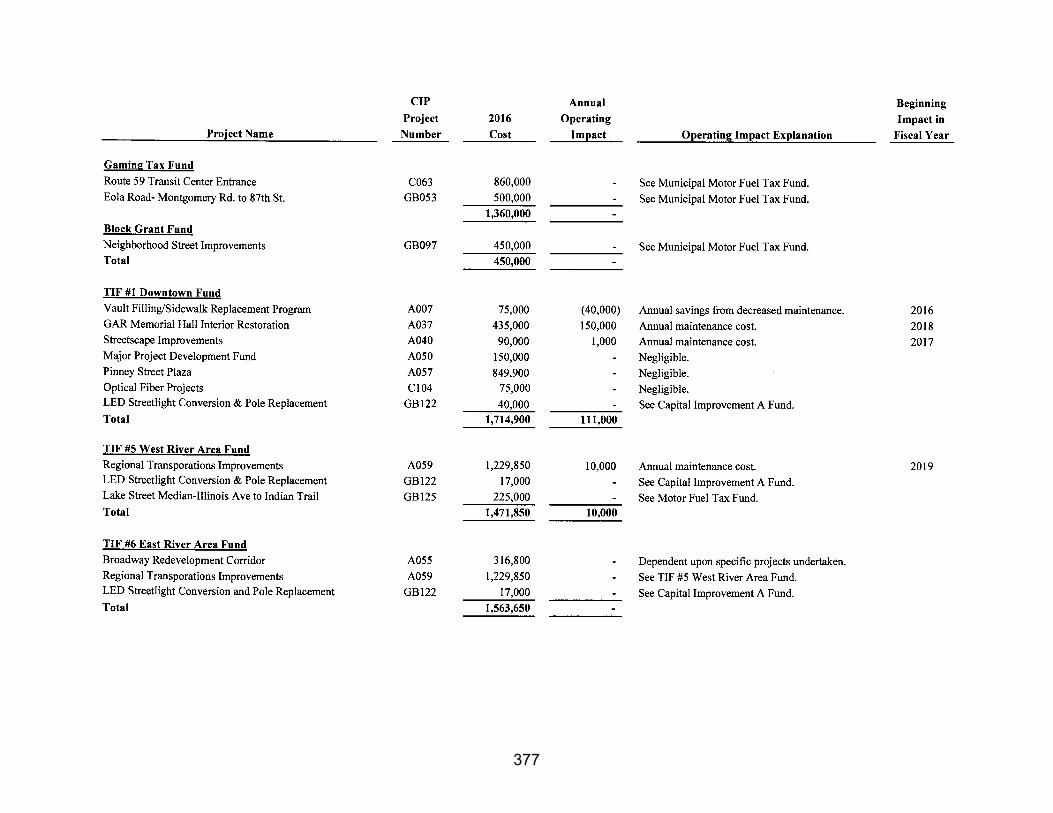
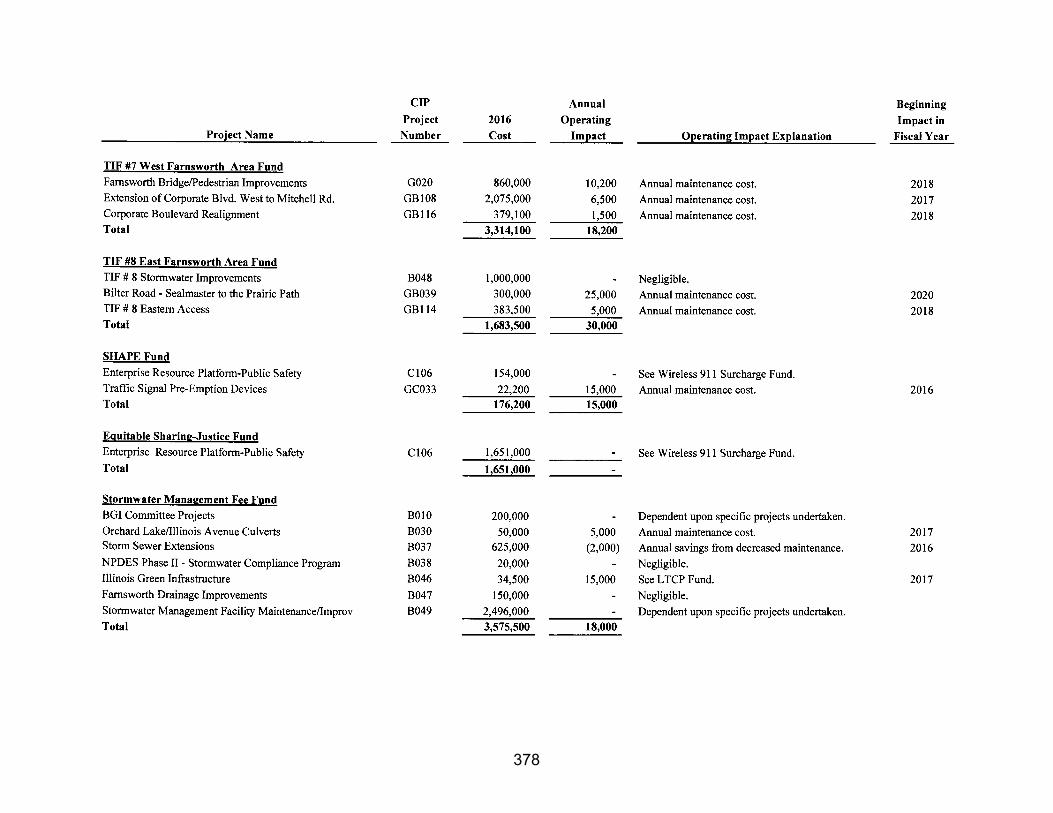
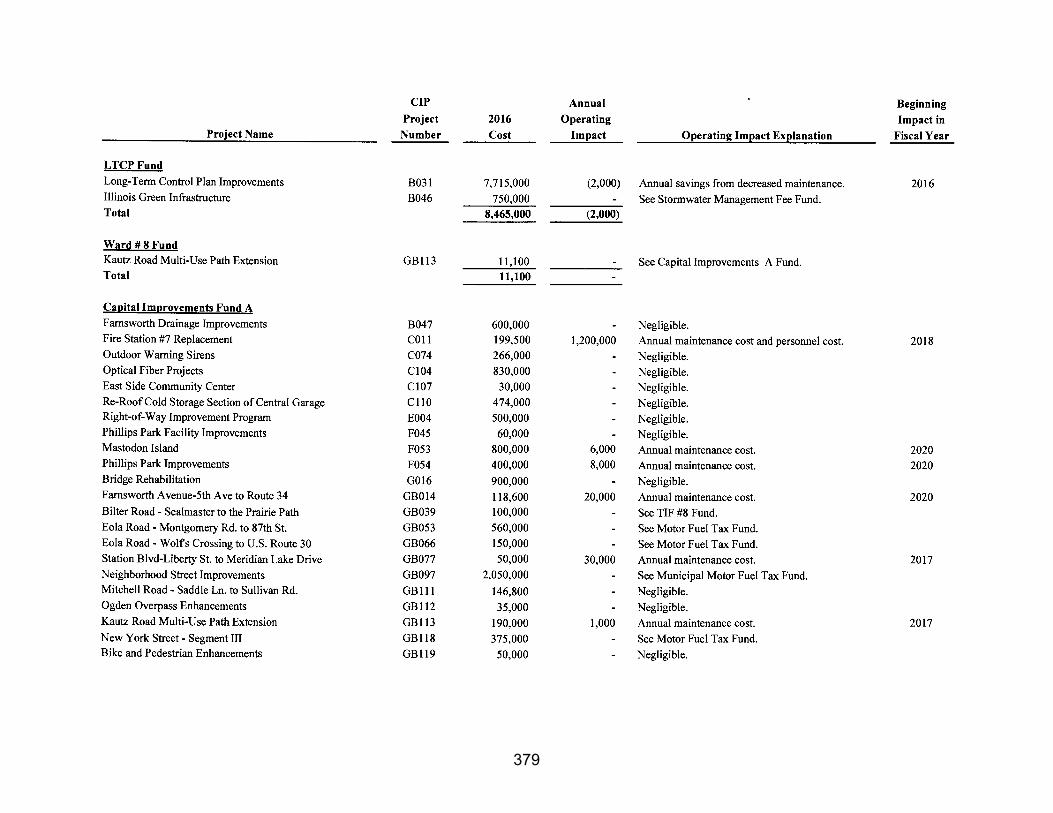
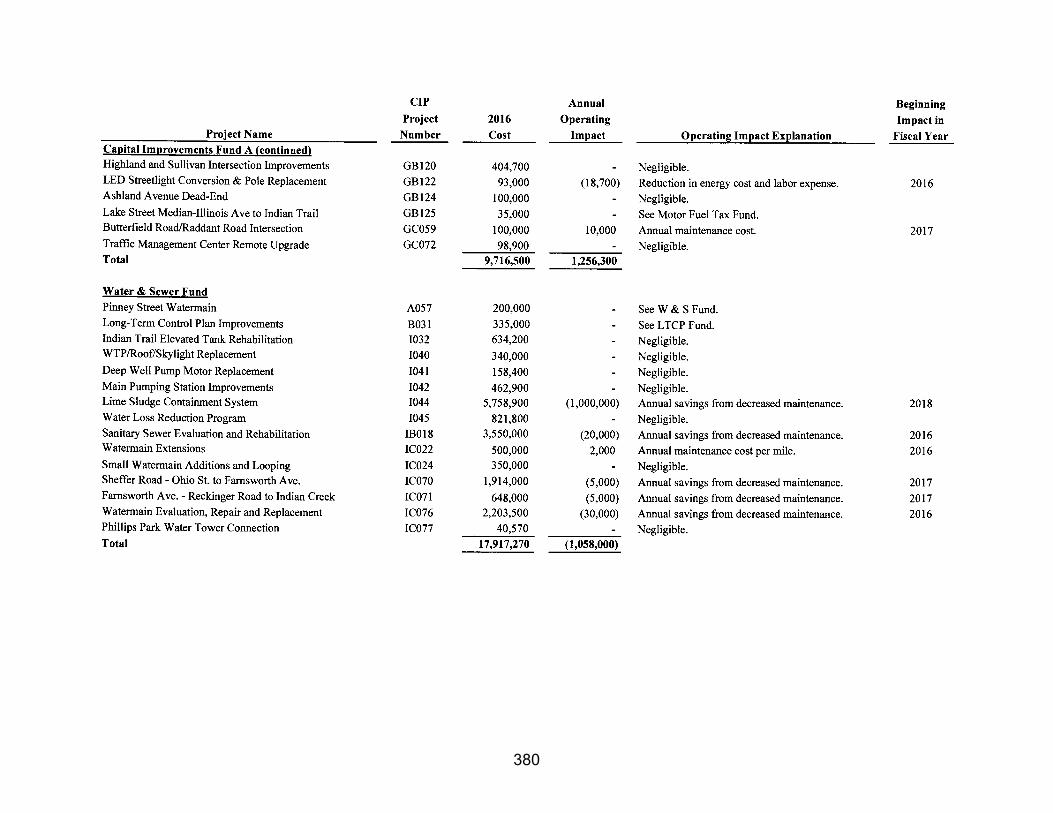
$15,000,000
$20,000,000
$25,000,000
2011 2012 2013 2014 2015 2016
Home Rule Sales Tax Allocation
Sanitation Capital Imp A SHAPE
MVPS Airport General Fund

104
CITY OF AURORA, ILLINOIS 2016 BUDGET
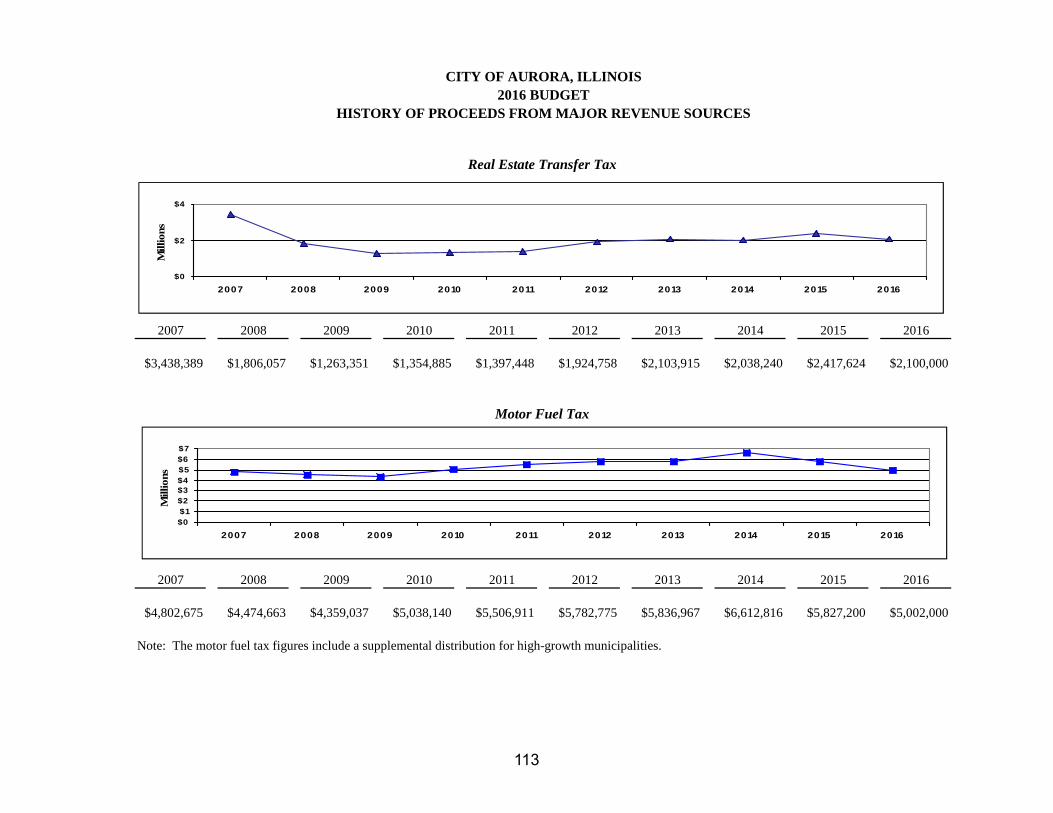
7. MOTOR FUEL TAX $5,002,000
The city receives motor fuel tax (MFT) revenue from the State of Illinois. As shared revenue, the amount remitted to the city is based on a per capita rate. As with state-shared income taxes, the city’s projection for fiscal year 2016 is based upon the IML economic analysis estimates as of January 2015.
Estimated revenue for fiscal year 2016 is $4,770,000. Additionally, the city expects to receive an MFT supplement by virtue of being one of Illinois’ high-growth municipalities. The 2016 supplement has been estimated to be $232,000.
8. GAMING TAXES $7,475,000
The City of Aurora is home to one of nine riverboat casinos in the state. Hollywood Casino, Aurora’s riverboat casino, began operations on June
17, 1993. The city receives a $1.00 admission fee per patron and a 5% wagering tax collected at the casino by the State of Illinois. Revenues from the admission fee are estimated at $1,000,000 and wagering tax revenues are estimated at $6,200,000 in fiscal year 2016. These estimates assume no change from the 2015 actual amount. Casino gaming revenues have not been growing in recent years.
Gaming tax revenue includes the proceeds of video gaming ($200,000) and off-track betting ($75,000) taxes.
No gaming tax revenue has been allocated to the General Fund for 2016.
9. SIMPLIFIED TELECOMMUNICATIONS TAX $5,900,000
Effective January 1, 2003, pursuant to a change in state law, the city’s 5.0% utility tax on telecommunications was combined with its 1% telecommunications infrastructure maintenance fee. The resultant “simplified telecommunications tax” rate for Aurora is 6%. The city’s 2016 projected revenue for the tax assumes no change from the 2015
$2,000,000
$3,000,000
$4,000,000
$5,000,000
$6,000,000
$7,000,000
2011 2012 2013 2014 2015 2016
Motor Fuel Tax Revenue
$0
$5,000,000
$10,000,000
$15,000,000
$20,000,000
2011 2012 2013 2014 2015 2016
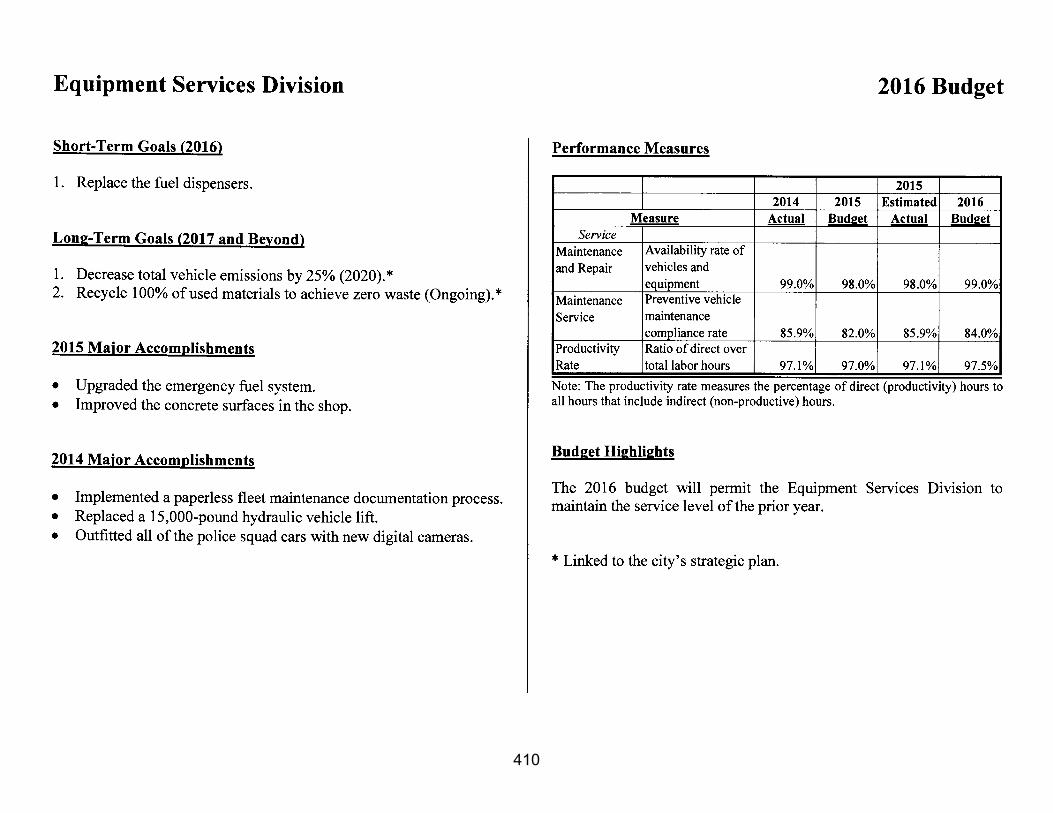
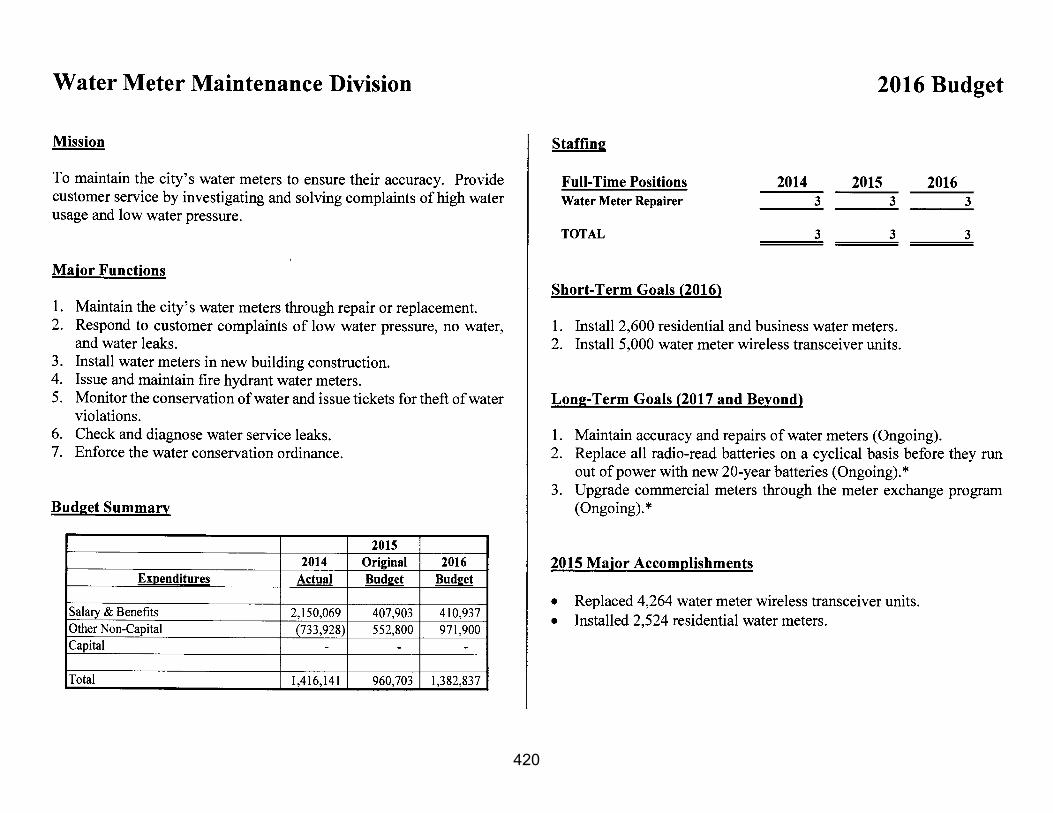
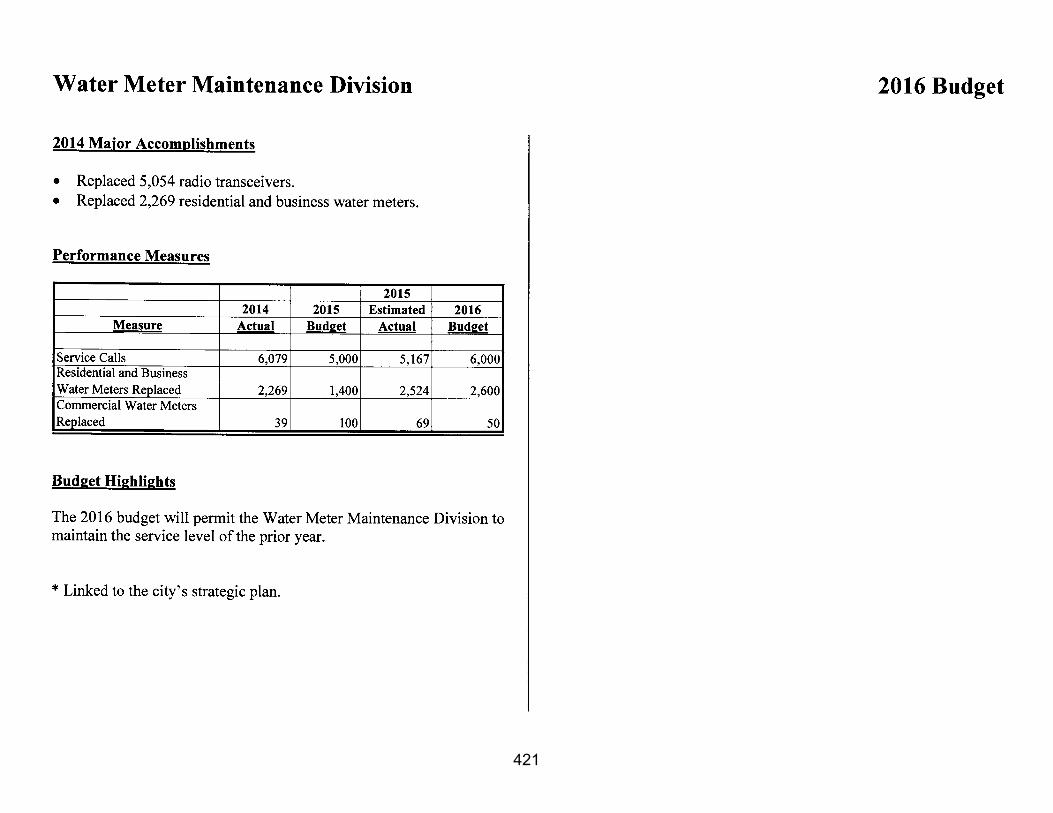
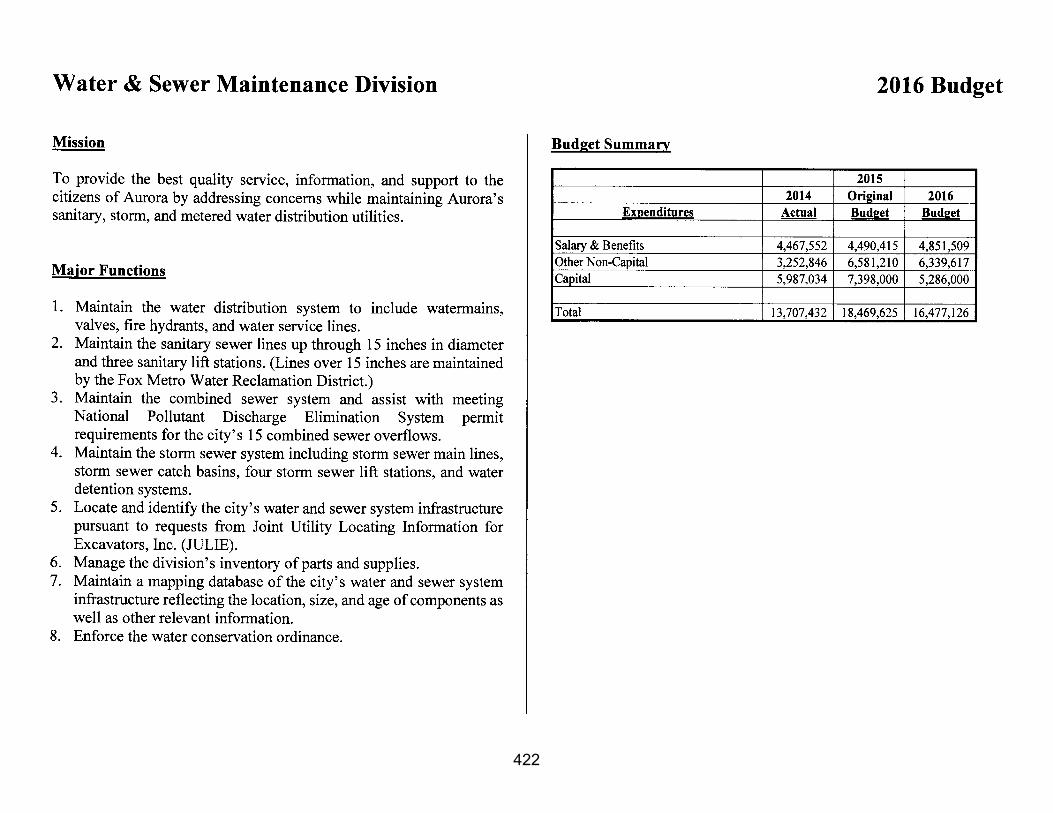
Gaming Tax Revenue
Admissions Wagering

105
CITY OF AURORA, ILLINOIS 2016 BUDGET
estimated actual amount. Telecommunications tax revenues have not been growing in recent years.
10. UTILITY TAX – ELECTRIC $3,500,000
Effective April 1, 1998, the city imposed a utility tax on the use of electricity. Initially, the tax was based on 3% of the gross billings and was later changed to a kilowatt-hour equivalent to comply with deregulation laws. Rates range from 0.202 to 0.330 cents per kilowatt-hour depending on the level of consumption. Fiscal year 2016 projected revenues of $3,500,000 assume no increase in the consumption of the city’s residents and businesses.
11. UTILITY TAX – NATURAL GAS $800,000
Effective April 1, 1998, the city imposed a tax of one cent per therm on the consumption of natural gas. This revenue source will generate an estimated $800,000 in fiscal year 2016. Fiscal year 2016 projection assumes no increase in the consumption of the city’s residents and businesses.
12. REAL ESTATE TRANSFER TAX $2,100,000
The City of Aurora has a real estate transfer tax (RETT) imposed at a rate of $3 per $1,000 of the sale price of real property. Fiscal year 2014 actual revenue was $2,038,240 and 2015 estimated actual revenue was $2,420,000. The city saw an increase in the proceeds of this tax in 2015 due to the sale of foreclosed properties. However, the city is not
projecting this revenue source to increase significantly in 2016 because property values have not yet fully rebounded to pre-recession levels.
13. LICENSES & PERMITS $4,769,650
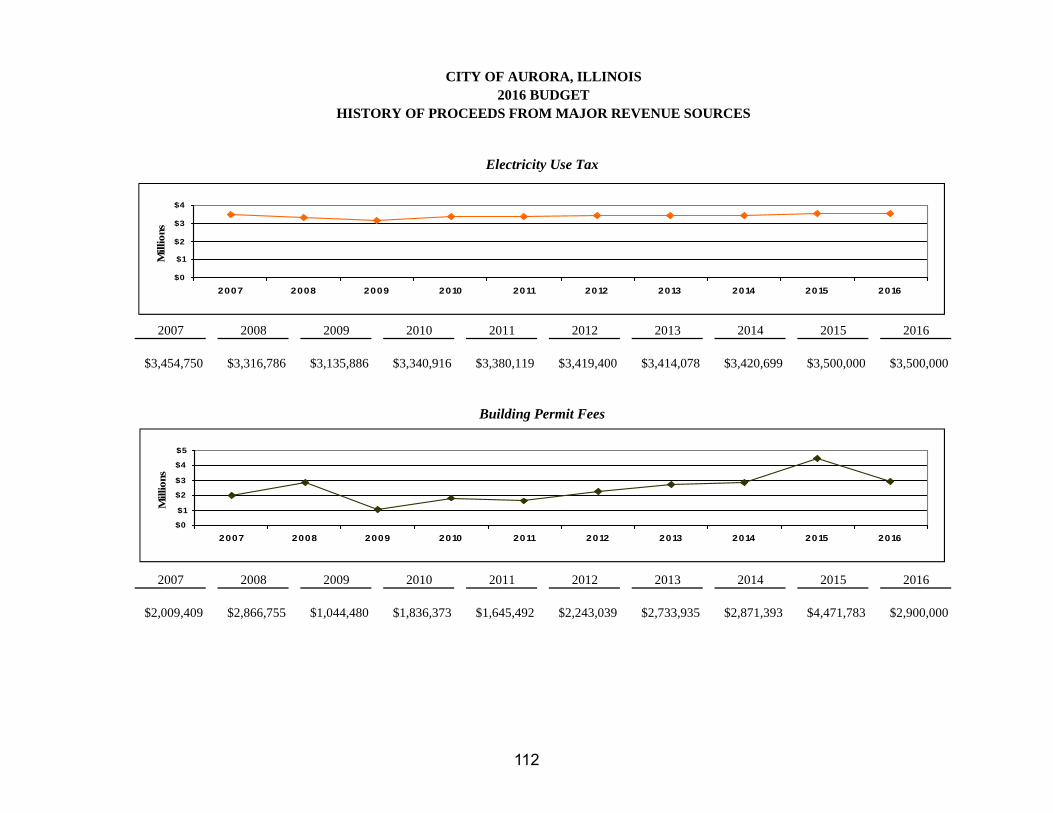
The city collects a variety of license and permit fees. Building permit fees account for a significant portion of this revenue classification. In fiscal year 2016 building permit fees are projected at $2,900,000. Revenue from oversize/weight permits for trucks are estimated at $65,000. In addition, contractor licensing fees are estimated at $195,700 and liquor license fees are estimated at $330,000.
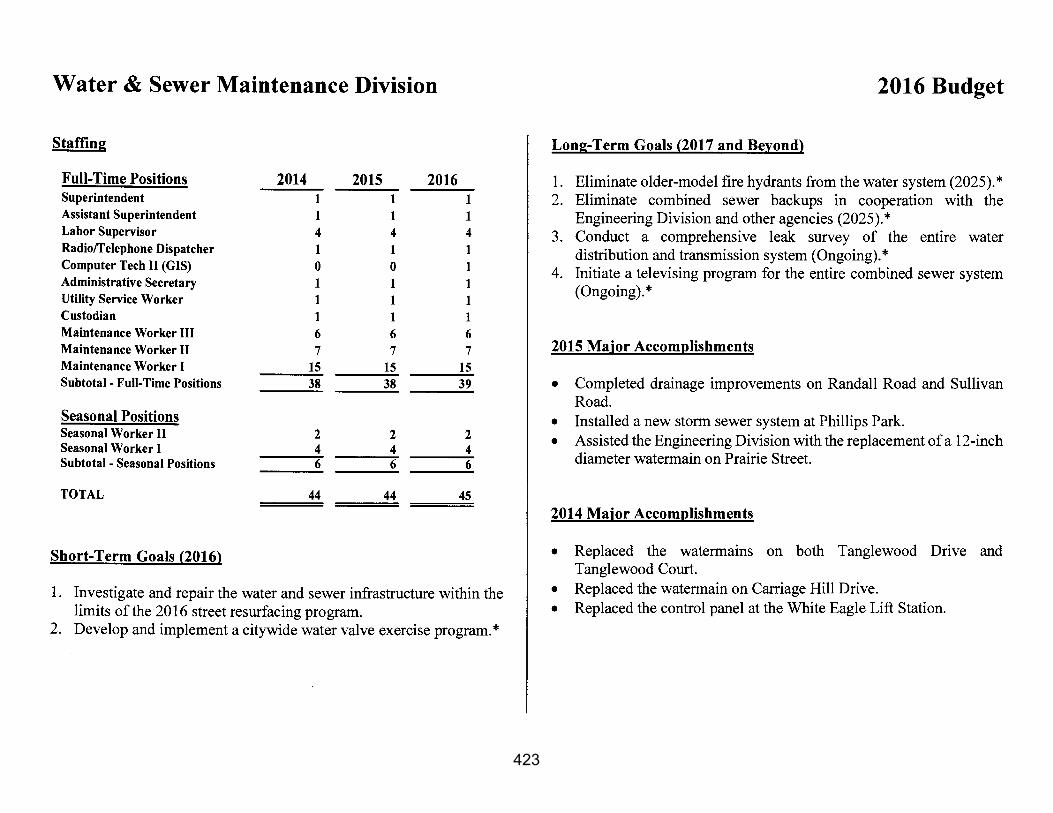
With respect to the building permit fee revenue projections, the city is conservatively estimating that revenues will be approximately the same in 2016 as the 2015 budgeted amount.
$750,000
$1,000,000
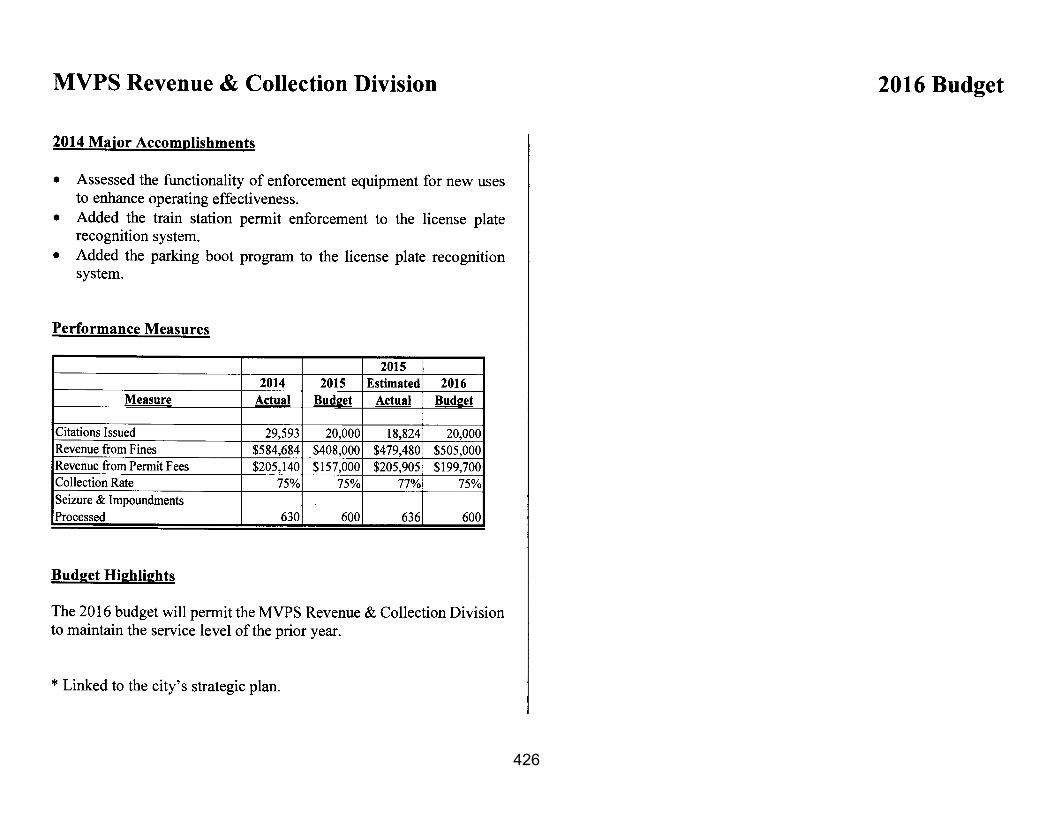
$1,250,000
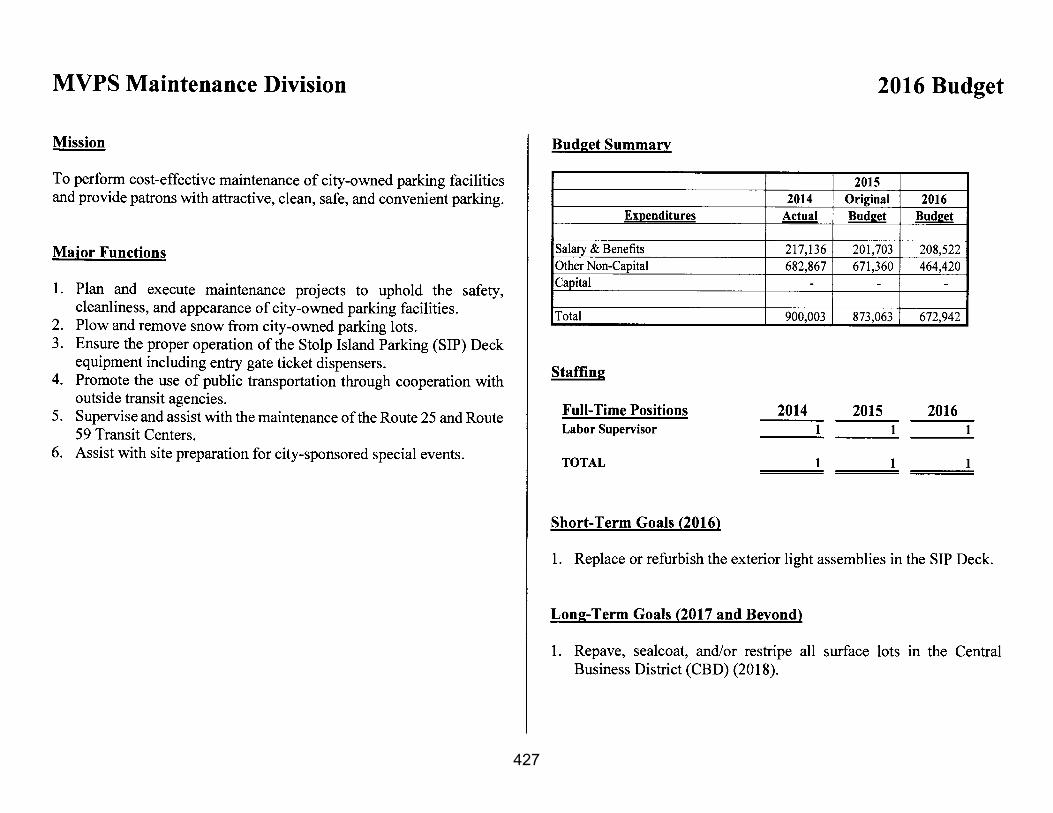
$1,500,000
$1,750,000
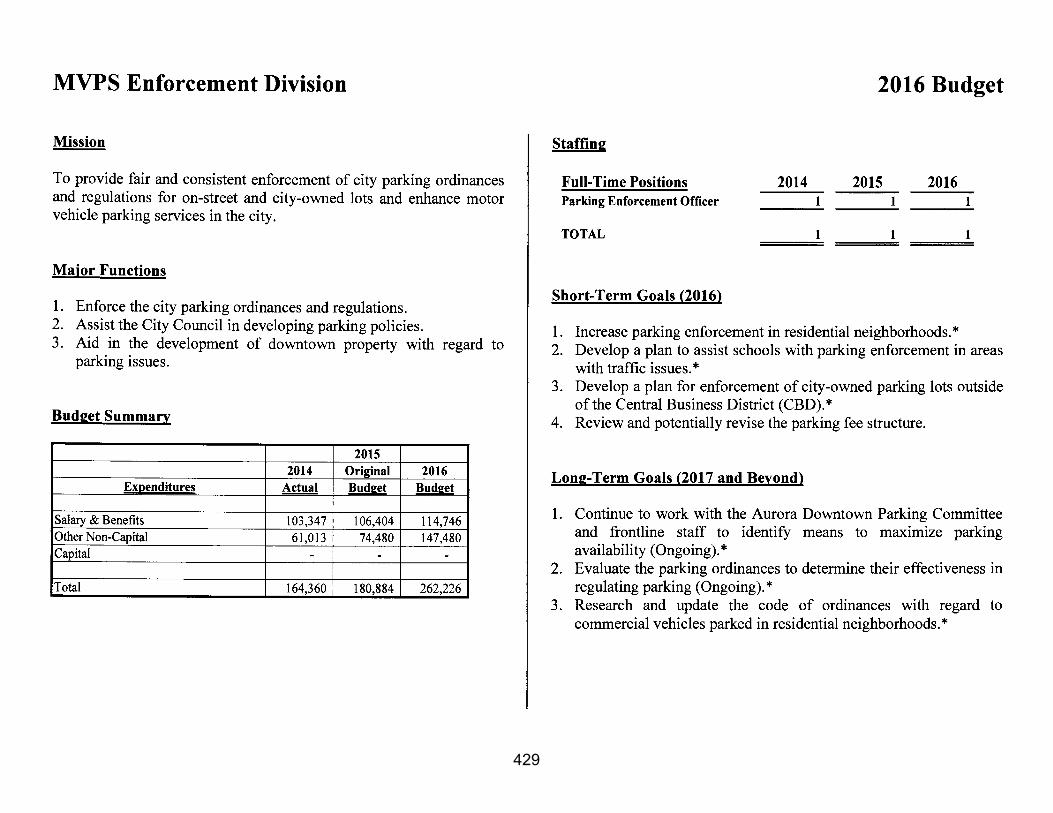
$2,000,000
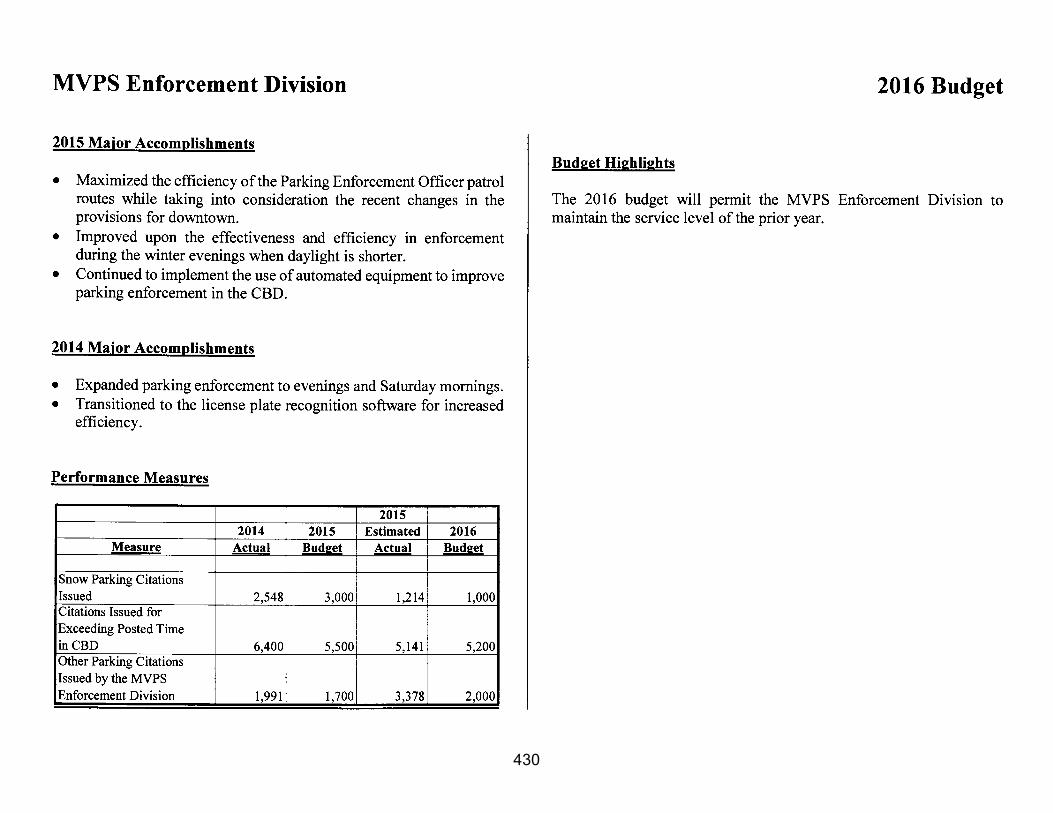
$2,250,000
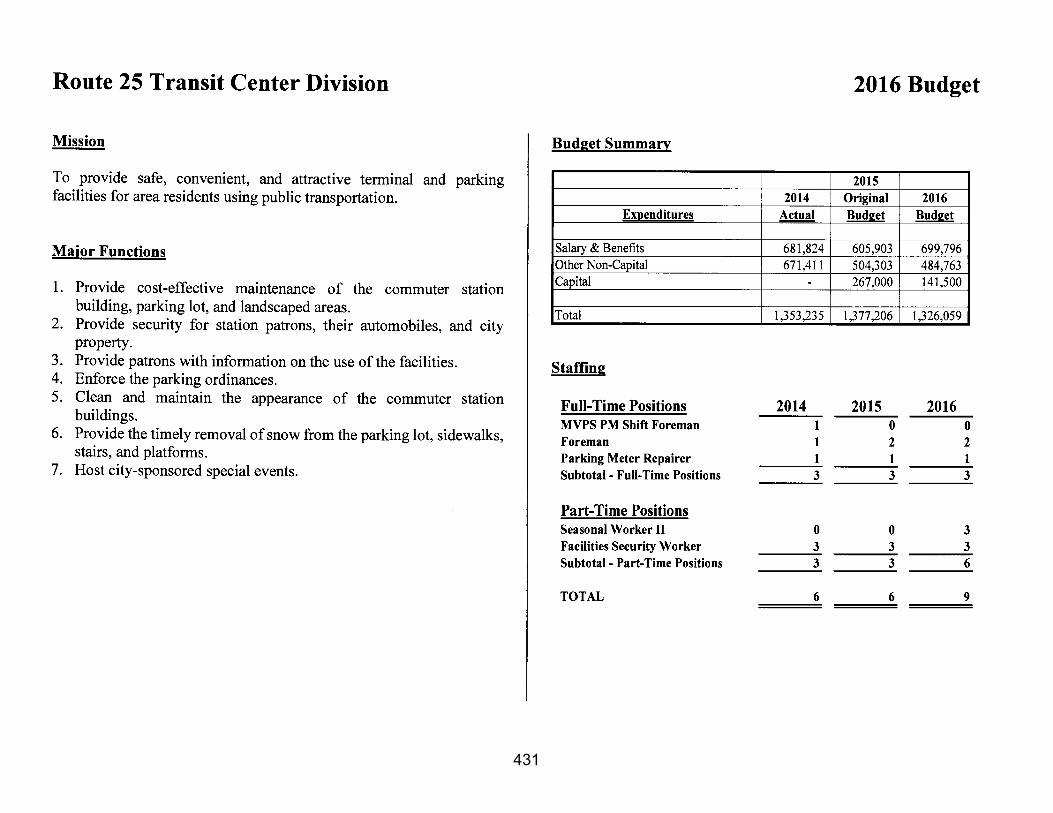
$2,500,000
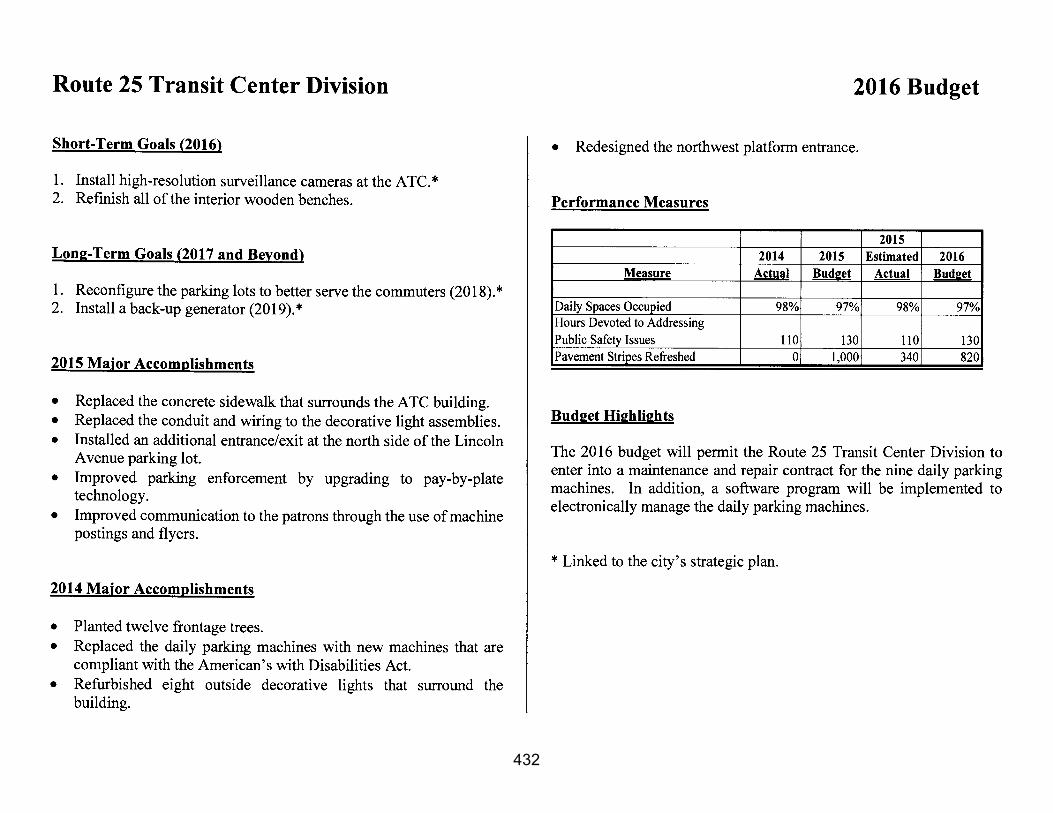
2011 2012 2013 2014 2015 2016
Real Estate Transfer Tax
106
107
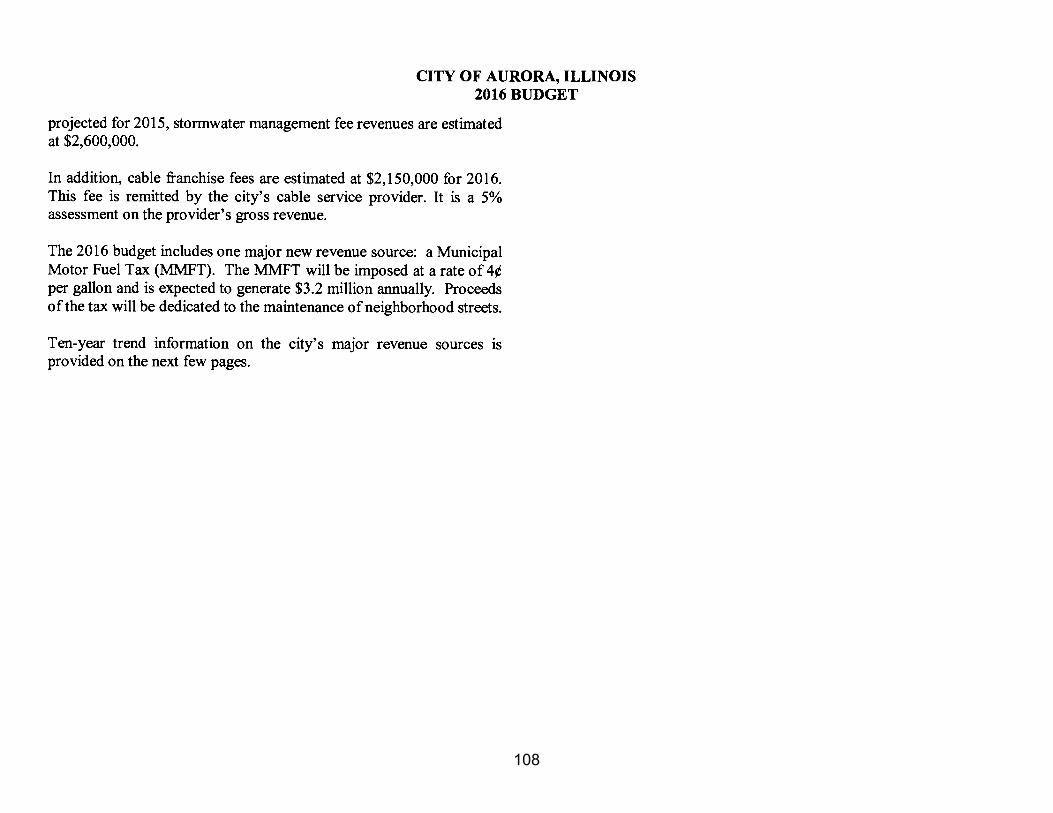
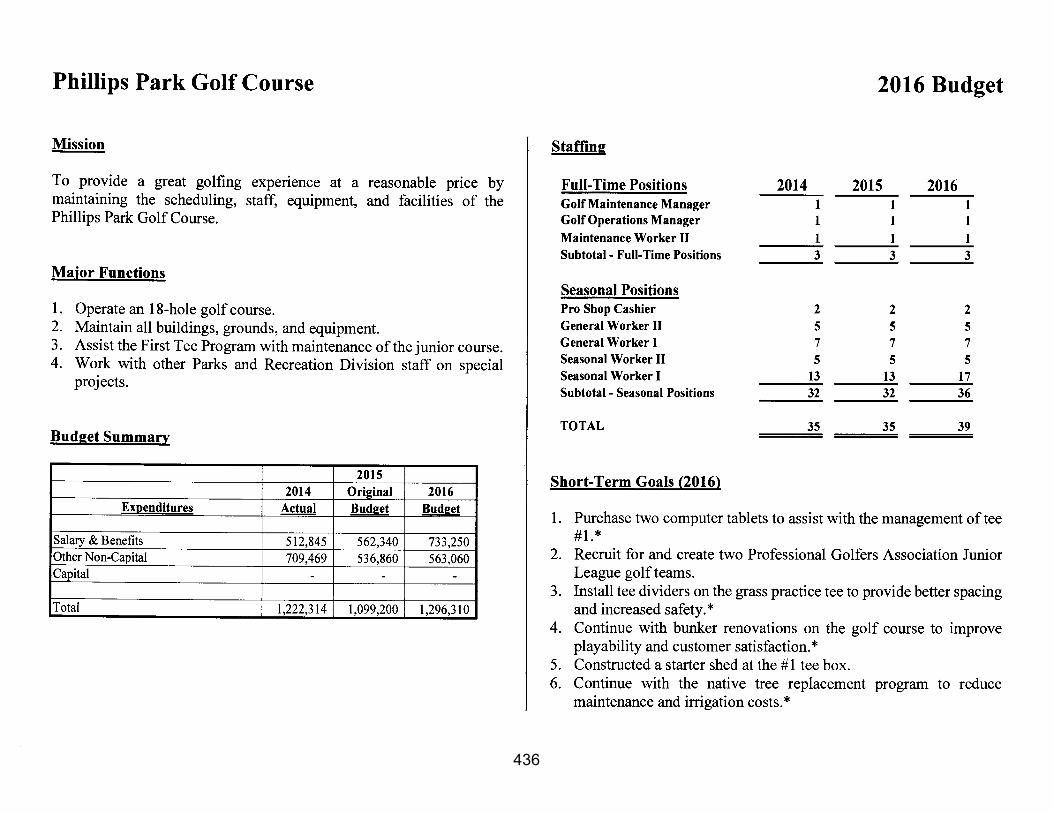
108
109
CITY OF AURORA, ILLINOIS2016 BUDGET
HISTORY OF PROCEEDS FROM MAJOR REVENUE SOURCES
Property Tax
2007 2008 2009 2010 2011 2012 2013 2014 2015 2016
$71,268,400 $76,702,439 $78,777,464 $79,847,930 $77,465,396 $72,335,576 $74,310,669 $74,240,867 $78,433,600 $79,970,719
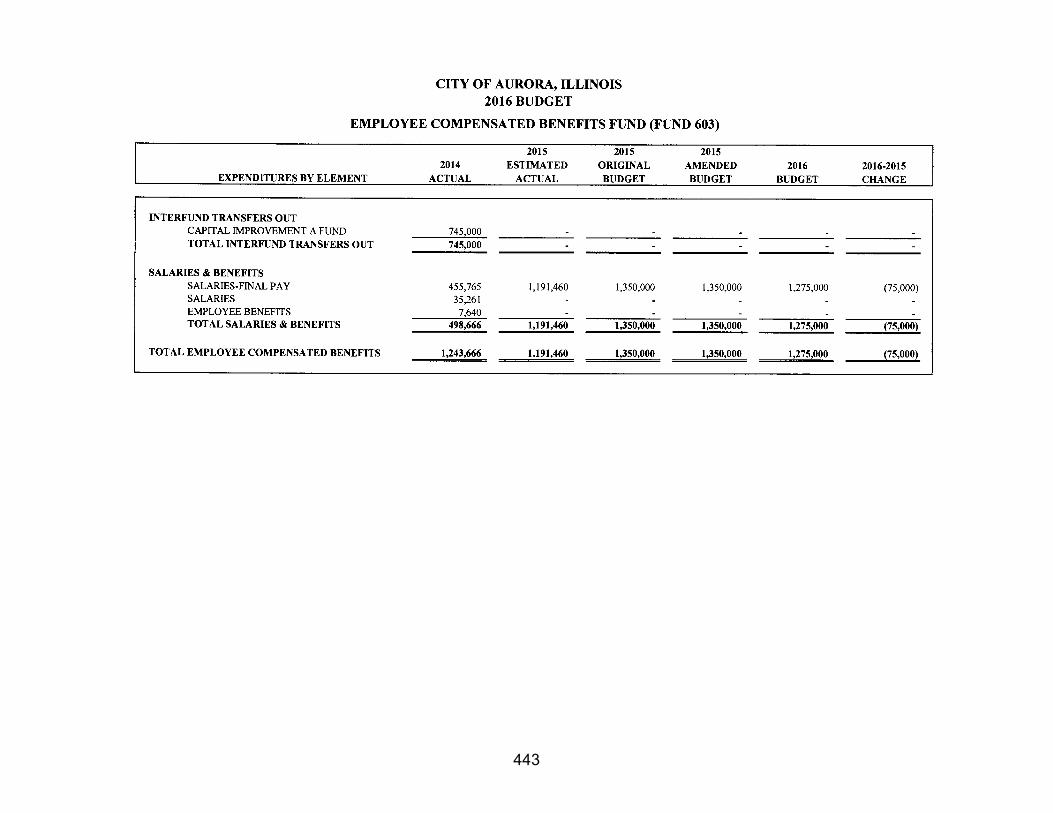
Note: The amounts shown above exclude county road and bridge property taxes.
State-Shared Sales Tax
2007 2008 2009 2010 2011 2012 2013 2014 2015 2016
$19,823,398 $19,265,572 $17,783,111 $18,883,714 $19,766,842 $20,400,419 $22,722,249 $21,952,701 $24,000,000 $25,100,000
Note: The state-shared sales tax amounts do not include home-rule sales, local use, or auto rental taxes.
$50
$75
$10 0
2007 2008 2009 2010 2011 2012 2013 2014 2015 2016
Mill
ions
$0
$10
$2 0
$3 0
2007 2008 2009 2010 2011 2012 2013 2014 2015 2016
Mill
ions
110
CITY OF AURORA, ILLINOIS2016 BUDGET
HISTORY OF PROCEEDS FROM MAJOR REVENUE SOURCES
Income Tax
2007 2008 2009 2010 2011 2012 2013 2014 2015 2016
$14,357,727 $15,589,361 $13,385,104 $12,960,748 $14,334,299 $17,388,869 $18,855,886 $18,947,605 $21,057,086 $19,850,000
Home-Rule Sales Tax
2007 2008 2009 2010 2011 2012 2013 2014 2015 2016
$18,766,449 $18,039,578 $16,615,629 $17,845,651 $18,641,584 $18,841,729 $19,295,817 $19,285,653 $19,500,000 $21,500,000
$0$5
$10
$15$2 0
$2 5
2007 2008 2009 2010 2011 2012 2013 2014 2015 2016
Mill
ions
$0
$5
$10
$15
$2 0
$2 5
2007 2008 2009 2010 2011 2012 2013 2014 2015 2016
Mill
ions

111
CITY OF AURORA, ILLINOIS2016 BUDGET
HISTORY OF PROCEEDS FROM MAJOR REVENUE SOURCES
Food & Beverage Tax
2007 2008 2009 2010 2011 2012 2013 2014 2015 2016
$3,524,803 $3,611,726 $3,409,295 $3,546,095 $3,713,124 $3,996,521 $4,072,652 $4,148,533 $4,447,309 $4,400,000
Telecommunications Tax
2007 2008 2009 2010 2011 2012 2013 2014 2015 2016
$6,827,379 $6,718,353 $6,554,209 $6,185,475 $6,202,311 $6,218,307 $5,864,429 $5,768,993 $5,800,000 $5,900,000
$0
$1
$2
$3
$4
$5
2007 2008 2009 2010 2011 2012 2013 2014 2015 2016
Mill
ions
$0
$2
$4
$6
$8
2007 2008 2009 2010 2011 2012 2013 2014 2015 2016
Mill
ions
112
CITY OF AURORA, ILLINOIS2016 BUDGET
HISTORY OF PROCEEDS FROM MAJOR REVENUE SOURCES
Electricity Use Tax
2007 2008 2009 2010 2011 2012 2013 2014 2015 2016
$3,454,750 $3,316,786 $3,135,886 $3,340,916 $3,380,119 $3,419,400 $3,414,078 $3,420,699 $3,500,000 $3,500,000
Building Permit Fees
2007 2008 2009 2010 2011 2012 2013 2014 2015 2016
$2,009,409 $2,866,755 $1,044,480 $1,836,373 $1,645,492 $2,243,039 $2,733,935 $2,871,393 $4,471,783 $2,900,000
$0
$1
$2
$3
$4
2007 2008 2009 2010 2011 2012 2013 2014 2015 2016
Mill
ions
$0
$1
$2
$3
$4
$5
2007 2008 2009 2010 2011 2012 2013 2014 2015 2016
Mill
ions
113
CITY OF AURORA, ILLINOIS2016 BUDGET
HISTORY OF PROCEEDS FROM MAJOR REVENUE SOURCES
Real Estate Transfer Tax
2007 2008 2009 2010 2011 2012 2013 2014 2015 2016
$3,438,389 $1,806,057 $1,263,351 $1,354,885 $1,397,448 $1,924,758 $2,103,915 $2,038,240 $2,417,624 $2,100,000
Motor Fuel Tax
2007 2008 2009 2010 2011 2012 2013 2014 2015 2016
$4,802,675 $4,474,663 $4,359,037 $5,038,140 $5,506,911 $5,782,775 $5,836,967 $6,612,816 $5,827,200 $5,002,000
Note: The motor fuel tax figures include a supplemental distribution for high-growth municipalities.
$0$1$2$3$4$5$6$7
2007 2008 2009 2010 2011 2012 2013 2014 2015 2016
Mill
ions
$0
$2
$4
2007 2008 2009 2010 2011 2012 2013 2014 2015 2016
Mill
ions

114
CITY OF AURORA, ILLINOIS2016 BUDGET
HISTORY OF PROCEEDS FROM MAJOR REVENUE SOURCES
Gaming Tax
2007 2008 2009 2010 2011 2012 2013 2014 2015 2016
$15,449,377 $12,632,332 $11,720,974 $10,546,684 $10,168,634 $8,968,878 $8,350,381 $7,441,119 $7,103,631 $7,200,000
Water & Sewer Service Fees
2007 2008 2009 2010 2011 2012 2013 2014 2015 2016
$24,461,678 $24,722,147 $24,458,108 $25,271,215 $24,542,941 $28,462,289 $27,628,567 $28,607,815 $29,952,154 $31,000,000
$0
$5
$10
$15
$2 0
2007 2008 2009 2010 2011 2012 2013 2014 2015 2016
Mill
ions
$10
$15
$2 0
$2 5
$3 0
$3 5
2007 2008 2009 2010 2011 2012 2013 2014 2015 2016
Mill
ions
115

116
117
118
119
120

121

122
123

124

125

126
127

128

129
130

131

132

133

134

135

136
137

138

139
140

141

142

143

144

145

146

147

148

149

150

151
152

153

154

155
156

157

158
159
2016CLASS BUDGET
Salaries & Benefits 224,027,145
Other Non-Capital 76,638,136
Capital 77,037,370
Debt Service 19,119,500
Transfers Out 13,210,600
Total 410,032,751
EXPENDITURES - ALL FUNDS2016 BUDGET
CITY OF AURORA, ILLINOIS
SALARIES & BENEFITS
54%
OTHER NON-CAPITAL
19%
CAPITAL19%
DEBTSERVICE
5%
TRANSFERSOUT3%

160
161
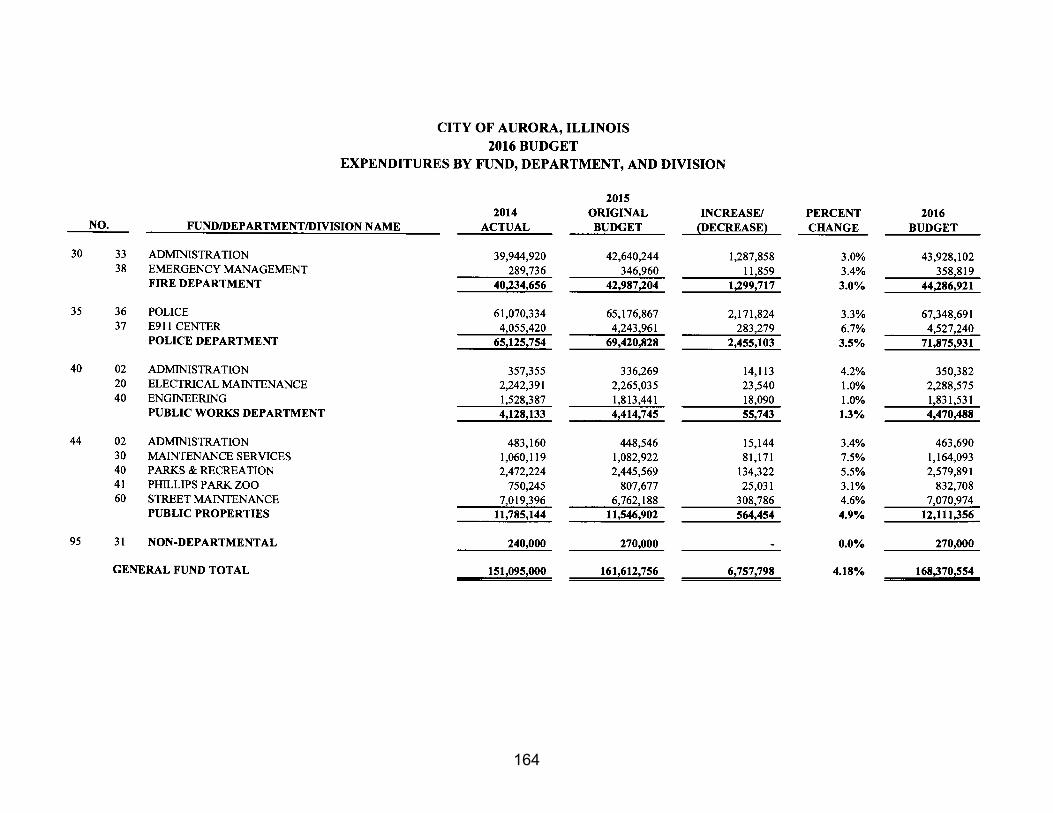
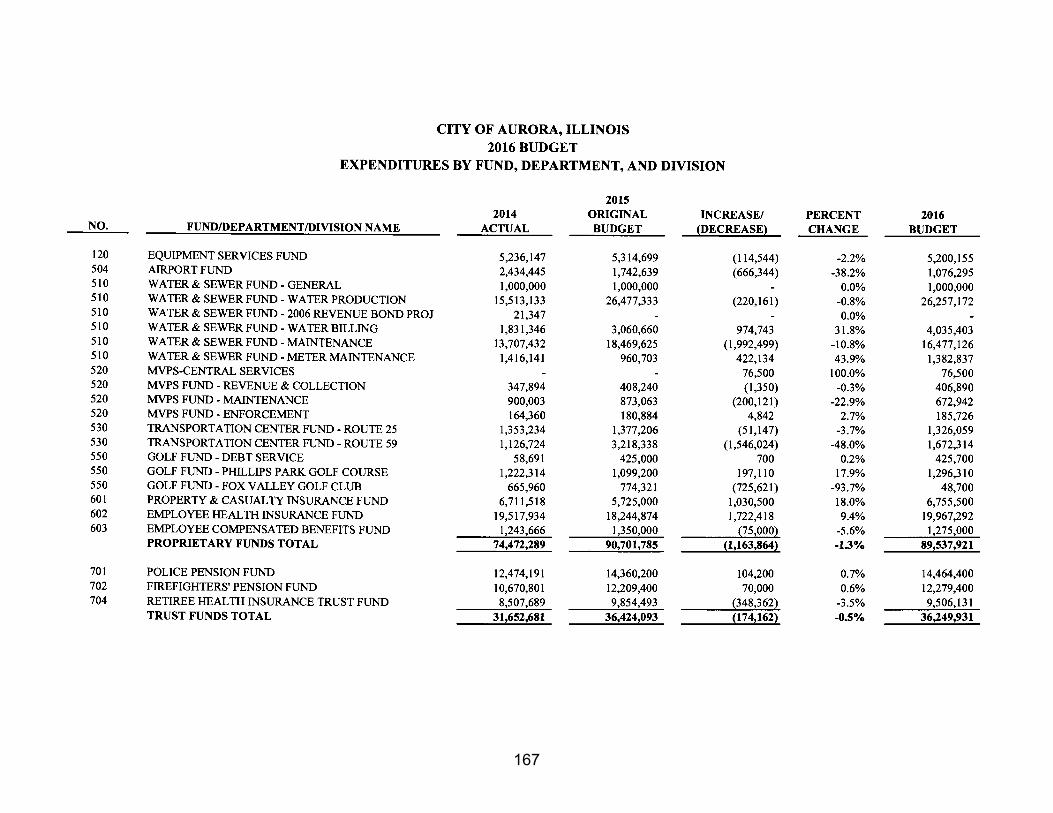
CITY OF AURORA, IILINOIS 2016 BUDGET
EXPENDITURES BY FUND, DEPARTMENT, AND DIVISION
20152014 ORIGINAL INCREASE/ PERCENT 2016
FUND DESCRIPTION ACTUAL BUDGET (DECREASE) CHANGE BUDGET
GENERAL FUND 151,095,000 161,612,756 6,757,798 4.2% 168,370,554SPECIAL REVENUE FUNDS 39,941,533 72,950,451 3,702,349 5.1% 76,652,800CAPITAL PROJECTS FUNDS 9,942,261 25,635,400 (10,997,150) -42.9% 14,638,250DEBT SERVICE FUND 23,845,177 14,433,200 (2,863,700) -19.8% 11,569,500PROPRIETARY FUNDS 74,472,289 90,701,785 (1,163,864) -1.3% 89,537,921TRUST FUNDS 31,652,681 36,424,093 (174,162) -0.5% 36,249,931TOTAL 330,948,941 401,757,685 (4,738,729) -1.2% 397,018,956
LIBRARY FUNDS 25,432,350 19,893,667 (6,879,692) -34.6% 13,013,975
COMBINED TOTAL 356,381,291 421,651,352 (11,618,421) -2.8% 410,032,931
$0 $20,000,000 $40,000,000 $60,000,000 $80,000,000 $100,000,000 $120,000,000 $140,000,000 $160,000,000
PUBLIC LIBRARY FUNDS
TRUST FUNDS
PROPRIETARY FUNDS
DEBT SERVICE FUND
CAPITAL PROJECTS FUNDS
SPECIAL REVENUE FUNDS
GENERAL FUND
2015 & 2016 BUDGET COMPARISON
2016 BUDGET 2015 BUDGET

162
163
164

165

166
167

168
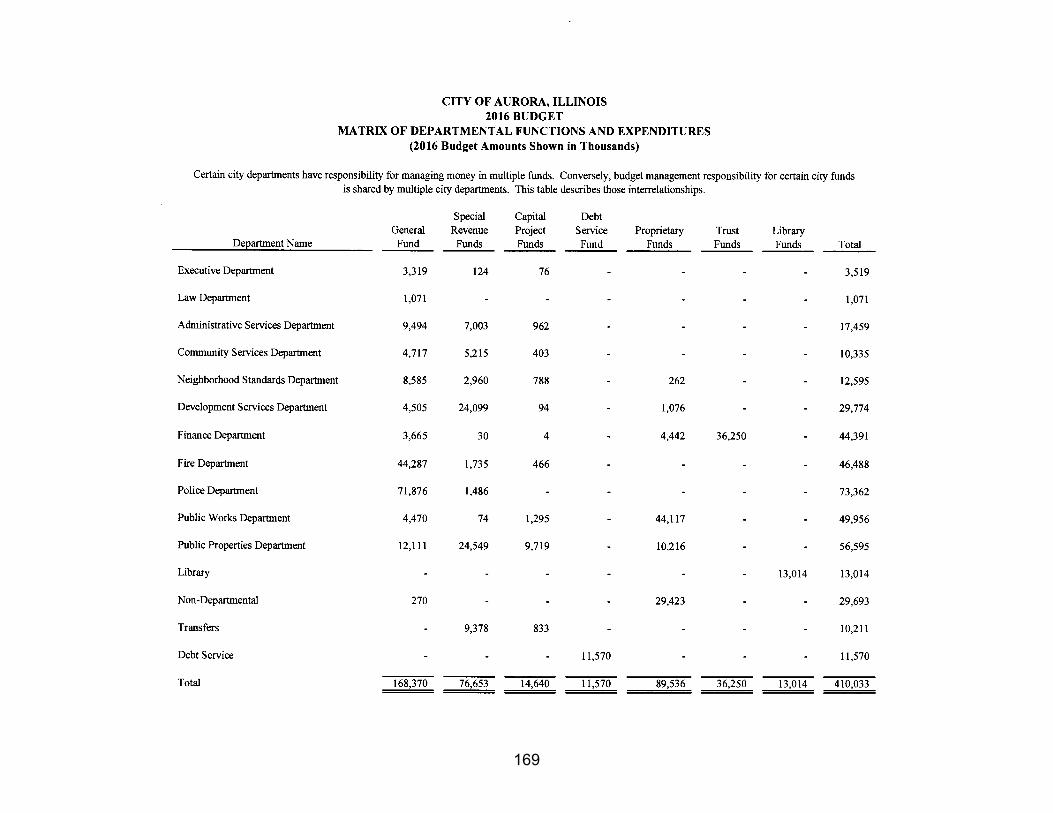
169

170
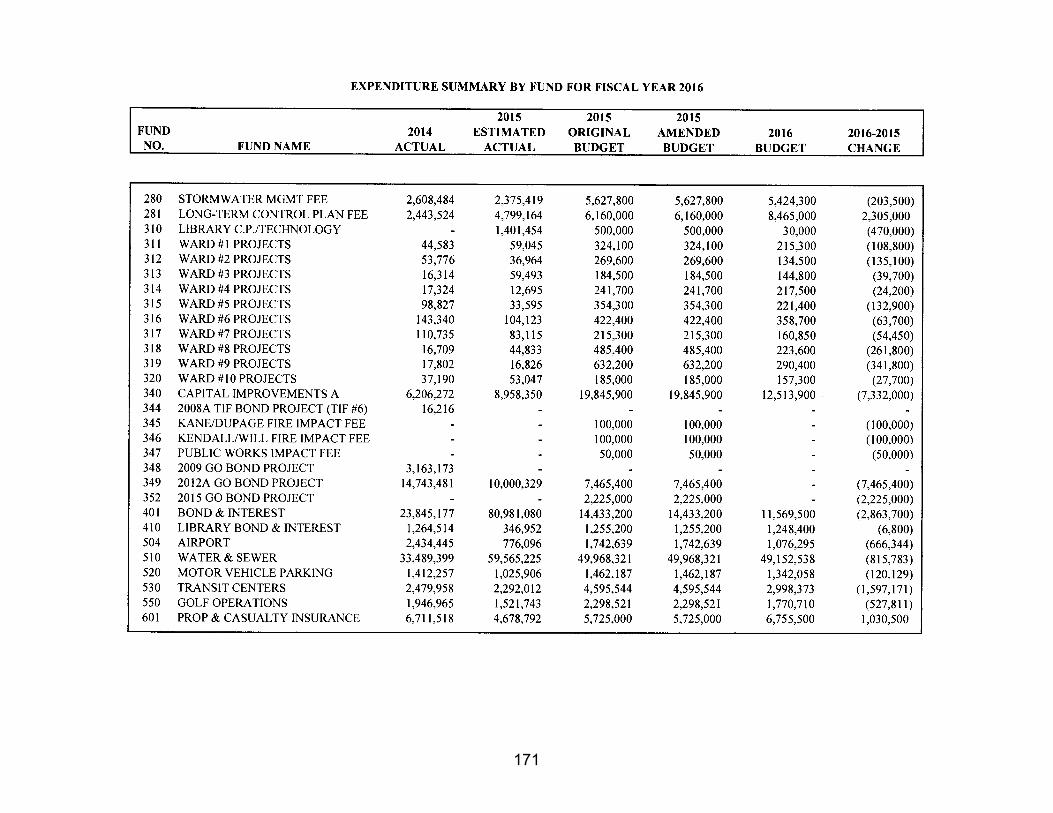
171

172

173
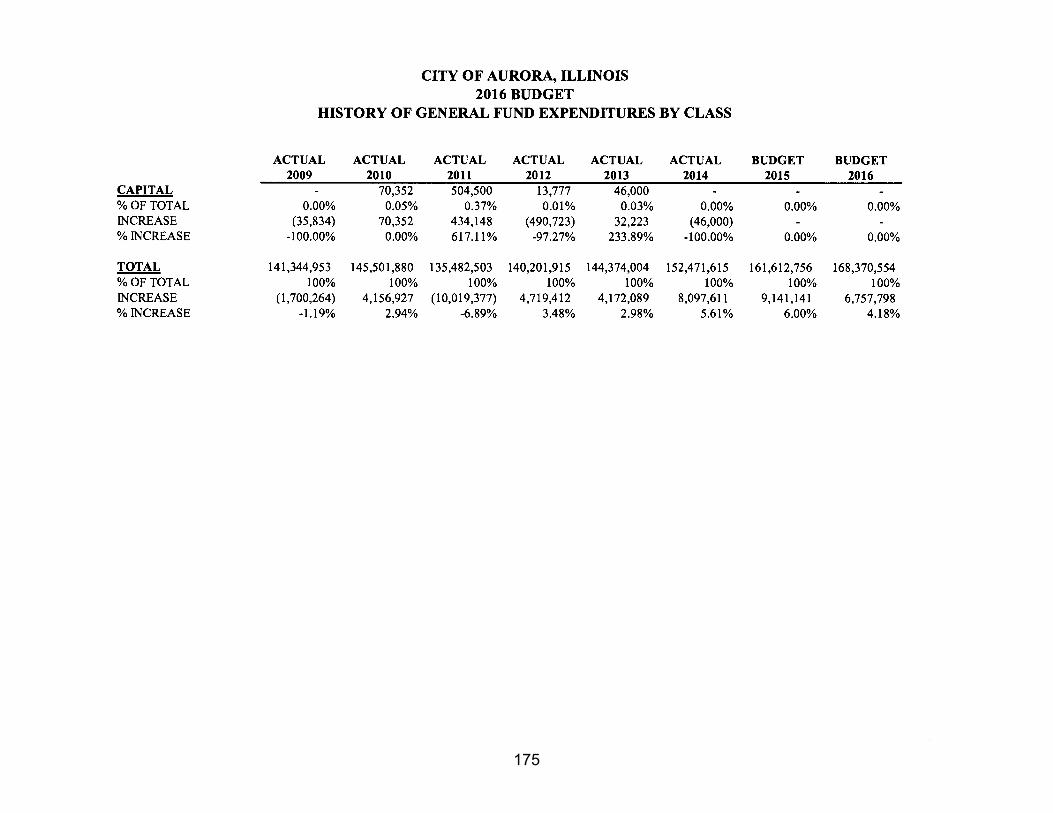
CITY OF AURORA, ILLINOIS2016 BUDGET
HISTORY OF GENERAL FUND EXPENDITURES BY CLASS
ACTUAL ACTUAL ACTUAL ACTUAL ACTUAL ACTUAL BUDGET BUDGET2009 2010 2011 2012 2013 2014 2015 2016
PERSONNEL 122,570,695 127,364,306 115,648,421 123,212,600 126,721,703 131,271,025 138,936,014 144,794,193OTHER NON-CAPITAL 18,774,258 18,067,222 19,329,582 16,975,538 17,606,301 21,200,590 22,676,742 23,576,361CAPITAL - 70,352 504,500 13,777 46,000 - - -
.TOTAL 141,344,953 145,501,880 135,482,503 140,201,915 144,374,004 152,471,615 161,612,756 168,370,554
PERSONNEL86.0%
OTHER NON-CAPITAL14.0%
2016 GENERAL FUND EXPENDITURES
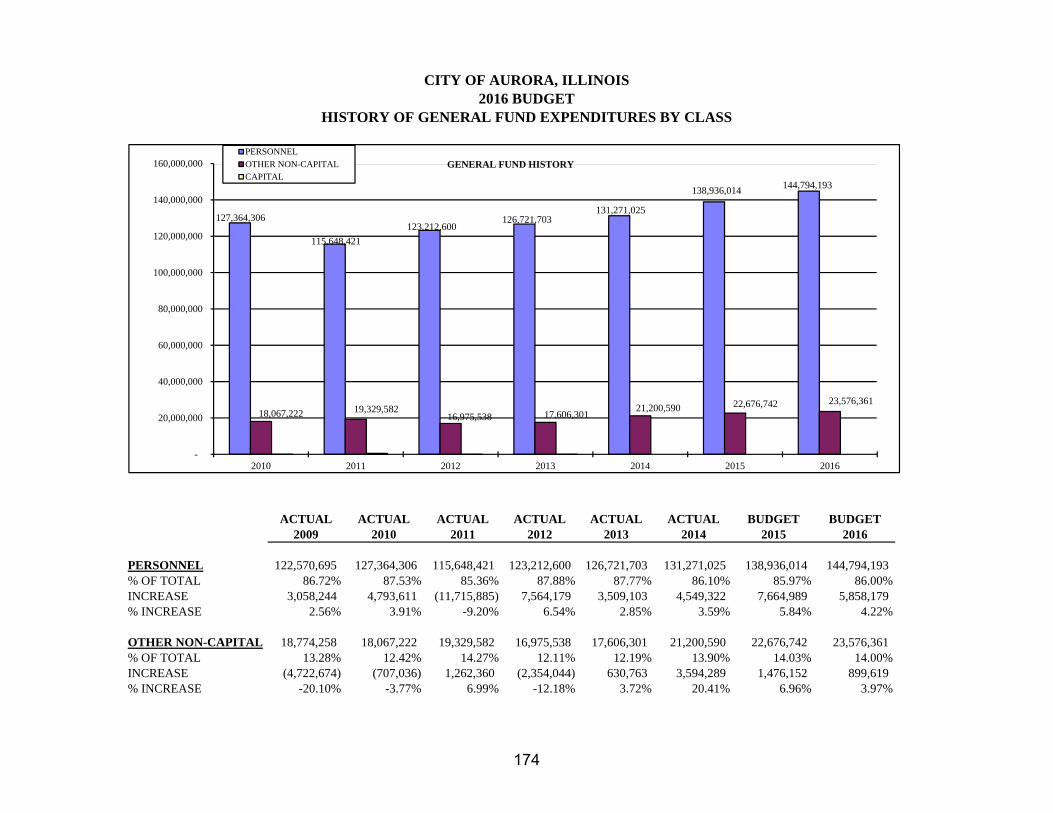
174
CITY OF AURORA, ILLINOIS2016 BUDGET
HISTORY OF GENERAL FUND EXPENDITURES BY CLASS
ACTUAL ACTUAL ACTUAL ACTUAL ACTUAL ACTUAL BUDGET BUDGET2009 2010 2011 2012 2013 2014 2015 2016
PERSONNEL 122,570,695 127,364,306 115,648,421 123,212,600 126,721,703 131,271,025 138,936,014 144,794,193% OF TOTAL 86.72% 87.53% 85.36% 87.88% 87.77% 86.10% 85.97% 86.00%INCREASE 3,058,244 4,793,611 (11,715,885) 7,564,179 3,509,103 4,549,322 7,664,989 5,858,179% INCREASE 2.56% 3.91% -9.20% 6.54% 2.85% 3.59% 5.84% 4.22%
OTHER NON-CAPITAL 18,774,258 18,067,222 19,329,582 16,975,538 17,606,301 21,200,590 22,676,742 23,576,361% OF TOTAL 13.28% 12.42% 14.27% 12.11% 12.19% 13.90% 14.03% 14.00%INCREASE (4,722,674) (707,036) 1,262,360 (2,354,044) 630,763 3,594,289 1,476,152 899,619% INCREASE -20.10% -3.77% 6.99% -12.18% 3.72% 20.41% 6.96% 3.97%
127,364,306
115,648,421
123,212,600126,721,703
131,271,025
138,936,014 144,794,193
18,067,222 19,329,58216,975,538 17,606,301
21,200,590 22,676,742 23,576,361
-
20,000,000
40,000,000
60,000,000
80,000,000
100,000,000
120,000,000
140,000,000
160,000,000
2010 2011 2012 2013 2014 2015 2016
GENERAL FUND HISTORYPERSONNELOTHER NON-CAPITALCAPITAL
175

176
177
178

179
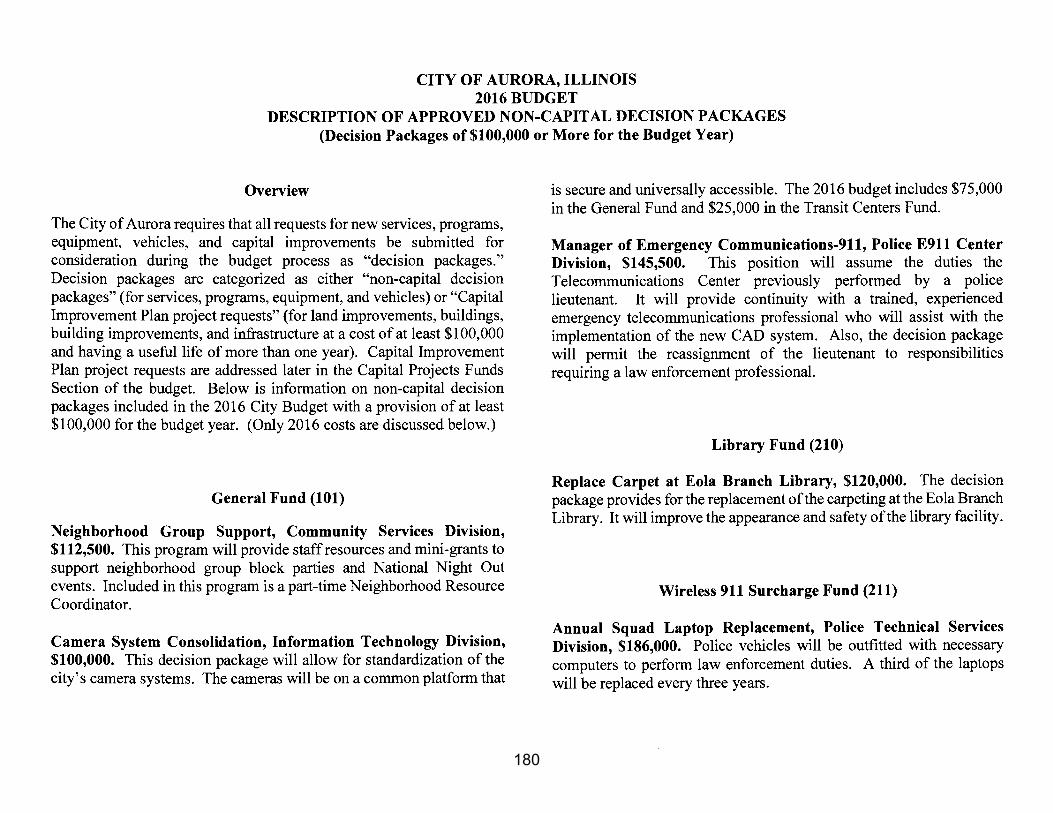
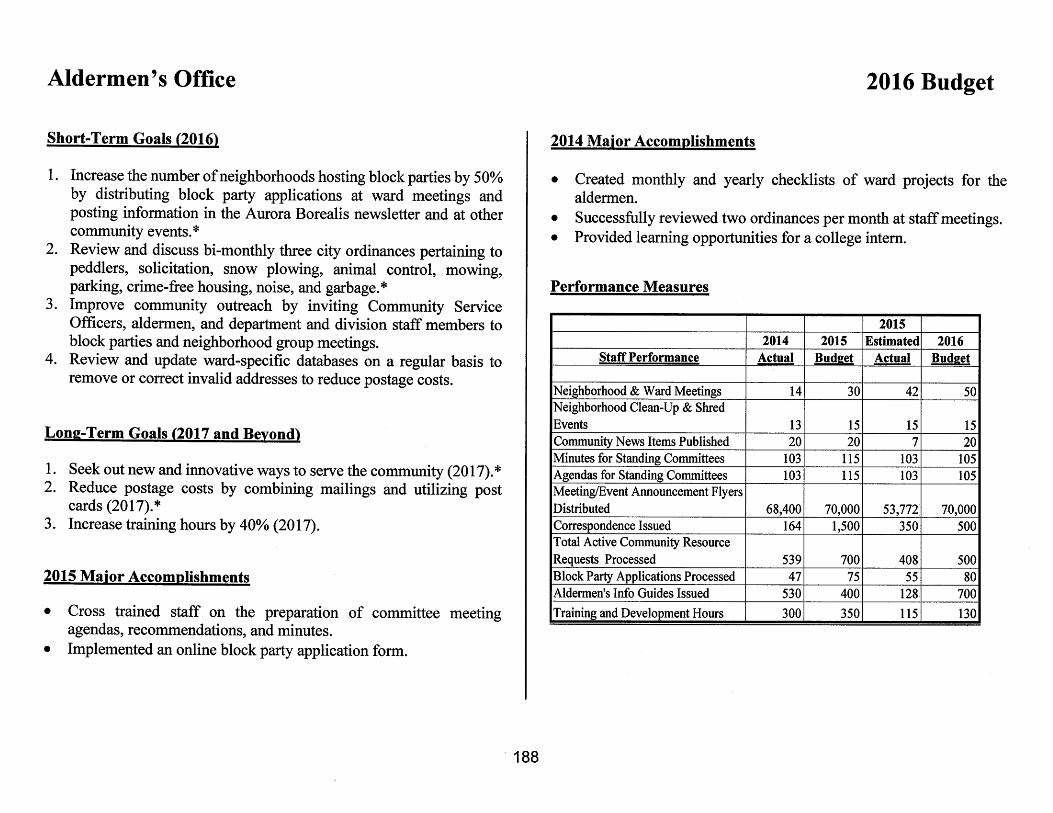
180

181

182

183

184
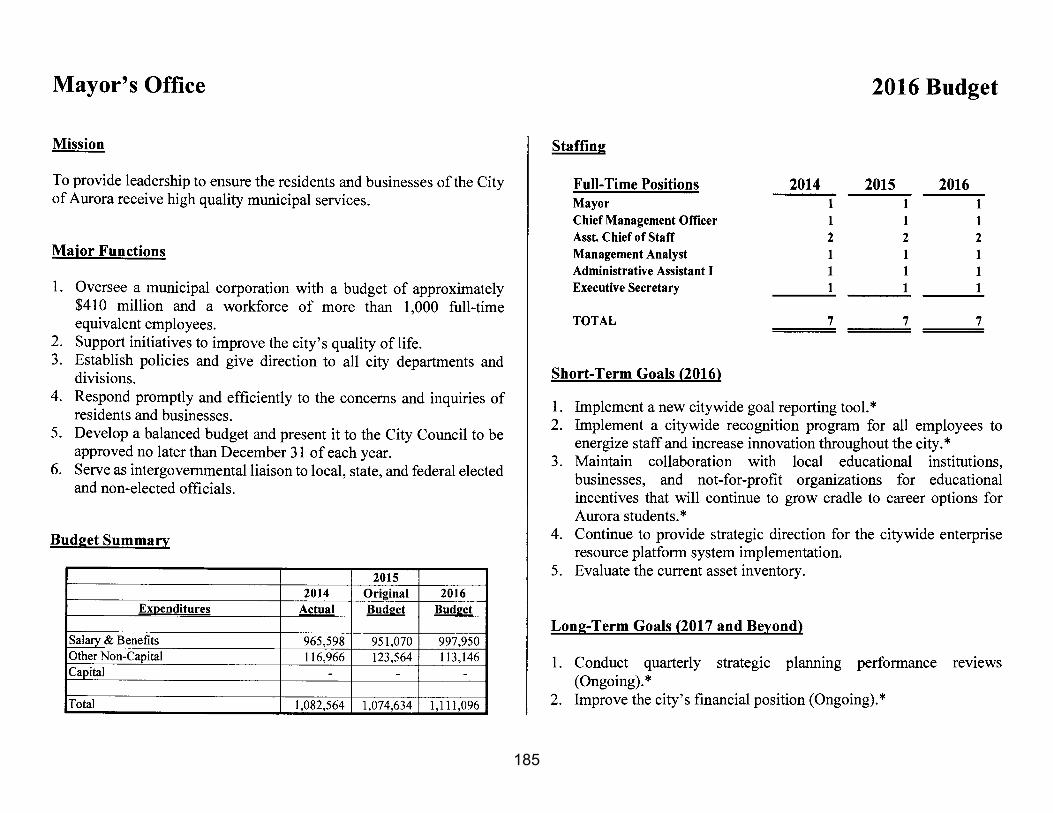
185

186

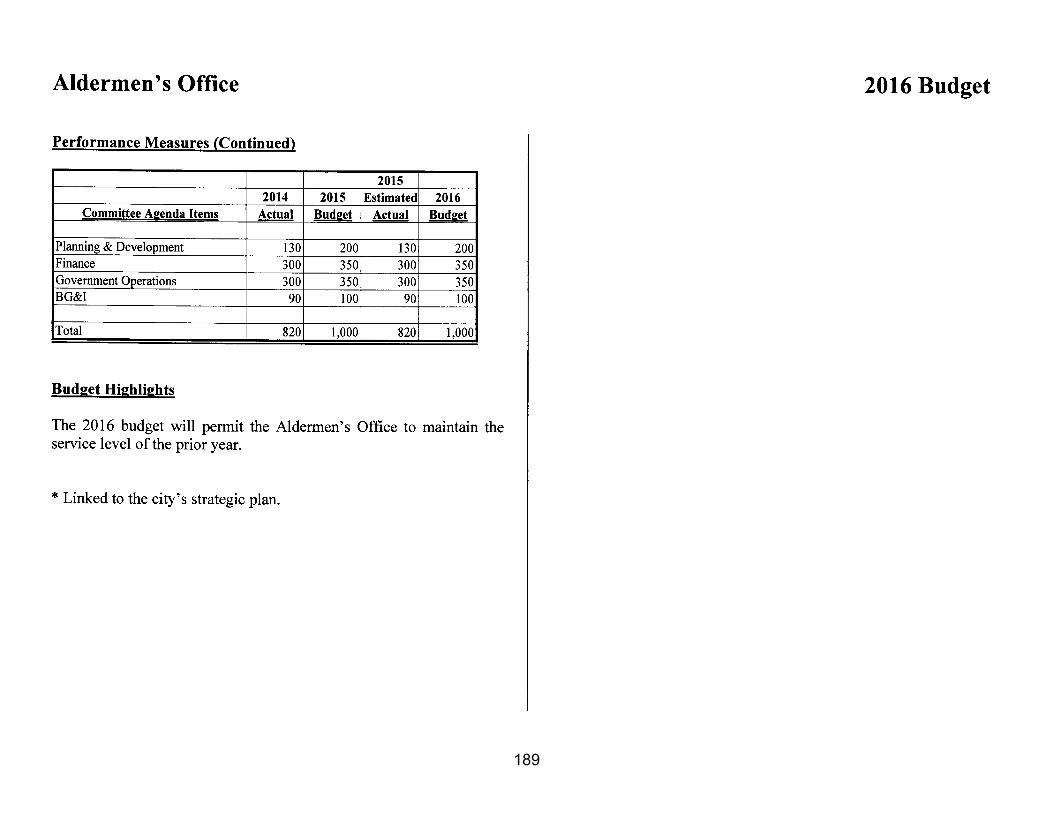
189
190
191

192
193

194

195

196

197

198
199
200
201

202

203

204

205
206
207
208

209
210

211
212

213

214

215

216
217

218
219

220
221

222

223
224

225

226
227

228

229
230

231
232
233
234
235

236

237
238

239

240
241

242
243

244

245

246

247

248
249
250
251

252
253

254
255
256
257

258
259
260

261
262

263
264
265

266

267
268

269

270

271
272

273

274
275

276

277

278

279

280
281

282

283
284
285

286

287

288
289
290
291
292
293
294

295

296
297
298

299

300

301
302

303

304

305

306

307

308

309

310
311

312
313

314

315
316

317

318

319

320

321

322
323

324

325
326
327
328

329

330
331

332
333

334
335
336

337

338
339

340

341

342

343

344

345
346

347
348

349
350

351
352

353

354
355

356
357

358
359
360

361

362

363
364

365
366
367
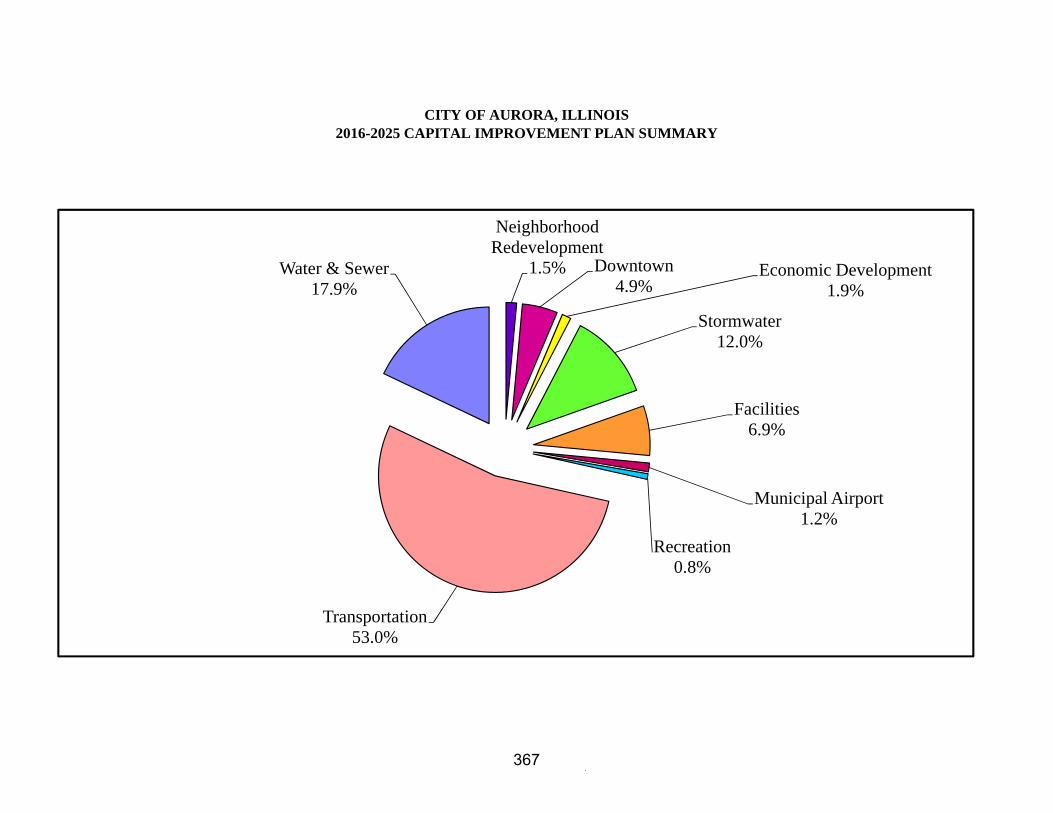
CITY OF AURORA, ILLINOIS2016-2025 CAPITAL IMPROVEMENT PLAN SUMMARY
NeighborhoodRedevelopment
1.5% Downtown4.9%
Economic Development1.9%
Stormwater12.0%
Facilities6.9%
Municipal Airport1.2%
Recreation0.8%
Transportation53.0%
Water & Sewer17.9%

368

369
370

371

372
373

374

375

376
377
378
379
380

381
382

383
384

385

386
387

388

389
390

391

392
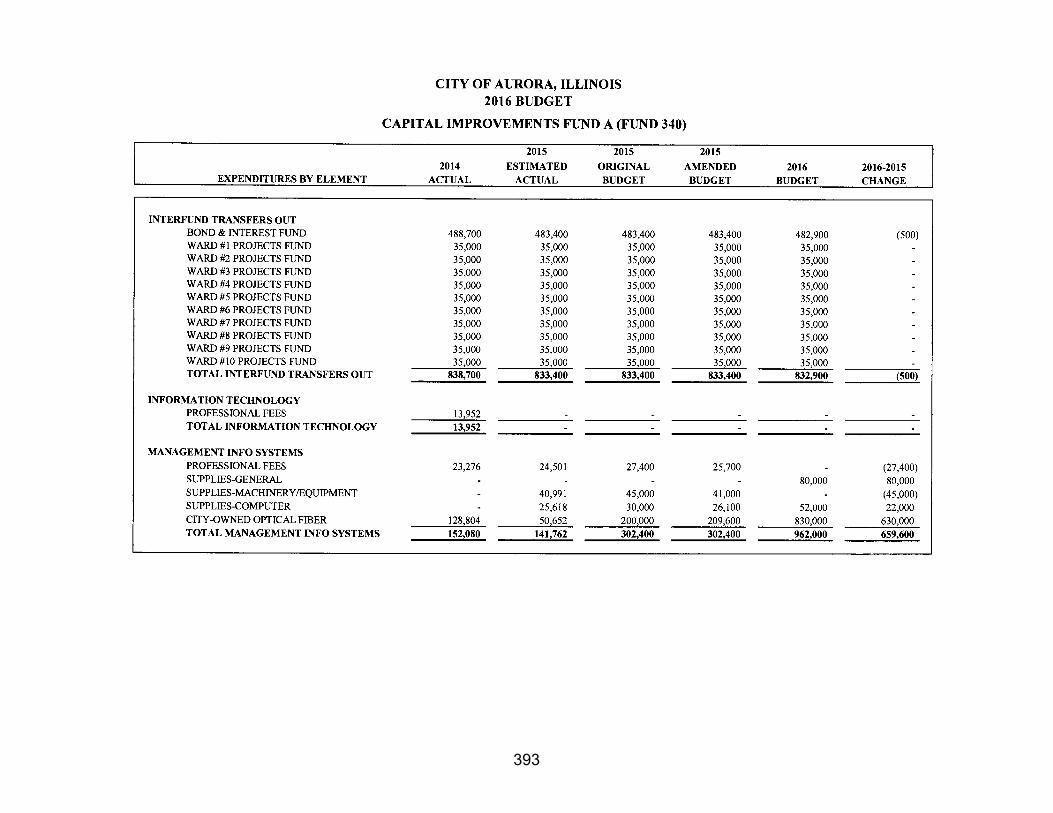
393
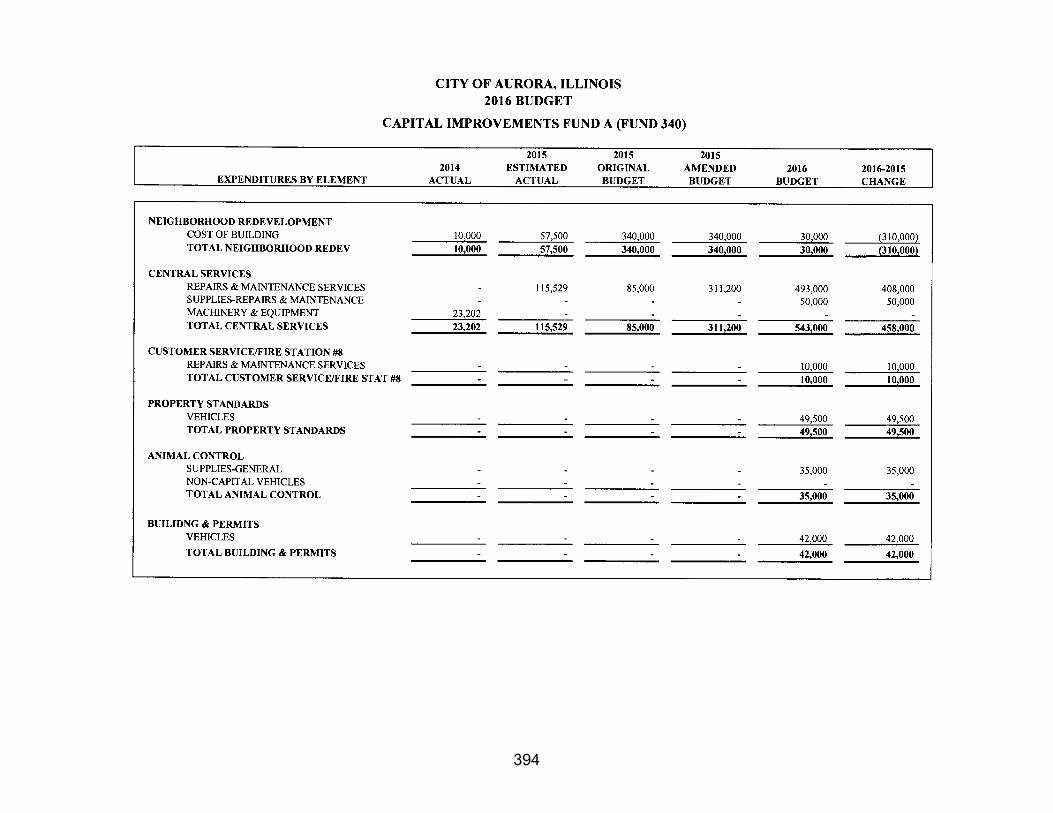
394

395

396

397

398

399
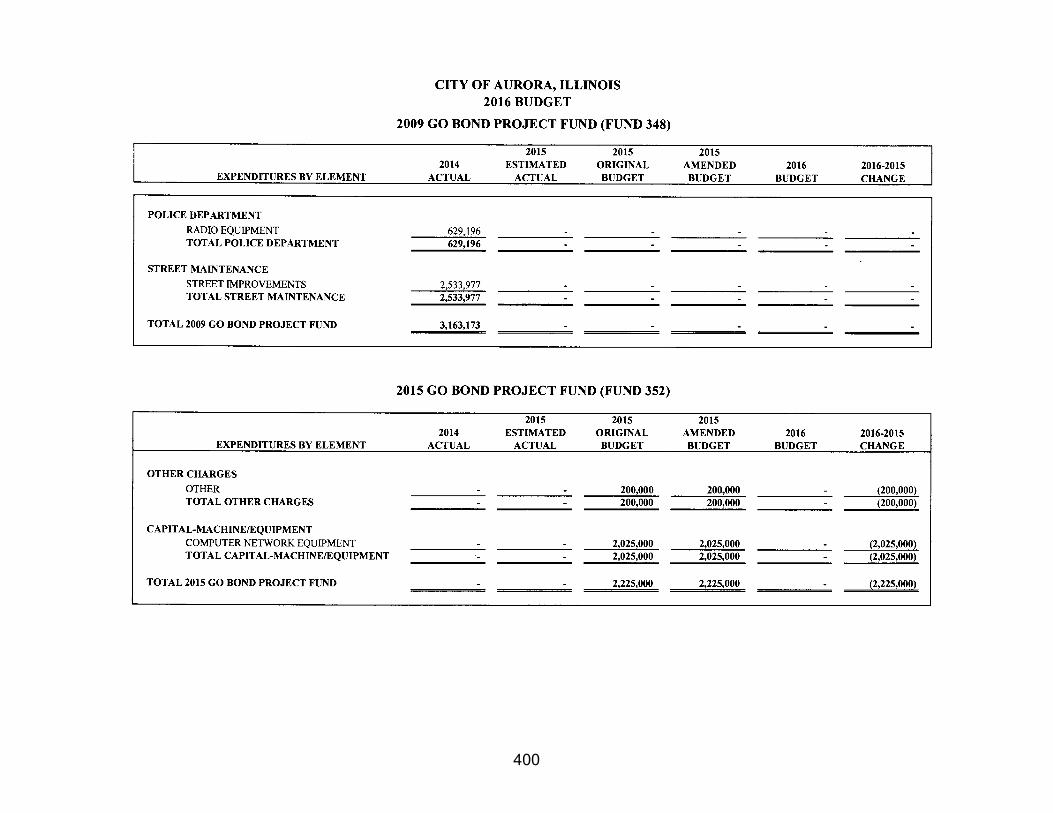
400

401
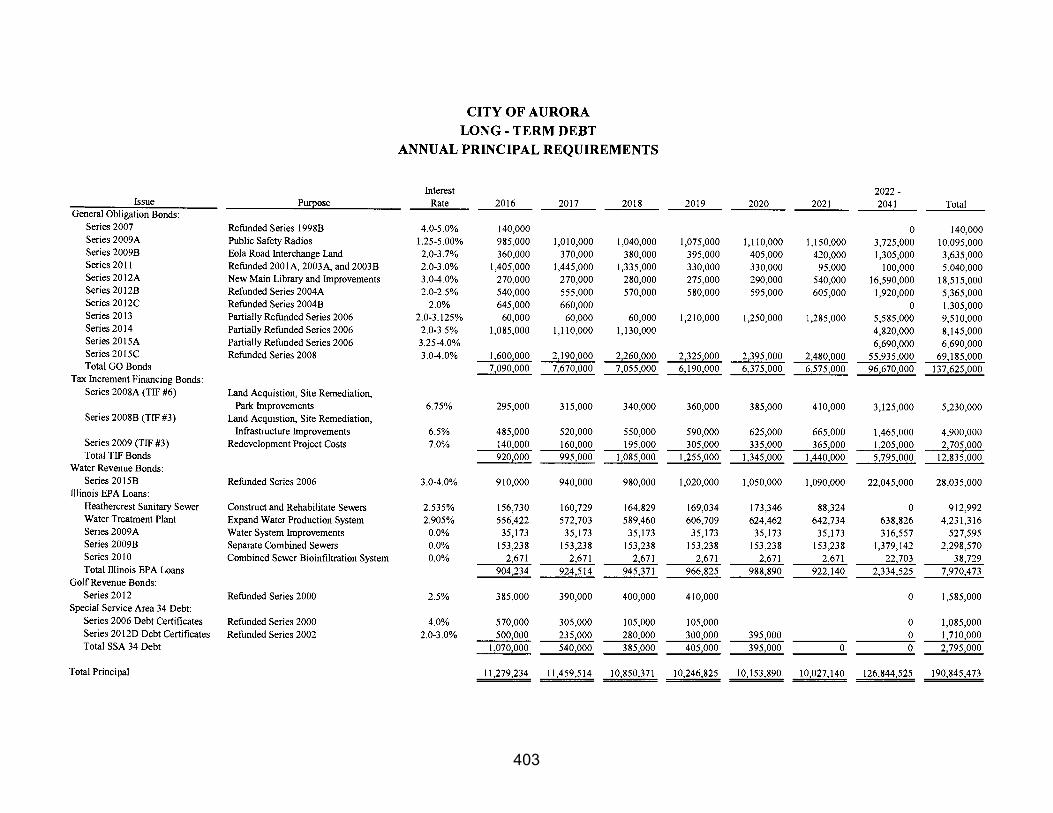
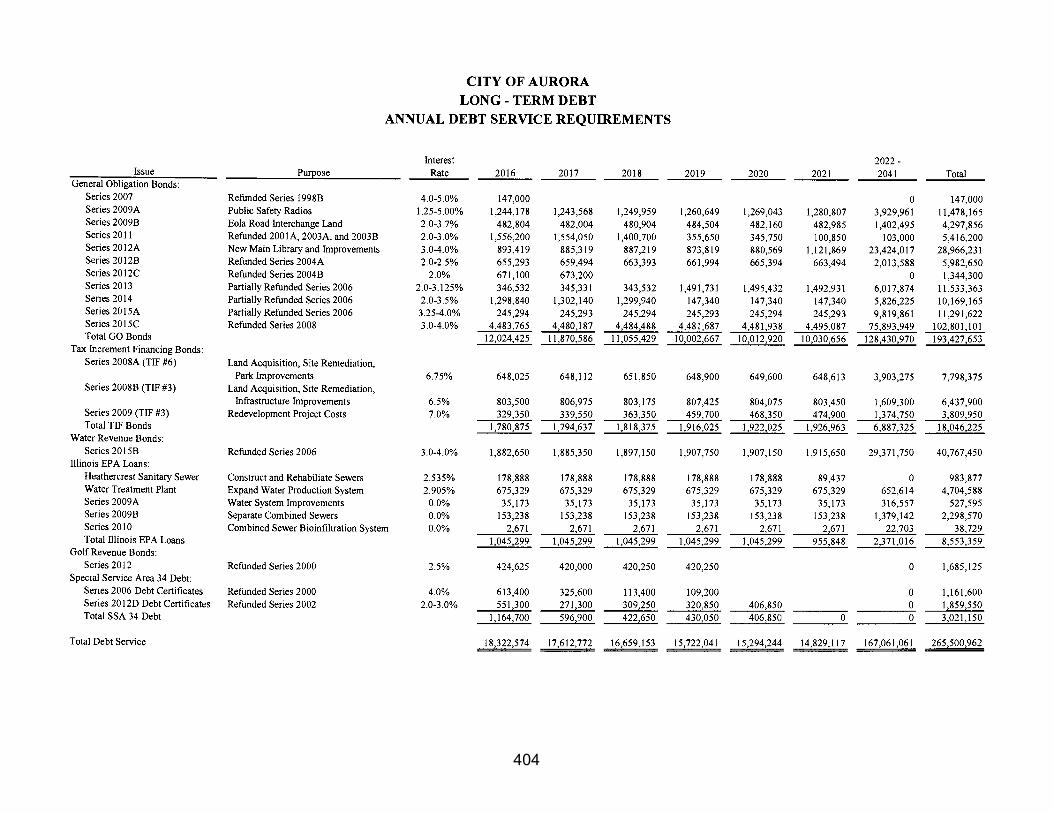
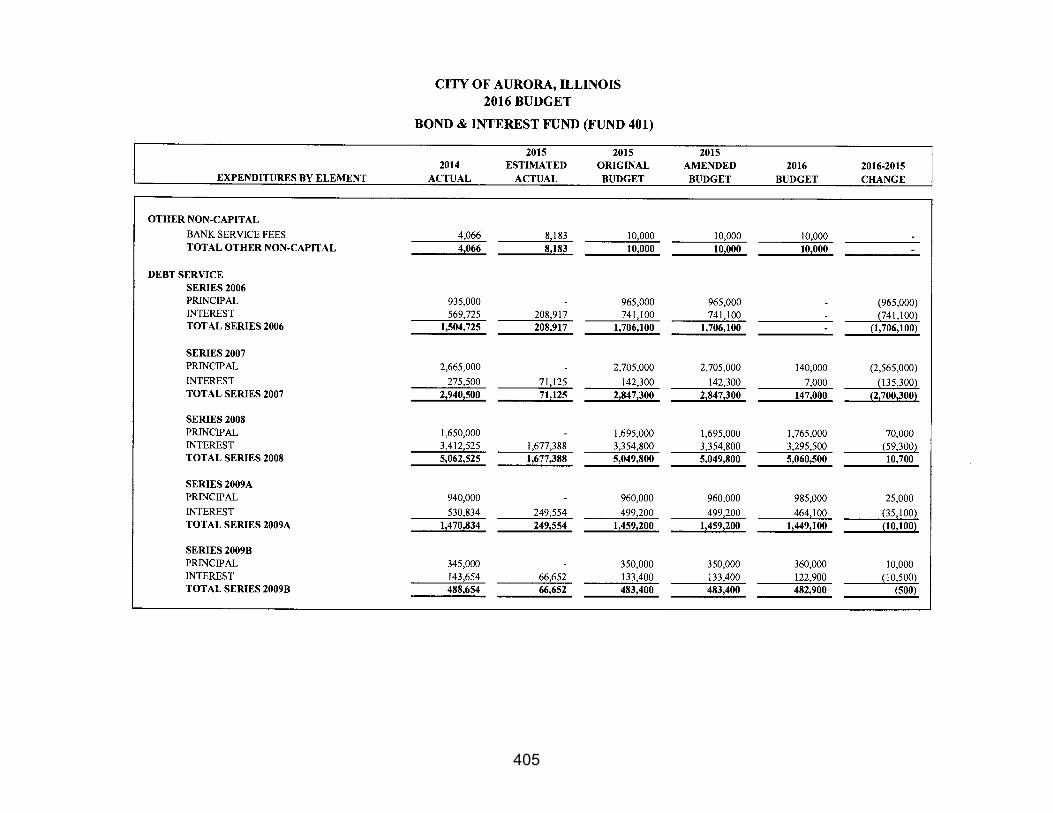
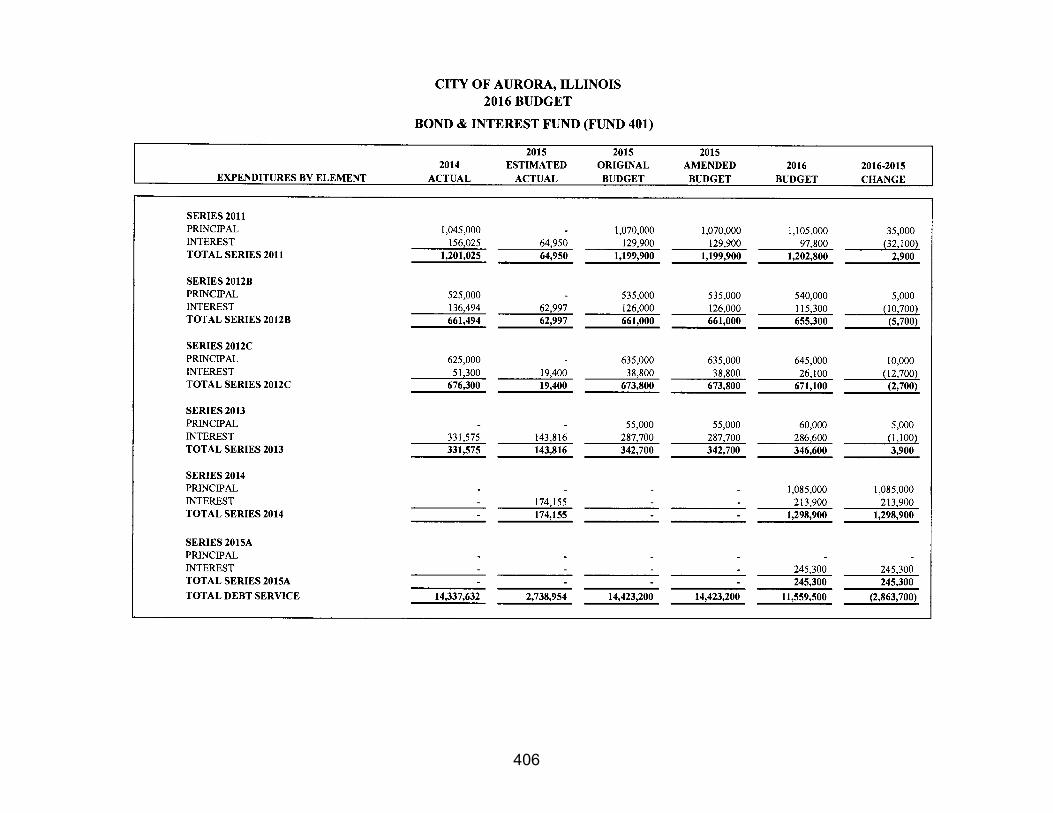
CITY OF AURORA, ILLINOIS 2016 BUDGET
LONG – TERM DEBT
The City of Aurora is a home-rule municipality under the Illinois Constitution of 1970. The Illinois General Assembly has set no debt limits for home-rule municipalities. Furthermore, the city may issue debt without referendum approval.
As a matter of policy, the city does not issue bonds with maturities greater than the useful lives of the capital assets financed through the bond proceeds. In addition, when the issuance of debt is necessary for capital projects related to the operation of enterprise funds, the city seeks to issue revenue bonds (not general obligation bonds) to finance those projects.
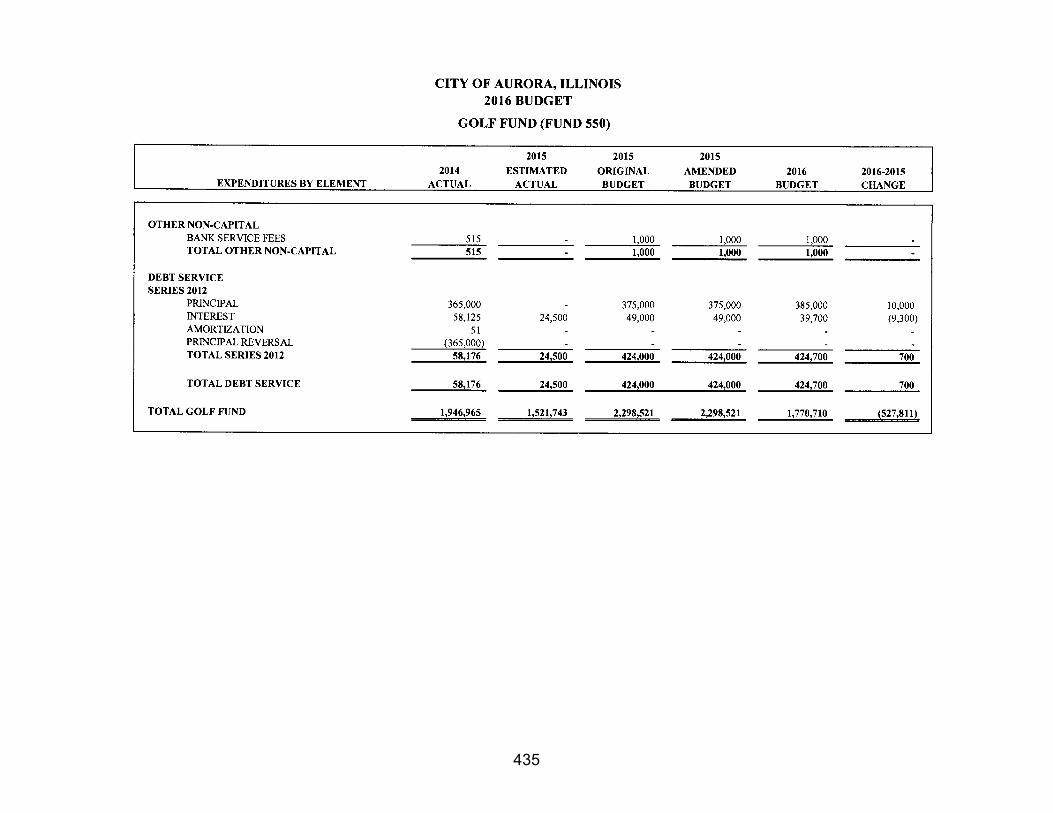
The city accounts for debt service payments related to general obligation bonds in the Bond and Interest Fund (Fund 401) and the Library Bond and Interest Fund (Fund 410). The TIF District #3 and TIF District #6 Funds (Funds 233 and 236, respectively) are used to account for the debt service associated with tax increment revenue bonds. Debt service payments on water and sewer revenue bonds are accounted for in the Water and Sewer Fund (Fund 510) and payments on golf revenue bonds are accounted for in the Golf Operations Fund (Fund 550). Payments for loans from the Illinois Environmental Protection Agency are recorded in the Stormwater Management Fee Fund (Fund 280) and the Water and Sewer Fund. Principal and interest payments on debt certificates issued to build elementary schools in Special Service Area (SSA) #34 are accounted for in the SSA #34 Fund (Fund 275). SSA property taxes are being used to satisfy the debt certificate debt service.
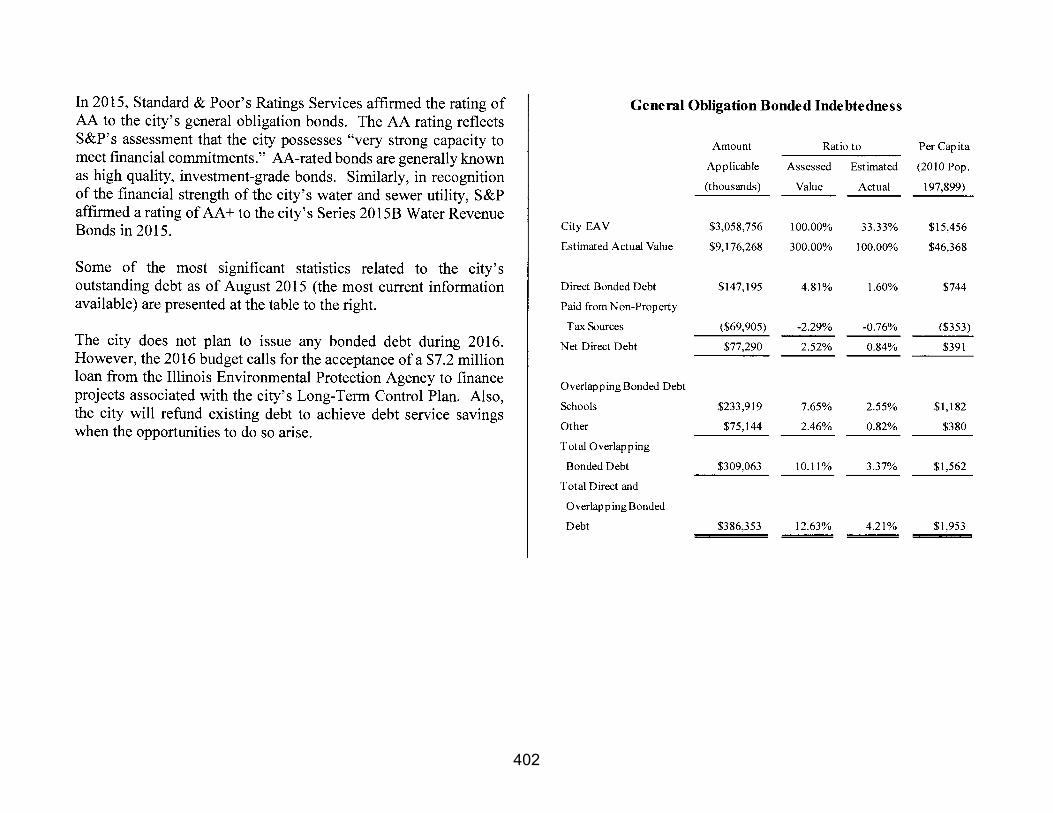
The city has abated a portion of the 2015 property tax levy for general obligation debt service (payable in 2016). That abatement will amount to approximately $7.0 million. Historically, the city has abated a large portion of its property tax levy for debt service. This abatement has been possible primarily by the dedication of gaming tax and real estate transfer tax revenues to the payment of debt service. The graph below illustrates the rapidity with which the City of Aurora is paying its outstanding general obligation debt.
The total general obligation debt of $137.6 million at the beginning of 2016 will be reduced to $96.7 million by the end of 2021. The principal payment is approximately $7.1 million for 2016.
$0
$25
$50
$75
$100
$125
$150
$175
$200
2016 2017 2018 2019 2020 2021
Mill
ions
General Obligation Debt - Principal Amount Outstanding
402
403
404
405
406

407

408

409
410

411

412

413

414

415

416

417

418

419
420
421
422
423

424

425
426
427

428
429
430
431
432

433

434
435
436

437

438

439

440

441

442
443
444

445

446

447

448

449
450

451

452
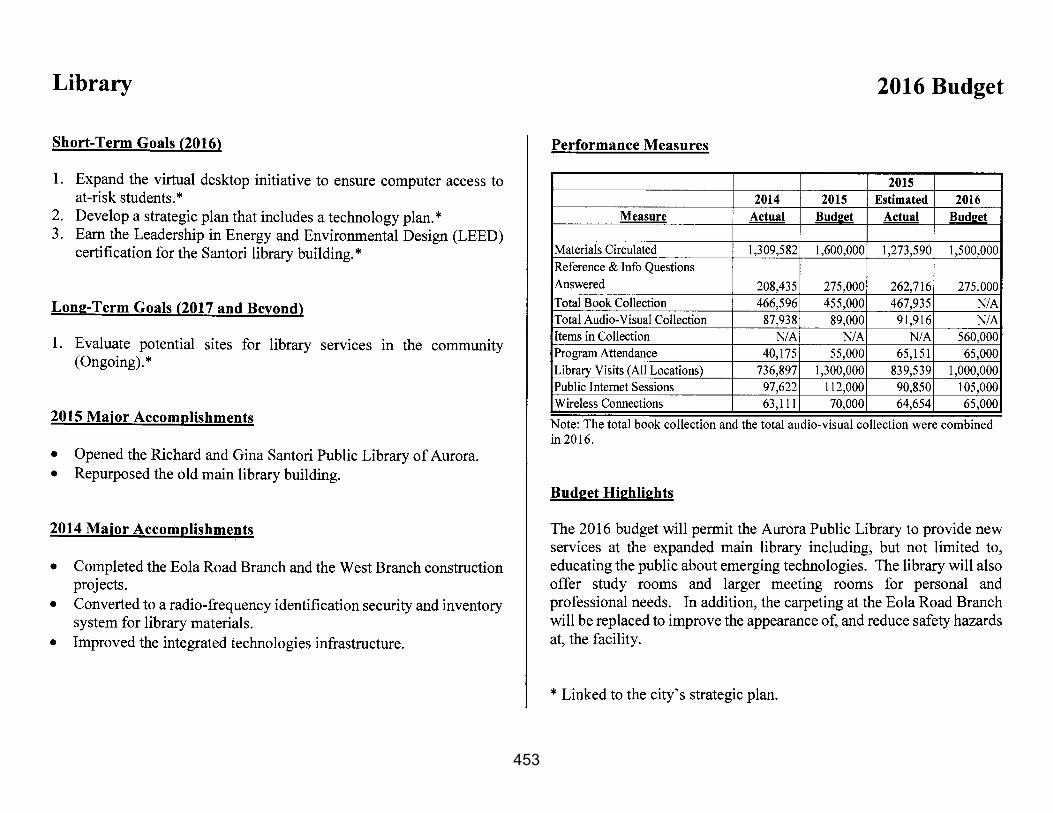
453

454

455

456

457

458

459
460
461

462
463

464

465

466

467

468


