105
CITY OF BELLEVUE ENVIRONMENTAL STEWARDSHIP INITIATIVE STRATEGIC PLAN 2013-2018

CITY OF BELLEVUEENVIRONMENTAL STEWARDSHIP INITIATIVE
STRATEGIC PLAN
2013-2018

CITY OF BELLEVUE ENVIRONMENTAL STEWARDSHIP INITIATIVE STRATEGIC PLAN 2013-2018
Contents
4 Introduction
6 Leadership Endorsement
7 Acknowledgements
10 Report Overview
11 Key Performance Indicators
12 Greenhouse Gas Emissions
20 Mobility & Land Use
34 Energy & Water
48 Materials Management & Waste
58 Ecosystems & Open Spaces
71 Endnotes
76 Appendices
A-1 AppendixA:ProjectPortfolio
Note: Supplemental Document: Greenhouse Gas Emissions Inventory, 2011 Available online at www.bellevuewa.gov/environmental.htm

ENVIRONMENTAL STEWARDSHIP INITIATIVE 2013-2018 4
INTRODUCTION
ENVIRONMENTAL STEWARDSHIP INITIATIVE 2013-2018 5
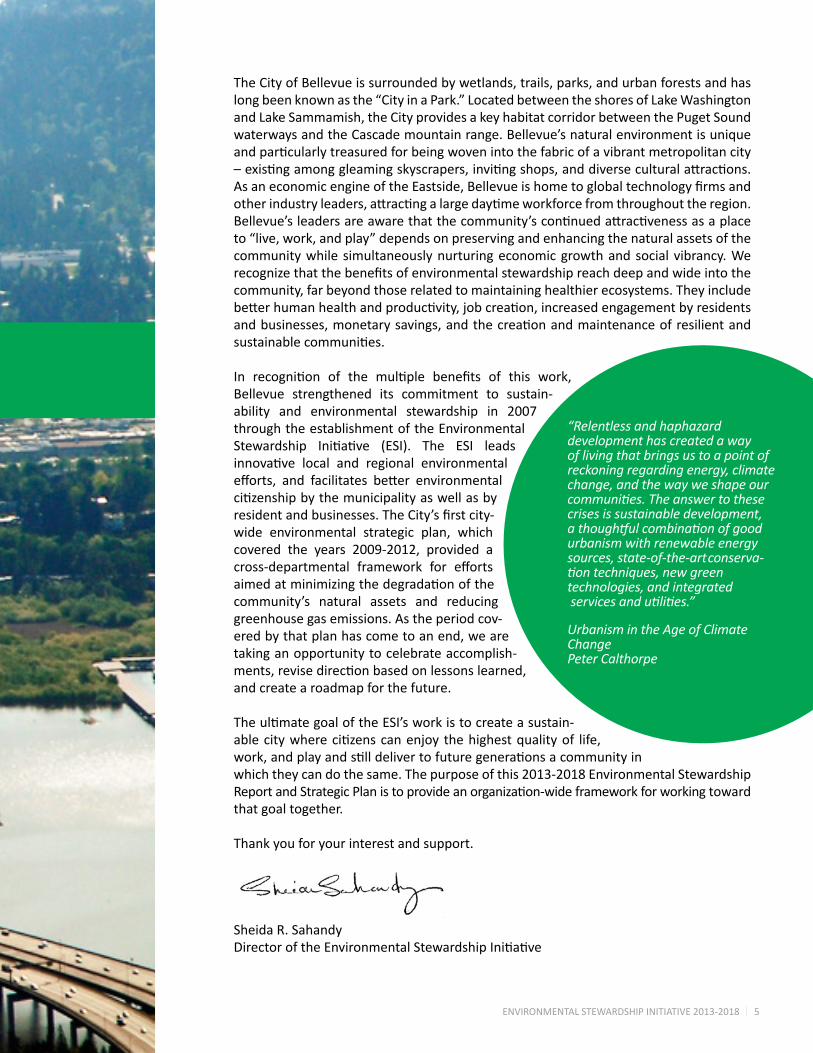
The City of Bellevue is surrounded by wetlands, trails, parks, and urban forests and has long been known as the “City in a Park.” Located between the shores of Lake Washington and Lake Sammamish, the City provides a key habitat corridor between the Puget Sound waterways and the Cascade mountain range. Bellevue’s natural environment is unique andparticularlytreasuredforbeingwovenintothefabricofavibrantmetropolitancity–existingamonggleamingskyscrapers,invitingshops,anddiverseculturalattractions.AsaneconomicengineoftheEastside,Bellevueishometoglobaltechnologyfirmsandotherindustryleaders,attractingalargedaytimeworkforcefromthroughouttheregion.Bellevue’sleadersareawarethatthecommunity’scontinuedattractivenessasaplaceto “live, work, and play” depends on preserving and enhancing the natural assets of the community while simultaneously nurturing economic growth and social vibrancy. We recognizethatthebenefitsofenvironmentalstewardshipreachdeepandwideintothecommunity, far beyond those related to maintaining healthier ecosystems. They include betterhumanhealthandproductivity,jobcreation,increasedengagementbyresidentsandbusinesses,monetarysavings,andthecreationandmaintenanceofresilientandsustainablecommunities.
In recognition of the multiple benefits of this work,Bellevue strengthened its commitment to sustain-ability and environmental stewardship in 2007 through the establishment of the Environmental Stewardship Initiative (ESI). The ESI leadsinnovative local and regional environmentalefforts, and facilitates better environmentalcitizenshipbythemunicipalityaswellasbyresidentandbusinesses.TheCity’sfirstcity-wide environmental strategic plan, which covered the years 2009-2012, provided a cross-departmental framework for effortsaimedatminimizingthedegradationofthecommunity’s natural assets and reducing greenhouse gas emissions. As the period cov-ered by that plan has come to an end, we are taking an opportunity to celebrate accomplish-ments,revisedirectionbasedonlessonslearned,and create a roadmap for the future.
TheultimategoaloftheESI’sworkistocreateasustain-ablecitywherecitizenscanenjoy thehighestqualityof life,work,andplayandstilldelivertofuturegenerationsacommunityinwhich they can do the same. The purpose of this 2013-2018 Environmental Stewardship ReportandStrategicPlanistoprovideanorganization-wideframeworkforworkingtowardthat goal together.
Thank you for your interest and support.
Sheida R. SahandyDirectoroftheEnvironmentalStewardshipInitiative
“Relentless and haphazard development has created a way of living that brings us to a point of reckoning regarding energy, climate change, and the way we shape our communities. The answer to these crises is sustainable development, a thoughtful combination of good urbanism with renewable energy sources, state-of-the-art conserva-tion techniques, new green technologies, and integrated services and utilities.”
Urbanism in the Age of Climate Change Peter Calthorpe
ENVIRONMENTAL STEWARDSHIP INITIATIVE 2013-2018 6
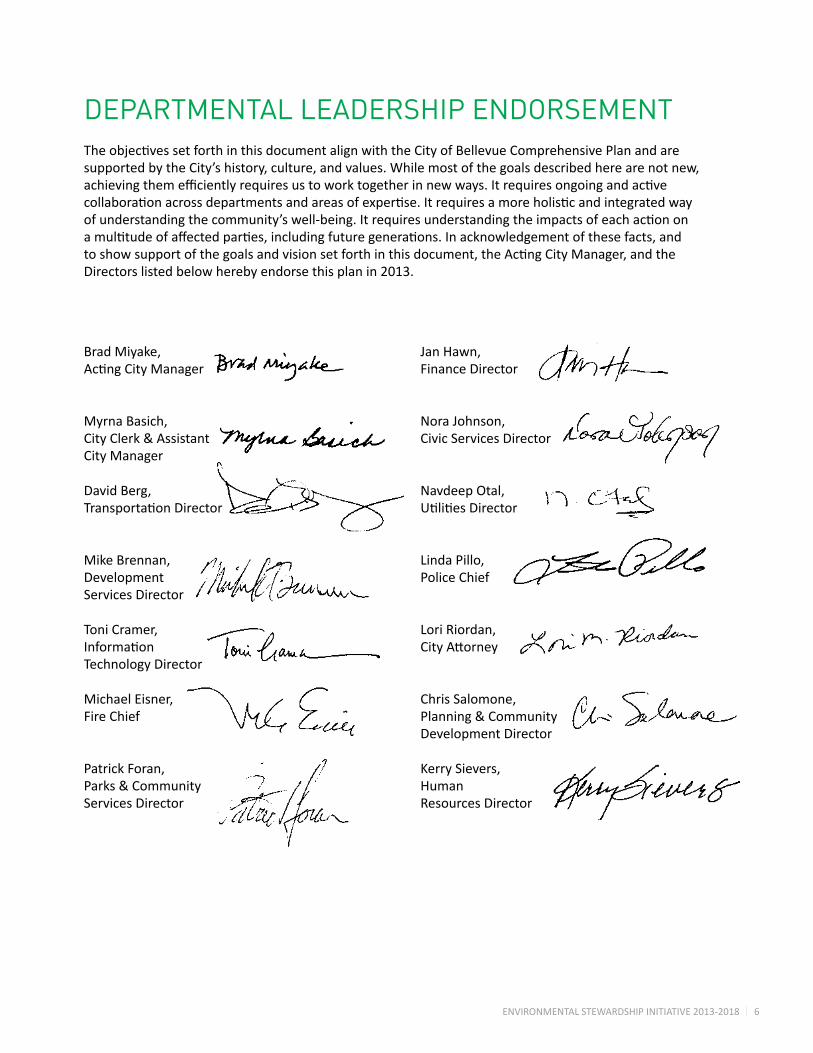
DEPARTMENTAL LEADERSHIP ENDORSEMENTTheobjectivessetforthinthisdocumentalignwiththeCityofBellevueComprehensivePlanandaresupported by the City’s history, culture, and values. While most of the goals described here are not new, achievingthemefficientlyrequiresustoworktogetherinnewways.Itrequiresongoingandactivecollaborationacrossdepartmentsandareasofexpertise.Itrequiresamoreholisticandintegratedwayofunderstandingthecommunity’swell-being.Itrequiresunderstandingtheimpactsofeachactiononamultitudeofaffectedparties,includingfuturegenerations.Inacknowledgementofthesefacts,andtoshowsupportofthegoalsandvisionsetforthinthisdocument,theActingCityManager,andtheDirectors listed below hereby endorse this plan in 2013.
Brad Miyake,ActingCityManager
Jan Hawn, Finance Director
Myrna Basich, City Clerk & Assistant City Manager
Nora Johnson, Civic Services Director
David Berg,TransportationDirector
Navdeep Otal, UtilitiesDirector
Mike Brennan,Development Services Director
Linda Pillo,Police Chief
Toni Cramer,Information Technology Director
Lori Riordan,CityAttorney
Michael Eisner,Fire Chief
Chris Salomone,Planning & Community Development Director
Patrick Foran,Parks & Community Services Director
Kerry Sievers,Human Resources Director
ENVIRONMENTAL STEWARDSHIP INITIATIVE 2013-2018 7
ACKNOWLEDGEMENTSTheobjectives,strategies,andindicatorspresentedinthisreportweredevelopedthroughcollaborationwithrepresentativesofkeyCitydepartments.Stakeholdermeetingswereheldforeachcategory,providingforumsfordiscussionofpastandcurrentprojects,newopportunities,barriers,andprioritiesforfutureaction.
AfteradraftoftheESIPlanwasdeveloped,additionalwrittenandverbalfeedbackwascollectedfromtheLeadershipTeamandstafftopicleadstofurtherrefineandrevisetheESIStrategicPlan.Ourspecialthanksgoto the following people, who have contributed ideas, insight, data, or edits to this document.
City of Bellevue
Paul Andersson*
Rick Bailey
Teresa Becker
Heidi Bedwell
Elaine Borjeson
GeoffBradley
Melissa Brown
Patricia Burgess
Debbie Childers
Judy Clark
Laurie Devereaux
Dan DeWald
Stephanie Dompier
Susan Fife-Ferris
Lionel Forde
Karen Gonzalez
Jennifer Goodhart
Pat Harris
Ernie Henrie
Bill Heubach
Paul Inghram
Mike Ingram
Claude Iosso
KatieJensen
Emma Johnson*
Kate Johnson
Andrew Kidde
Emil King
Tom Kuykendall
Kevin LeClair
Franz Loewenherz
Pam Maloney
Kevin McDonald
Tracy McMahan
Shelley McVein
Earl Meldahl
Stela Nikolova
Julie Orta
Camron Parker
Kit Paulsen
Michael Paine
Dave Perry
Shari Phillips
Chelo Picardal
Frank Pinney
Mark Poch
Bobbi Pochman
Sean Pownall
David Pyle
Randy Ransom
Liz Rector
Julie Reznick
Jamie Robinson
Gregg Schrader
Todd Shepler
Tom Spille
Liz Stead
Dan Stroh
Kam Szabo
Ian Toms
Brian Ward
Sean Wellander
Mike Whiteaker
BrettWilson
Others SarahBergmann,CascadiaConsulting
ShannonDonnegan,CascadiaConsulting*
Jessica Geenan, PSE
McKennaMorrigan,CascadiaConsulting*
Kris Overby, PSRC
MichaelSteinhoff,ICLEI
Primary Authors*
ENVIRONMENTAL STEWARDSHIP INITIATIVE 2013-2018 8
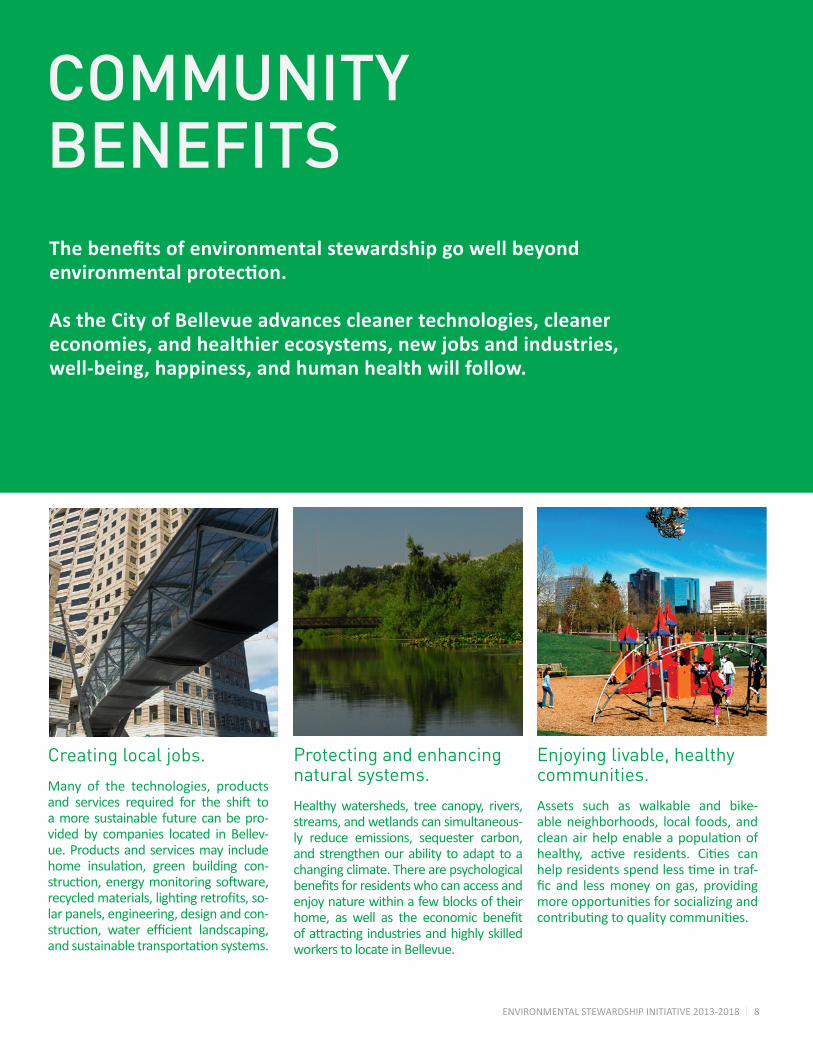
Creating local jobs.
Many of the technologies, products and services required for the shift toa more sustainable future can be pro-vided by companies located in Bellev-ue. Products and services may include home insulation, green building con-struction,energymonitoringsoftware,recycledmaterials,lightingretrofits,so-lar panels, engineering, design and con-struction, water efficient landscaping,andsustainabletransportationsystems.
Protecting and enhancing natural systems.
Healthy watersheds, tree canopy, rivers, streams, and wetlands can simultaneous-ly reduce emissions, sequester carbon, and strengthen our ability to adapt to a changing climate. There are psychological benefitsforresidentswhocanaccessandenjoy nature within a few blocks of their home, as well as the economic benefitofattractingindustriesandhighlyskilledworkers to locate in Bellevue.
Enjoying livable, healthy communities.
Assets such as walkable and bike-able neighborhoods, local foods, and cleanairhelpenableapopulationofhealthy, active residents. Cities canhelpresidentsspendlesstimeintraf-fic and lessmoney on gas, providingmoreopportunitiesforsocializingandcontributingtoqualitycommunities.
The benefits of environmental stewardship go well beyond environmental protection.
As the City of Bellevue advances cleaner technologies, cleaner economies, and healthier ecosystems, new jobs and industries, well-being, happiness, and human health will follow.
COMMUNITYBENEFITS
ENVIRONMENTAL STEWARDSHIP INITIATIVE 2013-2018 9
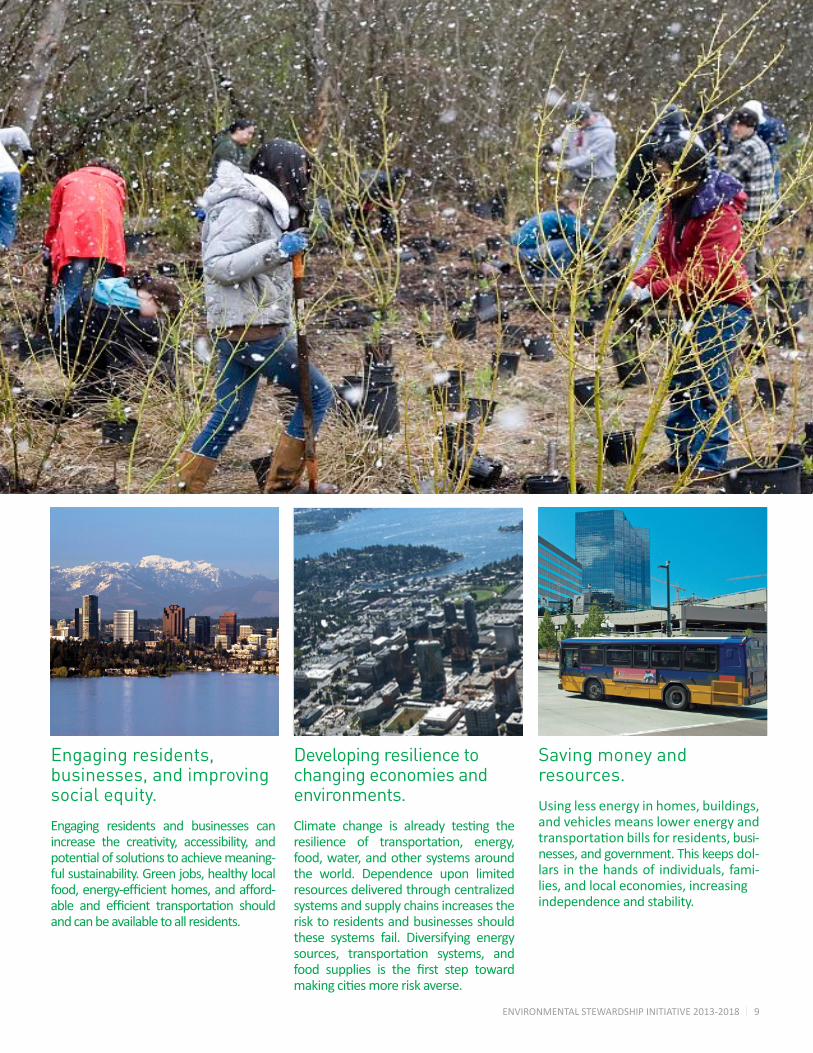
Saving money and resources. Using less energy in homes, buildings, and vehicles means lower energy and transportationbillsforresidents,busi-nesses, and government. This keeps dol-lars in the hands of individuals, fami-lies, and local economies, increasing independence and stability.
Developing resilience to changing economies and environments. Climate change is already testing theresilience of transportation, energy,food, water, and other systems around the world. Dependence upon limited resources delivered through centralized systems and supply chains increases the risk to residents and businesses should these systems fail. Diversifying energy sources, transportation systems, andfood supplies is the first step towardmakingcitiesmoreriskaverse.
Engaging residents, businesses, and improving social equity.
Engaging residents and businesses can increase the creativity, accessibility, andpotentialofsolutionstoachievemeaning-ful sustainability. Green jobs, healthy local food,energy-efficienthomes,andafford-able and efficient transportation shouldand can be available to all residents.
ENVIRONMENTAL STEWARDSHIP INITIATIVE 2013-2018 10
REPORT OVERVIEWPast, Present, and FutureThe 2013-2018 ESI Strategic Plan highlights some of the City’s notable sustainability achievements from 2009 to2012.AcomprehensivelistingofpastandongoingprojectsisavailableinAppendixA:ProjectPortfolio.
TheimpactsofESIeffortshavebeenmeasuredbycollectingandanalyzingkeyperformanceindicators(KPIs).KPIsprovidetheinformationneededtounderstandtheeffectivenessofourefforts,toseethehealthofourenvironmentatthetimeofmeasurementand,justasimportant,todiscerntrendsovertime.KPIsarethe“reportcard”thatgradesouraccomplishments,clarifiesourpresentsituation,andinformsourdecisionsforfutureaction.
TheESIobjectivesforthe2013-2018periodarethefocusofthisreport.Theoverridingstrategyforthisnextperiodistoleverageandbuilduponthefoundationslaidinthefirstplanbyimplementingprojectsatalargerscale, expanding upon successful pilot projects, and broadening engagement by residents and businesses throughoutthecommunity.ESIwillalsocontinuethestrategyofservingasaleaderandconvenerofregionaleffortsthatallowallEastsidecitiestoachievebetteroutcomesthantheycouldachievealone.
Organizational Structure of the ReportThisreportisorganizedintofivecategories.Thecategoriesareusedasanorganizingdevice,withtheacknowl-edgmentthatsomeofthestrategiesandactionscouldconceivablyfallinmultiplecategories.Eachcategoryincludesaprimarygoal,broadstrategies,andalistofdetailedactionsthatareintendedtoachievethestatedgoal.Totheextentpossible,thegoalsandactionsarealignedwiththeCity’sComprehensivePlanandotherregional,state,orfederalframeworks.Keycriteriausedindevelopingtheactionsincludedimpact,feasibility,andtimeframe.ProgresstowardgoalsismeasuredandverifiedwithKPIs(seechartonnextpage).
The categories are:
Greenhouse Gas Emissions
Mobility & Land Use
Energy & Water
Materials Management & Waste
Ecosystems & Open Spaces
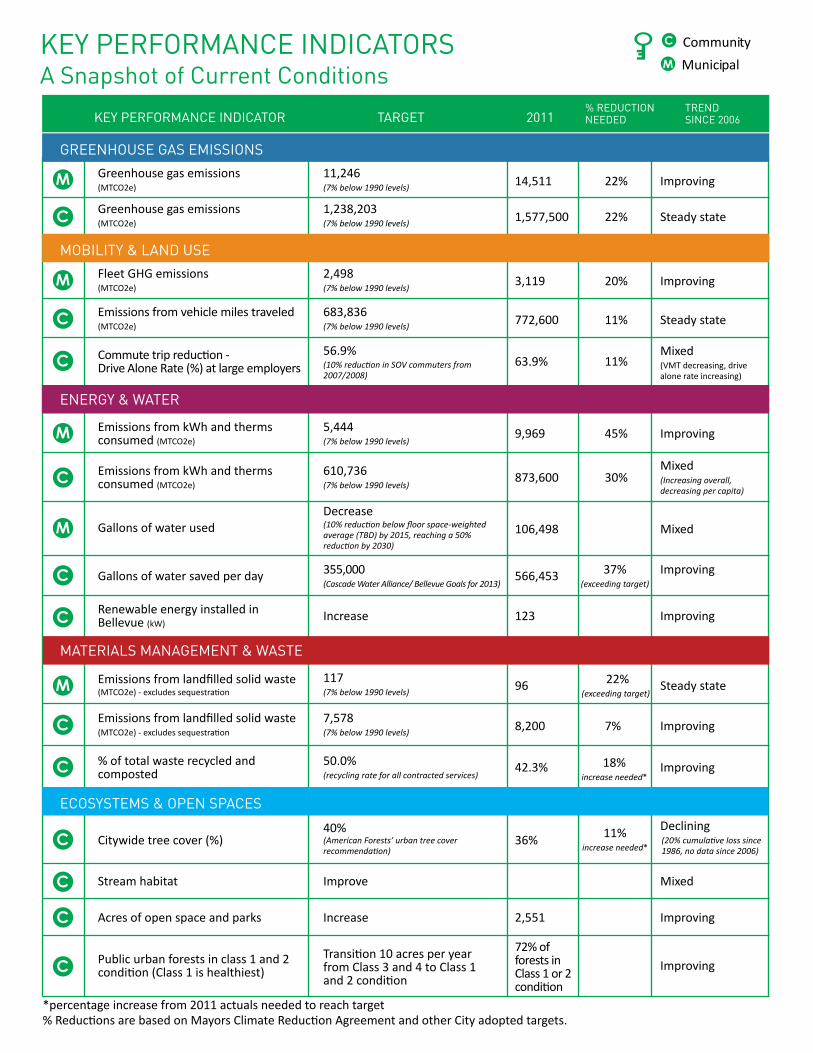
KEY PERFORMANCE INDICATORS A Snapshot of Current Conditions
M
C Community
Municipal
KEY PERFORMANCE INDICATOR TARGET 2011 TREND SINCE 2006
Greenhouse gas emissions(MTCO2e)
Greenhouse gas emissions (MTCO2e)
Fleet GHG emissions(MTCO2e)
Emissions from vehicle miles traveled(MTCO2e)
Commutetripreduction-DriveAloneRate(%)atlargeemployers
Emissions from kWh and therms consumed (MTCO2e)
Emissions from kWh and therms consumed (MTCO2e)
Gallons of water used
Gallons of water saved per day
Renewable energy installed in Bellevue (kW)
Emissionsfromlandfilledsolidwaste(MTCO2e)-excludessequestration
Emissionsfromlandfilledsolidwaste(MTCO2e)-excludessequestration
%oftotalwasterecycledandcomposted
Citywidetreecover(%)
Stream habitat
Acres of open space and parks
Public urban forests in class 1 and 2 condition(Class1ishealthiest)
14,511
1,577,500
3,119
772,600
63.9%
9,969
873,600
106,498
566,453
123
96
8,200
42.3%
36%
2,551
72%offorests in Class 1 or 2 condition
GREENHOUSE GAS EMISSIONS
MOBILITY & LAND USE
ENERGY & WATER
MATERIALS MANAGEMENT & WASTE
ECOSYSTEMS & OPEN SPACES
22%
22%
20%
11%
11%
45%
30%
37%(exceeding target)
22%(exceeding target)
7%
18%increase needed*
11%increase needed*
M
M
M
M
M
C
C
C
C
C
C
C
C
C
C
C
C
11,246(7% below 1990 levels)
1,238,203(7% below 1990 levels)
2,498(7% below 1990 levels)
683,836(7% below 1990 levels)
56.9%(10% reduction in SOV commuters from 2007/2008)
5,444(7% below 1990 levels)
610,736(7% below 1990 levels)
Decrease(10% reduction below floor space-weighted average (TBD) by 2015, reaching a 50% reduction by 2030)
355,000(Cascade Water Alliance/ Bellevue Goals for 2013)
Increase
117 (7% below 1990 levels)
40%(American Forests’ urban tree cover recommendation)
Improve
Increase
Transition10acresperyearfrom Class 3 and 4 to Class 1 and2condition
7,578(7% below 1990 levels)
50.0%(recycling rate for all contracted services)
Improving
Steady state
Improving
Steady state
Mixed(VMTdecreasing,drivealonerateincreasing)
Improving
Mixed(Increasing overall, decreasing per capita)
Mixed
Improving
Improving
Steady state
Improving
Improving
Declining(20% cumulative loss since 1986, no data since 2006)
Mixed
Improving
Improving
% REDUCTION NEEDED
*percentage increase from 2011 actuals needed to reach target%ReductionsarebasedonMayorsClimateReductionAgreementandotherCityadoptedtargets.
ENVIRONMENTAL STEWARDSHIP INITIATIVE 2013-2018 12
GREENHOUSE GAS EMISSIONS
ENVIRONMENTAL STEWARDSHIP INITIATIVE 2013-2018 13
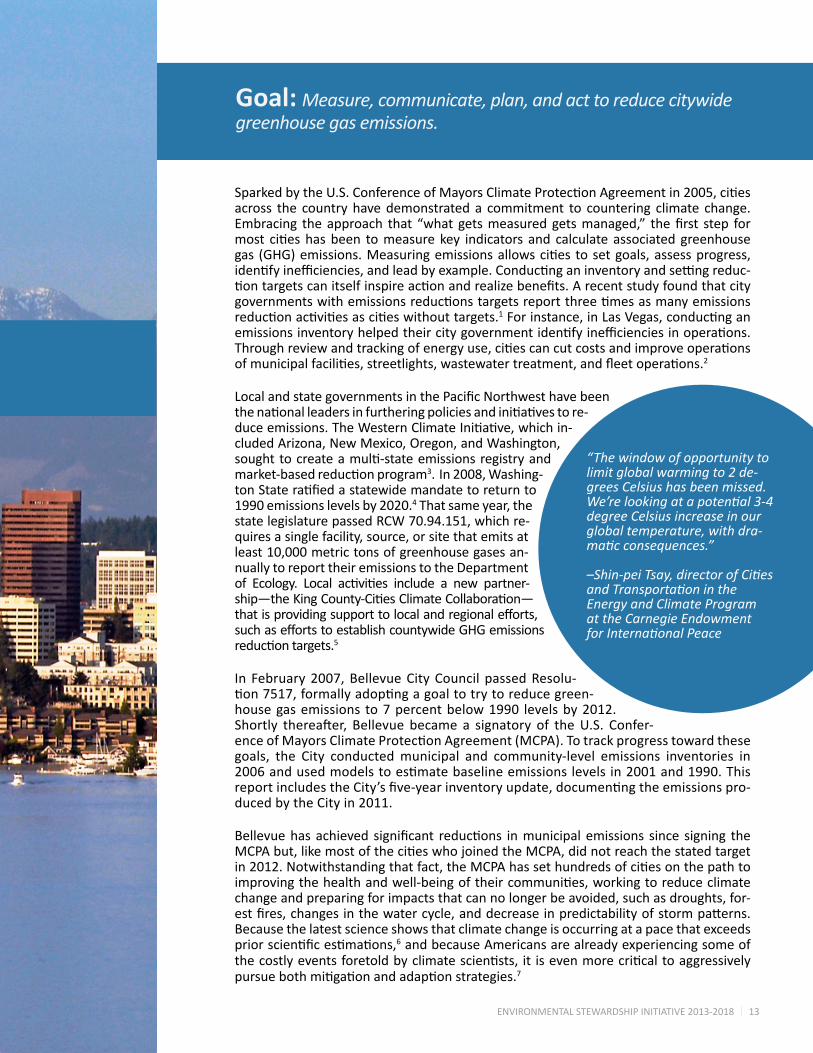
SparkedbytheU.S.ConferenceofMayorsClimateProtectionAgreementin2005,citiesacross the country have demonstrated a commitment to countering climate change. Embracing theapproach that “whatgetsmeasuredgetsmanaged,” thefirst step formost citieshasbeen tomeasure key indicators and calculateassociatedgreenhousegas (GHG)emissions.Measuringemissionsallowscities tosetgoals,assessprogress,identifyinefficiencies,andleadbyexample.Conductinganinventoryandsettingreduc-tiontargetscanitselfinspireactionandrealizebenefits.Arecentstudyfoundthatcitygovernmentswithemissionsreductionstargetsreportthreetimesasmanyemissionsreductionactivitiesascitieswithouttargets.1Forinstance,inLasVegas,conductinganemissionsinventoryhelpedtheircitygovernmentidentifyinefficienciesinoperations.Throughreviewandtrackingofenergyuse,citiescancutcostsandimproveoperationsofmunicipalfacilities,streetlights,wastewatertreatment,andfleetoperations.2
LocalandstategovernmentsinthePacificNorthwesthavebeenthenationalleadersinfurtheringpoliciesandinitiativestore-duceemissions.TheWesternClimateInitiative,whichin-cluded Arizona, New Mexico, Oregon, and Washington, soughttocreateamulti-stateemissionsregistryandmarket-basedreductionprogram3. In 2008, Washing-tonStateratifiedastatewidemandatetoreturnto1990 emissions levels by 2020.4 That same year, the state legislature passed RCW 70.94.151, which re-quires a single facility, source, or site that emits at least 10,000 metric tons of greenhouse gases an-nually to report their emissions to the Department of Ecology. Local activities include a new partner-ship—theKingCounty-CitiesClimateCollaboration—thatisprovidingsupporttolocalandregionalefforts,suchaseffortstoestablishcountywideGHGemissionsreductiontargets.5
In February 2007, Bellevue City Council passed Resolu-tion7517,formallyadoptingagoaltotrytoreducegreen-house gas emissions to 7 percent below 1990 levels by 2012. Shortly thereafter, Bellevue became a signatory of theU.S. Confer-enceofMayorsClimateProtectionAgreement(MCPA).Totrackprogresstowardthesegoals, the City conducted municipal and community-level emissions inventories in 2006andusedmodelstoestimatebaselineemissionslevelsin2001and1990.ThisreportincludestheCity’sfive-yearinventoryupdate,documentingtheemissionspro-duced by the City in 2011.
Bellevuehasachieved significant reductions inmunicipalemissions since signing theMCPAbut,likemostofthecitieswhojoinedtheMCPA,didnotreachthestatedtargetin2012.Notwithstandingthatfact,theMCPAhassethundredsofcitiesonthepathtoimprovingthehealthandwell-beingoftheircommunities,workingtoreduceclimatechange and preparing for impacts that can no longer be avoided, such as droughts, for-estfires,changesinthewatercycle,anddecreaseinpredictabilityofstormpatterns.Because the latest science shows that climate change is occurring at a pace that exceeds priorscientificestimations,6 and because Americans are already experiencing some of thecostlyeventsforetoldbyclimatescientists, it isevenmorecriticaltoaggressivelypursuebothmitigationandadaptionstrategies.7
Goal: Measure, communicate, plan, and act to reduce citywide greenhouse gas emissions.
“The window of opportunity to limit global warming to 2 de-grees Celsius has been missed. We’re looking at a potential 3-4 degree Celsius increase in our global temperature, with dra-matic consequences.”
–Shin-pei Tsay, director of Cities and Transportation in the Energy and Climate Program at the Carnegie Endowment for International Peace
ENVIRONMENTAL STEWARDSHIP INITIATIVE 2013-2018 14
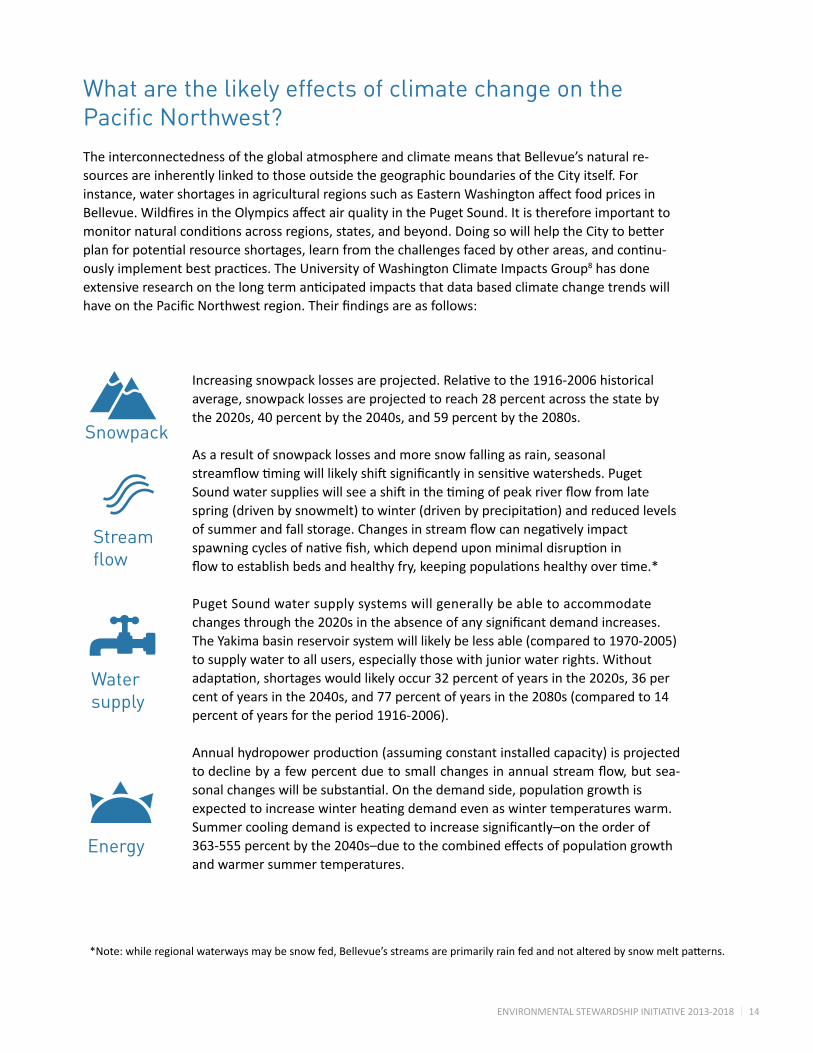
What are the likely effects of climate change on the Pacific Northwest?The interconnectedness of the global atmosphere and climate means that Bellevue’s natural re-sources are inherently linked to those outside the geographic boundaries of the City itself. For instance,watershortagesinagriculturalregionssuchasEasternWashingtonaffectfoodpricesinBellevue.WildfiresintheOlympicsaffectairqualityinthePugetSound.Itisthereforeimportanttomonitornaturalconditionsacrossregions,states,andbeyond.DoingsowillhelptheCitytobetterplanforpotentialresourceshortages,learnfromthechallengesfacedbyotherareas,andcontinu-ouslyimplementbestpractices.TheUniversityofWashingtonClimateImpactsGroup8 has done extensiveresearchonthelongtermanticipatedimpactsthatdatabasedclimatechangetrendswillhaveonthePacificNorthwestregion.Theirfindingsareasfollows:
Increasingsnowpacklossesareprojected.Relativetothe1916-2006historical average, snowpack losses are projected to reach 28 percent across the state by
the 2020s, 40 percent by the 2040s, and 59 percent by the 2080s.
As a result of snowpack losses and more snow falling as rain, seasonal streamflowtimingwilllikelyshiftsignificantlyinsensitivewatersheds.Puget
Soundwatersupplieswillseeashiftinthetimingofpeakriverflowfromlate spring(drivenbysnowmelt)towinter(drivenbyprecipitation)andreducedlevelsofsummerandfallstorage.Changesinstreamflowcannegativelyimpact
spawningcyclesofnativefish,whichdependuponminimaldisruptionin flowtoestablishbedsandhealthyfry,keepingpopulationshealthyovertime.*
Puget Sound water supply systems will generally be able to accommodate changesthroughthe2020sintheabsenceofanysignificantdemandincreases.
TheYakimabasinreservoirsystemwilllikelybelessable(comparedto1970-2005)to supply water to all users, especially those with junior water rights. Without
adaptation,shortageswouldlikelyoccur32percentofyearsinthe2020s,36percentofyearsinthe2040s,and77percentofyearsinthe2080s(comparedto14percentofyearsfortheperiod1916-2006).
Annualhydropowerproduction(assumingconstantinstalledcapacity)isprojectedtodeclinebyafewpercentduetosmallchangesinannualstreamflow,butsea-sonalchangeswillbesubstantial.Onthedemandside,populationgrowthis expectedtoincreasewinterheatingdemandevenaswintertemperatureswarm.Summercoolingdemandisexpectedtoincreasesignificantly–ontheorderof363-555percentbythe2040s–duetothecombinedeffectsofpopulationgrowthand warmer summer temperatures.
Snowpack
Stream flow
Water supply
Energy
*Note:whileregionalwaterwaysmaybesnowfed,Bellevue’sstreamsareprimarilyrainfedandnotalteredbysnowmeltpatterns.
ENVIRONMENTAL STEWARDSHIP INITIATIVE 2013-2018 15
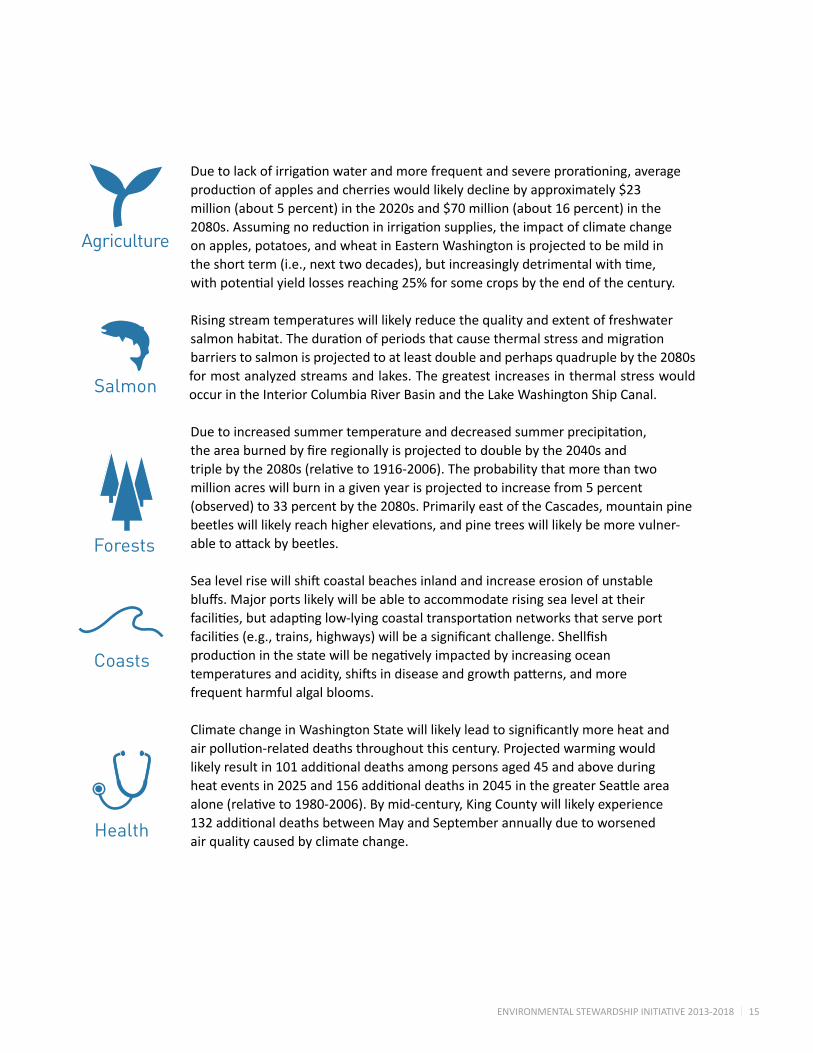
Duetolackofirrigationwaterandmorefrequentandsevereprorationing,average productionofapplesandcherrieswouldlikelydeclinebyapproximately$23 million(about5percent)inthe2020sand$70million(about16percent)inthe 2080s.Assumingnoreductioninirrigationsupplies,theimpactofclimatechange on apples, potatoes, and wheat in Eastern Washington is projected to be mild in theshortterm(i.e.,nexttwodecades),butincreasinglydetrimentalwithtime, withpotentialyieldlossesreaching25%forsomecropsbytheendofthecentury.
Rising stream temperatures will likely reduce the quality and extent of freshwater salmonhabitat.Thedurationofperiodsthatcausethermalstressandmigration barriers to salmon is projected to at least double and perhaps quadruple by the 2080s for most analyzed streams and lakes. The greatest increases in thermal stress would occur in the Interior Columbia River Basin and the Lake Washington Ship Canal.
Duetoincreasedsummertemperatureanddecreasedsummerprecipitation, theareaburnedbyfireregionallyisprojectedtodoublebythe2040sand triplebythe2080s(relativeto1916-2006).Theprobabilitythatmorethantwo million acres will burn in a given year is projected to increase from 5 percent (observed)to33percentbythe2080s.PrimarilyeastoftheCascades,mountainpine beetleswilllikelyreachhigherelevations,andpinetreeswilllikelybemorevulner- abletoattackbybeetles.
Sealevelrisewillshiftcoastalbeachesinlandandincreaseerosionofunstable bluffs.Majorportslikelywillbeabletoaccommodaterisingsealevelattheir facilities,butadaptinglow-lyingcoastaltransportationnetworksthatserveport facilities(e.g.,trains,highways)willbeasignificantchallenge.Shellfish productioninthestatewillbenegativelyimpactedbyincreasingocean temperaturesandacidity,shiftsindiseaseandgrowthpatterns,andmore frequent harmful algal blooms.
ClimatechangeinWashingtonStatewilllikelyleadtosignificantlymoreheatand airpollution-relateddeathsthroughoutthiscentury.Projectedwarmingwould likelyresultin101additionaldeathsamongpersonsaged45andaboveduring heateventsin2025and156additionaldeathsin2045inthegreaterSeattlearea alone(relativeto1980-2006).Bymid-century,KingCountywilllikelyexperience 132additionaldeathsbetweenMayandSeptemberannuallyduetoworsened air quality caused by climate change.
Agriculture
Salmon
Forests
Coasts
Health
ENVIRONMENTAL STEWARDSHIP INITIATIVE 2013-2018 16
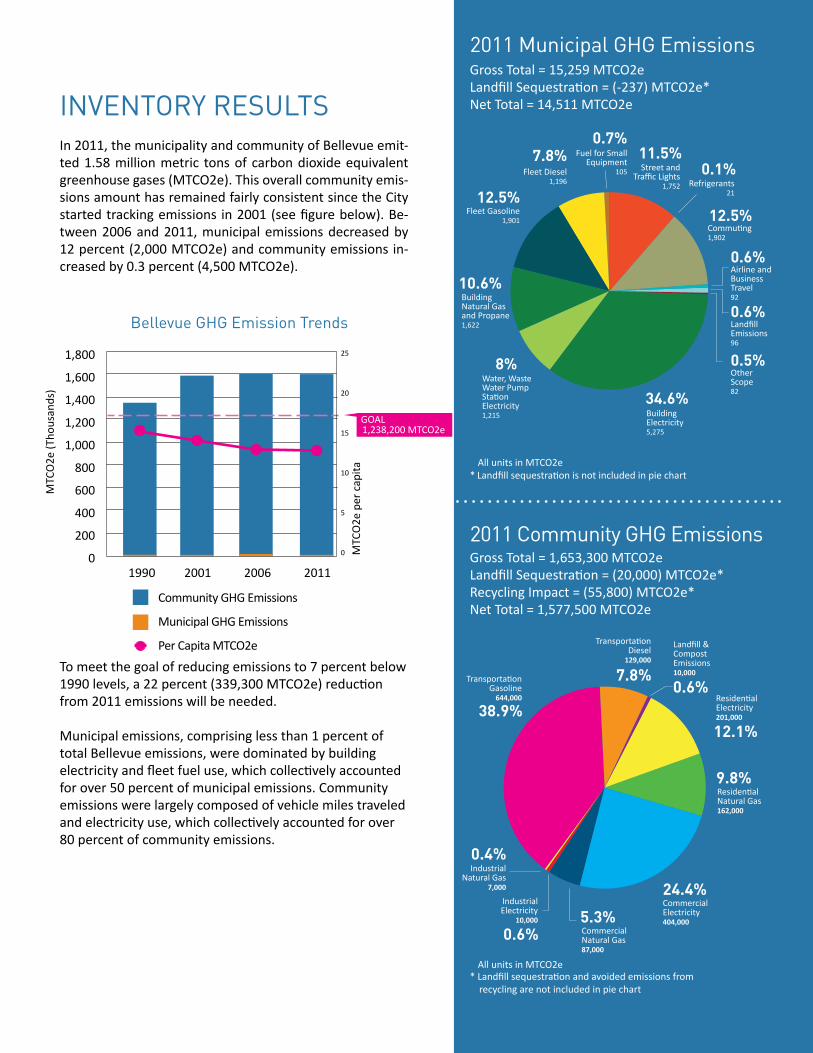
INVENTORY RESULTSIn 2011, the municipality and community of Bellevue emit-ted 1.58 million metric tons of carbon dioxide equivalent greenhousegases(MTCO2e).Thisoverallcommunityemis-sions amount has remained fairly consistent since the City startedtrackingemissions in2001(seefigurebelow).Be-tween 2006 and 2011, municipal emissions decreased by 12percent(2,000MTCO2e)andcommunityemissionsin-creasedby0.3percent(4,500MTCO2e).
To meet the goal of reducing emissions to 7 percent below 1990levels,a22percent(339,300MTCO2e)reductionfrom 2011 emissions will be needed.
Municipal emissions, comprising less than 1 percent of total Bellevue emissions, were dominated by building electricityandfleetfueluse,whichcollectivelyaccountedfor over 50 percent of municipal emissions. Community emissions were largely composed of vehicle miles traveled andelectricityuse,whichcollectivelyaccountedforover80 percent of community emissions.
All units in MTCO2e*Landfillsequestrationisnotincludedinpiechart
All units in MTCO2e*Landfillsequestrationandavoidedemissionsfrom recycling are not included in pie chart
Fuel for Small Equipment
105 Street and TrafficLights
1,752 Refrigerants 21
Fleet Gasoline 1,901
Fleet Diesel 1,196
TransportationGasoline
644,000
TransportationDiesel
129,000
Industrial Electricity
10,000
ResidentialElectricity 201,000
Landfill&Compost Emissions 10,000
Building Natural Gas and Propane 1,622
Building Electricity 5,275
Industrial Natural Gas
7,000
Commercial Natural Gas87,000
Commercial Electricity404,000
ResidentialNatural Gas162,000
Commuting1,902
LandfillEmissions96
Other Scope 82
Airline and Business Travel 92
Water, Waste Water Pump StationElectricity 1,215
0.7%11.5%
0.1%
12.5%
7.8%
38.9%
7.8%
0.6%
12.1%
0.6%
0.4%
5.3%
24.4%
9.8%
10.6%
34.6%
0.6%
0.5%
0.6%
12.5%
8%
Gross Total = 15,259 MTCO2eLandfillSequestration=(-237)MTCO2e*Net Total = 14,511 MTCO2e
Gross Total = 1,653,300 MTCO2eLandfillSequestration=(20,000)MTCO2e*RecyclingImpact=(55,800)MTCO2e*Net Total = 1,577,500 MTCO2e
2011 Community GHG Emissions
2011 Municipal GHG Emissions
25
20
15
10
5
0
GOAL1,238,200 MTCO2e
Bellevue GHG Emission Trends
MTC
O2e
(Tho
usan
ds)
1,800
1,600
1,400
1,200
1,000
800
600
400
200
0
Community GHG Emissions
Municipal GHG Emissions
Per Capita MTCO2e
1990 2001 2006 2011
MTC
O2e
per
cap
ita
ENVIRONMENTAL STEWARDSHIP INITIATIVE 2013-2018 17
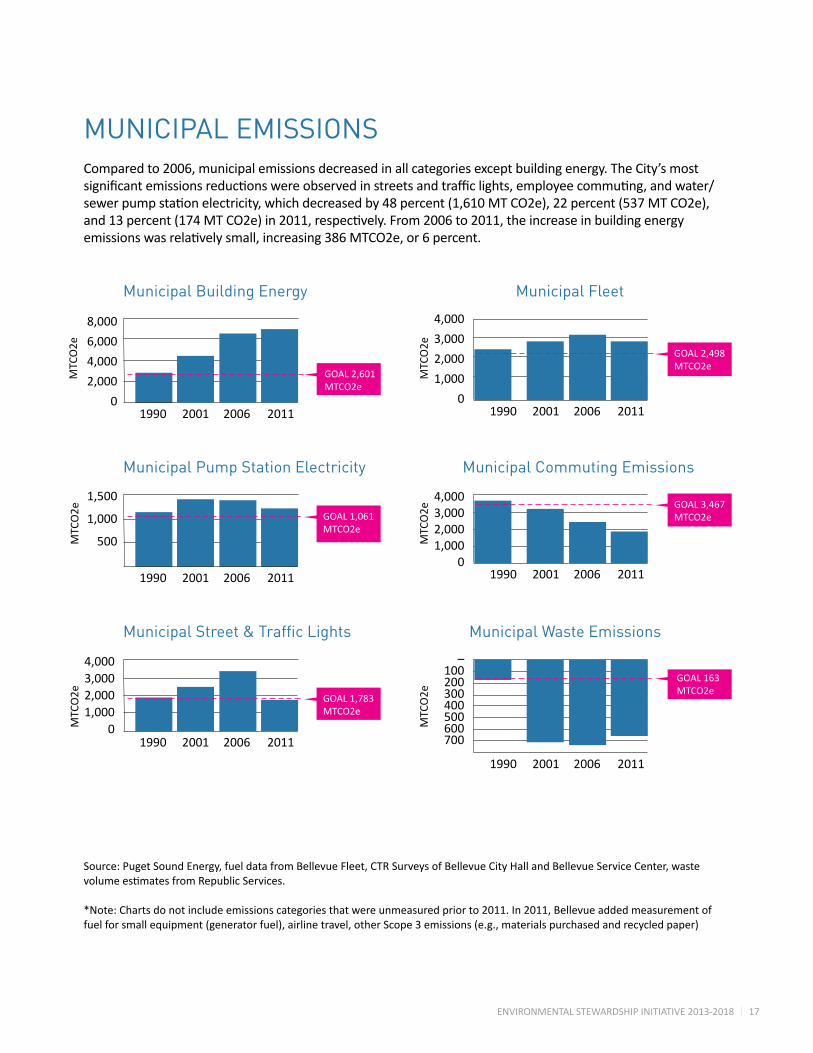
MUNICIPAL EMISSIONSCompared to 2006, municipal emissions decreased in all categories except building energy. The City’s most significantemissionsreductionswereobservedinstreetsandtrafficlights,employeecommuting,andwater/sewerpumpstationelectricity,whichdecreasedby48percent(1,610MTCO2e),22percent(537MTCO2e),and13percent(174MTCO2e)in2011,respectively.From2006to2011,theincreaseinbuildingenergyemissionswasrelativelysmall,increasing386MTCO2e,or6percent.
Source: Puget Sound Energy, fuel data from Bellevue Fleet, CTR Surveys of Bellevue City Hall and Bellevue Service Center, waste volumeestimatesfromRepublicServices.
*Note: Charts do not include emissions categories that were unmeasured prior to 2011. In 2011, Bellevue added measurement of fuelforsmallequipment(generatorfuel),airlinetravel,otherScope3emissions(e.g.,materialspurchasedandrecycledpaper)
1990 2001 2006 2011
1990 2001 2006 2011
1990 2001 2006 2011
1990 2001 2006 2011
1990 2001 2006 2011
1990 2001 2006 2011
8,000
6,000
4,000
2,000
0
4,0003,0002,0001,000
0
1,500
1,000
500
4,000
3,000
2,000
1,000
0
4,0003,0002,0001,000
0
–100200300400500600700
Municipal Building Energy
Municipal Street & Traffic Lights
Municipal Pump Station Electricity
Municipal Fleet
Municipal Commuting Emissions
GOAL 2,601 MTCO2e
GOAL 1,783 MTCO2e
GOAL 1,061 MTCO2e
GOAL 2,498 MTCO2e
GOAL 3,467 MTCO2e
GOAL 163 MTCO2e
Municipal Waste Emissions
MTC
O2e
MTC
O2e
MTC
O2e
MTC
O2e
MTC
O2e
MTC
O2e

ENVIRONMENTAL STEWARDSHIP INITIATIVE 2013-2018 18
COMMUNITY EMISSIONSFrom 2006 to 2011, emissions from the Bellevue community increased by 4,500 MTCO2e, or 0.3 percent. Electricity emissions decreased by 3 percent, or 22,100 MTCO2e. Emissions from natural gas and vehicle milestravelledincreasedby7percent(16,500MTCO2e)and1percent(9,500MTCO2e),respectively.Landfilldisposalemissionsdecreasedby600MTCO2e,or7percent.Becauseoflesswastegoingtolandfill,theamountofcarbonbeingstoredinlandfilldecreasedby5,200MTCO2e,or21percent.
Source:PugetSoundEnergy,BellevueDepartmentofTransportationmodelforvehiclemilestraveled,wastetonnagereportsfromBellevueUtilities.
NEXT STEPSThe2011inventoryrevealstheCity’semissionsarelevelingoff,reversinganalarmingtrendinemissionsgrowth.Tostartadeclineinemissions,theCitywillneedtoaddadditionalconcentratedeffortandresourc-es in all categories.
Thecategoriesmeasuredinthisinventoryvariedwidelyintheirrespectiveemissions,withthreecategories(vehiclemilestraveled,communityelectricity,andcommunitynaturalgas)accountingforover98percentofoverallemissions.ThesesectorsrepresentpriorityareasforreducingemissionsandmeetingCitygoals.EmphasisonactionstoreduceemissionsinthesehighlycontributivesectorswouldallowtheCitytodirectfundstowardthoseeffortsthatcouldofferthemostcosteffectivegreenhousegasemissionreduction.
STRATEGIES & ACTIONSManyoftheactionsdescribedelsewhereinthisreportreducegreenhousegasemissions.Thepurposeofthissection,therefore,islimitedtofocusingonthemechanismsrequiredtomeasuretheresultsofouref-fortsspecificallyrelatingtoGHGemissionsandensuringtheCityispreparingfortheforeseeableimpactsofclimatechange.Thefollowingthreeactionsfocusontheseobjectives.
700,000600,000500,000400,000300,000200,000100,000
1990 2001 2006 2011
1990 2001 2006 2011
GOAL 404,200 MTCO2e
GOAL 206,600 MTCO2e
Community Electricity
300,000250,000200,000150,000100,000
50,000
Community Natural Gas
MTC
O2e
1990 2001 2006 2011
800,000750,000700,000650,000600,000
GOAL 683,800 MTCO2e
Community VMT
MTC
O2e
MTC
O2e
1990 2001 2006 2011
–20,00040,00060,00080,000
100,000120,000
Community Waste Emissions-Net
GOAL 56,400 MTCO2e
MTC
O2e
ENVIRONMENTAL STEWARDSHIP INITIATIVE 2013-2018 19
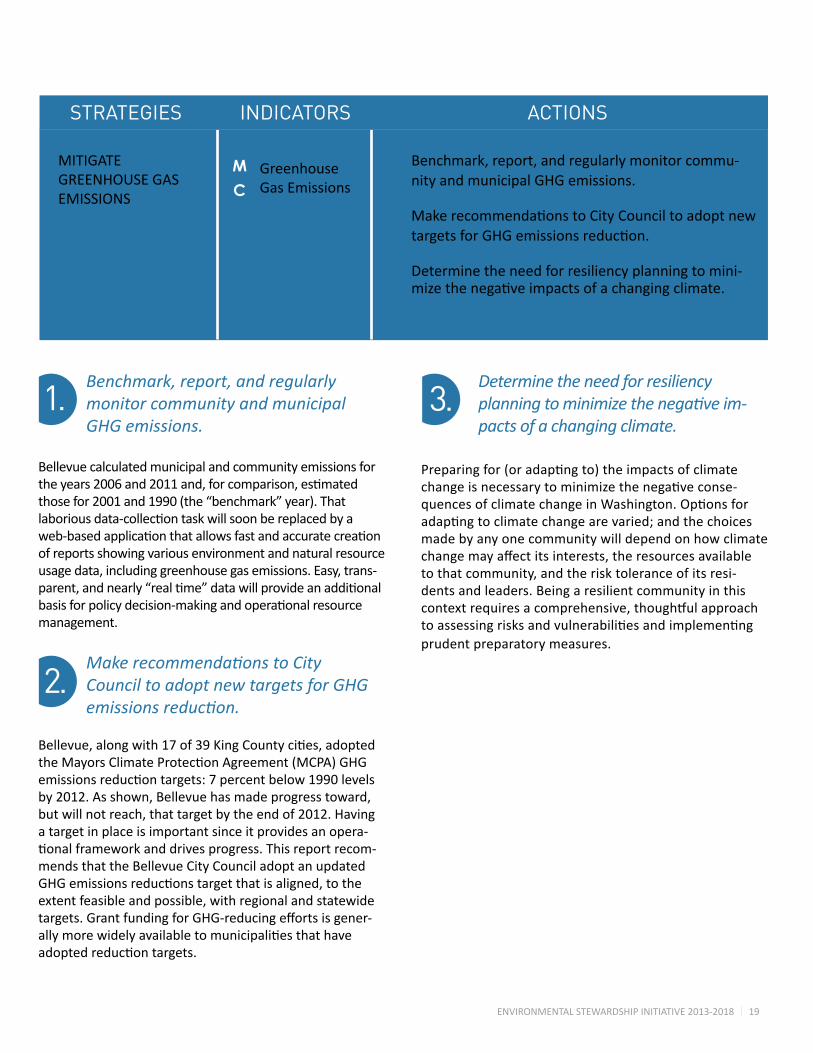
Benchmark, report, and regularly monitor community and municipal GHG emissions.
Bellevue calculated municipal and community emissions for theyears2006and2011and,forcomparison,estimatedthosefor2001and1990(the“benchmark”year).Thatlaboriousdata-collectiontaskwillsoonbereplacedbyaweb-basedapplicationthatallowsfastandaccuratecreationof reports showing various environment and natural resource usage data, including greenhouse gas emissions. Easy, trans-parent,andnearly“realtime”datawillprovideanadditionalbasisforpolicydecision-makingandoperationalresourcemanagement.
Make recommendations to City Council to adopt new targets for GHG emissions reduction.
Bellevue,alongwith17of39KingCountycities,adoptedtheMayorsClimateProtectionAgreement(MCPA)GHGemissionsreductiontargets:7percentbelow1990levelsby 2012. As shown, Bellevue has made progress toward, but will not reach, that target by the end of 2012. Having a target in place is important since it provides an opera-tionalframeworkanddrivesprogress.Thisreportrecom-mends that the Bellevue City Council adopt an updated GHGemissionsreductionstargetthatisaligned,totheextent feasible and possible, with regional and statewide targets.GrantfundingforGHG-reducingeffortsisgener-allymorewidelyavailabletomunicipalitiesthathaveadoptedreductiontargets.
Determine the need for resiliency planning to minimize the negative im-pacts of a changing climate.
Preparingfor(oradaptingto)theimpactsofclimatechangeisnecessarytominimizethenegativeconse-quencesofclimatechangeinWashington.Optionsforadaptingtoclimatechangearevaried;andthechoicesmade by any one community will depend on how climate changemayaffectitsinterests,theresourcesavailableto that community, and the risk tolerance of its resi-dents and leaders. Being a resilient community in this contextrequiresacomprehensive,thoughtfulapproachtoassessingrisksandvulnerabilitiesandimplementingprudent preparatory measures.
2.
3.1.
MITIGATE GREENHOUSE GAS EMISSIONS
Greenhouse Gas Emissions
1. Benchmark, report, and regularly monitor commu-nity and municipal GHG emissions.
2. MakerecommendationstoCityCounciltoadoptnewtargetsforGHGemissionsreduction.
3. Determine the need for resiliency planning to mini-mizethenegativeimpactsofachangingclimate.
STRATEGIES INDICATORS ACTIONS
M
C

ENVIRONMENTAL STEWARDSHIP INITIATIVE 2013-2018 20
MOBILITY & LAND USE
ENVIRONMENTAL STEWARDSHIP INITIATIVE 2013-2018 21
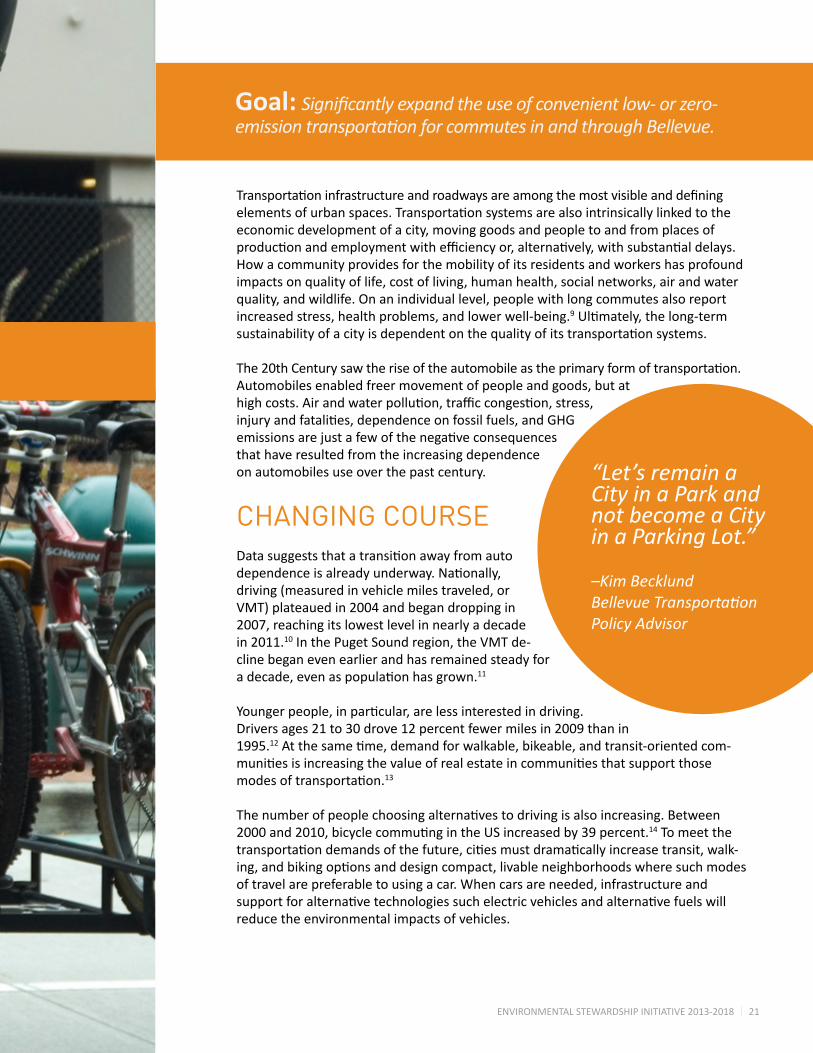
Transportationinfrastructureandroadwaysareamongthemostvisibleanddefiningelementsofurbanspaces.Transportationsystemsarealsointrinsicallylinkedtotheeconomic development of a city, moving goods and people to and from places of productionandemploymentwithefficiencyor,alternatively,withsubstantialdelays.How a community provides for the mobility of its residents and workers has profound impacts on quality of life, cost of living, human health, social networks, air and water quality, and wildlife. On an individual level, people with long commutes also report increased stress, health problems, and lower well-being.9Ultimately,thelong-termsustainabilityofacityisdependentonthequalityofitstransportationsystems.
The20thCenturysawtheriseoftheautomobileastheprimaryformoftransportation.Automobiles enabled freer movement of people and goods, but at highcosts.Airandwaterpollution,trafficcongestion,stress,injuryandfatalities,dependenceonfossilfuels,andGHGemissionsarejustafewofthenegativeconsequencesthat have resulted from the increasing dependence on automobiles use over the past century.
CHANGING COURSEDatasuggeststhatatransitionawayfromautodependenceisalreadyunderway.Nationally,driving(measuredinvehiclemilestraveled,orVMT)plateauedin2004andbegandroppingin2007, reaching its lowest level in nearly a decade in 2011.10 In the Puget Sound region, the VMT de-cline began even earlier and has remained steady for adecade,evenaspopulationhasgrown.11
Youngerpeople,inparticular,arelessinterestedindriving.Drivers ages 21 to 30 drove 12 percent fewer miles in 2009 than in 1995.12Atthesametime,demandforwalkable,bikeable,andtransit-orientedcom-munitiesisincreasingthevalueofrealestateincommunitiesthatsupportthosemodesoftransportation.13
Thenumberofpeoplechoosingalternativestodrivingisalsoincreasing.Between2000and2010,bicyclecommutingintheUSincreasedby39percent.14 To meet the transportationdemandsofthefuture,citiesmustdramaticallyincreasetransit,walk-ing,andbikingoptionsanddesigncompact,livableneighborhoodswheresuchmodesof travel are preferable to using a car. When cars are needed, infrastructure and supportforalternativetechnologiessuchelectricvehiclesandalternativefuelswillreduce the environmental impacts of vehicles.
Goal: Significantly expand the use of convenient low- or zero-emission transportation for commutes in and through Bellevue.
“Let’s remain a City in a Park and not become a City in a Parking Lot.”
–Kim BecklundBellevue Transportation Policy Advisor
ENVIRONMENTAL STEWARDSHIP INITIATIVE 2013-2018 22
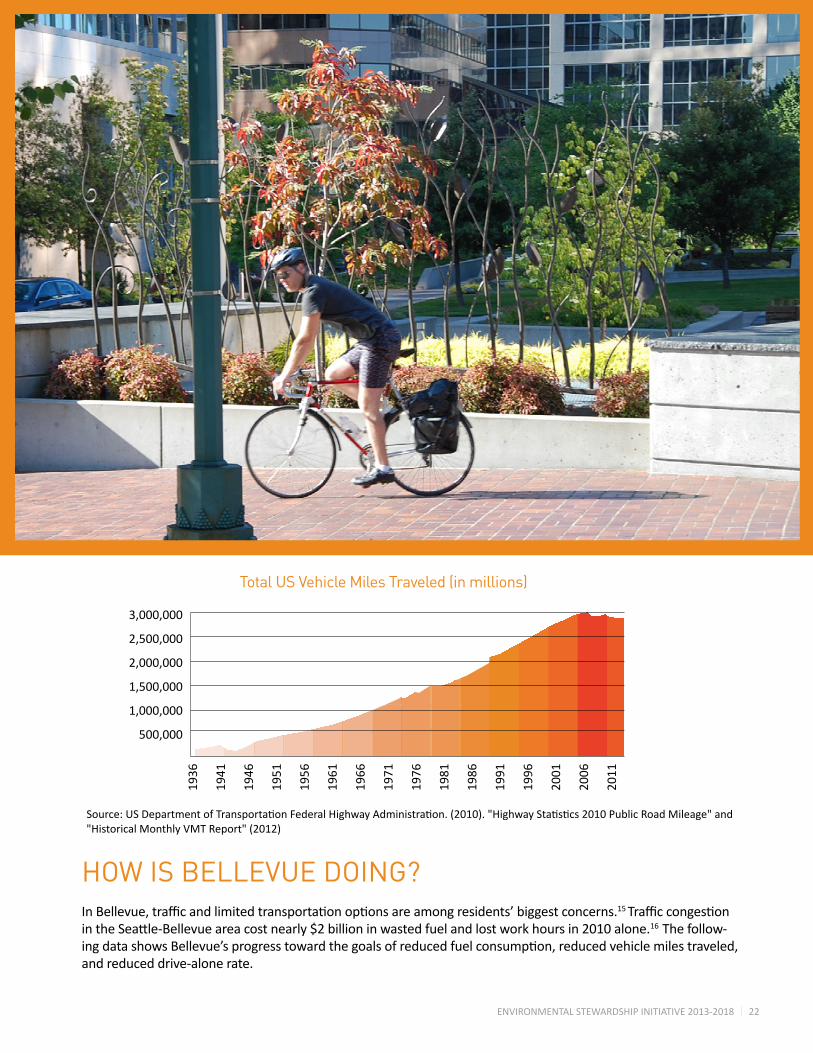
HOW IS BELLEVUE DOING?InBellevue,trafficandlimitedtransportationoptionsareamongresidents’biggestconcerns.15 TrafficcongestionintheSeattle-Bellevueareacostnearly$2billioninwastedfuelandlostworkhoursin2010alone.16 The follow-ingdatashowsBellevue’sprogresstowardthegoalsofreducedfuelconsumption,reducedvehiclemilestraveled,and reduced drive-alone rate.
Total US Vehicle Miles Traveled (in millions)
3,000,000
2,500,000
2,000,000
1,500,000
1,000,000
500,000
1936
1941
1946
1951
1956
1961
1966
1971
1976
1981
1986
1991
1996
2001
2006
2011
Source:USDepartmentofTransportationFederalHighwayAdministration.(2010)."HighwayStatistics2010PublicRoadMileage"and"HistoricalMonthlyVMTReport"(2012)
ENVIRONMENTAL STEWARDSHIP INITIATIVE 2013-2018 23
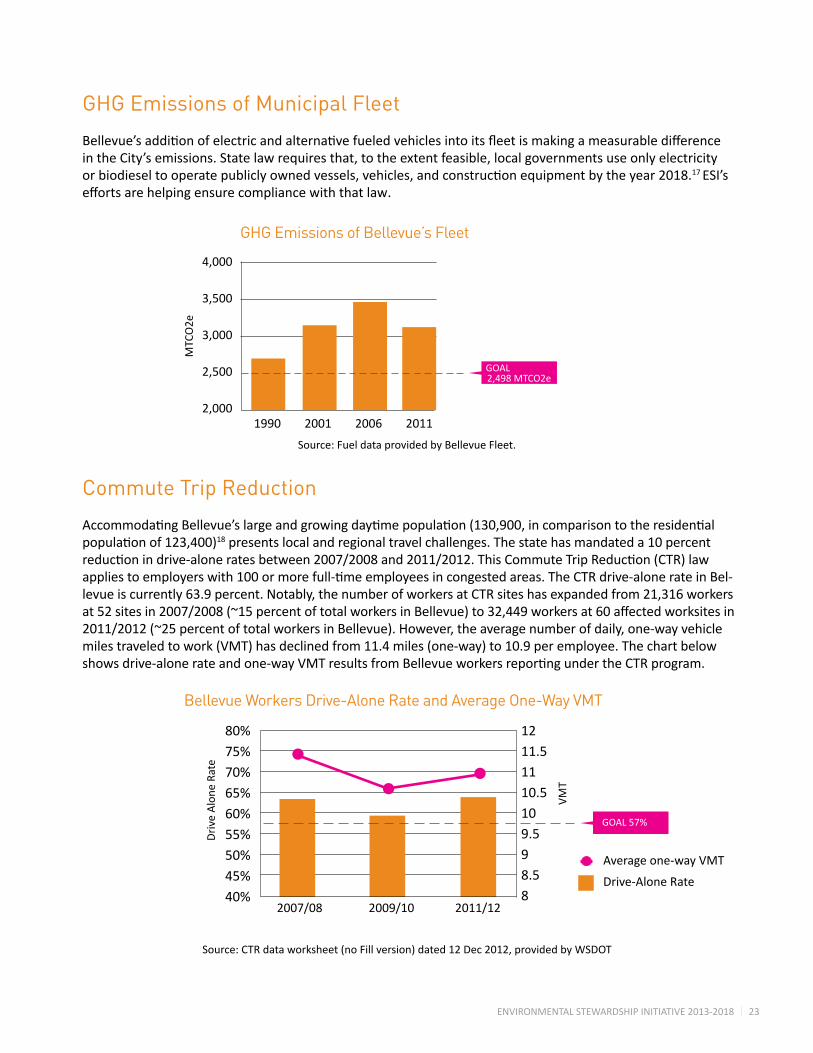
GHG Emissions of Municipal Fleet
Bellevue’sadditionofelectricandalternativefueledvehiclesintoitsfleetismakingameasurabledifferencein the City’s emissions. State law requires that, to the extent feasible, local governments use only electricity orbiodieseltooperatepubliclyownedvessels,vehicles,andconstructionequipmentbytheyear2018.17 ESI’s effortsarehelpingensurecompliancewiththatlaw.
Commute Trip Reduction
AccommodatingBellevue’slargeandgrowingdaytimepopulation(130,900,incomparisontotheresidentialpopulationof123,400)18 presents local and regional travel challenges. The state has mandated a 10 percent reductionindrive-aloneratesbetween2007/2008and2011/2012.ThisCommuteTripReduction(CTR)lawappliestoemployerswith100ormorefull-timeemployeesincongestedareas.TheCTRdrive-alonerateinBel-levue is currently 63.9 percent. Notably, the number of workers at CTR sites has expanded from 21,316 workers at52sitesin2007/2008(~15percentoftotalworkersinBellevue)to32,449workersat60affectedworksitesin2011/2012(~25percentoftotalworkersinBellevue).However,theaveragenumberofdaily,one-wayvehiclemilestraveledtowork(VMT)hasdeclinedfrom11.4miles(one-way)to10.9peremployee.Thechartbelowshowsdrive-alonerateandone-wayVMTresultsfromBellevueworkersreportingundertheCTRprogram.
1990 2001 2006 2011
4,000
3,500
3,000
2,500
2,000
GOAL2,498 MTCO2e
MTC
O2e
GHG Emissions of Bellevue’s Fleet
GOAL57%
Bellevue Workers Drive-Alone Rate and Average One-Way VMT
2007/08 2009/10 2011/12
80%75%70%65%60%55%50%45%40%
1211.51110.5109.598.58
Dri
ve A
lone
Rat
e
VMT
Average one-way VMT
Drive-Alone Rate
Source: Fuel data provided by Bellevue Fleet.
Source:CTRdataworksheet(noFillversion)dated12Dec2012,providedbyWSDOT
ENVIRONMENTAL STEWARDSHIP INITIATIVE 2013-2018 24
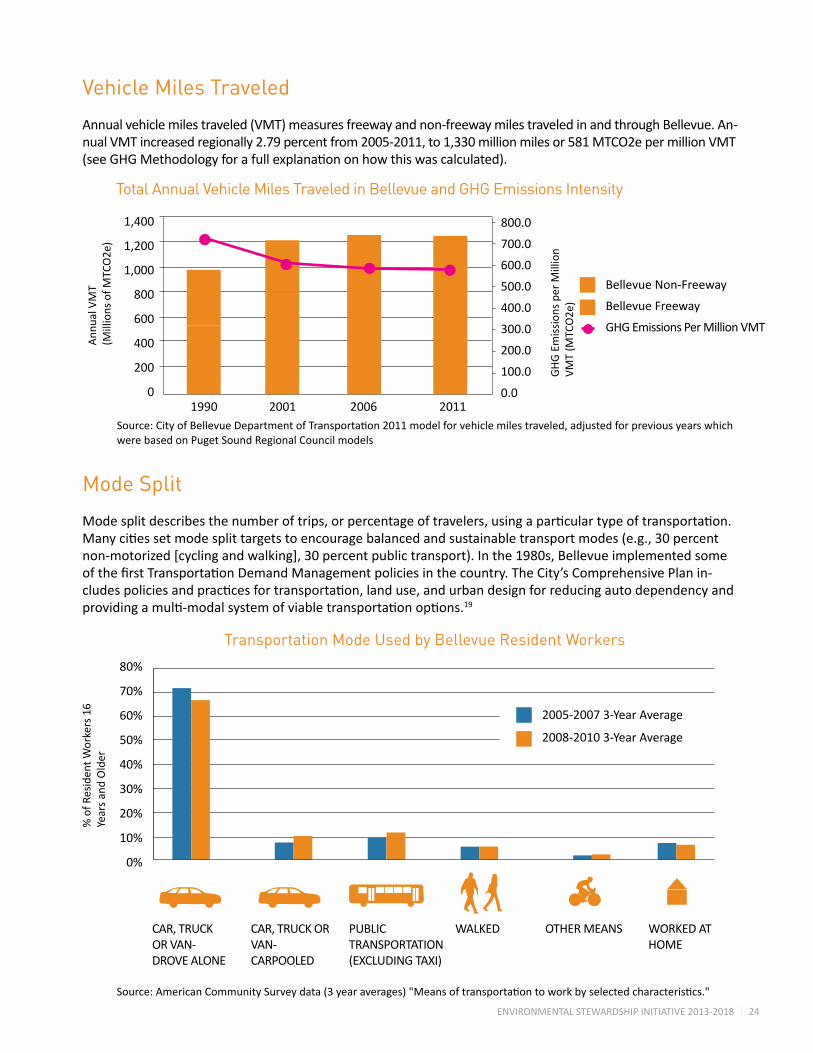
Vehicle Miles Traveled
Annualvehiclemilestraveled(VMT)measuresfreewayandnon-freewaymilestraveledinandthroughBellevue.An-nual VMT increased regionally 2.79 percent from 2005-2011, to 1,330 million miles or 581 MTCO2e per million VMT (seeGHGMethodologyforafullexplanationonhowthiswascalculated).
Mode Split
Modesplitdescribesthenumberoftrips,orpercentageoftravelers,usingaparticulartypeoftransportation.Manycitiessetmodesplittargetstoencouragebalancedandsustainabletransportmodes(e.g.,30percentnon-motorized[cyclingandwalking],30percentpublictransport).Inthe1980s,BellevueimplementedsomeofthefirstTransportationDemandManagementpoliciesinthecountry.TheCity’sComprehensivePlanin-cludespoliciesandpracticesfortransportation,landuse,andurbandesignforreducingautodependencyandprovidingamulti-modalsystemofviabletransportationoptions.19
Total Annual Vehicle Miles Traveled in Bellevue and GHG Emissions Intensity
Bellevue Non-Freeway
Bellevue Freeway
GHG Emissions Per Million VMT
1990 2001 2006 2011
Ann
ual V
MT
(MillionsofM
TCO2e
)
GH
G E
mis
sion
s pe
r M
illio
n VM
T(M
TCO2e
)
1,400
1,200
1,000
800
600
400
200
0
800.0
700.0
600.0
500.0
400.0
300.0
200.0
100.0
0.0
Transportation Mode Used by Bellevue Resident Workers
CAR, TRUCK OR VAN- DROVE ALONE
CAR, TRUCK OR VAN- CARPOOLED
PUBLIC TRANSPORTATION (EXCLUDINGTAXI)
WALKED OTHER MEANS
WORKED AT HOME
2005-2007 3-Year Average
2008-2010 3-Year Average
80%
70%
60%
50%
40%
30%
20%
10%
0%
%ofR
esiden
tWorkers16
Year
s an
d O
lder
Source:CityofBellevueDepartmentofTransportation2011modelforvehiclemilestraveled,adjustedforpreviousyearswhichwere based on Puget Sound Regional Council models
Source:AmericanCommunitySurveydata(3yearaverages)"Meansoftransportationtoworkbyselectedcharacteristics."
ENVIRONMENTAL STEWARDSHIP INITIATIVE 2013-2018 25
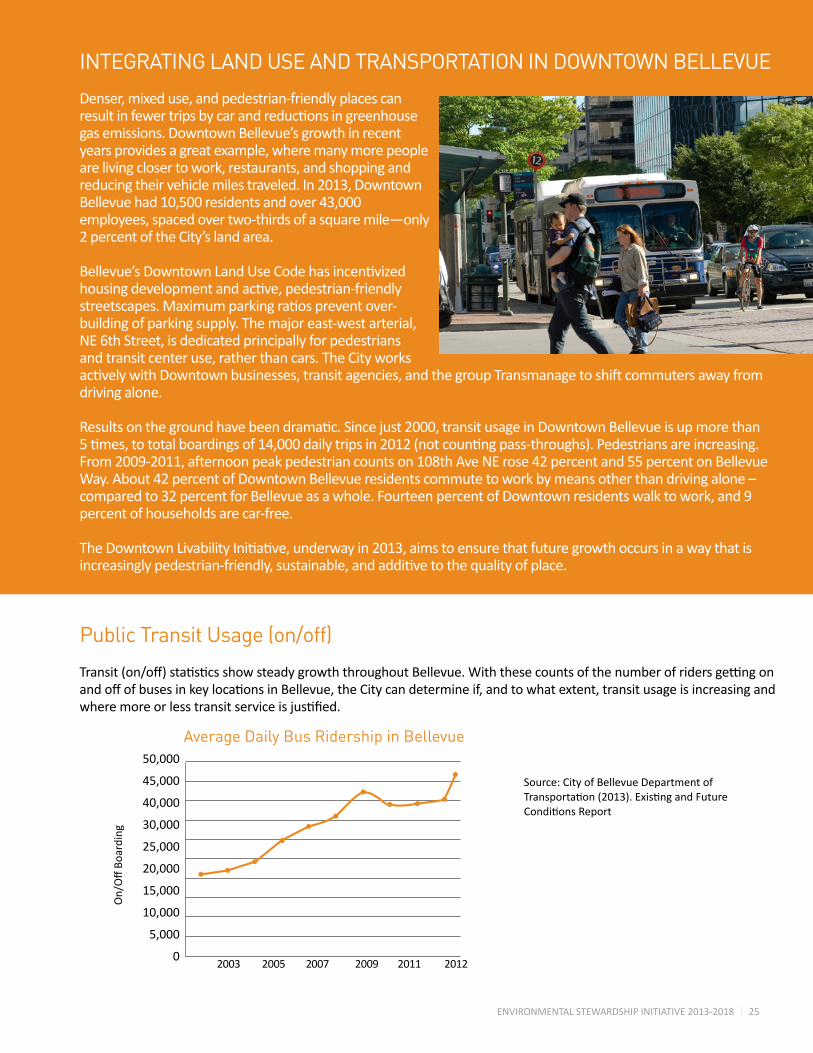
INTEGRATING LAND USE AND TRANSPORTATION IN DOWNTOWN BELLEVUE
Denser, mixed use, and pedestrian-friendly places can resultinfewertripsbycarandreductionsingreenhousegas emissions. Downtown Bellevue’s growth in recent years provides a great example, where many more people are living closer to work, restaurants, and shopping and reducing their vehicle miles traveled. In 2013, Downtown Bellevue had 10,500 residents and over 43,000 employees, spaced over two-thirds of a square mile—only 2 percent of the City’s land area.
Bellevue’sDowntownLandUseCodehasincentivizedhousingdevelopmentandactive,pedestrian-friendlystreetscapes.Maximumparkingratiospreventover-building of parking supply. The major east-west arterial, NE 6th Street, is dedicated principally for pedestrians and transit center use, rather than cars. The City works activelywithDowntownbusinesses,transitagencies,andthegroupTransmanagetoshiftcommutersawayfromdriving alone.
Resultsonthegroundhavebeendramatic.Sincejust2000,transitusageinDowntownBellevueisupmorethan5times,tototalboardingsof14,000dailytripsin2012(notcountingpass-throughs).Pedestriansareincreasing.From2009-2011,afternoonpeakpedestriancountson108thAveNErose42percentand55percentonBellevueWay. About 42 percent of Downtown Bellevue residents commute to work by means other than driving alone – compared to 32 percent for Bellevue as a whole. Fourteen percent of Downtown residents walk to work, and 9 percent of households are car-free.
TheDowntownLivabilityInitiative,underwayin2013,aimstoensurethatfuturegrowthoccursinawaythatisincreasinglypedestrian-friendly,sustainable,andadditivetothequalityofplace.
Public Transit Usage (on/off)
Transit(on/off)statisticsshowsteadygrowththroughoutBellevue.WiththesecountsofthenumberofridersgettingonandoffofbusesinkeylocationsinBellevue,theCitycandetermineif,andtowhatextent,transitusageisincreasingandwheremoreorlesstransitserviceisjustified.
Average Daily Bus Ridership in Bellevue
2003 2005 2007 2009 2011 2012
50,000
45,000
40,000
30,000
25,000
20,000
15,000
10,000
5,000
0
On/OffBoa
rding
Source: City of Bellevue Department of Transportation(2013).ExistingandFutureConditionsReport
ENVIRONMENTAL STEWARDSHIP INITIATIVE 2013-2018 26
Walk Score
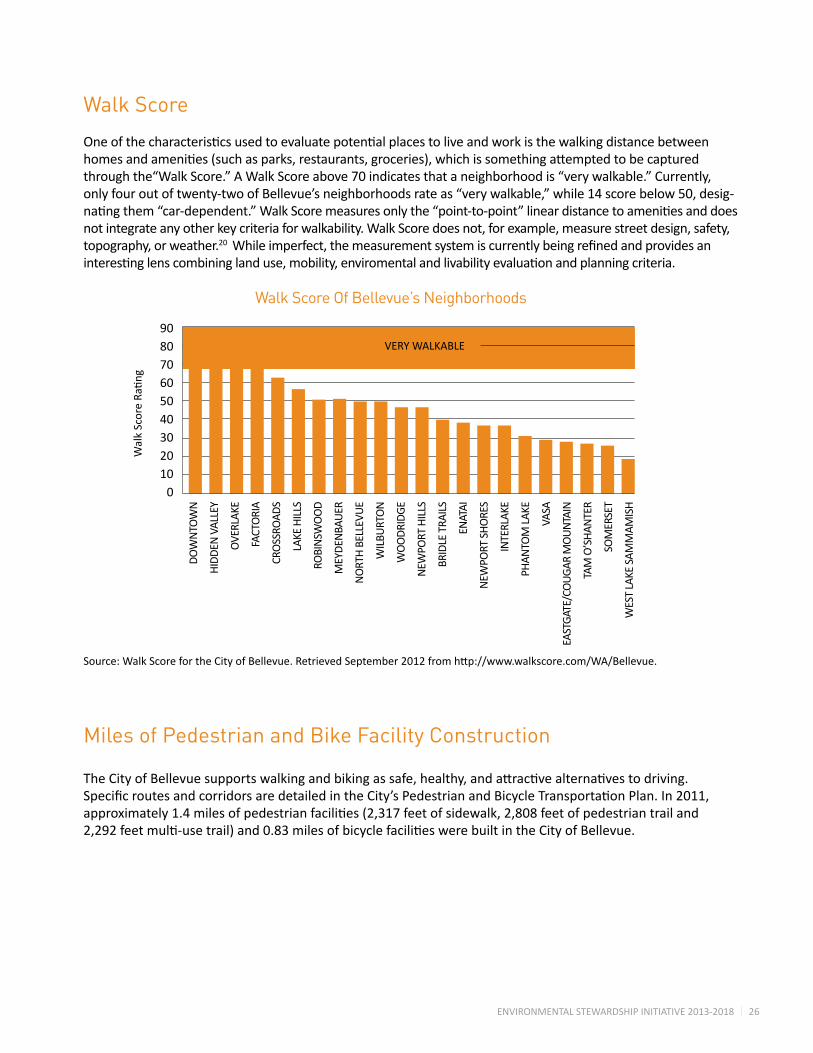
Oneofthecharacteristicsusedtoevaluatepotentialplacestoliveandworkisthewalkingdistancebetweenhomesandamenities(suchasparks,restaurants,groceries),whichissomethingattemptedtobecapturedthrough the“Walk Score.” A Walk Score above 70 indicates that a neighborhood is “very walkable.” Currently, only four out of twenty-two of Bellevue’s neighborhoods rate as “very walkable,” while 14 score below 50, desig-natingthem“car-dependent.”WalkScoremeasuresonlythe“point-to-point”lineardistancetoamenitiesanddoesnot integrate any other key criteria for walkability. Walk Score does not, for example, measure street design, safety, topography, or weather.20 Whileimperfect,themeasurementsystemiscurrentlybeingrefinedandprovidesaninterestinglenscombininglanduse,mobility,enviromentalandlivabilityevaluationandplanningcriteria.
WalkScoreRa
ting
Walk Score Of Bellevue’s Neighborhoods
DO
WN
TOW
N
HID
DEN
VAL
LEY
OVE
RLAK
E
FACT
ORI
A
CRO
SSRO
ADS
LAKE
HIL
LS
ROBI
NSW
OO
D
MEY
DEN
BAU
ER
NO
RTH
BEL
LEVU
E
WIL
BURT
ON
WO
OD
RID
GE
NEW
PORT
HIL
LS
BRID
LE T
RAIL
S
ENAT
AI
NEW
PORT
SH
ORE
S
INTE
RLAK
E
PHAN
TOM
LAK
E
VASA
EAST
GAT
E/CO
UG
AR M
OU
NTA
IN
TAM
O’S
HAN
TER
SOM
ERSE
T
WES
T LA
KE S
AMM
AMIS
H
908070605040302010
0
VERY WALKABLE
Miles of Pedestrian and Bike Facility Construction
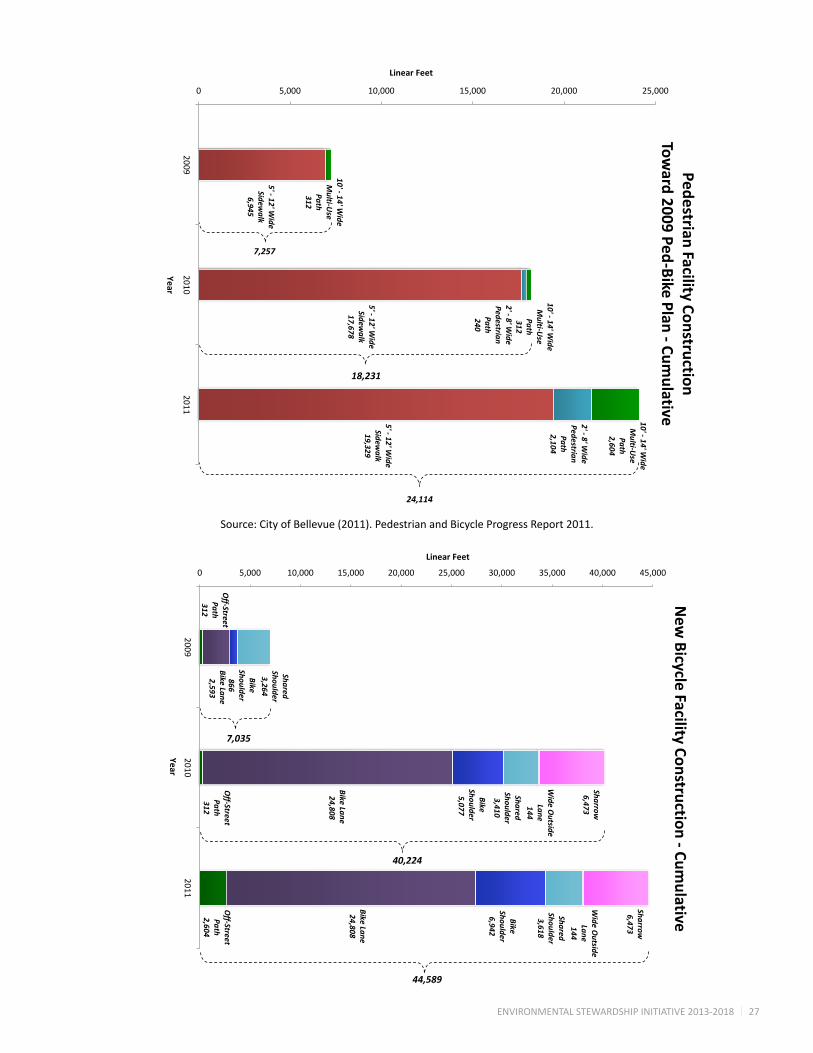
TheCityofBellevuesupportswalkingandbikingassafe,healthy,andattractivealternativestodriving.SpecificroutesandcorridorsaredetailedintheCity’sPedestrianandBicycleTransportationPlan.In2011,approximately1.4milesofpedestrianfacilities(2,317feetofsidewalk,2,808feetofpedestriantrailand2,292feetmulti-usetrail)and0.83milesofbicyclefacilitieswerebuiltintheCityofBellevue.
Source: Walk Score for the City of Bellevue. Retrieved September 2012 from http://www.walkscore.com/WA/Bellevue.
ENVIRONMENTAL STEWARDSHIP INITIATIVE 2013-2018 27
Source:CityofBellevue(2011).PedestrianandBicycleProgressReport2011.
Summ
ary
2011 Pedestrian and Bicycle Program Progress Report
Page 3
Pedestrian Improvem
ents
Figure 3: Pedestrian Facility Construction toward the 2009 Ped-Bike Plan – Cum
ulative (See Appendix, Table 2 for additional detail)
5' - 12' Wide
Sidewalk
6,945
5' - 12' Wide
Sidewalk
17,678
5' - 12' Wide
Sidewalk
19,329
2' - 8' Wide
Pedestrian Path 240
2' - 8' Wide
Pedestrian Path 2,104
10' - 14' Wide
Multi-U
se Path 312
10' - 14' Wide
Multi-U
se Path 312
10' - 14' Wide
Multi-U
se Path 2,604
0 5,000 10,000 15,000 20,000 25,000
20092010
2011
Linear Feet
Year
Pedestrian Facility Construction Tow
ard 2009 Ped-Bike Plan - Cumulative
7,257
24,114
18,231
Summ
ary
2011 Pedestrian and Bicycle Program Progress Report
Page 7
Bicycle Improvem
ents
Figure 7: New
Bicycle Facility Construction – cumulative
(See Appendix Table 4 for additional detail)
Off-Street Path 312
Off-Street Path 312
Off-Street Path 2,604
Bike Lane 2,593
Bike Lane 24,808
Bike Lane 24,808
Bike Shoulder
866
Bike Shoulder
5,077
Bike Shoulder
6,942
Shared Shoulder
3,264
Shared Shoulder
3,410
Shared Shoulder
3,618 W
ide Outside
Lane 144
Wide O
utside Lane 144
Sharrow
6,473
Sharrow
6,473
0 5,000 10,000 15,000 20,000 25,000 30,000 35,000 40,000 45,000
20092010
2011
Linear Feet
Year
New
Bicycle Facility Construction - Cumulative
7,035
40,224
44,589
ENVIRONMENTAL STEWARDSHIP INITIATIVE 2013-2018 28
Electrical Vehicle (EV) Charging Station Use
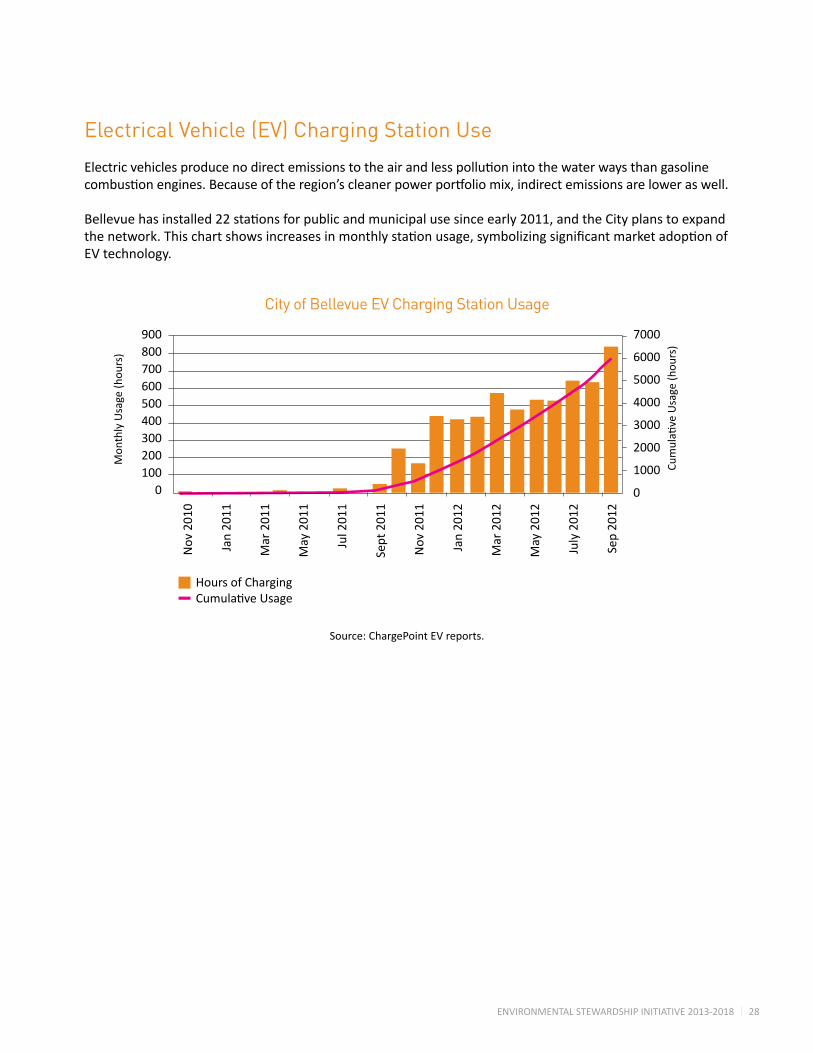
Electricvehiclesproducenodirectemissionstotheairandlesspollutionintothewaterwaysthangasolinecombustionengines.Becauseoftheregion’scleanerpowerportfoliomix,indirectemissionsareloweraswell.
Bellevuehasinstalled22stationsforpublicandmunicipalusesinceearly2011,andtheCityplanstoexpandthenetwork.Thischartshowsincreasesinmonthlystationusage,symbolizingsignificantmarketadoptionofEV technology.
Mon
thlyUsage(h
ours)
City of Bellevue EV Charging Station Usage
Hours of ChargingCumulativeUsage
900800700600500400300200100
0
7000
6000
5000
4000
3000
2000
1000
0
Cumulati
veUsage(h
ours)
Nov
201
0
Jan
2011
Mar
201
1
May
201
1
Jul 2
011
Sept
201
1
Nov
201
1
Jan
2012
Mar
201
2
May
201
2
July
201
2
Sep
2012
Source: ChargePoint EV reports.
ENVIRONMENTAL STEWARDSHIP INITIATIVE 2013-2018 29
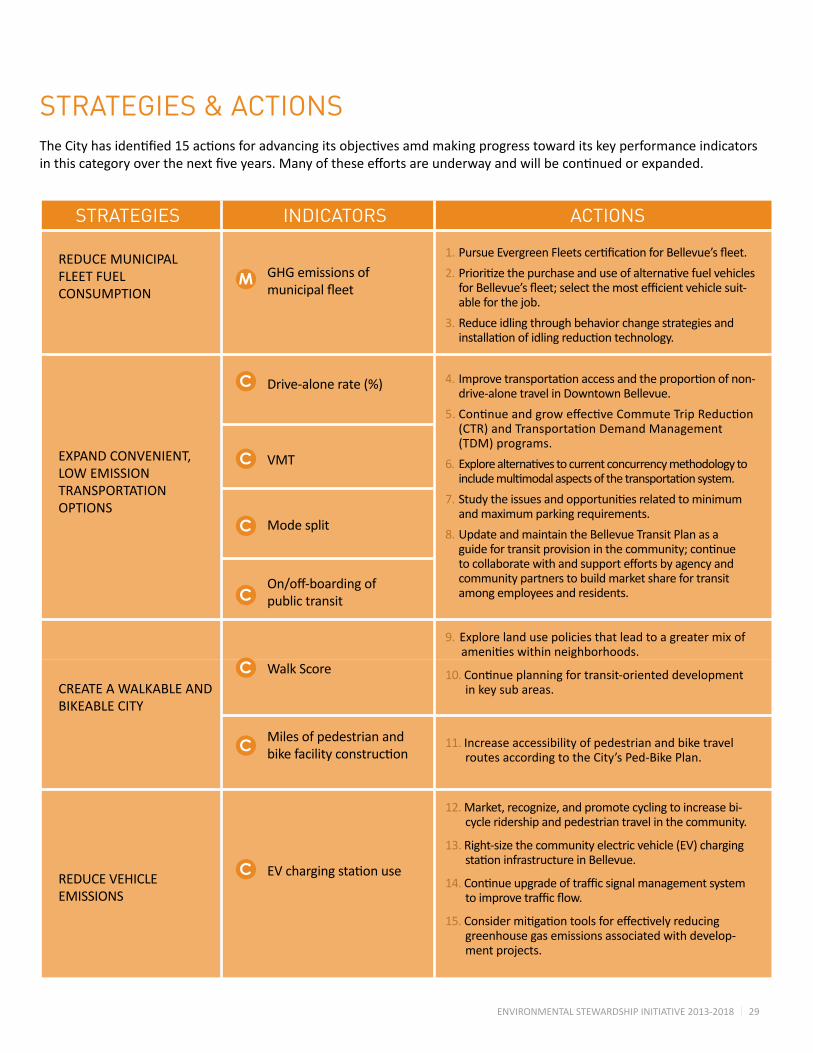
STRATEGIES & ACTIONSTheCityhasidentified15actionsforadvancingitsobjectivesamdmakingprogresstowarditskeyperformanceindicatorsinthiscategoryoverthenextfiveyears.Manyoftheseeffortsareunderwayandwillbecontinuedorexpanded.
STRATEGIES INDICATORS ACTIONS
REDUCE MUNICIPALFLEET FUELCONSUMPTION
EXPANDCONVENIENT,LOW EMISSIONTRANSPORTATIONOPTIONS
CREATE A WALKABLE AND BIKEABLE CITY
REDUCE VEHICLEEMISSIONS
GHG emissions of municipalfleet
Drive-alonerate(%)
VMT
Mode split
On/off-boardingofpublic transit
Walk Score
Miles of pedestrian and bikefacilityconstruction
EVchargingstationuse
1. PursueEvergreenFleetscertificationforBellevue’sfleet.
2. PrioritizethepurchaseanduseofalternativefuelvehiclesforBellevue’sfleet;selectthemostefficientvehiclesuit-able for the job.
3. Reduce idling through behavior change strategies and installationofidlingreductiontechnology.
4. Improvetransportationaccessandtheproportionofnon-drive-alone travel in Downtown Bellevue.
5. ContinueandgroweffectiveCommuteTripReduction(CTR)andTransportationDemandManagement(TDM)programs.
6. Explorealternativestocurrentconcurrencymethodologytoincludemultimodalaspectsofthetransportationsystem.
7. Studytheissuesandopportunitiesrelatedtominimumand maximum parking requirements.
8. Update and maintain the Bellevue Transit Plan as a guidefortransitprovisioninthecommunity;continuetocollaboratewithandsupporteffortsbyagencyandcommunity partners to build market share for transit among employees and residents.
9. Explore land use policies that lead to a greater mix of amenitieswithinneighborhoods.
10. Continueplanningfortransit-orienteddevelopmentin key sub areas.
11. Increase accessibility of pedestrian and bike travel routes according to the City’s Ped-Bike Plan.
12. Market, recognize, and promote cycling to increase bi-cycle ridership and pedestrian travel in the community.
13. Right-sizethecommunityelectricvehicle(EV)chargingstationinfrastructureinBellevue.
14. Continueupgradeoftrafficsignalmanagementsystemtoimprovetrafficflow.
15. Considermitigationtoolsforeffectivelyreducinggreenhouse gas emissions associated with develop-ment projects.
M
C
C
C
C
C
C
C

ENVIRONMENTAL STEWARDSHIP INITIATIVE 2013-2018 30
Pursue Evergreen Fleets certification for Bellevue’s fleet.
Efficientfleetsreducegovernmentspendingandincreasehealthylivingforresidents.ThisactionincludesBellevuepursuingcertificationwiththeEvergreenFleetsprogram,aprojectoftheWesternWashingtonCleanCitiesCoalition.CertificationwillalignBellevue’sfleetperformancewithnationalstandardsandprovideopportunitiesforrecogni-tionbythenationalGovernmentGreenFleet100BestFleets program.
Prioritize the purchase and use of alter-native fuel vehicles for Bellevue’s fleet; select the most efficient vehicle suitable for the job.
Bydiversifyingfuelsawayfromtraditionalfossilfuel(e.g.to-ward,E-85FlexFuel,biodiesel,electric,andnaturalgas)and
selectingtherightsizevehicleforoptimumefficiency,fleetmanagershaveasignificantopportunitytosavemoneyandresources.21 To facilitate this, an internal Fleet Governance CommitteewillworkwithCitydepartments,includingPro-curement, to develop policies and procedures to select the mostefficientfuelandvehicleforthejob.Thisactionincludesthe City’s fueling infrastructure being updated to provide bio-diesel,E85,and/orEVplug-instationsforBellevue’sfleet.
Reduce idling through behavior change strategies and installation of idling re-duction technology.
Vehicles get the worst MPG when their engines run but they don’tmove.Becauseofthis,aswellasnoiseandparticulateimpacts,manystatesandmunicipalitiesrestrictidlingorhaveanti-idlingpolicies.Inaddition,newtechnologysuchasbattery-basedauxiliarypowersystemsforaidcarscanassistevenfurtherwithreducingidletime.
2.
1.
CITY FLEET CUTTING CONSUMPTION OF FOSSIL FUELS
Takingsignificantstepstocutcostsandgreenhousegas emissions, the City of Bellevue has replaced aging vehicles with 3 electric cars and over 90 hy-brid vehicles.
Steadily replacing gasoline powered with hybrids over the past several years, the City now has 120 hybrids, more than half of the 230 passenger ve-hiclesinthefleet. Havingalargeportfolioofhigh-efficiencyvehiclessaves the City more than $100,000 and 30,000gallons of gasoline each year, and reduces an-nual fleet carbon dioxide emissions by 250met-ric tons. Moving away from gasoline dependency hasprovedparticularlyeffectiveasgaspriceshaveclimbed.
“We are not only being good stewards of our environment but also of tax dollars by gradually transitioningtoacleaner,greenerfleet,”saidMayorConradLee.“Wearewalkingthetalk,andshowingourcommunity that it is feasible to use greener cars.” Bellevue’sinvestmentinchargingstationsisalsopayingeconomicdividends,withluxuryelectriccarmakerTeslachoosing to site a showroom here, alongside Chevy and Nissan who are also selling electric models.
3.
ENVIRONMENTAL STEWARDSHIP INITIATIVE 2013-2018 31
Improve transportation access and the proportion of non-drive-alone travel in Downtown Bellevue.
ThisactionwillcontinuetoimplementandworktowardsthegoalsoftheDowntownBellevueGrowthandTransportationEfficiencyCenterplan(“ConnectDowntown”),aprogramwhich is a component of the state’s revised 2006 Commute TripReductionlaw.Thisplanprovidesacustomizeddown-town-widetripreductionprogramwith10objectivescover-ingelementssuchaspublic/privatepartnerships,amenities,marketing,andincentives.TheConnectDowntowngoalis63.9%commutedrive-aloneratefromthe71%baseline.Asof2011,Bellevueisat65%.22
Continue to grow effectiveCommute Trip Reduction (CTR) and Transportation Demand Management (TDM) programs.
CTR programs are required by Washington State law. In Bellevue, employers with 100 or more employees commut-ing to a worksite in the 6-9 a.m. peak period are required to establishprogramstoreducecommutetrips(BCC14.40).These employers are eligible to receive assistance from the Citytodevelopeffectiveprogramsandmeasureprogress.City TDM programs include support for downtown employ-ers through the voluntary Commute Advantage program. In addition,BellevuemaintainstheChooseYourWayBellevue.org website as a one-stop resource for employers, employ-ees,andresidentstolearnabouttransportationoptionsandavailable resources. CTR and TDM programs save money and emissionswhilesignificantlyreducingcongestion.
Explore alternatives to current concur-rency methodology to include multimodal aspects of the transportation system.
WashingtonState’sGrowthManagementAct(GMA)containsaprovisionrequiringlocaljurisdictionstohaveinplace,ortohavefunded,necessarytransportationfa-cilitiesconcurrentwithnewdevelopment.TheseLevel-of-Service(LOS)standards,calledconcurrency,arebasedontheflowrate,builtcapacityoflanes,andthetrafficsignals required by Bellevue City Code. Concurrency standards currently do not include pedestrian, bike, bus rapidtransitorrailfacilitiesthat,inadditiontothestreetnetwork, provide for mobility in dense urban areas. The CityofBellevueaimstoexploreincorporatingmoreofthesemulti-modaltransportationLOSstandardsintoitsconcurrencystandard.However,significantbarriersexistdue to the unavailability of reliable measures of alterna-
tivemodeimprovementimpactsonareamobilityandnecessaryfinancialplanningtoforecasttransituse.TheCity of Bellevue will work towards resolving these issues inordertobetterreflectthemulti-modalmobilityinDowntown and other urban growth areas.
Study the issues and opportunities related to minimum and maximum parking requirements.
The current Land Use Code requires developers to build a minimum number of parking spaces based on size and loca-tion.Thiscanleadtosprawlingparkinglotsthatconsumeotherwisevaluablelandandincreasetrafficcongestionwhilereducing valuable assets like tree canopy and walkability. If auto spaces are not required because of a use of transit, carpooling,walking,orbiking,anexemptionprocessforpro-viding onsite parking is needed. Where parking spaces have beenreduced,innovativemitigationoptionsforparkingimpacts should be allowed.
Update and maintain the Bellevue Transit Plan as a guide for transit provision in the community; continue to collaborate with and support efforts by agency and community partners to build market share for transit among employees and residents.
Transit services in Bellevue are provided by outside agencies (SoundTransitandKingCountyMetro).TheCity,however,playsanessentialroleinprovidingtheinfrastructure,plan-ning,andafinancialshareinexpandingandfacilitatingthesetransitnetworks.Thisstrategycontinuestosupportfuture-focused transit projects that reduce auto-dependency for Bellevue’s residents and workforce.
Explore land use policies that lead to a greater mix of amenities within neigh-borhoods.
Bellevue plans for development through its Comprehen-sive Plan, which is updated every 7 years. The Compre-hensive Plan is aligned with the state’s Growth Manage-ment Act and King County’s countywide planning policy. Land use planning for increased urban density, as well encouragingneighborhoodscaleamenities,areprovenways to reduce vehicle miles traveled.
5.
4.
6.
7.
8.
9.
ENVIRONMENTAL STEWARDSHIP INITIATIVE 2013-2018 32
Continue planning for transit-oriented development in key sub-areas.
Transit-orienteddevelopment(TOD)isaconceptthatcreatescompact,walkable,livablecommunitiesnearbus and train lines. Such developments create com-munitiesthatincludeamixofjobs,housing,andurbanamenities,providingresidentslifestyleoptionsthatarenotinextricablytiedtoautomobiles.CaliforniaAirResourcesBoardstudiesshowthat“significantlyincreasingwalkingandtransitopportunities,”alongwith strategically located moderate-to-high-density development and transit, could achieve an annual reductioninvehiclemilestraveled(VMT)ofbetween20-30 percent per TOD household.23 Transit-oriented de-velopmentreducesregionalroadcongestion,improvesair quality, increases transit ridership, and reduces fuel expensesforresidents-promotingahealthierlifestyleoverall. In Bellevue, key transit sub-areas include Down-town, Eastgate/I-90, Wilburton, Bel-Red 2023, and the Spring District 2023.
Increase accessibility to pedestrian and bike travel routes according to the City’s Ped-Bike Plan.
Peoplewalkandbikemoreoftenifthetravelroutesfordoingsoaresafe,attractive,andenjoyable.IntheUS,walking and cycling are much more dangerous than car travel, both on a per-trip and per-mile basis.24 Closing infra-structure gaps in sidewalks increases pedestrian safety, as dotrafficcalmingandsignalimprovements,whileim-provingexerciseopportunitiesandhealthoutcomes.TheCity’s Ped-Bike Plan calls for 435 projects that when built will yield 90 miles of sidewalk, 144 miles of bikeway, and 20 miles of trail facility improvements. Examples like the West Lake Sammamish Parkway project are enabling more multi-modalmobilityforresidents.25
Market, recognize, and promote cycling to increase bicycle ridership and pedestrian travel in the community.
Trafficimprovementscanbesupplementedbyincentiveprograms in order to increase non-motorized travel. The City’sTDMprogramincentivizesbiketripsbypromotingrelevantinformation,giveaways,andcontestsandinstallingbike racks. May is Bike to Work Month in the Puget Sound and is a great example of how to recognize and encourage people to get on their bikes. The City hopes to expand its educationprogramstoencourageresidents,students,andemployeestobikeandwalkfartherandmoreoften.
TRANSPORTATION PARTNERSHIPS
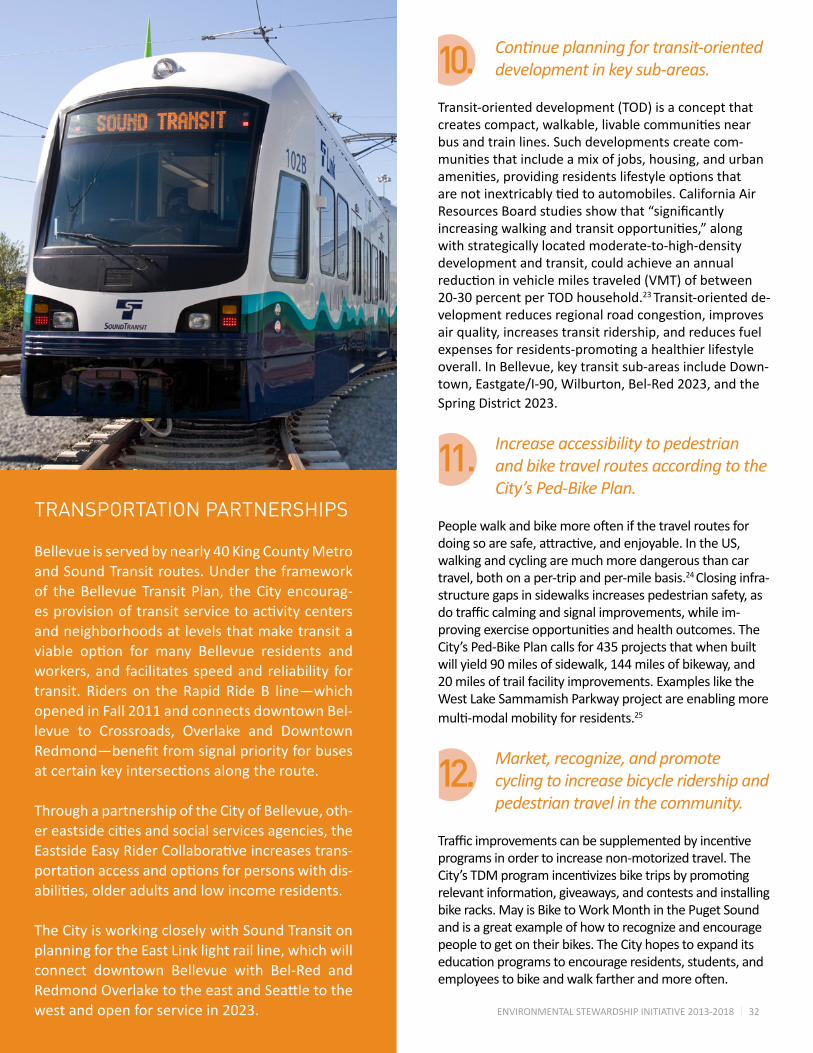
Bellevue is served by nearly 40 King County Metro and Sound Transit routes. Under the framework of the Bellevue Transit Plan, the City encourag-esprovisionoftransitservicetoactivitycentersand neighborhoods at levels that make transit a viable option for many Bellevue residents andworkers, and facilitates speed and reliability for transit. Riders on the Rapid Ride B line—which opened in Fall 2011 and connects downtown Bel-levue to Crossroads, Overlake and Downtown Redmond—benefitfromsignalpriorityforbusesatcertainkeyintersectionsalongtheroute. Through a partnership of the City of Bellevue, oth-ereastsidecitiesandsocialservicesagencies,theEastsideEasyRiderCollaborativeincreasestrans-portationaccessandoptionsforpersonswithdis-abilities,olderadultsandlowincomeresidents. The City is working closely with Sound Transit on planning for the East Link light rail line, which will connect downtown Bellevue with Bel-Red and RedmondOverlaketotheeastandSeattletothewest and open for service in 2023.
ENVIRONMENTAL STEWARDSHIP INITIATIVE 2013-2018 33
Right-size the community electric vehicle (EV) charging station infrastructure in Bellevue.
The City will work both independently and with commer-cialbuildingstoright-sizethenetworkofchargingstations,includingconsiderationofsitingLevelIII“FastChargers,”inareas with the highest demand and usage. Other consid-erationsinthisprocessincludeappropriatecostrecoverypricingandregionalandstatecollaborationefforts.
Continue upgrade of traffic signal man-agement system to improve traffic flow.
TrafficsignalmanagementallowstheCitytocoordinateandsynchronizetrafficsignals.Bellevuehaslongbeenanationalleaderinsignalmanagement,butrecentad-vancesin“adaptive”signals(signalsthatadapttorealtimetrafficconditions)provideadditionalopportunitiestoincreaseefficiencyandthereforeairqualityandfuelefficiency.Bellevueisintheprocessofconvertingallsignalstotrafficadaptivetechnology,withplanstocom-plete the project in 2015.
Consider mitigation tools for effectively reducing greenhouse gas emissions asso-ciated with development projects.
BellevueDevelopmentServicesstaffhavebegundisclos-ing greenhouse gas impacts of major new developments underreviewwithintheCity’sjurisdictionthroughtheStateEnvironmentalPolicyAct(SEPA).SuchSEPAre-quirementsarefocusedonidentification,disclosure,andconsiderationofGHGimpacts.However,thisinformationisnotcurrentlybeingutilizedtoidentifygreenhousegasmitigationoptionsassociatedwiththedevelopment.Thisactionrecommendsresearchandevaluationofpotentialapproachestomitigatinggreenhousegasimpactsfromnew development.
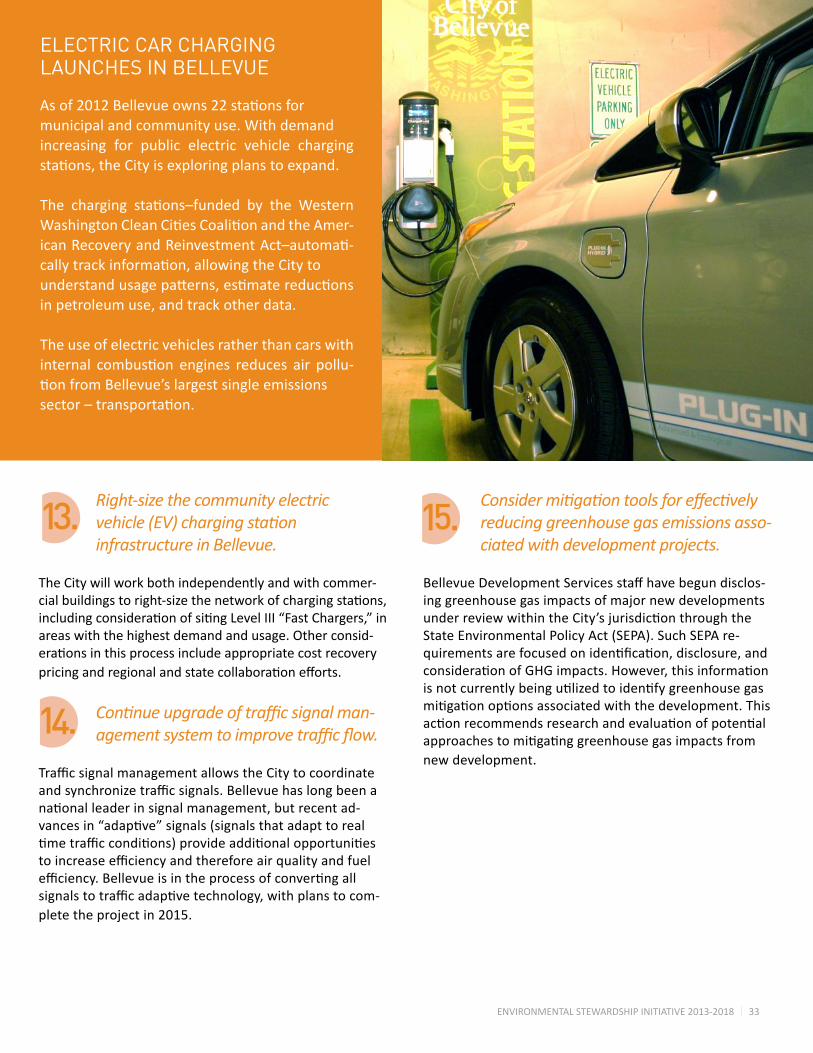
ELECTRIC CAR CHARGING LAUNCHES IN BELLEVUE
Asof2012Bellevueowns22stationsformunicipal and community use. With demand increasing for public electric vehicle charging stations,theCityisexploringplanstoexpand. The charging stations–funded by the WesternWashingtonCleanCitiesCoalitionandtheAmer-icanRecoveryandReinvestmentAct–automati-callytrackinformation,allowingtheCitytounderstandusagepatterns,estimatereductionsin petroleum use, and track other data. The use of electric vehicles rather than cars with internal combustion engines reduces air pollu-tionfromBellevue’slargestsingleemissionssector–transportation.
4
5

ENVIRONMENTAL STEWARDSHIP INITIATIVE 2013-2018 34
ENERGY & WATER
ENVIRONMENTAL STEWARDSHIP INITIATIVE 2013-2018 35
Goal: Ensure long-term access to clean energy and water while reducing the fiscal and environmental impacts of consumption.
Energy and water supplies are inherently linked to Bellevue’s quality of life, economic development, and community health. This region is blessed with some of the best-tasting,cleanest,andmostabundantwatersupplyinthecountry.Reliable,plentiful,andrelativelyinexpensiveenergyisanotherenvironmentalassetthat,whileoftentaken for granted by residents, is a reason many major industries and employers locate in the Northwest. However, neither of these assets is endless or without en-vironmentalimpact.Conservationandefficiencymeasures,alongwithfocusontheincreaseofrenewableenergy,willhelpprotecttheseattributesintothe future.
Hydropower generates 50 percent of Puget Sound En-ergy’s(PSE)electricity.26 This has given rise to our repu-tationforhaving“clean”electricity,ascomparedtothenationalaverageof42percentelectric-ityfromcoal-firedpowerplants.27 However, one third of PSE’s electricity comes from the coal-firedpowerplantitco-ownsinColstrip,Montana, which means that electricity use withinBellevuestillrequiressignificantcombustionofcoal.28
Even electricity generated from hydropow-erhasnegativeenvironmentaleffects,theprimary one being the impact on salmon andotheraquatichabitat.Damsradicallyalter natural water temperatures, chemistry, flowcharacteristics,andsedimentloads,allofwhichcanleadtosignificantchangesintheecologyandphysicalcharacteristicsoftheriverupstream and downstream.
The other key fuel source in the region, natural gas, is “cleaner”thancoal.However,therearesignificantconcernsabout the environmental and human health impacts of natural gas extractionefforts,especiallythoserelatedtogroundwater.Thecombustionofnaturalgas also emits carbon.
Forthesereasons,strategiesthatincreaseinstallationofrenewableenergygenera-tionsourceswhilesimultaneouslyworkingonenergyconservationandefficiencymake a lot of sense.
ThesupplyofwaterinWesternWashingtoniscurrentlyquiterobust.However,scientistsfrom the UW Climate Impacts Group showthatAprilsnowwaterequivalent(SWE)isprojected to decrease by an average of approximately 27-29 percent across Washing-ton State by the 2020s, 37-44 percent by the 2040s, and 53-65 percent by the 2080s, as global average temperatures increase,29,30 meaning that water resources and stor-age planning will become increasingly important.
“The US economy has tripled in size since 1970 and three-quarters of the energy needed to fuel that growth came from an amazing variety of efficiency advances-- not new en-ergy supplies. ...Going forward, the current economic recovery, and our future economic prosperity, will de-pend more on new energy efficiency behaviors and investments than we’ve seen in the last 40 years.”
-John A. Skip Laitner, The Long-Term Energy Efficiency Potential, ACEEE, January 2012

ENVIRONMENTAL STEWARDSHIP INITIATIVE 2013-2018 36
CONSERVATION AND EFFICIENCY: A SUCCESS STORYSteadypopulationgrowthinthePugetSoundregionrequiresutilitiestomeetgrowingdemandsforenergyandwater.Onewaythatutilitieshavemetincreaseddemandisbysupportingconservationefforts.
Since1978,regionalenergyefficiencymeasureshaveproducednearly3,700MWofsavings–equivalenttotheproductioncapacityofmorethansixcoalplants.Theseenergyefficiencymeasuresreducecostsforratepayers,conservenaturalresources,andavoidthesignificantcapitalandoperatingexpensesofbuildingnewfacilities.31
Increasedenergyefficiencyinbuildingsisaprimaryreasonforaslowingrateofgrowthinelectricitycon-sumptionnationwide,despitegrowingpopulationsandbuildingstock.Nationally,thebuildingsectorac-countedforabout41percentofprimaryenergyconsumptionin2010,44percentmorethanthetransporta-tionsectorand36percentmorethantheindustrialsector.32 33
Withrespecttowater,proactiveinvestmentsandongoingefforts,includingthoseofthePugetSoundPart-nership,strivetoensurethattheprotectionofthePugetSoundregionalwatershedandtheongoingavail-abilityofsafe,dependablewatersupply.Efficiencytechnologiesandpracticeshavereducedwaterdemandbeloweventhemostconservativeplanningestimates,andthecentralPugetSoundhassufficientwaterforat least the next 50 years.34
Finally, renewable energy generation is starting to lower carbon emissions from electricity delivered through the grid. In 2006, Washington became the second state after Colorado to pass a renewable energy standard by ballot initiative. Renewable energy has effectively brought down the Northwest region’s grid baseload emissions from 907 lbs of CO2e per MWh in 2005 to 823 lbs of CO2e per MWh in 2009—a 9.2 percent reduction!
History
Annual Growth In Electricity Consumption Continues to Slow
14
12
10
8
6
4
2
0
1950 1960 1970 1980 1990 2000 2010 2020 2030
PROJECTIONS
2010
Percen
tGrowth(3
-yea
rrolling
average)
Structural Change In Economy- Higher Prices
Standards Improved Effi ciency
PERIOD ANNUAL GROWTH1950s 9.81960s 7.31970s 4.71980s 2.91990s 2.42000-2010 1.02010-2035 0.8
Trend Line
Source: EIA, Annual Energy Outlook 2012

ENVIRONMENTAL STEWARDSHIP INITIATIVE 2013-2018 37
WashingtonStateInitiative937requiredthatelectricutilitiesservingmorethan25,000 customers in the state of Washington obtain 15 percent of their electricity fromnewrenewableresourcesby2020andundertakeallcost-effectiveenergyconservation.TheUnionofConcernedScientistsfoundthatby2025,I-937willresultinthefollowingeconomicbenefitsforWashington:
•2.9percent,or$1.13billion,insavingson consumer electricity bills
•2,000newjobsinmanufacturing, construction,operation,maintenance,and other industries
•$138millioninadditionalincomeanda $148millionincreaseingrossstateproduct
•$2.9billioninnewcapitalinvestment
•$30millioninincometorurallandowners from wind power land leases
•$167millioninnewpropertytaxrevenuesorpaymentinlieuoftaxesforlocalcommunities
I-937
ENVIRONMENTAL STEWARDSHIP INITIATIVE 2013-2018 38
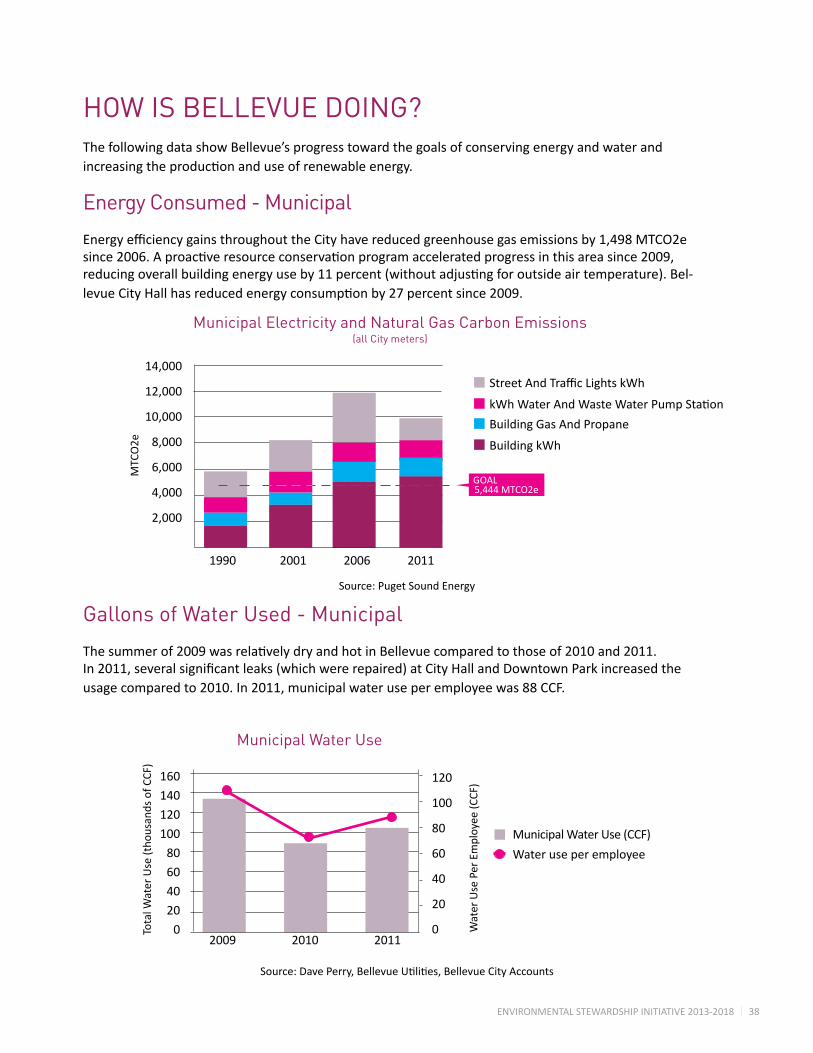
HOW IS BELLEVUE DOING?The following data show Bellevue’s progress toward the goals of conserving energy and water and increasingtheproductionanduseofrenewableenergy.
Energy Consumed - Municipal
EnergyefficiencygainsthroughouttheCityhavereducedgreenhousegasemissionsby1,498MTCO2esince2006.Aproactiveresourceconservationprogramacceleratedprogressinthisareasince2009,reducingoverallbuildingenergyuseby11percent(withoutadjustingforoutsideairtemperature).Bel-levueCityHallhasreducedenergyconsumptionby27percentsince2009.
Gallons of Water Used - Municipal
Thesummerof2009wasrelativelydryandhotinBellevuecomparedtothoseof2010and2011.In2011,severalsignificantleaks(whichwererepaired)atCityHallandDowntownParkincreasedtheusage compared to 2010. In 2011, municipal water use per employee was 88 CCF.
StreetAndTrafficLightskWh
kWhWaterAndWasteWaterPumpStation
Building Gas And Propane
Building kWh
Municipal Water Use
160
140
120
100
80
60
40
20
0
120
100
80
60
40
20
0 2009 2010 2011
TotalW
aterUse(tho
usan
dsofC
CF)
WaterUsePerEmployee
(CCF
)
MunicipalWaterUse(CCF)
Water use per employee
Municipal Electricity and Natural Gas Carbon Emissions (all City meters)
14,000
12,000
10,000
8,000
6,000
4,000
2,000
1990 2001 2006 2011
MTC
O2e
GOAL5,444 MTCO2e
Source: Puget Sound Energy
Source:DavePerry,BellevueUtilities,BellevueCityAccounts
2009 2010 2011
ENVIRONMENTAL STEWARDSHIP INITIATIVE 2013-2018 39
Energy Consumed - Community
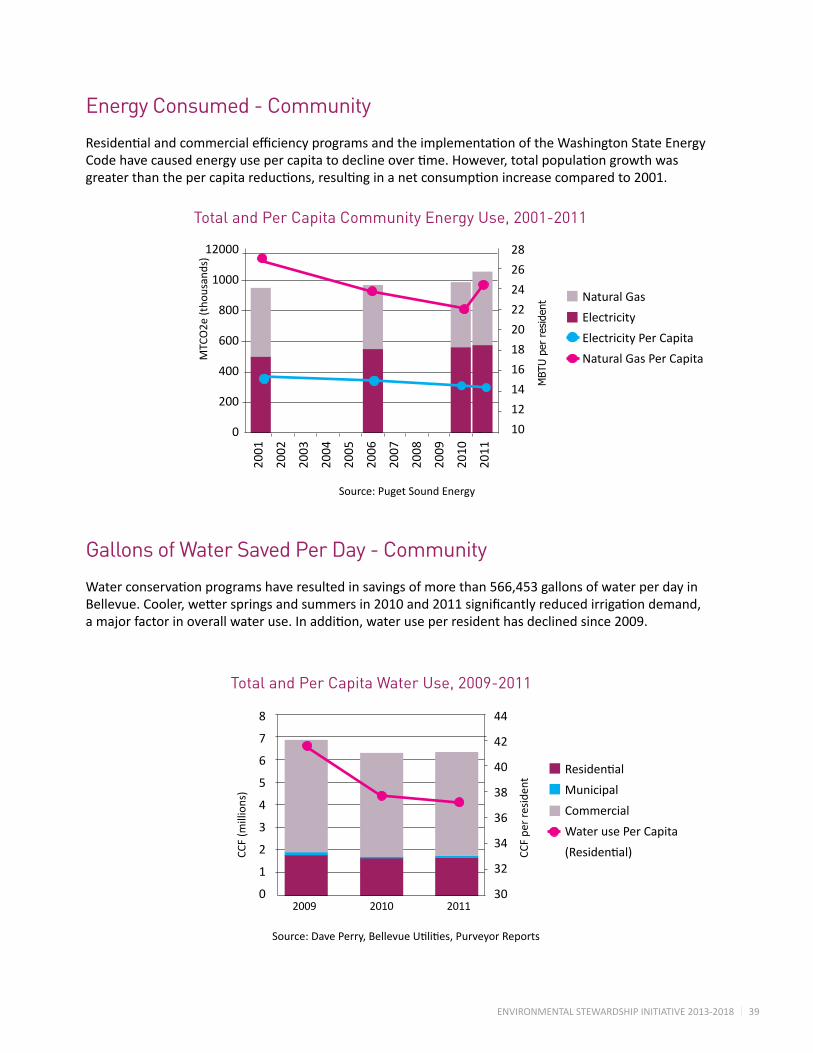
ResidentialandcommercialefficiencyprogramsandtheimplementationoftheWashingtonStateEnergyCodehavecausedenergyusepercapitatodeclineovertime.However,totalpopulationgrowthwasgreaterthanthepercapitareductions,resultinginanetconsumptionincreasecomparedto2001.
Gallons of Water Saved Per Day - Community
Waterconservationprogramshaveresultedinsavingsofmorethan566,453gallonsofwaterperdayinBellevue.Cooler,wetterspringsandsummersin2010and2011significantlyreducedirrigationdemand,amajorfactorinoverallwateruse.Inaddition,wateruseperresidenthasdeclinedsince2009.
8
7
6
5
4
3
2
1
0
44
42
40
38
36
34
32
30
Residential
Municipal
Commercial
Water use Per Capita
(Residential)CCF(m
illions)
CCF
per
resi
dent
Total and Per Capita Water Use, 2009-2011
2009 2010 2011
Total and Per Capita Community Energy Use, 2001-2011
12000
1000
800
600
400
200
0
28
26
24
22
20
18
16
14
12
10
Natural Gas
Electricity
Electricity Per Capita
Natural Gas Per Capita
2001
2002
2003
2004
2005
2006
2007
2008
2009
2010
2011
MTC
O2e
(tho
usan
ds)
MBT
U p
er r
esid
ent
Source: Puget Sound Energy
Source:DavePerry,BellevueUtilities,PurveyorReports
ENVIRONMENTAL STEWARDSHIP INITIATIVE 2013-2018 40
PSE Sales of Green Power and kW of Renewables Installed
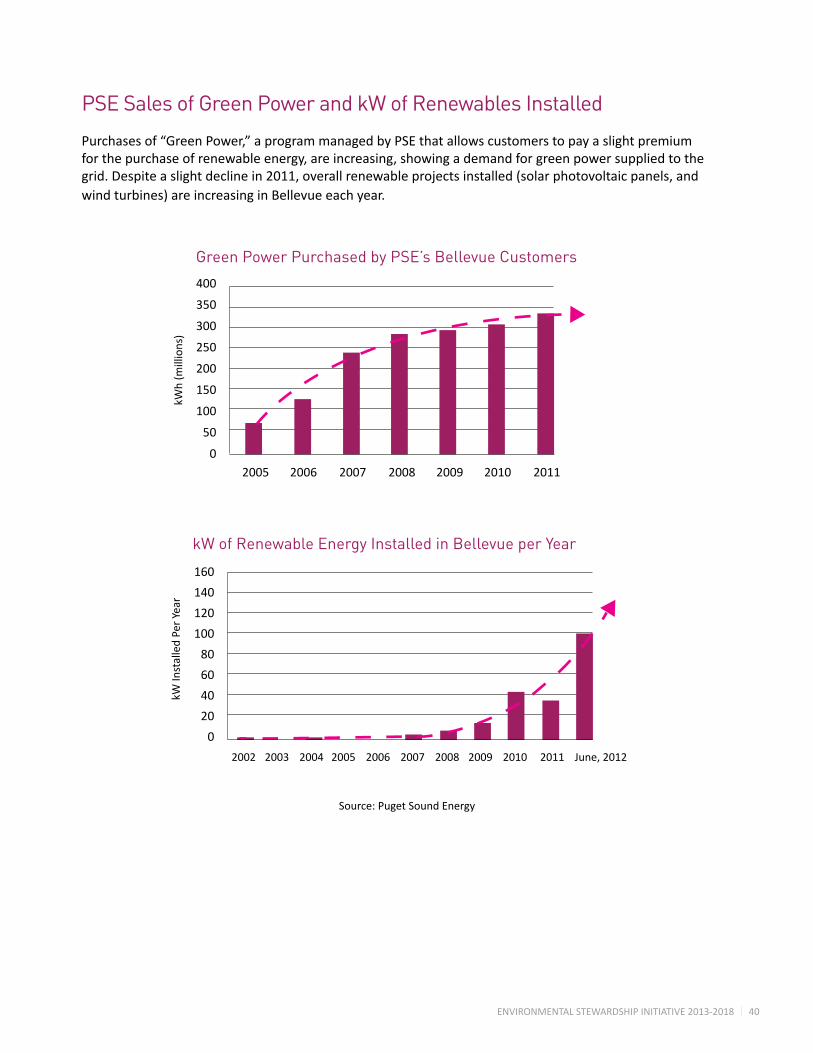
Purchases of “Green Power,” a program managed by PSE that allows customers to pay a slight premium for the purchase of renewable energy, are increasing, showing a demand for green power supplied to the grid.Despiteaslightdeclinein2011,overallrenewableprojectsinstalled(solarphotovoltaicpanels,andwindturbines)areincreasinginBellevueeachyear.
160
140
120
100
80
60
40
20
0
kW In
stal
led
Per
Year
2002 2003 2004 2005 2006 2007 2008 2009 2010 2011 June, 2012
kW of Renewable Energy Installed in Bellevue per Year
400
350
300
250
200
150
100
50
0
kWh(m
illions)
2005 2006 2007 2008 2009 2010 2011
Green Power Purchased by PSE’s Bellevue Customers
Source: Puget Sound Energy

ENVIRONMENTAL STEWARDSHIP INITIATIVE 2013-2018 41
STRATEGIES & ACTIONSTheCityhasidentified12actionsforadvancingitsobjectivesandmakingprogresstowarditskeyperformanceindicatorsinthiscategoryoverthenextfiveyears.Manyoftheseeffortsareunderwayandshouldcontinueorbeexpanded.
STRATEGIES INDICATORS ACTIONS
IMPROVE PERFORMANCE OF MUNICIPAL BUILDINGS AND SITES
IMPROVE PERFORMANCE OF COMMUNITY BUILDINGS AND SITES
ENGAGE THE COMMUNITY ON BEST PRACTICES FOR CONSERVATION
SUPPORT RENEWABLE ENERGY
Energy consumed
Gallons of water used
Energy consumed
Gallons of water saved per day
PSE sales of Green Power and kW of renewables installed in Bellevue
1. Continuetoimplementenergyandwaterconservationretrofitsandoperationalimprovementsformunicipalfacilities,streetlightsandtrafficsignals,andpumpstations.
2. IncreasetheCity’sI.T.energyefficiency.
3. Continuetoinstallandimplementwater-efficientlandscapingandpracticesforstreetscapes,parksites,Cityfacilities,andCity-maintainedplantings.
4. OperateandbuildCityfacilitiesaccordingtoestab-lished high performance standards of EPA’s ENERGY STAR and the USGBC’s Leadership in Energy and EnvironmentalDesign(LEED),andpursuecertificationwhere possible.
5. EstablishaninternalRevolvingLoanFund(RLF)to capturesavingsfromefficiencyupgradesandfund new projects.
6. Establish energy use benchmarking and disclosure requirement for commercial and City buildings with morethan25,000squarefeetandmultifamilybuild-ings with more than 20 units.
7. Encourageenergyandwaterconservationand green building in Bellevue through the energy code and other tools.
8. Reducecodebarriersandstreamlinepermittingprocesses for green building and renewable energy projects.
9. Movetowardreal-timeenergyandwaterconsump-tioninformationforcustomersthroughelectrical“smart-grid” technology and automated meter reads for water use.
10. Encouragemunicipalandprivatemarketparticipa-tioninvoluntaryprogramstodriveenergyandwaterconservation.
11. Conduct community awareness programs to encour-ageenergyandwaterconservationpracticesandrenewable energy purchases.
12. Implement renewable energy projects and study the potentialfordistrictenergysub-areasinBellevue.
M
M
C
C
C
ENVIRONMENTAL STEWARDSHIP INITIATIVE 2013-2018 42
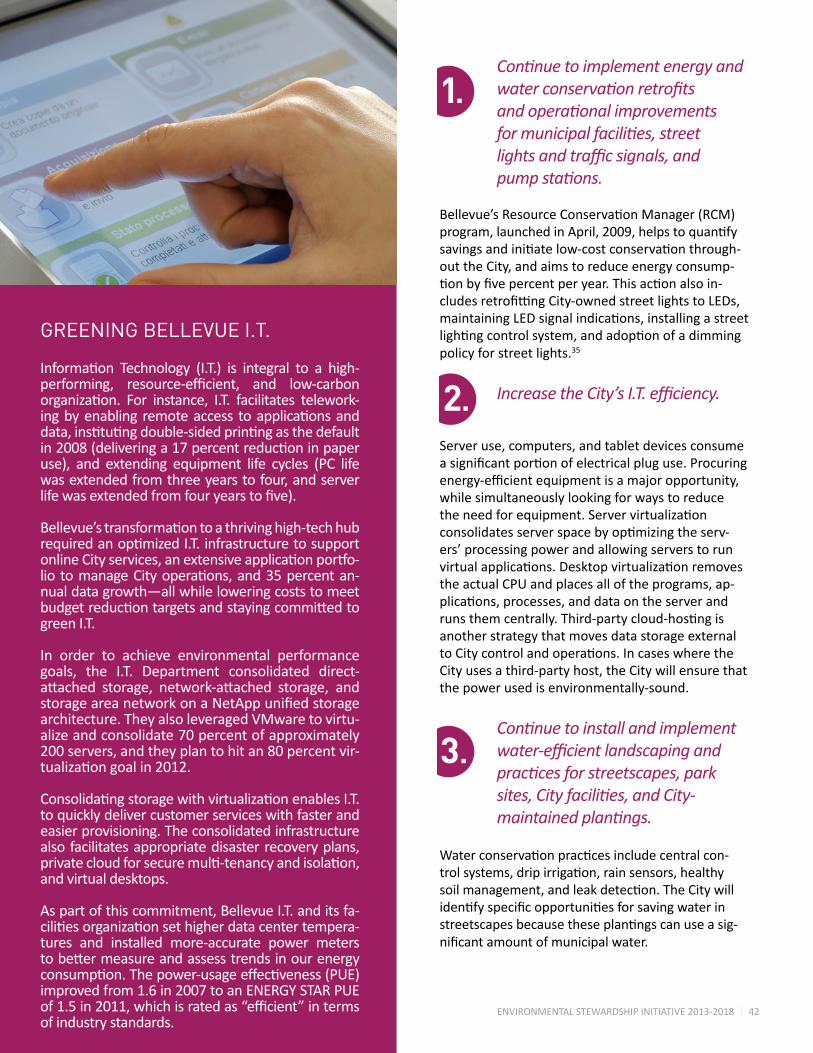
Continue to implement energy
Continue to implement energy and water conservation retrofits and operational improvements for municipal facilities, street lights and traffic signals, and pump stations.
Bellevue’sResourceConservationManager(RCM)program,launchedinApril,2009,helpstoquantifysavingsandinitiatelow-costconservationthrough-out the City, and aims to reduce energy consump-tionbyfivepercentperyear.Thisactionalsoin-cludesretrofittingCity-ownedstreetlightstoLEDs,maintainingLEDsignalindications,installingastreetlightingcontrolsystem,andadoptionofadimmingpolicy for street lights.35
Increase the City’s I.T. efficiency.
Server use, computers, and tablet devices consume asignificantportionofelectricalpluguse.Procuringenergy-efficientequipmentisamajoropportunity,while simultaneously looking for ways to reduce theneedforequipment.Servervirtualizationconsolidatesserverspacebyoptimizingtheserv-ers’ processing power and allowing servers to run virtualapplications.Desktopvirtualizationremovesthe actual CPU and places all of the programs, ap-plications,processes,anddataontheserverandrunsthemcentrally.Third-partycloud-hostingisanother strategy that moves data storage external toCitycontrolandoperations.IncaseswheretheCity uses a third-party host, the City will ensure that the power used is environmentally-sound.
Continue to install and implement water-efficient landscaping and practices for streetscapes, park sites, City facilities, and City- maintained plantings.
Waterconservationpracticesincludecentralcon-trolsystems,dripirrigation,rainsensors,healthysoilmanagement,andleakdetection.TheCitywillidentifyspecificopportunitiesforsavingwaterinstreetscapesbecausetheseplantingscanuseasig-nificantamount of municipal water.
GREENING BELLEVUE I.T.
Information Technology (I.T.) is integral to a high-performing, resource-efficient, and low-carbonorganization. For instance, I.T. facilitates telework-ingbyenabling remoteaccess toapplicationsanddata,institutingdouble-sidedprintingasthedefaultin2008(deliveringa17percentreductioninpaperuse), and extending equipment life cycles (PC lifewas extended from three years to four, and server lifewasextendedfromfouryearstofive).
Bellevue’stransformationtoathrivinghigh-techhubrequiredanoptimizedI.T.infrastructuretosupportonlineCityservices,anextensiveapplicationportfo-lio tomanageCityoperations,and35percentan-nual data growth—all while lowering costs to meet budgetreductiontargetsandstayingcommittedtogreen I.T.
In order to achieve environmental performance goals, the I.T. Department consolidated direct-attached storage, network-attached storage, andstorageareanetworkonaNetAppunifiedstoragearchitecture. They also leveraged VMware to virtu-alize and consolidate 70 percent of approximately 200 servers, and they plan to hit an 80 percent vir-tualizationgoalin2012.
ConsolidatingstoragewithvirtualizationenablesI.T.to quickly deliver customer services with faster and easier provisioning. The consolidated infrastructure also facilitates appropriate disaster recovery plans, privatecloudforsecuremulti-tenancyandisolation,and virtual desktops.
As part of this commitment, Bellevue I.T. and its fa-cilitiesorganizationsethigherdatacentertempera-tures and installed more-accurate power meters tobettermeasureandassesstrendsinourenergyconsumption.Thepower-usageeffectiveness(PUE)improved from 1.6 in 2007 to an ENERGY STAR PUE of1.5in2011,whichisratedas“efficient”intermsof industry standards.
1.
2.
3.

ENVIRONMENTAL STEWARDSHIP INITIATIVE 2013-2018 43
Operate and build City facilities accord-ing to established high performance standards of EPA’s ENERGY STAR and the USGBC’s Leadership in Energy & Environ-mental Design (LEED); pursue certifica-tion where feasible and prudent.
ThisactionwilloperateandbuildCityfacilitiesandsitesto meet the performance standards of ENERGY STAR certificationand/orLEED.36 Both ENERGY STAR and LEED offerhighperformanceguidelinesthattheCitycanlooktoinoperatingitsfacilitiesandsites.Byfollowingthesestandards,regardlessofwhetherCityfacilitiesactuallyarecertified,energyandwaterconservationwillincrease.Theadditionalstepofeithertypeofcertificationwillrecognizeeffortsandimpressiveachievements,aswellasleadbyexample for the community. Bellevue City Hall has twice earnedENERGYSTARcertification,in2008and2010.ItistheonlyCityfacilitythathasbeencertified,outofahandful
ofeligibleCityfacilities.TheBellevueMercerSloughEnvi-ronmentalEducationCenterwastheCity’sfirstand,atthetimeofpublication,onlyLEEDGold-certifiednewbuilding. Establish an internal Revolving Loan Fund (RLF) to capture savings from efficiency upgrades and fund new projects. Arevolvingloanfund(RLF)isapoolofmoneydesignatedforfundingcost-savingenergyefficiency,renewableenergy,orotherconservationmeasuresovertime.ARLFistypicallymanaged by an internal team, and monies are loaned to qualifiedapplicantsordepartmentswithinajurisdiction.Savings from projects are used to pay back the loan in a predeterminedtimeframe,therebymakingfundsavailableagain for new project investments.37
4.
5.
ENERGY DISCLOSURE FOR BUILDINGS:
Boosting the Value of Real Estate, Creating Jobs, and Reducing Energy
Many building owners and operators lack knowledge about the energy performanceoftheirbuildings.Makingthisinformationmoreaccessibleen-ables the market to factor energy performance into real estate leasing and investmentdecisions,facilitatingdemandforenergy-efficientbuildingsandcompetitiontoimproveenergyperformance.
AnanalysiscompletedbyIMTandthePoliticalEconomyResearchInstitute(PERI)attheUniversityofMassachusettsshowedthatanationwideenergydisclosure policy would:
• Reduce energy costs for building owners, consumers, and businesses byapproximately$3.8billionthrough2015andmorethan$18billion through 2020.
•Generatemorethan$7.8billioninprivateinvestmentinenergyefficiency measuresthrough2020,yielding$3to$4inenergycostsavingsforevery dollar invested.
•ReduceannualenergyconsumptionintheU.S.buildingsectorby approximately 0.2 quadrillion BTUs by 2020, equal to taking more than 3millioncarsofftheroadeachyear.
Majorcitiesandstatesnowrequirebuildingownersandoperatorstocomparatively rate theenergyperformanceof theirbuildingsanddisclosebuilding energy performance indicators to the marketplace.
As building owners and tenants increase their knowledge and improve their performance,ENERGYSTARcertificationismorelikelytobeachieved.Theav-erage sale premium is 2 to 5 percent higher for ENERGY STAR rated buildings.
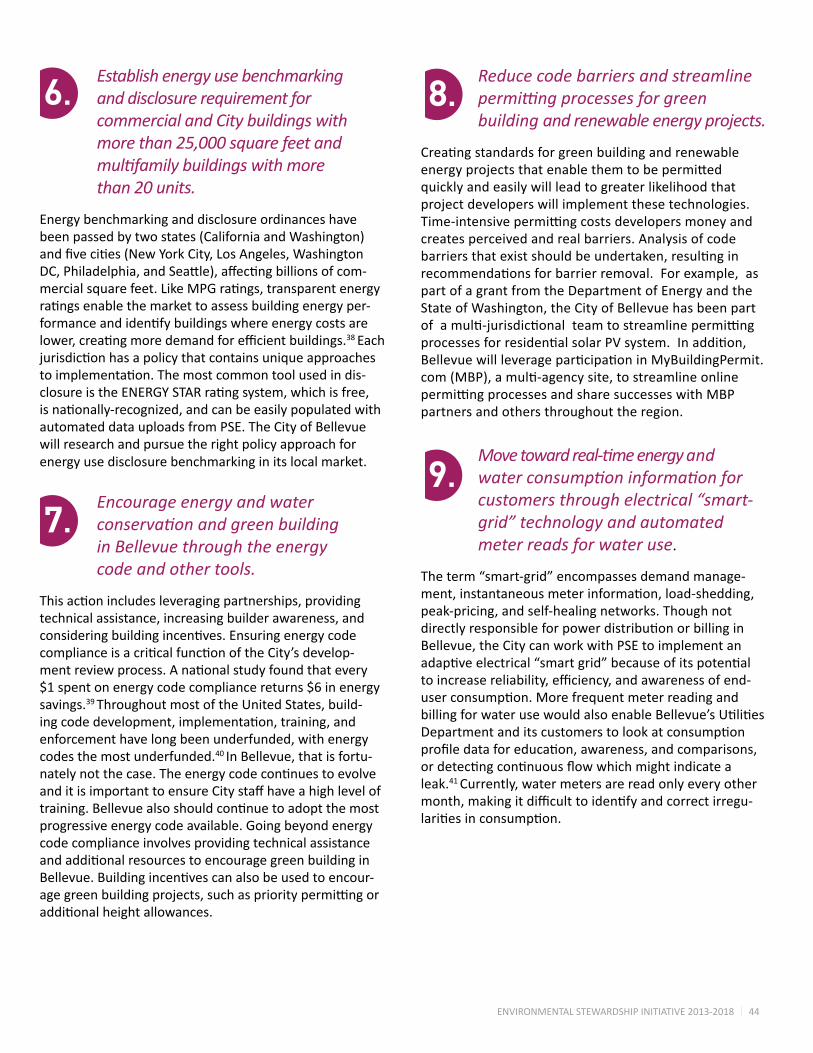
ENVIRONMENTAL STEWARDSHIP INITIATIVE 2013-2018 44
Establish energy use benchmarking and disclosure requirement for commercial and City buildings with more than 25,000 square feet and multifamily buildings with more than 20 units.
Energy benchmarking and disclosure ordinances have beenpassedbytwostates(CaliforniaandWashington)andfivecities(NewYorkCity,LosAngeles,WashingtonDC,Philadelphia,andSeattle),affectingbillionsofcom-mercialsquarefeet.LikeMPGratings,transparentenergyratingsenablethemarkettoassessbuildingenergyper-formanceandidentifybuildingswhereenergycostsarelower,creatingmoredemandforefficientbuildings.38 Each jurisdictionhasapolicythatcontainsuniqueapproachestoimplementation.Themostcommontoolusedindis-closureistheENERGYSTARratingsystem,whichisfree,isnationally-recognized,andcanbeeasilypopulatedwithautomated data uploads from PSE. The City of Bellevue will research and pursue the right policy approach for energy use disclosure benchmarking in its local market. Encourage energy and water conservation and green building in Bellevue through the energy code and other tools.
Thisactionincludesleveragingpartnerships,providingtechnical assistance, increasing builder awareness, and consideringbuildingincentives.EnsuringenergycodecomplianceisacriticalfunctionoftheCity’sdevelop-mentreviewprocess.Anationalstudyfoundthatevery$1spentonenergycodecompliancereturns$6inenergysavings.39 Throughout most of the United States, build-ingcodedevelopment,implementation,training,andenforcement have long been underfunded, with energy codes the most underfunded.40 In Bellevue, that is fortu-natelynotthecase.TheenergycodecontinuestoevolveanditisimportanttoensureCitystaffhaveahighleveloftraining.Bellevuealsoshouldcontinuetoadoptthemostprogressive energy code available. Going beyond energy code compliance involves providing technical assistance andadditionalresourcestoencouragegreenbuildinginBellevue.Buildingincentivescanalsobeusedtoencour-agegreenbuildingprojects,suchasprioritypermittingoradditionalheightallowances.
Reduce code barriers and streamline permitting processes for green building and renewable energy projects.
Creatingstandardsforgreenbuildingandrenewableenergyprojectsthatenablethemtobepermittedquickly and easily will lead to greater likelihood that project developers will implement these technologies. Time-intensivepermittingcostsdevelopersmoneyandcreates perceived and real barriers. Analysis of code barriersthatexistshouldbeundertaken,resultinginrecommendationsforbarrierremoval.Forexample,aspart of a grant from the Department of Energy and the State of Washington, the City of Bellevue has been part ofamulti-jurisdictionalteamtostreamlinepermittingprocessesforresidentialsolarPVsystem.Inaddition,BellevuewillleverageparticipationinMyBuildingPermit.com(MBP),amulti-agencysite,tostreamlineonlinepermittingprocessesandsharesuccesseswithMBPpartners and others throughout the region.
Move toward real-time energy and water consumption information for customers through electrical “smart- grid” technology and automated meter reads for water use. The term “smart-grid” encompasses demand manage-ment,instantaneousmeterinformation,load-shedding,peak-pricing, and self-healing networks. Though not directlyresponsibleforpowerdistributionorbillinginBellevue, the City can work with PSE to implement an adaptiveelectrical“smartgrid”becauseofitspotentialtoincreasereliability,efficiency,andawarenessofend-userconsumption.MorefrequentmeterreadingandbillingforwaterusewouldalsoenableBellevue’sUtilitiesDepartmentanditscustomerstolookatconsumptionprofiledataforeducation,awareness,andcomparisons,ordetectingcontinuousflowwhichmightindicatealeak.41 Currently, water meters are read only every other month,makingitdifficulttoidentifyandcorrectirregu-laritiesinconsumption.
6. 8.
7.
9.
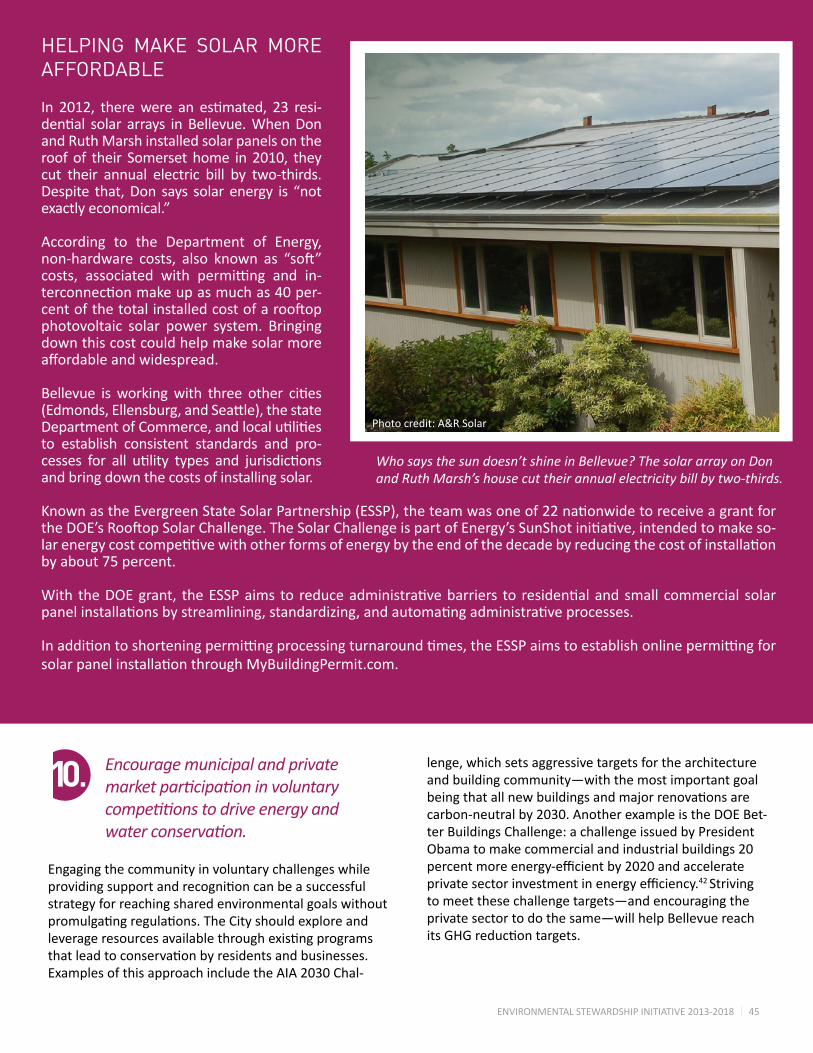
ENVIRONMENTAL STEWARDSHIP INITIATIVE 2013-2018 45
Encourage municipal and private market participation in voluntary competitions to drive energy and water conservation.
Engaging the community in voluntary challenges while providingsupportandrecognitioncanbeasuccessfulstrategy for reaching shared environmental goals without promulgatingregulations.TheCityshouldexploreandleverageresourcesavailablethroughexistingprogramsthatleadtoconservationbyresidentsandbusinesses.Examples of this approach include the AIA 2030 Chal-
lenge, which sets aggressive targets for the architecture and building community—with the most important goal beingthatallnewbuildingsandmajorrenovationsarecarbon-neutral by 2030. Another example is the DOE Bet-ter Buildings Challenge: a challenge issued by President Obama to make commercial and industrial buildings 20 percentmoreenergy-efficientby2020andaccelerateprivatesectorinvestmentinenergyefficiency.42 Striving to meet these challenge targets—and encouraging the private sector to do the same—will help Bellevue reach itsGHGreductiontargets.
HELPING MAKE SOLAR MORE AFFORDABLE
In 2012, therewere an estimated, 23 resi-dential solar arrays inBellevue.WhenDonand Ruth Marsh installed solar panels on the roof of their Somerset home in 2010, they cut their annual electric bill by two-thirds. Despite that, Don says solar energy is “not exactly economical.”
According to the Department of Energy, non-hardware costs, also known as “soft”costs, associated with permitting and in-terconnectionmakeupasmuchas40per-centofthetotalinstalledcostofarooftopphotovoltaic solar power system. Bringing down this cost could help make solar more affordableandwidespread.
Bellevue is workingwith three other cities(Edmonds,Ellensburg,andSeattle),thestateDepartmentofCommerce,andlocalutilitiesto establish consistent standards and pro-cesses for all utility types and jurisdictionsand bring down the costs of installing solar.
KnownastheEvergreenStateSolarPartnership(ESSP),theteamwasoneof22nationwidetoreceiveagrantfortheDOE’sRooftopSolarChallenge.TheSolarChallengeispartofEnergy’sSunShotinitiative,intendedtomakeso-larenergycostcompetitivewithotherformsofenergybytheendofthedecadebyreducingthecostofinstallationby about 75 percent.
With theDOEgrant, theESSPaims to reduceadministrativebarriers to residentialandsmall commercial solarpanelinstallationsbystreamlining,standardizing,andautomatingadministrativeprocesses.
Inadditiontoshorteningpermittingprocessingturnaroundtimes,theESSPaimstoestablishonlinepermittingforsolarpanelinstallationthroughMyBuildingPermit.com.
10.
Who says the sun doesn’t shine in Bellevue? The solar array on Don and Ruth Marsh’s house cut their annual electricity bill by two-thirds.
Photo credit: A&R Solar
ENVIRONMENTAL STEWARDSHIP INITIATIVE 2013-2018 46
Conduct community awareness programs to encourage energy and water conservation practices and renewable energy purchases.
Bellevue partnered with PSE and six neighboring cit-ies to implement a successful Home Energy Reports (HER)program(seenextpage).TheCitywillconsidera second phase to that program which would lever-age and build upon this success. For example, the City can work with PSE to increase community awareness ofrenewableenergyopportunities.Althoughmostwaterconservationoutreachisnowperformedbythe Cascade Water Alliance, the region’s water sup-plier,Bellevuewillcontinuetoencouragewatercon-servationthroughoutthecommunitywithpolicies,rates,andimplementationofoutreachandeducationprograms when resources allow.
Implement renewable energy proj-ects and study the potential for district energy sub-areas in Bellevue.
Technologiessuchassolarphotovoltaic(PV)electric-ity, solar hot water, geothermal, and biomass can generate local, renewable energy. District energy involves the piping of steam, or hot or cold water, such that a single central boiler and/or chiller plant can take the place of lots of smaller ones at individual buildings.43 There are more than 3,000 district energy systems in North America, most in older downtown coresandonmedical,educational,ormilitarycam-puses. Oneparticularlyexcitingapplicationofthisisusing waste heat to heat hydronic pipe loops shared betweenmultiplebuildings.Districtenergyprojectswould require developing an understanding of the potential,codes,andstandards,aswellasdeveloping(orpartneringtodevelop)expertiseonthetopic.
EASTSIDE SUSTAINABLEBUSINESS ALLIANCE
The Eastside Sustainable Business Alliance is a fusion of Eastside businesses, small and large, with a vision ofachievingsustainableoperationsandpositivecom-munity impacts. Created by businesses for businesses, ESBAofferstheopportunitytoworktogethertoleadour region toward the complementary goals of emis-sion reductions, enhanced economy, and superiorstewardship.
In addition to providing a forum for education, net-working,andcreativebrainstorming,ESBAfacilitatesprograms to help businesses work together with the community toward a greener future. Programs such as the Eastside Green Business Challenge motivatebusinessestorealizethefinancialcaseforgoinggreenwhile stimulating investments in local resourcesandclean technology.
TheChallenge is a friendly competitionamong localorganizationsandsevenEastsidecitiesthathelpspar-ticipantsreducethenaturalresourcestheyconsumeand thereby lower costs, enhance their brand, and im-prove our environment. In 2012, the Challenge helped participatingbusinesses save roughly$2millionandover 10,000 metric tons of CO2 emissions from energy savings alone.
11.
12.
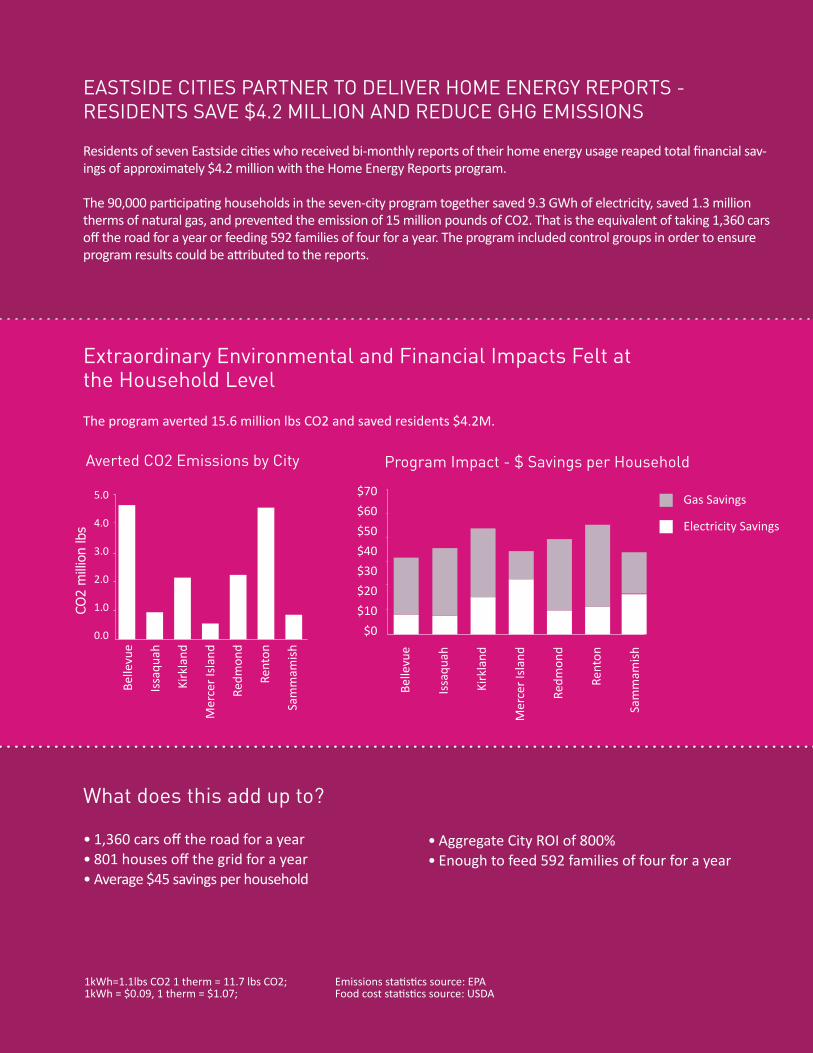
ENVIRONMENTAL STEWARDSHIP INITIATIVE 2013-2018 47
What does this add up to?
• 1,360carsofftheroadforayear• 801housesoffthegridforayear• Average$45savingsperhousehold
• AggregateCityROIof800%• Enough to feed 592 families of four for a year
EASTSIDE CITIES PARTNER TO DELIVER HOME ENERGY REPORTS - RESIDENTS SAVE $4.2 MILLION AND REDUCE GHG EMISSIONS
ResidentsofsevenEastsidecitieswhoreceivedbi-monthlyreportsoftheirhomeenergyusagereapedtotalfinancialsav-ingsofapproximately$4.2millionwiththeHomeEnergyReportsprogram.
The90,000participatinghouseholdsintheseven-cityprogramtogethersaved9.3GWhofelectricity,saved1.3milliontherms of natural gas, and prevented the emission of 15 million pounds of CO2. That is the equivalent of taking 1,360 cars offtheroadforayearorfeeding592familiesoffourforayear.Theprogramincludedcontrolgroupsinordertoensureprogramresultscouldbeattributedtothereports.
1kWh=1.1lbsCO21therm=11.7lbsCO2;1kWh=$0.09,1therm=$1.07;
Emissionsstatisticssource:EPAFoodcoststatisticssource:USDA
Extraordinary Environmental and Financial Impacts Felt at the Household Level
Theprogramaverted15.6millionlbsCO2andsavedresidents$4.2M.
Averted CO2 Emissions by City Program Impact - $ Savings per Household
$70
$60
$50
$40
$30
$20
$10
$0
Gas Savings
Electricity Savings
Belle
vue
Issa
quah
Kirk
land
Mer
cer
Isla
nd
Redm
ond
Rent
on
Sam
mam
ish
5.0
4.0
3.0
2.0
1.0
0.0
Belle
vue
Issa
quah
Kirk
land
Mer
cer
Isla
nd
Redm
ond
Rent
on
Sam
mam
ish
CO2
mill
ion
lbs

ENVIRONMENTAL STEWARDSHIP INITIATIVE 2013-2018 48
GHG EMISSIONSMATERIALS MANAGEMENT & WASTE
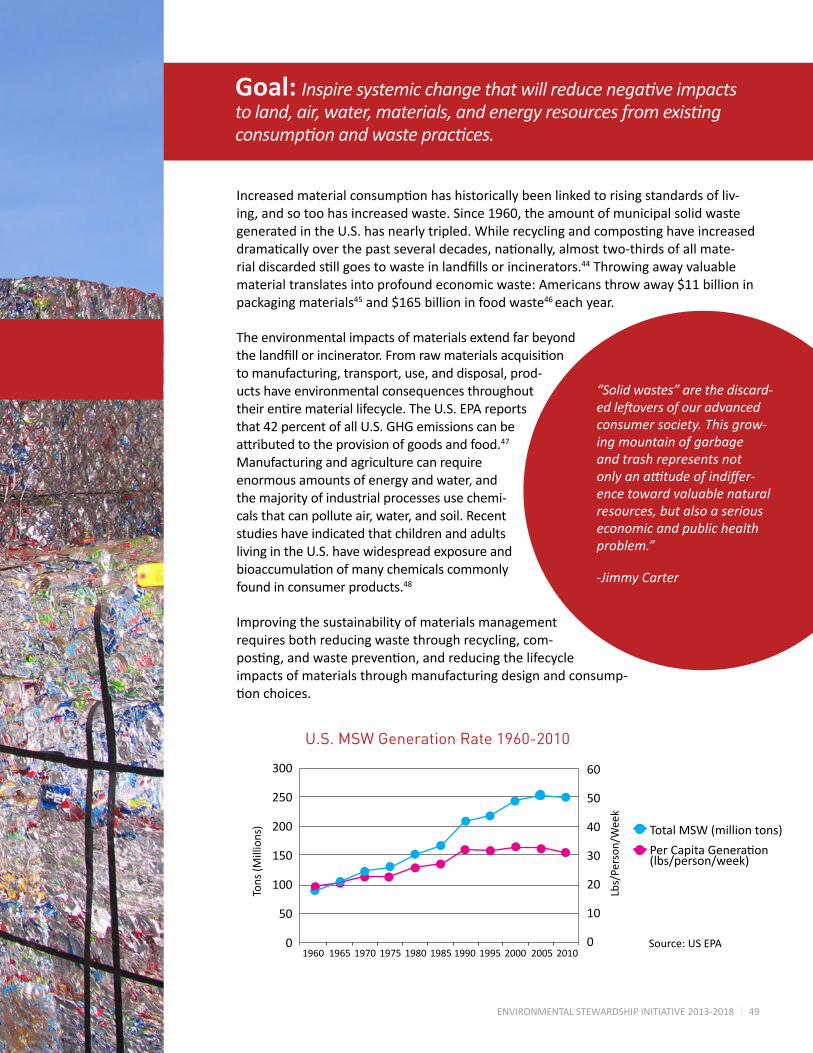
ENVIRONMENTAL STEWARDSHIP INITIATIVE 2013-2018 49
Increasedmaterialconsumptionhashistoricallybeenlinkedtorisingstandardsofliv-ing, and so too has increased waste. Since 1960, the amount of municipal solid waste generatedintheU.S.hasnearlytripled.Whilerecyclingandcompostinghaveincreaseddramaticallyoverthepastseveraldecades,nationally,almosttwo-thirdsofallmate-rialdiscardedstillgoestowasteinlandfillsorincinerators.44 Throwing away valuable materialtranslatesintoprofoundeconomicwaste:Americansthrowaway$11billioninpackaging materials45and$165billioninfoodwaste46 each year.
The environmental impacts of materials extend far beyond thelandfillorincinerator.Fromrawmaterialsacquisitionto manufacturing, transport, use, and disposal, prod-ucts have environmental consequences throughout theirentiremateriallifecycle.TheU.S.EPAreportsthat 42 percent of all U.S. GHG emissions can be attributedtotheprovisionofgoodsandfood.47 Manufacturing and agriculture can require enormous amounts of energy and water, and the majority of industrial processes use chemi-cals that can pollute air, water, and soil. Recent studies have indicated that children and adults living in the U.S. have widespread exposure and bioaccumulationofmanychemicalscommonlyfound in consumer products.48
Improving the sustainability of materials management requires both reducing waste through recycling, com-posting,andwasteprevention,andreducingthelifecycleimpacts of materials through manufacturing design and consump-tionchoices.
Goal: Inspire systemic change that will reduce negative impacts to land, air, water, materials, and energy resources from existing consumption and waste practices.
“Solid wastes” are the discard-ed leftovers of our advanced consumer society. This grow-ing mountain of garbage and trash represents not only an attitude of indiffer-ence toward valuable natural resources, but also a serious economic and public health problem.”
-Jimmy Carter
300
250
200
150
100
50
0
60
50
40
30
20
10
0
Tons(M
illions)
Lbs/
Pers
on/W
eek
U.S. MSW Generation Rate 1960-2010
TotalMSW(milliontons)
PerCapitaGeneration(lbs/person/week)
1960 1965 1970 1975 1980 1985 1990 1995 2000 2005 2010Source: US EPA
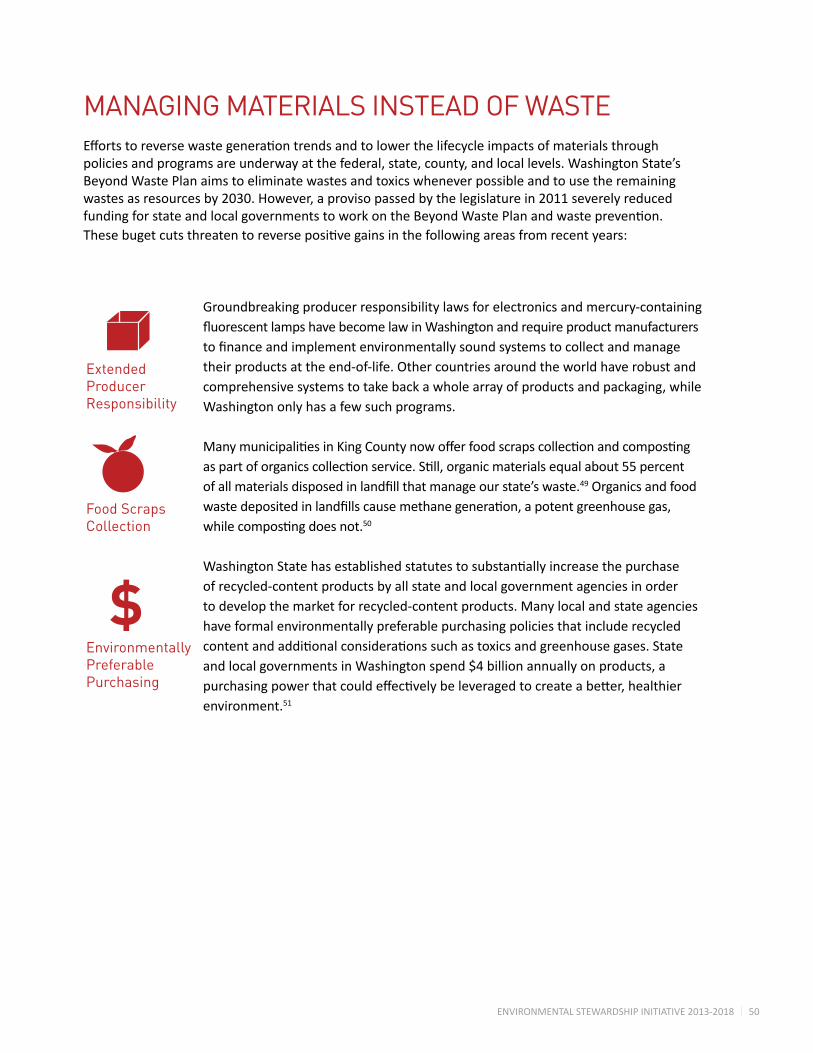
ENVIRONMENTAL STEWARDSHIP INITIATIVE 2013-2018 50
MANAGING MATERIALS INSTEAD OF WASTEEffortstoreversewastegenerationtrendsandtolowerthelifecycleimpactsofmaterialsthroughpolicies and programs are underway at the federal, state, county, and local levels. Washington State’s Beyond Waste Plan aims to eliminate wastes and toxics whenever possible and to use the remaining wastes as resources by 2030. However, a proviso passed by the legislature in 2011 severely reduced fundingforstateandlocalgovernmentstoworkontheBeyondWastePlanandwasteprevention.Thesebugetcutsthreatentoreversepositivegainsinthefollowingareasfromrecentyears:
Groundbreaking producer responsibility laws for electronics and mercury-containing fluorescentlampshavebecomelawinWashingtonandrequireproductmanufacturers tofinanceandimplementenvironmentallysoundsystemstocollectandmanage their products at the end-of-life. Other countries around the world have robust and comprehensive systems to take back a whole array of products and packaging, while Washington only has a few such programs.
ManymunicipalitiesinKingCountynowofferfoodscrapscollectionandcomposting aspartoforganicscollectionservice.Still,organicmaterialsequalabout55percent ofallmaterialsdisposedinlandfillthatmanageourstate’swaste.49 Organics and food wastedepositedinlandfillscausemethanegeneration,apotentgreenhousegas, whilecompostingdoesnot.50
WashingtonStatehasestablishedstatutestosubstantiallyincreasethepurchase of recycled-content products by all state and local government agencies in order to develop the market for recycled-content products. Many local and state agencies have formal environmentally preferable purchasing policies that include recycled contentandadditionalconsiderationssuchastoxicsandgreenhousegases.State andlocalgovernmentsinWashingtonspend$4billionannuallyonproducts,a purchasingpowerthatcouldeffectivelybeleveragedtocreateabetter,healthier environment.51
Extended Producer Responsibility
Food Scraps Collection
Environmentally Preferable Purchasing
$
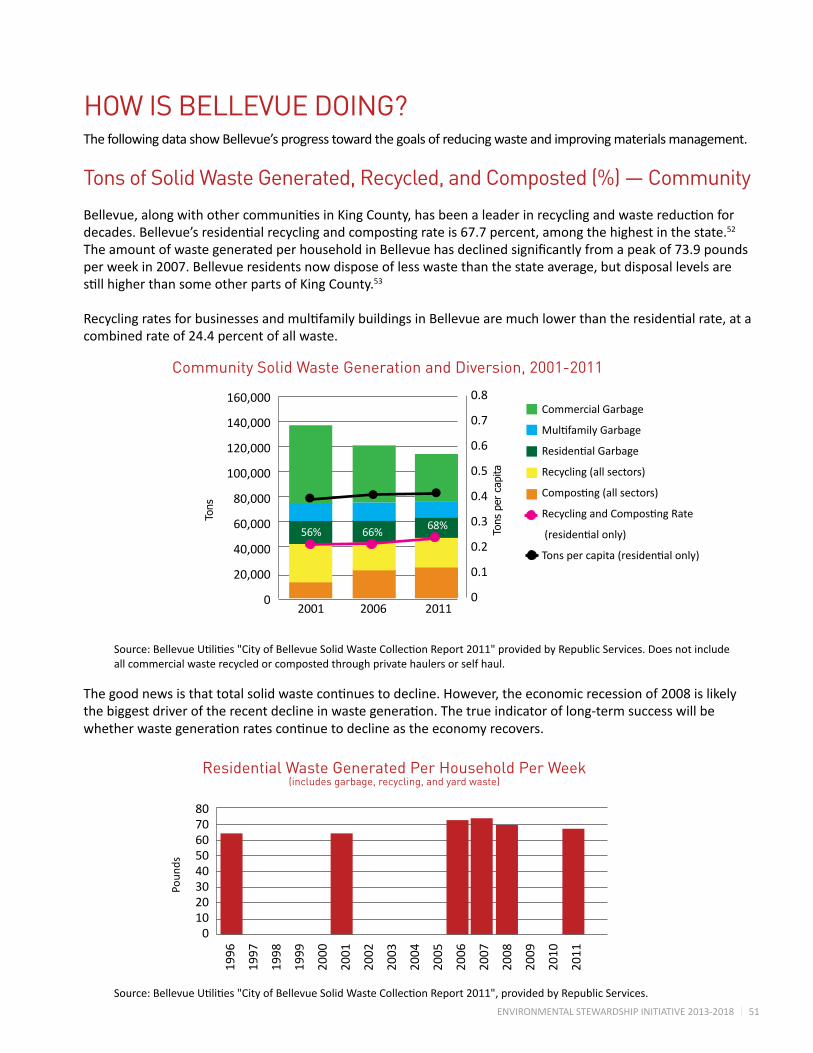
ENVIRONMENTAL STEWARDSHIP INITIATIVE 2013-2018 51
HOW IS BELLEVUE DOING?The following data show Bellevue’s progress toward the goals of reducing waste and improving materials management. Tons of Solid Waste Generated, Recycled, and Composted (%) — Community
Bellevue,alongwithothercommunitiesinKingCounty,hasbeenaleaderinrecyclingandwastereductionfordecades.Bellevue’sresidentialrecyclingandcompostingrateis67.7percent,amongthehighestinthestate.52 TheamountofwastegeneratedperhouseholdinBellevuehasdeclinedsignificantlyfromapeakof73.9poundsper week in 2007. Bellevue residents now dispose of less waste than the state average, but disposal levels are stillhigherthansomeotherpartsofKingCounty.53
RecyclingratesforbusinessesandmultifamilybuildingsinBellevuearemuchlowerthantheresidentialrate,atacombined rate of 24.4 percent of all waste.
Thegoodnewsisthattotalsolidwastecontinuestodecline.However,theeconomicrecessionof2008islikelythebiggestdriveroftherecentdeclineinwastegeneration.Thetrueindicatoroflong-termsuccesswillbewhetherwastegenerationratescontinuetodeclineastheeconomyrecovers.
Poun
ds
8070605040302010
0
Residential Waste Generated Per Household Per Week (includes garbage, recycling, and yard waste)
1996
1997
1998
1999
2000
2001
2002
2003
2004
2005
2006
2007
2008
2009
2010
2011
160,000
140,000
120,000
100,000
80,000
60,000
40,000
20,000
0
Tons
2001 2006 2011
Commercial Garbage
MultifamilyGarbage
ResidentialGarbage
Recycling(allsectors)
Composting(allsectors)
RecyclingandCompostingRate
(residentialonly)
Tonspercapita(residentialonly)
Community Solid Waste Generation and Diversion, 2001-2011
56% 66% 68%
Source:BellevueUtilities"CityofBellevueSolidWasteCollectionReport2011",providedbyRepublicServices.
Source:BellevueUtilities"CityofBellevueSolidWasteCollectionReport2011"providedbyRepublicServices.Doesnotincludeall commercial waste recycled or composted through private haulers or self haul.
Tons
per
cap
ita
0.8
0.7
0.6
0.5
0.4
0.3
0.2
0.1
0
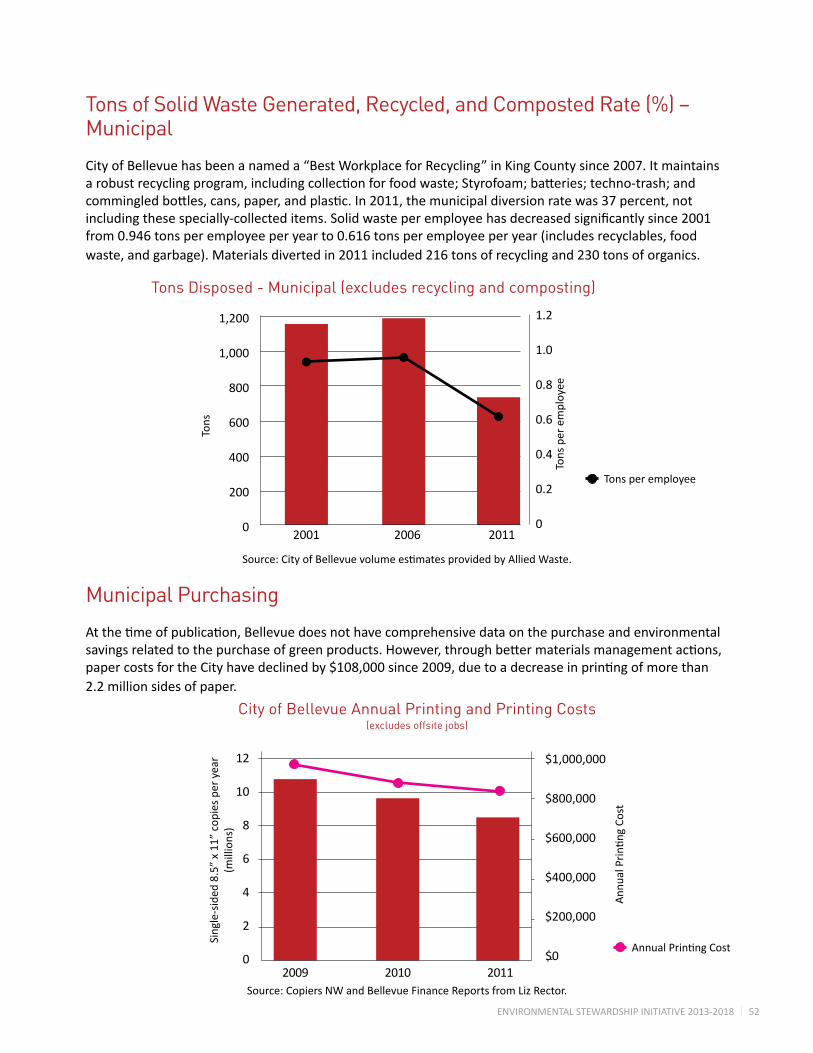
ENVIRONMENTAL STEWARDSHIP INITIATIVE 2013-2018 52
Tons of Solid Waste Generated, Recycled, and Composted Rate (%) – Municipal
City of Bellevue has been a named a “Best Workplace for Recycling” in King County since 2007. It maintains arobustrecyclingprogram,includingcollectionforfoodwaste;Styrofoam;batteries;techno-trash;andcommingledbottles,cans,paper,andplastic.In2011,themunicipaldiversionratewas37percent,notincludingthesespecially-collecteditems.Solidwasteperemployeehasdecreasedsignificantlysince2001from0.946tonsperemployeeperyearto0.616tonsperemployeeperyear(includesrecyclables,foodwaste,andgarbage).Materialsdivertedin2011included216tonsofrecyclingand230tonsoforganics.
Municipal Purchasing
Atthetimeofpublication,Bellevuedoesnothavecomprehensivedataonthepurchaseandenvironmentalsavingsrelatedtothepurchaseofgreenproducts.However,throughbettermaterialsmanagementactions,papercostsfortheCityhavedeclinedby$108,000since2009,duetoadecreaseinprintingofmorethan2.2 million sides of paper.
1,200
1,000
800
600
400
200
0
Tons
2001 2006 2011
Tons Disposed - Municipal (excludes recycling and composting)
$1,000,000
$800,000
$600,000
$400,000
$200,000
$0
12
10
8
6
4
2
0
Sing
le-s
ided
8.5
” x
11”
copi
es p
er y
ear
(millions)
Ann
ualPrinti
ngCost
2009 2010 2011
City of Bellevue Annual Printing and Printing Costs (excludes offsite jobs)
Tons per employee
1.2
1.0
0.8
0.6
0.4
0.2
0
Tons
per
em
ploy
eeSource:CityofBellevuevolumeestimatesprovidedbyAlliedWaste.
Source: Copiers NW and Bellevue Finance Reports from Liz Rector.
AnnualPrintingCost
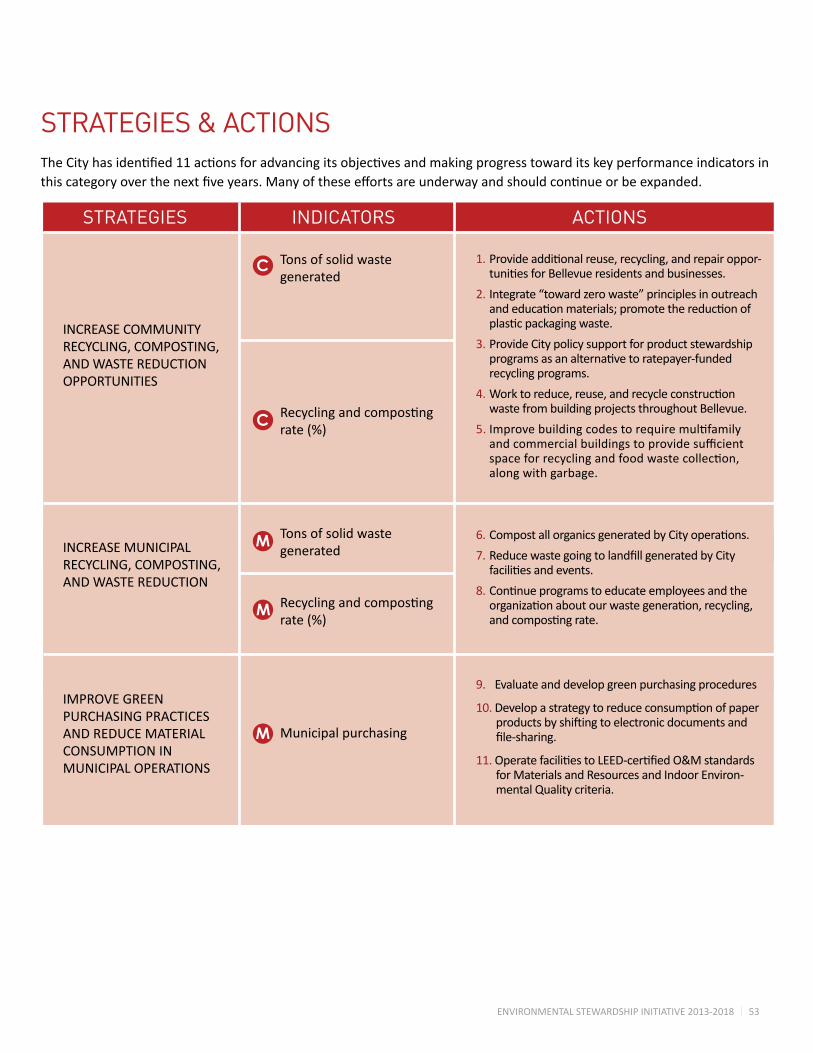
ENVIRONMENTAL STEWARDSHIP INITIATIVE 2013-2018 53
STRATEGIES & ACTIONSTheCityhasidentified11actionsforadvancingitsobjectivesandmakingprogresstowarditskeyperformanceindicatorsinthiscategoryoverthenextfiveyears.Manyoftheseeffortsareunderwayandshouldcontinueorbeexpanded.
INCREASE COMMUNITY RECYCLING, COMPOSTING, AND WASTE REDUCTION OPPORTUNITIES
INCREASE MUNICIPAL RECYCLING, COMPOSTING, AND WASTE REDUCTION
IMPROVE GREEN PURCHASING PRACTICES AND REDUCE MATERIAL CONSUMPTION IN MUNICIPAL OPERATIONS
Tons of solid waste generated
Recyclingandcompostingrate(%)
Tons of solid waste generated
Recyclingandcompostingrate(%)
Municipal purchasing
M
M
C
C
M
STRATEGIES INDICATORS ACTIONS
1. Provideadditionalreuse,recycling,andrepairoppor-tunitiesforBellevueresidentsandbusinesses.
2. Integrate “toward zero waste” principles in outreach andeducationmaterials;promotethereductionofplasticpackagingwaste.
3. Provide City policy support for product stewardship programsasanalternativetoratepayer-fundedrecycling programs.
4. Worktoreduce,reuse,andrecycleconstructionwaste from building projects throughout Bellevue.
5. Improvebuildingcodestorequiremultifamilyandcommercialbuildingstoprovidesufficientspaceforrecyclingandfoodwastecollection,along with garbage.
6. CompostallorganicsgeneratedbyCityoperations.
7. ReducewastegoingtolandfillgeneratedbyCityfacilitiesandevents.
8. Continueprogramstoeducateemployeesandtheorganizationaboutourwastegeneration,recycling,andcompostingrate.
9. Evaluate and develop green purchasing procedures
10. Developastrategytoreduceconsumptionofpaperproductsbyshiftingtoelectronicdocumentsandfile-sharing.
11. OperatefacilitiestoLEED-certifiedO&Mstandardsfor Materials and Resources and Indoor Environ-mental Quality criteria.
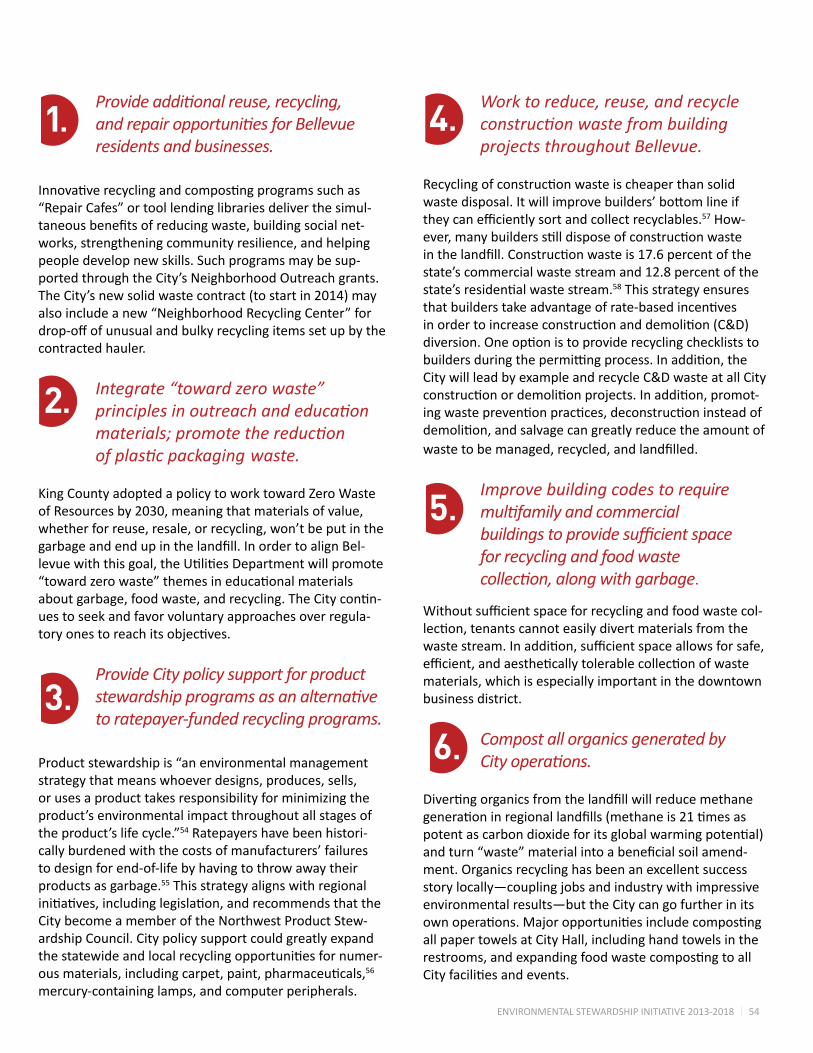
ENVIRONMENTAL STEWARDSHIP INITIATIVE 2013-2018 54
Provide additional reuse, recycling, and repair opportunities for Bellevue residents and businesses.
Innovativerecyclingandcompostingprogramssuchas“Repair Cafes” or tool lending libraries deliver the simul-taneousbenefitsofreducingwaste,buildingsocialnet-works, strengthening community resilience, and helping people develop new skills. Such programs may be sup-ported through the City’s Neighborhood Outreach grants. TheCity’snewsolidwastecontract(tostartin2014)mayalso include a new “Neighborhood Recycling Center” for drop-offofunusualandbulkyrecyclingitemssetupbythecontracted hauler.
Integrate “toward zero waste” principles in outreach and education materials; promote the reduction of plastic packaging waste.
King County adopted a policy to work toward Zero Waste of Resources by 2030, meaning that materials of value, whether for reuse, resale, or recycling, won’t be put in the garbageandendupinthelandfill.InordertoalignBel-levuewiththisgoal,theUtilitiesDepartmentwillpromote“towardzerowaste”themesineducationalmaterialsaboutgarbage,foodwaste,andrecycling.TheCitycontin-ues to seek and favor voluntary approaches over regula-toryonestoreachitsobjectives.
Provide City policy support for product stewardship programs as an alternative to ratepayer-funded recycling programs.
Product stewardship is “an environmental management strategy that means whoever designs, produces, sells, or uses a product takes responsibility for minimizing the product’s environmental impact throughout all stages of the product’s life cycle.”54 Ratepayers have been histori-cally burdened with the costs of manufacturers’ failures to design for end-of-life by having to throw away their products as garbage.55 This strategy aligns with regional initiatives,includinglegislation,andrecommendsthattheCity become a member of the Northwest Product Stew-ardship Council. City policy support could greatly expand thestatewideandlocalrecyclingopportunitiesfornumer-ousmaterials,includingcarpet,paint,pharmaceuticals,56 mercury-containing lamps, and computer peripherals.
Work to reduce, reuse, and recycle construction waste from building projects throughout Bellevue.
Recyclingofconstructionwasteischeaperthansolidwastedisposal.Itwillimprovebuilders’bottomlineiftheycanefficientlysortandcollectrecyclables.57 How-ever,manybuildersstilldisposeofconstructionwasteinthelandfill.Constructionwasteis17.6percentofthestate’s commercial waste stream and 12.8 percent of the state’sresidentialwastestream.58 This strategy ensures thatbuilderstakeadvantageofrate-basedincentivesinordertoincreaseconstructionanddemolition(C&D)diversion.Oneoptionistoproviderecyclingcheckliststobuildersduringthepermittingprocess.Inaddition,theCity will lead by example and recycle C&D waste at all City constructionordemolitionprojects.Inaddition,promot-ingwastepreventionpractices,deconstructioninsteadofdemolition,andsalvagecangreatlyreducetheamountofwastetobemanaged,recycled,andlandfilled.
Improve building codes to require multifamily and commercial buildings to provide sufficient space for recycling and food waste collection, along with garbage.
Withoutsufficientspaceforrecyclingandfoodwastecol-lection,tenantscannoteasilydivertmaterialsfromthewastestream.Inaddition,sufficientspaceallowsforsafe,efficient,andaestheticallytolerablecollectionofwastematerials, which is especially important in the downtown business district. Compost all organics generated by City operations.
Divertingorganicsfromthelandfillwillreducemethanegenerationinregionallandfills(methaneis21timesaspotentascarbondioxideforitsglobalwarmingpotential)andturn“waste”materialintoabeneficialsoilamend-ment. Organics recycling has been an excellent success story locally—coupling jobs and industry with impressive environmental results—but the City can go further in its ownoperations.Majoropportunitiesincludecompostingall paper towels at City Hall, including hand towels in the restrooms,andexpandingfoodwastecompostingtoallCityfacilitiesandevents.
1.
2.
4.
5.
3.
6.
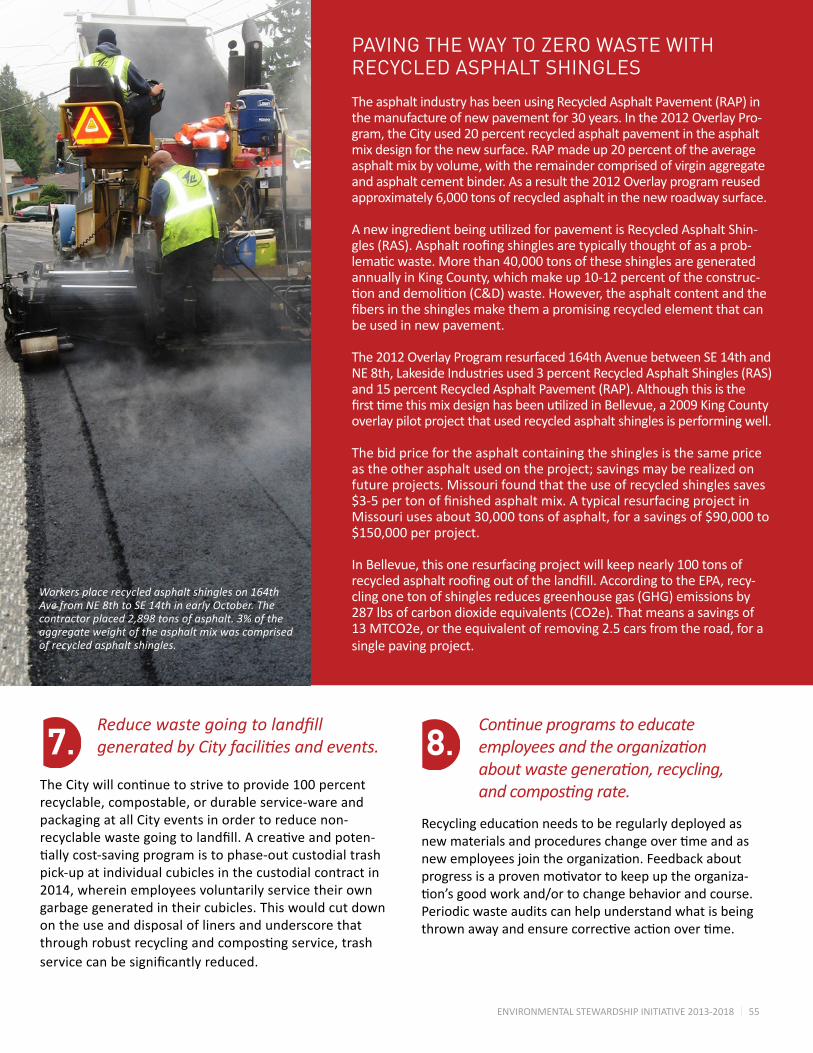
ENVIRONMENTAL STEWARDSHIP INITIATIVE 2013-2018 55
Reduce waste going to landfill generated by City facilities and events.
TheCitywillcontinuetostrivetoprovide100percentrecyclable, compostable, or durable service-ware and packaging at all City events in order to reduce non-recyclablewastegoingtolandfill.Acreativeandpoten-tiallycost-savingprogramistophase-outcustodialtrashpick-up at individual cubicles in the custodial contract in 2014, wherein employees voluntarily service their own garbage generated in their cubicles. This would cut down on the use and disposal of liners and underscore that throughrobustrecyclingandcompostingservice,trashservicecanbesignificantlyreduced.
Continue programs to educate employees and the organization about waste generation, recycling, and composting rate.
Recyclingeducationneedstoberegularlydeployedasnewmaterialsandprocedureschangeovertimeandasnewemployeesjointheorganization.Feedbackaboutprogressisaprovenmotivatortokeepuptheorganiza-tion’sgoodworkand/ortochangebehaviorandcourse.Periodic waste audits can help understand what is being thrownawayandensurecorrectiveactionovertime.
PAVING THE WAY TO ZERO WASTE WITH RECYCLED ASPHALT SHINGLES
TheasphaltindustryhasbeenusingRecycledAsphaltPavement(RAP)inthe manufacture of new pavement for 30 years. In the 2012 Overlay Pro-gram, the City used 20 percent recycled asphalt pavement in the asphalt mix design for the new surface. RAP made up 20 percent of the average asphalt mix by volume, with the remainder comprised of virgin aggregate and asphalt cement binder. As a result the 2012 Overlay program reused approximately 6,000 tons of recycled asphalt in the new roadway surface.
AnewingredientbeingutilizedforpavementisRecycledAsphaltShin-gles(RAS).Asphaltroofingshinglesaretypicallythoughtofasaprob-lematicwaste.Morethan40,000tonsoftheseshinglesaregeneratedannually in King County, which make up 10-12 percent of the construc-tionanddemolition(C&D)waste.However,theasphaltcontentandthefibersintheshinglesmakethemapromisingrecycledelementthatcanbe used in new pavement.
The 2012 Overlay Program resurfaced 164th Avenue between SE 14th and NE8th,LakesideIndustriesused3percentRecycledAsphaltShingles(RAS)and15percentRecycledAsphaltPavement(RAP).AlthoughthisisthefirsttimethismixdesignhasbeenutilizedinBellevue,a2009KingCountyoverlay pilot project that used recycled asphalt shingles is performing well.
The bid price for the asphalt containing the shingles is the same price astheotherasphaltusedontheproject;savingsmayberealizedonfuture projects. Missouri found that the use of recycled shingles saves $3-5pertonoffinishedasphaltmix.AtypicalresurfacingprojectinMissouriusesabout30,000tonsofasphalt,forasavingsof$90,000to$150,000perproject.
In Bellevue, this one resurfacing project will keep nearly 100 tons of recycledasphaltroofingoutofthelandfill.AccordingtotheEPA,recy-clingonetonofshinglesreducesgreenhousegas(GHG)emissionsby287lbsofcarbondioxideequivalents(CO2e).Thatmeansasavingsof13 MTCO2e, or the equivalent of removing 2.5 cars from the road, for a single paving project.
7.
Workers place recycled asphalt shingles on 164th Ave from NE 8th to SE 14th in early October. The contractor placed 2,898 tons of asphalt. 3% of the aggregate weight of the asphalt mix was comprised of recycled asphalt shingles.
8.
ENVIRONMENTAL STEWARDSHIP INITIATIVE 2013-2018 56
Evaluate and develop green purchasing procedures.
Green purchasing procedures, coupled with an educa-tionalandoutreacheffort,willhelpCitydepartmentsconsiderenvironmentalfactorswhenbuyingcommoditiessuch as paper, paint, chemicals, computers, appliances, fuel,energy,furniture,compostamendments,andofficesupplies. Green procurement doesn’t necessarily require extra cost or in some cases can be less expensive than traditionalproducts.59 Green procurement also strives to reduce the amount of material purchased through reuse, salvage, maintenance, repair, new technologies, and smarterprocesses.Manyjurisdictionsnationwidehaveimplemented green procurement policies and programs and the City can either replicate this criteria and/or pig-gyback on available contracts executed by the City of Seattle,KingCounty,ortheStateofWashington.
Develop a strategy to reduce consumption of paper products by shifting to electronic documents and file-sharing.
ThisactionincludesidentifyingmajorareasofpaperconsumptionattheCityandsavingsopportunitiessuchasfieldinspections,SecurePrint,Councilpackets,BudgetOne,andcontractrouting.Aninterdepartmentalteamwillworktoidentifyandremovebarrierstopaperre-duction.Inaddition,staffwillcontinuetoworkwiththecopier service provider to collect data and report to the organizationonmonthlyandannualpaper-useimpacts.
9.
ENVIRONMENTALLY PREFERABLE PURCHASING SAVED KING COUNTY $1.54 MILLION IN 2011
Environmentally preferable purchasing (EPP) is de-finedby theUSEPAaspurchasingofproductsandservices“havingalesserorreducedeffectonhumanhealth and the environment when compared with competing products that serve the same purpose.This comparison may consider raw materials acquisi-tion,production,manufacturing,packaging,distribu-tion, reuse, operation,maintenance, or disposal ofthe product.”
King County’s Environmentally Preferable Products PurchasingPolicy(KCC18.20),originallyestablishedin 1989, was updated in 2011 to include revisions forpaperreductionandthepurchaseof100percentrecycled paper, as well as electronics recycling and reportingrequirements.TheamendedpolicydirectsCounty agencies to buy environmentally preferable products“wheneverpracticable.”
In2011,KingCountyagenciespurchased$60millionworth of environmentally preferable products, saving $1.54millioncomparedtothecostofconventionalproducts. The savings are both the result of reduced initial purchase cost and avoided replacement costduetodurability.Often,thereareadditionalsavingsachieved through less maintenance or reduced energyandwateruseovertime.
10.
ENVIRONMENTAL STEWARDSHIP INITIATIVE 2013-2018 57
Operate facilities to LEED-certified O&M standards for Materials and Resources and Indoor Environmental Quality criteria.
LEED is an industry benchmark for green buildings and operations.PrerequisitesforLEEDO&MwithinMateri-als and Resources and Indoor Environmental Quality are adoptionofaSustainablePurchasingPolicy,SolidWasteManagementPolicy,andGreenCleaningPolicy(policieswhich align well with other ESI strategies recommended inthiscategory).FollowingtheO&MLEEDchecklistwillhelpCityfacilitiesalongthepathtoachievingaLEEDrating(whenandiftheCityseekstocertifyitsfacilities).Additionally,documentingtheCity’sexistinghazardouschemicalpracticesandproceduresingreaterdetailwillidentifyopportunitiesforimprovement.Withinthisac-tion,theCitywillalsoconsiderthird-partycertificationsuch as EnviroStars for hazardous and solid waste pre-ventionandmanagement.
11.
ON THE PATH TO PAPERLESS
In October 2011, Bellevue implemented Phase 1 of a digital permit application system for submissionof the electrical, mechanical, and plumbing permits that require plan review called “Paperless Permit-ting.” Applicants can submit their forms online 24hoursadayandhavetheprocessingstaffreviewtheapplicationmaterialsandsendrevisionrequestsallonline. 35 percent of all permits now occur online. AfterthePhase2implementationoftheremainingpermittypesinJuly2013,theCityanticipatesthatatleast50percentofallapplicationswilloccuronlinewithin one year.
ThePhase1implementationhasimprovedthecus-tomer experience by reducing the reviewing process forsomeapplications.Inaddition,applicantsarere-alizingareductionoftheirexpensesandresourcesby not having to submit multiple paper copies oftheplansetsandotherrelateddocuments.Anesti-mated 322,000 24”x36” sheets and 76,500 8.5”x11” sheets will be saved annually once the 50 percent electronicsubmissionlevelisachieved.Collectively,97,500 miles previously required for permits will not be driven. Bellevue’s Paperless Permitting reducescommunity emissions by 46 MTCO2 annually and savesapplicantsover$600,000 inprintingandfuelcosts,*notincludingthecostsoftraveltimeorcostsavingsfromimprovedprocessingtimes.
*Assumes$0.30persquarefootofprintingand$0.10per 8.5”x11”sheet;plus$3.50infuelcosts

ENVIRONMENTAL STEWARDSHIP INITIATIVE 2013-2018 58
ECOSYSTEMS & OPEN SPACES ECOSYSTEMS & OPEN SPACES

ENVIRONMENTAL STEWARDSHIP INITIATIVE 2013-2018 59
Healthyfunctioningecosystemsprovidecleanair,drinkablewater,food,recreation,stormwatermanagement,inspiration,andqualityoflife,aswellashabitatforotherspecies.Richnaturalresourcesandlandscapeshaveenticedmanyresidentsandbusi-nesses to call Bellevue home.
Urbantreecanopiesactasanaturalspongeandfilterfordrenchingrainsandrun-off,providing millions of dollars worth of stormwater management services. They provide oxygenfortheplanet,aplaygroundforadventuroushikers,andabufferforurbannoiseandvisualpollution.Developmentprojectsthatresultintreelossrobthecommunityofallofthesecriticalassets,particularlywhenthereisnoreplacementplan. Beyondthetreesthemselves,vegetationandsoilsin natural areas reduce the velocity, tempera-ture,andamountofwaterflowduringstorms.Hard surfaces such as asphalt and pavement increasestreamscouring,pollution,andtemperature loads. Water temperature is the number one impairment for waterways in Washington State, with pathogens being second. Impervious surface area in Bellevue is 46 percent60 of total land area – a value that exceeds the accepted threshold for stream channel stability.61
Salmonstillmigratefromfreshwatertosaltwater in the Northwest, and play a vital role in a long and fragile food web. Yet some species are in serious decline. Throughout Puget Sound, only 22 ofatleast37historicChinookpopulationsremain.Theremaining Chinook salmon are at only 10 percent of their historic numbers, with some down lower than 1 percent.62
Since1967theaveragepopulationof20NorthAmericancommonbirdssurveyedintheU.S.hasfallenby68percent,from17.6millionto5.35million;someindividualspecies dived as much as 80 percent.63 A variety of factors–including reduced habitat, agricultural development, house cats, and glass skyscrapers–have contributed to the dramaticdeclineofcommonbirdsinNorthAmerica.Warmingglobaltemperaturesthreaten to push avian species out of their normal territories, causing further stress in the future.
Goal: Repair the integrity of natural systems in and around Bel-levue to the highest of standards, which will allow residents, fish, and wildlife to thrive.
For a planting cost of $250 - $600, a single street tree provides over $90,000 of direct benefits (not including aesthetic, social and natural) in the lifetime of the tree. -Dan Burden, Co-Founder Walkable Communities, November, 2008
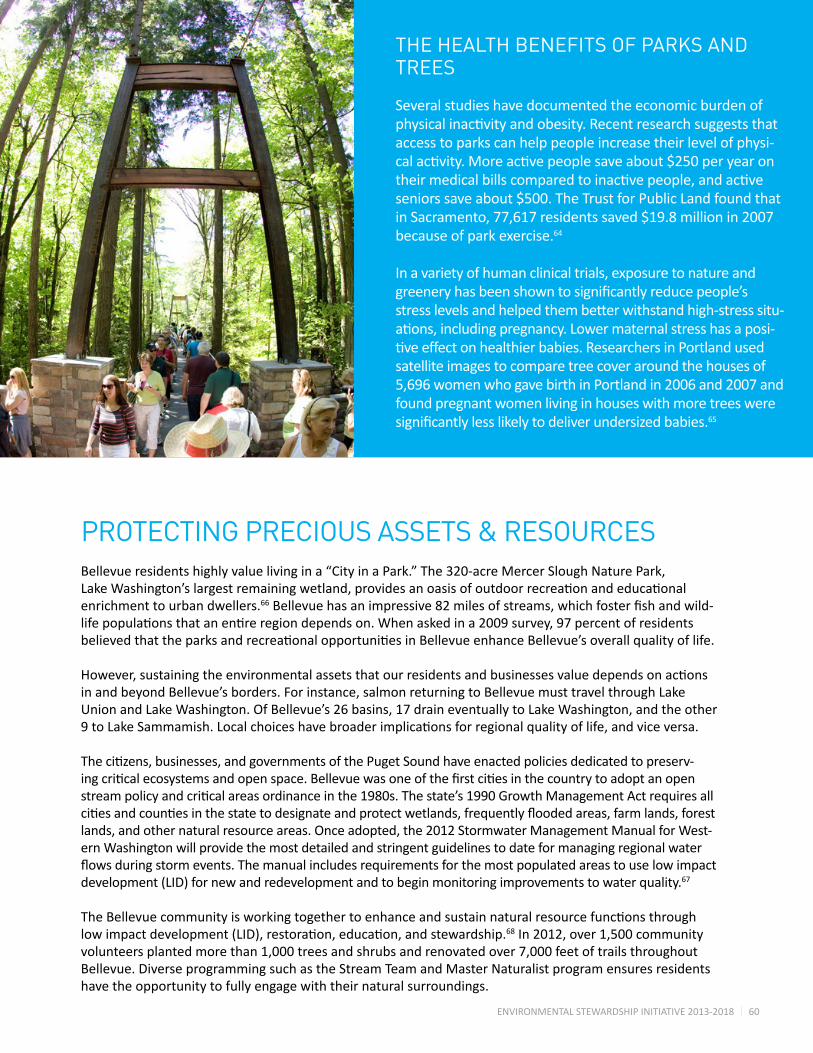
ENVIRONMENTAL STEWARDSHIP INITIATIVE 2013-2018 60
PROTECTING PRECIOUS ASSETS & RESOURCESBellevue residents highly value living in a “City in a Park.” The 320-acre Mercer Slough Nature Park, LakeWashington’slargestremainingwetland,providesanoasisofoutdoorrecreationandeducationalenrichment to urban dwellers.66Bellevuehasanimpressive82milesofstreams,whichfosterfishandwild-lifepopulationsthatanentireregiondependson.Whenaskedina2009survey,97percentofresidentsbelievedthattheparksandrecreationalopportunitiesinBellevueenhanceBellevue’soverallqualityoflife. However,sustainingtheenvironmentalassetsthatourresidentsandbusinessesvaluedependsonactionsin and beyond Bellevue’s borders. For instance, salmon returning to Bellevue must travel through Lake Union and Lake Washington. Of Bellevue’s 26 basins, 17 drain eventually to Lake Washington, and the other 9toLakeSammamish.Localchoiceshavebroaderimplicationsforregionalqualityoflife,andviceversa. Thecitizens,businesses,andgovernmentsofthePugetSoundhaveenactedpoliciesdedicatedtopreserv-ingcriticalecosystemsandopenspace.Bellevuewasoneofthefirstcitiesinthecountrytoadoptanopenstreampolicyandcriticalareasordinanceinthe1980s.Thestate’s1990GrowthManagementActrequiresallcitiesandcountiesinthestatetodesignateandprotectwetlands,frequentlyfloodedareas,farmlands,forestlands, and other natural resource areas. Once adopted, the 2012 Stormwater Management Manual for West-ern Washington will provide the most detailed and stringent guidelines to date for managing regional water flowsduringstormevents.Themanualincludesrequirementsforthemostpopulatedareastouselowimpactdevelopment(LID)fornewandredevelopmentandtobeginmonitoringimprovementstowaterquality.67 TheBellevuecommunityisworkingtogethertoenhanceandsustainnaturalresourcefunctionsthroughlowimpactdevelopment(LID),restoration,education,andstewardship.68 In 2012, over 1,500 community volunteers planted more than 1,000 trees and shrubs and renovated over 7,000 feet of trails throughout Bellevue. Diverse programming such as the Stream Team and Master Naturalist program ensures residents have the opportunity to fully engage with their natural surroundings.
THE HEALTH BENEFITS OF PARKS AND TREES
Several studies have documented the economic burden of physicalinactivityandobesity.Recentresearchsuggeststhataccess to parks can help people increase their level of physi-calactivity.Moreactivepeoplesaveabout$250peryearontheirmedicalbillscomparedtoinactivepeople,andactiveseniorssaveabout$500.TheTrustforPublicLandfoundthatinSacramento,77,617residentssaved$19.8millionin2007because of park exercise.64
In a variety of human clinical trials, exposure to nature and greeneryhasbeenshowntosignificantlyreducepeople’sstresslevelsandhelpedthembetterwithstandhigh-stresssitu-ations,includingpregnancy.Lowermaternalstresshasaposi-tiveeffectonhealthierbabies.ResearchersinPortlandusedsatellite images to compare tree cover around the houses of 5,696 women who gave birth in Portland in 2006 and 2007 and found pregnant women living in houses with more trees were significantlylesslikelytodeliverundersizedbabies.65
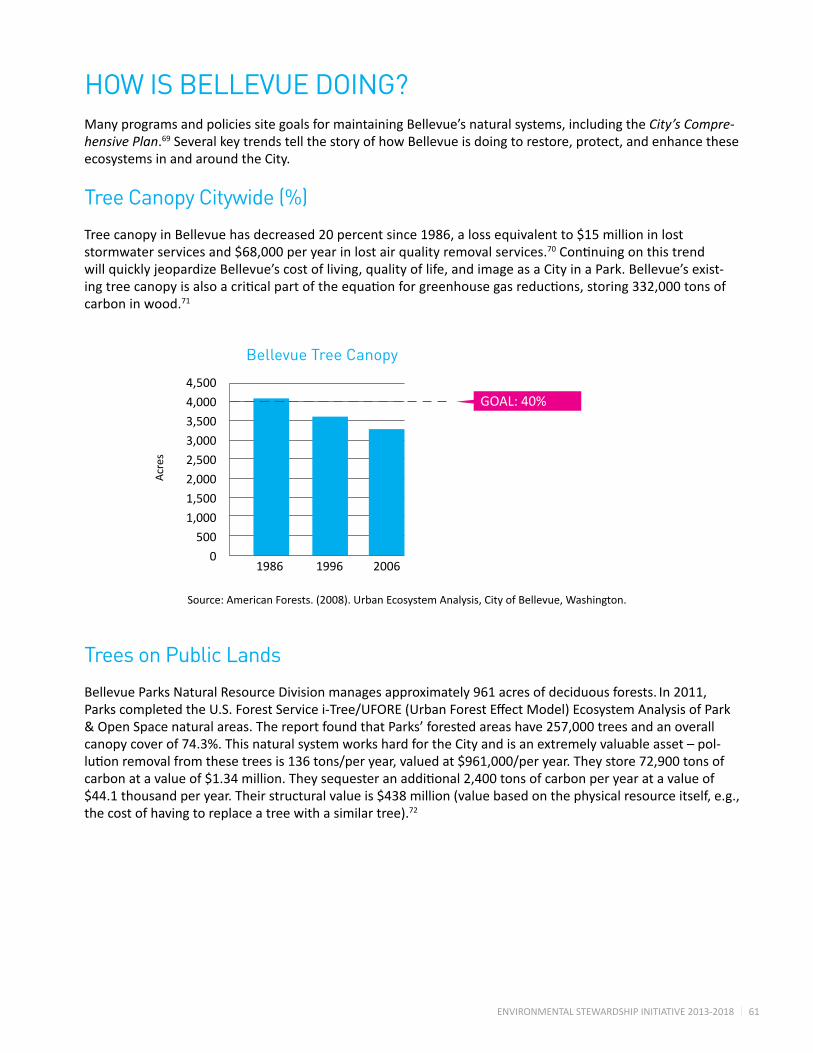
ENVIRONMENTAL STEWARDSHIP INITIATIVE 2013-2018 61
HOW IS BELLEVUE DOING?Many programs and policies site goals for maintaining Bellevue’s natural systems, including the City’s Compre-hensive Plan.69 Several key trends tell the story of how Bellevue is doing to restore, protect, and enhance these ecosystems in and around the City.
Tree Canopy Citywide (%) TreecanopyinBellevuehasdecreased20percentsince1986,alossequivalentto$15millioninloststormwaterservicesand$68,000peryearinlostairqualityremovalservices.70Continuingonthistrendwill quickly jeopardize Bellevue’s cost of living, quality of life, and image as a City in a Park. Bellevue’s exist-ingtreecanopyisalsoacriticalpartoftheequationforgreenhousegasreductions,storing332,000tonsofcarbon in wood.71
Trees on Public Lands Bellevue Parks Natural Resource Division manages approximately 961 acres of deciduous forests. In 2011, ParkscompletedtheU.S.ForestServicei-Tree/UFORE(UrbanForestEffectModel)EcosystemAnalysisofPark& Open Space natural areas. The report found that Parks’ forested areas have 257,000 trees and an overall canopycoverof74.3%.ThisnaturalsystemworkshardfortheCityandisanextremelyvaluableasset–pol-lutionremovalfromthesetreesis136tons/peryear,valuedat$961,000/peryear.Theystore72,900tonsofcarbonatavalueof$1.34million.Theysequesteranadditional2,400tonsofcarbonperyearatavalueof$44.1thousandperyear.Theirstructuralvalueis$438million(valuebasedonthephysicalresourceitself,e.g.,thecostofhavingtoreplaceatreewithasimilartree).72
1986 1996 2006
4,500
4,000
3,500
3,000
2,500
2,000
1,500
1,000
500
0
GOAL:40%
Bellevue Tree Canopy
Acr
es
Source:AmericanForests.(2008).UrbanEcosystemAnalysis,CityofBellevue,Washington.
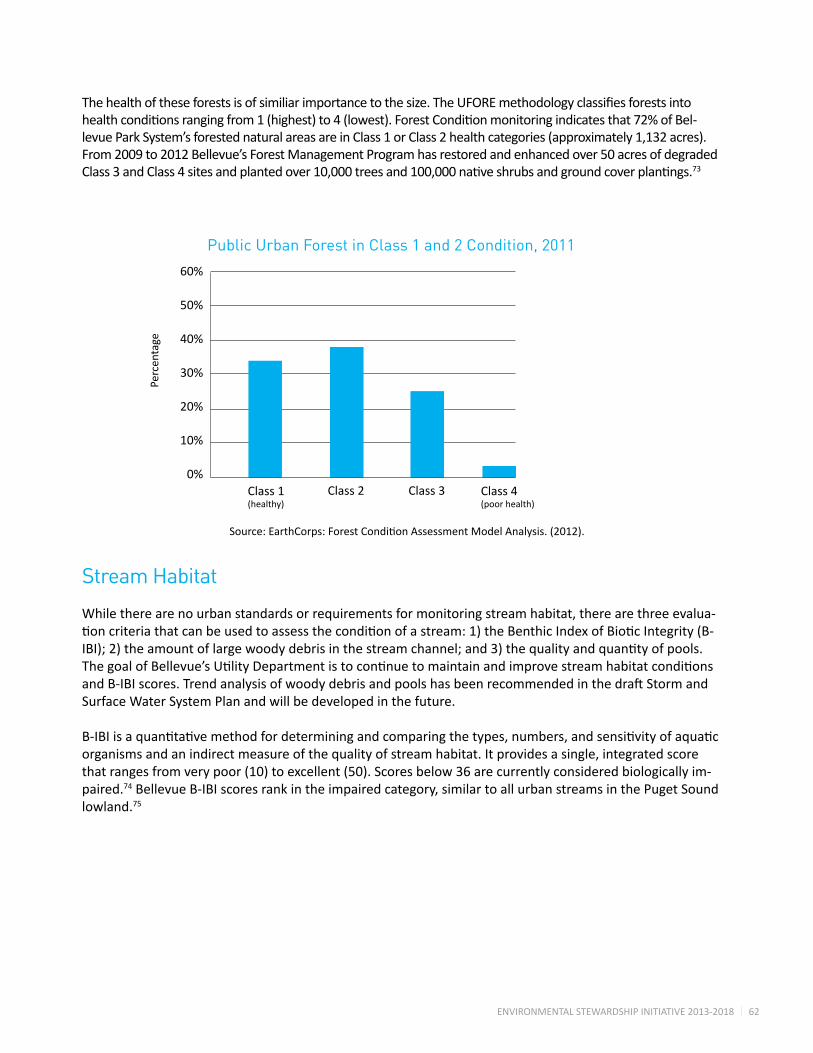
ENVIRONMENTAL STEWARDSHIP INITIATIVE 2013-2018 62
Thehealthoftheseforestsisofsimiliarimportancetothesize.TheUFOREmethodologyclassifiesforestsintohealthconditionsrangingfrom1(highest)to4(lowest).ForestConditionmonitoringindicatesthat72%ofBel-levueParkSystem’sforestednaturalareasareinClass1orClass2healthcategories(approximately1,132acres).From 2009 to 2012 Bellevue’s Forest Management Program has restored and enhanced over 50 acres of degraded Class3andClass4sitesandplantedover10,000treesand100,000nativeshrubsandgroundcoverplantings.73
Stream Habitat
While there are no urban standards or requirements for monitoring stream habitat, there are three evalua-tioncriteriathatcanbeusedtoassesstheconditionofastream:1)theBenthicIndexofBioticIntegrity(B-IBI);2)theamountoflargewoodydebrisinthestreamchannel;and3)thequalityandquantityofpools.ThegoalofBellevue’sUtilityDepartmentistocontinuetomaintainandimprovestreamhabitatconditionsandB-IBIscores.TrendanalysisofwoodydebrisandpoolshasbeenrecommendedinthedraftStormandSurface Water System Plan and will be developed in the future.
B-IBIisaquantitativemethodfordeterminingandcomparingthetypes,numbers,andsensitivityofaquaticorganisms and an indirect measure of the quality of stream habitat. It provides a single, integrated score thatrangesfromverypoor(10)toexcellent(50).Scoresbelow36arecurrentlyconsideredbiologicallyim-paired.74 Bellevue B-IBI scores rank in the impaired category, similar to all urban streams in the Puget Sound lowland.75
Public Urban Forest in Class 1 and 2 Condition, 2011
Perc
enta
ge
Class 1 (healthy)
Class 2 Class 3 Class 4(poorhealth)
60%
50%
40%
30%
20%
10%
0%
Source:EarthCorps:ForestConditionAssessmentModelAnalysis.(2012).
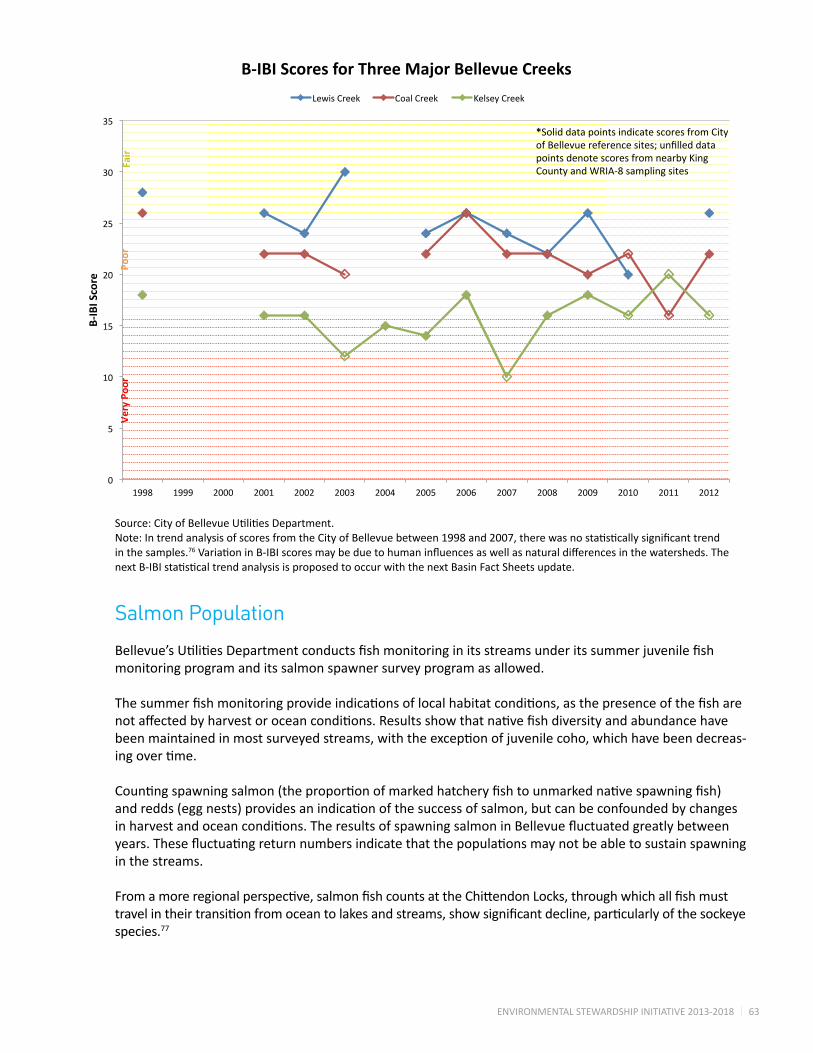
ENVIRONMENTAL STEWARDSHIP INITIATIVE 2013-2018 63
Salmon Population Bellevue’sUtilitiesDepartmentconductsfishmonitoringinitsstreamsunderitssummerjuvenilefishmonitoring program and its salmon spawner survey program as allowed.
Thesummerfishmonitoringprovideindicationsoflocalhabitatconditions,asthepresenceofthefisharenotaffectedbyharvestoroceanconditions.Resultsshowthatnativefishdiversityandabundancehavebeenmaintainedinmostsurveyedstreams,withtheexceptionofjuvenilecoho,whichhavebeendecreas-ingovertime.
Countingspawningsalmon(theproportionofmarkedhatcheryfishtounmarkednativespawningfish)andredds(eggnests)providesanindicationofthesuccessofsalmon,butcanbeconfoundedbychangesinharvestandoceanconditions.TheresultsofspawningsalmoninBellevuefluctuatedgreatlybetweenyears.Thesefluctuatingreturnnumbersindicatethatthepopulationsmaynotbeabletosustainspawningin the streams.
Fromamoreregionalperspective,salmonfishcountsattheChittendonLocks,throughwhichallfishmusttravelintheirtransitionfromoceantolakesandstreams,showsignificantdecline,particularlyofthesockeyespecies.77
Source:CityofBellevueUtilitiesDepartment.Note:IntrendanalysisofscoresfromtheCityofBellevuebetween1998and2007,therewasnostatisticallysignificanttrendin the samples.76VariationinB-IBIscoresmaybeduetohumaninfluencesaswellasnaturaldifferencesinthewatersheds.ThenextB-IBIstatisticaltrendanalysisisproposedtooccurwiththenextBasinFactSheetsupdate.
0
5
10
15
20
25
30
35
1998 1999 2000 2001 2002 2003 2004 2005 2006 2007 2008 2009 2010 2011 2012
B-‐IBI Score
B-‐IBI Scores for Three Major Bellevue Creeks
Lewis Creek Coal Creek Kelsey Creek
*Solid data points indicate scores from City of Bellevue reference sites; unfilled data points denote scores from nearby King County and WRIA-‐8 sampling sites
Very Po
or
Poor
Fair
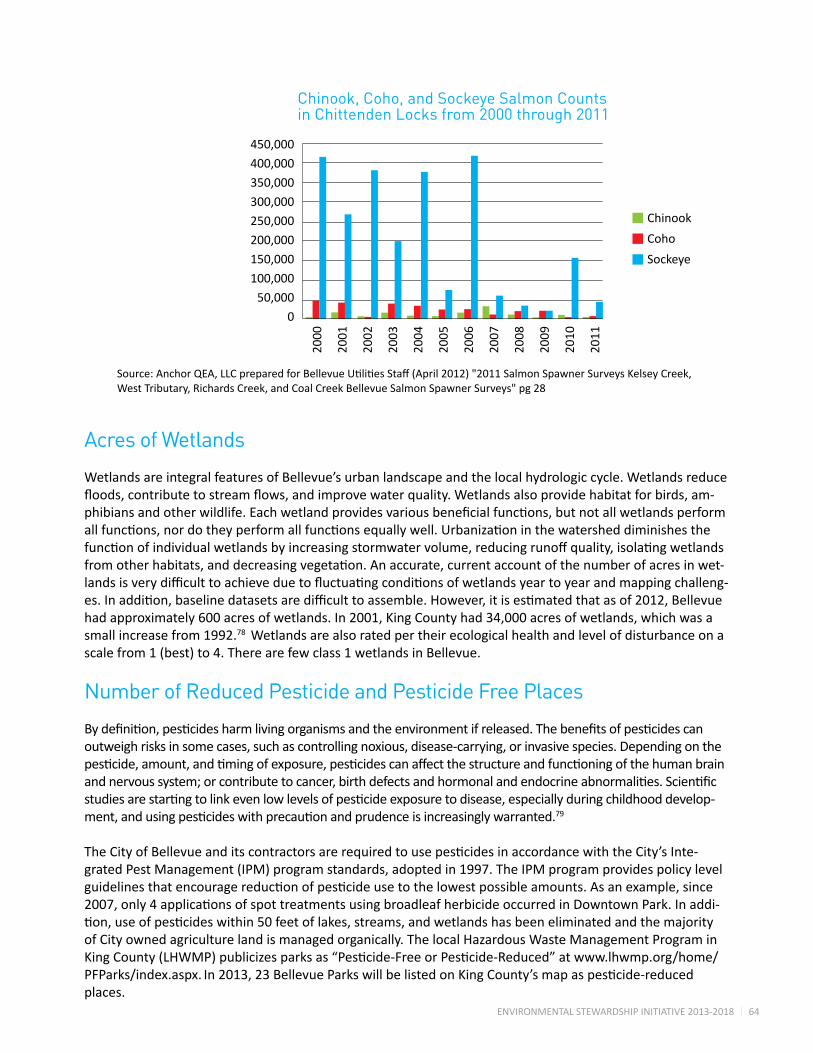
ENVIRONMENTAL STEWARDSHIP INITIATIVE 2013-2018 64
Acres of Wetlands
Wetlands are integral features of Bellevue’s urban landscape and the local hydrologic cycle. Wetlands reduce floods,contributetostreamflows,andimprovewaterquality.Wetlandsalsoprovidehabitatforbirds,am-phibiansandotherwildlife.Eachwetlandprovidesvariousbeneficialfunctions,butnotallwetlandsperformallfunctions,nordotheyperformallfunctionsequallywell.Urbanizationinthewatersheddiminishesthefunctionofindividualwetlandsbyincreasingstormwatervolume,reducingrunoffquality,isolatingwetlandsfromotherhabitats,anddecreasingvegetation.Anaccurate,currentaccountofthenumberofacresinwet-landsisverydifficulttoachieveduetofluctuatingconditionsofwetlandsyeartoyearandmappingchalleng-es.Inaddition,baselinedatasetsaredifficulttoassemble.However,itisestimatedthatasof2012,Bellevuehad approximately 600 acres of wetlands. In 2001, King County had 34,000 acres of wetlands, which was a small increase from 1992.78 Wetlands are also rated per their ecological health and level of disturbance on a scalefrom1(best)to4.Therearefewclass1wetlandsinBellevue.
Number of Reduced Pesticide and Pesticide Free Places
Bydefinition,pesticidesharmlivingorganismsandtheenvironmentifreleased.Thebenefitsofpesticidescanoutweigh risks in some cases, such as controlling noxious, disease-carrying, or invasive species. Depending on the pesticide,amount,andtimingofexposure,pesticidescanaffectthestructureandfunctioningofthehumanbrainandnervoussystem;orcontributetocancer,birthdefectsandhormonalandendocrineabnormalities.Scientificstudiesarestartingtolinkevenlowlevelsofpesticideexposuretodisease,especiallyduringchildhooddevelop-ment,andusingpesticideswithprecautionandprudenceisincreasinglywarranted.79
TheCityofBellevueanditscontractorsarerequiredtousepesticidesinaccordancewiththeCity’sInte-gratedPestManagement(IPM)programstandards,adoptedin1997.TheIPMprogramprovidespolicylevelguidelinesthatencouragereductionofpesticideusetothelowestpossibleamounts.Asanexample,since2007,only4applicationsofspottreatmentsusingbroadleafherbicideoccurredinDowntownPark.Inaddi-tion,useofpesticideswithin50feetoflakes,streams,andwetlandshasbeeneliminatedandthemajorityof City owned agriculture land is managed organically. The local Hazardous Waste Management Program in KingCounty(LHWMP)publicizesparksas“Pesticide-FreeorPesticide-Reduced”atwww.lhwmp.org/home/PFParks/index.aspx. In2013,23BellevueParkswillbelistedonKingCounty’smapaspesticide-reducedplaces.
450,000
400,000
350,000
300,000
250,000
200,000
150,000
100,000
50,000
0
Chinook, Coho, and Sockeye Salmon Counts in Chittenden Locks from 2000 through 2011
2000
2001
2002
2003
2004
2005
2006
2007
2008
2009
2010
2011
Chinook
Coho
Sockeye
Source:AnchorQEA,LLCpreparedforBellevueUtilitiesStaff(April2012)"2011SalmonSpawnerSurveysKelseyCreek,WestTributary,RichardsCreek,andCoalCreekBellevueSalmonSpawnerSurveys"pg28
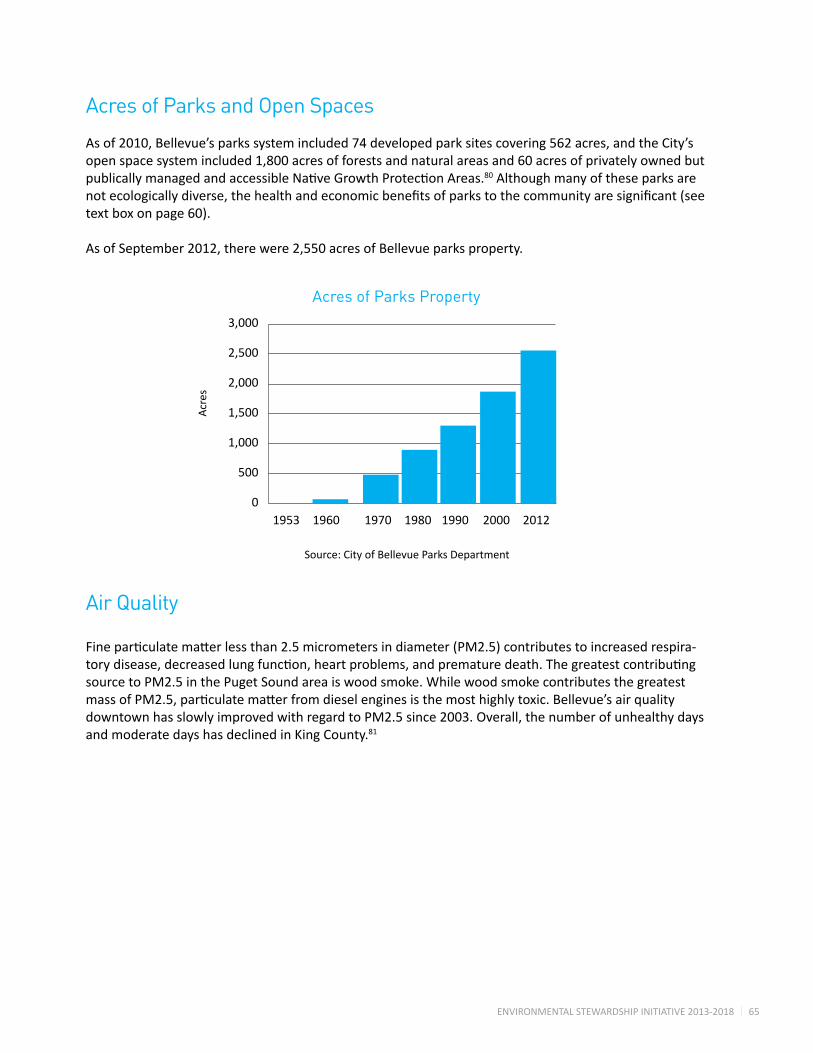
ENVIRONMENTAL STEWARDSHIP INITIATIVE 2013-2018 65
Acres of Parks and Open Spaces
As of 2010, Bellevue’s parks system included 74 developed park sites covering 562 acres, and the City’s open space system included 1,800 acres of forests and natural areas and 60 acres of privately owned but publicallymanagedandaccessibleNativeGrowthProtectionAreas.80 Although many of these parks are notecologicallydiverse,thehealthandeconomicbenefitsofparkstothecommunityaresignificant(seetextboxonpage60).
As of September 2012, there were 2,550 acres of Bellevue parks property.
Air Quality Fineparticulatematterlessthan2.5micrometersindiameter(PM2.5)contributestoincreasedrespira-torydisease,decreasedlungfunction,heartproblems,andprematuredeath.Thegreatestcontributingsource to PM2.5 in the Puget Sound area is wood smoke. While wood smoke contributes the greatest massofPM2.5,particulatematterfromdieselenginesisthemosthighlytoxic.Bellevue’sairqualitydowntown has slowly improved with regard to PM2.5 since 2003. Overall, the number of unhealthy days and moderate days has declined in King County.81
1953 1960 1970 1980 1990 2000 2012
3,000
2,500
2,000
1,500
1,000
500
0
Acres of Parks Property
Acr
es
Source: City of Bellevue Parks Department
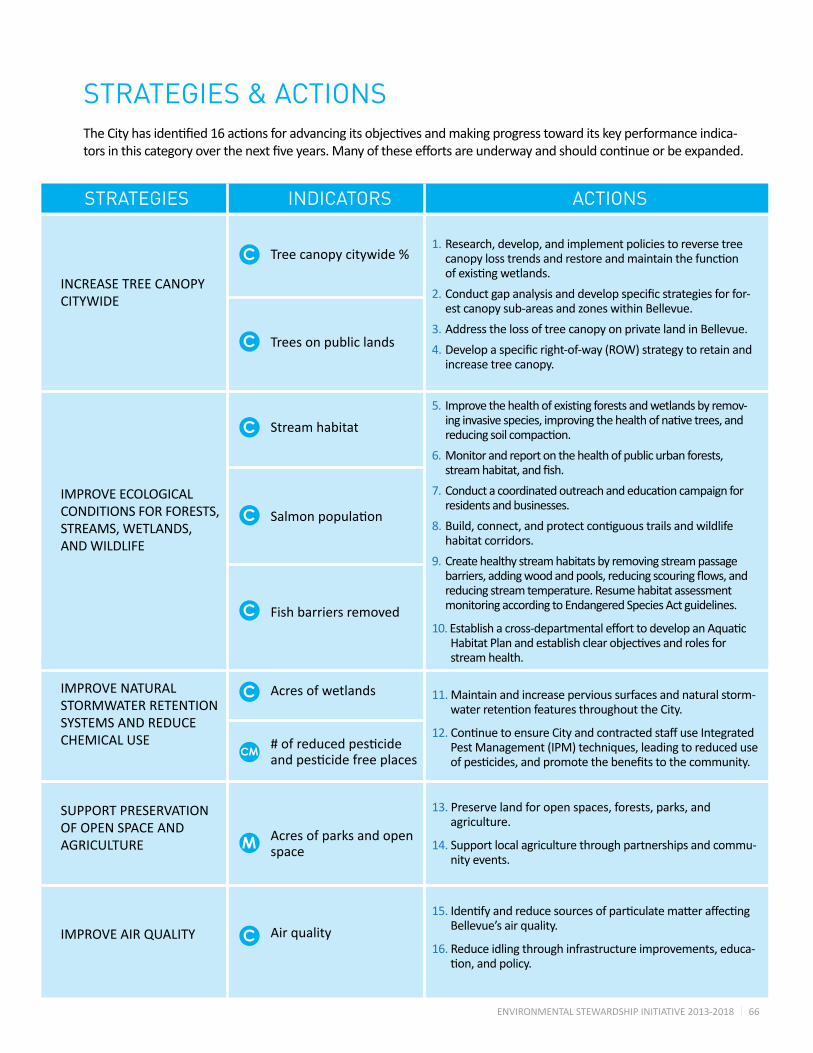
ENVIRONMENTAL STEWARDSHIP INITIATIVE 2013-2018 66
STRATEGIES INDICATORS ACTIONS
INCREASE TREE CANOPY CITYWIDE
IMPROVE ECOLOGICAL CONDITIONS FOR FORESTS, STREAMS, WETLANDS, AND WILDLIFE
IMPROVE NATURAL STORMWATER RETENTION SYSTEMS AND REDUCE CHEMICAL USE
SUPPORT PRESERVATION OF OPEN SPACE AND AGRICULTURE
IMPROVE AIR QUALITY
Treecanopycitywide%
Trees on public lands
Stream habitat
Salmonpopulation
Fish barriers removed
Acres of wetlands
#ofreducedpesticideandpesticidefreeplaces
Acres of parks and open space
Air quality
1. Research, develop, and implement policies to reverse tree canopylosstrendsandrestoreandmaintainthefunctionofexistingwetlands.
2. Conductgapanalysisanddevelopspecificstrategiesforfor-est canopy sub-areas and zones within Bellevue.
3. Address the loss of tree canopy on private land in Bellevue.
4. Developaspecificright-of-way(ROW)strategytoretainandincrease tree canopy.
5. Improvethehealthofexistingforestsandwetlandsbyremov-inginvasivespecies,improvingthehealthofnativetrees,andreducingsoilcompaction.
6. Monitor and report on the health of public urban forests, streamhabitat,andfish.
7. Conductacoordinatedoutreachandeducationcampaignforresidents and businesses.
8. Build,connect,andprotectcontiguoustrailsandwildlifehabitat corridors.
9. Create healthy stream habitats by removing stream passage barriers,addingwoodandpools,reducingscouringflows,andreducing stream temperature. Resume habitat assessment monitoring according to Endangered Species Act guidelines.
10. Establishacross-departmentalefforttodevelopanAquaticHabitatPlanandestablishclearobjectivesandrolesforstream health.
11. Maintain and increase pervious surfaces and natural storm-waterretentionfeaturesthroughouttheCity.
12. ContinuetoensureCityandcontractedstaffuseIntegratedPestManagement(IPM)techniques,leadingtoreduceduseofpesticides,andpromotethebenefitstothecommunity.
13. Preserve land for open spaces, forests, parks, and agriculture.
14. Support local agriculture through partnerships and commu-nity events.
15. IdentifyandreducesourcesofparticulatematteraffectingBellevue’s air quality.
16. Reduce idling through infrastructure improvements, educa-tion,andpolicy.
C
C
C
C
C
C
CM
M
C
STRATEGIES & ACTIONSTheCityhasidentified16actionsforadvancingitsobjectivesandmakingprogresstowarditskeyperformanceindica-torsinthiscategoryoverthenextfiveyears.Manyoftheseeffortsareunderwayandshouldcontinueorbeexpanded.
ENVIRONMENTAL STEWARDSHIP INITIATIVE 2013-2018 67
1.
2.
3.
4.
5.
6.
Research, develop, and implement policies to reverse tree canopy loss trends and restore and maintain the function of existing wetlands.
Examples of policy tools that can reverse tree canopy loss includeSEPAchecklists,wetlandmitigationbanking,andNativeGrowthProtectionEasements/Areas,82 although certain policy adjustments may be needed, as well as more follow-up and enforcement. For example, while the City has policies in place to protect wetlands, some illegal developmentcontinuestoencroachontheseremainingvitalareasandtheCitymustremainproactivetopreventthis.Thefunctionalbenefitsofwetlandsaredependenton being located in the right place, containing the right vegetation,withtherightsoiltype.Therefore,theCitywillcontinuetomonitorandpreventlossofbothwetlandacresaswellaswetlandfunction.
Conduct gap analysis and develop specific strategies for forest canopy sub-areas and zones within Bellevue.
The overall target for Bellevue is a tree canopy of 40 percent;asof2007,thecanopyisat36percent.Bellevue’sexistingcanopyfallsshortofAmericanForests’recommendationsinallareas,butsomeareinsteeper decline than others.83 The types of trees present inBellevue’scanopyaffectstormwaterretentionvalueaswell(e.g.,deciduousvs.coniferous).Inadditiontocreatingaplanforthesub-areasandtreetype,theCityplanstoalsodevelopandimplementanactionplanfortheCentral Business District in Downtown on soil health, street plantings,andothertreemanagementpractices.
Address the loss of tree canopy on private land in Bellevue.
Private land decisions are a significant reason for the decline in tree canopy in Bellevue. The City needs to develop tools to encourage residents to make environ-mentally beneficial decisions on private land, such as appropriate land use incentives, as well as outreach and education.
Develop a specific right-of-way (ROW) strategy to retain and increase tree canopy.
TheCityactivelymanages9,640streettreesplantedon roughly 200 acres of right of way. These formal streetscapesarevaluedatover$48milliondollarsintermsofreplacementcostsand$12millionintermsofstormwaterretention.Withover4,000existingacresofROW land in Bellevue, an enhanced strategy to put these spacestoworkwillsavemoney,amongotherbenefits.The American Forests Urban Ecosystem Analysis found that a 5 percent increase in ROW tree canopy would provideanadditional1.9millioncubicfeetinstormwaterrunoffmitigation,valuedat$3.7million.84
Improve the health of existing forests and wetlands by removing invasive species, improving the health of native trees, and reducing soil compaction.
ThisactionfocusesonimprovingthephysicalconditionsofBellevue’s urban forest and removing threats to long-term health. Bellevue currently successfully partners with com-munityvolunteersfornativeplantingsandinvasivespeciesremoval.BellevuewillcontinuetoengagevolunteersintreecanopyrestorationprojectsandexplorerecruitmentofotherpartnerssuchastheWashingtonConservationCorps, AmeriCorps, and Earth Corps, as well as businesses from the Eastside Sustainable Business Alliance, or others.
Monitor and report on the health of public urban forests, stream habitat, and fish.
Thisactionencouragescontinuedcollectionofdataonthe health of Bellevue’s natural ecosystems. It also recom-mendsengagingnewaudienceswiththeinformationandpresentingitinamoremeaningfulway.TheCitywillpubliclyreporttreecanopycoveragestatisticsthroughwebsites and City Parks’ visitor centers, and will regularly engageCitypolicymakerswiththeinformation.BellevueUtilitiesoperatesastreamhealthmonitoringprogramthattracksB-IBIindexfiguresandfishcountsandusesvolunteerstocollectthedata.Resumingaquatichabitatassessment monitoring according to Endangered Species Actguidelinesisalsoencouraged.TheseandothereffortsbytheBellevueUtilitiesvolunteerprogramincreaselocalknowledge and ownership of local stream habitat and more accurate trend analysis.
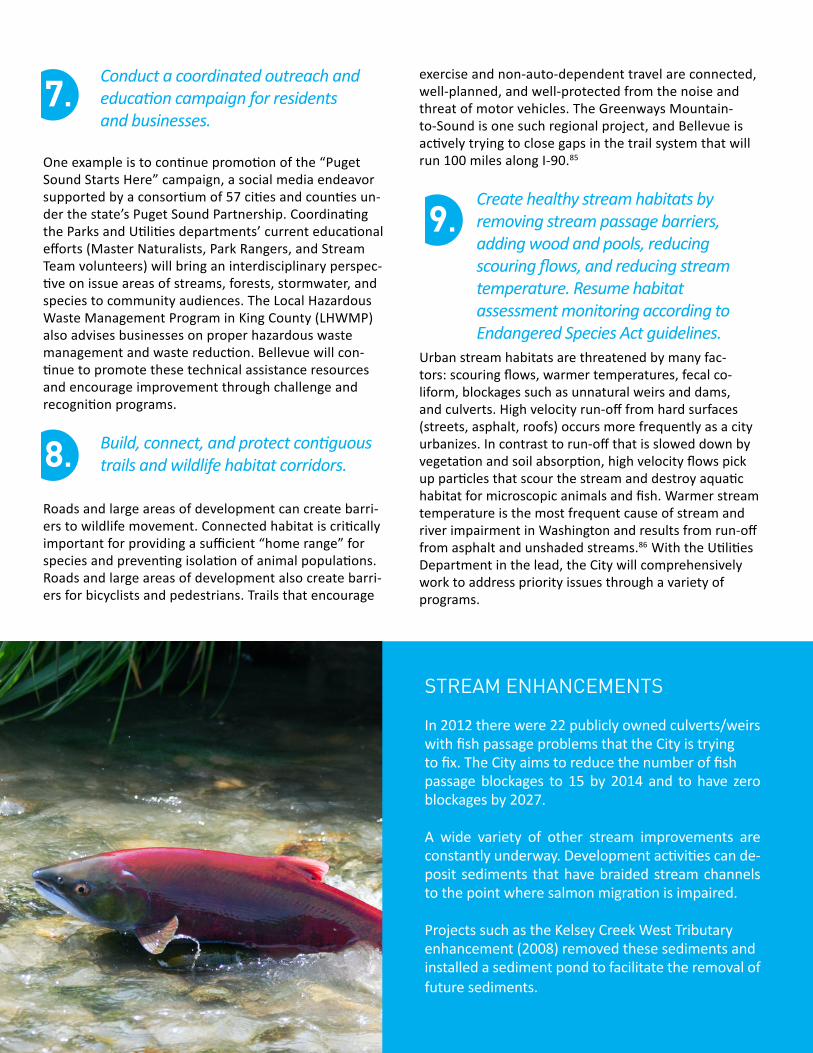
ENVIRONMENTAL STEWARDSHIP INITIATIVE 2013-2018 68
8.
9.
7.
STREAM ENHANCEMENTS
In 2012 there were 22 publicly owned culverts/weirs withfishpassageproblemsthattheCityistryingtofix.TheCityaimstoreducethenumberoffishpassage blockages to 15 by 2014 and to have zero blockages by 2027.
A wide variety of other stream improvements are constantlyunderway.Developmentactivitiescande-posit sediments that have braided stream channels tothepointwheresalmonmigrationisimpaired.
Projects such as the Kelsey Creek West Tributary enhancement(2008)removedthesesedimentsandinstalled a sediment pond to facilitate the removal of future sediments.
Conduct a coordinated outreach and education campaign for residents and businesses.
Oneexampleistocontinuepromotionofthe“PugetSound Starts Here” campaign, a social media endeavor supportedbyaconsortiumof57citiesandcountiesun-derthestate’sPugetSoundPartnership.CoordinatingtheParksandUtilitiesdepartments’currenteducationalefforts(MasterNaturalists,ParkRangers,andStreamTeamvolunteers)willbringaninterdisciplinaryperspec-tiveonissueareasofstreams,forests,stormwater,andspecies to community audiences. The Local Hazardous WasteManagementPrograminKingCounty(LHWMP)also advises businesses on proper hazardous waste managementandwastereduction.Bellevuewillcon-tinuetopromotethesetechnicalassistanceresourcesand encourage improvement through challenge and recognitionprograms.
Build, connect, and protect contiguous trails and wildlife habitat corridors.
Roads and large areas of development can create barri-erstowildlifemovement.Connectedhabitatiscriticallyimportantforprovidingasufficient“homerange”forspeciesandpreventingisolationofanimalpopulations.Roads and large areas of development also create barri-ers for bicyclists and pedestrians. Trails that encourage
exercise and non-auto-dependent travel are connected, well-planned, and well-protected from the noise and threat of motor vehicles. The Greenways Mountain-to-Sound is one such regional project, and Bellevue is activelytryingtoclosegapsinthetrailsystemthatwillrun 100 miles along I-90.85
Create healthy stream habitats by removing stream passage barriers, adding wood and pools, reducing scouring flows, and reducing stream temperature. Resume habitat assessment monitoring according to Endangered Species Act guidelines.
Urban stream habitats are threatened by many fac-tors:scouringflows,warmertemperatures,fecalco-liform, blockages such as unnatural weirs and dams, andculverts.Highvelocityrun-offfromhardsurfaces(streets,asphalt,roofs)occursmorefrequentlyasacityurbanizes.Incontrasttorun-offthatissloweddownbyvegetationandsoilabsorption,highvelocityflowspickupparticlesthatscourthestreamanddestroyaquatichabitatformicroscopicanimalsandfish.Warmerstreamtemperature is the most frequent cause of stream and riverimpairmentinWashingtonandresultsfromrun-offfrom asphalt and unshaded streams.86 WiththeUtilitiesDepartment in the lead, the City will comprehensively work to address priority issues through a variety of programs.
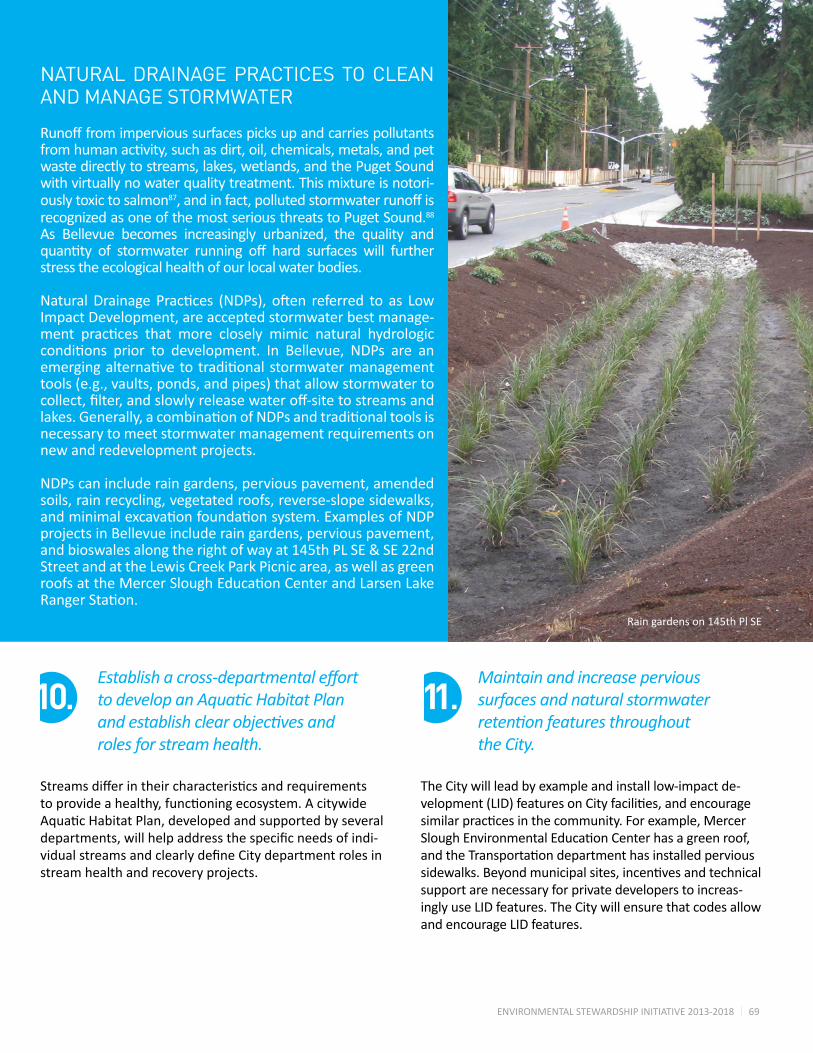
ENVIRONMENTAL STEWARDSHIP INITIATIVE 2013-2018 69
10. 11.
NATURAL DRAINAGE PRACTICES TO CLEAN AND MANAGE STORMWATER
Runofffromimpervioussurfacespicksupandcarriespollutantsfromhumanactivity,suchasdirt,oil,chemicals,metals,andpetwaste directly to streams, lakes, wetlands, and the Puget Sound with virtually no water quality treatment. This mixture is notori-ously toxic to salmon87,andinfact,pollutedstormwaterrunoffisrecognized as one of the most serious threats to Puget Sound.88 As Bellevue becomes increasingly urbanized, the quality and quantity of stormwater running off hard surfaces will furtherstress the ecological health of our local water bodies.
NaturalDrainagePractices (NDPs), often referred to as LowImpact Development, are accepted stormwater best manage-ment practices that more closely mimic natural hydrologicconditions prior to development. In Bellevue, NDPs are anemergingalternativetotraditionalstormwatermanagementtools(e.g.,vaults,ponds,andpipes)thatallowstormwatertocollect,filter,andslowlyreleasewateroff-sitetostreamsandlakes.Generally,acombinationofNDPsandtraditionaltoolsisnecessary to meet stormwater management requirements on new and redevelopment projects.
NDPs can include rain gardens, pervious pavement, amended soils, rain recycling, vegetated roofs, reverse-slope sidewalks, andminimalexcavationfoundationsystem.ExamplesofNDPprojects in Bellevue include rain gardens, pervious pavement, and bioswales along the right of way at 145th PL SE & SE 22nd Street and at the Lewis Creek Park Picnic area, as well as green roofsattheMercerSloughEducationCenterandLarsenLakeRangerStation.
Establish a cross-departmental effort to develop an Aquatic Habitat Plan and establish clear objectives and roles for stream health.
Streamsdifferintheircharacteristicsandrequirementstoprovideahealthy,functioningecosystem.AcitywideAquaticHabitatPlan,developedandsupportedbyseveraldepartments,willhelpaddressthespecificneedsofindi-vidualstreamsandclearlydefineCitydepartmentrolesinstream health and recovery projects.
Maintain and increase pervious surfaces and natural stormwater retention features throughout the City.
The City will lead by example and install low-impact de-velopment(LID)featuresonCityfacilities,andencouragesimilarpracticesinthecommunity.Forexample,MercerSloughEnvironmentalEducationCenterhasagreenroof,andtheTransportationdepartmenthasinstalledpervioussidewalks.Beyondmunicipalsites,incentivesandtechnicalsupport are necessary for private developers to increas-ingly use LID features. The City will ensure that codes allow and encourage LID features.
Rain gardens on 145th Pl SE
ENVIRONMENTAL STEWARDSHIP INITIATIVE 2013-2018 70
Continue to ensure City and contracted staff use integrated pest management (IPM) techniques, leading to reduced use of pesticides, and promote the ben-efits to the community.
The Parks department, including its landscape con-tractors,willcontinuetomanagelandscapesusinganEnvironmentalBestManagementPracticesmanual,whichoutlinesIPM,healthysoils,andwaterconservationstrategies.Third-partyrecognitionandcertificationpro-cesses can demonstrate to the community that the City isimplementingbestpracticesaroundchemicaluseandstrivingforcontinualimprovement.TheUSGBC’sLEEDgreenbuildingstandardsalsocontainsspecificcriteriatocertifylandscapesandsitelocations,whichcanbeusedas a guide in City projects. The LEED standards consider how owners manage open space and habitat, IPM, and stormwater.
Preserve land for open spaces, forests, parks, and agriculture.
Bellevuewillcontinuetostrategicallyacquirelandthatpreserveslandforfuturegenerationsandbuildsonitsremarkableparksystem.Anexampleofaregionalinitia-tivethatsupportsthisstrategyistheCascadeAgendatopreserve farms, forests, parks, shorelines, and natural areas.Currently19northwestcities(Bellevueisnotone)areformallylistedas“CascadeAgenda”cities.89 An ad-ditionaltooltofurtherreduceregionalsprawlisTransferofDevelopment Rights, which allows for more urban density while preserving working agricultural land or forested areas in rural King County.
Support local agriculture through part-nerships and community events.
TheCitywillhelpoffercommunitygardeningandfarmstandopportunitiesforresidents,andpartnerwithprivateandnon-profitorganizationstoencouragelocalFarmer’s Markets and Community Supported Agriculture.
Identify and reduce sources of particulate matter affecting Bellevue’s air quality.
ThisactionformsaCitypartnershipwiththePugetSoundCleanAirAgencyandotherstoaddressparticulatematter,classifiedas“themostimportantairpollutantchallengeaffectingourregion”becauseparticulatemat-ter(especiallyPM2.5)90 causes an array of serious health effects.Inthewinter,mostparticlepollutioncomesfromburninginfireplacesandwoodstoves.Duringthesum-mer,vehicleexhaust(cars,trucks,buses,amongothers),land-clearing burning and backyard burning of yard waste arethepredominantsourcesoffineparticles.
Reduce idling through infrastructure improvements, education, and policy.
The City can help reduce idling through a variety of approaches,includingtrafficlightsynchronization,roundabouts,educationandsignage,andinstitutinganno-idling policy for applicable City vehicles. Idling is a wastefulconsumptionoffuel(asitisessentially“zeromilespergallon”)andgeneratesexhaustthatcancausesmog and other respiratory problems.
14.
15.
16.
13.
12.
ENVIRONMENTAL STEWARDSHIP INITIATIVE 2013-2018 71
ENDNOTES1. CarbonDisclosureProject.(2012).Measurement for Management: CDP Cities 2012 Global Report. Retrieved from
https://www.cdproject.net/CDPResults/CDP-Cities-2012-Global-Report.pdf
2. Ibid.
3. WashingtonStateDepartmentofEcology.(2011).Climate Change: National and Regional Leadership. Retrieved from Washington State Department of Ecology Web site: http://www.ecy.wa.gov/climatechange/leadership.htm
4. WashingtonStateDepartmentofEcology.(2011).Climate Change: Policy Framework. Retrieved from Washington State Department of Ecology Web site: http://www.ecy.wa.gov/climatechange/laws.htm
5. KingCounty.(2012).King County - Cities Climate Collaboration and Pledge. Retrieved from King County Web site: http://www.kingcounty.gov/environment/climate/other-governments/climate-pledge.aspx
6. Lydersen,K.(2009,February15).Scientists:PaceofClimateChangeExceedsEstimates.The Washington Post. Retrieved from http://www.washingtonpost.com/wp-dyn/content/article/2009/02/14/AR2009021401757.html
7. NationalResearchCouncil.(2010).Adapting to the Impacts of Climate Change. Retrieved from http://dels.nas.edu/resources/static-assets/materials-based-on-reports/reports-in-brief/Adapting_Report_Brief_final.pdf
8. ClimateImpactsGroup.(2009).The Washington Climate Change Impacts Assessment. University of Washington. Retrieved from http://cses.washington.edu/db/pdf/wacciareport681.pdf
9. Crabtree,S.(2010,August13).Wellbeing Lower Among Workers with Long Commutes. Retrieved from Gallup Wellbeing: http://www.gallup.com/poll/142142/wellbeing-lower-among-workers-long-commutes.aspx
10. FederalHighwayAdministration.(2012).Traffic Volume Trends.RetrievedfromOfficeofHighwayPoliceInformation:Travel Monitoring Web site: http://www.fhwa.dot.gov/policyinformation/travel_monitoring/tvt.cfm
11. Williams-Derry,C.(2011,August8).“DisappearingCars,Circa2002.”Sightline Daily. Retrieved from http://daily.sightline.org/2011/08/08/disappearing-cars-circa-2002/
12. Chozick,A.(2012,March22).“AsYoungLoseInterestinCars,GMTurnstoMTVforHelp.”New York Times.
13. Leinberger,C.(2012,May25).“NowCoveted-AWalkable,ConvenientPlace.” New York Times.
14. LeagueofAmericanBicyclists.(n.d.).2010 Bike Commuting Data Released. Retrieved from http://www.bikeleague.org/news/acs2010.php
15. ORCInterational.(2012).Bellevue Performance Measures Survey. City of Bellevue.
16. TexasTransportationInstitute.(2011).Table 2. What Congestion Means to Your Town, 2010. 2011 Urban Mobility Report. Retrieved from http://mobility.tamu.edu/files/2011/09/national-table_2.pdf
17. SeeRCW43.19.648formoreinformation.Compressednaturalgas,liquefiednaturalgas,orpropanemaybesubstitutedfor electricity or biofuel if the department of commerce determines that electricity and biofuel are not reasonably available, and transit agencies using compressed natural gas are exempt from this requirement.
18. CityofBellevuePlanningandCommunityDevelopment.(January2012).Bellevue By the Numbers. Retrieved March 1, 2013 from http://www.ci.bellevue.wa.us/pdf/PCD/Bellevue_By_The_Numbers.pdf
19. CityofBellevue.(2004Update).City of Bellevue Comprehensive Plan. Retrieved from http://www.bellevuewa.gov/comprehensive_plan.htm
20. Walk Score. Retrieved March 1, 2013 from http://www.walkscore.com/methodology.shtml Walk Score uses a patent-pending system to measure the walkability of an address. The Walk Score algorithm awards points based on the distancetoamenitiesineachcategory.Amenitieswithin.25milesreceivemaximumpointsandnopointsareawardedforamenitiesfurtherthanonemile.WalkScoreusesavarietyofdatasourcesincludingGoogle,Education.com, Open StreetMap,andLocaleze.WalkScoreisanapproximationofwalkability.Thereareanumberoffactorsthatcontributetowalkability that are not part of the algorithm, including street design, safety from crime and crashes, pedestrian-friendly community design, topography, and weather.
21. Biodiesel emits carbon to the atmosphere but since it is not “new carbon” from buried fossil fuels, it does not increase net GHG emissions.Formoreinformation,visittheUSDeptofEnergyathttp://www.afdc.energy.gov/vehicles/diesels_emissions.html
22. CityofBellevue.(February2008)Downtown Bellevue Growth and Transportation Efficiency Center. Retrieved from http://www.ci.bellevue.wa.us/pdf/Transportation/connect_downtown_plan.pdf and email correspondence with Kate Johnson.
23. CaliforniaDepartmentofTransportation.(2010,April13).Transit-Oriented Development (TOD). Retrieved from California DepartmentofTransportationWebsite:http://www.dot.ca.gov/hq/MassTrans/tod.html
24. Pucher,J.,&Dijkstra,L.(2003,September).“PromotingSafeWalkingandCyclingtoImprovePublicHealth:LessonsFromThe Netherlands and Germany.” American Journal of Public Health,93(9),1509-1516.Retrievedfrom http://policy.rutgers.edu/faculty/pucher/ajphfromjacobsen.pdf
ENVIRONMENTAL STEWARDSHIP INITIATIVE 2013-2018 72
25. CityofBellevue.(2009).2009 City of Bellevue Pedestrian and Bicycle Transportation Plan Report. Retrieved from http://www.bellevuewa.gov/pdf/Transportation/ped_bike_plan_2009.pdf
26. PugetSoundEnergy.(2012).Electric Supply. Retrieved from http://www.pse.com/aboutpse/EnergySupply/Pages/Electric-Supply.aspx
27. U.S.DepartmentofEnergy.(2012).Electricity: Overview. Retrieved from http://www.eia.gov/electricity/
28. Ryan,J.(2012,July27).“MontanaCoalFuelsPugetSoundEnergy.”KUOW News. Retrieved from http://www.kuow.org/program.php?id=27475
29. ClimateImpactsGroup.(2009).Research: Hydrology and Water Resources: Key Findings. Retrieved from Climate Impacts Group Web site: http://cses.washington.edu/cig/res/hwr/hwrkeyfindings.shtml
30. ClimateImpactsGroup.(2009).Hydrology and Water Resources: Current Research: Climate Change Impacts on WA State Hydrology. Retrieved from Climate Impacts Group Web site: http://cses.washington.edu/cig/res/hwr/wacchydro.shtml
31. NorthwestEnergyCoalition.(2009).The Power of Efficiency: Pacific Northwest Energy Conservation Potential Through 2020. Retrieved from http://nwenergy.adhostclient.com/wp-content/uploads/Power-of-Efficiency-050109.pdf
32. U.S.DepartmentofEnergy.(2012,March).Buildings Energy Book. Retrieved from U.S. Department of Energy Web site: http://buildingsdatabook.eren.doe.gov/ChapterIntro1.aspx
33. Deleted
34. WaterSupplyForum.(2012).Regional Water Supply Outlook. Retrieved from Water Supply Forum Web site: http://www.watersupplyforum.org/home/outlook/
35. Since48%ofthetotalelectricitycostsforthecityaresignalsandstreetlights,itisanimportantareatoaddress.MosttrafficsignalshavealreadybeenconvertedtoLEDs.However,fewstreetlightshavebeenconvertedasof2012.
36. ENERGYSTARisanationwide,low-costprogramthatrankstheactualenergyuseofabuildingagainstsimilarbuildingtypes,andonlycertaincommercialbuildingsmayreceiveascore.CommercialbuildingsthatearntheENERGYSTAR(ascoreof75orgreateroutof100points)useanaverageof35percentlessenergythantypicalbuildingsandalsorelease35 percent less carbon dioxide into the atmosphere. LEED is program of the U.S. Green Building Council and provides independent,third-partyverificationthatabuildingisdesignedandbuiltwithenvironmentalperformanceinmind.LEEDforExistingBuildingsaddresseswhole-buildingcleaningandmaintenanceissues(includingchemicaluse),recyclingprograms, exterior maintenance programs, and systems upgrades.
37. TheCityofAnnArbor,Michigan,similarinsizetoBellevue,establishedaRLFin1982thathasaffordedthecityover$600,000inloans,withsavingsofover$150,000peryearand$1.5Mcumulative.AnnArborhasreduceditsgreenhousegas emissions by 980 tons of carbon dioxide equivalents per year thanks to this fund.
38. InstituteforMarketTransformation.(2011).Introduction to Commercial Building Energy Rating and Disclosure Policies. Retrieved from http://www.imt.org/uploads/resources/files/6.26Rating_Intro.pdf
39. InstituteforMarketTransformation.(n.d.).$810 Million Funding Needed to Achieve 90% Compliance with Building Energy Codes. Retrieved from http://www.doe.gov/sites/prod/files/gcprod/documents/Energy_Code_Enforcement_Funding_Task_Force_-_Fact_Sheet.pdf
40. Ibid.
41. Schlenger,D.(2012). Water Utilities Begin the Shift to Advanced Metering Infrastructure. Retrieved from PenWell CorporationWebsite:http://www.waterworld.com/articles/print/volume-24/issue-8/amra/water-utilities-begin-the-shift-to-advanced-metering-infrastructure.html
42. Todate,theAIA2030Challengehasbeenadoptedbymanyorganizationsincluding:TheNationalGovernorsAssociation,TheNationalAssociationofCounties,thestatesofMinnesota,Illinois,NewMexico,WashingtonState,andnumerouscitiesandcounties.Seattlecurrentlyhasa“2030district”commercialareaestablishedvoluntarilybasedontheAIA2030Challengegoals,andBellevueisanexcellentnextpilottestinggroundforasimilardistrict.InWashington,KitsapCounty,ThurstonCounty,theSeattle2030District,andStarbuckshavejoinedtheBetterBuildingsChallenge.
43. Morethan50%ofallbuildingstockinsomecountriesofNorthernEuropeisconnectedtodistrictenergysystems.Eco-districtdevelopmentareasandcampuseshaveadoptedanexcitingdistrictenergyvisionandimplementationstrategyinPortland.CompassResourceManagement,Ltd.(2010).Portland Pilot Ecodistricts, Neighborhood Infrastructure: Doing More with Less.PortlandSustainabilityInstitute,Vancouver,BC.Retrievedfromhttp://www.pdxinstitute.org/images/posi_publications/ecodistricts_district_utilities_final_report_november10.pdf
44. U.S.EnvironmentalProtectionAgency.(2011).Municipal Solid Waste Generation, Recycling, and Disposal in the United States: Tables and Figures for 2010.OfficeofResourceConservationandRecovery.
45. MacKerron,C.(2012).UnfinishedBusiness:The Case for Extended Producer Responsibility for Post-Consumer Packaging. Retrieved from http://asyousow.org/publications/2012/UnfinishedBusiness_TheCaseforEPR_20120710.pdf
ENVIRONMENTAL STEWARDSHIP INITIATIVE 2013-2018 73
46. Gunders,D.(2012).Wasted: How America Is Losing Up to 40 Percent of Its Food from Farm to Fork to Landfill. Natural Resources Defense Council. Retrieved from http://www.nrdc.org/food/files/wasted-food-IP.pdf
47. U.S.EnvironmentalProtectionAgency.(2009).Opportunities to Reduce Greenhouse Gas Emissions through Materials and Land Management Practices.OfficeofSolidWasteandEmergencyResponse.Retrievedfrom http://www.epa.gov/oswer/docs/ghg_land_and_materials_management.pdf
48. U.S.DepartmentofHealthandHumanServices.(2009).Fourth National Report on Human Exposure to Environmental Chemicals. CentersforDiseaseControlandPrevention.Retrievedfrom http://www.cdc.gov/exposurereport/pdf/FourthReport.pdf
49. WashingtonStateDepartmentofEcology.(2011).Solid Waste in Washington State: 20th Annual Status Report. Waste 2 Resources Program. Retrieved from https://fortress.wa.gov/ecy/publications/publications/1107039.pdf
50. U.S.EnvironmentalProtectionAgency.(2011).Reducing Greenhouse Gas Emissions through Recycling and Composting. Materials Management Workgroup of the West Coast Climate and Materials Forum. Retrieved from http://www.epa.gov/region10/pdf/climate/wccmmf/Reducing_GHGs_through_Recycling_and_Composting.pdf
51. WashingtonStateDepartmentofEcology.(2011).Green Purchasing. Retrieved from Washington Department of Ecology Web site: http://www.ecy.wa.gov/programs/swfa/epp/
52. WashingtonStateDepartmentofEcology,(December2011).SolidWasteinWashingtonState:20thAnnualStatusReport.Waste 2 Resources Program. Retrieved from https://fortress.wa.gov/ecy/publications/publications/1107039.pdf
53. KingCounty.(2012,June12).Indicators: Solid Waste Disposal and Recycling. Retrieved from http://your.kingcounty.gov/dnrp/measures/indicators/rc-solid-waste.aspx
54. NorthwestProductStewardshipCouncil.(2012,September18).Retrievedfromhttp://www.productstewardship.net/
55. Inaproductstewardshipmodel,thosewhohavethemostinfluenceoverdesigndecisionshaveacommensurateresponsibilityfortheproductatend-of-life.Inaddition,thosewhodonotuseorbenefitfromtheproductarenotburdenedwiththeproduct’sdisposalimpactsorcosts.Properphysicalandfiscalresponsibilitiesprovideincentivestochange the design and produce less waste.
56. Pharmaceuticalsaremanagedforsafedisposal,ratherthanrecycling.
57. KingCounty.(June8,2011). Construction, demolition & landclearing diversion/recycling and disposal options. Retrieved from http://your.kingcounty.gov/solidwaste/facilities/cdl-stations.asp
58. WashingtonStateDepartmentofEcology,(December2011).
59. E.g., re-manufactured cartridges, which Bellevue does not currently purchase.
60. AmericanForests.(2008).UrbanEcosystemAnalysis:CityofBellevue,WA.Retrievedfrom http://systemecology.org/4_Past_Projects/AmforReport_Bellevue_lowres.pdf
61. Booth,D.;Hartley,D;andJackson,R.(June2002)“ForestCover,Impervious-SurfaceArea,andtheMitigationofStormwater Impacts.” Journal of the American Water Resources Association. Retrieved from https://www.ci.oswego.or.us/sites/default/files/archives/projects/planningprojects/PP09-0011_Sensitive_Lands_Outreach/Second_Look_Task_Force/01-07-10_Part_1_Scientific_Papers.pdf
62. Puget Sound Partnership. Retrieved from http://www.psp.wa.gov/SR_status.php
63. NationalAudobonSociety.(2012).State of the Birds. Retrieved from Audobon Society Web site: http://web4.audubon.org/bird/stateofthebirds/cbid/
64. Harnik,P.andWelle,B.(2009)Measuring the Economic Value of a City Park System. The Trust for Public Land. Retrieved from http://www.tpl.org/publications/books-reports/ccpe-publications/measuring-the-economic-value.html
65. Donovana,G.,Michaelb,Y.,Butryc,D.,Sullivand,A.,andChasea,J.(January2011).“Urbantreesandtheriskofpoorbirthoutcomes.” Health & Place. Volume 17, Issue 1, Pages 390–393. Retrieved from http://www.sciencedirect.com/science/article/pii/S1353829210001656
66. eCityGovAlliance.(2009).Mercer Slough Nature Park Trails. Retrieved from MyParksandRecreation.com: http://www.myparksandrecreation.com/ParksTrails/Details.aspx?pid=471
67. PugetSoundPartnership.(2010).2009 State of the Sound Report. Retrieved from http://www.psp.wa.gov/downloads/SOS09/09-04534-000_State_of_the_Sound-1.pdf
68. Lowimpactdevelopment(LID)isadevelopmentstrategythatmimicsnaturalsystemstohelpmaintainandrestorethenatural hydrology of watersheds in urban, developed areas.
69. CityofBellevue.(2009).City of Bellevue Comprehensive Plan: Environmental Element. Retrieved from http://www.bellevuewa.gov/pdf/PCD/CompPlan_Vol_1_09.Environment.pdf
70. AmericanForests.(2008).
71. Ibid.
ENVIRONMENTAL STEWARDSHIP INITIATIVE 2013-2018 74
72. URFO, January 2010. City of Bellevue i-Tree Ecosystem Analysis.
73. EarthCorps.May2012.“ForestConditionAssessmentModelAnalysisof100permanentplotslocatedinforestedparksinBellevue, Washington.”
74. CityofSeattle,KingCounty,PierceCounty,andSnohomishCounty.(2010).Puget Sound Stream Benthos. Retrieved July 8, 2010. http://pugetsoundstreambenthos.org/default.aspx
75. ResearchershavefoundtheB-IBIscoretobesignificantlycorrelatedwiththeamountofurbanizationinawatershed,measuredbypercentimperviousarea(Albertietal.2007;Boothetal.2004;MorleyandKarr2002).Generally,whenawatershedbecomesmorethan10percentimpervious,thescoreislower.KelseyCreekbasinis40%imperviouswith55%treecanopyintheriparianbuffer,LewisCreekbasinis20%imperviouswith85%treecanopyintheriparianbuffer,andCoalCreekbasinis29%imperviouswith69%treecanopyintheriparianbuffer(CityofBellevueUtilitiesDepartment,2012) References: Alberti,M.,D.Booth,K.Hill,B.Coburn,C.Avolio,S.Coe,andD.Spirandelli.(2007).”TheImpactofUrbanPatterns on AquaticEcosystems:AnEmpiricalAnalysisinPugetLowlandSub-basins.”Landscape and Urban Planning 80(4):345-361. Booth,D.B.,J.R.Karr,S.Schauman,C.P.Konrad,S.A.Morley,M.G.Larson,andS.J.Burges.(2004).“RevivingUrbanStreams: Land Use, Hydrology, Biology, and Human Behavior.” Journal of the American Water Resources Association. 40(5):1351-1364. Morley,S.A.andJ.R.Karr.(2002).“AssessingandRestoringtheHealthofUrbanStreamsinthePugetSoundBasin.” Conservation Biology16(6):1498-1509. CityofBellevueUtilitiesDepartment.(2012).2012 Storm and Surface Water System Plan Review Draft. Retrieved March 16, 2013 from http://www.ci.bellevue.wa.us/pdf/Utilities/Storm_PLan_2012.pdf
76. Bollman,W.(October2009)Biological Assessment of Stream Sites in the City of Bellevue, Based on Macroinvertebrate Assemblages. Report to the City of Bellevue, Washington Utilities Department. Retrieved from http://www.ci.bellevue.wa.us/pdf/Utilities/BELLEVUE_Bugs_FINAL08_Summary.pdf
77. AnchorQEA.(2012). 2011 Bellevue Salmon Spawner Surveys. Seattle,WA.Retrievedfrom http://www.bellevuewa.gov/pdf/Utilities/Bellevue_Salmon_Spawner_Survey_4-12-2012_Final.pdf
78. MetropolitanKingCountyCountywidePlanningPoliciesBenchmark.(June2005)ProgramIndicator 16: Change in Wetland Acreage and Functions. Retrieved from http://your.kingcounty.gov/budget/benchmrk/bench04/Environment/ Environment_05.pdf#16
79. PesticideActionNetworkNorthAmerica.(October2012)“AGenerationinJeopardy.Howpesticidesareunderminingourchildren’s health & intelligence.” Retrieved April 3, 2013 from http://www.safelawns.org/blog/wp-content/uploads/2012/10/KidsHealthReportOct2012.pdf
80. Parker,C.(2010).Bellevue Parks and Open Space System Plan 2010. City of Bellevue, Parks and Community Services. Retrieved from http://www.bellevuewa.gov/pdf/Parks/park_plan_update_draft_4-29-10.pdf
81. PugetSoundCleanAirAgency.(2012).2010 Air Quality Data Summary. Retrieved from http://www.pscleanair.org/news/library/reports/2010_AQDS_Report.pdf
82. Eitheraneasementrecordedonthepropertytitle,oraseparatetractortaxparcel
83. Urbanresidential(-5%),Suburbanresidential(-15%),CentralBusinessDistrict(-8%),Commercial/MixedUse(-4%),andIndustrial(-6%).From:AmericanForests.(2008).Urban Ecosystem Analysis: City of Bellevue, WA. Retrieved from http://systemecology.org/4_Past_Projects/AmforReport_Bellevue_lowres.pdf
84. AmericanForests.(2008).
85. CityofBellevue.(n.d.).EW-4: Mountains to Sound Greenway. Retrieved from City of Bellevue Web site: http://www.bellevuewa.gov/pdf/Transportation/Mountains_to_Sound_Greenway_Trail_Handout.pdf
86. USEPA(2008)WashingtonCausesofImpairmentforReportingYear2008.Availablefrom http://ofmpub.epa.gov/tmdl_waters10/attains_state.control?p_state=WA#total_assessed_waters
87. AssociatedPress.(January22,2013).“StudylinkscohosalmondeathstostormwaterrunofffromWashingtonhighways.” Oregon Live. Retrieved from http://www.oregonlive.com/environment/index.ssf/2013/01/study_links_coho_salmon_deaths.html
88. Puget Sound Partnership. Retrieved from http://www.psparchives.com/our_work/stormwater.htm
89. See Forterra at http://www.forterra.org/who_we_are/cascade_agenda
90. PM2.5arefineparticlesmeasuring2.5micrometersindiameterorsmallerthatembedinthelungs.

ENVIRONMENTAL STEWARDSHIP INITIATIVE 2013-2018 76
APPENDICES
2 AppendixA:ProjectPortfolioA-1
ESIAPPENDIXA.PROJECTPORTFOLIO2013-2018 A-1
CITY OF BELLEVUE
AllMTCO2ecalculationshavebeenupdatedtoreflecteGrid2009datafoundat:http://epa.gov/cleanenergy/documents/egridzips/eGRID2012V1_0_year09_SummaryTables.pdf Non-baseload emission factors were used to calculate savings unless noted otherwise.
SUSTAINABILITYPROJECTSPORTFOLIO
OCTOBER 2012 ENVIRONMENTAL STEWARDSHIP INITIATIVE
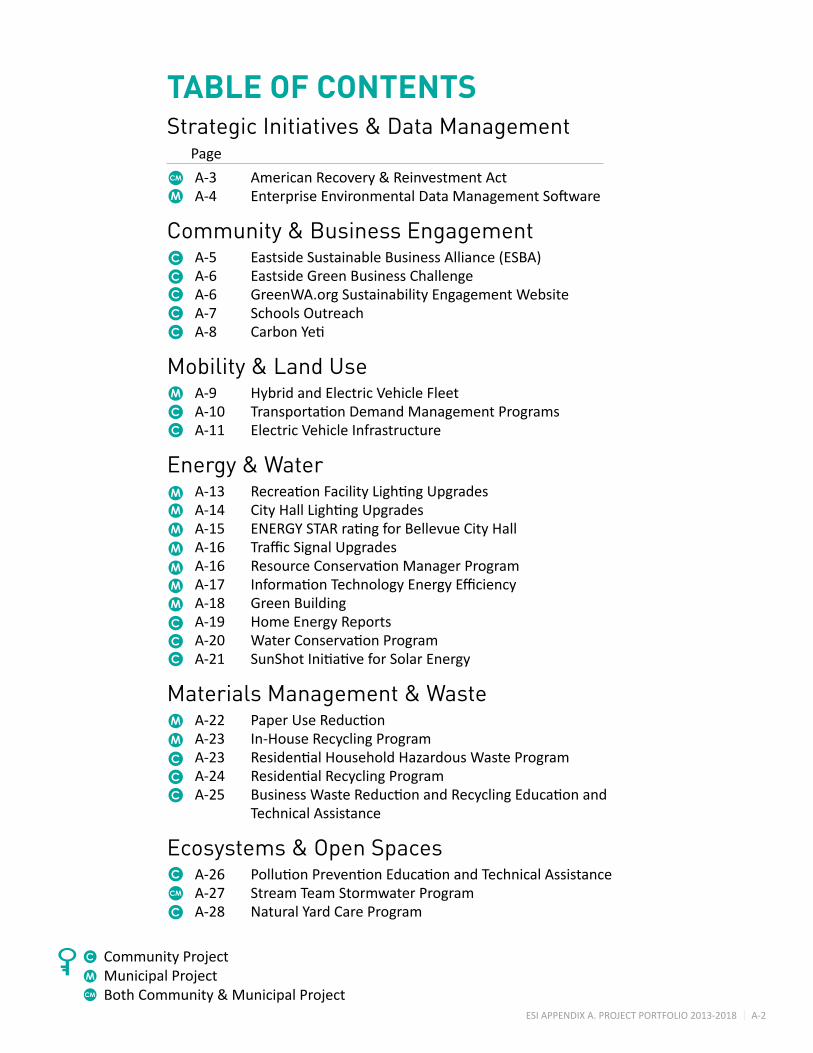
ESIAPPENDIXA.PROJECTPORTFOLIO2013-2018 A-2
TABLE OF CONTENTSStrategic Initiatives & Data Management Page
A-3 American Recovery & Reinvestment Act A-4 EnterpriseEnvironmentalDataManagementSoftware
Community & Business Engagement A-5 EastsideSustainableBusinessAlliance(ESBA) A-6 Eastside Green Business Challenge A-6 GreenWA.org Sustainability Engagement Website A-7 Schools Outreach A-8 CarbonYeti Mobility & Land Use A-9 Hybrid and Electric Vehicle Fleet A-10 TransportationDemandManagementPrograms A-11 Electric Vehicle Infrastructure
Energy & Water A-13 RecreationFacilityLightingUpgrades A-14 CityHallLightingUpgrades A-15 ENERGYSTARratingforBellevueCityHall A-16 TrafficSignalUpgrades A-16 ResourceConservationManagerProgram A-17 InformationTechnologyEnergyEfficiency A-18 Green Building A-19 Home Energy Reports A-20 WaterConservationProgram A-21 SunShotInitiativeforSolarEnergy
Materials Management & Waste A-22 PaperUseReduction A-23 In-House Recycling Program A-23 ResidentialHouseholdHazardousWasteProgram A-24 ResidentialRecyclingProgram A-25 BusinessWasteReductionandRecyclingEducationand Technical Assistance
Ecosystems & Open Spaces A-26 PollutionPreventionEducationandTechnicalAssistance A-27 Stream Team Stormwater Program A-28 Natural Yard Care Program
M
M
M
M
M
M
M
M
M
M
M
C
C
C
C
C
C
C
C
C
C
C
C
C
C
C
CM
Community ProjectMunicipal ProjectBoth Community & Municipal Project
M
CM
C
CM
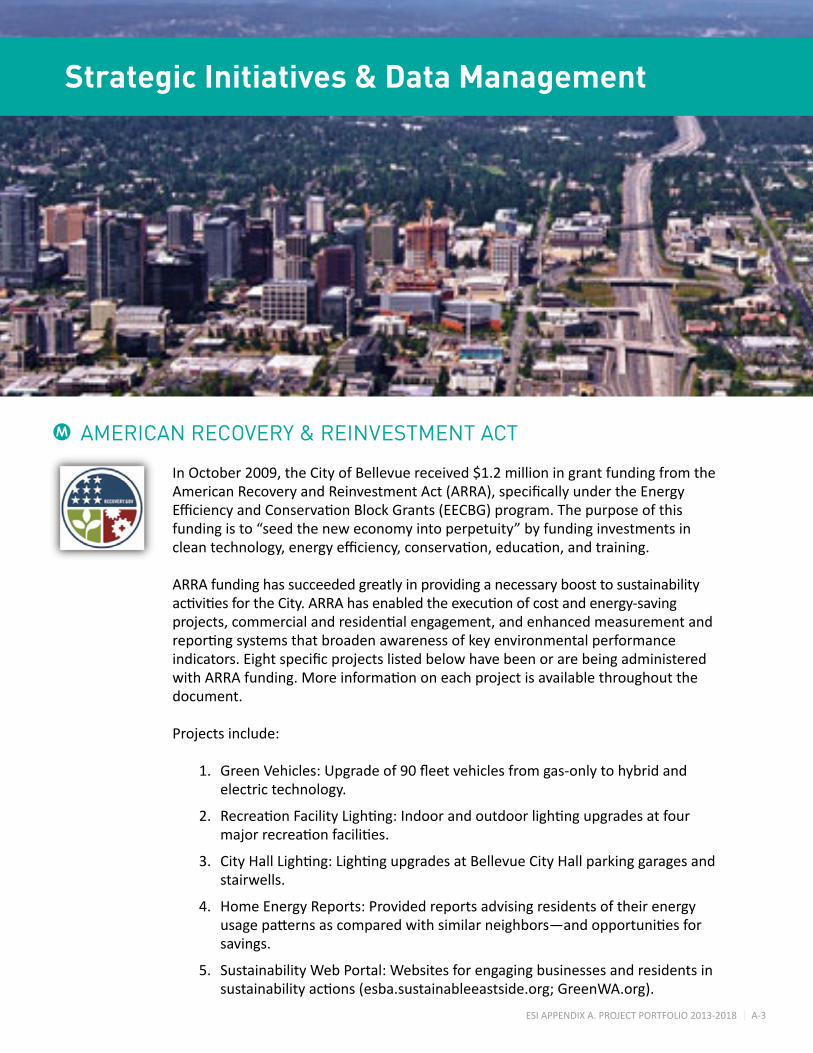
ESIAPPENDIXA.PROJECTPORTFOLIO2013-2018 A-3
InOctober2009,theCityofBellevuereceived$1.2millioningrantfundingfromtheAmericanRecoveryandReinvestmentAct(ARRA),specificallyundertheEnergyEfficiencyandConservationBlockGrants(EECBG)program.Thepurposeofthisfunding is to “seed the new economy into perpetuity” by funding investments in cleantechnology,energyefficiency,conservation,education,andtraining.
ARRA funding has succeeded greatly in providing a necessary boost to sustainability activitiesfortheCity.ARRAhasenabledtheexecutionofcostandenergy-savingprojects,commercialandresidentialengagement,andenhancedmeasurementandreportingsystemsthatbroadenawarenessofkeyenvironmentalperformanceindicators.EightspecificprojectslistedbelowhavebeenorarebeingadministeredwithARRAfunding.Moreinformationoneachprojectisavailablethroughoutthedocument.
Projects include:
1. GreenVehicles:Upgradeof90fleetvehiclesfromgas-onlytohybridand electric technology.
2. RecreationFacilityLighting:Indoorandoutdoorlightingupgradesatfour majorrecreationfacilities.
3. CityHallLighting:LightingupgradesatBellevueCityHallparkinggaragesand stairwells.
4. Home Energy Reports: Provided reports advising residents of their energy usagepatternsascomparedwithsimilarneighbors—andopportunitiesfor savings.
5. Sustainability Web Portal: Websites for engaging businesses and residents in sustainabilityactions(esba.sustainableeastside.org;GreenWA.org).
AMERICAN RECOVERY & REINVESTMENT ACTM
Strategic Initiatives & Data Management
ESIAPPENDIXA.PROJECTPORTFOLIO2013-2018 A-4
6. EnterpriseEnvironmentalDataManagementSoftware:Softwaretoolthat tracks key environmental performance indicators city-wide and supports trend analysis.
7. ElectricVehicleCharging:Installationofelectricvehiclechargingstationsfor Cityfleetandemployeeusage.
8. Greenhouse Gas Inventory: An updated inventory of City and community greenhouse gas emissions, coupled with an update to the City’s ESI Strategic Plan for 2013-2018.
TheEnterpriseEnvironmentalDataManagementsoftwarewillallowtheCitytoconsolidate,track,andmanageenvironmentalperformancedata(e.g.,energy,fuel,waste,water,employeecommuting,andmaterials).Thesoftwarewillcentrallycombinedata;measureandreportprogress;forecastbenefitsofprogramsandcampaigns;andengagestakeholderswithaccurate,up-to-date,andtransparentinformationrelatedtotheCity’senvironmentalperformancetargets.Keymetricssuch as greenhouse gas emissions and resource savings will be tracked more closelyandconsistently,resultingintheabilitytostrategicallymanageandreduceoperatingcostsandnegativeenvironmentalimpacts.
ENTERPRISE ENVIRONMENTAL DATA MANAGEMENT SOFTWARE
Start date and end date .................. March 2012 – September 2015
Upfront Cost .................................... $40,000
Funding Source ............................... ARRA
Annual Energy Savings ................... Expected to drive savings across all operations
M

ESIAPPENDIXA.PROJECTPORTFOLIO2013-2018 A-5
PublicandprivatepartnersintheEastsideSustainableBusinessAlliance(ESBA)worktoacceleratetheadoptionofcleanertechnologiesandoperationalimprovementsinorgani-zationsthroughouttheEastside.Byparticipatinginprogramsandevents,businessescanovercome the green learning curve more quickly–improving environmental, economic, and socialbottomlines–withtheadviceandsupportofaknowledgeablebusinesscommunity.The ESBA website at esba.sustainableeastside.org is home to feature stories, case studies, presentationarchives,andemergingprograms.
ESBA was launched in 2010 and has grown to engage over 100 eastside businesses of alltypesandsizes.Otherbenefitsofparticipationinclude:
• no cost
• technical tools
• idea-sharing
• marketingopportunities
• community building
• events
• roundtables
• expert advice
• bestpractices
EASTSIDE SUSTAINABLE BUSINESS ALLIANCE
Strategic Initiatives & Data ManagementCommunity & Business Engagement
C
ESIAPPENDIXA.PROJECTPORTFOLIO2013-2018 A-6
EASTSIDE GREEN BUSINESS CHALLENGE
GREENWA.ORG SUSTAINABILITY ENGAGEMENT WEBSITE
TheEastsideGreenBusinessChallengeisafriendlycompetitionamonglocalorganizationsand6eastsidecities(Bellevue,Issaquah,Kirkland,Renton,Sammamish,andMercerIsland)toseewhocansavethemostmoneyandnaturalresourcesinoneyear.
The Challenge successfully launched in January 2012 and gives businesses a year to make as many improvements to their sustainability performance as possible. With a convenientonlinescorecard,participatingentitieshaveinsideraccesstofreeresourcesthathelpthemprioritizeandtackletheissuesthatmattermost.TheChallengeissupported with generous funding from ICLEI–Local Governments for Sustainability andcorporatesponsorsincludingCascadePowerGroup,OfficeDepot,PugetSoundEnergy,RepublicServices,CedarGroveComposting,andmore.TheChallengeaimstosavethecombinedbusinesscommunityover$2millionand10,000MTCO2e.
Bellevue’s GreenWA.org website is a community engagement platform that helps residents, businesses, and tourists tour and learn about the sustainability assets in Bellevue. Users are treated to a database of fun and educational maps, videos, and knowledge pieces that highlight where, how, and why to live more sustainably in Bellevue.
The“Maps”portionofthesiteallowsuserstoidentifyawidevarietyofsustainabilityassets—where they can commute via bicycle, spot salmon in the streams, or recycle an old television, for example. Did you spot a rain garden that you want to know more about?JustclickintothemapmarkerformoreinformationonhowthisassetishelpingBellevue meet its environmental stewardship goals and how to build your own.
C
C
Start date and end date ................. January 2012 through December 2012(programmaybecontinued)
Grant ............................................... $25,000grant,plusin-kindand numerous corporate sponsorships
Funding Source .............................. ICLEI–Local Governments for Sustainability and private sector sponsorships
Annual Financial Savings Goal ....... $2million
Annual CO2 Reduction Goal ............ 10,000 MTCO2e
ESIAPPENDIXA.PROJECTPORTFOLIO2013-2018 A-7
Byviewingvideos,readingarticles,orsigningupforvolunteeropportunitiesontheevents calendar, residents will be able to learn and engage with each other toward common goals – healthy living, clean air, and clean water. The website also allows the Citytocontinuetosurveywhereandhowitispushingtheenvelopeonsustainabilityinnovationsandwhereithasmoreworktodo.
Thesiteisbeingbuiltwiththeintentionofexpansiontoregionaljurisdictionsandwithhopesofbecominganationalshowpieceforcommunityengagementoncriticalsustainability issues.
TheCityprovideshelptoBellevueschoolsinsettinguporimprovingwastereduction,waterconservation,compostingandrecycling–actionsthatcansaveresourcesaswellas money on solid waste bills. Outreach assistance is also available on other environmentaltopicssuchasdrinkingwater,conservation,pollutionprevention,salmonmigrationandreducingyourcarbonfootprint.
SCHOOLS OUTREACHC
Project start and end date ............. 2012 – ongoing
Total cost ........................................ $124,000
Funding Source .............................. ARRA
Start date and end date ................. Ongoing
Outcomes ....................................... Youtheducationprogramsreachedabout 4,500 students
ESIAPPENDIXA.PROJECTPORTFOLIO2013-2018 A-8
CARBON YETI
Start date and end date ................. April 2007 through present
Total cost ........................................ $122,339asofApril2012
Funding Source .............................. Washington State Department of EcologyCoordinatedPrevention Grant, solid waste fund, storm water funding
Annual pledges .............................. 850 pledges between 12/17/07 and 7/12/10
Annual MTCO2e Savings .................. 1,604MTCO2eperyearestimated assuming 100 percent of people pledging changed their behavior (equivalenttoa13.5percentannual reductionperpersonfromWAper capitaCO2emissions)Cost per MTCO2e reduced** $47per($75,338forthe2.6year pledgeperiodabove)
*calculatedfromCarbonYetianalysisspreadsheet,providedbyCityofBellevueUtilitiesDepartment
Residents can cut greenhouse gas emissions and conserve energy at home without hugelifestylechanges.TheCityofBellevueofferstipswiththehelpofamascotforenvironmentalstewardship,theCarbonYeti.
In the “Smaller Footprint Pledge” book, the cartoon Bigfoot shows ways to save energyinandaroundone’shome.TheCarbonYetihasaninteractivehouseonlineatwww.BellevueWA.gov/yetihouse with related games too.
TheCarbonYetiearnedtheCityaCleanAirExcellenceAwardfromtheEnvironmentalPro-tectionAgencyin2011,theYouthEducationRecyclerof2010fromtheWashingtonStateRecyclingAssociation,andtheGreenCityAwardin2012fromWaste&RecyclingNews.
C
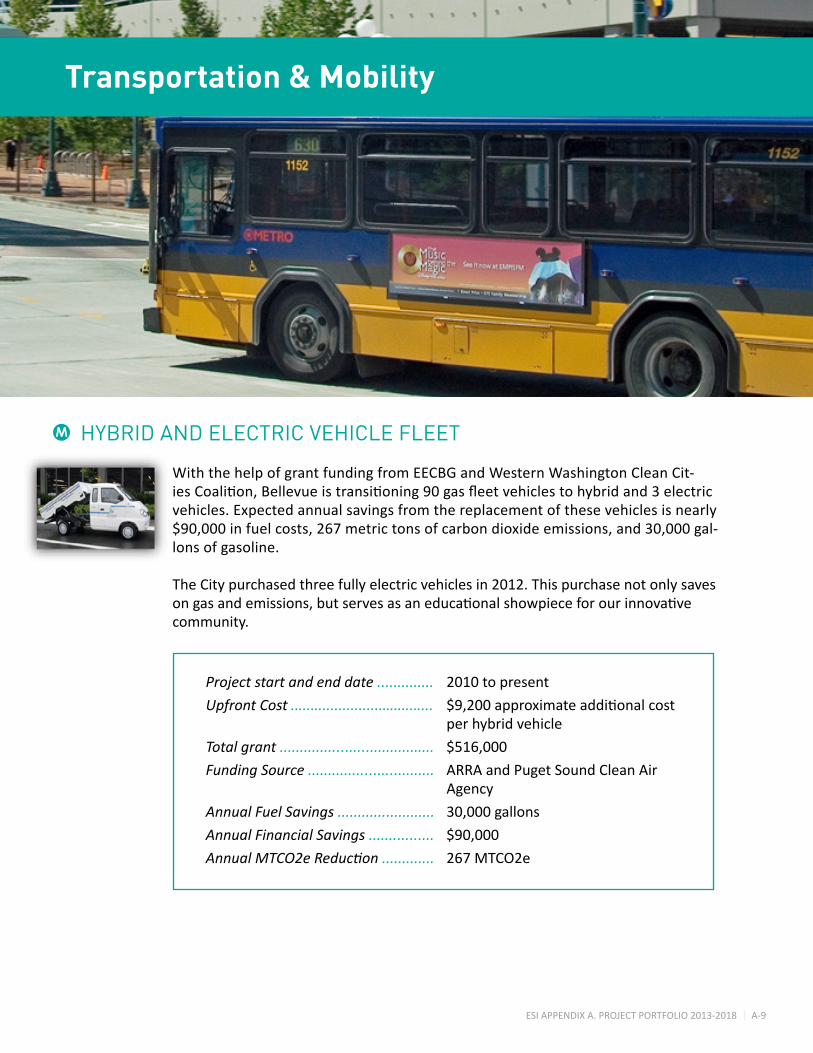
ESIAPPENDIXA.PROJECTPORTFOLIO2013-2018 A-9
With the help of grant funding from EECBG and Western Washington Clean Cit-iesCoalition,Bellevueistransitioning90gasfleetvehiclestohybridand3electricvehicles. Expected annual savings from the replacement of these vehicles is nearly $90,000infuelcosts,267metrictonsofcarbondioxideemissions,and30,000gal-lons of gasoline.
The City purchased three fully electric vehicles in 2012. This purchase not only saves ongasandemissions,butservesasaneducationalshowpieceforourinnovativecommunity.
HYBRID AND ELECTRIC VEHICLE FLEETM
Strategic Initiatives & Data ManagementTransportation & Mobility
Project start and end date .............. 2010 to present
Upfront Cost .................................... $9,200approximateadditionalcost per hybrid vehicle
Total grant ...................................... $516,000
Funding Source ............................... ARRA and Puget Sound Clean Air Agency
Annual Fuel Savings ........................ 30,000 gallons
Annual Financial Savings ................ $90,000
Annual MTCO2e Reduction ............. 267 MTCO2e
ESIAPPENDIXA.PROJECTPORTFOLIO2013-2018 A-10
Bellevue has a comprehensive approach to reducing vehicle trips in the community through commutetripreduction(CTR)programsatworksitesandoutreachtoemployeesandresi-dents.Largeemployers,with100ormoreemployeescommutingtoaworksiteinthe6am-9am peak period, are required per state laws and City ordinance to establish programs (BCC14.40).TheseemployersreceiveassistancefromtheCitythroughacontractwithKingCountyMetrotodevelopeffectiveprogramsandmeasureprogress.
ThebaseofworkersatsitesaffectedbytheCTRprogramhasexpanded.In2007/2008,therewere21,316workersat52sites(~15percentoftotalworkersintheCity).Duringthe2011/2012surveyperiod,therewere32,449workersat60affectedworksites(~24percentoftotalworkersintheCity).Therateofdrive-alonecommutingatthesesitesincreasedslightly,from63.2percentto63.9percent.Theaverage(one-way)vehiclemilestraveleddeclined from 11.4 to 10.9.
DowntownBellevuetripreductionprogramsareguidedbytheCity’sConnectDowntownplan. Small employers in Downtown who are not mandated to provide CTR programs for their employees can receive support though the voluntary Commute Advantage program. Sincelaunchingtheprograminlate2007,164employershavesubstantivelyengagedwiththeprogrambyattendingworkshopsorprivateconsultation,and72havestartedcommuteprogramsfortheiremployeesorsignificantlyenhancedtheirexistingcommuteprogram.Overall, one-third of workers in Downtown receive transit passes that are heavily or fully subsidizedbytheiremployers.Themostrecentmodesharemeasurement(2011)shows17percentofcommutetripstoDowntownoccurringviatransitandanadditional11percentby carpool and vanpool.
The City also started an online commute club, “Downtown Bellevue on the Move”, in 2011 for downtown workers and residents, in which they can log their non-drive-alone trips and earnrewards;anestimated120individualsshiftedtoanon-drive-alonemodeasaresultoftheprogram.Theproportionofdowntowncommuterswhodrivealonetoworkisat65percent in 2011, down from 71 percent in the 2005 measurement.
CitizensurveysconsistentlyshowstrongsupportamongBellevueresidentsforencouragingandfacilitatingincreaseduseoftransportationalternatives,suchasridingthebus,car-pooling, and vanpooling. The City maintains the ChooseYourWayBellevue.org website as a one-stopresourceforemployers,employees,andresidentstolearnabouttransportationoptionsandavailableresources.
TRANSPORTATION DEMAND MANAGEMENT PROGRAMSC
Program start and end date ................................ 2007topresent(CTRprogramforlargeemployersstartedin1993)
Annual CTR program cost, 2012 (Actual) ........... StateCTRgrantandCitystafftimeandoverhead($112,226)
Other TDM program costs, 2012 (Actual) ........... Cityfunds($245,268)+FederalCMAQfundsthroughKingCounty($77,779)+StateI-405constructionmitigationfundsthroughKingCounty($128,990)=$452,037
Cost per MTCO2e reduced , CTR program only ........ $5.87
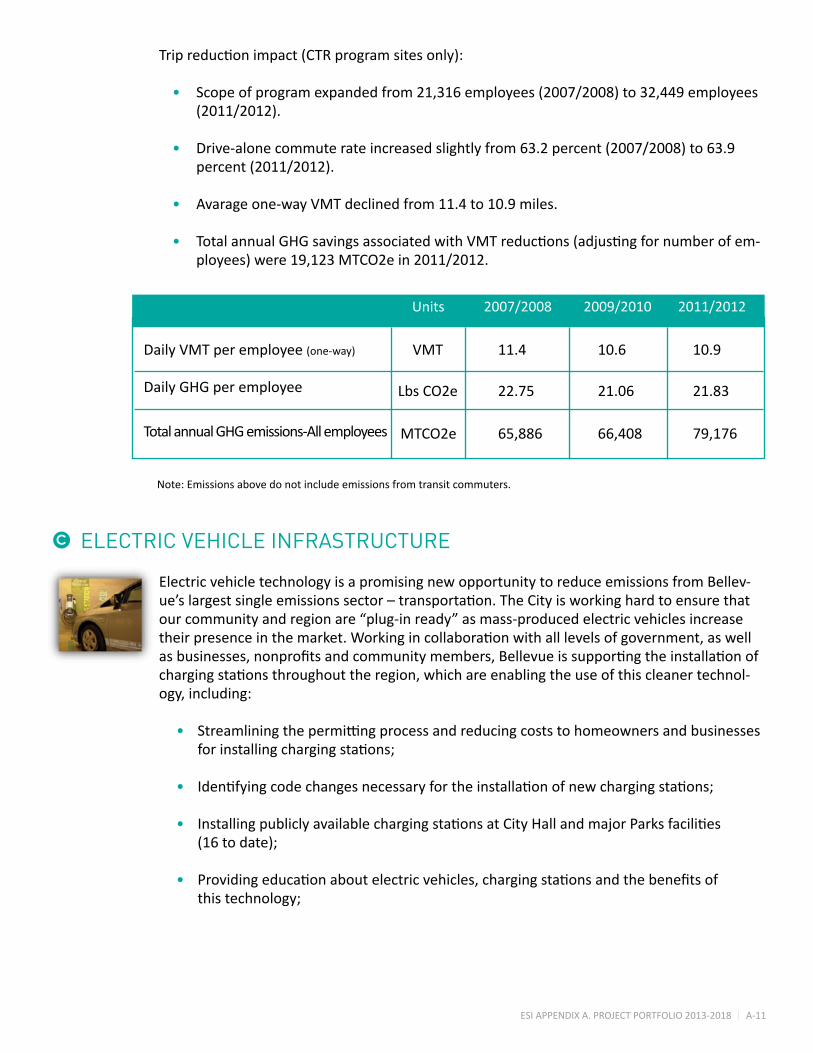
ESIAPPENDIXA.PROJECTPORTFOLIO2013-2018 A-11
Tripreductionimpact(CTRprogramsitesonly):
• Scopeofprogramexpandedfrom21,316employees(2007/2008)to32,449employees(2011/2012).
• Drive-alonecommuterateincreasedslightlyfrom63.2percent(2007/2008)to63.9
percent(2011/2012).
• Avarage one-way VMT declined from 11.4 to 10.9 miles.
• TotalannualGHGsavingsassociatedwithVMTreductions(adjustingfornumberofem-ployees)were19,123MTCO2ein2011/2012.
Electric vehicle technology is a promising new opportunity to reduce emissions from Bellev-ue’slargestsingleemissionssector–transportation.TheCityisworkinghardtoensurethatour community and region are “plug-in ready” as mass-produced electric vehicles increase theirpresenceinthemarket.Workingincollaborationwithalllevelsofgovernment,aswellasbusinesses,nonprofitsandcommunitymembers,Bellevueissupportingtheinstallationofchargingstationsthroughouttheregion,whichareenablingtheuseofthiscleanertechnol-ogy, including:
• Streamliningthepermittingprocessandreducingcoststohomeownersandbusinessesforinstallingchargingstations;
• Identifyingcodechangesnecessaryfortheinstallationofnewchargingstations; • InstallingpubliclyavailablechargingstationsatCityHallandmajorParksfacilities
(16todate); • Providingeducationaboutelectricvehicles,chargingstationsandthebenefitsof
thistechnology;
ELECTRIC VEHICLE INFRASTRUCTUREC
Units 2007/2008 2009/2010 2011/2012
Daily VMT per employee (one-way) 11.4 10.6 10.9
Daily GHG per employee 22.75 21.06 21.83
Total annual GHG emissions-All employees 65,886 66,408 79,176
Note: Emissions above do not include emissions from transit commuters.
VMT
Lbs CO2e
MTCO2e

ESIAPPENDIXA.PROJECTPORTFOLIO2013-2018 A-12
• CoordinatingaregionalEVinfrastructurestrategywithneighboringcities, KingCounty,andthestate; • ProcuringelectricvehiclesforuseinCityfleets(3todate);and • Stay tuned to all developments in this emerging industry.
Bellevue has received direct funding for electric vehicle infrastructure from both the WesternWashingtonCleanCitiesCoalitionandEECBG.Withthisfunding,theCityhasinstalled16publicusechargingstationsat6differentmunicipallocations.Majorcontributionstoarobustchargingnetworkacrossnorthwesternstatesarebeingmadebyseveralotherentities,includingprivatebusinesses,ChargePointAmerica,andtheEV Project.
Program start and end date ................. November 2010 to October 2012
Cost ...................................................... $260,000grant
Funding Source ..................................... ARRA, Western Washington CleanCitiesCoalition,and Coulomb Technologies
Cumulative MTCO2e Reduction ............ 6.97 MTCO2e since March 2011 through October 2012

ESIAPPENDIXA.PROJECTPORTFOLIO2013-2018 A-13
ExtensivelightingupgradestookplaceatRobinswoodTennisCenter,SouthBellevueCommunityCenter,NewportHillssportsfields,andHighlandCentersportsfields.Newlightingsystemsprovidehigherqualitylightwithfewerbulbsandlessspillage,savingmoneyandenergywhilesubstantiallyimprovingsportsfieldandrecreationalfacilities.
RECREATION FACILITY LIGHTING UPGRADESM
Strategic Initiatives & Data ManagementEnergy & Water
Project start date Robinswood Tennis Center ...... installed 8.25.10
SBCC ........................................ installed 8.25.10 Newport Hills .......................... installed 7.28.10 Highland Center ...................... installed 9.1.10Upfront Cost ................................... $350,000 Funding Source ............................... ARRA and Puget Sound Energy
Annual Fuel Savings........................ 335,000 kWh
Annual Financial Savings ............... $37,000
Annual MTCO2e Reduction ............ 232 MTCO2e Payback Period .............................. 9.4 yearsCost per MTCO2e reduced ............. $151(assuming10yearlifespan)
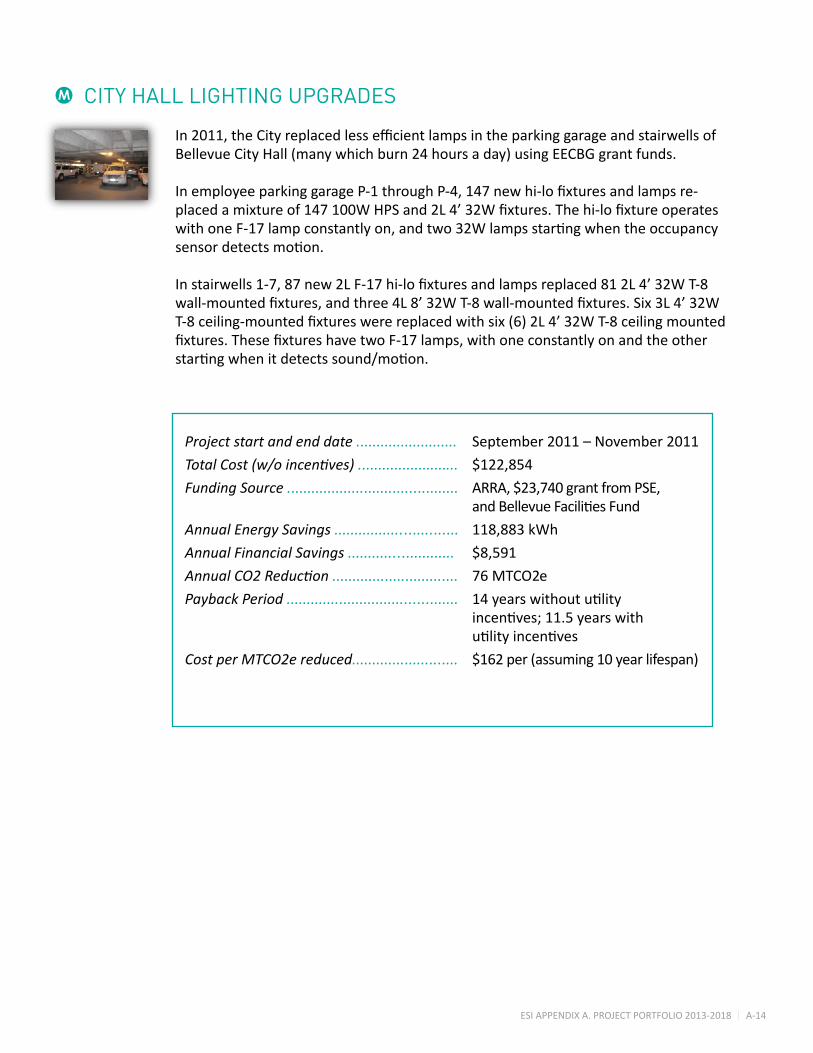
ESIAPPENDIXA.PROJECTPORTFOLIO2013-2018 A-14
CITY HALL LIGHTING UPGRADES
Project start and end date ......................... September 2011 – November 2011
Total Cost (w/o incentives) ......................... $122,854
Funding Source .......................................... ARRA,$23,740grantfromPSE, andBellevueFacilitiesFund
Annual Energy Savings .............................. 118,883 kWh
Annual Financial Savings .......................... $8,591
Annual CO2 Reduction ............................... 76 MTCO2e
Payback Period .......................................... 14yearswithoututility incentives;11.5yearswith utilityincentives
Cost per MTCO2e reduced.......................... $162per(assuming10yearlifespan)
In2011,theCityreplacedlessefficientlampsintheparkinggarageandstairwellsofBellevueCityHall(manywhichburn24hoursaday)usingEECBGgrantfunds.
InemployeeparkinggarageP-1throughP-4,147newhi-lofixturesandlampsre-placedamixtureof147100WHPSand2L4’32Wfixtures.Thehi-lofixtureoperateswithoneF-17lampconstantlyon,andtwo32Wlampsstartingwhentheoccupancysensordetectsmotion.
Instairwells1-7,87new2LF-17hi-lofixturesandlampsreplaced812L4’32WT-8wall-mountedfixtures,andthree4L8’32WT-8wall-mountedfixtures.Six3L4’32WT-8ceiling-mountedfixtureswerereplacedwithsix(6)2L4’32WT-8ceilingmountedfixtures.ThesefixtureshavetwoF-17lamps,withoneconstantlyonandtheotherstartingwhenitdetectssound/motion.
M
ESIAPPENDIXA.PROJECTPORTFOLIO2013-2018 A-15
ENERGY STAR RATING FOR BELLEVUE CITY HALL
Certification dates ..................................... 2008, 2010
Total Cost .................................................... $5,000forinitialcertification, $1,000insubsequentyears
Total Financial Savings .............................. $186,175comparedtotheyear of2008(approx.$53,000per year)throughJune2012, adjustingforoutsideair temperature and rate changes
MTCO2e Reduction* ................................... 862 MTCO2e compared to the year of 2008, as of June 2012*CalculatedusingPortfolioManager
BellevueCityHallhastwiceearnedtheU.S.EnvironmentalProtectionAgency’s(EPA’s)pres-tigiousENERGYSTARin2008and2010.ENERGYSTARisthenationalsymbolforprotectingtheenvironmentthroughsuperiorenergyefficiency.EPA’sENERGYSTARenergyperfor-mancescalehelpsorganizationsassesshowefficientlytheirbuildingsuseenergyrelativetosimilarbuildingsnationwide.Abuildingthatscoresa75orhigheronEPA’s1-100scalemaybe eligible for the ENERGY STAR.
NotonlyhasCityHallearnedtheawardtwice,itisoutperformingmostbuildingsnation-wide.Ascoreof96meansCityHallisinthetopfourpercentofsimilarbuildingsnation-wide.Twenty-fivebuildingsarecurrentlycertifiedasENERGYSTARinBellevue.OnlythreecityhallsinWashingtonStatearecertified,andfourteenacrossthenation.
As of June 2012, Bellevue City Hall has reduced its total energy use 25.7 percent since the year ending December 2008!
M
CITY HALL RATING
2007 2008* 2009 2010* 2011 2012*Certified
838789919697
ESIAPPENDIXA.PROJECTPORTFOLIO2013-2018 A-16
TRAFFIC SIGNAL UPGRADES
RESOURCE CONSERVATION MANAGER PROGRAM
Bellevue’sTransportationDepartmenthasreplacedallincandescentlightbulbsintrafficsignalswithnewlight-emittingdiodes(LEDs),startingtheupgradein2001.
The savings to the City in costs, energy, and carbon dioxide emissions are some of the most impressiveofanymunicipalenergyefficiencyprojectstodate.
Savingsareexpectedtoaccumulateovertime.
TheResourceConservationManager(RCM)program,startedin2009,focusesonreducingenergyusethroughouttheCity’sfacilities,aswellaswaterconservationandwasteprevention.
As of April 2012, the RCM program reduced greenhouse gas emissions by 1,595 metric tons ofcarbondioxide(MTCO2e)comparedtothebaselineyearendingMarch2009.
SomeoftheenergyconservationprojectsthattheCityhasimplementedthusfarinclude:
• Upgradinglightingefficiencyandcontrol;
• Schedulingmechanicalequipmenttobettermatchoccupancy;
• Adjustinghotwatertemperaturesto120F;
• Installingvariablefrequencydrivesonpumpsandmotors;
• Reducingunnecessaryplugloads;
• Installinglow-flowwaterfixturessuchasshowerheadsandaerators;
• Educatingandengagingemployeesaboutenergyefficiency;
• HiringEnergyServicesPerformanceContractors(ESCO)toidentify furtherprojects,assistwithfinancing,andinstalltheprojects;and
• Reportingonperformance.
M
M
Project start and end date ............. 2001 - 2012
Total cost ...................................... $493,000from2009to2012
Annual Financial Savings .............. $196,000(2012)
Annual MTCO2e Reduction*.......... 989 MTCO2e in 2012, a 95 percent reductioncomparedto2000
Simple Payback ............................. 2.6 years
Cost per MTCO2e reduced ............ $71(assuminga7-yearlifespan)
*uses base load eGrid emission factors
ESIAPPENDIXA.PROJECTPORTFOLIO2013-2018 A-17
INFORMATION TECHNOLOGY ENERGY EFFICIENCY
Program start and end date .............. April 2009 – April 2012
Total Cost ............................................ $88,389peryear
Funding Source ................................. PugetSoundEnergygrantof$28,000 peryear;cityenergybillsavings
Cumulative Energy Saving goal ............ 3,614,320kWh;80,407therms
Financial savings goal ......................... $180,500peryear,$345,920 cumulatively
MTCO2e Reduction goal ....................... 1,427MTCO2eperyear;2,740 MTCO2ecumulatively
Actual Energy Savings .......................... 3,345,670kWh;140,724therms
Actual Cost Savings .............................. $217,319annually,$391,971 cumulatively
Actual MTCO2e Reduction ................... 1,595 MTCO2e annually, 2,888 MTCO2ecumulatively
Cost per MTCO2e reduced .................... $60(includesoffsetofPSEgrant)
M
Inwinterof2007,theCityinstalledtheNightwatchmansoftwarethatpowersdownCitymonitorsandCPUsatmidnight.TheResourceConservationManagerprogramandtheITChangeAdvisoryBoardchangedthissettingto10p.m.(previouslyitwasmidnight)inthesummer of 2010 and implemented Nightwatchman for laptops. IT also assisted in imple-mentedsleepmodeformonitorsaftertenminutesofinactivityinlate2010.
AllCitycomputersareratedasENERGYSTAR.Computersboughtinthefuture(asof2010)bytheCitywillbeElectronicProductEnvironmentalAssessmentTool(EPEAT)Gold-rated(HPstandard)andRestrictionoftheuseofcertainHazardousSubstances(RoHS)compli-ant—which are high environmental standards for toxicity, materials, and energy use in electronics.Multi-FunctionDevices(MFPs)leasedbytheCityarealsoENERGYSTAR-rated.
Inaddition,IThasagoalofvirtualizingitsserversfromthecurrent30to40percentvirtu-alization(approximately60servers)to70to85percentvirtualization(approximately100moreservers).Currently60percentofserversarevirtualized(asofMarch2012).Virtualiz-ingserversmeansreducingtheamountofhardware(andinfrastructure)neededtosupportthesamefilestorage.ThisreducesenergyconsumptioninDataCentersbyupto30percentfor each server replaced.
ESIAPPENDIXA.PROJECTPORTFOLIO2013-2018 A-18
GREEN BUILDING
Start date and end date .............................. 2007
Annual cost ................................................. $5,197/year
Energy savings ............................................ 94,448 kWh/ year
Financial savings ........................................... $6,826/year
MTCO2e Savings........................................... 60 MTCO2e/ year
Cost per MTCO2e reduced ........................... $86.61
CM
Bellevue’sGreenTeamstartedasamultidepartmentalteamwithexpertiseingreenbuildingsandsustainabledevelopment.CitystaffmemberswhoareLEEDAPcertifiedandtrainedinLowImpactDevelopment(LID)practicesareprovidingreviewofcurrentbuild-ingcodesforalignmentwithbestpracticesforbothLIDandgreenbuilding.DevelopmentServicesstaffencouragegreenerdevelopmentinBellevuebyprovidingaccesstoresources,knowledgeable support, and expert review of green building projects.
In 2012, there were 22 projects in the City of Bellevue that have been awarded LEED cer-tification,and24projectsthathadregisteredforLEEDcertification.LEEDCertificationisexpectedtogrowastheCity’scapacitytosupport,incentivize,andmarkettheseprojectscontinuestoincrease.
TheCityhaspursuedgreenbuildingfeaturesatCityHall(ENERGYSTAR-certified)andtheMercerSloughEnvironmentalEducationCenter(LEEDGold-certified)andinstalledgreenroofsattheLakeHillsRangerStationandLewisCreekPark.TheBellevueBotanicalGardensVisitorCenteriscurrentlyplannedforamajorrenovationandwillalsolikelyincorporategreenfeaturessuchasagreenroofandday-lighting.TheCityofBellevueplanstocontinuetopursuecost-effectivegreenbuildingfeatureswhenconstructingorrenovatingfacilities.Studiesshowthatthesebuildingsprovidecostsavingsovertheirlifetimeandarehealthierplaces to work and live.

ESIAPPENDIXA.PROJECTPORTFOLIO2013-2018 A-19
HOME ENERGY REPORTS
Project start and end date ...................... November 2010 to present
Upfront Cost ........................................... $350,000
Funding Source ...................................... ARRAandPSE($175,000each)
Annual Energy Savings ........................... TBD
Annual Financial Savings ........................ $38.18perBellevuehousehold;$4.2 million for all eastside households
Annual MTCO2e Reduction...................... 7,076 MTCO2e
Cost per MTCO2e reduced....................... $49(assumingoneyearlifespanof behaviorchange)
Nearly 35,000 Bellevue residents received free Home Energy Reports showing how their energy use compares with similar-sized homes in their neighborhood. The Home EnergyReports,senttonearly100,000homesontheEastside,offerparticipantsanenvironmentallyfriendlywayto“beattheJoneses.”Inadditiontocomparingenergyuse,thereportsoffertipsforcuttinghouseholdconsumptionofgasandelectricity.Eastside residents who received the reports responded to the comparison challenge and cut their use. Altogether, over the course of the 14-month program, residents savedmorethan$4.2millionontheirelectricityandgasbills.
Inadditiontosavingmoney,participantsinBellevue,Kirkland,Issaquah,MercerIsland,Redmond,Renton,andSammamishcollectivelyhaveavertedmorethan15.6millionpoundsofcarbondioxideemissionsandsaved9.3gigawatthoursand1.3millionthermsofenergy.Thisisroughlyequivalenttotaking801homesoffthegridforayear,or1,360carsofftheroadforayear.
Acrossallcities,an800percentreturnoninvestmentwasseenwiththeaveragehomesavingabout$45.Bellevuealoneaverted4.5millionpoundsofcarbondioxideemissions,theequivalentoftaking389carsofftheroadforoneyear.Bellevuehouseholdsreceivingthereportsaresavinganaverageof$38inenergycostspermonth,whileeachhomeenergyreportcosttheCity$5toproduce.
C
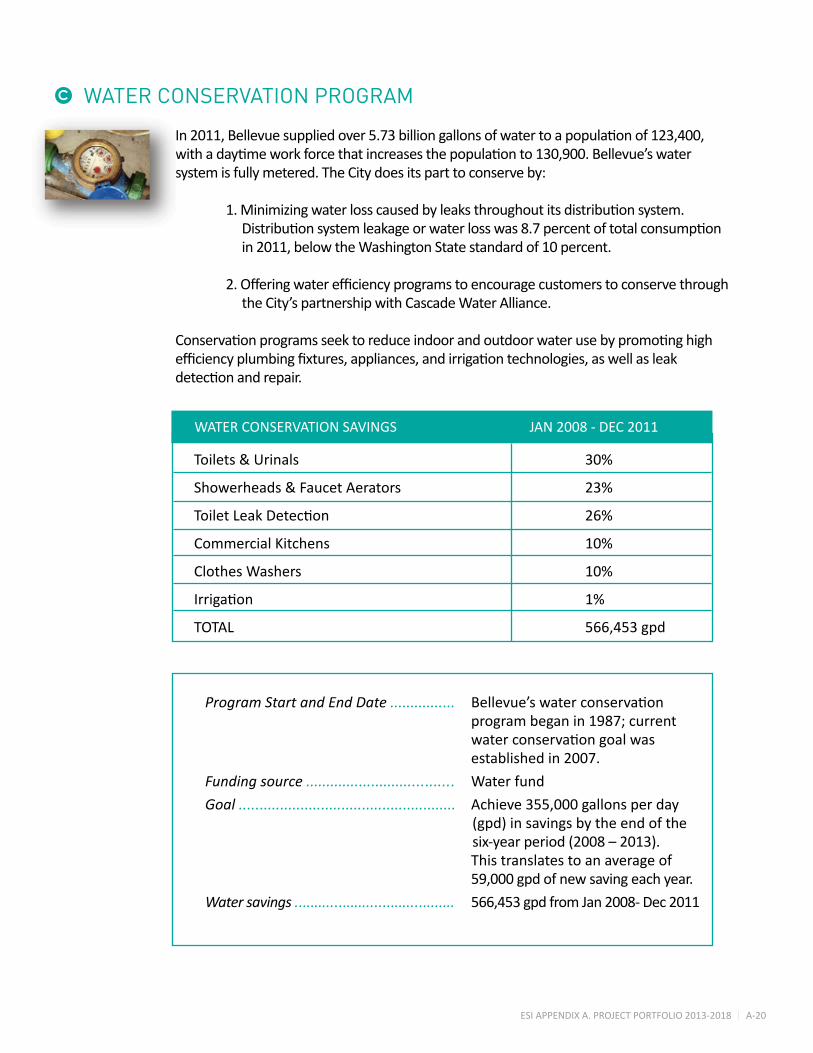
ESIAPPENDIXA.PROJECTPORTFOLIO2013-2018 A-20
WATER CONSERVATION PROGRAM
Program Start and End Date ................ Bellevue’swaterconservation programbeganin1987;current waterconservationgoalwas established in 2007.
Funding source .................................... Water fund
Goal ..................................................... Achieve 355,000 gallons per day (gpd)insavingsbytheendofthesix-yearperiod(2008–2013).
This translates to an average of 59,000 gpd of new saving each year.
Water savings ........................................ 566,453 gpd from Jan 2008- Dec 2011
In2011,Bellevuesuppliedover5.73billiongallonsofwatertoapopulationof123,400,withadaytimeworkforcethatincreasesthepopulationto130,900.Bellevue’swatersystem is fully metered. The City does its part to conserve by:
1.Minimizingwaterlosscausedbyleaksthroughoutitsdistributionsystem. Distributionsystemleakageorwaterlosswas8.7percentoftotalconsumption in 2011, below the Washington State standard of 10 percent.
2.Offeringwaterefficiencyprogramstoencouragecustomerstoconservethrough the City’s partnership with Cascade Water Alliance.
Conservationprogramsseektoreduceindoorandoutdoorwaterusebypromotinghighefficiencyplumbingfixtures,appliances,andirrigationtechnologies,aswellasleakdetectionandrepair.
C
WATER CONSERVATION SAVINGS JAN 2008 - DEC 2011
Toilets & Urinals
Showerheads & Faucet Aerators
ToiletLeakDetection
Commercial Kitchens
Clothes Washers
Irrigation
TOTAL
30%
23%
26%
10%
10%
1%
566,453 gpd

ESIAPPENDIXA.PROJECTPORTFOLIO2013-2018 A-21
SUNSHOT INITIATIVE FOR SOLAR ENERGY
Program Start ....................................... 2012
Funding source ....................................... Federal Department of Energy Grant,in-kindlaborcontributionof $10,000fromBellevuestaff
Grant amount ....................................... $523,800(Bellevue’sshareofthe grantis$65,000)
TheDepartmentofEnergyislaunchinganationwideefforttomakesolarenergymoreaccessibleandaffordable,increasedomesticsolardeployment,andpositiontheU.S.as a leader in the rapidly-growing global solar market.
TheSunShotinitiative’sgoalistocutredtape—streamliningandstandardizingpermitting,zoning,metering,andconnectionprocesses—andimprovefinanceop-tionstoreducebarriersandlowercostsforresidentialandsmallcommercialroof-top solar systems.
TheWashingtonStateDepartmentofCommerceteamreceived$523,800tocreateanonlinepermittingsystem,shortenpermittingprocessingturnaroundtimes,andfixfeesthroughthiseffort.Theteamisworkingtoeliminatetheuseofexternaldisconnectswitchesandwillliftsystemsizeandprogramcapacitylimits.DOEwillaward$12Millionto22teamsnationwidetohelpreducebarriersandserveasmodelsforothercommunities.
The Washington State Department of Commerce team includes the following partner organizations:CitiesofSeattle,Bellevue,Edmonds,andEllensburg;NorthwestSEED;SolarWA;ThurstonEnergy;SustainableConnections;andservingpowerutilities.
C
ESIAPPENDIXA.PROJECTPORTFOLIO2013-2018 A-22
InApril2008,theCitypassedadouble-sidedprintingpolicyforallblackandwhiteprinters/copiers in City Hall. This reduced the number of prints by 17 percent between April2008andMarch2009.Theoverallsavingsduetothereductioninpaperusagewas$7,797inthatyear.
Otherpaper-reductioninitiativesincludee-billingforcustomers,firestationseliminat-ing paper dispatch records, and employees receiving paperless paychecks.
TheCityofBellevue,ledbytheFinanceDepartmentandtheResourceConservationTeam,madeagoaltoreducepaperuseby5percentin2010.Througheducation,copierconsolidation,andmorescanningoptions,Bellevueemployeesreducedpapercopies by more than 10 percent in 2010, and reduced prints by another 11 percent in 2011 below 2010.
PAPER USE REDUCTIONM
Cost savings .................................... $81,203inprintingandpapercosts (2010);$27,350.39(2011compared to2010)
Paper savings .................................. 1.2millionsheets(2010);556,500 sheets(2011comparedto2010)
MTCO2e savings ............................. 7.6 MTCO2e compared to base year of 2009
Strategic Initiatives & Data ManagementMaterials Management & Waste
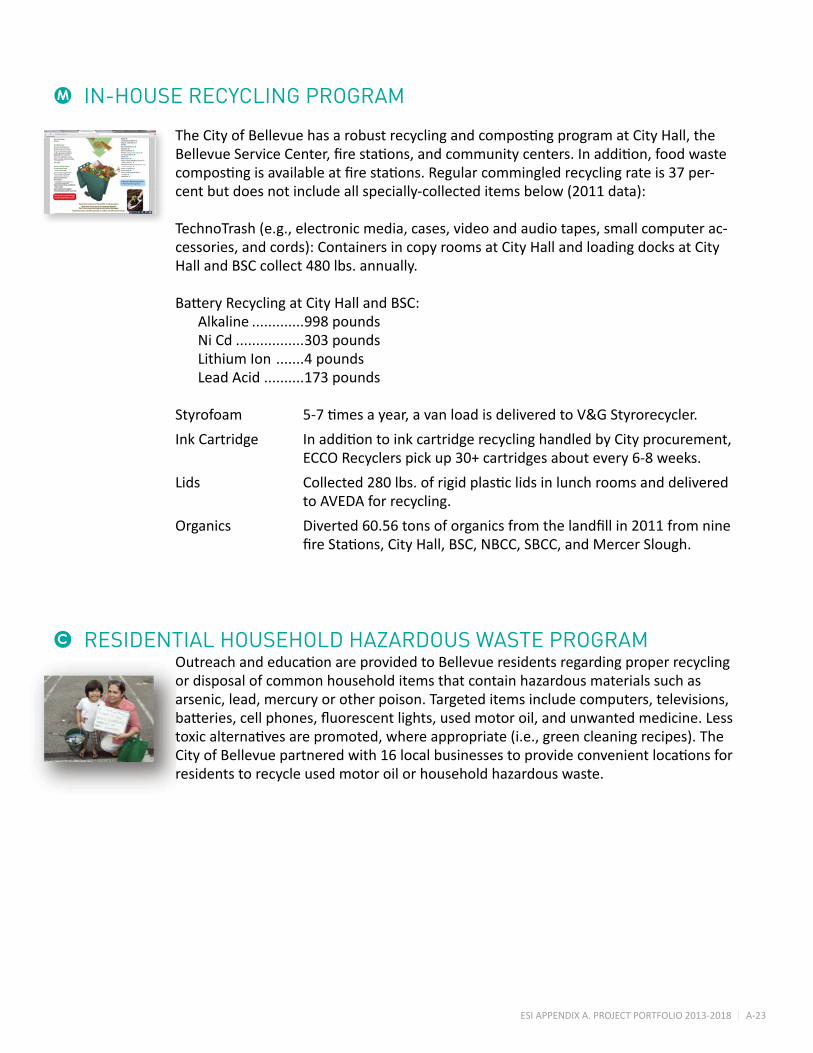
ESIAPPENDIXA.PROJECTPORTFOLIO2013-2018 A-23
IN-HOUSE RECYCLING PROGRAM
RESIDENTIAL HOUSEHOLD HAZARDOUS WASTE PROGRAM
M
C
TheCityofBellevuehasarobustrecyclingandcompostingprogramatCityHall,theBellevueServiceCenter,firestations,andcommunitycenters.Inaddition,foodwastecompostingisavailableatfirestations.Regularcommingledrecyclingrateis37per-centbutdoesnotincludeallspecially-collecteditemsbelow(2011data):
TechnoTrash(e.g.,electronicmedia,cases,videoandaudiotapes,smallcomputerac-cessories,andcords):ContainersincopyroomsatCityHallandloadingdocksatCityHall and BSC collect 480 lbs. annually.
BatteryRecyclingatCityHallandBSC: Alkaline .............998 pounds Ni Cd .................303 pounds Lithium Ion .......4 pounds Lead Acid ..........173 pounds
Styrofoam 5-7timesayear,avanloadisdeliveredtoV&GStyrorecycler.
InkCartridge InadditiontoinkcartridgerecyclinghandledbyCityprocurement,ECCORecyclerspickup30+cartridgesaboutevery6-8weeks.
Lids Collected280lbs.ofrigidplasticlidsinlunchroomsanddeliveredto AVEDA for recycling.
Organics Diverted60.56tonsoforganicsfromthelandfillin2011fromninefireStations,CityHall,BSC,NBCC,SBCC,andMercerSlough.
OutreachandeducationareprovidedtoBellevueresidentsregardingproperrecyclingor disposal of common household items that contain hazardous materials such as arsenic, lead, mercury or other poison. Targeted items include computers, televisions, batteries,cellphones,fluorescentlights,usedmotoroil,andunwantedmedicine.Lesstoxicalternativesarepromoted,whereappropriate(i.e.,greencleaningrecipes).TheCityofBellevuepartneredwith16localbusinessestoprovideconvenientlocationsforresidents to recycle used motor oil or household hazardous waste.
ESIAPPENDIXA.PROJECTPORTFOLIO2013-2018 A-24
RESIDENTIAL RECYCLING PROGRAM
Start date ......................................... Single-family recycling program began in1989,andthemultifamilyprogram began in 1993.
Tons of waste generated (2011) ...... 62,332 tons of waste (residentialandmultifamily)
Tons diverted (2011) ........................ 34,703 tons of waste diverted from thelandfillin2011(residentialand multifamilyonly)
In 2011, Bellevue’s robust single-family residents recycled 67.7 percent of their waste, whichincludesorganics;multifamilyandcommercialtenantsrecycled24.3percentoftheir waste. Overall, Bellevue diverted 39 percent of garbage to recycling or compost-ingin2011(includingcommercial).
C
CONTAINS MERCURY 2006 – DEFINITELY/PROBABLY 2010 – DEFINITELY/PROBABLY
Thermostats 52% 69%
FluorescentLightBulbs 36% 51%
Computers 39% 51%
Program Start and End Date ................ 1993 through present
Funding Source .................................... Washington State Department of EcologyCoordinatedPrevention Grant and King County Local Hazardous Waste Management Program Grant
Annual Outcomes ............................... Consistent annual used motor oil recycling rate above 80 percent. Batteryrecyclingeventscollected 3,304 pounds of lead acid and 3,542 pounds of alkaline in 2011.
RESIDENTS’ AWARENESS OF PRODUCTS THAT CONTAIN HAZARDOUS MATERIALS ANDNEEDSPECIALHANDLING(2006;2010)
ESIAPPENDIXA.PROJECTPORTFOLIO2013-2018 A-25
BUSINESS WASTE REDUCTION & RECYCLING EDUCATION & TECHNICAL ASSISTANCE
Program Start Date ................................. 1991throughpresent;commercial recyclingofferedasacontract service by the City of Bellevue in 2004, but private services have been available for decades.
Funding Source ........................................ KingCountyWasteReduction and Recycling Grant and Solid Waste fund.
Annual Outcomes* ............................... 13,560 tons of waste diverted fromthelandfillin2011.Assistance provided to a minimum of 100 businesses each year.
*Incompleteinformationtodeterminecommercialrecyclingratebecausebusinessesmay choose any hauler for recycling. Only Allied Waste is contractually obligated to report tonnage to the City.
TheCityofBellevueprovideswastepreventionandrecyclingassistancetoBellevuebusinesses and property managers through targeted outreach and onsite technical support. The Bellevue business community consists of approximately 10,000 businesses and 130,000 employees. Bellevue businesses consistently rank among theBestWorkplacesforWasteReductionandRecyclinginKingCounty.In2011,20Bellevue businesses were awarded Best Workplaces for Recycling and Waste ReductioninKingCounty.
C

ESIAPPENDIXA.PROJECTPORTFOLIO2013-2018 A-26
TheCityprovideseducationandoutreachonpollutionpreventionbestmanagementpracticestoBellevuebusinessestohelpthemcomplywithCitycoderequirements.Assistance includes brochures, posters, ads, and onsite technical assistance.
The City also marks storm drains on private property with the message, “Don’t Pollute, DrainstoStream”afterobtainingwrittenpermissionfrompropertyowners.TheCitymarkedall15,000+ofitspublicstormdrainswiththispermanentmessage,educatingthe public and reducing pollutants entering Bellevue waterways via public drains from non-pointsources.The4-inch,colorfulplasticmarkersprovedtobehighlyvisibleandare expected to last up to 15 years.
CoalCreekWatershedresidentsweresentinformationandapledgecardpromotingBMPsforstormwaterpollutionprevention(carwashing,petwaste,andnaturalyardcare)andtoolstopromotethedesiredbehaviorsweresenttothosewhopledged.ElevenpercentreturnedthepledgecardfromCoalCreekandfivepercentofKelseyCreekresidentsreturnedtheirpledge(overthreepercentisconsideredfantastic).
POLLUTION PREVENTION EDUCATION AND TECHNICAL ASSISTANCEC
Strategic Initiatives & Data ManagementEcosystems & Open Spaces

ESIAPPENDIXA.PROJECTPORTFOLIO2013-2018 A-27
STREAM TEAM STORMWATER PROGRAM
Start date ................................... 1988
Funding source ........................... Stormwater fees
Goal/ outcome ........................... Stream Team has about 150 volunteers who donate an average of 700 volunteer hours per year. Volunteers make over 700 stream visits per yearmonitoringforfishandsamplingstreambugs.Inaddition,over3,000studentshaveengagedinStream Team programs.
The Stream Team Mission is to increase community awareness about stormwater issuesthroughmultiplemethodsofoutreachandprovideopportunitiesforcommunityinvolvementbyinvitingcitizenstohelpmonitorandrestorelocalstreams.Theresultoftheseeffortsisinformedcitizenswhoappreciateournaturalresources,arestewardsofourlo-calwaterways,andhelpspreadinformationthroughoutthecommunity.TheStreamTeamProgram has several goals that are achieved through a variety of programs about salmon, streams, and other stormwater topics. The goals are to:
• Provideinformation
• Increase community awareness
• Increase community involvement
• Initiatechangesthatwillprotectwaterqualityandhabitat
• Preventpollution
• Complywithexternalfederalandstateregulationsandrecommendations, includingNPDES(NationalPollutionDischargeEliminationSystem),WRIA8 (WatershedResourceInventoryArea8alsoknownastheCedar/Sammamish/Lake WashingtonWatershed),andtheEndangeredSpeciesAct
• ProvideservicesconsistentwiththeUtilitiesStrategicPlan,theCityofBellevueCompre- hensivePlan,andBellevue’sCoreValues(asmeasuredbyperformanceindicators)
StreamTeamvolunteersgatherimportantinformationaboutBellevue’sstreams,lakes,andwetlandsandhelpimprovetheCity’sfishandwildlifehabitatinavarietyofways: • SalmonWatcher:monitorlocalstreamsforsalmonreturninginthefall,visitingasite for15minutestwiceaweekfromSeptemberthroughDecemberandreportingwhen, whereandwhattypeofsalmonaresighted.Attendtwo-hourworkshopinSeptember.
• Peamouth Patrol: check local streams for 15 minutes twice a week from mid-April throughMay.RecordspawningtimesanduseofBellevuestreams.Attendone-hour workshop in April.
• EarthDay/ArborDay:Plantnativeplantsnearstreamsandinwetlands.
• Collect insect samples from Bellevue streams for water quality monitoring.
Inadditiontothevolunteerefforts,StreamTeamprovidesoutreachprogramsrangingfrompresentationsforschoolsaboutourlocalsalmonandstreams,tostaffingdisplaysatpubliceventsandworkingoneducationalsignageontopicslikepreventingpollution.
CM
ESIAPPENDIXA.PROJECTPORTFOLIO2013-2018 A-28
NATURAL YARD CARE PROGRAM
TheNaturalYardCare(NYC)programprovideseducationandhow-to-resourcestoBellev-uehomeownersonyardcarebestmanagementpracticestoencourageyardcarebehaviorchange to conserve and protect water resources, reduce yard waste, and enhance public health.ThedesiredbehaviorchangescorrelatedirectlywiththefivestepsofNYC:1)buildhealthysoil,2)plantrightforyoursite,3)practicesmartwatering,4)thinktwicebeforeus-ingpesticides,and5)practicenaturallawncare.
NYCpracticesarepromotedthroughseasonalNYCworkshopsandtheCity’scommunica-tionavenues.ANYCworkshopserieswassuccessfullyheldatBellevueCityHallinspring2011. Homeowners from the Coal Creek watershed and the Factoria neighborhood area wereinvitedtoparticipate,buttheworkshopswereopentoallinterestedhomeowners.Atotalof90homesparticipatedinthe5workshops.Theprogramearnedanoverallsatisfac-tionratingof98percent,with88percentoftheparticipantspledgingtoimplementtheNYC techniques they learned.
NYCtipsandresourcesareregularlyfeaturedinBellevue’sIt’sYourCitynewspaperandonthe City’s website. A popular resource is the City’s Natural Gardening series which includes a seasonal gardening calendar and guides on the following topics: garden design, choosing therightplants;lawnalternatives;lawncare;soilbuilding;mulching;fertilizing;compost-ingfoodandyarddebris;efficientwatering;andnaturalpest,weed,anddiseasecontrol.The guides are also available through workshops, City Hall, and the Bellevue Botanical Garden. Approximately 3,500 printed guides were distributed in 2011.
NYCpracticesarealsomodeledandpromotedthroughtheCity’sWaterwiseGardenat the Bellevue Botanical Garden. Community volunteers donated approximately 550 hours in 2011, working in the garden while learning more about Waterwise plants and naturalcarepractices.
C
Program Start and End Date ........... 2003 to present
Funding source ................................ Water fund, Washington State Department of Ecology Coordinated PreventionGrant,andagrantfrom the Local Hazardous Waste Management Program of King County
Outcomes ........................................ In2011,workshopattendeeswere askedtosignapledgetotakeaction on natural yard care. A pledge rate of 88 percent was achieved for the spring series. Research shows workshop attendeeswillsharenaturalyardcare informationandpracticeswith5-7 additionalpeople,extendingthereach of the program.

mc10795_10.13.indd


