71
CITY OF BOSTON, MASSACHUSETTS Basic Financial Statements and Required Supplementary Information June 30, 2008 (With Independent Auditors’ Report Thereon)

CITY OF BOSTON, MASSACHUSETTS
Basic Financial Statements and Required Supplementary Information
June 30, 2008
(With Independent Auditors’ Report Thereon)
CITY OF BOSTON, MASSACHUSETTS
Table of Contents
Page
Independent Auditors’ Report 1 – 2
Management’s Discussion and Analysis – Required Supplementary Information (Unaudited) 3 – 15
Basic Financial Statements:
Government-Wide Financial Statements:
Statement of Net Assets 17
Statement of Activities 18 – 19
Fund Financial Statements:
Balance Sheet – Governmental Funds 20
Reconciliation of the Governmental Funds Balance Sheet to the Statement of Net Assets 21
Statement of Revenues, Expenditures, and Changes in Fund Balances – Governmental Funds 22
Reconciliation of the Statement of Revenues, Expenditures, and Changes in Fund Balance of Governmental Funds to the Statement of Activities 23
Statement of Revenues and Expenditures – Budgetary Basis General Fund – Budget and Actual 24
Statement of Net Assets – Proprietary Funds 25
Statement of Revenues, Expenses, and Changes in Net Assets – Proprietary Funds 26
Statement of Cash Flows – Proprietary Fund Types 27
Statement of Fiduciary Net Assets – Fiduciary Funds 28
Statement of Changes in Fiduciary Net Assets – Fiduciary Funds 29
Notes to Basic Financial Statements 30 – 68
Schedule I – Schedules of Funding Progress and Employers’ Contributions – Required Supplementary Information (Unaudited) 69
Independent Auditors’ Report
The Honorable Mayor and City Council City of Boston, Massachusetts:
We have audited the accompanying financial statements of the governmental activities, the business-type activities, the aggregate discretely presented component units, each major fund, and the aggregate remaining fund information of the City of Boston (the City), Massachusetts, as of and for the year ended June 30, 2008, which collectively comprise the City’s basic financial statements as listed in the table of contents. These financial statements are the responsibility of the City’s management. Our responsibility is to express opinions on these financial statements based on our audit. We did not audit the financial statements of certain entities, which represent 2.5% and 3.4% of the assets and revenues, respectively, of the aggregate remaining fund information and 25.7% and 24.0% of the assets and revenues, respectively, of the discretely presented component units. Those financial statements were audited by other auditors whose reports have been furnished to us, and our opinion on the financial statements, insofar as it relates to the aggregate remaining fund information and the discretely presented component units and their effects on the governmental and fiduciary activities, is based solely on the reports of the other auditors.
We conducted our audit in accordance with auditing standards generally accepted in the United States of America and the standards applicable to financial audits contained in Government Auditing Standards, issued by the Comptroller General of the United States. Those standards require that we plan and perform the audit to obtain reasonable assurance about whether the financial statements are free of material misstatement. An audit includes consideration of internal control over financial reporting as a basis for designing audit procedures that are appropriate in the circumstances, but not for the purpose of expressing an opinion on the effectiveness of the City’s internal control over financial reporting. Accordingly, we express no such opinion. The financial statements of the permanent funds and private-purpose trust funds were not audited in accordance with Government Auditing Standards, issued by the Comptroller General of the United States. An audit also includes examining, on a test basis, evidence supporting the amounts and disclosures in the financial statements, assessing the accounting principles used and significant estimates made by management, as well as evaluating the overall financial statement presentation. We believe that our audit and the reports of the other auditors provide a reasonable basis for our opinions.
In our opinion, based on our audit and the reports of other auditors, the financial statements referred to above present fairly, in all material respects, the respective financial position of the governmental activities, the business-type activities, the aggregate discretely presented component units, each major fund, and the aggregate remaining fund information of the City of Boston, Massachusetts, as of June 30, 2008, and the respective changes in financial position and, where applicable, cash flows thereof and the respective budgetary comparison for the general fund for the year then ended in conformity with U.S. generally accepted accounting principles.
As described in notes 12 and 11(h), the City, in 2008, implemented Governmental Accounting Standards Board (GASB) Statements Nos. 45 and 50, Accounting and Financial Reporting by Employers for Postemployment Benefits Other Than Pensions and Pension Disclosures, respectively.
KPMG LLP Telephone 617 988 1000 99 High Street Fax 617 988 0800 Boston, MA 02110-2371 Internet www.us.kpmg.com
KPMG LLP, a U.S. limited liability partnership, is the U.S. member firm of KPMG International, a Swiss cooperative.
2
In accordance with Government Auditing Standards, we have also issued our report dated December 15, 2008 on our consideration of the City’s internal control over financial reporting and on our tests of its compliance with certain provisions of laws, regulations, contracts, and grant agreements and other matters. The purpose of that report is to describe the scope of our testing of internal control over financial reporting and compliance and the results of that testing, and not to provide an opinion on the internal control over financial reporting or on compliance. That report is an integral part of an audit performed in accordance with Government Auditing Standards and should be considered in assessing the results of our audit.
Management’s Discussion and Analysis on pages 3 through 15 and the schedules of funding progress and employers’ contributions on page 69 are not a required part of the basic financial statements, but are supplementary information required by U.S. generally accepted accounting principles. We have applied certain limited procedures which consisted principally of inquiries of management regarding the methods of measurement and presentation of the required supplementary information. However, we did not audit the information and express no opinion on it.
Boston, Massachusetts December 15, 2008
CITY OF BOSTON, MASSACHUSETTS
Required Supplementary Information
Management’s Discussion and Analysis
June 30, 2008
(Unaudited)
3 (Continued)
The City of Boston (the City) provides this Management’s Discussion and Analysis to present additional information to the readers of the City’s basic financial statements. This narrative overview and analysis of the financial activities of the City is for the fiscal year ended June 30, 2008. Readers are encouraged to consider this information in conjunction with the additional information that is furnished in the City’s Comprehensive Annual Financial Report (CAFR).
Overview of the Financial Statements
This discussion and analysis is intended to serve as an introduction to the City’s financial statements. The City’s basic financial statements include three components: 1) government-wide financial statements, 2) fund financial statements, and 3) notes to the financial statements. This report also contains required supplementary information regarding historical pension and other postemployment benefit plan information. These components are described below:
Basic Financial Statements
The basic financial statements include two types of financial statements that present different views of the City – the Government-Wide Financial Statements and the Fund Financial Statements. These financial statements also include the Notes to the Financial Statements that explain some of the information in the financial statements and provide more detail.
Government-Wide Financial Statements
The Government-Wide Financial Statements provide a broad view of the City’s operations in a manner similar to a private-sector business. The statements provide both short-term and long-term information about the City’s financial position, which assist in assessing the City’s economic condition at the end of the fiscal year. These are prepared using the flow of economic resources measurement focus and the accrual basis of accounting. This basically means they follow methods that are similar to those used by most businesses. They take into account all revenues and expenses connected with the fiscal year even if cash involved has not been received or paid. The government-wide financial statements include two statements:
The Statement of Net Assets presents all of the government’s assets and liabilities, with the difference between the two reported as “net assets.” Over time, increases or decreases in the City’s net assets may serve as a useful indicator of whether the financial position of the City is improving or deteriorating.
The Statement of Activities presents information showing how the government’s net assets changed during the most recent fiscal year. All changes in net assets are reported as soon as the underlying event giving rise to the change occurs, regardless of the timing of related cash flows.
Thus, revenues and expenses are reported in this statement for some items that will not result in cash flows until future fiscal periods (such as uncollected taxes and earned but unused vacation leave). This statement also presents a comparison between direct expenses and program revenues for each function of the City.
CITY OF BOSTON, MASSACHUSETTS
Required Supplementary Information
Management’s Discussion and Analysis
June 30, 2008
(Unaudited)
4 (Continued)
Both the above financial statements have separate sections for the three different types of city programs or activities. These three types of activities are:
Governmental Activities – The activities in this section are mostly supported by taxes and intergovernmental revenues (federal and state grants). Most services normally associated with city government fall into this category, including general government, human services, public safety, public works, property and development, parks and recreation, library, schools, county, public health programs, state and district assessments, and debt service.
Business-Type Activities – These functions normally are intended to recover all or a significant portion of their costs through user fees and charges to external users of goods and services. These business-type activities of the City include the activities related to the City’s Convention Center Bond Fund and Hospital Bond Fund.
Discretely Presented Component Units – These are operations for which the City has financial accountability but function independent of the City of Boston. For the most part, these entities operate similar to private-sector businesses and the business-type activities described above.
The City’s four discretely presented major component units are:
Boston Public Health Commission
Boston Redevelopment Authority
Economic Development Industrial Corporation
Trustees of the Boston Public Library
Complete financial statements of the individual component units can be obtained from their respective administrative offices. Additional information about the City’s component units is presented in the notes to the financial statements.
The government-wide financial statements can be found immediately following this discussion and analysis.
Fund Financial Statements
A fund is a grouping of related accounts that is used to maintain control over resources that have been segregated for specific activities or objectives. The City, like other local governments, uses fund accounting to ensure and demonstrate compliance with finance related legal requirements.
CITY OF BOSTON, MASSACHUSETTS
Required Supplementary Information
Management’s Discussion and Analysis
June 30, 2008
(Unaudited)
5 (Continued)
The Fund Financial Statements focus on individual parts of the city government, reporting the City’s operations in more detail than the government-wide statements. All of the funds of the City can be divided into three categories. It is important to note that these fund categories use different accounting approaches and should be interpreted differently. The three categories of funds are:
1. Governmental Fund Financial Statements – Most of the basic services provided by the City are financed through governmental funds. Governmental funds are used to account for essentially the same functions reported as governmental activities in the government-wide financial statements. However, unlike the government-wide financial statements, the governmental fund financial statements focus on near-term inflows and outflows of spendable resources. They also focus on the balances of spendable resources available at the end of the fiscal year. Such information may be useful in evaluating the government’s near-term financing requirements. This approach is known as using the flow of current financial resources measurement focus and the modified accrual basis of accounting. Under this approach, revenues are recorded when cash is received or when susceptible to accrual. Expenditures are recorded when liabilities are incurred and due. These statements provide a detailed short-term view of the City’s finances to assist in determining whether there will be adequate financial resources available to meet the current needs of the City.
Because the focus of governmental funds is narrower than that of the government-wide financial statements, it is useful to compare the information presented for governmental funds with similar information presented for governmental activities in the government-wide financial statements. By doing so, readers may better understand the long-term impact of the government’s near-term financing decisions. Both the governmental fund balance sheet and the governmental fund statement of revenues, expenditures, and changes in fund balances provide a reconciliation to facilitate this comparison between governmental funds and the governmental activities. These reconciliations are presented on the page immediately following each governmental fund financial statement.
The City presents four columns in the governmental fund balance sheet and in the governmental fund statement of revenues, expenditures, and changes in fund balances. The City’s three major governmental funds are – the General Fund, the Special Revenue Fund, and the Capital Projects Fund. All nonmajor governmental funds are combined in the “Other Governmental Funds” column on these statements. The governmental fund financial statements can be found immediately following the government-wide statements.
Of the City’s governmental funds, the General Fund is the only fund for which a budget is legally adopted. The Statement of Revenues and Expenditures – Budgetary Basis is presented on page 24. This Statement provides a comparison of the original and final budget and the actual expenditures for the current and prior year.
CITY OF BOSTON, MASSACHUSETTS
Required Supplementary Information
Management’s Discussion and Analysis
June 30, 2008
(Unaudited)
6 (Continued)
In accordance with state law and regulations, the City’s legally adopted general fund budget is prepared on a “budgetary” basis instead of U.S. generally accepted accounting principles (GAAP). Among the key differences between these two sets of accounting principles are that “budgetary” records property tax as it is levied, while GAAP records it as it becomes susceptible to accrual, “budgetary” records certain activities and transactions in the general fund that GAAP records in separate funds, and “budgetary” records any amount raised that covers a prior year deficit as an expenditure, and any available funds raised from prior year surpluses as a revenue, while GAAP ignores these impacts from prior years. The difference in accounting principles inevitably leads to varying results in excess or deficiency of revenues over expenditures. Additional information and a reconciliation of “budgetary” to GAAP statements is provided in note 4 to the financial statements.
2. Proprietary Funds Financial Statements – These funds are used to show activities that operate more like those of commercial enterprises. Because these funds charge fees for services provided to outside customers including local governments, they are known as enterprise funds. Proprietary funds provide the same type of information as the government-wide financial statements, only in more detail. Like the government-wide financial statements, proprietary fund financial statements use the accrual basis of accounting. No reconciliation is needed between the government-wide financial statements for business-type activities and the proprietary fund financial statements.
The basic proprietary funds financial statements can be found immediately following the governmental fund financial statements.
3. Fiduciary Funds Financial Statements – These funds are used to account for resources held for the benefit of parties outside the City government. Fiduciary funds are not reflected in the government-wide financial statements because the resources of these funds are not available to support the City’s own programs. The accounting used for fiduciary funds is much like that used for proprietary funds. They use the accrual basis of accounting.
The City’s fiduciary funds are the Employee Retirement Fund (the State-Boston Retirement System), which accounts for the transactions, assets, liabilities, and net assets of the City employees’ pension plan, and the Private Purpose Trust Funds, which includes money held and administered by the City on behalf of third parties.
The fiduciary funds financial statements can be found immediately following the proprietary fund financial statements.
Notes to the Financial Statements
The notes provide additional information that is essential to a full understanding of the data provided in the Government-Wide and the Fund Financial Statements. The Notes to the Financial Statements can be found immediately following the Fiduciary Funds Financial Statements.
CITY OF BOSTON, MASSACHUSETTS
Required Supplementary Information
Management’s Discussion and Analysis
June 30, 2008
(Unaudited)
7 (Continued)
Required Supplementary Information
The basic financial statements are followed by a section of required supplementary information, which includes a schedule of funding progress and a schedule of employer contributions for the State-Boston Retirement System as well as the schedule of funding progress for the City’s other post-employment benefit plan.
Government-Wide Financial Analysis
This analysis is based on the statement of net assets and the statement of activities found on pages 17 through 19 of the financial statements.
Government-Wide Highlights
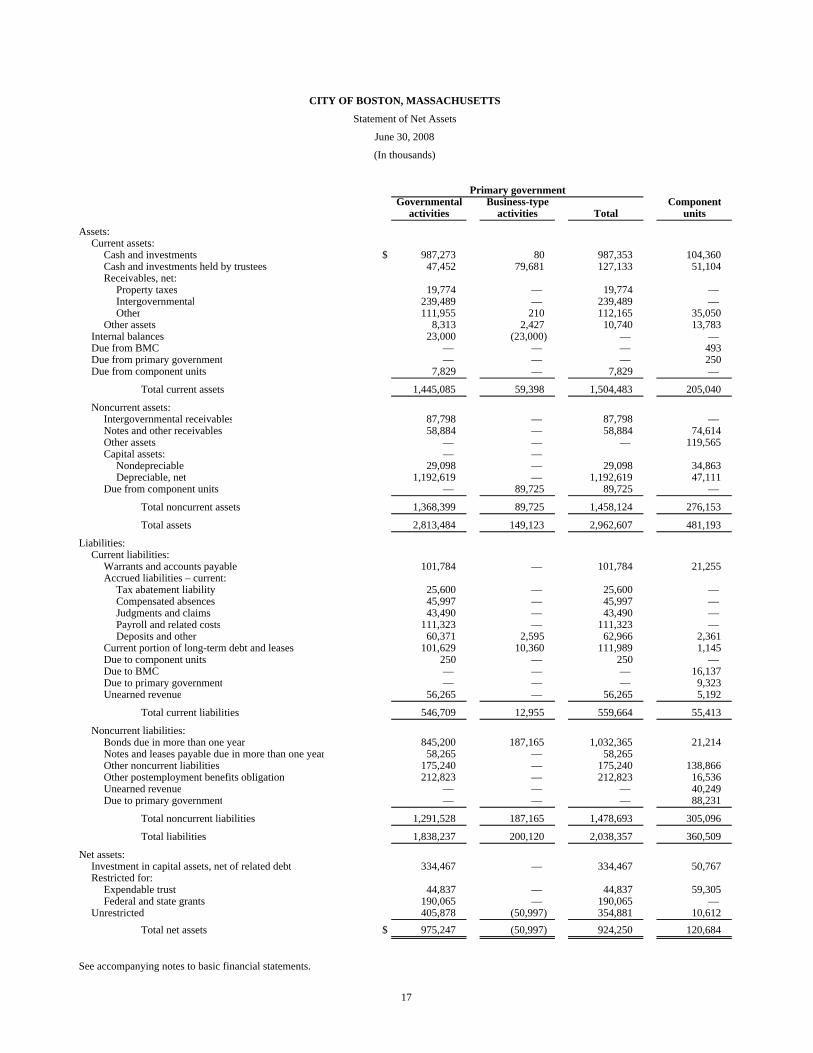
Net Assets – Primary Government – The total assets of the City exceeded its liabilities at fiscal year ending June 30, 2008 by $924.3 million (presented as net assets). Of this amount, $354.9 million was reported as “unrestricted net assets”. Unrestricted net assets represent the amount available to be used to meet the City’s ongoing obligations to citizens and creditors.
Changes in Net Assets – Primary Government – The City’s total net assets decreased by $164.9 million in fiscal year 2008. Net assets of governmental activities decreased by $183.9 million, while net assets of the business-type activities increased by $19.0 million.
Net Assets
As noted earlier, net assets may serve over time as a useful indicator of a government’s financial position. The City’s combined net assets (governmental and business-type activities) totaled $924.3 million at the end of 2008, compared to $1.09 billion at the end of the previous year.
The components of net assets are comprised of the following: the investment in capital assets such as land, buildings, equipment, and infrastructure (road, bridges, and other immovable assets), less any related debt used to acquire that asset that is still outstanding – this amount is $334.5 million indicating that the net book value of the City’s capital assets exceeds the amount of capital debt outstanding. The City uses these capital assets to provide services to citizens; consequentially, these assets are not available for future spending. Although the City’s investment in its capital assets is reported net of related debt, it should be noted that the resources needed to repay this debt must be provided from other sources, since the capital assets themselves cannot be used to liquidate these liabilities.
CITY OF BOSTON, MASSACHUSETTS
Required Supplementary Information
Management’s Discussion and Analysis
June 30, 2008
(Unaudited)
8 (Continued)
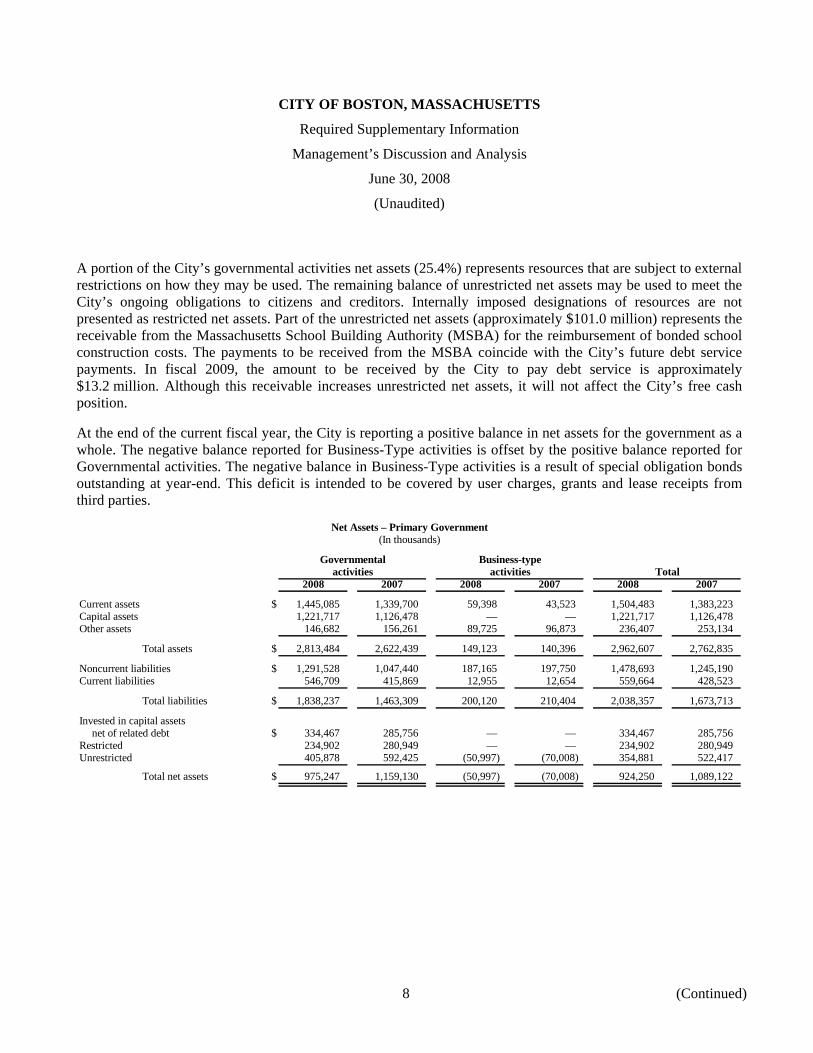
A portion of the City’s governmental activities net assets (25.4%) represents resources that are subject to external restrictions on how they may be used. The remaining balance of unrestricted net assets may be used to meet the City’s ongoing obligations to citizens and creditors. Internally imposed designations of resources are not presented as restricted net assets. Part of the unrestricted net assets (approximately $101.0 million) represents the receivable from the Massachusetts School Building Authority (MSBA) for the reimbursement of bonded school construction costs. The payments to be received from the MSBA coincide with the City’s future debt service payments. In fiscal 2009, the amount to be received by the City to pay debt service is approximately $13.2 million. Although this receivable increases unrestricted net assets, it will not affect the City’s free cash position.
At the end of the current fiscal year, the City is reporting a positive balance in net assets for the government as a whole. The negative balance reported for Business-Type activities is offset by the positive balance reported for Governmental activities. The negative balance in Business-Type activities is a result of special obligation bonds outstanding at year-end. This deficit is intended to be covered by user charges, grants and lease receipts from third parties.
Net Assets – Primary Government(In thousands)
Governmental Business-typeactivities activities Total
2008 2007 2008 2007 2008 2007
Current assets $ 1,445,085 1,339,700 59,398 43,523 1,504,483 1,383,223 Capital assets 1,221,717 1,126,478 — — 1,221,717 1,126,478 Other assets 146,682 156,261 89,725 96,873 236,407 253,134
Total assets $ 2,813,484 2,622,439 149,123 140,396 2,962,607 2,762,835
Noncurrent liabilities $ 1,291,528 1,047,440 187,165 197,750 1,478,693 1,245,190 Current liabilities 546,709 415,869 12,955 12,654 559,664 428,523
Total liabilities $ 1,838,237 1,463,309 200,120 210,404 2,038,357 1,673,713
Invested in capital assetsnet of related debt $ 334,467 285,756 — — 334,467 285,756
Restricted 234,902 280,949 — — 234,902 280,949 Unrestricted 405,878 592,425 (50,997) (70,008) 354,881 522,417
Total net assets $ 975,247 1,159,130 (50,997) (70,008) 924,250 1,089,122
CITY OF BOSTON, MASSACHUSETTS
Required Supplementary Information
Management’s Discussion and Analysis
June 30, 2008
(Unaudited)
9 (Continued)
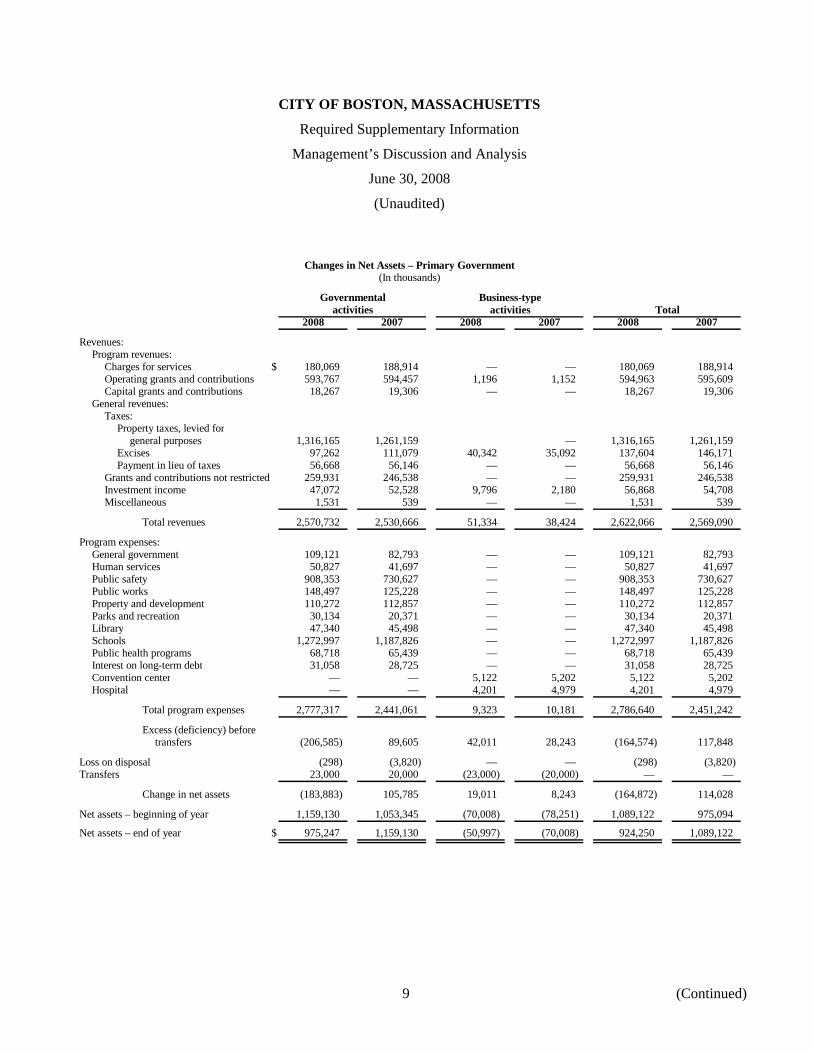
Changes in Net Assets – Primary Government(In thousands)
Governmental Business-typeactivities activities Total
2008 2007 2008 2007 2008 2007
Revenues:Program revenues:
Charges for services $ 180,069 188,914 — — 180,069 188,914 Operating grants and contributions 593,767 594,457 1,196 1,152 594,963 595,609 Capital grants and contributions 18,267 19,306 — — 18,267 19,306
General revenues:Taxes:
Property taxes, levied forgeneral purposes 1,316,165 1,261,159 — 1,316,165 1,261,159
Excises 97,262 111,079 40,342 35,092 137,604 146,171 Payment in lieu of taxes 56,668 56,146 — — 56,668 56,146
Grants and contributions not restricted 259,931 246,538 — — 259,931 246,538 Investment income 47,072 52,528 9,796 2,180 56,868 54,708 Miscellaneous 1,531 539 — — 1,531 539
Total revenues 2,570,732 2,530,666 51,334 38,424 2,622,066 2,569,090
Program expenses:General government 109,121 82,793 — — 109,121 82,793 Human services 50,827 41,697 — — 50,827 41,697 Public safety 908,353 730,627 — — 908,353 730,627 Public works 148,497 125,228 — — 148,497 125,228 Property and development 110,272 112,857 — — 110,272 112,857 Parks and recreation 30,134 20,371 — — 30,134 20,371 Library 47,340 45,498 — — 47,340 45,498 Schools 1,272,997 1,187,826 — — 1,272,997 1,187,826 Public health programs 68,718 65,439 — — 68,718 65,439 Interest on long-term debt 31,058 28,725 — — 31,058 28,725 Convention center — — 5,122 5,202 5,122 5,202 Hospital — — 4,201 4,979 4,201 4,979
Total program expenses 2,777,317 2,441,061 9,323 10,181 2,786,640 2,451,242
Excess (deficiency) beforetransfers (206,585) 89,605 42,011 28,243 (164,574) 117,848
Loss on disposal (298) (3,820) — — (298) (3,820) Transfers 23,000 20,000 (23,000) (20,000) — —
Change in net assets (183,883) 105,785 19,011 8,243 (164,872) 114,028
Net assets – beginning of year 1,159,130 1,053,345 (70,008) (78,251) 1,089,122 975,094
Net assets – end of year $ 975,247 1,159,130 (50,997) (70,008) 924,250 1,089,122
CITY OF BOSTON, MASSACHUSETTS
Required Supplementary Information
Management’s Discussion and Analysis
June 30, 2008
(Unaudited)
10 (Continued)
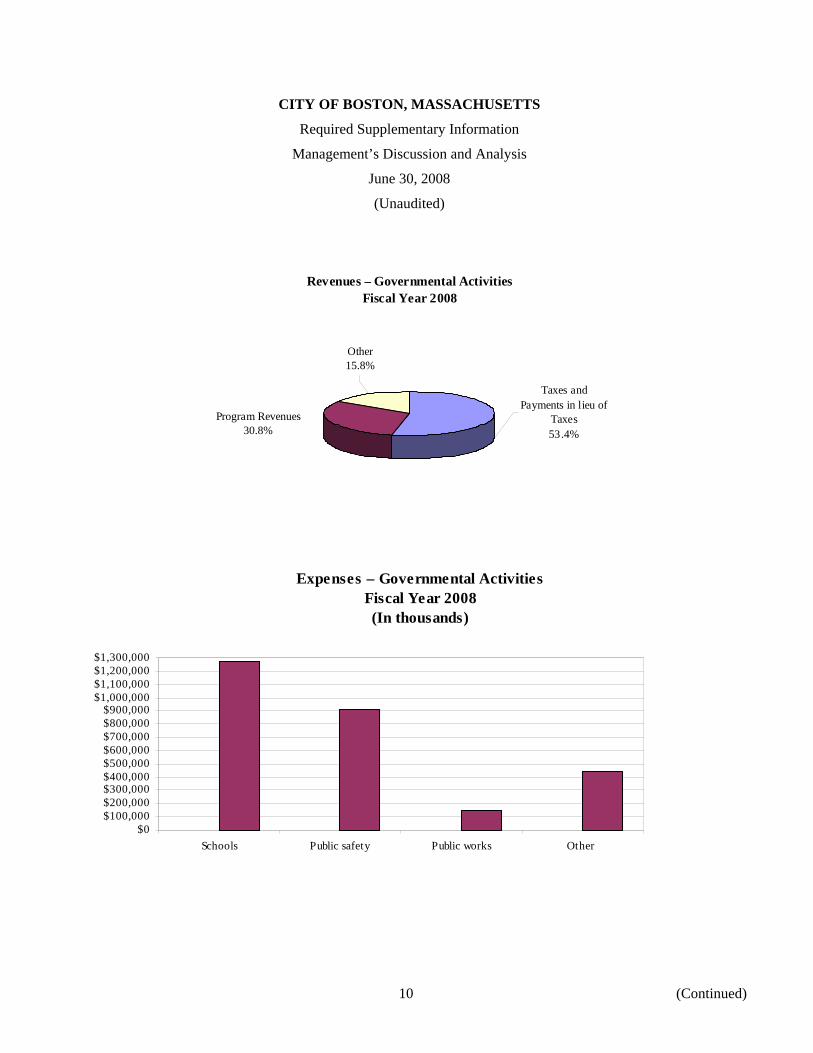
Revenues – Governmental Activities Fiscal Year 2008
Taxes and Payments in lieu of
Taxes53.4%
Other15.8%
Program Revenues30.8%
Expenses – Governmental Activities Fiscal Year 2008 (In thousands)
$0$100,000$200,000$300,000$400,000$500,000$600,000$700,000$800,000$900,000
$1,000,000$1,100,000$1,200,000$1,300,000
Schools Public safety Public works Other
CITY OF BOSTON, MASSACHUSETTS
Required Supplementary Information
Management’s Discussion and Analysis
June 30, 2008
(Unaudited)
11 (Continued)
Governmental Activities
The City’s governmental activities net assets decreased by $183.9 million over the prior fiscal year. The following net changes occurred during the course of operations in fiscal 2008: In the assets accounts, cash and investments increased by $25.3 million, receivables increased by $79.8 million, capital assets increased by $95.2 million. In the liability accounts, there were increases in warrants payable of $36.8 million, current long-term debt of $6.9 million, unearned revenue of $36.3 million and accrued liabilities of $17.7 million. Additionally, a new liability of $212.8 million relative to the City’s other postemployment obligation was booked in 2008. See page 14 for a more detailed discussion.
During fiscal year 2008, the City’s revenues increased by 1.6%. The City’s largest sources of revenues were property taxes, excise taxes, and payment in lieu of taxes of $1.47 billion (57.2% of total revenue) and $792.1 million of program revenues (30.8% of total revenue). The increase in tax revenue was attributed to a change in property tax commitments and a growth in room occupancy. A rise in state aid was the source for the increase in grants and contributions not restricted. Investment income and other miscellaneous revenues totaled $48.6 million down $4.4 million from fiscal year 2007. The primary factor for the decrease in investment income was lower investment returns.
The increase in revenues allowed for an increase in expense categories. The City’s expenses cover a range of services. The largest expenses were for schools ($1.27 billion), public safety ($908.4 million), public works ($148.5 million), property and development ($110.3 million), general government ($109.1 million), public health programs ($68.7 million), and human services ($50.8 million). The primary reason behind the increased expenses for schools was an increase in salaries. Further, all categories of government experienced an increase in expenses due to the recognition of the City’s OPEB expense in 2008.
In 2008, governmental activities expenses exceeded program revenues (i.e., user charges, operating grants and capital grants) by $1.96 billion. This shortfall was covered primarily through taxes ($1.47 billion) and unrestricted grants and contributions ($259.9 million).
Comparative data on these revenues and expenses is itemized in the reporting of the Changes in Net Assets – Primary Government on page 9.
Business-Type Activities
Net assets from business-type activities increased $19.0 million during fiscal 2008. This change in net assets resulted primarily from an increase in excise tax revenues and investment income.
Financial Analysis of the City’s Fund Statements
This analysis is based on the Governmental and Proprietary Fund Financial Statements on pages 20 through 27.
As noted earlier, the City uses fund accounting to ensure and demonstrate compliance with finance-related legal requirements.
CITY OF BOSTON, MASSACHUSETTS
Required Supplementary Information
Management’s Discussion and Analysis
June 30, 2008
(Unaudited)
12 (Continued)
Fund Highlights
Governmental Funds – Fund Balances – As of the close of fiscal year 2008, the City’s governmental funds reported a combined ending fund balance of $1.04 billion, an increase of $23.0 million from the prior year. Of this total amount, $586.4 million represents the “unreserved and undesignated fund balances” with $553.1 million of this amount in the general fund. The increase in fund balance is largely due to an increase in tax receipts.
Governmental Funds
The focus of the City’s governmental funds is to provide information on near-term inflows, outflows, and balances of spendable resources. Such information is useful in assessing the City’s financial requirements. In particular, unreserved fund balance may serve as a useful measure of a government’s financial position at the end of the fiscal year.
General Fund – Fund Balance – The general fund is the chief operating fund of the City. The City’s General Fund – Fund Balance Policy states in part to maintain a GAAP undesignated fund balance in the general fund that is 10%, or higher, of GAAP general fund operating expenditures for the fiscal year. The GAAP undesignated fund balance at the end of fiscal year 2008 was $553.1 million, which represents approximately 25.3% of GAAP general fund operating expenditures.
However, because the City is required to follow the statutory basis of accounting rather than GAAP for determining the amount of undesignated fund balance that can be appropriated, it is the statutory (not the GAAP) fund balance that is used to calculate “free cash”. Free cash is the amount of statutory fund balance in the general fund, as certified by the Commonwealth of Massachusetts’ Department of Revenue, that is available for appropriation and is generated when actual revenues, on a cash basis, exceeded budgeted amounts and encumbrances are less than appropriations, or both.
The City of Boston has established the General Fund-Fund Balance Policy to ensure that the City maintains adequate levels of fund balance to mitigate current and future risks (i.e. revenue shortfalls and unanticipated expenditures). The policy in full states that the City shall maintain a GAAP undesignated fund balance in the general fund that is 10% or higher than the current fiscal year’s GAAP general fund operating expenditures; and that the City shall only consider the certification of free cash (as defined by the Commonwealth of Massachusetts’ Department of Revenue) in years where the appropriation of free cash shall not cause the fiscal year’s GAAP undesignated fund balance to go below 10% of the fiscal year’s GAAP general fund expenditures while maintaining a Budgetary Undesignated Fund Balance between 5% and 10% of Budgetary Operating Expenses.
The City shall only consider the appropriation of certified free cash to offset: (1) certain fixed costs such as pension contributions and related post-employment health benefits; and/or (2) to fund extraordinary and nonrecurring events as determined and certified by the City Auditor.
CITY OF BOSTON, MASSACHUSETTS
Required Supplementary Information
Management’s Discussion and Analysis
June 30, 2008
(Unaudited)
13 (Continued)
Special Revenue Fund – Fund Balance – The Special Revenue Fund accounts for the proceeds of specific revenue sources that are legally restricted to expenditures for predefined purposes. The fiscal year 2008 special revenue fund balance is reported at $190.1 million, a $30.3 million decrease from fiscal year 2007.
Capital Projects Fund – Fund Balance – The Capital Projects Fund accounts for financial resources to be used for the acquisition or construction of major capital facilities, other than those financed by proprietary funds and trust funds. The fiscal year 2008 capital projects fund deficit is $1.0 million, a $13.3 million decrease from fiscal year 2007. The deficit in this fund balance is the result of the $14 million MSBA receivable for the Burke School and will be eliminated upon reimbursement of construction costs from the MSBA.
Other Governmental Funds – Fund Balance – Other Governmental Funds account for assets held by the City in permanent trust funds. The fiscal year 2008 other governmental funds fund balance is $44.8 million, a $3.5 million decrease from fiscal year 2007.
Proprietary Funds
The City’s Proprietary Funds provide the same type of information found in the Government-Wide Financial Statements for business-type activities. This information is presented on the same basis of accounting, but in more detail.
The City’s Proprietary Funds net deficit for fiscal year 2008 was $51.0 million. The net deficit in the Proprietary Funds is a result of the Convention Center special obligation bonds outstanding at year-end.
Budgetary Highlights
The general fund budgetary highlights include ending fiscal year 2008 with a $15.8 million dollar surplus. This represents the City’s 23rd consecutive year with a balanced budget. Changes to the original budget resulted in an increase of $9.9 million to the overall budget. These supplemental appropriations were primarily for salaries and wages within the Boston Public Schools Department. Funding for the supplemental appropriations consisted of the Retired Teachers Pension payments of $4.7 million and building infrastructure improvements and permits of $4.6 million. During the year, revenues exceeded budgetary estimates, thus eliminating the need to draw from existing fund balance. The departmental and other revenue favorable variance of $14.4 million was primarily comprised of $8.0 million in reimbursements for fringe and pension costs from grants and $2.3 million increase in Municipal Medicaid reimbursement. The $7.0 million favorable variance in Commonwealth of Massachusetts was driven by an additional $7.4 million of revenue from the state for Retired Teachers Pension. The “other available funds” fell short of fiscal year 2008 receipts by $5.0 million due to recording less actual “free cash” than budgeted. Police and Fire Department overtime expense, exceeding the budget by $16.5 million, was the main factor in Public Safety’s overspending.
Capital Asset and Debt Administration
Capital Assets
The City’s investment in capital assets for its governmental activities, as of June 30, 2008, has a net book value of $1.22 billion, made up of costs totaling $2.41 billion less accumulated depreciation of $1.19 billion. This
CITY OF BOSTON, MASSACHUSETTS
Required Supplementary Information
Management’s Discussion and Analysis
June 30, 2008
(Unaudited)
14 (Continued)
investment in capital assets includes land, buildings, improvements, equipment, infrastructure and construction in progress. Infrastructure assets are items that are normally immovable and have value only to the City, such as roads, bridges, streets, sidewalks, drainage systems, lighting systems, and similar items.
The total increase in the City’s investment in capital assets for the current fiscal year was approximately 8.5% in terms of net book value. However, actual expenditures to purchase or construct capital assets were $158.5 million for the year. Most of this amount was used for the purpose of constructing or reconstructing buildings and building improvements. Depreciation charges for the year totaled $62.9 million. Additional information on the City’s capital assets can be found in note 8 of the Notes to Basic Financial Statements.
Long-Term Obligations
Debt Administration – The authority of the City to incur debt is governed by federal and state laws that restrict the amounts and purposes for which a municipality can incur debt. At year-end, the City had $903.2 million in General Obligations Bonds principal outstanding – an increase of $42.3 million over last year.
The key factor in this increase was the issuance of the March 1, 2008 Series A and B general obligation and refunding bonds totaling $154.3 million. Of this amount, $126.2 million (Series A) was new money issued for the purpose of funding various municipal capital projects and $28.2 million (Series B) was issued for the purpose of refunding certain outstanding general obligations of the City. The Series A and B bonds were rated AA, Aa1 and AA+ by Fitch, Moody’s and S&P, respectively.
General Obligation Bonds are backed by the full faith and credit of the City, including the City’s power to levy additional taxes to ensure repayment of the debt. Accordingly, all general obligation debt currently outstanding has been approved by a vote of the City Council.
Notes and Leases Payable and Other Long-Term Obligations – The City’s general long-term notes and leases and other long-term obligations increased by $240.3 million, or 77.6% during the current fiscal year. The key factor, for this increase, was the implementation of Government Accounting Standards Board (GASB) Statement No. 45, Accounting and Financial Reporting by Employers for Post-employment Benefits Other Than Pensions (OPEB) of $212.8 million. This is the first year the City has recorded this obligation. Additionally, leases increased by $12.4 million due to the issuance of new equipment leases exceeding lease repayments.
Additional information on the City’s long-term debt obligations can be found in note 10 of the Notes to Basic Financial Statements.
New Accounting Standards
In 2008, the City implemented Government Accounting Standards Board (GASB) Statement No. 45, Accounting and Financial Reporting by Employers for Postemployment Benefits Other Than Pensions. This standard requires the City to recognize postemployment benefits, mainly health insurance, when earned rather than on a pay-as-you-go basis.
CITY OF BOSTON, MASSACHUSETTS
Required Supplementary Information
Management’s Discussion and Analysis
June 30, 2008
(Unaudited)
15
In order to comply with this standard, the City hired an actuary to estimate the accrued liability and a required 2008 contribution based on the current level of benefits and an amortization period of 30 years. Based on the results of that review, the City booked an OPEB expense and an OPEB obligation of $212.8 million.
The City’s 2008 Annual Required Contribution (ARC) was $327.8 million. Contributions against the ARC on a pay-as-you-go basis totaled $114.9 million and do not include a $21 million transfer to the Health Stabilization Fund which was created subsequent to year-end. The Health Stabilization Fund was established to manage and account for the City’s OPEB liability.
The City also implemented GASB Statement No. 50, Pension Disclosures, in 2008. This new standard now requires entities to report the results of the most recent actuarial valuation in the footnotes. This information was previously only required to be reported as required supplementary information.
Future Accounting Pronouncements
GASB has issued Statement No. 49, Accounting and Financial Reporting for Pollution Remediation Obligation. This statement is effective date for reporting is June 30, 2009. However, restatement of beginning net assets will be required if an obligation exists, therefore July 1, 2008 is the more accurate effective date for this statement.
This statement explains when a government would be required to report a liability in its financial statements related to cleaning up pollution or contamination. GASB 49 also establishes a probability-weighted method that a government would be required to use to determine the established amount of pollution obligation liabilities to be reported in its financial statements.
Requests for Information
This financial report is designed to provide a general overview of the City of Boston’s finances for all of City of Boston’s citizens, taxpayers, customers, investors and creditors. Questions concerning any of the information provided in this report or requests for additional information should be addressed to: City of Boston, Auditing Department, Boston City Hall, Room M-4, Boston, MA 02201.

16
(This page intentionally left blank)
CITY OF BOSTON, MASSACHUSETTS
Statement of Net Assets
June 30, 2008
(In thousands)
Primary governmentGovernmental Business-type Component
activities activities Total units
Assets:Current assets:
Cash and investments $ 987,273 80 987,353 104,360 Cash and investments held by trustees 47,452 79,681 127,133 51,104 Receivables, net:
Property taxes 19,774 — 19,774 — Intergovernmental 239,489 — 239,489 — Other 111,955 210 112,165 35,050
Other assets 8,313 2,427 10,740 13,783 Internal balances 23,000 (23,000) — — Due from BMC — — — 493 Due from primary government — — — 250 Due from component units 7,829 — 7,829 —
Total current assets 1,445,085 59,398 1,504,483 205,040
Noncurrent assets:Intergovernmental receivables 87,798 — 87,798 — Notes and other receivables 58,884 — 58,884 74,614 Other assets — — — 119,565 Capital assets: — —
Nondepreciable 29,098 — 29,098 34,863 Depreciable, net 1,192,619 — 1,192,619 47,111
Due from component units — 89,725 89,725 —
Total noncurrent assets 1,368,399 89,725 1,458,124 276,153
Total assets 2,813,484 149,123 2,962,607 481,193
Liabilities:Current liabilities:
Warrants and accounts payable 101,784 — 101,784 21,255 Accrued liabilities – current:
Tax abatement liability 25,600 — 25,600 — Compensated absences 45,997 — 45,997 — Judgments and claims 43,490 — 43,490 — Payroll and related costs 111,323 — 111,323 — Deposits and other 60,371 2,595 62,966 2,361
Current portion of long-term debt and leases 101,629 10,360 111,989 1,145 Due to component units 250 — 250 — Due to BMC — — — 16,137 Due to primary government — — — 9,323 Unearned revenue 56,265 — 56,265 5,192
Total current liabilities 546,709 12,955 559,664 55,413
Noncurrent liabilities:Bonds due in more than one year 845,200 187,165 1,032,365 21,214 Notes and leases payable due in more than one year 58,265 — 58,265 Other noncurrent liabilities 175,240 — 175,240 138,866 Other postemployment benefits obligation 212,823 — 212,823 16,536 Unearned revenue — — — 40,249 Due to primary government — — — 88,231
Total noncurrent liabilities 1,291,528 187,165 1,478,693 305,096
Total liabilities 1,838,237 200,120 2,038,357 360,509
Net assets:Investment in capital assets, net of related debt 334,467 — 334,467 50,767 Restricted for:
Expendable trust 44,837 — 44,837 59,305 Federal and state grants 190,065 — 190,065 —
Unrestricted 405,878 (50,997) 354,881 10,612 Total net assets $ 975,247 (50,997) 924,250 120,684
See accompanying notes to basic financial statements.
17
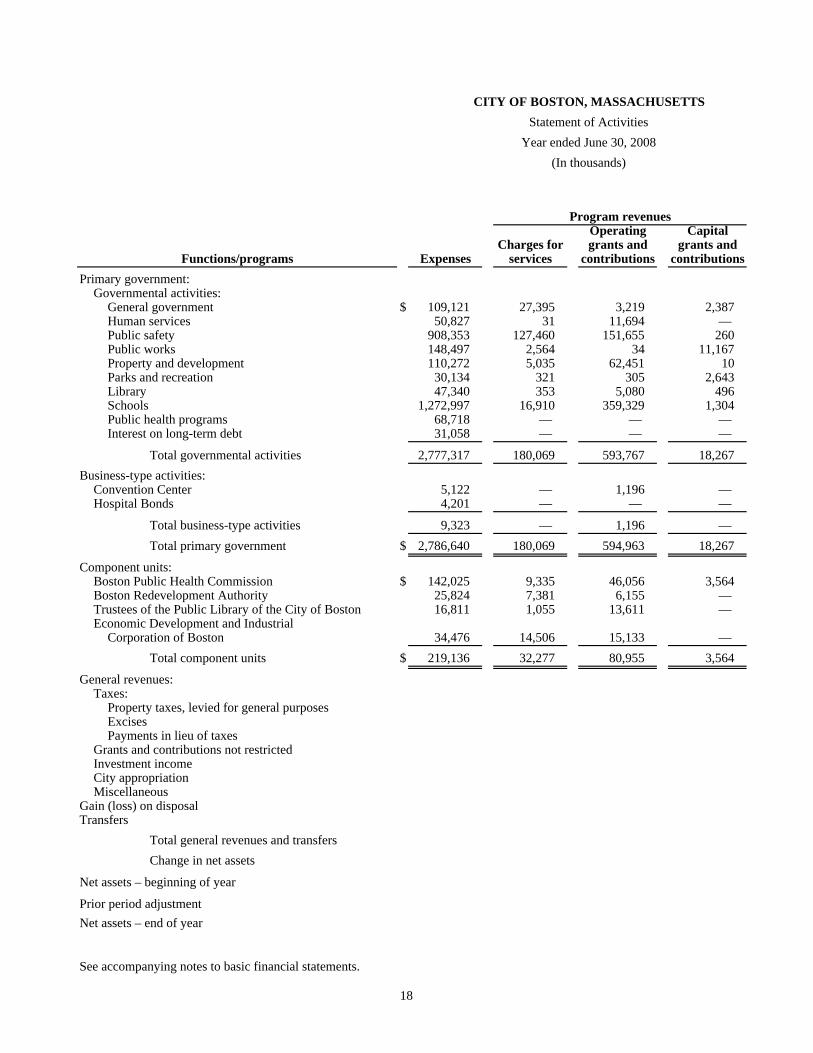
CITY OF BOSTON, MASSACHUSETTSStatement of Activities
Year ended June 30, 2008(In thousands)
Program revenuesOperating Capital
Charges for grants and grants andFunctions/programs Expenses services contributions contributions
Primary government:Governmental activities:
General government $ 109,121 27,395 3,219 2,387 Human services 50,827 31 11,694 — Public safety 908,353 127,460 151,655 260 Public works 148,497 2,564 34 11,167 Property and development 110,272 5,035 62,451 10 Parks and recreation 30,134 321 305 2,643 Library 47,340 353 5,080 496 Schools 1,272,997 16,910 359,329 1,304 Public health programs 68,718 — — — Interest on long-term debt 31,058 — — —
Total governmental activities 2,777,317 180,069 593,767 18,267 Business-type activities:
Convention Center 5,122 — 1,196 — Hospital Bonds 4,201 — — —
Total business-type activities 9,323 — 1,196 — Total primary government $ 2,786,640 180,069 594,963 18,267
Component units:Boston Public Health Commission $ 142,025 9,335 46,056 3,564 Boston Redevelopment Authority 25,824 7,381 6,155 — Trustees of the Public Library of the City of Boston 16,811 1,055 13,611 — Economic Development and Industrial
Corporation of Boston 34,476 14,506 15,133 — Total component units $ 219,136 32,277 80,955 3,564
General revenues:Taxes:
Property taxes, levied for general purposesExcisesPayments in lieu of taxes
Grants and contributions not restrictedInvestment incomeCity appropriationMiscellaneous
Gain (loss) on disposalTransfers
Total general revenues and transfersChange in net assets
Net assets – beginning of year
Prior period adjustmentNet assets – end of year
See accompanying notes to basic financial statements.
18
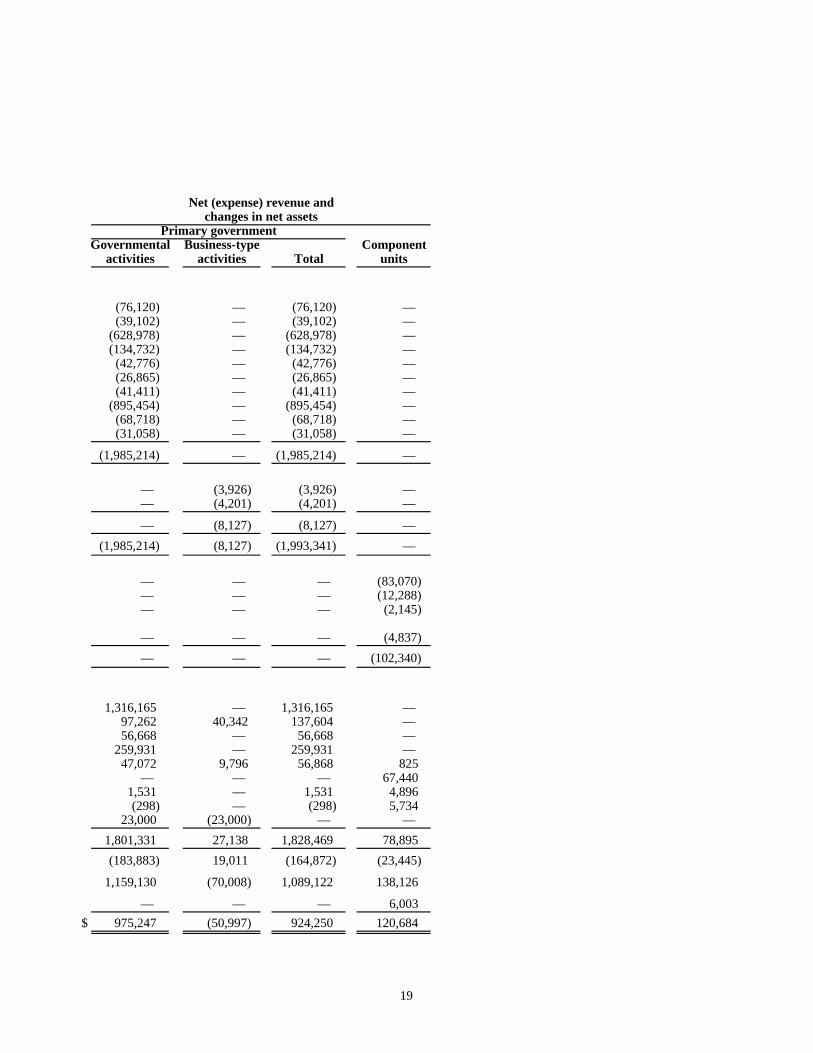
Net (expense) revenue andchanges in net assets
Primary governmentGovernmental Business-type Component
activities activities Total units
(76,120) — (76,120) — (39,102) — (39,102) —
(628,978) — (628,978) — (134,732) — (134,732) —
(42,776) — (42,776) — (26,865) — (26,865) — (41,411) — (41,411) —
(895,454) — (895,454) — (68,718) — (68,718) — (31,058) — (31,058) —
(1,985,214) — (1,985,214) —
— (3,926) (3,926) — — (4,201) (4,201) —
— (8,127) (8,127) — (1,985,214) (8,127) (1,993,341) —
— — — (83,070) — — — (12,288) — — — (2,145)
— — — (4,837) — — — (102,340)
1,316,165 — 1,316,165 — 97,262 40,342 137,604 — 56,668 — 56,668 —
259,931 — 259,931 — 47,072 9,796 56,868 825
— — — 67,440 1,531 — 1,531 4,896 (298) — (298) 5,734
23,000 (23,000) — — 1,801,331 27,138 1,828,469 78,895 (183,883) 19,011 (164,872) (23,445)
1,159,130 (70,008) 1,089,122 138,126
— — — 6,003 $ 975,247 (50,997) 924,250 120,684
19
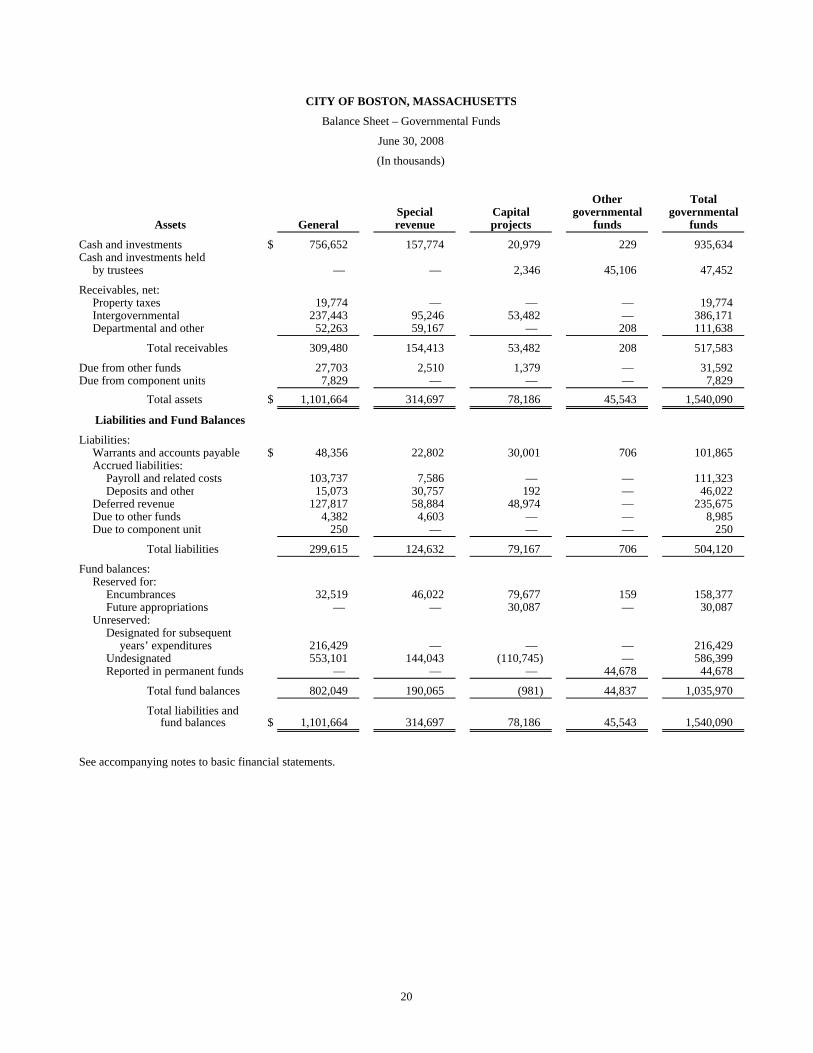
CITY OF BOSTON, MASSACHUSETTS
Balance Sheet – Governmental Funds
June 30, 2008
(In thousands)
Other TotalSpecial Capital governmental governmental
Assets General revenue projects funds funds
Cash and investments $ 756,652 157,774 20,979 229 935,634 Cash and investments held
by trustees — — 2,346 45,106 47,452
Receivables, net:Property taxes 19,774 — — — 19,774 Intergovernmental 237,443 95,246 53,482 — 386,171 Departmental and other 52,263 59,167 — 208 111,638
Total receivables 309,480 154,413 53,482 208 517,583
Due from other funds 27,703 2,510 1,379 — 31,592 Due from component units 7,829 — — — 7,829
Total assets $ 1,101,664 314,697 78,186 45,543 1,540,090
Liabilities and Fund Balances
Liabilities:Warrants and accounts payable $ 48,356 22,802 30,001 706 101,865 Accrued liabilities:
Payroll and related costs 103,737 7,586 — — 111,323 Deposits and other 15,073 30,757 192 — 46,022
Deferred revenue 127,817 58,884 48,974 — 235,675 Due to other funds 4,382 4,603 — — 8,985 Due to component unit 250 — — — 250
Total liabilities 299,615 124,632 79,167 706 504,120
Fund balances:Reserved for:
Encumbrances 32,519 46,022 79,677 159 158,377 Future appropriations — — 30,087 — 30,087
Unreserved:Designated for subsequent
years’ expenditures 216,429 — — — 216,429 Undesignated 553,101 144,043 (110,745) — 586,399 Reported in permanent funds — — — 44,678 44,678
Total fund balances 802,049 190,065 (981) 44,837 1,035,970
Total liabilities and fund balances $ 1,101,664 314,697 78,186 45,543 1,540,090
See accompanying notes to basic financial statements.
20
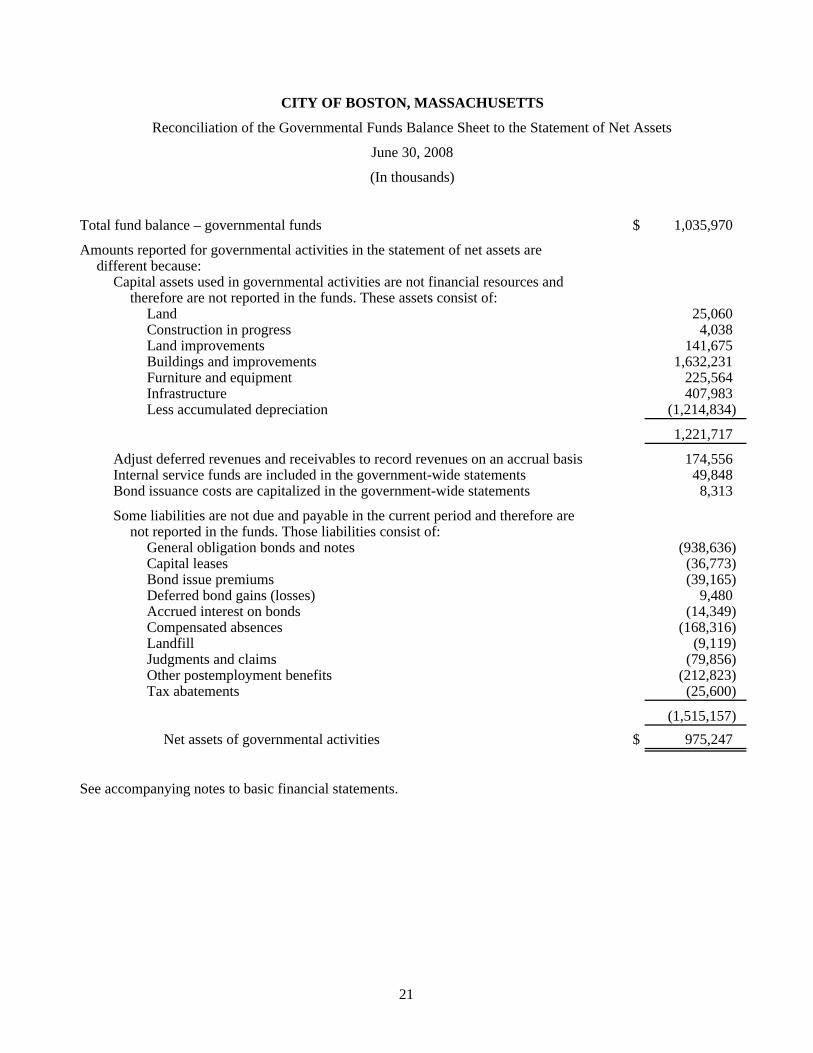
CITY OF BOSTON, MASSACHUSETTS
Reconciliation of the Governmental Funds Balance Sheet to the Statement of Net Assets
June 30, 2008
(In thousands)
Total fund balance – governmental funds $ 1,035,970
Amounts reported for governmental activities in the statement of net assets aredifferent because:
Capital assets used in governmental activities are not financial resources andtherefore are not reported in the funds. These assets consist of:
Land 25,060 Construction in progress 4,038 Land improvements 141,675 Buildings and improvements 1,632,231 Furniture and equipment 225,564 Infrastructure 407,983 Less accumulated depreciation (1,214,834)
1,221,717
Adjust deferred revenues and receivables to record revenues on an accrual basis 174,556 Internal service funds are included in the government-wide statements 49,848 Bond issuance costs are capitalized in the government-wide statements 8,313
Some liabilities are not due and payable in the current period and therefore arenot reported in the funds. Those liabilities consist of:
General obligation bonds and notes (938,636) Capital leases (36,773) Bond issue premiums (39,165) Deferred bond gains (losses) 9,480 Accrued interest on bonds (14,349) Compensated absences (168,316) Landfill (9,119) Judgments and claims (79,856) Other postemployment benefits (212,823) Tax abatements (25,600)
(1,515,157) Net assets of governmental activities $ 975,247
See accompanying notes to basic financial statements.
21
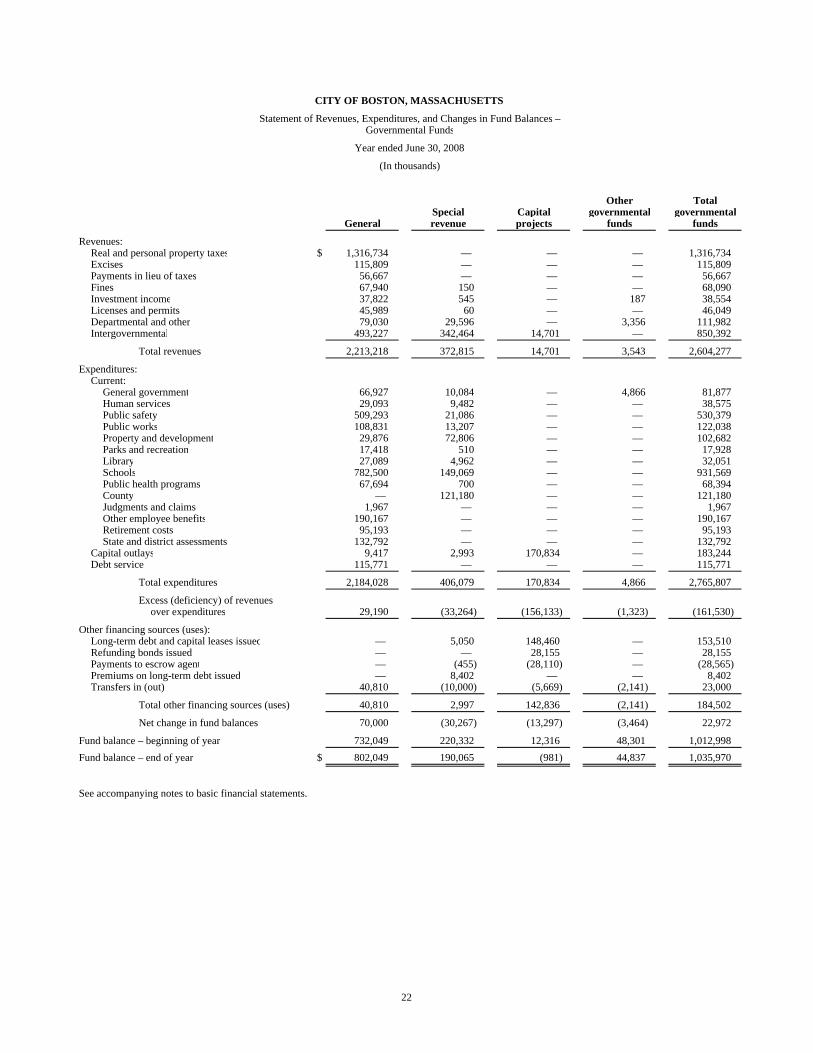
CITY OF BOSTON, MASSACHUSETTS
Statement of Revenues, Expenditures, and Changes in Fund Balances –Governmental Funds
Year ended June 30, 2008
(In thousands)
Other TotalSpecial Capital governmental governmental
General revenue projects funds funds
Revenues:Real and personal property taxes $ 1,316,734 — — — 1,316,734 Excises 115,809 — — — 115,809 Payments in lieu of taxes 56,667 — — — 56,667 Fines 67,940 150 — — 68,090 Investment income 37,822 545 — 187 38,554 Licenses and permits 45,989 60 — — 46,049 Departmental and other 79,030 29,596 — 3,356 111,982 Intergovernmental 493,227 342,464 14,701 — 850,392
Total revenues 2,213,218 372,815 14,701 3,543 2,604,277
Expenditures:Current:
General government 66,927 10,084 — 4,866 81,877 Human services 29,093 9,482 — — 38,575 Public safety 509,293 21,086 — — 530,379 Public works 108,831 13,207 — — 122,038 Property and development 29,876 72,806 — — 102,682 Parks and recreation 17,418 510 — — 17,928 Library 27,089 4,962 — — 32,051 Schools 782,500 149,069 — — 931,569 Public health programs 67,694 700 — — 68,394 County — 121,180 — — 121,180 Judgments and claims 1,967 — — — 1,967 Other employee benefits 190,167 — — — 190,167 Retirement costs 95,193 — — — 95,193 State and district assessments 132,792 — — — 132,792
Capital outlays 9,417 2,993 170,834 — 183,244 Debt service 115,771 — — — 115,771
Total expenditures 2,184,028 406,079 170,834 4,866 2,765,807
Excess (deficiency) of revenuesover expenditures 29,190 (33,264) (156,133) (1,323) (161,530)
Other financing sources (uses):Long-term debt and capital leases issued — 5,050 148,460 — 153,510 Refunding bonds issued — — 28,155 — 28,155 Payments to escrow agent — (455) (28,110) — (28,565) Premiums on long-term debt issued — 8,402 — — 8,402 Transfers in (out) 40,810 (10,000) (5,669) (2,141) 23,000
Total other financing sources (uses) 40,810 2,997 142,836 (2,141) 184,502
Net change in fund balances 70,000 (30,267) (13,297) (3,464) 22,972
Fund balance – beginning of year 732,049 220,332 12,316 48,301 1,012,998 Fund balance – end of year $ 802,049 190,065 (981) 44,837 1,035,970
See accompanying notes to basic financial statements.
22
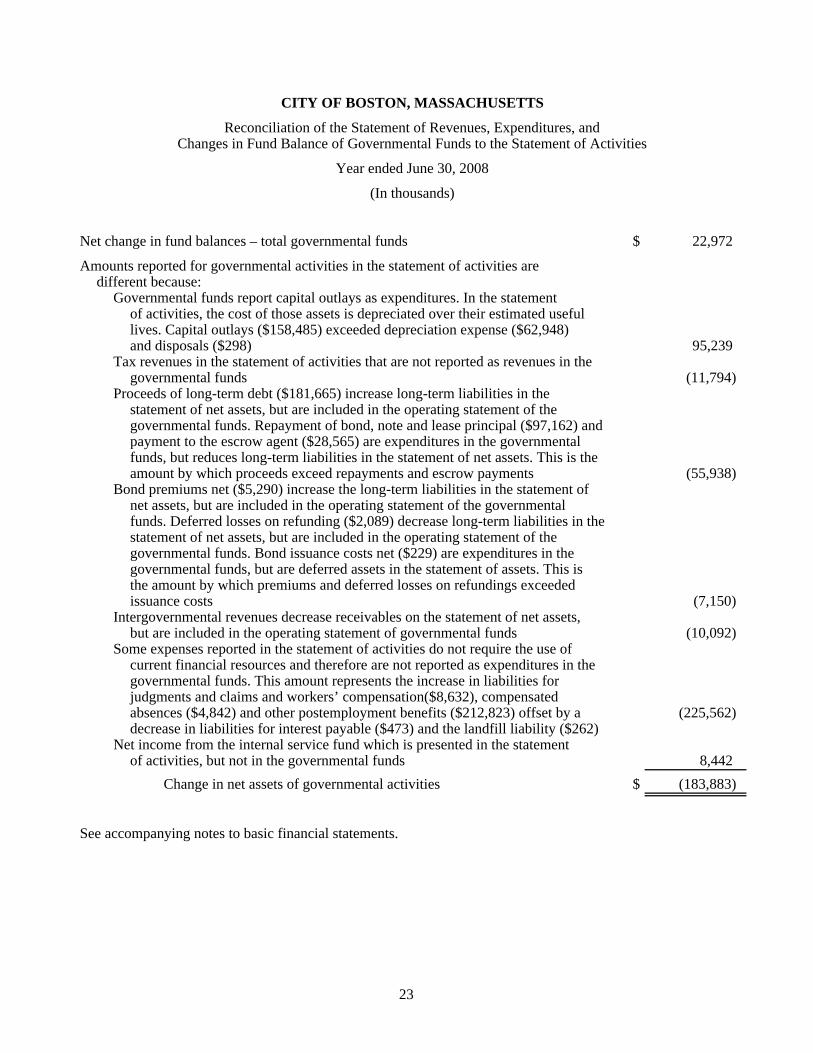
CITY OF BOSTON, MASSACHUSETTS
Reconciliation of the Statement of Revenues, Expenditures, andChanges in Fund Balance of Governmental Funds to the Statement of Activities
Year ended June 30, 2008
(In thousands)
Net change in fund balances – total governmental funds $ 22,972
Amounts reported for governmental activities in the statement of activities aredifferent because:
Governmental funds report capital outlays as expenditures. In the statementof activities, the cost of those assets is depreciated over their estimated usefullives. Capital outlays ($158,485) exceeded depreciation expense ($62,948)and disposals ($298) 95,239
Tax revenues in the statement of activities that are not reported as revenues in thegovernmental funds (11,794)
Proceeds of long-term debt ($181,665) increase long-term liabilities in thestatement of net assets, but are included in the operating statement of thegovernmental funds. Repayment of bond, note and lease principal ($97,162) andpayment to the escrow agent ($28,565) are expenditures in the governmentalfunds, but reduces long-term liabilities in the statement of net assets. This is theamount by which proceeds exceed repayments and escrow payments (55,938)
Bond premiums net ($5,290) increase the long-term liabilities in the statement ofnet assets, but are included in the operating statement of the governmentalfunds. Deferred losses on refunding ($2,089) decrease long-term liabilities in thestatement of net assets, but are included in the operating statement of thegovernmental funds. Bond issuance costs net ($229) are expenditures in thegovernmental funds, but are deferred assets in the statement of assets. This isthe amount by which premiums and deferred losses on refundings exceededissuance costs (7,150)
Intergovernmental revenues decrease receivables on the statement of net assets,but are included in the operating statement of governmental funds (10,092)
Some expenses reported in the statement of activities do not require the use ofcurrent financial resources and therefore are not reported as expenditures in thegovernmental funds. This amount represents the increase in liabilities forjudgments and claims and workers’ compensation($8,632), compensatedabsences ($4,842) and other postemployment benefits ($212,823) offset by a (225,562) decrease in liabilities for interest payable ($473) and the landfill liability ($262)
Net income from the internal service fund which is presented in the statementof activities, but not in the governmental funds 8,442
Change in net assets of governmental activities $ (183,883)
See accompanying notes to basic financial statements.
23
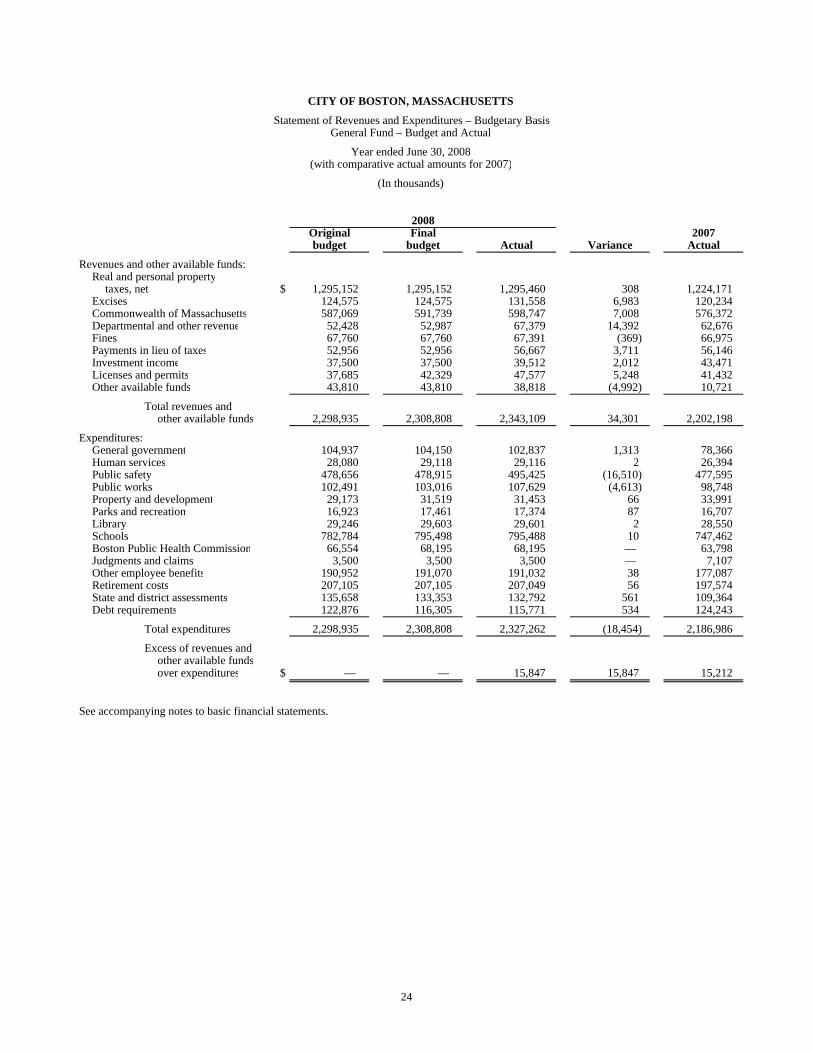
CITY OF BOSTON, MASSACHUSETTS
Statement of Revenues and Expenditures – Budgetary BasisGeneral Fund – Budget and Actual
Year ended June 30, 2008(with comparative actual amounts for 2007)
(In thousands)
2008Original Final 2007budget budget Actual Variance Actual
Revenues and other available funds:Real and personal property
taxes, net $ 1,295,152 1,295,152 1,295,460 308 1,224,171 Excises 124,575 124,575 131,558 6,983 120,234 Commonwealth of Massachusetts 587,069 591,739 598,747 7,008 576,372 Departmental and other revenue 52,428 52,987 67,379 14,392 62,676 Fines 67,760 67,760 67,391 (369) 66,975 Payments in lieu of taxes 52,956 52,956 56,667 3,711 56,146 Investment income 37,500 37,500 39,512 2,012 43,471 Licenses and permits 37,685 42,329 47,577 5,248 41,432 Other available funds 43,810 43,810 38,818 (4,992) 10,721
Total revenues andother available funds 2,298,935 2,308,808 2,343,109 34,301 2,202,198
Expenditures:General government 104,937 104,150 102,837 1,313 78,366 Human services 28,080 29,118 29,116 2 26,394 Public safety 478,656 478,915 495,425 (16,510) 477,595 Public works 102,491 103,016 107,629 (4,613) 98,748 Property and development 29,173 31,519 31,453 66 33,991 Parks and recreation 16,923 17,461 17,374 87 16,707 Library 29,246 29,603 29,601 2 28,550 Schools 782,784 795,498 795,488 10 747,462 Boston Public Health Commission 66,554 68,195 68,195 — 63,798 Judgments and claims 3,500 3,500 3,500 — 7,107 Other employee benefits 190,952 191,070 191,032 38 177,087 Retirement costs 207,105 207,105 207,049 56 197,574 State and district assessments 135,658 133,353 132,792 561 109,364 Debt requirements 122,876 116,305 115,771 534 124,243
Total expenditures 2,298,935 2,308,808 2,327,262 (18,454) 2,186,986
Excess of revenues andother available fundsover expenditures $ — — 15,847 15,847 15,212
See accompanying notes to basic financial statements.
24
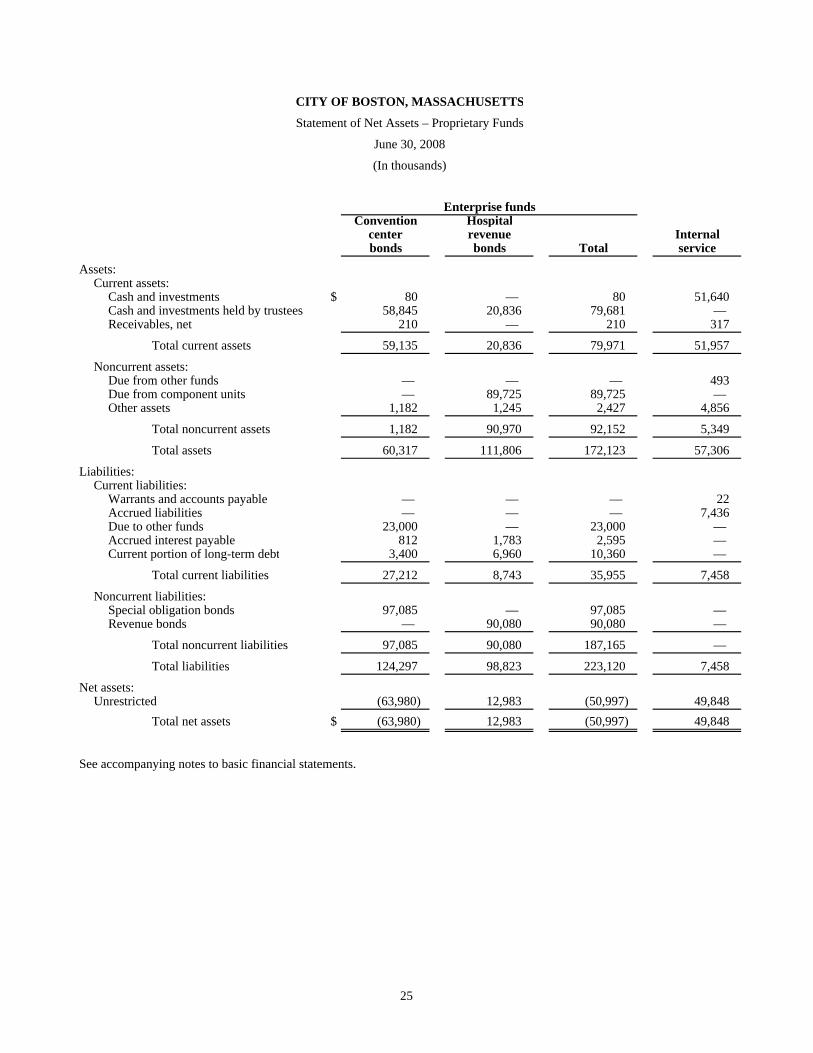
CITY OF BOSTON, MASSACHUSETTS
Statement of Net Assets – Proprietary Funds
June 30, 2008
(In thousands)
Enterprise fundsConvention Hospital
center revenue Internalbonds bonds Total service
Assets:Current assets:
Cash and investments $ 80 — 80 51,640 Cash and investments held by trustees 58,845 20,836 79,681 — Receivables, net 210 — 210 317
Total current assets 59,135 20,836 79,971 51,957
Noncurrent assets:Due from other funds — — — 493 Due from component units — 89,725 89,725 — Other assets 1,182 1,245 2,427 4,856
Total noncurrent assets 1,182 90,970 92,152 5,349
Total assets 60,317 111,806 172,123 57,306
Liabilities:Current liabilities:
Warrants and accounts payable — — — 22 Accrued liabilities — — — 7,436 Due to other funds 23,000 — 23,000 — Accrued interest payable 812 1,783 2,595 — Current portion of long-term debt 3,400 6,960 10,360 —
Total current liabilities 27,212 8,743 35,955 7,458
Noncurrent liabilities:Special obligation bonds 97,085 — 97,085 — Revenue bonds — 90,080 90,080 —
Total noncurrent liabilities 97,085 90,080 187,165 —
Total liabilities 124,297 98,823 223,120 7,458
Net assets:Unrestricted (63,980) 12,983 (50,997) 49,848
Total net assets $ (63,980) 12,983 (50,997) 49,848
See accompanying notes to basic financial statements.
25
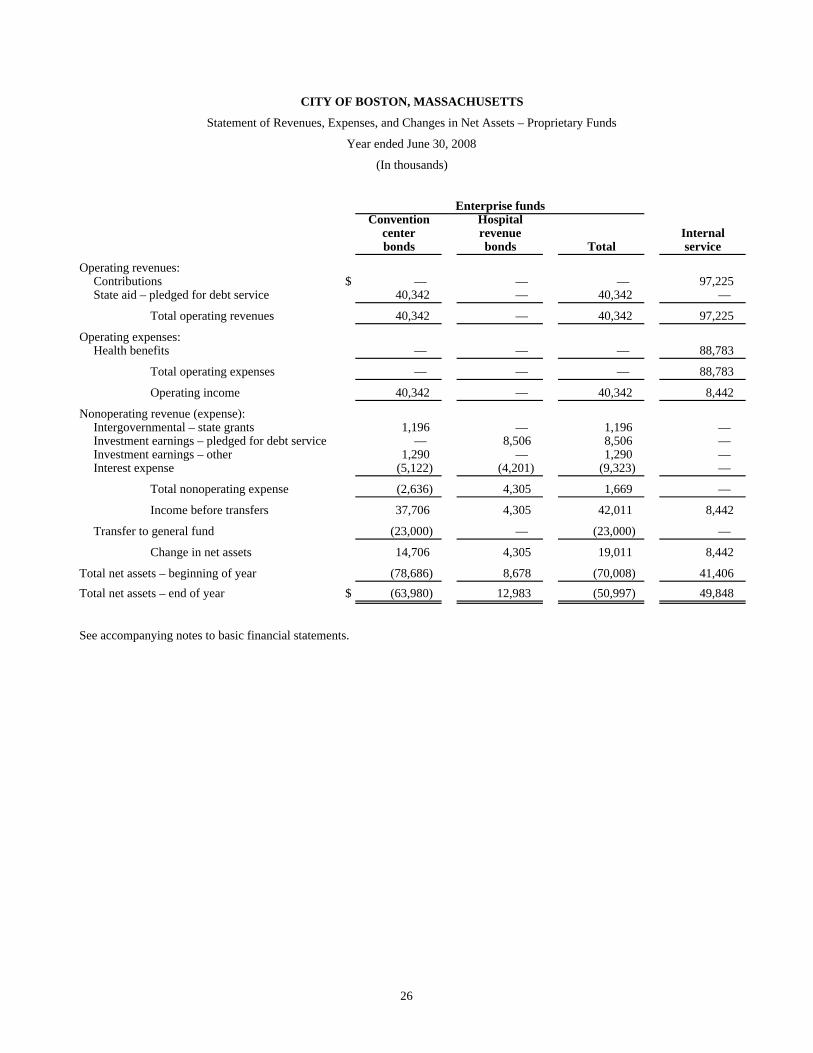
CITY OF BOSTON, MASSACHUSETTS
Statement of Revenues, Expenses, and Changes in Net Assets – Proprietary Funds
Year ended June 30, 2008
(In thousands)
Enterprise fundsConvention Hospital
center revenue Internalbonds bonds Total service
Operating revenues:Contributions $ — — — 97,225 State aid – pledged for debt service 40,342 — 40,342 —
Total operating revenues 40,342 — 40,342 97,225
Operating expenses:Health benefits — — — 88,783
Total operating expenses — — — 88,783
Operating income 40,342 — 40,342 8,442
Nonoperating revenue (expense):Intergovernmental – state grants 1,196 — 1,196 — Investment earnings – pledged for debt service — 8,506 8,506 — Investment earnings – other 1,290 — 1,290 — Interest expense (5,122) (4,201) (9,323) —
Total nonoperating expense (2,636) 4,305 1,669 —
Income before transfers 37,706 4,305 42,011 8,442
Transfer to general fund (23,000) — (23,000) —
Change in net assets 14,706 4,305 19,011 8,442
Total net assets – beginning of year (78,686) 8,678 (70,008) 41,406 Total net assets – end of year $ (63,980) 12,983 (50,997) 49,848
See accompanying notes to basic financial statements.
26
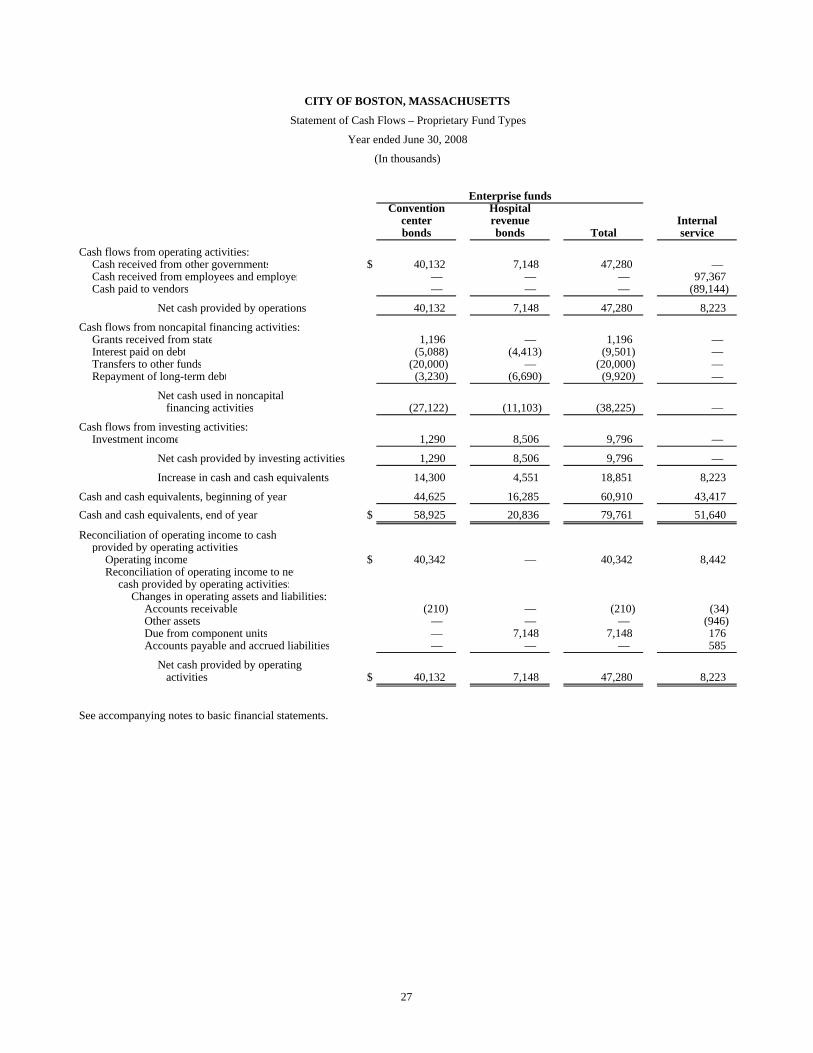
CITY OF BOSTON, MASSACHUSETTS
Statement of Cash Flows – Proprietary Fund Types
Year ended June 30, 2008
(In thousands)
Enterprise fundsConvention Hospital
center revenue Internalbonds bonds Total service
Cash flows from operating activities:Cash received from other governments $ 40,132 7,148 47,280 — Cash received from employees and employer — — — 97,367 Cash paid to vendors — — — (89,144)
Net cash provided by operations 40,132 7,148 47,280 8,223
Cash flows from noncapital financing activities:Grants received from state 1,196 — 1,196 — Interest paid on debt (5,088) (4,413) (9,501) — Transfers to other funds (20,000) — (20,000) — Repayment of long-term debt (3,230) (6,690) (9,920) —
Net cash used in noncapital financing activities (27,122) (11,103) (38,225) —
Cash flows from investing activities:Investment income 1,290 8,506 9,796 —
Net cash provided by investing activities 1,290 8,506 9,796 —
Increase in cash and cash equivalents 14,300 4,551 18,851 8,223
Cash and cash equivalents, beginning of year 44,625 16,285 60,910 43,417 Cash and cash equivalents, end of year $ 58,925 20,836 79,761 51,640
Reconciliation of operating income to cashprovided by operating activities:
Operating income $ 40,342 — 40,342 8,442 Reconciliation of operating income to net
cash provided by operating activities:Changes in operating assets and liabilities:
Accounts receivable (210) — (210) (34) Other assets — — — (946) Due from component units — 7,148 7,148 176 Accounts payable and accrued liabilities — — — 585
Net cash provided by operating activities $ 40,132 7,148 47,280 8,223
See accompanying notes to basic financial statements.
27
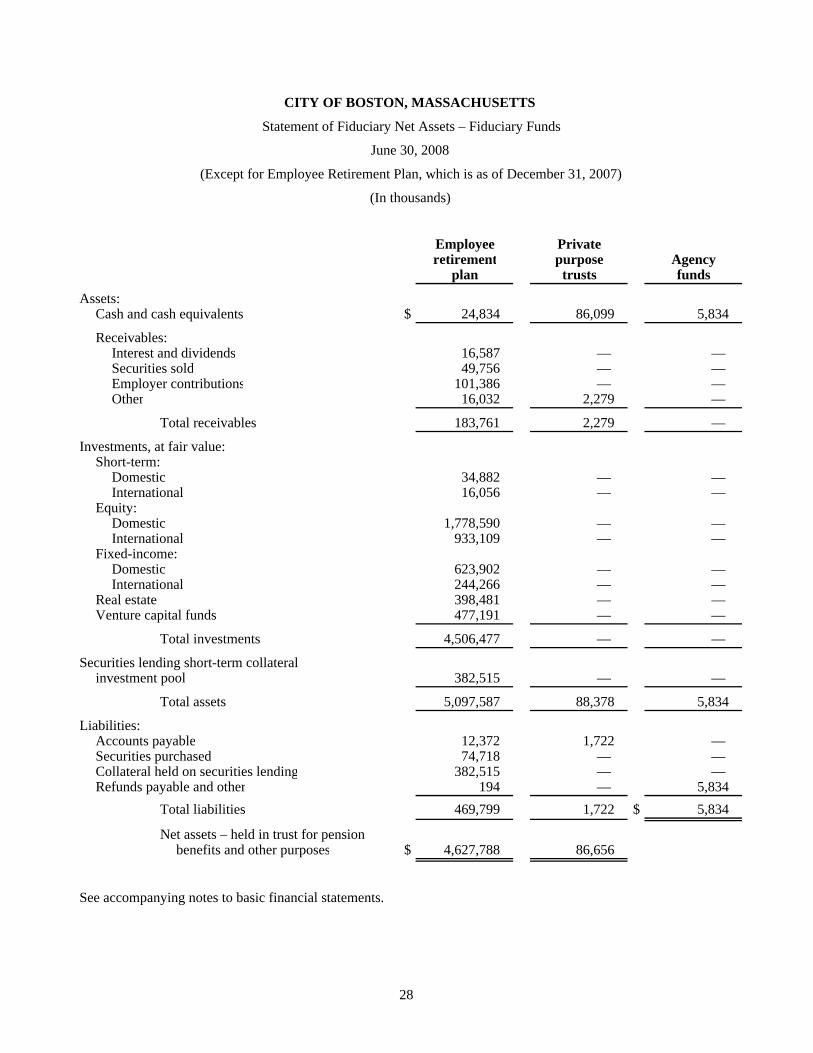
CITY OF BOSTON, MASSACHUSETTS
Statement of Fiduciary Net Assets – Fiduciary Funds
June 30, 2008
(Except for Employee Retirement Plan, which is as of December 31, 2007)
(In thousands)
Employee Privateretirement purpose Agency
plan trusts funds
Assets:Cash and cash equivalents $ 24,834 86,099 5,834
Receivables:Interest and dividends 16,587 — — Securities sold 49,756 — — Employer contributions 101,386 — — Other 16,032 2,279 —
Total receivables 183,761 2,279 —
Investments, at fair value:Short-term:
Domestic 34,882 — — International 16,056 — —
Equity:Domestic 1,778,590 — — International 933,109 — —
Fixed-income:Domestic 623,902 — — International 244,266 — —
Real estate 398,481 — — Venture capital funds 477,191 — —
Total investments 4,506,477 — —
Securities lending short-term collateralinvestment pool 382,515 — —
Total assets 5,097,587 88,378 5,834
Liabilities:Accounts payable 12,372 1,722 — Securities purchased 74,718 — — Collateral held on securities lending 382,515 — — Refunds payable and other 194 — 5,834
Total liabilities 469,799 1,722 $ 5,834
Net assets – held in trust for pensionbenefits and other purposes $ 4,627,788 86,656
See accompanying notes to basic financial statements.
28
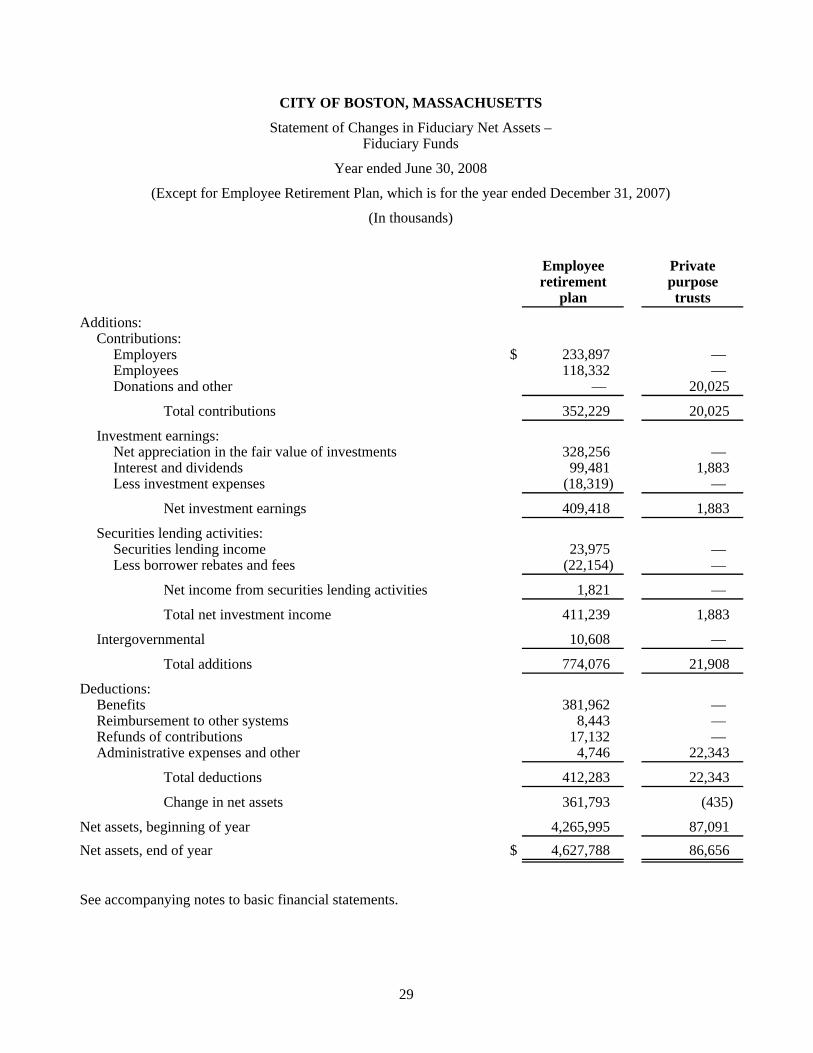
CITY OF BOSTON, MASSACHUSETTS
Statement of Changes in Fiduciary Net Assets –Fiduciary Funds
Year ended June 30, 2008
(Except for Employee Retirement Plan, which is for the year ended December 31, 2007)
(In thousands)
Employee Privateretirement purpose
plan trusts
Additions:Contributions:
Employers $ 233,897 — Employees 118,332 — Donations and other — 20,025
Total contributions 352,229 20,025
Investment earnings:Net appreciation in the fair value of investments 328,256 — Interest and dividends 99,481 1,883 Less investment expenses (18,319) —
Net investment earnings 409,418 1,883
Securities lending activities:Securities lending income 23,975 — Less borrower rebates and fees (22,154) —
Net income from securities lending activities 1,821 —
Total net investment income 411,239 1,883
Intergovernmental 10,608 —
Total additions 774,076 21,908
Deductions:Benefits 381,962 — Reimbursement to other systems 8,443 — Refunds of contributions 17,132 — Administrative expenses and other 4,746 22,343
Total deductions 412,283 22,343
Change in net assets 361,793 (435)
Net assets, beginning of year 4,265,995 87,091 Net assets, end of year $ 4,627,788 86,656
See accompanying notes to basic financial statements.
29
CITY OF BOSTON, MASSACHUSETTS
Notes to Basic Financial Statements
June 30, 2008
30 (Continued)
(1) The Financial Reporting Entity
The accounting policies followed in preparing the accompanying basic financial statements are as follows:
(a) Primary Government
The City of Boston (the City), incorporated as a town in 1630 and as a city in 1822, now exists under Chapter 486 of the Act of 1909 and Chapter 452 of the Acts of 1948 of the Commonwealth of Massachusetts (the Commonwealth) which, as amended, constitute the City’s Charter. The Mayor is elected to a four-year term and serves as chief executive officer of the City. The Mayor has general supervision of and control over the City’s boards, commissions, officers, and departments. The legislative body of the City is the City Council, which consists of thirteen elected members serving two-year terms.
The accompanying basic financial statements present the City of Boston and its component units. The component units discussed below are included in the City’s reporting entity because of the significance of their operational or financial relationships with the City.
(b) Retirement System
The State-Boston Retirement System (SBRS) is a defined benefit contributory retirement system created under state statute. It is administered by a Retirement Board comprised of five members: the City Auditor, who serves ex officio; two individuals elected by participants in the system; a fourth member appointed by the Mayor; and a fifth member chosen by the other members. The SBRS provides pension benefits to retired City, Boston Redevelopment Authority, Boston Housing Authority, Boston Water and Sewer Commission, Boston Public Health Commission and the Sheriff of Suffolk County employees. Although legally separate, the SBRS provides services entirely, or almost entirely to the City and thus has been reported as if it were part of the primary government; a method of inclusion known as blending.
A complete set of financial statements for SBRS for the fiscal year ended December 31, 2007 can be obtained through the City Auditor’s office, Room M-4, City Hall Plaza, Boston, Massachusetts 02201. The SBRS is included in the City’s fiduciary fund financial statements.
(c) Discretely Presented Component Units Disclosure
These component units are reported in a separate column to emphasize that they are legally separate from the City but are included because the City is financially accountable for and is able to impose its will on the organizations. Unless otherwise indicated, the notes to the basic financial statements pertain only to the primary government because certain disclosures of the component units are not significant relative to the total component units and to the primary government. A description of the component units, criteria for inclusion, and their relationship with the City are as follows:
Boston Redevelopment Authority (BRA) – The BRA is a public body politic and corporate constituting the City’s redevelopment authority and exercising the powers of a planning board for the City. The BRA is governed by a five-member board, four of whom are appointed by the Mayor. Its purpose is to provide planning support for major construction and redevelopment activity in the City.
CITY OF BOSTON, MASSACHUSETTS
Notes to Basic Financial Statements
June 30, 2008
31 (Continued)
Economic Development and Industrial Corporation of Boston (EDIC) – The EDIC is a body politic and corporate and an instrumentality of the Commonwealth. It is governed by the same persons appointed as members of the BRA board. The EDIC has various powers to assist industrial development projects in the City, and together with the BRA, assists the City with its economic development function.
Boston Public Health Commission (PHC) – The PHC is a body politic and corporate and public instrumentality of the Commonwealth, established by Chapter 147 of the Acts of 1995. PHC is governed by a seven-member board, six of whom are appointed by the Mayor and confirmed by the City Council, and one of whom is the chief executive officer of the Boston Medical Center (BMC). The PHC is responsible for the implementation of public health programs in the City.
Trustees of the Public Library of the City of Boston (TPL) – The TPL is a nonprofit organization qualified as a tax-exempt entity under Section 501(c)(3) of the Internal Revenue Code. Trustees of TPL are appointed by the Mayor. The TPL was established to benefit the public library system of the City.
The financial statements of the discretely presented component units are included for their respective fiscal year ends, which is June 30, 2008.
Complete financial statements of these discretely presented component units can be obtained through the City Auditor’s office, Room M-4, City Hall Plaza, Boston, Massachusetts 02201. In addition, condensed financial statements for the discretely presented component units are included in note 17.
(d) Related Organizations
The Mayor is also responsible for appointing members of the governing bodies of the Boston Housing Authority, Boston Industrial Development Finance Authority, and Boston Water and Sewer Commission; however, the City’s accountability for these organizations does not extend beyond making these appointments.
(2) Summary of Significant Accounting Policies
The accounting policies of the City of Boston, Massachusetts, conform to U.S. generally accepted accounting principles as applicable to governmental units as prescribed by the Governmental Accounting Standards Board (GASB). The following is a summary of the more significant policies followed by the City:
(a) Government-Wide and Fund Financial Statements
The government-wide financial statements (i.e., the statement of net assets and the statement of changes in net assets) report information on all of the nonfiduciary activities of the primary government and its component units. For the most part, the effect of interfund activity has been removed from these statements. Governmental activities, which normally are supported by taxes and intergovernmental revenues, are reported separately from business-type activities, which rely to a significant extent on fees and charges for support. Likewise, the primary government is reported
CITY OF BOSTON, MASSACHUSETTS
Notes to Basic Financial Statements
June 30, 2008
32 (Continued)
separately from certain legally separate component units for which the primary government is financially accountable.
The statement of activities demonstrates the degree to which the direct expenses of a given function or segment is offset by program revenues. Direct expenses are those that are clearly identifiable with a specific function or segment. Program revenues include 1) charges to customers or applicants who purchase, use, or directly benefit from goods, services, or privileges provided by a given function or segment, and 2) grants and contributions that are restricted to meeting the operational or capital requirements of a particular function or segment. Taxes and other items not properly included among program revenues are reported instead as general revenues.
Separate financial statements are provided for governmental funds, proprietary funds, and fiduciary funds, even though the latter are excluded from the government-wide financial statements. Major individual governmental funds and major individual enterprise funds are reported as separate columns in the fund financial statements.
(b) Measurement Focus, Basis of Accounting, and Financial Statement Presentation
Government-Wide Financial Statements
The government-wide financial statements are reported using the economic resources measurement focus and the accrual basis of accounting, as are the proprietary fund and fiduciary fund financial statements. The agency fund within the fiduciary fund has no measurement to focus. Revenues are recorded when earned and expenses are recorded when a liability is incurred, regardless of the timing of related cash flows. Property taxes are recognized as revenues in the year for which they are levied. Grants and similar items are recognized as revenue as soon as all eligibility requirements imposed by the provider have been met.
Amounts reported as program revenues include 1) charges to customers or applicants for goods, services, or privileges provided, 2) operating grants and contributions, and 3) capital grants and contributions, including special assessments. Internally dedicated resources are reported as general revenues rather than as program revenues. Likewise, general revenues include all taxes.
Governmental Fund Financial Statements
Governmental fund financial statements are reported using the current financial resources measurements focus and the modified accrual basis of accounting. Revenues are recognized as soon as they are “susceptible to accrual” (i.e., both measurable and available.) Revenues not considered to be available are recorded as deferred revenue.
The City applies the susceptible to accrual criteria to property taxes and intergovernmental revenues. In applying the susceptible to accrual concept to intergovernmental revenues, there are essentially two types of revenues. In one, resources must be expended on the specific purpose or project before any amounts will be reimbursed to the City; therefore, revenues are recognized based upon the amount of expenditures incurred. In the other, resources are virtually unrestricted and are usually revocable by the grantor only for failure to comply with prescribed compliance requirements. These resources are reflected as revenues at the time of receipt or earlier if the susceptible to accrual criteria
CITY OF BOSTON, MASSACHUSETTS
Notes to Basic Financial Statements
June 30, 2008
33 (Continued)
are met. Property taxes are recognized as revenue in the year for which taxes have been levied, provided they are collected within 60 days after year end.
Expenditures generally are recorded when a liability is incurred. However, debt service expenditures, as well as expenditures related to compensated absences and judgments and claims, are recorded only when payment is mature and due.
Proprietary Fund, Fiduciary Fund, and Component Unit Financial Statements
Private-sector standards of accounting and financial reporting issued prior to December 1, 1989 generally are followed in both the government-wide and proprietary fund financial statements to the extent that those standards do not conflict with or contradict guidance of GASB. Governments also have the option of following subsequent private-sector guidance for their business-type activities and enterprise funds, subject to this same limitation. The City has elected not to follow subsequent private-sector guidance.
Proprietary funds distinguish operating revenues and expenses from nonoperating items. Operating revenues and expenses generally result from the collection of revenue pledged to repay debt. The principal operating revenues of the City’s enterprise funds are lease receipts and excise taxes. The principal operating revenues of the City’s internal service funds are receipts from employer and employee premiums for health insurance premiums. Operating expenses for enterprise funds and internal service funds include the interest, administrative expenses, and vendor payments. All revenues and expenses not meeting this definition are reported as nonoperating revenues and expenses.
Governmental funds – The City reports the following major governmental funds:
The general fund is the City’s primary operating fund. It accounts for all financial resources of the general government, except those required to be accounted for in another fund.
The special revenue fund accounts principally for the activities funded by federal and state grant revenue sources and certain other revenues that are legally restricted to expenditures for specified purposes.
The capital activities fund accounts for bond proceeds and grant revenues used for the acquisition or construction of the City capital facilities.
Proprietary funds – The City reports the following major proprietary funds:
The convention center bond fund accounts for the City activities related to the financing for the construction of a new state-owned convention center. Revenue debt issued in connection with this fund is payable solely by specified local and state receipts.
The hospital revenue bond fund accounts for the activities related to the Boston City Hospital Revenue Bonds. These Bonds are payable solely from the mortgage note payments received from the Public Health Commission. These Bonds are repaid from a pledged revenue source from PHC.
CITY OF BOSTON, MASSACHUSETTS
Notes to Basic Financial Statements
June 30, 2008
34 (Continued)
Fiduciary funds – Additionally, the City reports the following fiduciary fund types:
The private-purpose trust fund is used to account for resources legally held in trust for the benefit of individuals, private organizations, or other governments. The City operates four pools used for the improvement of the City’s parks and cemeteries, educational scholarships and sporting equipment, creation of public utility and beauty and co-mingled nontestamentary trusts.
The pension trust fund accounts principally for the activities of the State-Boston Employees Retirement System, a blended component unit, which accumulates resources for pension benefit payments to retired City employees.
The agency funds are used to report funds held by the City in a purely custodial capacity. The City currently operates a drug evidence account for proceeds from property seized from illegal drug related activities. These funds are then used to offset the costs of technical equipment or expertise and investigations.
The City also uses an internal service fund to account for its self-insured health costs. Although the fund is presented in a separate column in the accompanying basic financial statements, it is not considered a major fund.
As a general rule, the effect of interfund activity has been eliminated from the government-wide financial statements.
When both restricted and unrestricted resources are available for use, it is the City’s policy to use restricted resources first, then unrestricted resources as they are needed.
(c) Cash Equivalents
For purposes of the statement of cash flows, investments with original maturities of three months or less when purchased are considered to be cash equivalents.
(d) Basis of Investment Valuation
Investments are presented in the accompanying basic financial statements at fair value. Where applicable, fair values are based on quotations from national securities exchanges, except for certain investments of SBRS which are described in notes 5 and 11. Further, income from investments is recognized in the same fund as the related investments.
The City invests in the Massachusetts Municipal Depository Trust (MMDT), which is an external investment pool and is not SEC registered. The fund is state regulated and is valued at current share price.
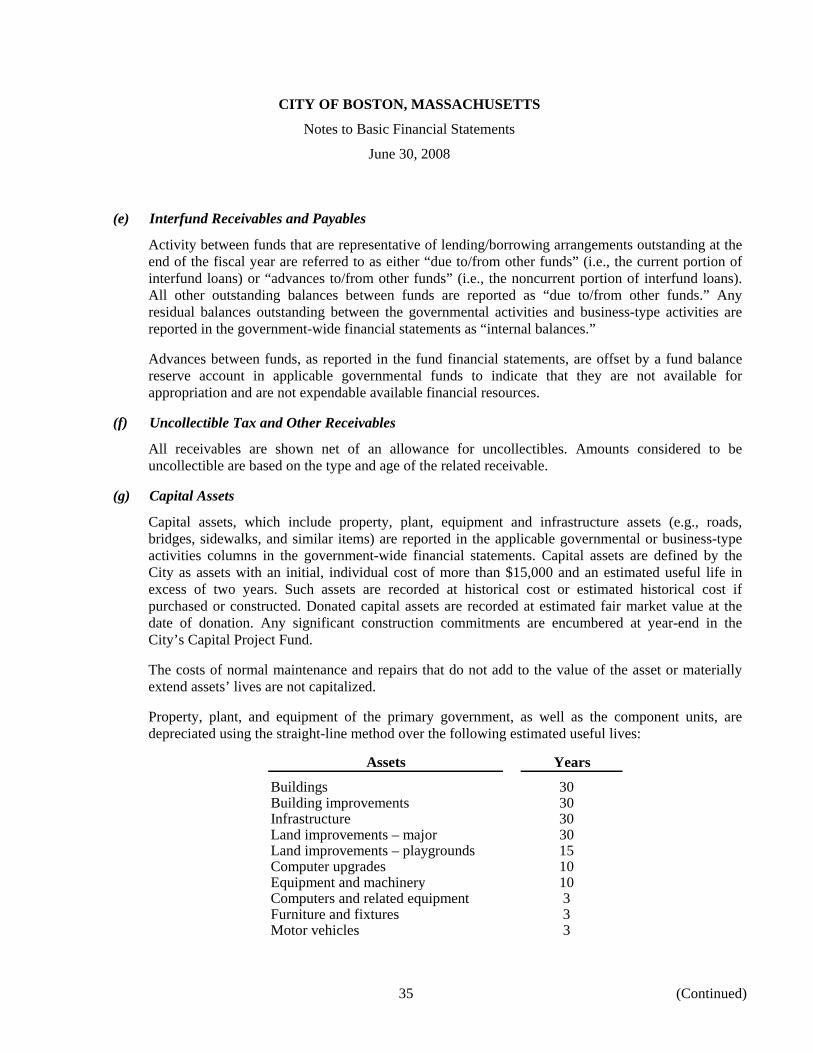
CITY OF BOSTON, MASSACHUSETTS
Notes to Basic Financial Statements
June 30, 2008
35 (Continued)
(e) Interfund Receivables and Payables
Activity between funds that are representative of lending/borrowing arrangements outstanding at the end of the fiscal year are referred to as either “due to/from other funds” (i.e., the current portion of interfund loans) or “advances to/from other funds” (i.e., the noncurrent portion of interfund loans). All other outstanding balances between funds are reported as “due to/from other funds.” Any residual balances outstanding between the governmental activities and business-type activities are reported in the government-wide financial statements as “internal balances.”
Advances between funds, as reported in the fund financial statements, are offset by a fund balance reserve account in applicable governmental funds to indicate that they are not available for appropriation and are not expendable available financial resources.
(f) Uncollectible Tax and Other Receivables
All receivables are shown net of an allowance for uncollectibles. Amounts considered to be uncollectible are based on the type and age of the related receivable.
(g) Capital Assets
Capital assets, which include property, plant, equipment and infrastructure assets (e.g., roads, bridges, sidewalks, and similar items) are reported in the applicable governmental or business-type activities columns in the government-wide financial statements. Capital assets are defined by the City as assets with an initial, individual cost of more than $15,000 and an estimated useful life in excess of two years. Such assets are recorded at historical cost or estimated historical cost if purchased or constructed. Donated capital assets are recorded at estimated fair market value at the date of donation. Any significant construction commitments are encumbered at year-end in the City’s Capital Project Fund.
The costs of normal maintenance and repairs that do not add to the value of the asset or materially extend assets’ lives are not capitalized.
Property, plant, and equipment of the primary government, as well as the component units, are depreciated using the straight-line method over the following estimated useful lives:
Assets Years
Buildings 30 Building improvements 30 Infrastructure 30 Land improvements – major 30 Land improvements – playgrounds 15 Computer upgrades 10 Equipment and machinery 10 Computers and related equipment 3 Furniture and fixtures 3 Motor vehicles 3
CITY OF BOSTON, MASSACHUSETTS
Notes to Basic Financial Statements
June 30, 2008
36 (Continued)
(h) Compensated Absences
Employees are granted sick and vacation leave in varying amounts. Upon retirement, termination, or death, certain employees are compensated for unused sick and vacation leave (subject to certain limitations) at their then current rates of pay. The portion of the liability related to unused sick and vacation time that has matured or is due as of June 30, 2008 is recorded in the governmental fund financial statements. The liability for vacation leave is based on the amount earned but not used; for sick leave, it is based on the amount accumulated at the balance sheet date (vesting method). The liability for both amounts is calculated based on the pay or salary rates in effect at the balance sheet date.
(i) Long-Term Obligations and Related Costs
Premiums, Discounts, and Issue Costs – In the government-wide financial statements, and proprietary fund types in the fund financial statements, long-term debt and other long-term obligations are reported as liabilities in the applicable governmental activities, business-type activities, or proprietary fund type statement of net assets. Bond premiums and discounts, as well as issuance costs, are deferred and amortized over the life of the bonds using the effective interest method. The unamortized portion is presented in the government-wide statement of net assets. Bonds payable are reported net of the applicable bond premium or discount. Bond issuance costs are reported as deferred charges and amortized over the term of the related debt.
In the fund financial statements, governmental fund types recognize bond premiums and discounts, as well as bond issuance costs, during the current period. The face amount of debt issued is reported as other financing sources. Premiums received on debt issuances are reported as other financing sources while discounts on debt issuances are reported as other financing uses. Issuance costs, whether or not withheld from the actual debt proceeds received, are reported as debt service expenditures.
(j) Fund Equity
In the fund financial statements, governmental funds report reservations of fund balance for amounts that are not available for appropriation or are legally restricted by outside parties for use for a specific purpose. Designations of fund balance represent tentative management plans that are subject to change.
(k) Tax Abatement Refunds
Matured tax abatement refunds that are due and payable at June 30 have been recorded as a liability in the general fund. Other refunds have been recorded in the government-wide statement of net assets.
CITY OF BOSTON, MASSACHUSETTS
Notes to Basic Financial Statements
June 30, 2008
37 (Continued)
(l) Landfill Closure and Postclosure Care Costs
State and federal regulations require the City to place a final cover on its Gardner Street landfill site when it stops accepting waste and to perform certain maintenance and monitoring functions at the site for 30 years after closure. At June 30, 2008, 100% of the Gardner Street landfill site had been used and had not accepted solid waste for several years. While most of the landfill closure construction was completed in prior years, there still remains 12 acres of the landfill to be capped as of June 30, 2008.
The total current cost of landfill closure and postclosure care is an estimate, subject to changes resulting from inflation, deflation, technology or other changes in applicable laws or regulations. Such costs are recognized as expenditures in the general fund to the extent that they are due or matured and are expected to be paid with expendable available financial resources. The total liability is reported in the government-wide statement of net assets. Expenditures related to the Gardner Street landfill site postclosure care in fiscal year 2008 were approximately $263,000.
(m) Use of Estimates
The preparation of the accompanying basic financial statements in conformity with U.S. generally accepted accounting principles requires management to make estimates and assumptions that affect the reported amounts of assets and liabilities and disclosure of contingent assets and liabilities at the date of the financial statements and the reported amounts of revenues and expenses during the reporting period. Actual results could differ from those estimates.
(3) Short-Term Debt
During fiscal year 2008, the City had no short-term debt issued or outstanding.
(4) Budgetary Data
The general fund is the only fund for which a budget is legally adopted. The budgets for all departments included in the general fund of the City, except the School Department, are prepared under the direction of the Mayor and City Council. The School Department budget is prepared under the direction of the School Committee.
Original and supplemental appropriations are submitted by the Mayor, approved by the City Council and lapse at year-end unless encumbered. The legal level of control over appropriations is at the department level. Amendments to the original budget must be approved by the City Council, except for a reallocation of appropriations of up to $3 million, which the Mayor may approve. Further, the City Auditor, with the approval of the Mayor, may make transfers from any appropriation to any other appropriation for purposes of eliminating deficits before closing the books for the fiscal year. After the close of the fiscal year, the City Auditor may, with the approval of the Mayor, apply any income, taxes, and funds not disposed of and make transfers from any appropriation to any other appropriation for the purpose of closing the accounts for the fiscal year. Supplemental appropriations, other than the aforementioned transfers, were $9.9 million for the year.
CITY OF BOSTON, MASSACHUSETTS
Notes to Basic Financial Statements
June 30, 2008
38 (Continued)
The City must establish its property tax rate each year so that the resulting property tax levy will comply with the limits required by Proposition 2-1/2 (note 6). The tax levy must equal the sum of (a) the aggregate of all annual appropriations for expenditures; plus (b) the reserve accounts described in the following paragraph; plus (c) provision for the prior fiscal years’ deficits, if any; less (d) the aggregate of all nonproperty tax revenues projected to be received by the City, including available funds, in amounts certified or approved by the Commonwealth for tax rate purposes.
In accordance with the 1986 amendments to the Funding Loan Act of 1982, the City has established two reserve funds. The first is a budget reserve fund which is required to be funded in stages to a final level of 2-1/2% of the prior year’s overall departmental appropriations, except the School Department, by the beginning of fiscal year 1990. It is available to be applied to extraordinary and unforeseen expenditures. The second is a separate reserve fund of 1% to 2-1/2% of the current year appropriation of the School Department to be applied to over expenditures in that department.
The City’s general fund budget is prepared on a basis other than accounting principles generally accepted in the United States of America (GAAP). The “actual” results column in the statement of revenues and expenditures – budgetary basis – general fund is presented on a “budgetary basis” to provide a meaningful comparison of actual results with the budget. The major differences between the budget and GAAP basis, where applicable, are that:
(a) Revenues are recorded when cash is received, except for real estate and personal property taxes which are recorded as revenue when levied (budget), as opposed to when susceptible to accrual (GAAP).
(b) Encumbrances and continuing appropriations are recorded as the equivalent of expenditures (budget), as opposed to a reservation of fund balance (GAAP).
(c) Certain activities and transactions are presented in separate funds (GAAP), rather than as components of the general fund (budget).
(d) Amounts raised for the prior years’ deficits and available funds from prior years’ surpluses are recorded as revenue items (budget), but have no effect on GAAP revenues.
In addition, there are certain differences in classifications between revenues, expenditures, and transfers.
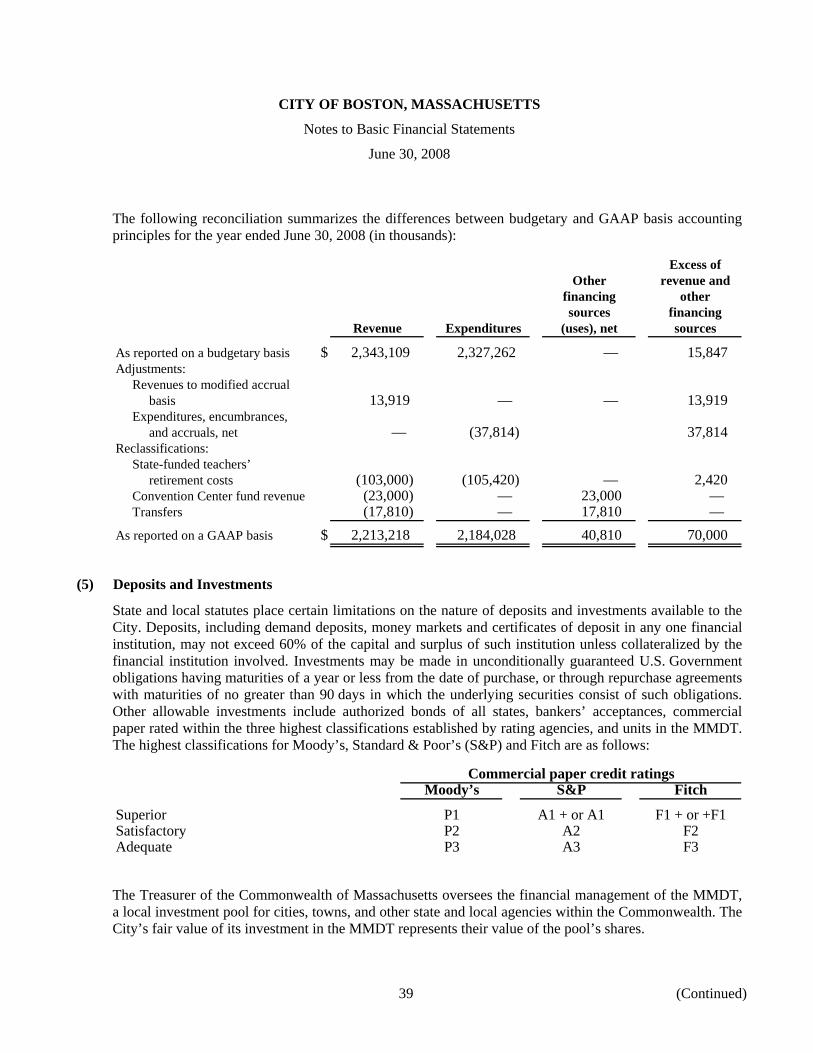
CITY OF BOSTON, MASSACHUSETTS
Notes to Basic Financial Statements
June 30, 2008
39 (Continued)
The following reconciliation summarizes the differences between budgetary and GAAP basis accounting principles for the year ended June 30, 2008 (in thousands):
Excess ofOther revenue and
financing othersources financing
Revenue Expenditures (uses), net sources
As reported on a budgetary basis $ 2,343,109 2,327,262 — 15,847 Adjustments:
Revenues to modified accrualbasis 13,919 — — 13,919
Expenditures, encumbrances,and accruals, net — (37,814) 37,814
Reclassifications:State-funded teachers’
retirement costs (103,000) (105,420) — 2,420 Convention Center fund revenue (23,000) — 23,000 — Transfers (17,810) — 17,810 —
As reported on a GAAP basis $ 2,213,218 2,184,028 40,810 70,000
(5) Deposits and Investments
State and local statutes place certain limitations on the nature of deposits and investments available to the City. Deposits, including demand deposits, money markets and certificates of deposit in any one financial institution, may not exceed 60% of the capital and surplus of such institution unless collateralized by the financial institution involved. Investments may be made in unconditionally guaranteed U.S. Government obligations having maturities of a year or less from the date of purchase, or through repurchase agreements with maturities of no greater than 90 days in which the underlying securities consist of such obligations. Other allowable investments include authorized bonds of all states, bankers’ acceptances, commercial paper rated within the three highest classifications established by rating agencies, and units in the MMDT. The highest classifications for Moody’s, Standard & Poor’s (S&P) and Fitch are as follows:
Commercial paper credit ratingsMoody’s S&P Fitch
Superior P1 A1 + or A1 F1 + or +F1Satisfactory P2 A2 F2Adequate P3 A3 F3
The Treasurer of the Commonwealth of Massachusetts oversees the financial management of the MMDT, a local investment pool for cities, towns, and other state and local agencies within the Commonwealth. The City’s fair value of its investment in the MMDT represents their value of the pool’s shares.
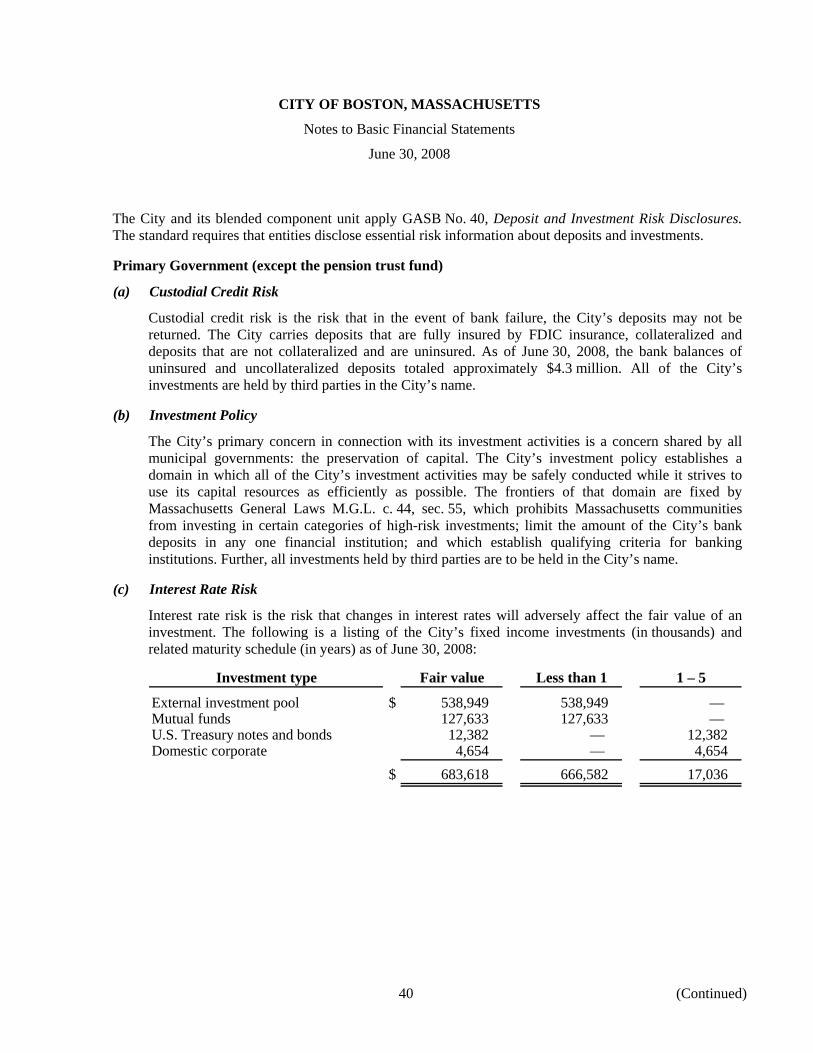
CITY OF BOSTON, MASSACHUSETTS
Notes to Basic Financial Statements
June 30, 2008
40 (Continued)
The City and its blended component unit apply GASB No. 40, Deposit and Investment Risk Disclosures. The standard requires that entities disclose essential risk information about deposits and investments.
Primary Government (except the pension trust fund)
(a) Custodial Credit Risk
Custodial credit risk is the risk that in the event of bank failure, the City’s deposits may not be returned. The City carries deposits that are fully insured by FDIC insurance, collateralized and deposits that are not collateralized and are uninsured. As of June 30, 2008, the bank balances of uninsured and uncollateralized deposits totaled approximately $4.3 million. All of the City’s investments are held by third parties in the City’s name.
(b) Investment Policy
The City’s primary concern in connection with its investment activities is a concern shared by all municipal governments: the preservation of capital. The City’s investment policy establishes a domain in which all of the City’s investment activities may be safely conducted while it strives to use its capital resources as efficiently as possible. The frontiers of that domain are fixed by Massachusetts General Laws M.G.L. c. 44, sec. 55, which prohibits Massachusetts communities from investing in certain categories of high-risk investments; limit the amount of the City’s bank deposits in any one financial institution; and which establish qualifying criteria for banking institutions. Further, all investments held by third parties are to be held in the City’s name.
(c) Interest Rate Risk
Interest rate risk is the risk that changes in interest rates will adversely affect the fair value of an investment. The following is a listing of the City’s fixed income investments (in thousands) and related maturity schedule (in years) as of June 30, 2008:
Investment type Fair value Less than 1 1 – 5
External investment pool $ 538,949 538,949 — Mutual funds 127,633 127,633 — U.S. Treasury notes and bonds 12,382 — 12,382 Domestic corporate 4,654 — 4,654
$ 683,618 666,582 17,036

CITY OF BOSTON, MASSACHUSETTS
Notes to Basic Financial Statements
June 30, 2008
41 (Continued)
(d) Credit Risk
The City’s fixed income investments as of June 30, 2008 were rated by Standard and Poor’s and/or an equivalent national rating organization and the ratings are presented below (in thousands) using the Standard and Poor’s rating scale:
Investment type Fair value Rating
External investment pool $ 538,949 Not ratedMutual funds 127,633 AAADomestic corporate 4,654 AAA to BBB+
$ 671,236
(e) Concentration Risk
The City adheres to the provisions of M.G.L. c. 44, sec. 55 when managing concentration risk. M.G.L. c. 44, sec. 55 contains several restrictions limiting where and under what circumstances the City may deposit its funds. Pursuant to M.G.L. c. 44, sec. 55, cities and towns in the Commonwealth may deposit available fund balances in banks, trust companies, or banking companies, provided that the amounts deposited do not exceed 60% of the capital and surplus of an institution unless satisfactory security for the amount in excess of 60% is provided by the depository.
State-Boston Retirement System (SBRS or the System)
(a) Custodial Credit Risk
Custodial credit risk is the risk that in the event of bank failure, the System’s deposits may not be returned. The System carries deposits that are fully insured by FDIC insurance or collateralized with securities held by the System or the System’s agent in the System’s name. The System also carries deposits that are not collateralized and are uninsured. As of December 31, 2007, all of the System’s deposits were insured or collateralized.
(b) Investment Policy
The provisions of M.G.L. c. 32, sec 23(2) govern the System’s investment practice.
Diversification is attained through varied investment management styles that comply with Massachusetts state law. This is accomplished through the retention of investment managers that adhere to M.G.L. c. 32, sec. 23(3), the “Prudent Person” rule.
The System has retained an investment consultant to work with the Retirement Board in a fiduciary capacity to assure that strategic investment diversification is attained, to employ investment managers with expertise in their respective asset classes, and to closely monitor the implementation and performance of the respective investment strategies.
The System is currently invested in stocks (domestic and foreign), fixed income securities (domestic and foreign), real estate, private equity, and hedge funds.
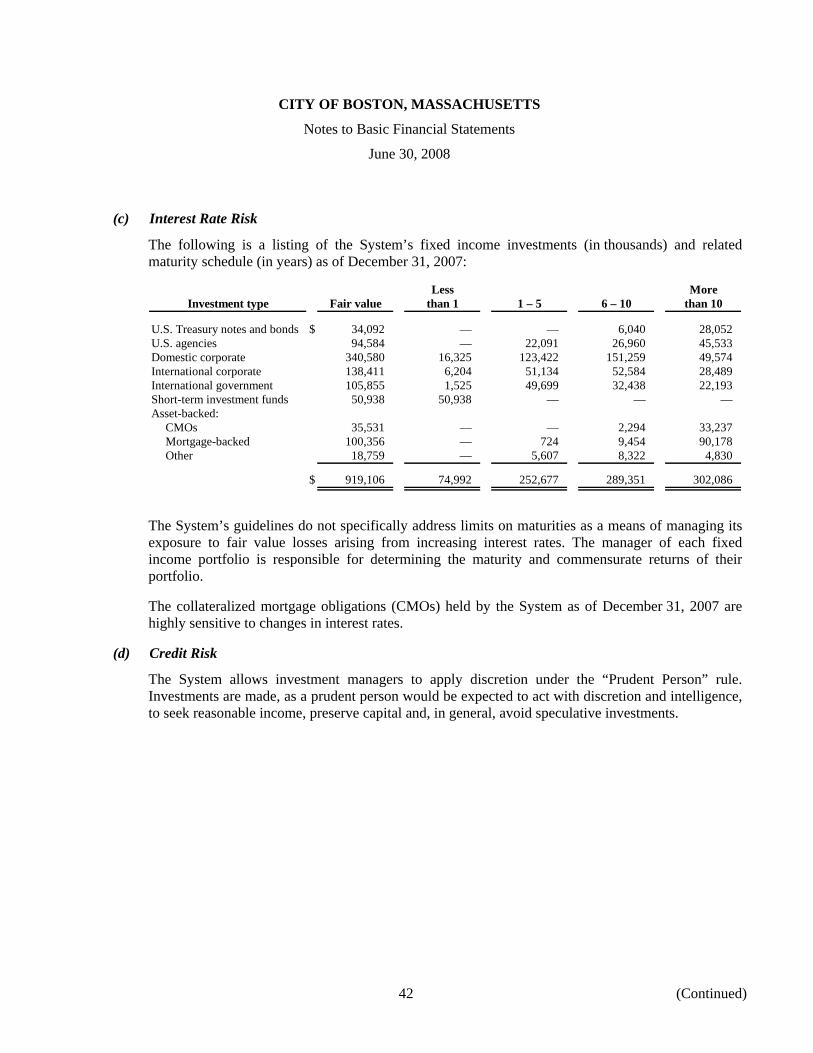
CITY OF BOSTON, MASSACHUSETTS
Notes to Basic Financial Statements
June 30, 2008
42 (Continued)
(c) Interest Rate Risk
The following is a listing of the System’s fixed income investments (in thousands) and related maturity schedule (in years) as of December 31, 2007:
Less MoreInvestment type Fair value than 1 1 – 5 6 – 10 than 10
U.S. Treasury notes and bonds $ 34,092 — — 6,040 28,052 U.S. agencies 94,584 — 22,091 26,960 45,533 Domestic corporate 340,580 16,325 123,422 151,259 49,574 International corporate 138,411 6,204 51,134 52,584 28,489 International government 105,855 1,525 49,699 32,438 22,193 Short-term investment funds 50,938 50,938 — — — Asset-backed:
CMOs 35,531 — — 2,294 33,237 Mortgage-backed 100,356 — 724 9,454 90,178 Other 18,759 — 5,607 8,322 4,830
$ 919,106 74,992 252,677 289,351 302,086
The System’s guidelines do not specifically address limits on maturities as a means of managing its exposure to fair value losses arising from increasing interest rates. The manager of each fixed income portfolio is responsible for determining the maturity and commensurate returns of their portfolio.
The collateralized mortgage obligations (CMOs) held by the System as of December 31, 2007 are highly sensitive to changes in interest rates.
(d) Credit Risk
The System allows investment managers to apply discretion under the “Prudent Person” rule. Investments are made, as a prudent person would be expected to act with discretion and intelligence, to seek reasonable income, preserve capital and, in general, avoid speculative investments.
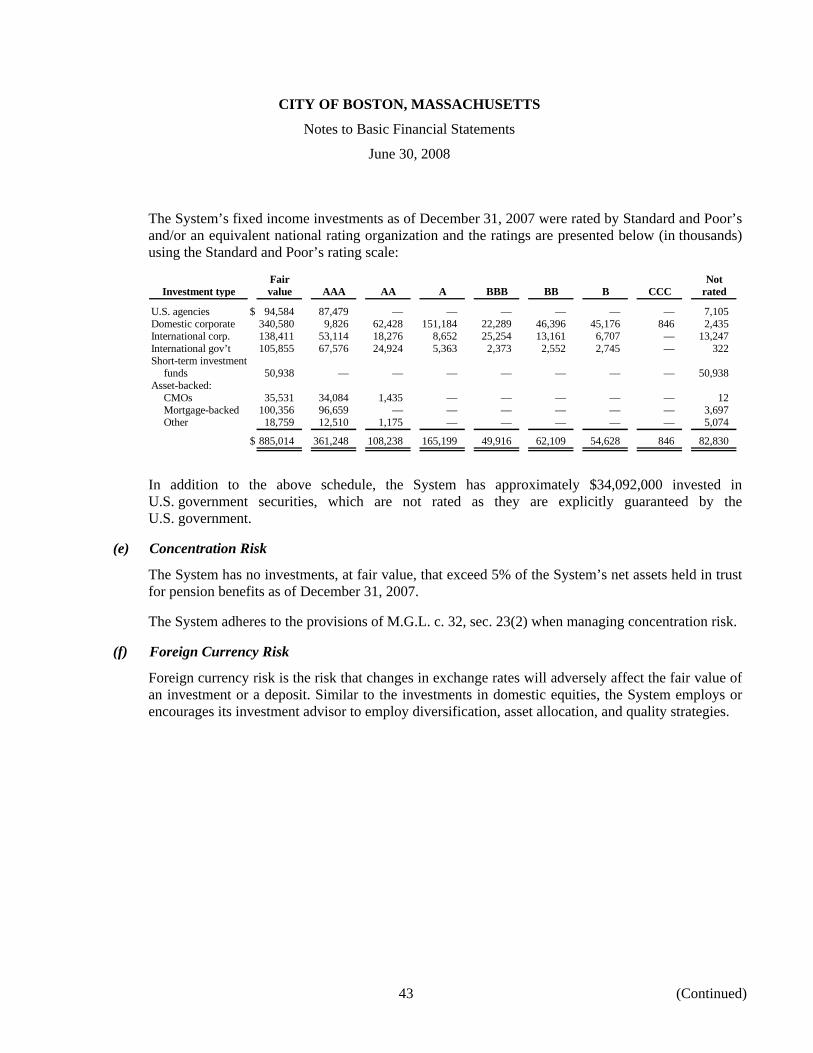
CITY OF BOSTON, MASSACHUSETTS
Notes to Basic Financial Statements
June 30, 2008
43 (Continued)
The System’s fixed income investments as of December 31, 2007 were rated by Standard and Poor’s and/or an equivalent national rating organization and the ratings are presented below (in thousands) using the Standard and Poor’s rating scale:
Fair NotInvestment type value AAA AA A BBB BB B CCC rated
U.S. agencies $ 94,584 87,479 — — — — — — 7,105 Domestic corporate 340,580 9,826 62,428 151,184 22,289 46,396 45,176 846 2,435 International corp. 138,411 53,114 18,276 8,652 25,254 13,161 6,707 — 13,247 International gov’t 105,855 67,576 24,924 5,363 2,373 2,552 2,745 — 322 Short-term investment
funds 50,938 — — — — — — — 50,938 Asset-backed:
CMOs 35,531 34,084 1,435 — — — — — 12 Mortgage-backed 100,356 96,659 — — — — — — 3,697 Other 18,759 12,510 1,175 — — — — — 5,074
$ 885,014 361,248 108,238 165,199 49,916 62,109 54,628 846 82,830
In addition to the above schedule, the System has approximately $34,092,000 invested in U.S. government securities, which are not rated as they are explicitly guaranteed by the U.S. government.
(e) Concentration Risk
The System has no investments, at fair value, that exceed 5% of the System’s net assets held in trust for pension benefits as of December 31, 2007.
The System adheres to the provisions of M.G.L. c. 32, sec. 23(2) when managing concentration risk.
(f) Foreign Currency Risk
Foreign currency risk is the risk that changes in exchange rates will adversely affect the fair value of an investment or a deposit. Similar to the investments in domestic equities, the System employs or encourages its investment advisor to employ diversification, asset allocation, and quality strategies.
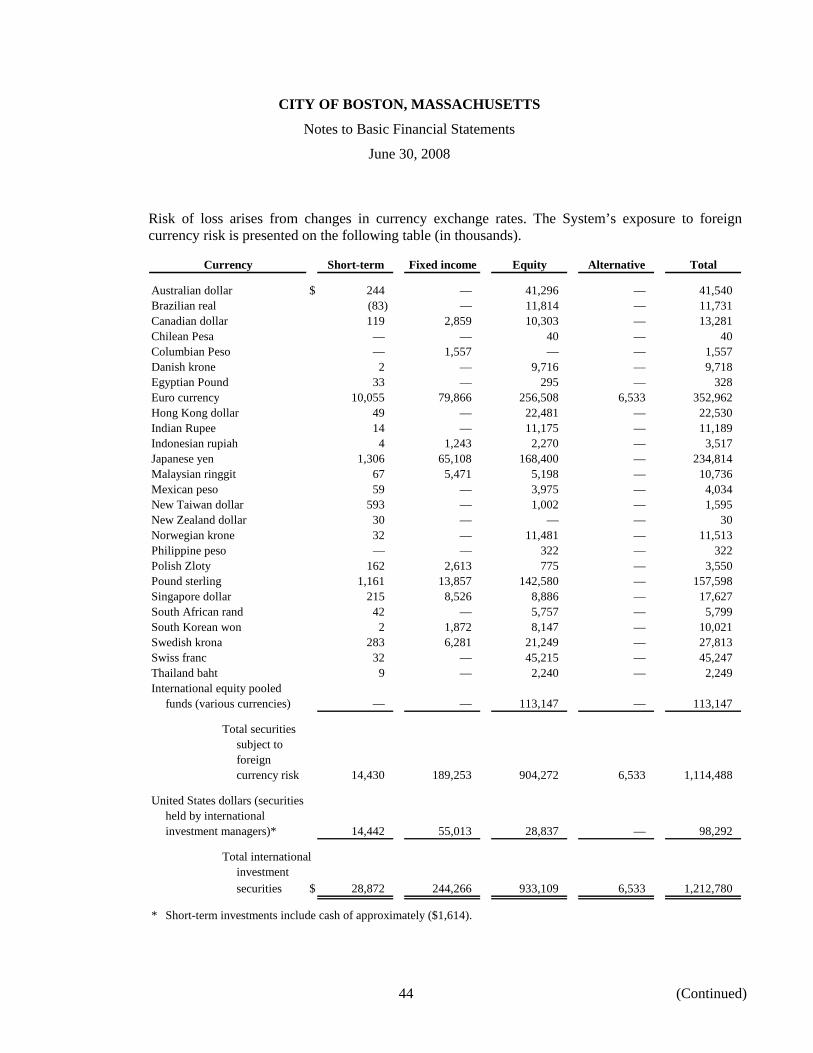
CITY OF BOSTON, MASSACHUSETTS
Notes to Basic Financial Statements
June 30, 2008
44 (Continued)
Risk of loss arises from changes in currency exchange rates. The System’s exposure to foreign currency risk is presented on the following table (in thousands).
Currency Short-term Fixed income Equity Alternative Total
Australian dollar $ 244 — 41,296 — 41,540 Brazilian real (83) — 11,814 — 11,731 Canadian dollar 119 2,859 10,303 — 13,281 Chilean Pesa — — 40 — 40 Columbian Peso — 1,557 — — 1,557 Danish krone 2 — 9,716 — 9,718 Egyptian Pound 33 — 295 — 328 Euro currency 10,055 79,866 256,508 6,533 352,962 Hong Kong dollar 49 — 22,481 — 22,530 Indian Rupee 14 — 11,175 — 11,189 Indonesian rupiah 4 1,243 2,270 — 3,517 Japanese yen 1,306 65,108 168,400 — 234,814 Malaysian ringgit 67 5,471 5,198 — 10,736 Mexican peso 59 — 3,975 — 4,034 New Taiwan dollar 593 — 1,002 — 1,595 New Zealand dollar 30 — — — 30 Norwegian krone 32 — 11,481 — 11,513 Philippine peso — — 322 — 322 Polish Zloty 162 2,613 775 — 3,550 Pound sterling 1,161 13,857 142,580 — 157,598 Singapore dollar 215 8,526 8,886 — 17,627 South African rand 42 — 5,757 — 5,799 South Korean won 2 1,872 8,147 — 10,021 Swedish krona 283 6,281 21,249 — 27,813 Swiss franc 32 — 45,215 — 45,247 Thailand baht 9 — 2,240 — 2,249 International equity pooled
funds (various currencies) — — 113,147 — 113,147
Total securitiessubject toforeigncurrency risk 14,430 189,253 904,272 6,533 1,114,488
United States dollars (securitiesheld by internationalinvestment managers)* 14,442 55,013 28,837 — 98,292
Total internationalinvestmentsecurities $ 28,872 244,266 933,109 6,533 1,212,780
* Short-term investments include cash of approximately ($1,614).
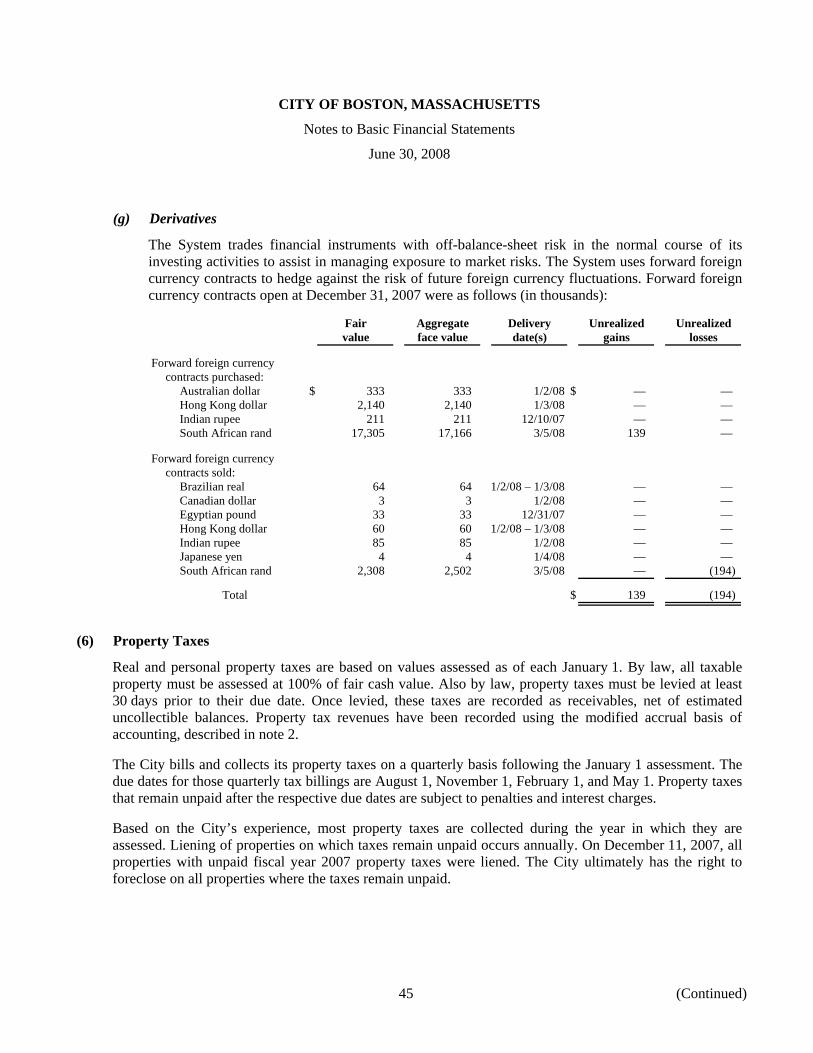
CITY OF BOSTON, MASSACHUSETTS
Notes to Basic Financial Statements
June 30, 2008
45 (Continued)
(g) Derivatives
The System trades financial instruments with off-balance-sheet risk in the normal course of its investing activities to assist in managing exposure to market risks. The System uses forward foreign currency contracts to hedge against the risk of future foreign currency fluctuations. Forward foreign currency contracts open at December 31, 2007 were as follows (in thousands):
Fair Aggregate Delivery Unrealized Unrealizedvalue face value date(s) gains losses
Forward foreign currencycontracts purchased:
Australian dollar $ 333 333 1/2/08 $ — — Hong Kong dollar 2,140 2,140 1/3/08 — — Indian rupee 211 211 12/10/07 — — South African rand 17,305 17,166 3/5/08 139 —
Forward foreign currencycontracts sold:
Brazilian real 64 64 1/2/08 – 1/3/08 — — Canadian dollar 3 3 1/2/08 — — Egyptian pound 33 33 12/31/07 — — Hong Kong dollar 60 60 1/2/08 – 1/3/08 — — Indian rupee 85 85 1/2/08 — — Japanese yen 4 4 1/4/08 — — South African rand 2,308 2,502 3/5/08 — (194)
Total $ 139 (194)
(6) Property Taxes
Real and personal property taxes are based on values assessed as of each January 1. By law, all taxable property must be assessed at 100% of fair cash value. Also by law, property taxes must be levied at least 30 days prior to their due date. Once levied, these taxes are recorded as receivables, net of estimated uncollectible balances. Property tax revenues have been recorded using the modified accrual basis of accounting, described in note 2.
The City bills and collects its property taxes on a quarterly basis following the January 1 assessment. The due dates for those quarterly tax billings are August 1, November 1, February 1, and May 1. Property taxes that remain unpaid after the respective due dates are subject to penalties and interest charges.
Based on the City’s experience, most property taxes are collected during the year in which they are assessed. Liening of properties on which taxes remain unpaid occurs annually. On December 11, 2007, all properties with unpaid fiscal year 2007 property taxes were liened. The City ultimately has the right to foreclose on all properties where the taxes remain unpaid.
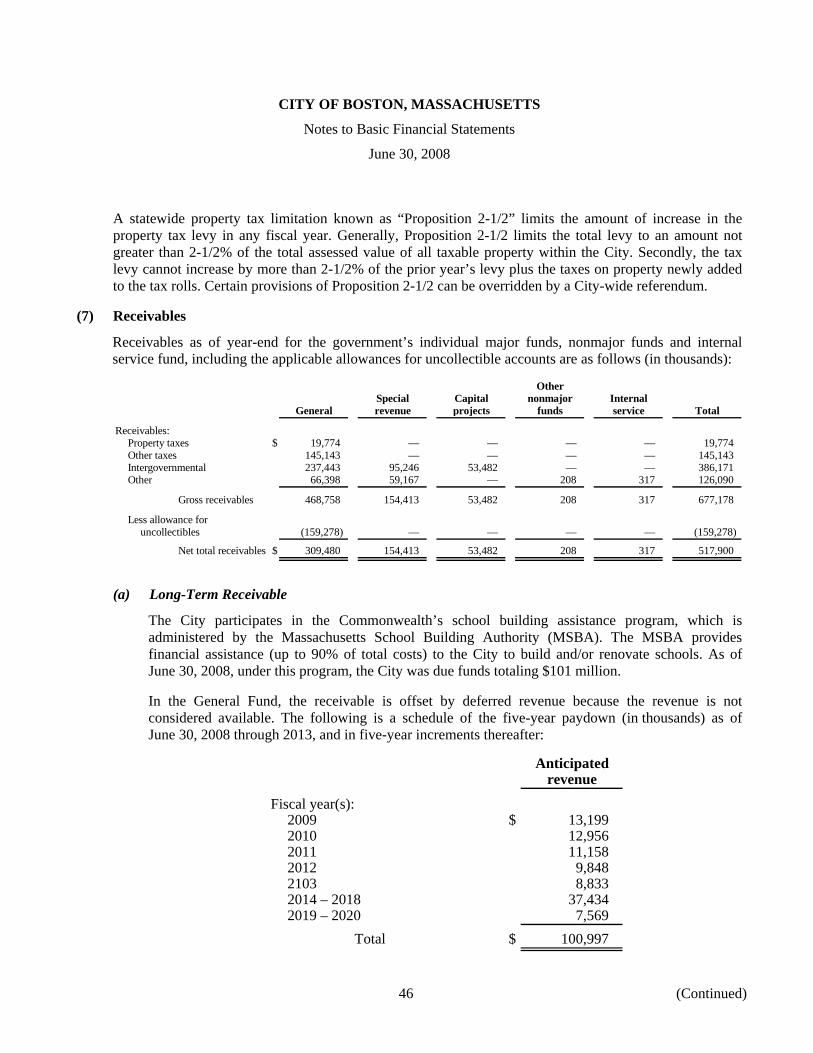
CITY OF BOSTON, MASSACHUSETTS
Notes to Basic Financial Statements
June 30, 2008
46 (Continued)
A statewide property tax limitation known as “Proposition 2-1/2” limits the amount of increase in the property tax levy in any fiscal year. Generally, Proposition 2-1/2 limits the total levy to an amount not greater than 2-1/2% of the total assessed value of all taxable property within the City. Secondly, the tax levy cannot increase by more than 2-1/2% of the prior year’s levy plus the taxes on property newly added to the tax rolls. Certain provisions of Proposition 2-1/2 can be overridden by a City-wide referendum.
(7) Receivables
Receivables as of year-end for the government’s individual major funds, nonmajor funds and internal service fund, including the applicable allowances for uncollectible accounts are as follows (in thousands):
OtherSpecial Capital nonmajor Internal
General revenue projects funds service Total
Receivables:Property taxes $ 19,774 — — — — 19,774 Other taxes 145,143 — — — — 145,143 Intergovernmental 237,443 95,246 53,482 — — 386,171 Other 66,398 59,167 — 208 317 126,090
Gross receivables 468,758 154,413 53,482 208 317 677,178
Less allowance foruncollectibles (159,278) — — — — (159,278)
Net total receivables $ 309,480 154,413 53,482 208 317 517,900
(a) Long-Term Receivable
The City participates in the Commonwealth’s school building assistance program, which is administered by the Massachusetts School Building Authority (MSBA). The MSBA provides financial assistance (up to 90% of total costs) to the City to build and/or renovate schools. As of June 30, 2008, under this program, the City was due funds totaling $101 million.
In the General Fund, the receivable is offset by deferred revenue because the revenue is not considered available. The following is a schedule of the five-year paydown (in thousands) as of June 30, 2008 through 2013, and in five-year increments thereafter:
Anticipatedrevenue
Fiscal year(s):2009 $ 13,199 2010 12,956 2011 11,158 2012 9,848 2103 8,833 2014 – 2018 37,434 2019 – 2020 7,569
Total $ 100,997
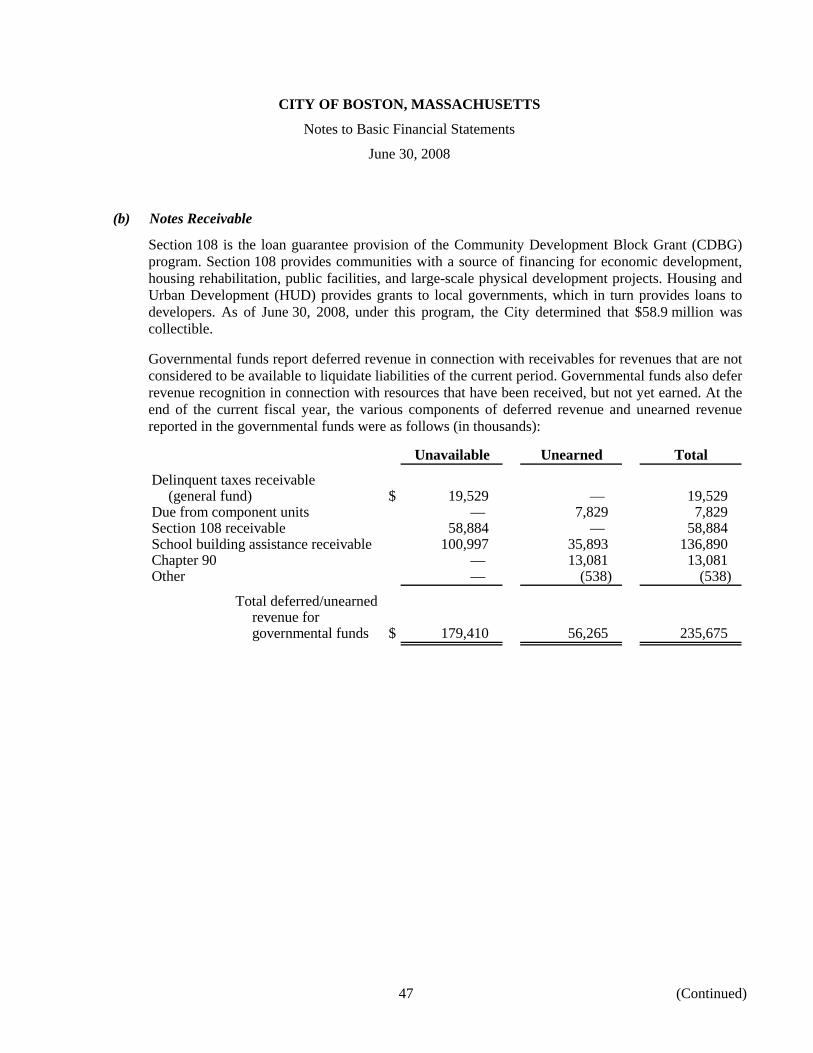
CITY OF BOSTON, MASSACHUSETTS
Notes to Basic Financial Statements
June 30, 2008
47 (Continued)
(b) Notes Receivable
Section 108 is the loan guarantee provision of the Community Development Block Grant (CDBG) program. Section 108 provides communities with a source of financing for economic development, housing rehabilitation, public facilities, and large-scale physical development projects. Housing and Urban Development (HUD) provides grants to local governments, which in turn provides loans to developers. As of June 30, 2008, under this program, the City determined that $58.9 million was collectible.
Governmental funds report deferred revenue in connection with receivables for revenues that are not considered to be available to liquidate liabilities of the current period. Governmental funds also defer revenue recognition in connection with resources that have been received, but not yet earned. At the end of the current fiscal year, the various components of deferred revenue and unearned revenue reported in the governmental funds were as follows (in thousands):
Unavailable Unearned Total
Delinquent taxes receivable(general fund) $ 19,529 — 19,529
Due from component units — 7,829 7,829 Section 108 receivable 58,884 — 58,884 School building assistance receivable 100,997 35,893 136,890 Chapter 90 — 13,081 13,081 Other — (538) (538)
Total deferred/unearnedrevenue forgovernmental funds $ 179,410 56,265 235,675
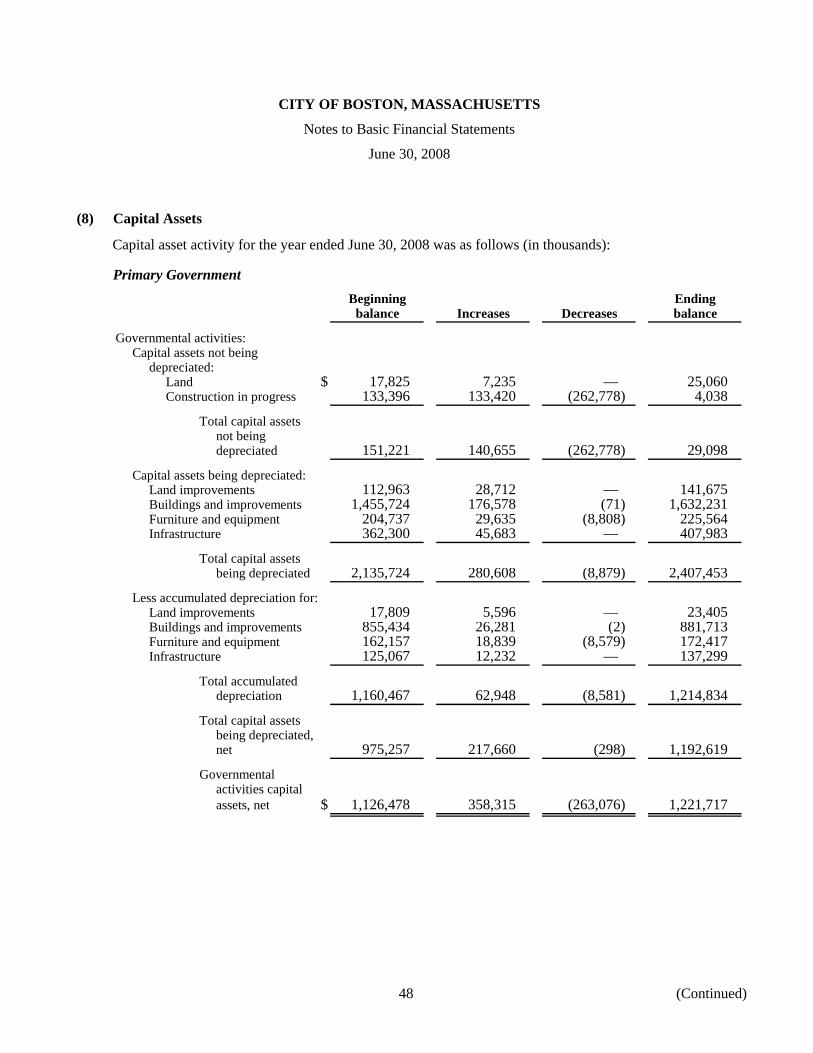
CITY OF BOSTON, MASSACHUSETTS
Notes to Basic Financial Statements
June 30, 2008
48 (Continued)
(8) Capital Assets
Capital asset activity for the year ended June 30, 2008 was as follows (in thousands):
Primary Government Beginning Ending
balance Increases Decreases balance
Governmental activities:Capital assets not being
depreciated:Land $ 17,825 7,235 — 25,060 Construction in progress 133,396 133,420 (262,778) 4,038
Total capital assetsnot beingdepreciated 151,221 140,655 (262,778) 29,098
Capital assets being depreciated:Land improvements 112,963 28,712 — 141,675 Buildings and improvements 1,455,724 176,578 (71) 1,632,231 Furniture and equipment 204,737 29,635 (8,808) 225,564 Infrastructure 362,300 45,683 — 407,983
Total capital assetsbeing depreciated 2,135,724 280,608 (8,879) 2,407,453
Less accumulated depreciation for:Land improvements 17,809 5,596 — 23,405 Buildings and improvements 855,434 26,281 (2) 881,713 Furniture and equipment 162,157 18,839 (8,579) 172,417 Infrastructure 125,067 12,232 — 137,299
Total accumulateddepreciation 1,160,467 62,948 (8,581) 1,214,834
Total capital assetsbeing depreciated,net 975,257 217,660 (298) 1,192,619
Governmentalactivities capitalassets, net $ 1,126,478 358,315 (263,076) 1,221,717
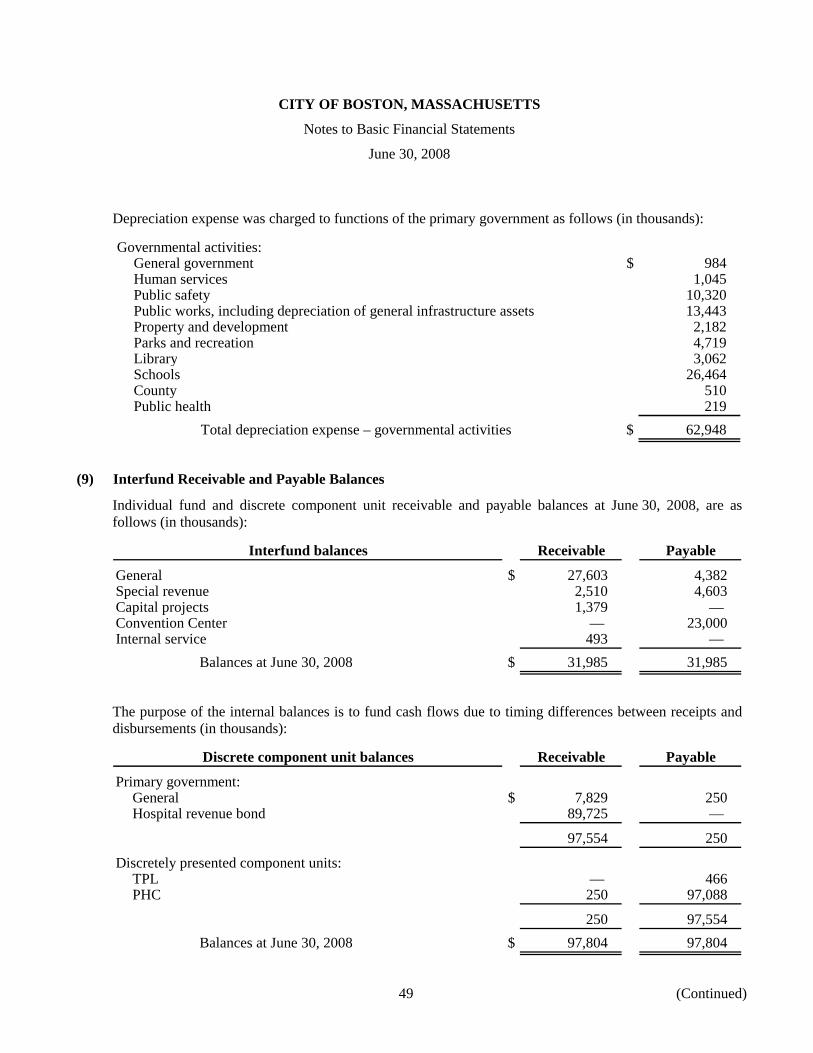
CITY OF BOSTON, MASSACHUSETTS
Notes to Basic Financial Statements
June 30, 2008
49 (Continued)
Depreciation expense was charged to functions of the primary government as follows (in thousands):
Governmental activities:General government $ 984 Human services 1,045 Public safety 10,320 Public works, including depreciation of general infrastructure assets 13,443 Property and development 2,182 Parks and recreation 4,719 Library 3,062 Schools 26,464 County 510 Public health 219
Total depreciation expense – governmental activities $ 62,948
(9) Interfund Receivable and Payable Balances
Individual fund and discrete component unit receivable and payable balances at June 30, 2008, are as follows (in thousands):
Interfund balances Receivable Payable
General $ 27,603 4,382 Special revenue 2,510 4,603 Capital projects 1,379 — Convention Center — 23,000 Internal service 493 —
Balances at June 30, 2008 $ 31,985 31,985
The purpose of the internal balances is to fund cash flows due to timing differences between receipts and disbursements (in thousands):
Discrete component unit balances Receivable Payable
Primary government:General $ 7,829 250 Hospital revenue bond 89,725 —
97,554 250
Discretely presented component units:TPL — 466 PHC 250 97,088
250 97,554 Balances at June 30, 2008 $ 97,804 97,804
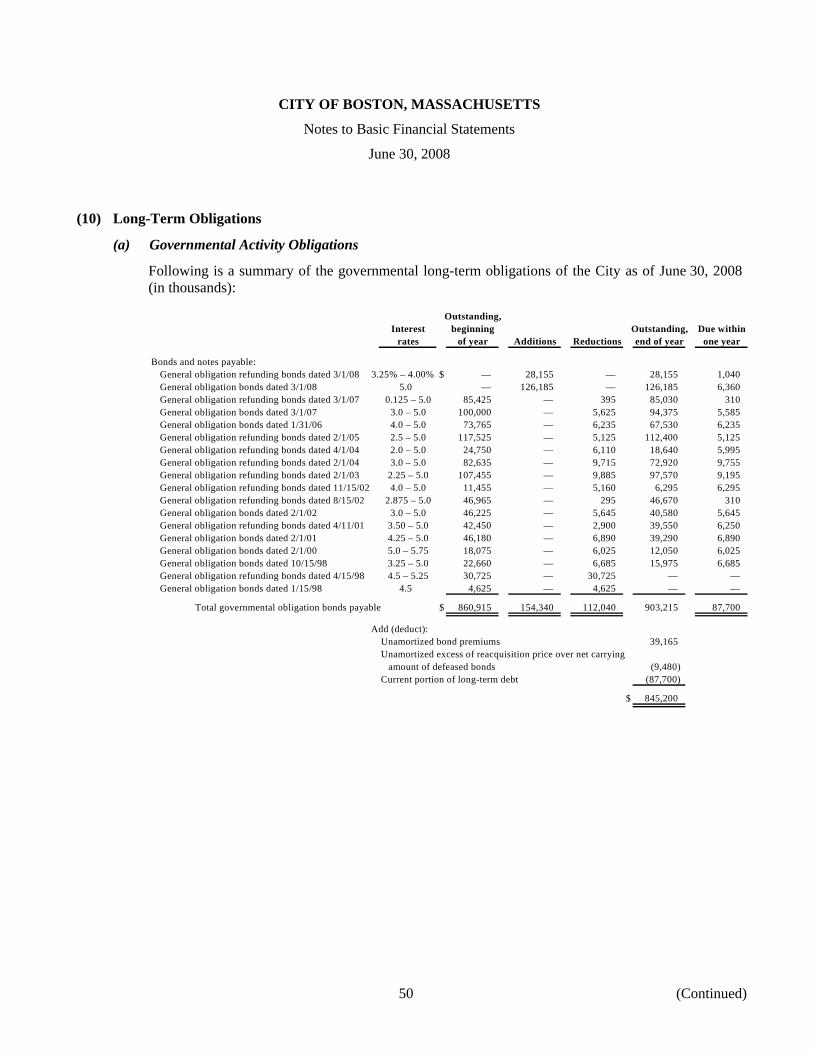
CITY OF BOSTON, MASSACHUSETTS
Notes to Basic Financial Statements
June 30, 2008
50 (Continued)
(10) Long-Term Obligations
(a) Governmental Activity Obligations
Following is a summary of the governmental long-term obligations of the City as of June 30, 2008 (in thousands):
Outstanding,Interest beginning Outstanding, Due within
rates of year Additions Reductions end of year one year
Bonds and notes payable:General obligation refunding bonds dated 3/1/08 3.25% – 4.00% $ — 28,155 — 28,155 1,040 General obligation bonds dated 3/1/08 5.0 — 126,185 — 126,185 6,360 General obligation refunding bonds dated 3/1/07 0.125 – 5.0 85,425 — 395 85,030 310 General obligation bonds dated 3/1/07 3.0 – 5.0 100,000 — 5,625 94,375 5,585 General obligation bonds dated 1/31/06 4.0 – 5.0 73,765 — 6,235 67,530 6,235 General obligation refunding bonds dated 2/1/05 2.5 – 5.0 117,525 — 5,125 112,400 5,125 General obligation refunding bonds dated 4/1/04 2.0 – 5.0 24,750 — 6,110 18,640 5,995 General obligation refunding bonds dated 2/1/04 3.0 – 5.0 82,635 — 9,715 72,920 9,755 General obligation refunding bonds dated 2/1/03 2.25 – 5.0 107,455 — 9,885 97,570 9,195 General obligation refunding bonds dated 11/15/02 4.0 – 5.0 11,455 — 5,160 6,295 6,295 General obligation refunding bonds dated 8/15/02 2.875 – 5.0 46,965 — 295 46,670 310 General obligation bonds dated 2/1/02 3.0 – 5.0 46,225 — 5,645 40,580 5,645 General obligation refunding bonds dated 4/11/01 3.50 – 5.0 42,450 — 2,900 39,550 6,250 General obligation bonds dated 2/1/01 4.25 – 5.0 46,180 — 6,890 39,290 6,890 General obligation bonds dated 2/1/00 5.0 – 5.75 18,075 — 6,025 12,050 6,025 General obligation bonds dated 10/15/98 3.25 – 5.0 22,660 — 6,685 15,975 6,685 General obligation refunding bonds dated 4/15/98 4.5 – 5.25 30,725 — 30,725 — — General obligation bonds dated 1/15/98 4.5 4,625 — 4,625 — —
Total governmental obligation bonds payable $ 860,915 154,340 112,040 903,215 87,700
Add (deduct):Unamortized bond premiums 39,165 Unamortized excess of reacquisition price over net carrying amount of defeased bonds (9,480) Current portion of long-term debt (87,700)
$ 845,200
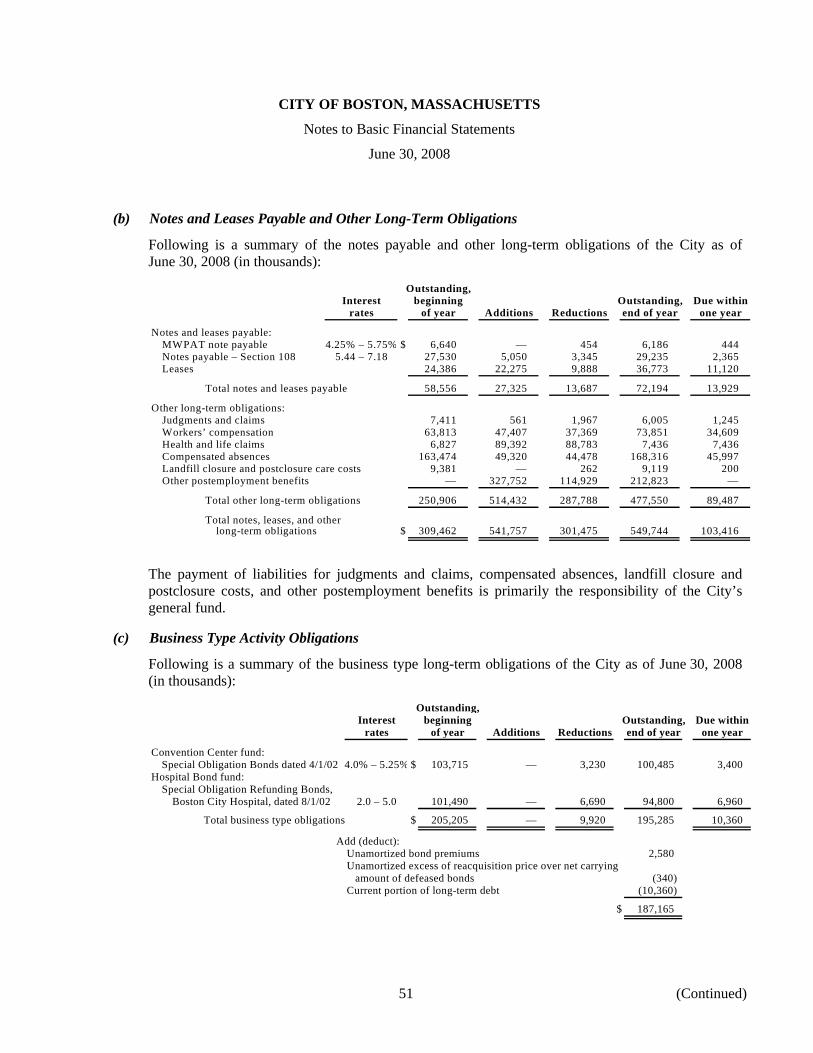
CITY OF BOSTON, MASSACHUSETTS
Notes to Basic Financial Statements
June 30, 2008
51 (Continued)
(b) Notes and Leases Payable and Other Long-Term Obligations
Following is a summary of the notes payable and other long-term obligations of the City as of June 30, 2008 (in thousands):
Outstanding,Interest beginning Outstanding, Due within
rates of year Additions Reductions end of year one year
Notes and leases payable:MWPAT note payable 4.25% – 5.75% $ 6,640 — 454 6,186 444 Notes payable – Section 108 5.44 – 7.18 27,530 5,050 3,345 29,235 2,365 Leases 24,386 22,275 9,888 36,773 11,120
Total notes and leases payable 58,556 27,325 13,687 72,194 13,929
Other long-term obligations:Judgments and claims 7,411 561 1,967 6,005 1,245 Workers’ compensation 63,813 47,407 37,369 73,851 34,609 Health and life claims 6,827 89,392 88,783 7,436 7,436 Compensated absences 163,474 49,320 44,478 168,316 45,997 Landfill closure and postclosure care costs 9,381 — 262 9,119 200 Other postemployment benefits — 327,752 114,929 212,823 —
Total other long-term obligations 250,906 514,432 287,788 477,550 89,487
Total notes, leases, and other long-term obligations $ 309,462 541,757 301,475 549,744 103,416
The payment of liabilities for judgments and claims, compensated absences, landfill closure and postclosure costs, and other postemployment benefits is primarily the responsibility of the City’s general fund.
(c) Business Type Activity Obligations
Following is a summary of the business type long-term obligations of the City as of June 30, 2008 (in thousands):
Outstanding,Interest beginning Outstanding, Due within
rates of year Additions Reductions end of year one year
Convention Center fund:Special Obligation Bonds dated 4/1/02 4.0% – 5.25% $ 103,715 — 3,230 100,485 3,400
Hospital Bond fund:Special Obligation Refunding Bonds,
Boston City Hospital, dated 8/1/02 2.0 – 5.0 101,490 — 6,690 94,800 6,960
Total business type obligations $ 205,205 — 9,920 195,285 10,360
Add (deduct):Unamortized bond premiums 2,580 Unamortized excess of reacquisition price over net carrying amount of defeased bonds (340)
Current portion of long-term debt (10,360)
$ 187,165
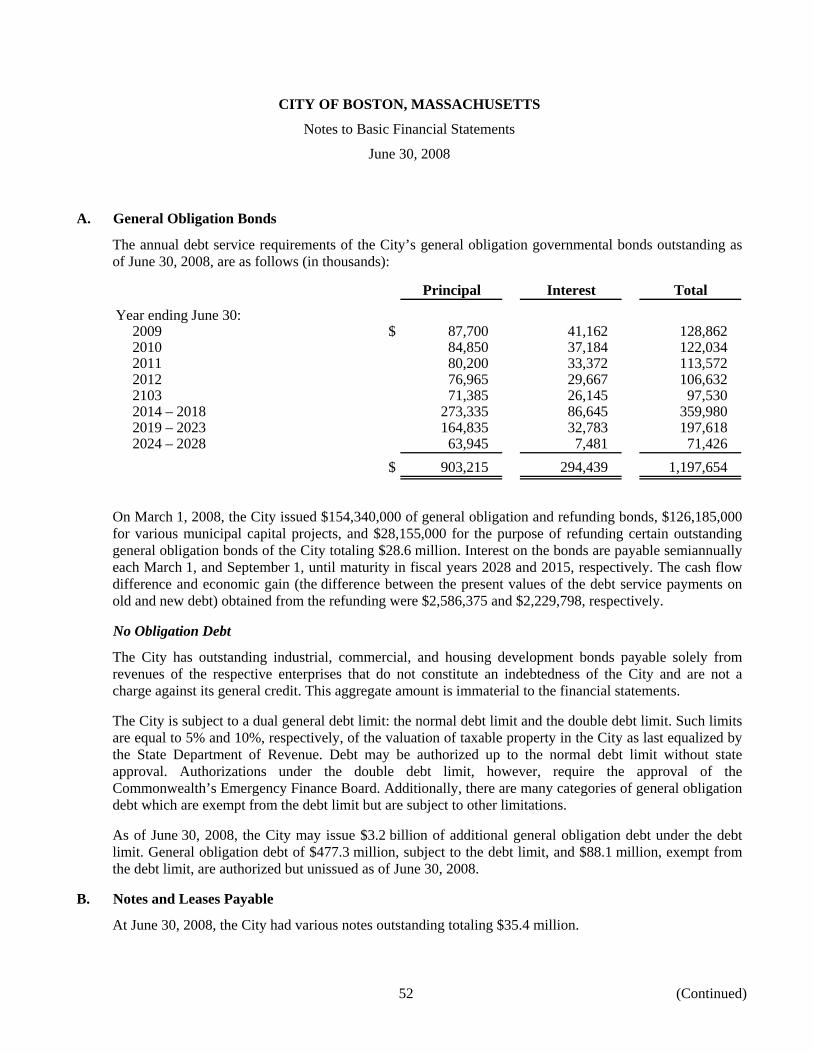
CITY OF BOSTON, MASSACHUSETTS
Notes to Basic Financial Statements
June 30, 2008
52 (Continued)
A. General Obligation Bonds
The annual debt service requirements of the City’s general obligation governmental bonds outstanding as of June 30, 2008, are as follows (in thousands):
Principal Interest Total
Year ending June 30:2009 $ 87,700 41,162 128,862 2010 84,850 37,184 122,034 2011 80,200 33,372 113,572 2012 76,965 29,667 106,632 2103 71,385 26,145 97,530 2014 – 2018 273,335 86,645 359,980 2019 – 2023 164,835 32,783 197,618 2024 – 2028 63,945 7,481 71,426
$ 903,215 294,439 1,197,654
On March 1, 2008, the City issued $154,340,000 of general obligation and refunding bonds, $126,185,000 for various municipal capital projects, and $28,155,000 for the purpose of refunding certain outstanding general obligation bonds of the City totaling $28.6 million. Interest on the bonds are payable semiannually each March 1, and September 1, until maturity in fiscal years 2028 and 2015, respectively. The cash flow difference and economic gain (the difference between the present values of the debt service payments on old and new debt) obtained from the refunding were $2,586,375 and $2,229,798, respectively.
No Obligation Debt
The City has outstanding industrial, commercial, and housing development bonds payable solely from revenues of the respective enterprises that do not constitute an indebtedness of the City and are not a charge against its general credit. This aggregate amount is immaterial to the financial statements.
The City is subject to a dual general debt limit: the normal debt limit and the double debt limit. Such limits are equal to 5% and 10%, respectively, of the valuation of taxable property in the City as last equalized by the State Department of Revenue. Debt may be authorized up to the normal debt limit without state approval. Authorizations under the double debt limit, however, require the approval of the Commonwealth’s Emergency Finance Board. Additionally, there are many categories of general obligation debt which are exempt from the debt limit but are subject to other limitations.
As of June 30, 2008, the City may issue $3.2 billion of additional general obligation debt under the debt limit. General obligation debt of $477.3 million, subject to the debt limit, and $88.1 million, exempt from the debt limit, are authorized but unissued as of June 30, 2008.
B. Notes and Leases Payable
At June 30, 2008, the City had various notes outstanding totaling $35.4 million.
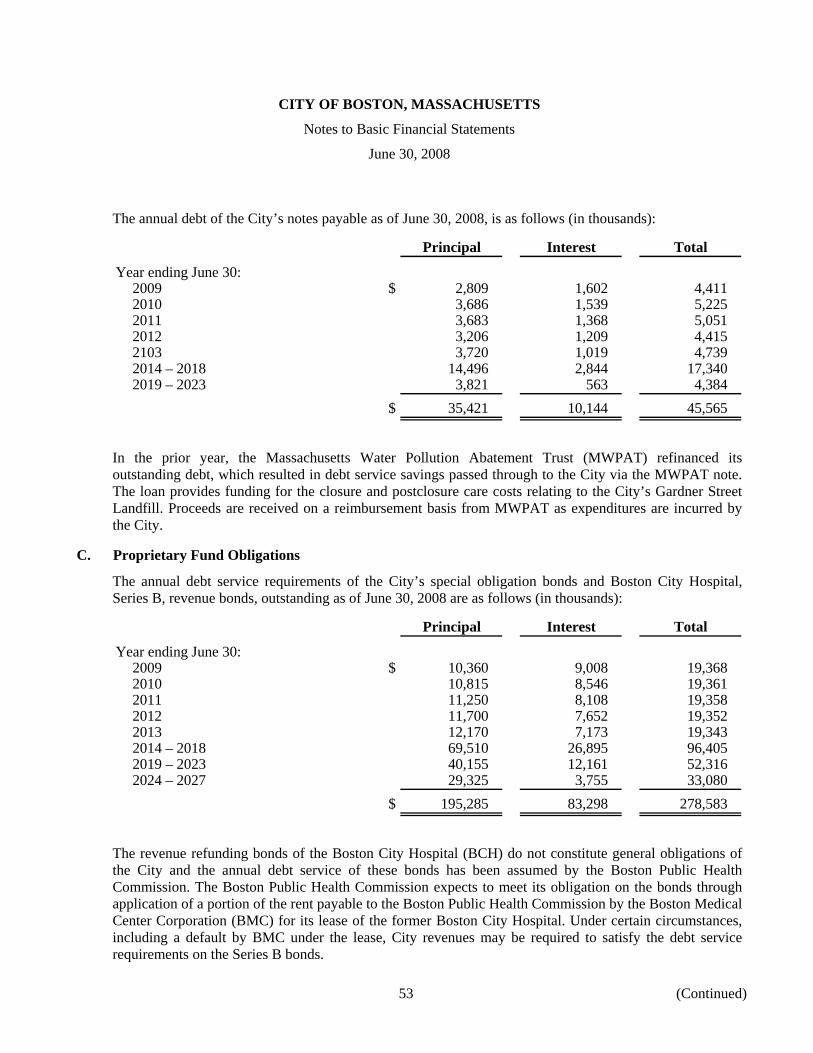
CITY OF BOSTON, MASSACHUSETTS
Notes to Basic Financial Statements
June 30, 2008
53 (Continued)
The annual debt of the City’s notes payable as of June 30, 2008, is as follows (in thousands):
Principal Interest Total
Year ending June 30:2009 $ 2,809 1,602 4,411 2010 3,686 1,539 5,225 2011 3,683 1,368 5,051 2012 3,206 1,209 4,415 2103 3,720 1,019 4,739 2014 – 2018 14,496 2,844 17,340 2019 – 2023 3,821 563 4,384
$ 35,421 10,144 45,565
In the prior year, the Massachusetts Water Pollution Abatement Trust (MWPAT) refinanced its outstanding debt, which resulted in debt service savings passed through to the City via the MWPAT note. The loan provides funding for the closure and postclosure care costs relating to the City’s Gardner Street Landfill. Proceeds are received on a reimbursement basis from MWPAT as expenditures are incurred by the City.
C. Proprietary Fund Obligations
The annual debt service requirements of the City’s special obligation bonds and Boston City Hospital, Series B, revenue bonds, outstanding as of June 30, 2008 are as follows (in thousands):
Principal Interest Total
Year ending June 30:2009 $ 10,360 9,008 19,368 2010 10,815 8,546 19,361 2011 11,250 8,108 19,358 2012 11,700 7,652 19,352 2013 12,170 7,173 19,343 2014 – 2018 69,510 26,895 96,405 2019 – 2023 40,155 12,161 52,316 2024 – 2027 29,325 3,755 33,080
$ 195,285 83,298 278,583
The revenue refunding bonds of the Boston City Hospital (BCH) do not constitute general obligations of the City and the annual debt service of these bonds has been assumed by the Boston Public Health Commission. The Boston Public Health Commission expects to meet its obligation on the bonds through application of a portion of the rent payable to the Boston Public Health Commission by the Boston Medical Center Corporation (BMC) for its lease of the former Boston City Hospital. Under certain circumstances, including a default by BMC under the lease, City revenues may be required to satisfy the debt service requirements on the Series B bonds.
CITY OF BOSTON, MASSACHUSETTS
Notes to Basic Financial Statements
June 30, 2008
54 (Continued)
The Boston Public Health Commission has assumed responsibility for paying to the City, an amount equal to current debt service on all outstanding general obligation bonds of the City issued for public health and hospital purposes, which amounted to $7.0 million at June 30, 2008.
Defeased Debt
The following transactions met the requirements of an in-substance defeasance:
• On April 11, 2001, the City issued $52.0 million in general obligation refunding bonds to advance refund $49.9 million of 1991, 1994, and 1995 Series Bonds.
• In August 2002, $127.8 million of bonds were issued to refund the Boston City Hospital, Series B Bonds dated June 1, 1993.
• On November 15, 2002, the City issued $43.1 million of general obligation refunding bonds for the purpose of refunding $45.1 million of outstanding general obligation bonds of the City, 2002 Series C.
• In February 2004, the City issued $35.9 million of general obligation refunding bonds to advance refund $37.7 million of 1994, 1995, 1996, and 1998 Series Bonds.
• In February 2005, the City issued $52.8 of general obligation refunding bonds to advance refund $56.9 million of 1996, 1998, and 2000 Series Bonds.
• In March 2007, the City issued $85.4 million of general obligation refunding bonds to advance refund $81.4 million of 1998A, 1998C, 2001A, 2002A, and 2003A Series Bonds.
• In March 2008, the City issued $28.2 million of general obligation refunding bonds to advance refund $28.6 million of 1998B Series Bonds.
The principal amount of debt refunded through in-substance defeasance transactions and still outstanding at June 30, 2008 was approximately $148.3 million.
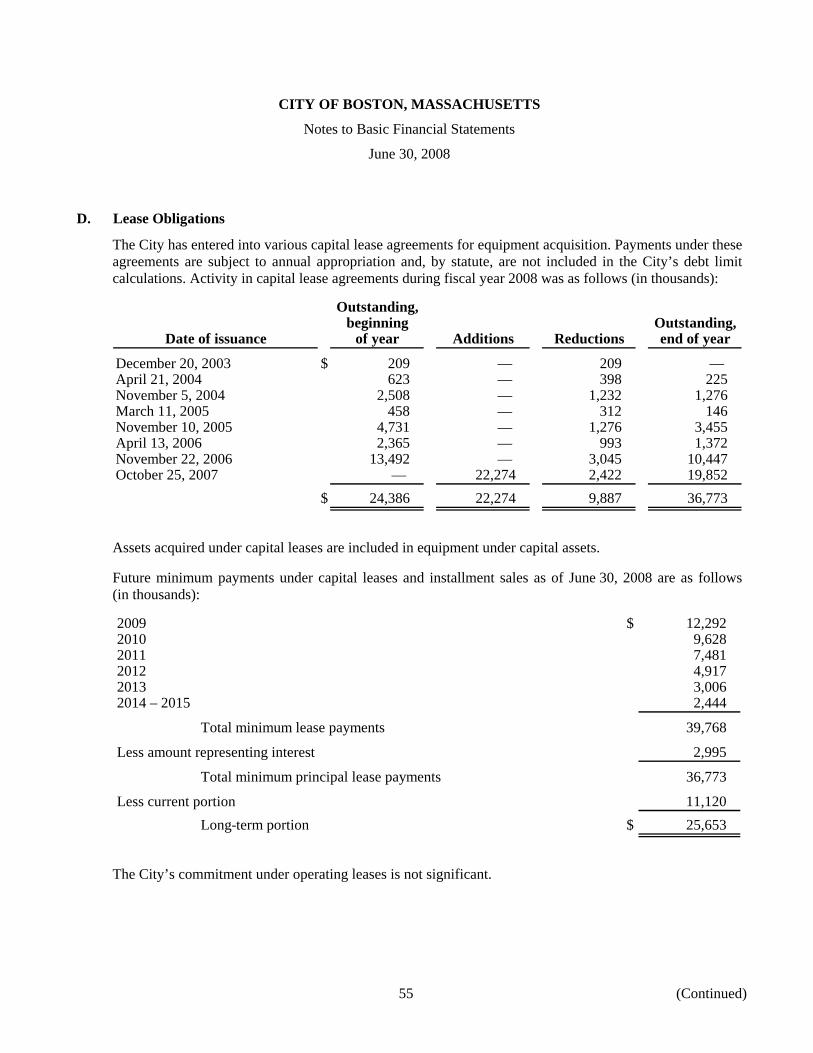
CITY OF BOSTON, MASSACHUSETTS
Notes to Basic Financial Statements
June 30, 2008
55 (Continued)
D. Lease Obligations
The City has entered into various capital lease agreements for equipment acquisition. Payments under these agreements are subject to annual appropriation and, by statute, are not included in the City’s debt limit calculations. Activity in capital lease agreements during fiscal year 2008 was as follows (in thousands):
Outstanding,beginning Outstanding,
Date of issuance of year Additions Reductions end of year
December 20, 2003 $ 209 — 209 — April 21, 2004 623 — 398 225 November 5, 2004 2,508 — 1,232 1,276 March 11, 2005 458 — 312 146 November 10, 2005 4,731 — 1,276 3,455 April 13, 2006 2,365 — 993 1,372 November 22, 2006 13,492 — 3,045 10,447 October 25, 2007 — 22,274 2,422 19,852
$ 24,386 22,274 9,887 36,773
Assets acquired under capital leases are included in equipment under capital assets.
Future minimum payments under capital leases and installment sales as of June 30, 2008 are as follows (in thousands):
2009 $ 12,292 2010 9,628 2011 7,481 2012 4,917 2013 3,006 2014 – 2015 2,444
Total minimum lease payments 39,768
Less amount representing interest 2,995
Total minimum principal lease payments 36,773
Less current portion 11,120 Long-term portion $ 25,653
The City’s commitment under operating leases is not significant.
CITY OF BOSTON, MASSACHUSETTS
Notes to Basic Financial Statements
June 30, 2008
56 (Continued)
(11) Retirement Plans
(a) Plan Description
The City contributes to the SBRS, a cost-sharing multiple-employer defined benefit pension plan. The System provides retirement, disability and death benefits to plan members and beneficiaries of the following government units:
(1) City of Boston (2) Boston Redevelopment Authority (3) Boston Housing Authority (4) Boston Water and Sewer Commission (5) Boston Public Health Commission (6) Suffolk County Sheriff’s Department
Chapter 32 of the MGL assigns authority to establish and amend benefit provisions of the plan to the state legislature.
The System is administered by a five-person Board of Retirement consisting of the City Auditor, who serves as a member ex officio, two members who are elected by the participants, in or retired from the service of the System, a fourth member appointed by the Mayor, and a fifth member chosen by the other members.
(b) Basis of Accounting
The System’s financial statements are prepared using the accrual basis of accounting. Plan member contributions are recognized in the period in which the contributions are due. Employer contributions to the plan are recognized when due and the employer has made a formal commitment to provide the contributions. Benefits and refunds are recognized when due and payable in accordance with the terms of each plan.
Investments of the System are stated as follows:
(a) Bonds are stated at quoted market value. (b) Equity securities are stated at quoted market value. (c) Real estate funds are stated at appraised value or partner’s account value, whichever is more
readily determinable. (d) Venture capital funds are stated at contributed cost or fair market value, whichever is more
readily determinable. (e) International investments are stated at quoted market value and are included in equities and
fixed income categories. (f) Cash is stated at carrying amount which is reconciled book balance.
CITY OF BOSTON, MASSACHUSETTS
Notes to Basic Financial Statements
June 30, 2008
57 (Continued)
(c) Membership
Membership in the System consisted of the following at December 31, 2007, the date of the latest actuarial valuation:
Retirees and beneficiaries receiving benefits 13,849 Terminated plan members entitled to but not receiving benefits 9,512 Active plan members 21,638
Total membership 44,999
Total number of participating employers 6
(d) Contributions
Plan members are required to contribute to the System. Depending on their employment date, active members must contribute a range of 5% – 9% of their regular gross compensation. Members hired after December 31, 1978 must contribute an additional 2% of regular compensation in excess of $30,000. Participating employers are required to pay into the System their share of the remaining system-wide actuarially determined contribution, which is apportioned among the employers based on active covered payroll. The Commonwealth of Massachusetts (the Commonwealth) reimburses the City for benefits paid to school teachers. The Commonwealth also reimbursed the System for a portion of benefit payments for cost of living increases granted before July 1, 1998. The contributions of plan members and the participating employers are governed by Chapter 32 of the MGL. The City’s required and actual contributions to the System for the years ended June 30, 2008, 2007 and 2006 were $203 million, $193 million, $186 million, or $105 million, or $99 million, and $101 million, net of teachers’ retirement, respectively.
During the fall of 1997, the System’s Retirement Board, the City Council, and the Mayor approved the option for local funding of cost of living adjustments. As a result, a locally funded cost of living adjustment of 3.0% on the first $12,000 of a retiree’s annual payment was awarded in fiscal year 2001 and each year following. These cost of living adjustments will be awarded by the Retirement Board each year, except in years in which the Retirement Board determines that such an adjustment would substantially impair the funding schedule.

CITY OF BOSTON, MASSACHUSETTS
Notes to Basic Financial Statements
June 30, 2008
58 (Continued)
(e) Legally Required Reserve Accounts
The balance in the System’s legally required reserves (on the statutory basis of accounting) at December 31, 2007 are as follows (in thousands):
Description Amount Purpose
Annuity savings fund $ 1,263,247 Active members’ contribution balanceAnnuity reserve fund 405,683 Retired members’ contribution accountMilitary service credit 49 Members’ contribution account while on
military leavePension reserve fund 2,549,910 Amounts appropriated to fund future
retirement benefitsPension fund 408,899 Remaining net assets
$ 4,627,788
All reserve accounts are funded at levels required by State statute.
(f) Securities Lending
The Public Employment Retirement Administration Commission of Massachusetts (PERAC) has issued supplemental regulations that permit the System to engage in securities lending transactions. These transactions are conducted by the System’s custodian, which lends certain securities owned by the System to other broker-dealers and banks pursuant to a form of loan agreement. The System and the borrowers maintain the right to terminate all securities lending transactions on demand.
At the System’s direction, the custodian lends the System’s securities and receives cash (including both United States and foreign currency), United States government securities, sovereign debt of foreign countries, and irrevocable bank letters of credit as collateral. The custodian does not have the ability to pledge or sell collateral unless the borrower defaults. Borrowers are required to deliver cash collateral in amounts equal to not less than 100% of the market value of the loaned securities.
The System does not impose any restrictions on the amount of securities lent on its behalf by the custodian. There were no failures by any borrowers to return loaned securities or pay distributions thereon, and there were no losses from a default of the borrowers or the custodian for the year ended December 31, 2007. The cash collateral received by the custodian on each loan was invested, together with the cash collateral of other qualified tax-exempt plan lenders, in a collective investment pool. The relationship between the average maturities of the investment pool and loans was affected by the maturities of the loans made by other plans that invested cash collateral in the collective investment pool, which the System could not determine. At December 31, 2007, the System had no credit risk exposure to borrowers because the amounts the System owed the borrowers exceeded the amounts owed to the System. Borrower rebates and fees paid to the custodian during the year ended December 31, 2007 was $1.3 million.
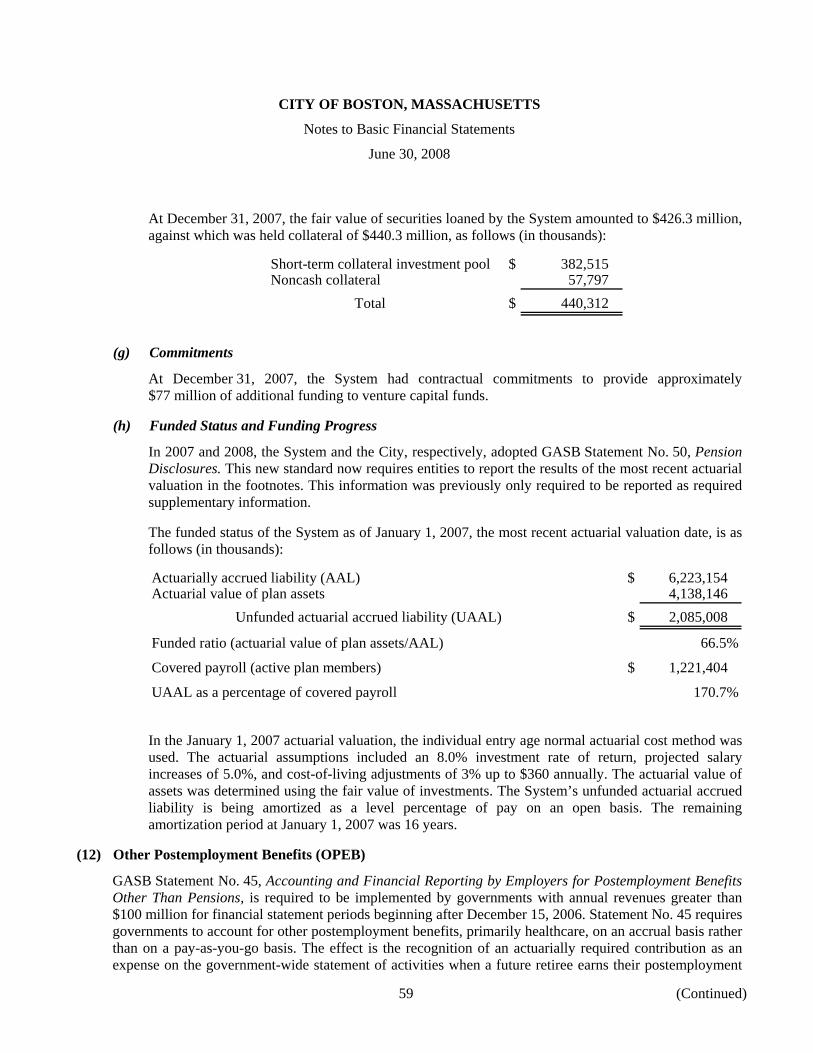
CITY OF BOSTON, MASSACHUSETTS
Notes to Basic Financial Statements
June 30, 2008
59 (Continued)
At December 31, 2007, the fair value of securities loaned by the System amounted to $426.3 million, against which was held collateral of $440.3 million, as follows (in thousands):
Short-term collateral investment pool $ 382,515 Noncash collateral 57,797
Total $ 440,312
(g) Commitments
At December 31, 2007, the System had contractual commitments to provide approximately $77 million of additional funding to venture capital funds.
(h) Funded Status and Funding Progress
In 2007 and 2008, the System and the City, respectively, adopted GASB Statement No. 50, Pension Disclosures. This new standard now requires entities to report the results of the most recent actuarial valuation in the footnotes. This information was previously only required to be reported as required supplementary information.
The funded status of the System as of January 1, 2007, the most recent actuarial valuation date, is as follows (in thousands):
Actuarially accrued liability (AAL) $ 6,223,154 Actuarial value of plan assets 4,138,146
Unfunded actuarial accrued liability (UAAL) $ 2,085,008
Funded ratio (actuarial value of plan assets/AAL) 66.5%
Covered payroll (active plan members) $ 1,221,404
UAAL as a percentage of covered payroll 170.7%
In the January 1, 2007 actuarial valuation, the individual entry age normal actuarial cost method was used. The actuarial assumptions included an 8.0% investment rate of return, projected salary increases of 5.0%, and cost-of-living adjustments of 3% up to $360 annually. The actuarial value of assets was determined using the fair value of investments. The System’s unfunded actuarial accrued liability is being amortized as a level percentage of pay on an open basis. The remaining amortization period at January 1, 2007 was 16 years.
(12) Other Postemployment Benefits (OPEB)
GASB Statement No. 45, Accounting and Financial Reporting by Employers for Postemployment Benefits Other Than Pensions, is required to be implemented by governments with annual revenues greater than $100 million for financial statement periods beginning after December 15, 2006. Statement No. 45 requires governments to account for other postemployment benefits, primarily healthcare, on an accrual basis rather than on a pay-as-you-go basis. The effect is the recognition of an actuarially required contribution as an expense on the government-wide statement of activities when a future retiree earns their postemployment
CITY OF BOSTON, MASSACHUSETTS
Notes to Basic Financial Statements
June 30, 2008
60 (Continued)
benefit rather than when they use their postemployment benefit. To the extent that an entity does not fund their actuarially required contribution, a postemployment benefit liability is recognized on the government-wide statement of net assets over time.
In addition to the pension benefits described in note 11, the City provides postemployment health care and life insurance benefits, in accordance with state statute and City ordinance, to participating retirees and their beneficiaries. Participating retirees are City of Boston retirees. As of June 30, 2007, the valuation date, approximately 14,000 retirees and 16,000 active members meet the eligibility requirements as put forth in Chapter 32B of MGL. The City sponsors and participates in an agent multi-employer defined benefit OPEB plan. The OPEB plan is administered by the City and does not issue a stand-alone financial report. GASB Statement No. 43 requires the City to report their OPEB plan as an agency fund in their fiduciary financial statements. However, the City has determined that activity in this fund is immaterial to the City’s financial statements and does not present the fund within the fiduciary financial statements.
Medical and prescription drug benefits are provided to all eligible retirees not enrolled in Medicare through a variety of plans offered by Blue Cross Blue Shield of Massachusetts, Harvard Pilgrim HealthCare, and Neighborhood Health Plan. Medical and prescription drug benefits are provided to retirees enrolled in Medicare through supplemental and Medicare Advantage plans offered by Blue Cross Blue Shield of Massachusetts, Harvard Pilgrim HealthCare, and Tufts Health Plan.
Groups 1 and 2 retirees, including teachers, with at least 10 years or 20 years of creditable service are eligible at age 55 or any age, respectively. Group 4 retirees with at least 10 years or 20 years of creditable service are eligible at age 45 or any age, respectively. Retirees on accidental disability retirement are eligible at any age while ordinary disability requires 10 years of creditable service. The surviving spouse is eligible to receive both pre- and post-retirement death benefits, as well as medical and prescription drug coverage.
(a) Funding Policy
Employer and employee contribution rates are governed by the respective collective bargaining agreements. The City currently funds the plan on a pay-as-you-go basis. The City and plan members share the cost of benefits. As of June 30, 2007, the valuation date, the plan members contribute 10% to 25% of the monthly premium cost, depending on the plan in which they are enrolled. The City contributes the balance of the premium cost.
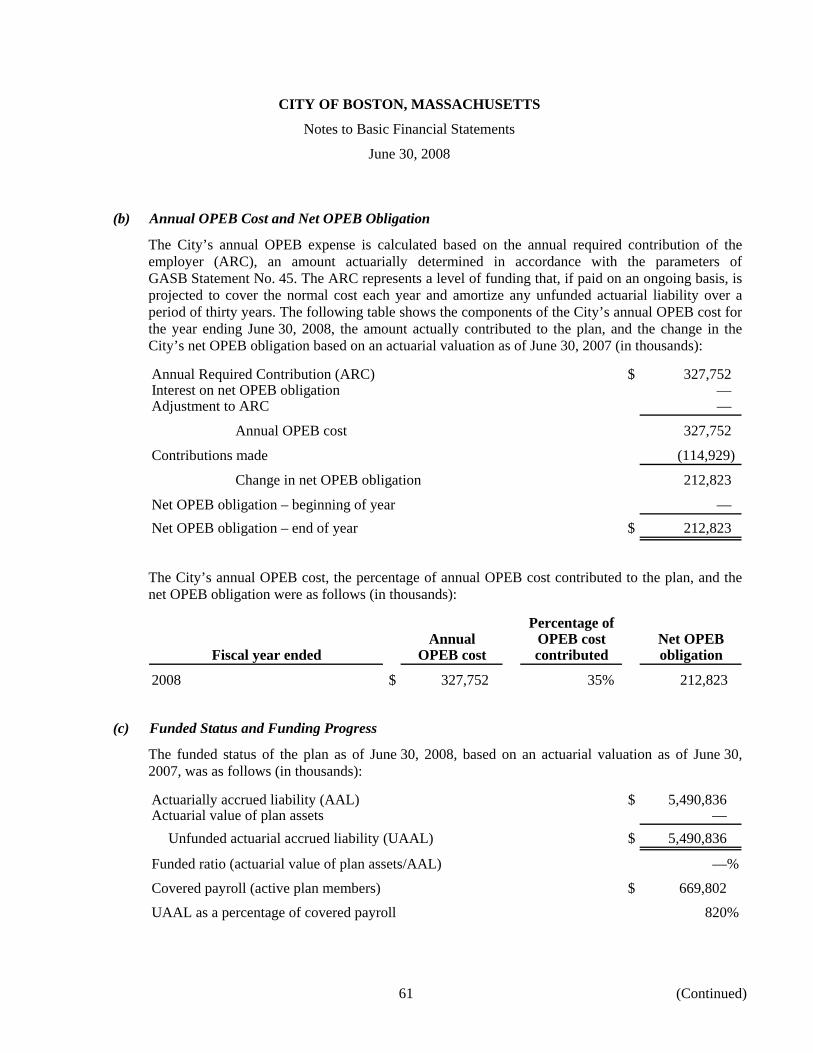
CITY OF BOSTON, MASSACHUSETTS
Notes to Basic Financial Statements
June 30, 2008
61 (Continued)
(b) Annual OPEB Cost and Net OPEB Obligation
The City’s annual OPEB expense is calculated based on the annual required contribution of the employer (ARC), an amount actuarially determined in accordance with the parameters of GASB Statement No. 45. The ARC represents a level of funding that, if paid on an ongoing basis, is projected to cover the normal cost each year and amortize any unfunded actuarial liability over a period of thirty years. The following table shows the components of the City’s annual OPEB cost for the year ending June 30, 2008, the amount actually contributed to the plan, and the change in the City’s net OPEB obligation based on an actuarial valuation as of June 30, 2007 (in thousands):
Annual Required Contribution (ARC) $ 327,752 Interest on net OPEB obligation — Adjustment to ARC —
Annual OPEB cost 327,752
Contributions made (114,929)
Change in net OPEB obligation 212,823
Net OPEB obligation – beginning of year — Net OPEB obligation – end of year $ 212,823
The City’s annual OPEB cost, the percentage of annual OPEB cost contributed to the plan, and the net OPEB obligation were as follows (in thousands):
Percentage ofAnnual OPEB cost Net OPEB
Fiscal year ended OPEB cost contributed obligation
2008 $ 327,752 35% 212,823
(c) Funded Status and Funding Progress
The funded status of the plan as of June 30, 2008, based on an actuarial valuation as of June 30, 2007, was as follows (in thousands):
Actuarially accrued liability (AAL) $ 5,490,836Actuarial value of plan assets —
Unfunded actuarial accrued liability (UAAL) $ 5,490,836
Funded ratio (actuarial value of plan assets/AAL) —%
Covered payroll (active plan members) $ 669,802
UAAL as a percentage of covered payroll 820%
CITY OF BOSTON, MASSACHUSETTS
Notes to Basic Financial Statements
June 30, 2008
62 (Continued)
Actuarial valuations of an ongoing plan involve estimates of the value of reported amounts and assumptions about the probability of occurrence of events far into the future. Examples include assumptions about future employment, mortality, and the healthcare cost trend. Amounts determined regarding the funded status of the plan and the annual required contributions of the City are subject to continual revision as actual results are compared with past expectations and new estimates are made about the future. The schedule of funding progress, presented as required supplementary information following the notes to the financial statements, presents multi-year trend information that shows whether the actuarial value of plan assets is increasing or decreasing over time relative to the actuarial accrued liabilities for benefits.
(d) Actuarial Methods and Assumptions
Projections of benefits for financial reporting purposes are based on the substantive plan (the plan as understood by the City and plan members) and include the types of benefits provided at the time of each valuation and the historical pattern of sharing of benefit costs between the City and plan members to that point. The actuarial methods and assumptions used include techniques that are designed to reduce short-term volatility in actuarial accrued liabilities and the actuarial value of assets, consistent with the long-term perspective of the calculations.
In the June 30, 2007 actuarial valuation, the projected unit credit cost method was used. The actuarial assumptions included a 4.5% investment rate of return and an annual health care cost trend rate of 10% – 11% initially, reduced by decrements to an ultimate rate of 5% after 5 – 6 years. The health care cost trend rate differs between the master medical and other healthcare plans. The actuarial value of assets was determined using the market value of investments. The City’s unfunded actuarial accrued liability is being amortized as a level percentage of pay on a closed basis. The remaining amortization period at July 1, 2007 was thirty years.
(13) Transfers
Transfers and their purposes during the year ended June 30, 2008 were as follows (in thousands):
ProprietaryGovernmental funds fund
Special Capital Other ConventionGeneral revenue projects governmental center
Primary government:Excess hotel/motel excise taxes $ 23,000 — — — (23,000) Cemetery fees/fund
appropriation 2,141 — — (2,141) — Parking meter fees/fund
appropriationpayment 10,000 (10,000) — — —
Sale of surplus property 5,669 — (5,669) — — Total $ 40,810 (10,000) (5,669) (2,141) (23,000)
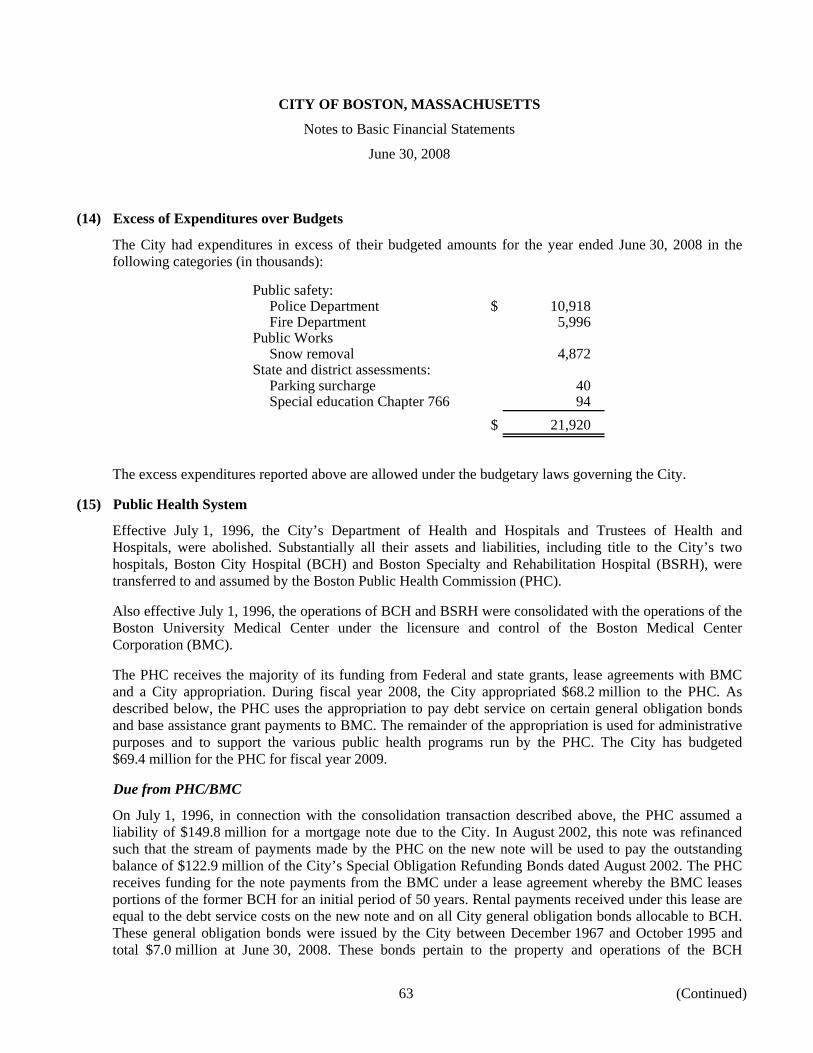
CITY OF BOSTON, MASSACHUSETTS
Notes to Basic Financial Statements
June 30, 2008
63 (Continued)
(14) Excess of Expenditures over Budgets
The City had expenditures in excess of their budgeted amounts for the year ended June 30, 2008 in the following categories (in thousands):
Public safety:Police Department $ 10,918 Fire Department 5,996
Public WorksSnow removal 4,872
State and district assessments:Parking surcharge 40 Special education Chapter 766 94
$ 21,920
The excess expenditures reported above are allowed under the budgetary laws governing the City.
(15) Public Health System
Effective July 1, 1996, the City’s Department of Health and Hospitals and Trustees of Health and Hospitals, were abolished. Substantially all their assets and liabilities, including title to the City’s two hospitals, Boston City Hospital (BCH) and Boston Specialty and Rehabilitation Hospital (BSRH), were transferred to and assumed by the Boston Public Health Commission (PHC).
Also effective July 1, 1996, the operations of BCH and BSRH were consolidated with the operations of the Boston University Medical Center under the licensure and control of the Boston Medical Center Corporation (BMC).
The PHC receives the majority of its funding from Federal and state grants, lease agreements with BMC and a City appropriation. During fiscal year 2008, the City appropriated $68.2 million to the PHC. As described below, the PHC uses the appropriation to pay debt service on certain general obligation bonds and base assistance grant payments to BMC. The remainder of the appropriation is used for administrative purposes and to support the various public health programs run by the PHC. The City has budgeted $69.4 million for the PHC for fiscal year 2009.
Due from PHC/BMC
On July 1, 1996, in connection with the consolidation transaction described above, the PHC assumed a liability of $149.8 million for a mortgage note due to the City. In August 2002, this note was refinanced such that the stream of payments made by the PHC on the new note will be used to pay the outstanding balance of $122.9 million of the City’s Special Obligation Refunding Bonds dated August 2002. The PHC receives funding for the note payments from the BMC under a lease agreement whereby the BMC leases portions of the former BCH for an initial period of 50 years. Rental payments received under this lease are equal to the debt service costs on the new note and on all City general obligation bonds allocable to BCH. These general obligation bonds were issued by the City between December 1967 and October 1995 and total $7.0 million at June 30, 2008. These bonds pertain to the property and operations of the BCH
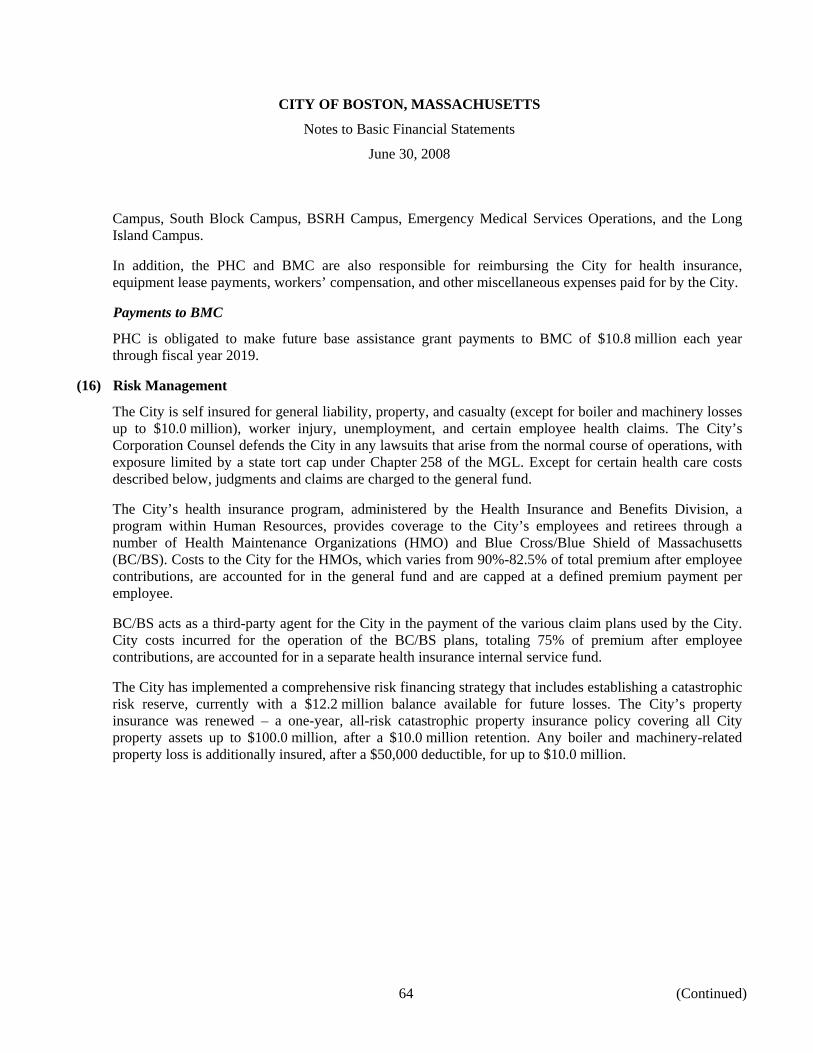
CITY OF BOSTON, MASSACHUSETTS
Notes to Basic Financial Statements
June 30, 2008
64 (Continued)
Campus, South Block Campus, BSRH Campus, Emergency Medical Services Operations, and the Long Island Campus.
In addition, the PHC and BMC are also responsible for reimbursing the City for health insurance, equipment lease payments, workers’ compensation, and other miscellaneous expenses paid for by the City.
Payments to BMC
PHC is obligated to make future base assistance grant payments to BMC of $10.8 million each year through fiscal year 2019.
(16) Risk Management
The City is self insured for general liability, property, and casualty (except for boiler and machinery losses up to $10.0 million), worker injury, unemployment, and certain employee health claims. The City’s Corporation Counsel defends the City in any lawsuits that arise from the normal course of operations, with exposure limited by a state tort cap under Chapter 258 of the MGL. Except for certain health care costs described below, judgments and claims are charged to the general fund.
The City’s health insurance program, administered by the Health Insurance and Benefits Division, a program within Human Resources, provides coverage to the City’s employees and retirees through a number of Health Maintenance Organizations (HMO) and Blue Cross/Blue Shield of Massachusetts (BC/BS). Costs to the City for the HMOs, which varies from 90%-82.5% of total premium after employee contributions, are accounted for in the general fund and are capped at a defined premium payment per employee.
BC/BS acts as a third-party agent for the City in the payment of the various claim plans used by the City. City costs incurred for the operation of the BC/BS plans, totaling 75% of premium after employee contributions, are accounted for in a separate health insurance internal service fund.
The City has implemented a comprehensive risk financing strategy that includes establishing a catastrophic risk reserve, currently with a $12.2 million balance available for future losses. The City’s property insurance was renewed – a one-year, all-risk catastrophic property insurance policy covering all City property assets up to $100.0 million, after a $10.0 million retention. Any boiler and machinery-related property loss is additionally insured, after a $50,000 deductible, for up to $10.0 million.
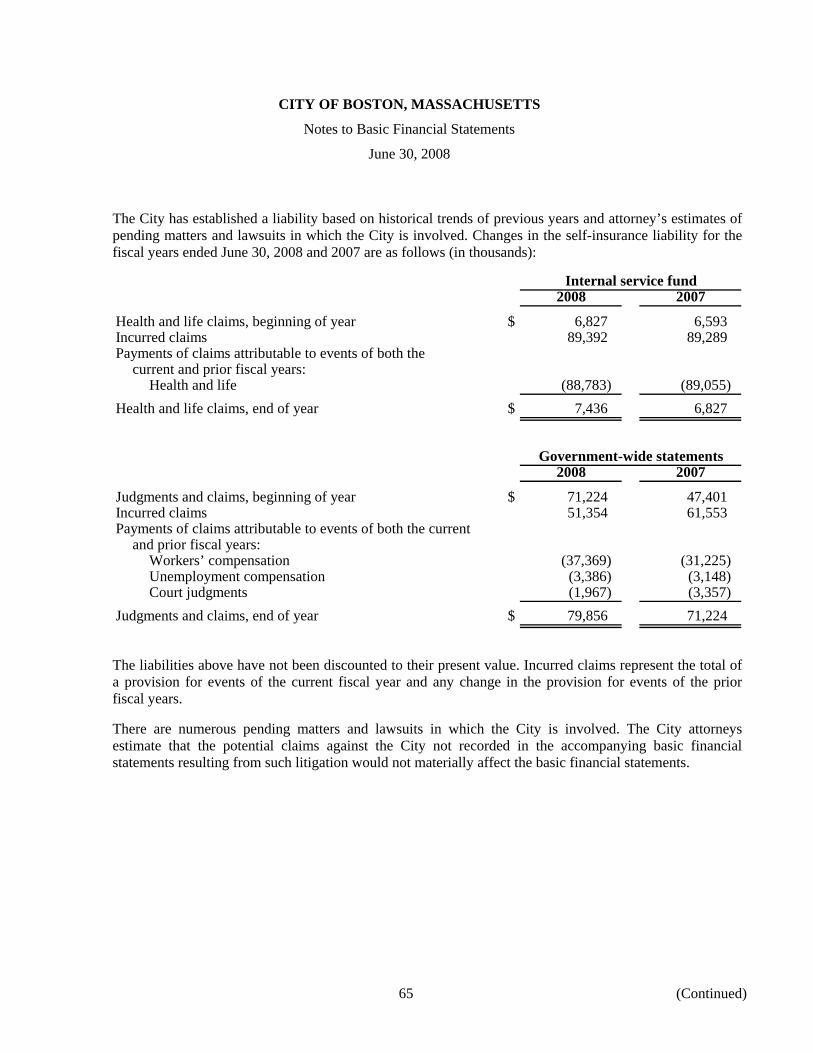
CITY OF BOSTON, MASSACHUSETTS
Notes to Basic Financial Statements
June 30, 2008
65 (Continued)
The City has established a liability based on historical trends of previous years and attorney’s estimates of pending matters and lawsuits in which the City is involved. Changes in the self-insurance liability for the fiscal years ended June 30, 2008 and 2007 are as follows (in thousands):
Internal service fund2008 2007
Health and life claims, beginning of year $ 6,827 6,593 Incurred claims 89,392 89,289 Payments of claims attributable to events of both the
current and prior fiscal years:Health and life (88,783) (89,055)
Health and life claims, end of year $ 7,436 6,827
Government-wide statements2008 2007
Judgments and claims, beginning of year $ 71,224 47,401 Incurred claims 51,354 61,553 Payments of claims attributable to events of both the current
and prior fiscal years:Workers’ compensation (37,369) (31,225) Unemployment compensation (3,386) (3,148) Court judgments (1,967) (3,357)
Judgments and claims, end of year $ 79,856 71,224
The liabilities above have not been discounted to their present value. Incurred claims represent the total of a provision for events of the current fiscal year and any change in the provision for events of the prior fiscal years.
There are numerous pending matters and lawsuits in which the City is involved. The City attorneys estimate that the potential claims against the City not recorded in the accompanying basic financial statements resulting from such litigation would not materially affect the basic financial statements.
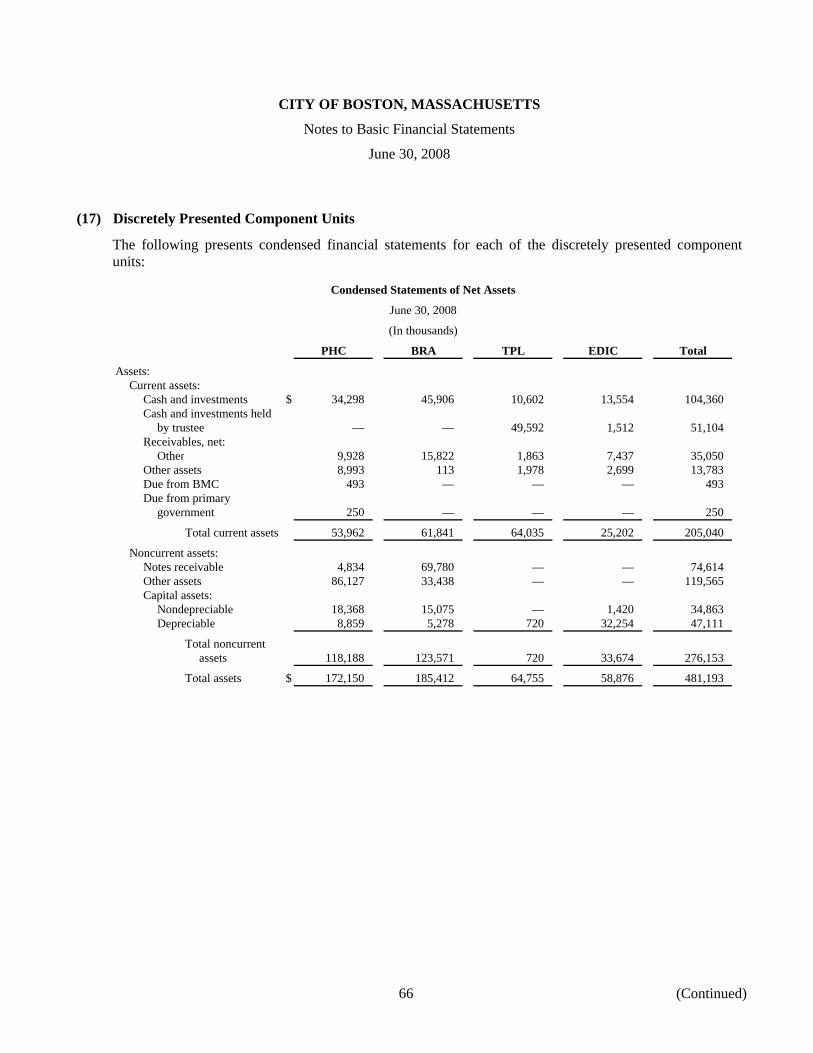
CITY OF BOSTON, MASSACHUSETTS
Notes to Basic Financial Statements
June 30, 2008
66 (Continued)
(17) Discretely Presented Component Units
The following presents condensed financial statements for each of the discretely presented component units:
Condensed Statements of Net Assets
June 30, 2008
(In thousands)
PHC BRA TPL EDIC Total
Assets:Current assets:
Cash and investments $ 34,298 45,906 10,602 13,554 104,360 Cash and investments held
by trustee — — 49,592 1,512 51,104 Receivables, net:
Other 9,928 15,822 1,863 7,437 35,050 Other assets 8,993 113 1,978 2,699 13,783 Due from BMC 493 — — — 493 Due from primary
government 250 — — — 250
Total current assets 53,962 61,841 64,035 25,202 205,040
Noncurrent assets:Notes receivable 4,834 69,780 — — 74,614 Other assets 86,127 33,438 — — 119,565 Capital assets:
Nondepreciable 18,368 15,075 — 1,420 34,863 Depreciable 8,859 5,278 720 32,254 47,111
Total noncurrentassets 118,188 123,571 720 33,674 276,153
Total assets $ 172,150 185,412 64,755 58,876 481,193
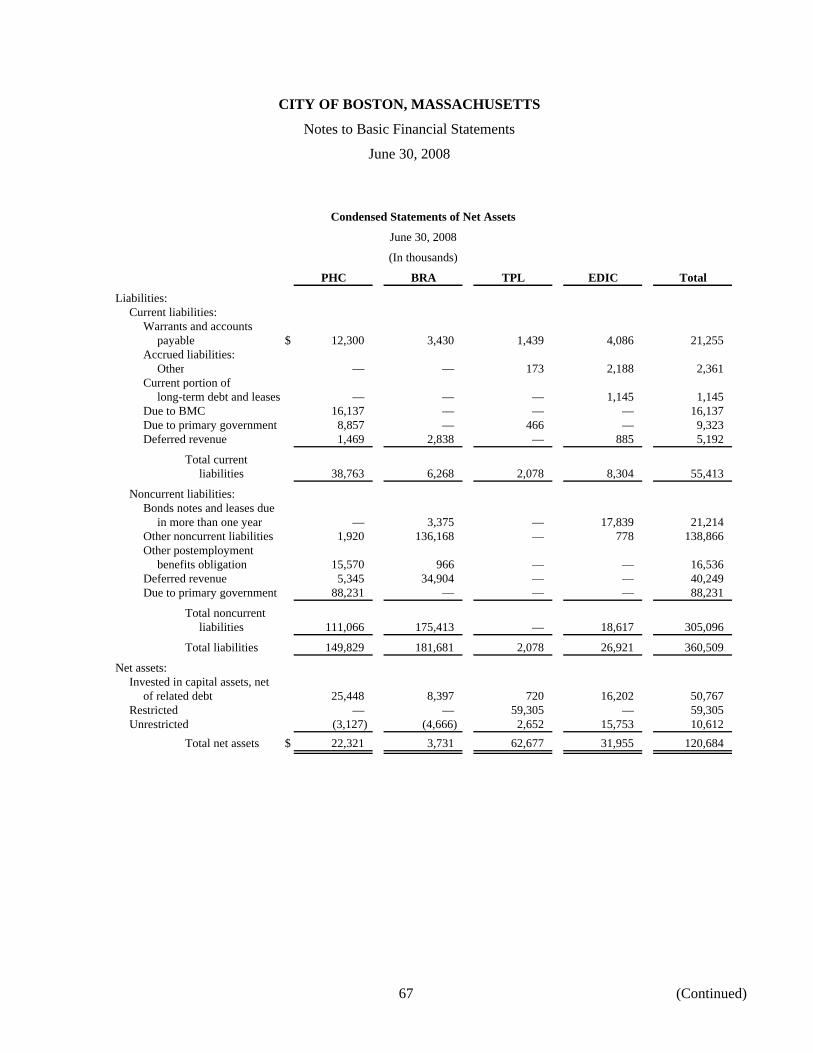
CITY OF BOSTON, MASSACHUSETTS
Notes to Basic Financial Statements
June 30, 2008
67 (Continued)
Condensed Statements of Net Assets
June 30, 2008
(In thousands)
PHC BRA TPL EDIC Total
Liabilities:Current liabilities:
Warrants and accountspayable $ 12,300 3,430 1,439 4,086 21,255
Accrued liabilities:Other — — 173 2,188 2,361
Current portion oflong-term debt and leases — — — 1,145 1,145
Due to BMC 16,137 — — — 16,137 Due to primary government 8,857 — 466 — 9,323 Deferred revenue 1,469 2,838 — 885 5,192
Total currentliabilities 38,763 6,268 2,078 8,304 55,413
Noncurrent liabilities:Bonds notes and leases due
in more than one year — 3,375 — 17,839 21,214 Other noncurrent liabilities 1,920 136,168 — 778 138,866 Other postemployment
benefits obligation 15,570 966 — — 16,536 Deferred revenue 5,345 34,904 — — 40,249 Due to primary government 88,231 — — — 88,231
Total noncurrentliabilities 111,066 175,413 — 18,617 305,096
Total liabilities 149,829 181,681 2,078 26,921 360,509
Net assets:Invested in capital assets, net
of related debt 25,448 8,397 720 16,202 50,767 Restricted — — 59,305 — 59,305 Unrestricted (3,127) (4,666) 2,652 15,753 10,612
Total net assets $ 22,321 3,731 62,677 31,955 120,684
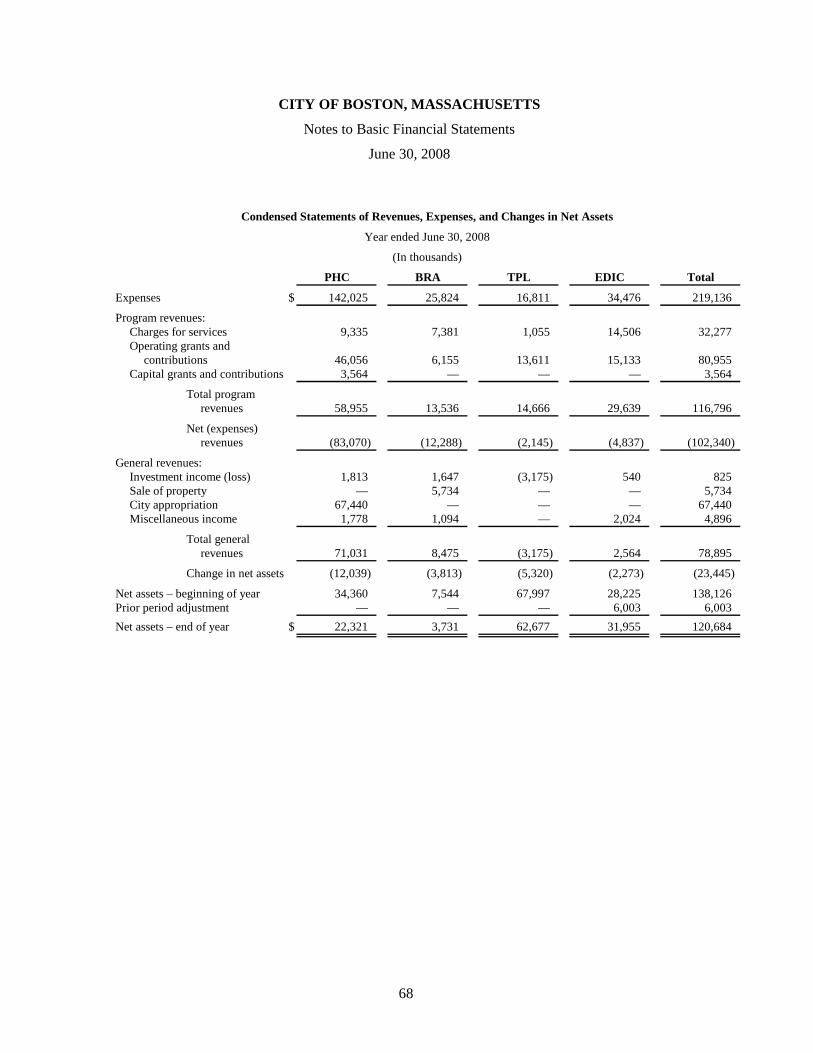
CITY OF BOSTON, MASSACHUSETTS
Notes to Basic Financial Statements
June 30, 2008
68
Condensed Statements of Revenues, Expenses, and Changes in Net Assets
Year ended June 30, 2008
(In thousands)
PHC BRA TPL EDIC Total
Expenses $ 142,025 25,824 16,811 34,476 219,136
Program revenues:Charges for services 9,335 7,381 1,055 14,506 32,277 Operating grants and
contributions 46,056 6,155 13,611 15,133 80,955 Capital grants and contributions 3,564 — — — 3,564
Total programrevenues 58,955 13,536 14,666 29,639 116,796
Net (expenses)revenues (83,070) (12,288) (2,145) (4,837) (102,340)
General revenues:Investment income (loss) 1,813 1,647 (3,175) 540 825 Sale of property — 5,734 — — 5,734 City appropriation 67,440 — — — 67,440 Miscellaneous income 1,778 1,094 — 2,024 4,896
Total generalrevenues 71,031 8,475 (3,175) 2,564 78,895
Change in net assets (12,039) (3,813) (5,320) (2,273) (23,445)
Net assets – beginning of year 34,360 7,544 67,997 28,225 138,126 Prior period adjustment — — — 6,003 6,003 Net assets – end of year $ 22,321 3,731 62,677 31,955 120,684
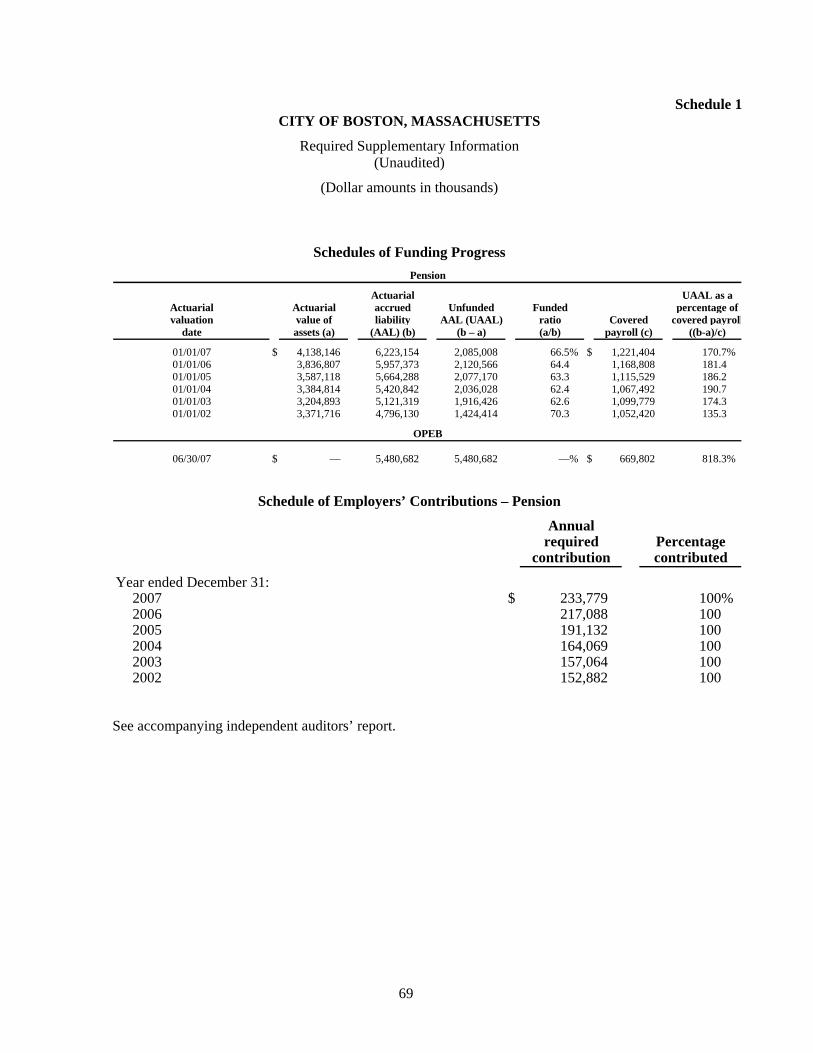
Schedule 1 CITY OF BOSTON, MASSACHUSETTS
Required Supplementary Information (Unaudited)
(Dollar amounts in thousands)
69
Schedules of Funding Progress Pension
Actuarial UAAL as aActuarial Actuarial accrued Unfunded Funded percentage ofvaluation value of liability AAL (UAAL) ratio Covered covered payroll
date assets (a) (AAL) (b) (b – a) (a/b) payroll (c) ((b-a)/c)
01/01/07 $ 4,138,146 6,223,154 2,085,008 66.5% $ 1,221,404 170.7%01/01/06 3,836,807 5,957,373 2,120,566 64.4 1,168,808 181.401/01/05 3,587,118 5,664,288 2,077,170 63.3 1,115,529 186.201/01/04 3,384,814 5,420,842 2,036,028 62.4 1,067,492 190.701/01/03 3,204,893 5,121,319 1,916,426 62.6 1,099,779 174.301/01/02 3,371,716 4,796,130 1,424,414 70.3 1,052,420 135.3
OPEB
06/30/07 $ — 5,480,682 5,480,682 —% $ 669,802 818.3%
Schedule of Employers’ Contributions – Pension
Annualrequired Percentage
contribution contributed
Year ended December 31:2007 $ 233,779 100%2006 217,088 1002005 191,132 1002004 164,069 1002003 157,064 1002002 152,882 100
See accompanying independent auditors’ report.


