72
CITY OF BOULDER Climate Action Plan

CIT
Y O
F BO
ULD
ER
Climate Action Plan

Table of Contents
I. Executive Summary II. Introduction
a. Climate Change in Colorado b. The Vision
III. Greenhouse Gas Emissions in Boulder a. Boulder’s Energy b. GHG Inventory
IV. Climate Action Plan a. Funding b. Cost Estimates/ Investment Strategy
V. Boulder’s Emission Reduction Strategies a. Energy Efficiency Strategies to Reduce Emissions
i. Commercial ii. Industrial iii. Residential iv. City Facilities and Operations
b. Renewable Energy and Emissions Offset Strategies i. Commercial and Industrial ii. Residential iii. City Facilities and Operations
c. Transportation i. City of Boulder Fleet Services
d. Waste Reduction and Recycling e. Water Conservation f. Urban Forestry and Carbon Sequestration
VI. Implementation Plan Attachment A: Resolution 906
Acknowledgments: The city of Boulder’s Office of Environmental Affairs would like to thank the following people for their input and guidance on the Plan: The Climate Action Plan Committee: Francie Anhut, David Bolduc, Amy Ellsworth, Evan Evans, Howard Geller, Betsy Gill, Crystal Gray, Ken Hotard, Jim Martin, Earl McLaughlin, Pam Milmoe, Don Mock, Suzanne O’Neill, Francoise Poinsatte, Steve Pomerance, Dan Powers, John Putnam, Ken Regelson, Will Toor and Mike Yokell. Environmental Advisory Board: Susan Iott, Suzanne Jones, Leah Kukowski, Francoise Poinsatte and John Putnam. Boulder City Council: Suzy Ageton, Robin Bohannan, Tom Eldridge, Crystal Gray, Shawn McGrath, Richard Polk, Mark Ruzzin, Andy Schultheiss and Jack Stoakes.
1

CITY OF BOULDER- CLIMATE ACTION PLAN
SECTION I: Executive Summary There is increasing scientific evidence that carbon dioxide (CO2) and other greenhouse gases released into the atmosphere will have a profound effect on the Earth’s climate, increasing the risk to municipal governments from increased extreme weather events, changing rainfall and crop productivity patterns, and migration of infectious diseases. It is a well-researched fact that the combustion of fossil fuels releases greenhouse gases (GHG), namely carbon dioxide (CO2), into the atmosphere, causing global surface temperatures to increase. For Colorado, global warming will likely mean diminished snow pack, increased drought, more insect outbreaks in forests, an earlier and longer wildfire season, reduced habitat for native species, and less economic growth in certain industries, such as farming and skiing. In May 2002, the Boulder City Council passed Resolution 906, also known as the Kyoto Resolution, setting the goal of reducing community greenhouse gas emissions to seven percent below 1990 levels by 2012. As a result of this resolution, staff in the Office of Environmental Affairs was directed to develop an action plan to serve as a roadmap to Boulder’s Kyoto goal. The overarching vision of the Plan is to develop a sustainable energy future for Boulder and Boulder County. The Climate Action Plan provides a framework to compare and analyze alternative strategies and policies, in order to facilitate Council’s review and the decision-making process. The Plan includes baseline data and emissions reduction strategies for all sectors—commercial, industrial, residential, transportation, and solid waste. It also addresses city operations, water conservation and urban forestry. The Boulder emissions inventory was completed by Econergy International in 2004. City staff updates the inventory on an annual basis using electricity and natural gas consumption data from Xcel Energy, vehicle miles traveled, and solid waste sent to the landfill. The following table summarizes Boulder’s 2004 GHG emissions.
Energy sources Percent Sector sources Percent
Electricity 51 Commercial 30
Transportation 28 Transportation 28
Natural gas 17 Residential 17
Solid waste 4 Industrial 15
100 CU 5
Solid waste 4
Street lighting 1
100
The city’s primary role will be to act as a facilitator, educator, and to promote market transformation for energy efficiency and renewable energy products and services. The plan outlines three primary strategies for reducing emissions: Increase energy efficiency; Switch to renewable energy and vehicle fuels; and Reduce vehicle miles traveled. Each section outlines overarching strategies and potential actions the city could take to reduce emissions. The plan concludes with an implementation plan that outlines specific actions to be implemented from
2

CITY OF BOULDER- CLIMATE ACTION PLAN
2007 through 2012 and quantifies the projected impacts, including estimated GHG reductions, public and private sector costs, private sector savings and the net cost per mtCO2e reduced. The annual total budget required to achieve these reductions ranges from $860,265 in 2007 to $1.07 million in 2012. The plan assumes that funds for marketing, outreach, and subsidies for critical services, such as energy audits, will comprise the majority of the budget. Significant funding for renewable energy purchases may be required in 2012 to cover an emissions reduction shortfall, thereby doubling the amount of funds needed in 2012, as compared to the average annual budgets for years 2007 to 20111. Achieving the Kyoto Protocol Goal requires not only a substantial financial commitment, but also the dedication of staff resources and political will. While the city recognizes that Boulder’s actions are far too small to impact global greenhouse gas emissions trends and the progression of global warming, Boulder seeks to encourage other communities around the country and world to implement strong greenhouse gas emissions reduction programs, beginning with Boulder County and its member cities.
1 On August 29th, 2006, Boulder City Council selected a revenue structure that does not include a large renewable energy purchase in 2012 which was originally proposed as a part of the Climate Action Plan. As a result, the budget for 2012 in the Climate Action Plan has been revised and does not reflect the purchase of a large amount of renewable energy.
3

CITY OF BOULDER- CLIMATE ACTION PLAN
SECTION II: Introduction In May 2002, the Boulder City Council passed Resolution 906, also known as the Kyoto Resolution, setting the goal of reducing community greenhouse gas emissions to seven percent below 1990 levels by 2012. This represents approximately a 24% reduction in emissions between 2005 and 2012. The resolution, also known as the Kyoto Protocol goal (Goal), builds on environmental policies and goals found in the Boulder Valley Comprehensive Plan (BVCP) and the City Council’s Environmental Goal. Specifically, the BVCP has policies on energy conservation, encouragement of energy alternatives, city leadership in resource conservation, energy-efficient land use and energy-efficient building design and construction. City Council’s Environmental Goal is “To enact and enhance city policies that cause the Boulder community to become a nationwide environmental leader among communities. The City will be a role model of exemplary environmental practices.” This goal also arises from concerns about the potential negative impacts of climate change on the Rocky Mountain region and beyond. In May 2005, the Boulder County Commissioners identified environmental sustainability as a priority initiative and established a Sustainability Task Force. The Task Force has established a process by which guiding principles and goals, cost-benefit analyses, and detailed action plans are being developed for key environmental impacts such as energy use, waste generation, and transportation. The guiding principles for energy use and waste generation are set forth in the “Resolution Adopting a Sustainable Energy Path for Boulder County” and the “Resolution Adopting Zero Waste as a Guiding Principle and Supporting the Creation of a Zero Waste Plan.” These resolutions call for the development of detailed action plans, the analysis of existing practices and opportunities to achieve the goals identified, and an assessment of the plans’ environmental, operational, community, and budgetary impacts. The final Climate Action Plan may incorporate actions for Boulder County. The strategies and actions in this plan are largely based on similar plans developed by other cities and states. Currently, over 220 cities have signed on to the U.S. Mayors Climate Protection Agreement established by Seattle Mayor Greg Nickels in February 2005. Under the Agreement, participating cities must strive to meet or beat the Kyoto Protocol targets in their own communities, as well as urge the state and federal government and U.S. Congress to enact policies and programs to reduce greenhouse gas emissions. Similarly, over 670 international cities, including many U.S. cities, participate in the Cities for Climate Protection program managed by the International Council for Local Environmental Initiatives (ICLEI). One of the milestones set by the program is to develop a local action plan to reduce emissions. Currently, a relatively small percentage of participating cities in one or both of the programs have developed and begun implementation of local action plans. Of Colorado municipalities, only Boulder, Boulder County, Fort Collins, and Aspen have Climate Action Plans. The non-profit group, Rocky Mountain Climate Organization, is working with its partners and regional stakeholders to develop a statewide Climate Action Plan. a. Climate Change in Colorado There is increasing scientific evidence that carbon dioxide (CO2) and other greenhouse gases released into the atmosphere will have a profound effect on the Earth’s climate, increasing the
4

CITY OF BOULDER- CLIMATE ACTION PLAN
risk to municipal governments from increased extreme weather events, changing rainfall and crop productivity patterns, and migration of infectious diseases. It is a well-researched fact that the combustion of fossil fuels releases greenhouse gases, namely carbon dioxide (CO2), into the atmosphere. In a series of lengthy reports, the Intergovernmental Panel on Climate Change (IPCC) found that atmospheric CO2 levels are increasing at an unprecedented and alarming rate due to human consumption of fossil fuels. As a result, the mean global surface temperature has risen by about 0.7- 1.5º F during the last century. This increased temperature contributes to rising sea levels, increased summer drought in some areas, more intense precipitation and weather events, habitat disruption that could lead to species extinction, and other possible serious effects. It is unknown how successful humans, plants, and animals will be at adapting to these relatively rapid changes. While how much the climate is warming, what effects can be predicted, and to what degree humans are responsible are avidly debated and researched questions, the vast majority of scientists agree that it is time to take strong precautionary measures to stabilize greenhouse gas emissions and slow global warming. For Colorado, climate change will likely mean diminished snow pack, increased drought, more insect outbreaks in forests, an earlier and longer wildfire season, reduced habitat for native species, and less economic growth, according to studies on the impacts of climate change on the Rocky Mountain region. Diminished snow pack and shrinking water supplies would drastically hurt the Front Range’s tourism, skiing, and farming industries, as well as all related businesses. Some of Colorado’s ski resorts and towns have acknowledged this threat and made commitments to reduce greenhouse gas emissions. Boulder, along with a growing number of Colorado cities, has joined the Rocky Mountain Climate Organization to help raise awareness about the regional impacts of climate change. b. The Vision The vision of the Climate Action Plan is to guide Boulder towards a sustainable energy future that dramatically reduces greenhouse gas emissions from current levels, while meeting the needs of present and future generations. A sustainable energy future is a critical component of the Boulder Valley Comprehensive Plan, which is a tool designed to protect the natural environment of the Boulder Valley while fostering a livable, vibrant and sustainable community. A sustainable energy future is achievable through the widespread adoption of the overarching strategies presented in the Climate Action Plan, which are to increase energy efficiency, switch to renewable energy and vehicle fuels, and reduce vehicle miles traveled. A report completed by a Boulder resident for the Sierra Club titled, “Sustainable Cities: Best Practices for Renewable Energy and Energy Efficiency” surveyed energy programs in Austin, Portland, Chicago and Fort Collins.2
2 “Sustainable Cities: Best Practices for Renewable Energy and Energy Efficiency.” Ken Regelson. 10/28/2005. http://rmc.sierraclub.org/energy/library/sustainablecities.pdf
5

CITY OF BOULDER- CLIMATE ACTION PLAN
The report identifies the following key elements cities are using to become more sustainable:
Leadership A Plan Funding Communications Training Inspections, Audits, and
Measurement
Efficiency Rebate Programs Renewable Programs Green Building Multifamily Building Programs Income Qualified Programs Green Roofs
While the city recognizes that Boulder’s actions are far too small to impact global greenhouse gas emissions trends, it also recognizes that the cost of inaction could be very high and that inaction represents a missed opportunity for saving money and improving the economic, environmental and social sustainability of the community. Boulder also seeks to encourage and inspire other communities around the country, particularly those without readily available funding sources, to implement greenhouse gas emissions reduction programs in an effort to slow global warming. A sustainable energy future means the following changes for Boulder:
More efficient and healthier buildings that reduce community energy costs; Multi-modal transportation systems conveniently linking different neighborhoods and
business districts; Wide availability of sustainable products, including green building materials, high
efficiency building equipment and cars, alternative fuels, organic food, and more; Renewable energy and distributed generation systems to hedge against energy price
volatility and electricity and natural gas distribution system vulnerabilities; Innovative, social programs ensuring that lower-income residents benefit from the shifts
and changes brought about by the Climate Action Plan; A vibrant economy and skilled workforce based on the demand for and provision of
sustainable products and services; and A strong sense of community pride in Boulder’s efforts to protect the environment from
the impacts of global warming.
6

CITY OF BOULDER- CLIMATE ACTION PLAN
SECTION III: Greenhouse Gas Emissions in Boulder a. Boulder’s Energy Xcel Energy provides electricity to all sectors in Boulder. Xcel provides natural gas to Boulder’s residential sector, as well as to many commercial customers. However, the natural gas market is deregulated and some of Boulder’s larger companies contract for natural gas through other providers, such as Seminole. The city of Boulder operates eight hydroelectric plants and sells the generated electricity to Xcel Energy. The city is currently contesting a Public Utilities Commission (PUC) ruling that assigns the renewable energy credits from the hydroelectric generation to Xcel Energy. The passage of Amendment 37 will lower the carbon intensity of the electricity sold to Xcel customers through the grid over time. For Xcel to be in compliance with Amendment 37, it must meet the following standards: (A) 3% of its retail electricity sales in Colorado for the years 2007 through 2010; (B) 6% of its sales for the years 2011 to 2014; and (C) 10% of its sales for the years 2015 and thereafter. Of the ten percent, at least four percent must be derived from solar electric generation technologies, with at least one-half of this four percent coming from solar electric technologies located onsite at customers’ facilities. Emissions reductions from solar PV installations are included in the Amendment 37 estimates. Emissions reductions from solar thermal installations are captured in the annual Xcel consumption reports through reduced natural gas consumption. In addition, Xcel is planning to bring online more natural gas-fired power plants, as opposed to coal-fired power plants. As a result, the carbon intensity of the electricity supplied to Boulder will decrease. This will have the effect of reducing the emissions associated with each kWh, which will help Boulder reach the Goal. It also means that the amount of emissions reductions that can be achieved through energy efficiency actions will decrease, since each kWh saved will have fewer emissions associated with it. Therefore, energy efficiency actions taken before additional renewable generation is built will have a lower $/ton cost. A settlement between the PUC and Xcel Energy requires Xcel Energy to spend up to $196 million on electric demand-side management and energy conservation programs from 2006 through 2013. Xcel offers rebates for the installation of a variety of energy efficiency measures in commercial buildings, including lighting, cooling systems, motors, and refrigeration upgrades. Residential programs have not been finalized. Staff is participating in an Xcel process to provide input on programs and services to be offered. Natural gas DSM programs are currently not offered. The city supports legislation that would initiate utility-run natural gas conservation programs. Because Boulder does not have a municipally-owned utility and currently cannot assess a Systems Benefit Charge on its residents, leveraging outside funds is of paramount importance. It is anticipated that utility rebates will comprise a significant portion of the funding available to implement energy efficiency programs, particularly in the commercial sector. Similarly,
7

CITY OF BOULDER- CLIMATE ACTION PLAN
Amendment 37 rebates and renewable energy credit (REC) payments, as well as federal tax incentives, will increase the cost-effectiveness of solar photovoltaic projects for Boulder residents and businesses. The University of Colorado at Boulder (CU) released its “Blueprint for a Green Campus,” which sets the vision of achieving a “zero or positive net impact on the climate by the year 2025 by consistently reducing emissions, improving air quality and implementing sustainable habits and practices.”3 CU currently also has energy management plans that recognize the need to conserve energy, purchase renewable energy, and reduce greenhouse gas emissions. The university has a natural gas-fired cogeneration plant that produces variable amounts of energy depending on the price of natural gas relative to buying electricity from Xcel Energy. The city collaborates with the university’s Climate Task Force on its greenhouse gas emissions plans and welcomes ways to work together. Because of these efforts, limited or no city funds and efforts will be directed to the University. The federal laboratories, including National Institute of Standards and Technology (NIST) and the National Oceanic and Atmospheric Administration (NOAA), are under the purview of the Federal Energy Management Program, which helps federal agencies control and reduce energy costs. This plan does not currently recommend actions for the federal labs, though staff will work to better understand the labs’ energy management plans and any renewable energy targets. b. Greenhouse Gas Emissions Inventory The Boulder emissions inventory was completed by Econergy International in 2004. City staff updates the inventory on an annual basis using the Inventory Maintenance System (IMS) developed by Econergy. The Inventory Maintenance System is a Microsoft Excel workbook with worksheets for inputting specific data as they become available. The inputs feed algorithms in other worksheets of the IMS workbook that automatically update the inventory, produce summary tables of pertinent metrics and generate useful charts, such as emissions trend lines, emissions by sector and emissions by fuel type, for graphically presenting the inventory components.
OVERVIEW
To establish the context within which to assess GHG emissions reduction opportunities in the City of Boulder, a comprehensive city-wide inventory was first constructed. For the purposes of the Inventory and identifying areas in which the City can realize its climate change objectives, emissions were disaggregated on both a sector and emission source basis. Seven individual sector inventories were constructed: Residential, Commercial, Industrial, Transportation, Street lighting, Solid Waste, and the University of Colorado. The Residential, Commercial, Industrial, and University of Colorado were further broken down into the emissions from electricity and natural gas consumption. The Transportation sector was divided into emissions resulting from vehicle gasoline and diesel fuel consumption. The Street Lighting sector quantifies emissions from electricity usage. Finally, the Solid Waste sector quantifies methane emissions resulting from disposal of solid waste in landfills.
3 “Blueprint for a Green Campus.” http://ecenter.colorado.edu/blueprint06/
8

CITY OF BOULDER- CLIMATE ACTION PLAN
BASIS FOR INVENTORY
The Inventory is based on accepted international protocols and keeps with a similar approach other cities with climate change objectives have used. The inventory is not meant to be precise GHG accounting, but it does provide a high level examination of the City’s GHG emissions. Utilizing the results of the Inventory enables the City to develop policies and programs that will create the greatest reductions in emissions, while simultaneously generating increased sales tax revenue. The primary basis for the GHG inventory was the historical consumption of electricity and natural gas, disaggregated by sector. The necessary historical energy consumption data were acquired from City of Boulder, University of Colorado, and Xcel Energy. For the most part, annual data for the consumption of electricity and natural gas were available for the 1990 – 2002 period. Using standard methodologies provided by the Intergovernmental Panel on Climate Change (IPCC) of the United Nations Framework Convention on Climate Change (UNFCCC), these historical consumption data were translated into GHG emissions on an annual basis. Thus an annual GHG inventory was created for the City for the 1990 through 2002 period. Furthermore, the historical data were used to forecast annual Business-As-Usual (BAU) GHG emissions for the 2003 through 2012 period. BAU emissions are those that would occur in the absence of new emissions mitigation efforts. The inventory considers only the predominant greenhouse gases, carbon dioxide and methane, together represented as units of CO2-equivalent4 (CO2e), that result from the combustion of fossil fuel and from anaerobic decay of solid waste. The inventory does not take into account the other GHGs (N2O, HFCs, PFCs, & SF6) covered by the Kyoto Protocol. The reasoning behind this omission is that, in the bigger picture, fossil fuel-related CO2 and solid waste decay CH4 comprise the vast majority of the City’s climate change-inducing emissions, with the other GHGs contributing only marginally to the overall inventory. Additionally, the Inventory does not cover emission sources considered to be insignificant and/or not readily controlled by local government actions. These excluded emission sources include aviation and locomotive transportation, agricultural enteric and manure sources, solvent use, land use and forestry, and industrial emissions not associated with energy. Finally, the inventory does not include the emissions related to the production of most goods bought or consumed in the City.5 The Inventory does credit the City for reductions achieved through the generation and purchase of renewable electricity. These credits are realized through the City’s hydroelectric generation
4 The Global Warming Potential (GWP) for carbon dioxide and methane has been calculated to make relative comparisons between the two gases possible. Since methane is 21 times more potent a greenhouse gas than carbon dioxide, the relative global warming potential of carbon dioxide = 1, and methane = 21. When GHG emissions are summed for an inventory, they are commonly referred to as CO2e , indicating that the gases have been converted to CO2 equivalent. 5 To avoid double counting, emissions from goods bought or consumed in the City should be included in inventories done by the communities in which the goods were made.
9

CITY OF BOULDER- CLIMATE ACTION PLAN
and public and private subscription to Xcel Energy’s Windsource Program.6 Other green tag purchases by Boulder businesses and individuals, such as through Renewable Choice and other green tag retailers, have not been reflected in the current inventory, due to the difficulty of acquiring these data. However, these emissions credits are included beginning in the 2004 inventory.
BOULDER GHG INVENTORY
The following sub-sections provide the historical and forecasted GHG inventories for the City’s aggregated Inventory Figure-1 illustrates the Inventory profile and indicates that between 1990 and 2004, total GHG emissions increased from 1.56 million to 1.81 million metric tons of carbon dioxide-equivalent, an increase of 16%. Moreover, the figure illustrates that by 2012, emissions are projected to reach just over two million metric tons for a total increase of 28% in GHG emissions unless action is taken to counteract the BAU trend. Figure-2 displays the forecasted inventory profile broken out by sector.
Figure -1: Boulder’s Forecast Inventory
Forecast Inventory
0
200,000
400,000
600,000
800,000
1,000,000
1,200,000
1,400,000
1,600,000
1,800,000
2,000,000
2,200,000
1990 1992 1994 1996 1998 2000 2002 2004 2006 2008 2010 2012
GH
G E
mis
sion
s (m
tCO
2)
Electricity Natural Gas Vehicle Fuel Landfill Gas Offsets
GHG Emissions Target = 1,459,375 mtCO2e
6 Currently, Xcel is disputing the city’s ownership of the RECs from Boulder’s hydroelectric facilities.
10

CITY OF BOULDER- CLIMATE ACTION PLAN
Figure-2: Boulder GHG Inventory Profile, 1990 – 2012
0
200,000
400,000
600,000
800,000
1,000,000
1,200,000
1,400,000
1,600,000
1,800,000
2,000,000
2,200,000
2,400,000
2,600,000
1990 1992 1994 1996 1998 2000 2002 2004 2006 2008 2010 2012
GH
G E
mis
sion
s (m
tCO
2)
Residential Commercial IndustrialStreet Lighting University of Colorado TransportationSolid Waste Hydo Offsets Wind Offsets
Figure -3 presents the Inventory disaggregated by sector for 2004. The figure shows that the Commercial Buildings sector is the largest emitter of GHG emissions. Contributing 30% of the 2003 Inventory, the Commercial sector provides a large opportunity for the City to achieve GHG reductions.
Figure -3: Breakdown of Inventory by Sector –2004
Residential17%
Commercial30%
Industrial15%
Solid Waste4%
Transportation28%
Street Lighting1%
University of Colorado
5%
11
CITY OF BOULDER- CLIMATE ACTION PLAN
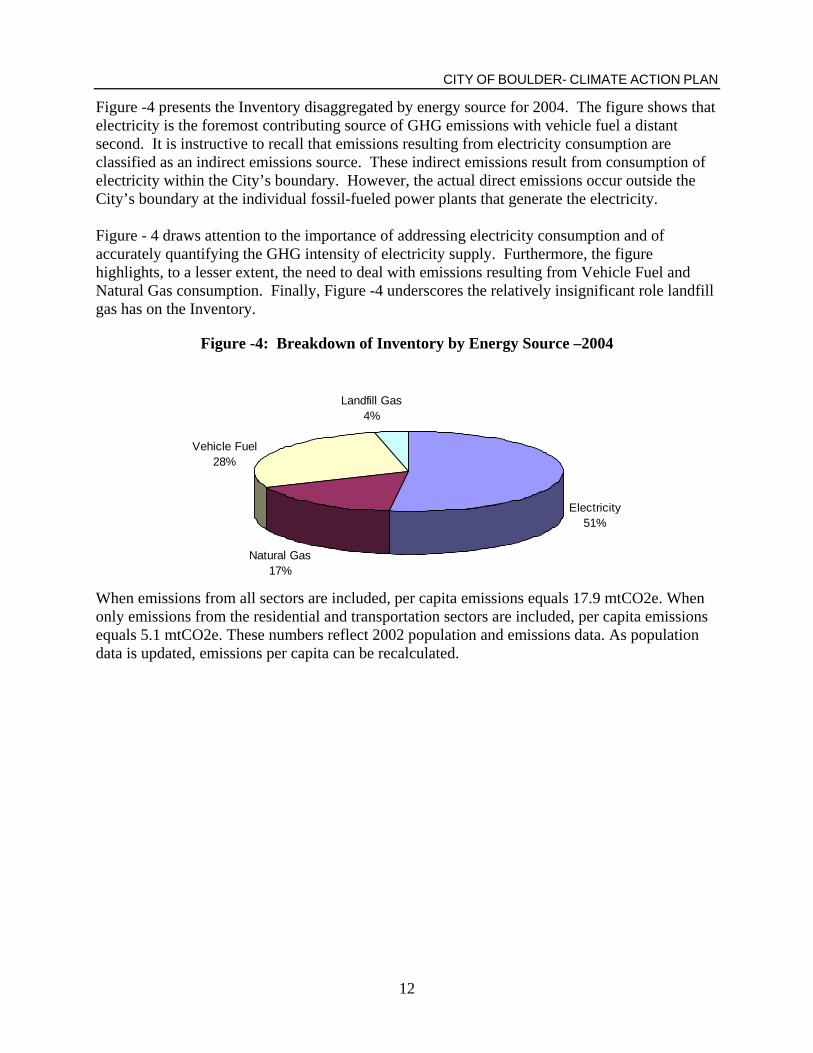
Figure -4 presents the Inventory disaggregated by energy source for 2004. The figure shows that electricity is the foremost contributing source of GHG emissions with vehicle fuel a distant second. It is instructive to recall that emissions resulting from electricity consumption are classified as an indirect emissions source. These indirect emissions result from consumption of electricity within the City’s boundary. However, the actual direct emissions occur outside the City’s boundary at the individual fossil-fueled power plants that generate the electricity. Figure - 4 draws attention to the importance of addressing electricity consumption and of accurately quantifying the GHG intensity of electricity supply. Furthermore, the figure highlights, to a lesser extent, the need to deal with emissions resulting from Vehicle Fuel and Natural Gas consumption. Finally, Figure -4 underscores the relatively insignificant role landfill gas has on the Inventory.
Figure -4: Breakdown of Inventory by Energy Source –2004
Electricity51%
Natural Gas17%
Vehicle Fuel28%
Landfill Gas4%
When emissions from all sectors are included, per capita emissions equals 17.9 mtCO2e. When only emissions from the residential and transportation sectors are included, per capita emissions equals 5.1 mtCO2e. These numbers reflect 2002 population and emissions data. As population data is updated, emissions per capita can be recalculated.
12

CITY OF BOULDER- CLIMATE ACTION PLAN
Section IV: The Climate Action Plan In April 2004, City Council directed staff in the Office of Environmental Affairs to develop an action plan to serve as a roadmap to Boulder’s Kyoto goal. The Climate Action Plan (Plan) is the guiding document and planning tool for achieving the Goal. The Plan provides a framework to compare and analyze alternative strategies and policies, in order to facilitate Council’s review and the decision-making process. The Plan includes baseline data and emissions reduction strategies for all sectors. It should be noted that the Plan is continuously evolving in response to new information, legislation, opportunities, and public input, but will establish a foundation for future work. The Implementation Plan that accompanies the Climate Action Plan outlines recommended actions, progress indicators, and the estimated costs and emissions reduction. It will be updated annually as part of the budget process. Similarly, staff will continue to prepare annual progress reports that will track program results and emissions. The Climate Action Plan is similar to master plans developed by other city departments. Master plans typically establish detailed policies, priorities, strategies, service standards, facility and system needs and capital budgeting for the delivery of specific services and infrastructure. Master plans include short and long term implementation strategies and a financing plan. Current funding for 2006 is at the fiscally constrained level. Reaching the Goal represents an action level; the vision level has not yet been determined. The Climate Action Plan will likely be incorporated into a larger strategic plan for the Office of Environmental Affairs expected by the end of 2007. The Office of Environmental Affairs is engaging in community dialogue about the emissions reduction goal and potential energy programs. A strategy group was formed to discuss overarching strategies and implications for achieving the goal and to provide recommendations to Council. The Strategy Group was expanded and re-named the Climate Action Plan Committee (CAPC) in January 2006. This group reviewed, discussed and provided input on funding strategies, public process, and the draft Plan. Tactical groups are convened to discuss programmatic details and offer comments of staff work. The Plan and funding options were presented to a variety of stakeholder groups including the Environmental Advisory Board, Chamber of Commerce Board of Directors, Boulder Tomorrow, and City Council. A public meeting in May 2006 formally presented the Plan and funding options to the broader public. Additional public process will continue in the future to keep the public informed of key decisions and changes to the Plan. a. Funding For 2005 and 2006, the greenhouse gas emissions work plan is funded by a two-year increase in the Trash Tax. The Trash Tax is an occupation tax on the trash haulers in Boulder, which is based on the amount of trash they collect in the city limits. Most trash haulers choose to pass this tax on to their customers as a line-item expense on their trash bills. It is a tax on the amount of trash being generated. Historically, Trash Tax revenues have been used for waste reduction programs and related personnel expenses. For 2005 and 2006, $258,000 a year has been allocated for GHG programs, for a two year total of $516,000. The annual budget is to be spent approximately as follows:
13

CITY OF BOULDER- CLIMATE ACTION PLAN
Commercial energy efficiency programs $ 65,000 Residential energy efficiency programs $ 50,000 Develop long-term funding and policy options $ 45,000 Workshops, outreach and marketing $ 15,000 Public process, technical and peer review $ 8,000
Greenhouse gas inventory tracking system $ 5,000 1.5 fixed term staff $ 70,000
The work plan currently has one full-time fixed-term employee dedicated to commercial and residential planning and programs, renewable energy, and research and one full-time employee spending 75% of time on general oversight, policy development and community relations. Staff hired an Environmental Outreach Specialist in early 2006 to coordinate residential energy and waste reduction outreach. Additional staff is proposed for 2007 and beyond. The city is in the process of researching and developing long term funding sources to fund implementation of the Plan. In May 2005, staff hired a consultant team (the Team) to identify and analyze potential funding sources to fund implementation of the Climate Action Plan at a level of roughly $1 to 3 million.7 Annual cost estimates are discussed in the Implementation Plan. The Team identified thirteen potential revenue sources that meet general criteria established by staff and were based in part on Council discussions in 2004. City staff identified the five options listed below as having the greatest potential for successful implementation. Many of the options can be used together to generate the required funds. Council members were supportive of conducting additional research on all of the five options.
Establish an Energy Efficiency and Renewable Energy (EERE) enterprise and fee; Create an annual Vehicle Sticker Fee; Extend the Trash Tax; Create a Renewable Energy Mitigation Program/Renewable Energy Mitigation Fund; and Increase the Development Excise Tax.
The options are explained in greater detail in the Team Report and are presented in a matrix format that shows legal and administrative considerations, precedent in other locations, revenue potential, nexus to GHG emissions, and whether voter approval is required. All options require further research and evaluation before implementation. As options are thoroughly researched, they will be evaluated using more specific criteria, such as revenue potential, economic impacts on all sectors and social equity concerns. Staff returned to Council in the second quarter of 2006 with additional information and recommendations on three funding options to further investigate. 7 Team members included:
• Heidi VanGenderen, Project Director and Senior Associate of the Wirth Chair in Environmental and Community Development Policy at the Graduate School of Public Affairs of the University of Colorado Denver and Health Sciences Center
• Bill Abolt, Chicago Office Director, and Erin Daughton, Senior Researcher, Shaw Environmental and Infrastructure, Inc.
• Phoebe Selden, Senior Vice President, Scott Balice Strategies • Henry Henderson, Principal, Policy Solutions Ltd. • Christopher Juniper, Vice President, Natural Capitalism Solutions
14

CITY OF BOULDER- CLIMATE ACTION PLAN
Council agreed with staff’s recommendations and authorized staff to pursue the options for inclusion in the 2007 budget process. The three options being pursued are an energy use/carbon fee, square footage fee, and extension of the Trash Tax increase. A final Council decision on funding sources and acceptance of the Plan is anticipated in June 2006. b. Cost Estimates Analysis completed after the consultants’ funding source evaluation estimates the annual total budget required to achieve the necessary reductions to range from $860,265 in 2007 to $1.98 million in 2012. Significant funding for renewable energy purchases may be required in 2012, thereby doubling the amount of funds needed in 2012, as compared to the average of the 2007 to 2011 annual budgets8.
Summary of Annual Budget Requirements
Annual City Costs 2007 2008 2009 2010 2011 2012 TOTALEnergy efficiency $488,828 $499,992 $545,941 $575,031 $598,888 $623,999 $3,332,678Renewable energy $56,438 $69,292 $81,712 $96,050 $110,385 $125,481 $539,357Transportation $70,875 $77,910 $83,813 $91,413 $98,559 $106,278 $528,848Education and Marketing $202,125 $177,194 $185,878 $197,773 $208,110 $219,116 $1,190,196Admin $42,000 $0 $0 $0 $0 $0 $42,000Total $860,265 $824,389 $897,344 $960,267 $1,015,941 $1,074,873 $5,633,080
*Costs have inflation factored in and do not include funds for city operation projects. This budget does not reflect a large renewable energy purchase in 2012.
The Kyoto Resolution established a policy to take cost-effective actions to reduce GHG emissions. The cost-effectiveness of the various strategies depends on whose costs and savings are being evaluated. In general, the city recommends actions to the community that produce benefits equal to or exceeding the implementation costs. A variety of energy efficiency improvements would meet this definition of cost-effectiveness. The costs to the city of encouraging residents and businesses to take these actions are variable. Pilot programs have been helpful in determining which programs get the best “bang for the buck” for the city’s investment. The city also supports renewable energy purchases, because emissions reductions can be achieved at a relatively low $/ mtCO2e. As such, cost-effective can have two meanings— one for the city that refers to good "bang for the buck" in terms on GHG reductions and another for those who reap the benefits of reduced energy and maintenance costs. The annual budget cost estimates depend on a number of factors. First, staff knows that significant education and outreach is required for households and businesses to implement energy efficiency and renewable energy measures. It is difficult to estimate the level of outreach required to maximize voluntary action in the community. As energy prices increase, more people may take efficiency actions on their own. Similarly, federal or state legislation or incentives may be introduced that make energy efficiency and renewable more cost-effective. Secondly, Xcel Energy has not finalized its 2007 through 2013 rebate programs for which $196 8 On August 29th, 2006, Boulder City Council selected a revenue structure that does not include a large renewable energy purchase in 2012 which was originally proposed as a part of the Climate Action Plan. As a result, the budget for 2012 in the Climate Action Plan has been revised and does not reflect the purchase of a large amount of renewable energy.
15

CITY OF BOULDER- CLIMATE ACTION PLAN
million is budgeted. These rebates will change over time, making private and public sector costs difficult to estimate into the future. Finally, cost estimates depend on what options are chosen to bring the community to the Goal. Different options require different levels of investment. For example, implementing a wide array of energy efficiency measures would require significant amounts of capital, but also produces a return on investment, creates jobs, and institutes long term improvements in the built environment. However, energy efficiency alone is not enough to reach the Goal. In contrast, the city and community could choose to purchase renewable energy credits or carbon credits as the primary strategy to achieve the necessary reductions. These options likely requires less capital investment, but do not affect people’s behavior or make lasting improvements to Boulder’s buildings. Building a wind farm would require significant capital and time investment for a relatively small contribution toward the Kyoto Goal. However, it is possible that investing in wind infrastructure would receive wide pubic support and may be a logical and exciting part of a longer term plan. Staff will continue to explore this option. The city could also choose regulatory approaches that cost relatively little to implement and achieve full market penetration. While no regulatory strategies are being proposed for immediate implementation, City Council and the Climate Action Plan Committee have recommended that the options presented in the Plan be considered in the future. It is likely that a combination of these options will be needed. This Plan, as well as the Implementation Plan, attempts to guide staff in developing the appropriate mix of strategies and investments.
16

CITY OF BOULDER- CLIMATE ACTION PLAN
SECTION V: Boulder’s Emissions Reduction Strategies
• Increase efficiency • Switch to renewable
energy and vehicle fuels• Reduce vehicle miles
traveled
This plan will highlight potential strategies for reducing emissions in all sectors and list current activities. Broadly, the primary strategies for reaching the Goal are to increase energy efficiency (i.e. reduce use), shift to renewable fuel sources in buildings and vehicles, and reduce vehicle miles traveled. These strategies are elaborated on in the list below. All programs and initiatives will be designed to reflect the overarching strategies.
Increase residential, commercial, and industrial energy efficiency; Increase community-wide renewable energy purchases and installations; Reduce vehicle miles traveled, purchase more efficient vehicles, and switch to low
carbon fuels; Utilize external funding, such as Xcel Energy rebates and federal tax incentives, when
possible; and Provide community education and outreach to increase awareness of energy and climate
issues and the Goal and to reduce barriers to voluntary action. The GHG emissions reduction efforts will endeavor to adhere to the following guiding principles:
Complement other city policies and initiatives, including the BVCP and Transportation Master Plan;
Balance cost burden across the sectors; Serve low income and underrepresented populations, such as the elderly and non-English
speaking households; Initiate activities where benefits exceed the costs; and Engage in strategic partnerships wherever possible.
a. Energy Efficiency Strategies to Reduce Emissions
Energy efficiency is the primary strategy for reducing emissions in the commercial, industrial, and residential sectors. Energy efficiency provides a solid return on investment, makes lasting improvements to the comfort, reliability, and marketability of Boulder’s building stock, and reduces emissions at the power plant. It also has the potential to create new jobs, strengthen the local energy services industry and to increase direct and indirect sales tax revenue, thereby complementing the city’s economic vitality efforts. Similarly, energy efficiency programs targeting lower income households can often serve as social programs by lowering energy costs
17

CITY OF BOULDER- CLIMATE ACTION PLAN
and the percentage of income spent on energy bills. There is also significant outside funding available, such as Xcel’s rebates, to support energy efficiency. It is important to note that while investments in energy efficiency often have quick paybacks and improve the comfort of buildings, market barriers exist that limit the installation of efficiency measures. Market barriers include but are not limited to information and transaction costs, performance uncertainties, product or service unavailability, and split incentives.9 In other words, though it very often makes financial sense to invest in energy efficiency, there are reasons and factors why people don’t invest. The city’s programs will be designed to overcome these market barriers and realize higher market penetration rates than otherwise would have been achieved absent the city’s involvement. The following strategies represent possible actions that the city could choose to pursue. Public input may be encouraged for particular activities or programs.
i. Commercial Sector
Energy use in commercial buildings, excluding the University of Colorado, accounts for approximately one-third of total community GHG emissions. Characteristics of this sector are summarized below:
• 1,600+ commercial buildings • 30 million square feet • 74 % of commercial space broadly defined as offices • Majority of office buildings built before 1990 • Annual electricity use exceeds 500 million kilowatt hours • Annual natural gas use exceeds 1 million decatherms • Annual GHG emissions exceed 550,000 metric tons of CO2
New commercial development is predominantly in-fill and redevelopment, such as the redevelopment of Crossroads Mall into the 29th Street retail district. City staff is currently evaluating the commercial building code to determine how it compares to the LEED standard and what incentives would be needed to increase the performance of new buildings. External programs serving the new commercial buildings sector include Xcel’s equipment rebates for new construction and the Energy Design Assistance program. Existing Activities
• Partners for A Clean Environment Program • Building Performance with ENERGY STAR Program (BPwES)
The above programs offer technical assistance to small, medium, and large businesses. The primary goals of the PACE program are to minimize the use of hazardous materials, decrease 9 Eto, J., Prahl, R., Schlegel, J. “A Scoping Study on Energy-Efficiency Market Transformation by California Utility DSM Programs.” July 1996.
18

CITY OF BOULDER- CLIMATE ACTION PLAN
waste, and efficiently use resources, including water, paper, and energy across a variety of sectors. The BPwES program has provided benchmarking, water and energy audits, and technical assistance to over twenty-five local mid-sized businesses, focusing on office buildings. The audit reports indicate that average electricity savings of 20% can be achieved through energy efficiency measures with paybacks of less than three years. Overarching Strategies Energy efficiency is anticipated to be the most palatable investment strategy to the commercial sector and have the most long term potential for market transformation, as compared to renewable energy. As previously mentioned, energy efficiency provides a solid return on investment, makes lasting improvements to the building stock, and can improve the local energy services industry and overall economic vitality. Energy efficiency is also a key component of green building, which is a rapidly growing industry. Despite the return on investment of many energy efficiency measures, there are significant market barriers to achieving widespread market penetration. Examples of barriers include information or transaction costs, misplaced or split incentives, performance uncertainties, and access to financing. The program should attempt to address and overcome market barriers and produce market effects. Potential market effects may include contractor promotion of high efficiency equipment, changes in dealer stocking practices, tenant pressure to include energy performance measures in leases, increase in builders and architects incorporating energy efficiency, and reduced incremental costs of energy efficiency products and services. In summary, the primary strategies for increasing efficiency in the commercial sector are the following:
• Collaborate with all actors that influence building performance; • Promote local energy service providers, including contractors, ESCOs, architects,
auditing and recommissioning companies; • Maximize participation in Xcel Energy’s rebate program; • Provide services currently not offered in the Boulder market that will address market
barriers; and • Provide meaningful ways for business and building owners to be recognized for their
achievements in energy efficiency. The program should involve all actors that influence building performance, including builders, architects, engineers, contractors, urban foresters, manufacturers and product distributors, realty, financial, and insurance industries, tenants and building owners. Partnerships with non-profits, the county and state, and other organizations should be explored. For example, the city should reach out to non-profits to help them save energy and money and use them to educate their clients about energy issues. The program should also capitalize on increasing interest in green building The program will strive to maximize participation in Xcel Energy’s demand side management and energy conservation programs to best leverage the available funds. Xcel is authorized to spend up to $196 million through 2013 on energy efficiency programs. Staff is participating in discussions with Xcel Energy to encourage Xcel to offer workshops and actively market its
19

CITY OF BOULDER- CLIMATE ACTION PLAN
programs and services in Boulder. The city’s programs will strive not to duplicate Xcel’s efforts or compete with local contractors and energy service companies. The city may choose to offer incentives or services not offered by Xcel or other service providers. It is instructive to note that no Boulder contractors and presumably few Boulder businesses had taken advantage of Xcel’s rebate programs prior to the city’s program. Similarly, the city should explore offering incentives to developers and property owners planning new construction or major remodels to encourage them to make the buildings far more efficient than code. Sample incentives include an expedited permitting process, planning and permitting fee waivers, and property tax rebates or waivers. Xcel Energy has the Energy Design Assistance program, which provides free energy consulting, energy modeling, and LEED services, as well as equipment rebates. The city has recommended that Xcel offer additional incentives for projects that take a more comprehensive or systems approach and incorporate multiple efficiency measures. Regardless of whether Xcel offers the bonus incentive, the city plans to promote whole-building, systems approaches to energy efficiency, as opposed to focusing solely on lighting or other single measures. The comprehensive approach may increase the likelihood that less cost-effective measures get implemented. ESCOs may be key to implementing broader packages of energy efficiency measures, as they typically have the resources to address all building systems. Potential Actions The following list includes potential options for facilitating energy efficiency in the commercial sector. The options would be part of the larger commercial program described later in this section. Most of the options are not direct incentives, such as additional rebates for energy efficient equipment, but are services or tools, which would be funded through the GHG annual budget. Recommended actions are detailed in Section VI: The Implementation Plan. Services
Provide free benchmarking services Provide free or subsidized energy (and water) audits Help businesses develop efficiency implementation plans Help businesses apply for utility rebates Provide upfront rebates for upgrades and collect Xcel rebate at project completion Help businesses receive bids from contractors Provide contract templates for common measures Standardize labor and material costs among participating contractors for common
measures Provide model leases that incorporate energy efficiency Establish procurement pool for electrical equipment Provide financial tools, like NOI Builder, to those considering energy upgrades Provide case studies and fact sheets Provide infrared imaging for buildings to identify places where energy is being wasted Provide free consulting regarding placement of trees to shade buildings
20

CITY OF BOULDER- CLIMATE ACTION PLAN
Training Provide contractor and technician training and certification Pay for facility managers of large energy users to attend Denver area technical trainings
and workshops Certify or pre-approve contractors for program participation Financing workshops (ESCOs, lenders, creative strategies) Technology workshops Benchmarking training
The programs should consist of elements that serve small and midsized businesses, commercial property owners, and possibly industrial and manufacturing facilities. The programs could take many different shapes, but will likely incorporate the elements described below. ENERGY STAR ENERGY STAR provides a range of tools and resources to help small, medium, and large businesses improve the energy efficiency of their businesses and buildings. ENERGY STAR is a federally-sponsored and supported program widely recognized by businesses and households. ENERGY STAR standards apply nationally and provide a uniform basis for comparing products and buildings. The city should develop a program that capitalizes on the ENERGY STAR name and national presence, but offers tangible local benefits and has a local identity. By aligning the program with ENERGY STAR, the city can take advantage of their tools, resources, campaigns, and national recognition framework. ENERGY STAR is also constantly developing new products and programs to address every sector.
Energy Audits The average energy audit of office buildings in Boulder identifies projects that can reduce electricity and natural gas use by 20% and 15%, respectively. Collectively, the recommended projects have paybacks less than three years. If every office building in Boulder reduced electricity and natural gas use by 20% and 15%, nearly 20% of the city’s goal would be achieved.
ENERGY STAR Benchmarking Benchmarking enables people to compare the general energy performance of a building against similar buildings in the region (using data from the Commercial Building Energy Consumption Survey (CBECS)). The process yields a 1-100 score that is generally a function of how the building operates and what energy efficiency features are present. The score makes energy consumption information easy to grasp for building owners, operators, and tenants. A 2005 California Energy Commission report endorses benchmarking, “as a means to motivate decision makers, usually building owners, to implement measures that will improve the energy efficiency of a building…Benchmarking is an initial step in a comprehensive efficiency upgrade program.”10 It is also referred to as an “entry point for other strategies,” such as re-commissioning and audits.11 Benchmarking is currently available for hotel/motels, offices, public buildings, schools, warehouses, medical facilities, and grocery stores. 10 “Options for Energy Efficiency in Existing Buildings.” California Energy Commission. July 2005. CEC-400-2005-039-SD, p.22. 11 ibid, p.24.
21
CITY OF BOULDER- CLIMATE ACTION PLAN
ENERGY STAR Partnership All businesses, particularly small businesses, are invited to become ENERGY STAR partners. Partners have access to a wide range of resources, including energy guide books, technical assistance hotline, fact sheets, and public relations materials. To become a partner, businesses agree to buy ENERGY STAR-certified equipment and upgrade the energy efficiency of their facility whenever financially viable. Energy Efficiency Technical Training and Workshops For the programs to be successful, contractors, building operators, property managers, and other energy-related service providers need to possess the skills necessary to understand and address buildings from a systems approach. A trained, highly-skilled workforce will help establish better confidence in energy efficiency technologies and services, which should help increase the demand for these products and services. These professionals can also help recruit participants to the programs and help maximize utility rebates, while strengthening their businesses. The California Energy Commission report recommends that training have a certification element and focus on re-commissioning services and HVAC systems, integrating a systems approach. For the city, it is likely not cost-effective or practical to establish a training facility for local technicians and professionals. Staff should explore currently-available programs offered in the Boulder-Denver area and online programs. The North American Technician Excellence (NATE) program is a nationally-recognized training and certification program for technicians in the heating, ventilation, air conditioning, and refrigeration industries. Currently, there are several training and testing facilities in the Denver and Fort Collins areas.12 The city could promote certification and encourage local technicians to receive certification. In addition, the Building Owners and Managers Association (BOMA) is launching a new program that will offer courses to property owners, managers, and operators on how to optimize equipment, buildings, and practices for energy efficiency. The city could arrange for these online classes and presentations to be shown free in Boulder. The city should hold informational workshops to raise awareness about the programs and services the city and Xcel Energy offer. Similarly, the city could sponsor local contractor and facility managers to attend local technical training workshops. Contributing to existing list serves or newsletters and speaking at routine meetings may be helpful in reaching contractors and technicians. One or two day trainings on efficiency best practices are also an option. The city could also work with existing trade organizations to incorporate energy efficiency content into their materials. How best to engage contractors working in Boulder should be discussed with contractor stakeholders. Commercial Leasing PracticesIt is estimated that over half of Boulder’s buildings are non-owner-occupied. This often creates a split incentive where the tenants are responsible for paying the energy bills, but don’t want to invest capital in someone else’s building. Conversely, building owners believe that improving the efficiency in tenant spaces where tenants pay the energy bills benefits only the tenant and does not provide a return on investment. Property owners don’t want to pay for what they can’t bill back to the tenant. An increasing amount of discussion is taking place in national real estate 12 http://www.natex.org/index.asp
22

CITY OF BOULDER- CLIMATE ACTION PLAN
and energy efficiency organizations to address this split incentive and encourage building owners to invest in energy efficiency. The city will work to develop solutions to this problem. There are three main types of commercial leases: net leases, gross leases, and fixed base leases. Net leases are the most common in Boulder. In net leases, the tenant is responsible for energy and other operating costs. Tenant space is either sub-metered or determined by a formula set in the lease. In gross leases, the owner is responsible for energy and operating costs. One strategy to address the split incentive is to try to move the market towards energy efficiency lease provisions and/or fixed base leases. Incorporating efficiency lease provisions may encourage building owners to upgrade their properties. For example, a benchmarking provision could be added to leases to require the building owner to benchmark the building once or twice a year and report the results to the tenants. The owner and tenant could also agree to share the upgrade expense in such a way that the tenant and owner benefit. For example, where tenants are responsible for energy costs, an owner pays for an efficiency upgrade and raises the rent by an amount below the energy savings. Thus, the tenant’s occupancy costs are lower and space improved, while the owner finances the project through the increased rent and increases the asset value of the building. There are tools available that offer varying levels of detail on the financial implications of building upgrades to tenants and owners. Additionally, staff should work with stakeholder organizations to make available a whole range of resources for owners and tenants, including model lease language, case studies, and the benefits of energy efficiency. In fixed base leases, the owner pays energy and operations expenses up to a fixed amount (an expense stop) and the tenant is responsible for anything over that amount. According to the California Energy Commission report, fixed based leases provide “the inventive for the owner to make efficiency upgrades, while limiting the risk if the tenants cause excessive energy consumption.”13 However, it may not always be clear how the benefits of efficiency projects are allocated under this arrangement. Model fixed base leases are available that incorporate leasing best practices for energy efficiency. Recognition Developing meaningful ways for business and building owners to be recognized is of paramount importance. The recognition scheme should create sustained positive publicity for winners or participants, possibly through annual awards, plaques and building labels, and repeated advertising. The city should also help them apply for national awards. The recognition should serve to promote energy efficient buildings and buildings with good energy management to potential tenants. Whatever promotion strategy is chosen, the city should dedicate adequate budget to having a solid recognition and marketing campaign. Regulatory Options The city could explore regulatory approaches to reducing emissions in the commercial sector. It is likely that regulatory options would be preceded by a pilot phase. No regulatory options are being proposed for 2007, but it is possible that regulatory options could be developed in out years if voluntary actions are not generating the required emissions reductions. Possible options are outlined below. 13California Energy Commission, p.29
23

CITY OF BOULDER- CLIMATE ACTION PLAN
• Require building benchmarking at time-of-sale, financing or re-financing events or other time period and the disclosure of ratings to tenants, buyers, lenders, and possibly the city.
• Require building benchmarking at time-of-sale, financing or re-financing events or other significant time period with the requirement that buildings reach an energy efficiency standard.
• Establish commercial sector procurement guidelines directing that all applicable electrical equipment be ENERGY STAR-rated.
• Adopt more stringent building codes that improve energy performance over standard codes, perhaps modeled after California’s Title 24.
It should be noted that there are other factors that will very likely increase the efficiency of commercial buildings over time. As mentioned earlier, increases in the price of energy may encourage more business and property owners to complete energy-saving upgrades. From 2005 to 2006, electricity prices increased by nine percent for larger commercial customers and eleven percent for small commercial customers. Similar rate increases were approved for 2006 to 2007. Improvements in federal efficiency standards for equipment, such as commercial HVAC and refrigeration systems, and the phase-out of less efficient equipment, such as T-12 lighting, will result in higher efficiency equipment being installed over time, compared to older and current standard equipment, with no incremental cost. Similarly, as new buildings are constructed and existing buildings are redeveloped and remodeled, they become subject to revised building codes and eligible for utility design assistance programs and whatever incentive programs the city’s Planning and Development Services may offer, which will help achieve higher levels of efficiency. Technological advances and market transformation may also lower the cost of some energy-saving products and services. Costs It is assumed that over 95% of the costs to improve efficiency in the commercial, industrial and residential sectors will be borne by the private sector and Xcel Energy. It is anticipated that Xcel rebates will cover between 25% and 50% of the implementation cost of efficiency measures. Very little city investment will be required. City investment will be directed towards channeling as much of the available rebate funds as possible into the Boulder community, in order to reduce private expenditures and achieve high participation rates. Staff will promote Xcel’s programs by engaging local contractors, vendors, and building professionals and by offering assistance and a variety of services to local property and business owners. Ultimately, staff anticipates facilitating growth in the energy services market to reduce the level of services required of the city. The city will not compete with local contractors or other energy service providers. It is important to note that if the city municipalizes, it is anticipated that the city would need to offer incentives and services similar to those offered by Xcel. Staff and a review group of local experts determined that reducing electricity use by 20 percent and natural gas use by five percent in approximately a third of existing commercial building space is a reasonable and achievable metric to use for planning purposes. Audit reports from the Building Performance with ENERGY STAR program support this by showing an average
24

CITY OF BOULDER- CLIMATE ACTION PLAN
electricity and natural gas savings of 20 percent and 15 percent, respectively.14 This level of energy reductions would require private sector investment of roughly $27 million by 2012. Xcel’s costs for this level of reductions are estimated to be $9 million. Estimated lifetime energy cost savings for the measures are $39 million, in 2006 dollars, assuming no increase in energy prices. Public sector costs will be for personnel and program expenses and are detailed in the Implementation Plan. It is expected that the commercial programs will require one dedicated full time employee and annual program budgets for total annual public sector costs of approximately $177,319 in 2007 to $298,489 in 2012, excluding personnel expenses.
ii. Industrial Sector
Boulder’s industrial sector is comprised of roughly thirteen large energy users comprising over nine million square feet. The square footage includes federal labs, manufacturers, printers, and research centers, as well as service stations and auto repair shops. The Industrial sector produced 15% of the City’s GHG emissions in 2004. The industrial inventory profile indicates that emissions will decrease from 317 thousand to 211 thousand metric tons of carbon dioxide equivalent, a decrease of 34% during the 1990 – 2012 period. The reason for the decrease is the significant decline of electricity consumption during the 1996 -2000 period. Electricity consumption has a primary role has on the sector’s inventory and highlights the importance of electric energy efficiency on meeting the sector target. Many of the larger facilities have a dedicated facility or operations manager to manage and direct facility or plant operations. Typically facility managers are responsible for managing construction projects, maintenance projects, equipment procurement, and ensuring that the facility is operating efficiently to reduce costs. The emphasis placed on energy optimization and skills in identifying efficiency opportunities varies with individual managers and across companies. Currently, there are external resources available to assist the industrial sector in reducing energy consumption. The primary resources include EPA’s Climate Leaders Program, Colorado State University’s Industrial Assessment Center, Xcel Energy’s DSM programs, and the Department of Energy’s (DOE) Industrial Technology Program, Federal Energy Management Program, Building Technologies Program, and other informational resources. The Partners for A Clean Environment (PACE) Program has also developed relationships with manufacturers and printers in Boulder County. PACE offers assistance to identify, evaluate, and implement pollution prevention and energy efficiency opportunities that will improve process efficiency and increase profits. Businesses that meet specific criteria established by PACE are certified as PACE Partners.
14 Because there are relatively few data points, staff assumed 5% natural gas savings in the analysis. This is likely conservative.
25

CITY OF BOULDER- CLIMATE ACTION PLAN
Overarching Strategies
Local Climate Leaders The EPA’s Climate Leaders program helps companies manage GHG emissions. Member companies with Boulder operations include: • Ball Corporation • Bank of America Corporation • IBM Corporation • Marriot Hotels • Roche • Target Corporation
It has been noted that the industrial sector is generally already attempting to reduce its energy consumption, due to energy’s significant impact on the bottom line. Additionally, the largest energy users have an account manager at Xcel to help them manage their energy use. Xcel said that they have instructed their account managers to more actively promote the rebate programs. The table to the right lists Boulder’s Climate Leaders, which are working with the EPA to reduce GHG emissions. In summary, the primary strategies for increasing efficiency in the commercial sector are the following:
• Engage industrial users to better understand their needs; • Maximize participation in Xcel Energy’s rebate program; • Connect industrial users with external resources; and • Support skill development for facility and operations managers.
The city should help industrial sector businesses take full advantage of the external resources available to them, including the rebates. The Xcel Recommissioning program may be particularly relevant and beneficial. Because of the breadth of informational and financial resources available, it is anticipated that the city will be more of a facilitator than implementer of programs and financial incentives. The city will work with the industrial sector to raise awareness of the city’s GHG goal and the sector’s contribution to total emissions, better understand the sector’s needs and barriers to efficiency, and provide assistance on connecting with existing programs and resources. Potential Actions Programs will be based on the needs expressed by representatives of the industrial sector. It is possible that the PACE Program could be expanded to better address industrial energy issues. Creating an industrial users group to share expertise, successes, and lessons learned may be an appropriate way to reach this sector. Workshops, newsletters and/or half year meetings are ways to remain in contact with industrial sector members.
iii. Residential Sector
Energy use in Boulder’s residential buildings accounts for 17% of total GHG emissions, contributing over 310,000 mtCO2e. The sector has the following characteristics:
• Approximately 35,000 residential buildings, including single and multi-family dwellings; • Over 70 million square feet; • Many homes built before the 1980’s; • Roughly half of housing units are rental properties; • Approximately 45% of Boulder’s residents live in single family, detached residences;
26
CITY OF BOULDER- CLIMATE ACTION PLAN
• It is estimated that Boulder homeowners typically occupy a home between five and six years before selling;
• Annual electricity use exceeds 237 million kilowatt-hours; and • Annual natural gas use exceeds 2.1 million decatherms.
Based on the result of 750 resident surveys, it is estimated that approximately a third of the homes in Boulder have central air conditioning, 15-25% have secondary refrigerators, and most have basic home appliances, such as washer, dryer, and dishwasher. Another survey indicated that roughly 30% of primary and secondary refrigerators are more than ten years old. The residential sector annually consumes around 240 million kWh and over two million decatherms of natural gas, emitting over 200,000 metric tons of CO2 a year. Existing Activities
• Weatherization Program • October Energy Awareness Month • Home Performance with ENERGY STAR (HPwES) • Green Points Program • Community Surveys • Tree Planting and Maintenance Programs through the Parks and Recreation Urban
Forestry Section Many of the existing residential energy programs also serve as social programs. Free weatherization is available to low-income households and households slightly above the low income qualification. It is estimated that weatherized homes will save the residents 20-25% on annual energy costs. In 2005, the five homes that received new, 90+% efficient furnaces are saving an average of 50% on their heating costs. HPwES can also be considered a weatherization program, but it is intended for higher income households. The city also gives out free compact fluorescent light bulbs during October Energy Awareness Month and throughout the year. Each light bulb saves about $5 on electricity costs. The Green Points Program is the residential building ordinance and was conceived as a mechanism for encouraging the overall social, economic and environmental good of constructing new and remodeled homes with minimal negative environmental consequences over the life of the structures. Green Points are awarded when beyond-code improvements are implemented. Overarching Strategies The primary strategies for increasing energy efficiency in the residential sector include using marketing, and reduce GHG emissions. The primary strategies for increasing efficiency in the commercial sector are the following:
• Use marketing, education and outreach to motivate residents to implement energy efficiency measures in their homes; and
• Promote Xcel’s residential rebate programs. Climate change is increasingly becoming an issue that resonates with the general public nationwide as something that should be addressed. A recent poll of 812 people by the University of Maryland’s Program on International Policy Attitudes (PIPA), found that ''virtually all
27

CITY OF BOULDER- CLIMATE ACTION PLAN
respondents – 94 percent – said the U.S. should limit its greenhouse gases at least as much as the other developed countries do on average.” In addition, 75 percent said that global warming requires action and only 21 percent opposed any steps with economic costs. Similarly, energy issues, including rising energy costs, concern over peak oil, the environmental and human costs of coal mining, and the advance of renewable energy technologies make an almost daily appearance in mainstream media. In the 2005 heating season, Xcel Energy customers paid significantly more for electricity and natural gas than they were in 2004. As a result, requests for weatherization and bill assistance services are increasing and more attention is being paid to increasing home energy efficiency. Additionally, interest in green building is rapidly growing, which has energy efficiency as one of its key components, as well as renewable energy. The energy efficiency and green building programs should be dovetailed wherever possible. One of the key strategies that the city can employ to increase efficiency and reduce local GHG emissions is to leverage these attitudes to encourage residents to take voluntary action at home. Fundamental to this effort is the ability to link one’s personal actions, such as driving, buying appliances, recycling to climate change and energy sustainability. The goal is to make this link ubiquitous in the Boulder community, such that there is a constant reminder that climate action, or community and global stewardship in general, is in a large part the responsibility of individuals. To help demonstrate the link, the city should endeavor to “brand” the issue of greenhouse gas emissions reduction or energy sustainability by developing not only a logo and a tag line, but also a set of principles that lie behind them. This brand could then be leveraged as a symbol of the community’s climate or energy efforts, reminding residents of the availability of daily options and establishing the connection between the many different contributors to climate change. The city should work with a marketing firm to develop the brand, website, and a strategy for promoting and disseminating it throughout the community. Potential Actions The programs should address owners and tenants of single and multi-family residences, recognizing that programs may have to be tailored according to the ownership status of dwellings and to the number of tenants within a building. It is expected that single-family home owners will likely be the easiest to reach and the most likely to implement energy efficiency measures. In contrast, rental property owners, particularly of multi-family units, are expected to be the hardest to reach. The program should also address Boulder’s low income, senior, and affordable housing properties. ENERGY STAR The ENERGY STAR program has many resources for the residential sector. ENERGY STAR is perhaps most well-known as a label for high efficiency products, such as refrigerators, air conditioners, furnaces, light bulbs, office and home electronics equipment, and much more. Products with the label are guaranteed to meet strict energy efficiency standards that are usually 10-15% higher than baseline standards. The label easily identifies high efficiency products to
28

CITY OF BOULDER- CLIMATE ACTION PLAN
consumers. The city could work with local retailers to further promote these products and provide links to ENERGY STAR’s product locator and buyer’s guide from the website. Home Performance with ENERGY STAR (HPwES) is a national EPA program designed to create local markets for home energy efficiency renovations that incorporate a whole house diagnostic approach. The whole house approach uses advanced diagnostic equipment such as blower-door tests and infrared cameras to determine where and how the building loses energy. The HPwES program trains local contractors on how to employ the whole house approach and how to market the approach to increase the market share of this type of service. ENERGY STAR provides marketing materials, technical assistance, and brand recognition, while local government, utilities, or other organizations provide the contractor training. ENERGY STAR also labels new and existing homes. This is a performance based labeling system that benchmarks a home’s energy performance against existing standards, such that “ENERGY STAR qualified homes are independently verified to be at least 30% more energy efficient than homes built to the 1993 national Model Energy Code or 15% more efficient than state energy code, whichever is more rigorous.” This program would be voluntary, and the city’s role would be to facilitate the certification by providing a listing of qualified certifiers, and by marketing the program to homeowners. Additionally, the city could offer a financial incentive to share the cost of the audit and certification with the homeowner, as well as facilitate the improvements necessary to earn the ENERGY STAR rating (e.g. by assisting homeowners with Xcel DSM rebates). An example of a similar program is offered by the city of Portland, where residents can call to schedule a home energy “review” and receive personalized recommendations on home energy saving measures. In addition, raters will install, free of charge, up to 10 CFLs, as well a provide information on rebates, low-interest financing, and tax credit assistance.15
General Education and Outreach The marketing and outreach effort should use two primary delivery channels: 1) Mass Market, and 2) Direct Outreach. Mass Market efforts include website development, newspaper print advertising, brochures, press releases, bill inserts, information hotline and direct mail. Direct Outreach tasks include sponsorship and booth staffing at community events and energy efficiency presentations to key community leaders, neighborhoods and special interest groups, including home owners associations and landlord groups. Outreach may take many different shapes, but will likely incorporate the elements outlined below. A. Website development. Develop the website into a tool for residents to reduce energy use and GHG emissions. The web site would include background information, instructions on how to receive rebates and federal tax credits, a home energy and GHG calculator, and links to other resources.
15 http://www.sustainableportland.org/energy_res_resources.html
29
CITY OF BOULDER- CLIMATE ACTION PLAN
B. Local Newspapers Promote energy and climate change awareness through a regular appearance in one or more of the local newspapers. The form of the appearance would depend on the willingness of the editorial board to participate, but possible ideas are:
a) a regular (weekly, bi-monthly) column written by staff or a local energy/GHG expert, b) case studies of local homes and households that have reduced emissions by a large
percent and success stories such as the house or household of the week.
C. Energy Efficiency Starter Kits or Conservation Kits A technique the city can use to educate residents about energy efficiency is to distribute free energy efficiency starter kits to interested individuals and groups or wherever city staff are communicating with the public (farmers market, community meetings, etc.). The starter kit could be a collection of information and simple energy efficiency measures, such as CFLs, low flow showerheads (< 1.5 gpm), and faucet aerators, along with information on the actions residents can take and how to go about taking them (e.g. how to sign up for wind power, how to plant trees for electricity savings, or how to take advantage of and apply for Xcel rebates). In terms of results, it is assumed that a minimum savings is achieved by using the two CFLs and one low flow showerhead, this would amount to about 600 lbs of CO2e reduced per year per kit.16 But if the desired carryover effect of learning about energy efficiency is taken into account, the results are potentially much higher. Organizing neighborhood sweeps to distribute and install kits is also an option. Direct installation programs combine energy efficiency and energy education to provide participants with immediate energy savings and information on how to save energy with additional measures and actions. Direct install programs have been used in a few states to install simple and cost-effective energy efficiency measures in low-income households. These programs can be implemented through a “neighborhood sweep” approach or incorporated into audit and weatherization programs. Kits cost between $10 and $60 including any labor costs. Depending on the climate and the measures provided, customers save between 100 and 1,200 kWh annually, as well as natural gas and water savings totaling $15 to $125 per household per year. D. Outreach to Boulder Schools Working with Boulder schools to add energy and GHG activities and information to their curriculum can be one of the most effective ways of reaching all sectors of the general public. The city could work with school administrators, principals, and teachers to coordinate energy related events, contests, demonstrations, and assignments for all levels of K-12 Boulder schools. The city could also leverage the support of the Colorado Energy Science Center, which already conducts energy-related school outreach.
16 Based on the Rocky Mountain Institute’s estimate of measure by measure reductions. They assume 370 lbs CO2e for a low flow showerhead and 94 lbs CO2e for each CFL. www.rmi.org/sitepages/pid341.php
30

CITY OF BOULDER- CLIMATE ACTION PLAN
E. High Profile Events and Community Recognition In order to create a buzz around the issues of energy and climate change and to generate interest in taking personal action to reduce energy use and GHG emissions, the city, along with local partner organizations, could organize events and provide recognition to those in the community taking a leadership role. The city should seek to create at least one dedicated energy/GHG event per year. The city should also seek to piggyback on existing events such as the Boulder Creek Festival, CU sporting events, Solar and Green Home Week, Arbor Day, etc. Xcel’s DSM Incentive and Tax Credit Promotion and Facilitation One of the driving forces behind the city’s residential energy efficiency effort will be the incentives and rebates made available through Xcel’s DSM programs. It is expected that these will involve rebates for lighting, HVAC system upgrades, and evaporative cooling.17 Although Xcel has not yet announced their updated residential DSM programs, the city will develop an outreach campaign designed to maximize the amount of DSM funding used by city residents for energy efficiency improvements. The city will also promote available federal tax credits available through the Federal Energy Policy Act of 2005. An outreach campaign may use utility bill inserts, website, brochures, and other means of communication. Energy Efficiency Training and Workshops This option offers training and informational workshops to various key players in the residential sector, including builders, contractors, real estate agents, architects, designers, apartment building owners, rental property owners, landscaper/arborists, and homeowners. Workshops could educate people on best practices for efficiency, how to identify and evaluate efficiency measures, green building and other topics. The city should partner with other organizations currently offering workshops, such as Colorado Energy Science Center, the Center for Resource Conservation, and the Boulder Green Building Guild. Incentive Programs Incentive programs are intended to encourage residents and businesses to change behaviors related to energy use and assist in market transformation. For example, the motivation behind distributing CFL’s is not just to achieve instant emissions reductions, but to introduce them to a product that they may continue to purchase and use in the future. Similarly, a refrigerator recycling program eliminates one fridge from use, but also may raise awareness of the high energy consumption of refrigerators and encourage the participant to use only one fridge well into the future, particularly when the primary refrigerator is replaced. The city’s motivation behind incentives differs from a utility’s motivation, which is generally only to reduce peak electricity demand when electricity is most expensive and scarce. A. Low or No Interest EE and RE Financing The city can provide—or work with local financing institutions to provide—low and/or no interest financing for the purchase or installation of energy efficiency measures or on-site renewable energy generation. This could operate similar to the Ft. Collins “Zilch” (Zero Interest Loans for Conservation Help) program, where no-interest loans are provided for a pre-defined list of home energy efficiency, water, and air quality improvement measures, such as insulation
17 Xcel’s DSM Roundtable Discussion Handout, June 10, 2005
31

CITY OF BOULDER- CLIMATE ACTION PLAN
installation. The city currently offers low-interest loans to low income residents for its rehabilitation program. B. Refrigerator Recycling This program would accelerate the removal of older refrigerators, which would have a significant energy impact, especially if a household has two or more refrigerators. This program would imitate, and, if possible, partner with, the Ft. Collins refrigerator recycling program. In the Ft. Collins program, the Ft Collins Utility has partnered with JACO Environmental to remove and recycle refrigerators or freezers between 10-27 ft3 of both residential and small commercial clients. The utility offers a $35 incentive to encourage customers to participate. In 2004, the program collected 700 appliances, saving 820 MWh of electricity and reducing GHG emissions by over 4,300 tons of CO2e, while JACO’s recycling process kept 98% of the appliance materials out of the landfill, while capturing and destroying the CFC refrigerant. Xcel Energy plans to offer this program and the city of Boulder will actively promote it. C. Home Energy Audit/Analysis One of the staple programs offered by other cities and utilities across the country, such as Portland, Austin, Tampa Bay, and others, is the home energy analysis/audit service. These programs pay for an energy technician to rate a house’s energy performance, looking for leaks, poor insulation, thermal bridges, inefficient equipment, lack of shade, etc. The result of this service is a report for the homeowner detailing how they can reduce their energy costs and improve the comfort of their homes. The report is intended to encourage homeowners to invest in energy efficiency. Some programs offer this as a stand alone service, while others combine it with the Home Performance with Energy Star program, in which the energy analysis is only the first step in a home energy retrofit. The program could be designed to include multifamily units. The city will work with local energy auditors and the Center for Resource Conservation (CRC) to explore this option. In 2006, CRC implemented a pilot energy audit program that the city helped support. D. Free Weatherization Services Another staple program offered by other cities is the low income weatherization program. Weatherization enables low-income families to permanently reduce their energy bills by making their homes more energy efficient. Nationally, weatherization reduces heating bills by an average of 31% and overall energy bills by $274 per year.18 Net savings for each home weatherized average 29.1 MMbtu/year.19 The Boulder County weatherization provider is Longs Peak Energy Conservation (LPEC). LPEC uses funds from the U.S. Department of Energy, Governor's Office of Energy Management and Conservation, LEAP, and Xcel Energy. In 2005, the city of Boulder provided funding to LPEC to extend the range of weatherization services to higher income bracket families. Going forward, the city could set a target of number of homes weatherized each year and increase the funding for median income families.
18 http://www.eere.energy.gov/weatherization/ 19 http://www.waptac.org/sp.asp?id=1437
32

CITY OF BOULDER- CLIMATE ACTION PLAN
E. Bulk Purchase and Installation Program It is recognized that many homes in south Boulder lack proper insulation. The city could work with an insulation manufacturer and local contractors to install insulation in entire neighborhoods on a home-to-home basis. It would be similar to the neighborhood sweep program outlined above. There is precedent for this kind of program, such as in Minneapolis, where mass insulation projects were implemented in areas around airports to reduce noise pollution in homes. F. CFL and Other Product Giveaways The city has handed out over 3,000 CFLs since January 2004. This program has been very well received by the public, many of whom call staff with comments that they are very satisfied with the bulb and will continue to use CFLs in the future. The city is planning to expand this program by conducting neighborhood sweeps, where hired teams will canvas neighborhoods distributing and installing CFLs, low-flow showerheads, education material and educating people on making adjustments to thermostats, refrigerators, and hot water heaters. Voluntary Codes and Standards Voluntary codes and standards are intended to provide recognition and a non-financial incentive to those that go above and beyond standard practices. The higher voluntary codes and standards also educate people on better energy practices and provide case studies of successful implementation. A. Green Points Upgrade – Voluntary Recognition. The program could be expanded such that buildings could receive more than just a pass/fail grade. Rather, if a building earns a given number of energy efficient points by implementing a given number of energy efficient measures, the home could be given a label that denotes this higher category-specific performance (e.g. “Green Points Energy+”). Alternatively, the program could provide different levels of labeling for homes that earn different number of points, such that the program would certify buildings as “Green Points Certified,” “Green Points Silver,” or “Green Points Gold.” B. Basic Energy Efficiency Standards. This program option would provide a certification scheme that would allow building owners to rate their existing building’s energy performance according to a standardized methodology. They could be prescriptive (i.e. a checklist that includes insulation standards, leakage standards, window standards, solar gain and shading etc.) or, if adequate data exists, performance based. The city’s role would be to create the standards, or to adopt other existing standards, to market the certification to landlords and building owners, and to educate the public on the existence, meaning, and value of the certification. C. Green Building Strategic or Master Plan A strategic or master plan should be developed to serve as a planning tool and guiding document for the city’s green building efforts and investment. The plan should establish goals for residential and commercial sectors and outline potential strategies for increasing green building in Boulder, including code and regulatory options. The plan should pull together elements from the Climate Action Plan and the Master Plan for Waste Reduction, as well as compile new information specific to green building.
33

CITY OF BOULDER- CLIMATE ACTION PLAN
Regulatory Options A. Green Points Upgrade – Mandatory Energy Requirements Green Points and the IECC 2000 are the relevant residential building codes with regard to energy and environmental performance for new buildings and buildings that undergo major renovations within the city. Currently, Green Points can be met by obtaining a certain number of points that do not necessarily reflect the energy characteristics of a building, since other points in other non-energy categories can be used to satisfy the Green Points requirement. The Green Points Program is currently being upgraded and the points system adjusted. It should continue to be maintained, evaluated and updated in sync with other building and energy code adoptions. One method to insure that all new buildings are built to have high energy performance and comfort is require that a higher number of points are earned through energy performance measures, which could include points from the following categories: framing, energy code, plumbing, electrical, insulation (remodels), HVAC, and solar. Another option is to increase the minimum standards in each of the energy related categories. B. Residential Energy Conservation Ordinance (RECO) Residential Energy Conservation Ordinances (RECOs) are a policy tool for upgrading the energy efficiency and water usage of existing housing. RECOs require building owners (landlords and/or homeowners) to implement specific, prescriptive energy and water efficiency measures if their property doesn’t meet a minimum standard.
RECOs are especially relevant in the rental property sector, where there exists a disincentive for landlords to incur the costs of efficiency improvements when they don’t directly reap the benefits. These properties are often the ones in the greatest need of upgrades. In addition, a RECO offers an avenue for addressing the rental and multifamily housing sectors and can offer benefits to the lower income portion of the community, providing a crucial equity component in the broader city’s energy and GHG offerings. Typically, RECOs take effect either when the property changes hands (point of sale) or during the rental license inspection process. One possibility would be to establish a date when all properties must reach the minimum standard. The date could be several years in the future to allow time for late adopters to comply. In developing a RECO for Boulder, the city should balance factors such as how to realize maximum energy efficiency, how to minimize the cost and administrative burden on the city, and how to minimize inconvenience and cost to the building owners.
The cost to the city of a RECO program would be that of the labor for the property inspections and Planning Department staff, although these costs are typically recovered (in other RECO programs around the country) through a $15-$50 inspection fee borne by the property owner. The cost of the required improvements that would be borne by the property owner varies depending on the existing condition of the building, but average costs in other programs range from $650–$1,000. This cost would be in addition to the cost of the inspection, also borne by the property owner, which in other cities, ranges from $50-$100. Energy savings would likely be on the order of 10-20% per building, depending on the stringency of the standards. The city may consider offering incentives to early adopters.
34

CITY OF BOULDER- CLIMATE ACTION PLAN
Costs Education and outreach to the residential sector is a primary strategy for increasing efficiency in that sector. Similar to the commercial sector, residential efforts will attempt to leverage available utility rebates, federal tax credits authorized under the Energy Policy Act of 2005, and private investment. Currently, the level of residential utility rebates and services are unknown, as is the impact rising natural gas and electricity prices will have on voluntary efficiency and conservation. Information on Xcel programs will be available in mid 2006. Staff is coordinating with the Center for Resource Conservation (CRC) and the LPEC weatherization program to develop programs and initiatives for the residential sector that fill gaps left by Xcel and other programs. The uncertainties and lack of data make it difficult to develop cost and savings estimates for the residential sector at this time. The success of the residential programs and the prevalence of voluntary emissions reductions actions will depend on the level of outreach, education, and assistance provided. Through its programs and outreach efforts, staff has positioned itself as a key community resource for providing information and assistance about cost-effective emissions reduction measures, renewable energy options, efficiency technologies, and available resources to identify and fund energy projects. The costs associated with continuously growing awareness in the community are for personnel, marketing, and for providing supplementary incentives and services, not covered by Xcel or other service providers. These costs will change over time as marketing and incentives requirements adapt to the changing market and achieved results.
iv. City Facilities and Operations
In 2004, the city organization used over 25 million kWh and 510,000 therms of natural gas, emitting over 28,000 mtCO2e. In the GHG inventory, these emissions are included in the commercial sector. The city has an inventory of 127 buildings totaling 2.6 million square feet, of which 12 buildings or 682,000 square feet are maintained by Facilities and Asset Management (FAM). Energy expenses for the 115 non-FAM maintained buildings are charged directly to departments by Xcel Energy. Energy costs for the 12 FAM-maintained buildings are paid by FAM through the General Fund and allocated on a square footage basis. FAM practices energy efficiency by continually trying to find ways to save energy in the city organization and improve the comfort of city buildings. FAM is responsible for monitoring energy use in city facilities and ensuring that new facilities and remodels are designed to minimize overall capital, maintenance and energy costs. Starting in the mid-90s, FAM completed a number of building upgrades, including switching to energy efficient lighting and installing efficient HVAC (heating, ventilation, air conditioning) systems. Recent efficiency improvements include installing occupancy sensors, adding insulation during remodels, installing variable speed fans in new HVAC equipment, installing reflective roofing materials on flat roofs and selecting high efficiency boilers. Additionally, the city pursues LEED Silver Certification for new facilities and major renovations. Because of aggressive efforts to reduce energy consumption in the past, the remaining potential for energy efficiency is limited.
35

CITY OF BOULDER- CLIMATE ACTION PLAN
The City is also a member of the Chicago Climate Exchange and has made a commitment to reduce city organization emissions by 1% a year from 2002 through 2006. Joining CCX makes a commitment to reduce city organization emissions, supports a carbon trading mechanism and market-based solutions to reduce emissions and leads by example. Overarching Strategies
If the city organization reduced its electricity use by 20% from current levels by 2012, it would save almost $500,000 and prevent approximately 4,000 mtCO2e with a payback of less than four years.
Establishing an energy reduction target for the city organization will help focus attention on energy efficiency opportunities and may motivate employees to play a more active role in conserving energy at the workplace. Staff plans to explore a cost-allocation system, similar to the Computer Replacement Fund, that could fund energy efficiency improvements across the organization, including facilities not maintained by FAM and through the General Fund. Departments and FAM will continue to explore additional ways to reduce facility energy costs. These initiatives include:
• Continuing to replace inefficient HVAC systems and controls and incandescent light bulbs with compact fluorescent bulbs.
• Checking buildings for proper door and window seals. • Setting thermostats at 68 to 70 degrees in winter and 76 to 78 degrees in the summer.
Discouraging the use of personal devices, such as mini-refrigerators, décor lighting, and space heaters.
• Turning off computer monitors, speakers, and lights when not in use. The city should continuously strive to raise awareness about employee energy use within the organization and encourage employees to take personal actions to reduce energy use. This can be accomplished through emails, department liaisons and other outreach tools.
b. Renewable Energy & Emissions Offset Strategies
Staff recognizes that it would require significant and likely unrealistic amounts of public and private capital to achieve the emissions reduction target through energy efficiency alone. As a result, renewable energy will have an important role in all sectors. The Boulder community currently receives approximately 8% of its electricity from renewables, including the city’s hydroelectric generation. As mentioned earlier, the city is contesting a ruling that assigns ownership of the city’s hydroelectric renewable energy credits to Xcel Energy. Boulder is the first community in Colorado to become an EPA-certified Green Power Community and is one of only a handful of such communities in the country. Boulder will receive recognition from the EPA, including press releases and an outdoor sign to be posted in the community. Boulder’s residents and businesses have the following four options for supporting renewable energy:
36

CITY OF BOULDER- CLIMATE ACTION PLAN
Xcel Energy’s Windsource Program Renewable Energy Credits (RECs) or “green tags” Install renewable energy system on site Contribute to emissions offset funds
The passage of Amendment 37 requires Xcel Energy to get three percent of retail sales in 2007-2010 and ten percent by 2015 from renewable sources. While it is anticipated that most of the requirement will be accomplished through wind farms, the law requires that four percent of the total renewable energy come from solar. Xcel will offer a consumer rebate of $4.50 per watt to help them meet the requirement. If Xcel meets the renewable energy target, Boulder’s emissions from electricity use will drop by around ten percent by 2015. Emissions reductions from solar PV installations are included in Amendment 37 impacts. Emissions reductions from solar thermal installations are captured in the annual Xcel consumption reports through reduced natural gas consumption. The current analysis shows that there may be a 60,000 metric ton deficit in 2012. The city will likely have to purchase over 72,000 MWh of wind power in 2012 to meet the Goal at a cost of around $908,97220. If the sectors increase renewable energy purchases or energy efficiency measures over what is projected in the analysis, the 2012 city purchase will be reduced. The analysis also includes the city’s hydroelectric generation. The following strategies represent possible actions that the city could choose to pursue. Before any strategy would be implemented, staff and the relevant tactical group would evaluate the strategy for cost-effectiveness, emissions reduction potential, and consider any equity issues. Public process may be encouraged for particular activities or programs.
i. Commercial Sector
Currently, there are over 350 commercial and industrial customers receiving electricity from renewable sources, representing 5% of total commercial and industrial customers and approximately 3% of the sectors’ electricity load. The majority of Boulder businesses subscribing to renewable energy are purchasing wind through Xcel’s Windsource program or buying RECs from local suppliers. Existing Activities
• Boulder Wind Challenge Overarching Strategies In summary, the primary strategies for increasing renewable energy use in the commercial sector include: 20 On August 29th, 2006, Boulder City Council selected a revenue structure that does not include a large renewable energy purchase in 2012 which was originally proposed as a part of the Climate Action Plan. As a result, the budget for 2012 in the Climate Action Plan has been revised and does not reflect the purchase of a large amount of renewable energy.
37

CITY OF BOULDER- CLIMATE ACTION PLAN
• Educate businesses on available renewable energy options, including on-site generation and how to subscribe;
• Promote local renewable energy suppliers; • Connect businesses with external resources, such as EPA’s Green Power Partnership and
the Center for Resource Conservation (CRC); and • Recognize companies for their renewable energy purchases.
Potential Actions Boulder Wind Challenge- The city coordinated a two month Wind Challenge with Western Resource Advocates, which challenged the residential and business community to increase the total number of wind power subscribers by 500. Around 150 businesses signed up during the Challenge. The city may explore other challenge concepts, including a solar challenge. Emissions Offsets- Another strategy is to encourage businesses to offer emissions offsets to customers. Businesses could offer RECs or contribute to emissions offset funds with certain purchases or provided services. For example, Co-operative Bank Mortgages of the UK offsets one ton of CO2 on the client’s behalf for the life of the mortgage at no additional cost. It gives businesses the opportunity to differentiate their products and demonstrate environmental leadership. Other examples include travel agencies offsetting the GHG impact of air travel and companies offsetting their emissions to offer “carbon neutral” products. Workshops- The city could host workshops that educate businesses on renewable energy options and available resources, such as Amendment 37 rebates, federal tax credits, EPA Green Power Partnership. The workshops could be sponsored by local solar and wind power providers. Costs The city’s main role will be to educate and help businesses find the resources and information they need to purchase or install renewable energy. The cost to the city to increase renewable energy use in the commercial sector is expected to be limited to marketing costs. Local renewable energy suppliers, such as Clean and Green, actively promote their products to local businesses.
ii. Industrial Sector
Industrial sector wind power purchases are combined with commercial purchases in the annual Windsource reports. It is known that at least three of the large industrial users purchase wind power for their facilities. Some industrial facilities may be good candidates for on-site generation, such as photovoltaics, cogeneration and fuel cells. Overarching Strategies The primary strategies for increasing renewable energy use in the industrial sector are to:
• Educate industrial users on available renewable energy options, including on-site generation and how to subscribe or implement;
• Promote local renewable energy suppliers;
38

CITY OF BOULDER- CLIMATE ACTION PLAN
• Connect businesses with external resources, such as EPA’s Green Power Partnership and the Center for Resource Conservation (CRC); and
• Recognize companies for their renewable energy purchases. Potential Actions Boulder Wind Challenge- The challenge should be promoted to industrial users to increase subscriptions and/or sign up new users. Workshops- The city could host workshops that educate industrial users on renewable energy options and available resources, such as Amendment 37 rebates, federal tax credits, EPA Green Power Partnership. The workshops could be sponsored by local solar and wind power providers. Identify rooftops for PV- The city could use its aerial mapping tools to identify rooftops suitable for PV. The city could then contact the business to inform them of their solar capabilities and provide information on how to evaluate a solar PV project. Costs The city’s main role will be to educate and help businesses find the resources and information they need to purchase or install renewable energy. The cost to the city to increase renewable energy use in the industrial sector is expected to be minimal and limited to marketing costs. For the implementation plan, the costs are included in the commercial summary. If the rooftop PV project is pursued, costs may be slightly higher.
iii. Residential Sector
Currently, there are over 6,500 residential customers receiving electricity from renewable sources. This represents over 8% of the sector’s electricity load. The majority of Boulder households subscribing to renewable energy are purchasing wind through Xcel’s Windsource program or buying RECs from local suppliers. Existing Activities
• Contributed $5,500 to the Center for Resource Conservation (CRC) to support installation of solar hot water at affordable housing units
• Boulder Wind Challenge • CRC’s solar workshops and trainings
The existing activities have focused on voluntary wind power subscriptions and installing solar power equipment. Around 1,000 households signed up for wind power or increased their wind purchase during the Wind Challenge. Overarching Strategies Similar to the commercial and industrial strategies, a primary strategy to increasing renewable energy use in Boulder is to raise awareness of the benefits and available options. There are currently four local wind power suppliers offering wind products to residents, all of which
39

CITY OF BOULDER- CLIMATE ACTION PLAN
participated in the 2005 Boulder Wind Challenge. Amendment 37 will favorably affect the economics of solar energy, thereby making more widespread adoption of solar energy more sensible and realistic. The Center for Resource Conservation (CRC) will focus many of their efforts on promoting renewable energy to the residential sector. They are currently sponsoring a program to help people repair solar hot water systems. They also plan to promote the Amendment 37 rebates through workshops. It may be desirable to expand the wind challenge and develop a solar challenge. Promotion of zero energy homes is also possible. It is assumed that most residents and businesses in Boulder that install solar electric systems will sell the renewable energy credits (RECs) generated by the system to Xcel. Initially, Xcel will pay $2.50 per watt for the RECs, which could be a deciding factor for many people considering solar. If the RECs are sold to Xcel then the homeowner or business cannot claim the renewable or environmental attributes, including the GHG emissions reduction. As such, Boulder’s solar systems will not directly contribute to the Goal, but will indirectly reduce the carbon intensity of electricity from the grid by displacing electricity from coal or natural gas fired power plants with solar electricity generated on-site. The reduced electricity purchases from Xcel due to onsite generation will be reflected in the GHG inventory. Additionally, solar electric systems reduce strain on the grid, particularly during the peak period, and could improve power reliability for all Boulder customers. Potential Actions Boulder Wind Challenge- The challenge should be continued and promoted to residents to increase subscriptions and/or sign up new users. Promote installation of renewable energy systems- Work with CRC to promote solar thermal and electric systems on homes, as well as contractor training.
iv. City Facilities and Operations
The Boulder Valley Comprehensive Plan has a policy encouraging the use of renewable energy. Increasing renewable energy use is also a city of Boulder goal. In 2005, the city organization became an EPA Green Power Partner for its green power purchases. The city currently purchases 420,000 kWh a month of wind power from Xcel Energy. The North Boulder Recreation Center purchases 377,000 kWh of wind through renewable energy certificates. This represents approximately 3% of the city’s total electrical load.
Solar Hot Water The North Boulder Recreation Center has one of the largest solar thermal systems in the country. The system annually saves approximately 20,000 therms of natural gas, preventing almost 100 mtCO2e. The system saves around $20,000 a year for a simple payback of ten years.
The city also operates eight hydroelectric plants and sells the generated electricity to Xcel Energy. The hydroelectric facilities generate over 35 million kilowatt-hours a year. Currently, the city is contesting a ruling by the Public Utility Commission
40

CITY OF BOULDER- CLIMATE ACTION PLAN
(PUC) that assigns the renewable energy credits from the hydroelectric generation to Xcel. The city is currently exploring the possibility of installing solar electric systems on city facilities, though it is likely that the city would have to sell the RECs to make the projects financially feasible. Currently, the city’s North Boulder Recreation Center has one of the largest solar hot water systems in the United States. Alternative fuel purchases for the city fleets will be discussed in the Transportation Section. Existing Activities
• Purchase RECs for the North Boulder Recreation Center • Solar hot water system at North Boulder Recreation Center • Purchase Windsource for the Municipal Building and Atrium Building
Potential Actions Encourage additional REC or Windsource purchases by city departments The following table outlines the emissions reductions possible if the city increased the percentage of electricity received from wind. A cost-allocation system similar to the Computer Replacement Fund could be established to fund the renewable energy purchases. In contrast, the GHG program could fund the purchases, while encouraging departments to make additional purchases to exceed the goal.
RE Target
by 2012 (%)
GHG emissions reduction (mtCO2e)
Cost
10% 2,000 $25,108 20% 3,999 $50,216 30% 5,999 $75,324 40% 7,999 $100,43250% 9,999 $125,540
100% 19,997 $251,080 *Based on 2005 data and no changes in consumption OEA could work with Finance and FAM to supply information and encourage departments responsible for their utility bills to offset a portion or all of their emissions with Windsource or RECs. OEA could issue a departmental challenge to motivate departments to consider renewable energy. The city could develop a centralized fund, similar to the computer replacement fund, that each department pays into, which would fund renewable energy purchases or projects. Expand outreach and education to city employees Provide general outreach and education to city employees through SPIRIT messages, city newsletter, posters, and similar marketing tools.
41

CITY OF BOULDER- CLIMATE ACTION PLAN
Install solar photovoltaic system(s) on city facilities The city is exploring the possibility of receiving a portion of its electricity from solar power. While the city cannot claim the emissions reductions from the system if the RECs are sold, the system would lower the city’s energy costs, display its environmental leadership, and promote solar to the community. Solar systems in Boulder may reduce the region’s peak demand and pollution problems, regardless of REC ownership. Develop “Cool Fuel” Program for fleets and city employees Mock or adopt BP’s “Cool Fuel” program. BP provides a corporate rebate to organizations based on the gallons of fuel purchased in the Cool Fuel program. The city then uses this rebate to purchase CO emission offsets which, in effect, zero out the impact. The offsets are verified by the Climate Neutral Network.
221 The program could be expanded to include the employees of
other interested companies or organizations or to the entire city. Establish community wind farm The city could investigate the possibility of establishing a community wind project to supply a portion of the city’s electrical needs. It is believed that the current franchise agreement with Xcel allows the city to purchase electricity from a wind farm it builds. However, Boulder would need to build a multi-turbine farm at great expense to deliver a significant amount of wind power to the community. Boulder’s existing Windsource customers purchase the output of approximately 21 turbines. Building a community wind farm may be a longer term goal that can be realized after franchise negotiations with Xcel in 2010 or if the city municipalizes.
c. Transportation
Vehicle transportation is the second largest sector contributing to Boulder’s GHG emissions. The Transportation sector produced 28% of total 2004 emissions totaling 514,000 mtCO2e. The emissions estimates are based on vehicle miles traveled in the Boulder Valley planning area. It is not possible to extract data limited to travel within Boulder city limits. If current trends were to continue unmitigated, forecasts indicate that Boulder will experience a 47% increase in 2012 VMT relative to 1990. Because each fuel type has a different emissions factor (lb CO2e/gallon), the inventory also includes biodiesel and ethanol purchases within the city of Boulder, including use by the city fleet and private vehicles. There are three fundamental strategies for reducing vehicle GHG emissions—reduce vehicle miles traveled (VMT); Improve fuel economy of the public and private fleets; and Use less GHG-intensive fuels. While all three approaches each offer the City several options for reducing GHG emissions, they furthermore provide several significant synergies. While reducing VMT curtails GHG emissions, it also helps alleviate other growing problems, such as traffic congestion, and
Primary Strategies
• Reduce vehicle miles traveled
• Improve fuel economy • Use lower carbon fuels
21 http://www.interfacesustainability.com/coolfuel.html
42

CITY OF BOULDER- CLIMATE ACTION PLAN
offsets the need for new road infrastructure. While improving fuel economy and switching to alternative fuels reduce GHG emissions, they also decrease local air pollution and decrease dependency on foreign oil. The desire to reduce traffic congestion and vehicle travel has been a longstanding City priority. In 1989, the City initiated the first Transportation Master Plan (TMP), which is the long range blueprint for travel and mobility in the Boulder. The TMP aims to first, provide safe and convenient mobility and access in the City; and second, to do so while minimizing auto congestion, air pollution, and noise. Specifically, its objectives for 2025 include:
• Continued progress toward no growth in long-term vehicle traffic;
• Reduce single-occupant-vehicle travel to 25 percent of trips; • Continued reduction in mobile source emissions of air
pollutants; • No more than 20 percent of roadways congested (at Level of Service [LOS] F); • Expand fiscally viable transportation alternatives for all
Boulder residents and employees, including the elderly and those with disabilities; and • Increase transportation alternatives commensurate
with the rate of employee growth.
Efforts to reduce emissions from the transportation sector seek to complement the Transportation Master Plan (TMP) goals by encouraging reduced single occupant vehicle trips, reduced vehicle miles traveled, and increase in the use of alternative fuels. Achieving the TMP Action goals would achieve approximately a quarter of the sector’s GHG emissions target. Existing Activities
• Transportation Master Plan • GO Boulder • Eco-Pass Program
The Transportation Master Plan (TMP) is the long range, guiding document for all transportation initiatives in the city of Boulder. It provides the policy basis for how transportation funding is spent and what projects or programs the city will focus on to provide transportation services for its residents through the year 2025. The TMP sets these projects and programs within the context of the broader community goals to protect the natural environment and enhance Boulder's quality of life. The Plan includes an investment program based on Current Funding and an Action Plan of strategic investments that would be made if additional funding becomes available. Given the decline in city sales tax revenues over a number of years, the city is behind the investment program called for in Current Funding and the Action Plan remains unfunded. GO Boulder is frequently referred to as “The TMP in action”. Working with residents, institutions such as CU, and regional partners, GO Boulder addresses transportation needs for today and tomorrow. They provide educational information, outreach programs and maintenance reporting and develop innovative programs such as the Community Transit Network of high frequency buses and the extensive system of off-street bicycle paths, pedestrian paths and
43

CITY OF BOULDER- CLIMATE ACTION PLAN
underpasses. GO Boulder also organizes Walk and Bike Week—Boulder's largest annual celebration of great options in transportation, encouraging the use of alternative modes as easy, fun and practical means of getting around the community.
The Eco Pass is a discounted annual bus pass purchased by employers and universities for all full-time employees and students, with an option to include part-time employees. With a photo ID card, employees and students are entitled to unlimited rides on all regular RTD transit services, including travel to Denver International Airport. The city of Boulder and RTD created a bus pass program especially for neighborhoods called the Neighborhood Eco (NECO) Pass. As of February 2005, 20 neighborhoods in Boulder and one in Lafayette offer the Pass to nearly 4,000 residents. All of the Eco Pass programs provide about 60,000 passes to the Boulder community. The TMP Action Plan would expand that to 100,000 passes while the Vision Plan includes a community-wide pass for all residents and employees. The TMP Vision Plan includes a community-wide pass.
Overarching Strategies The following charts illustrate the modal distribution for all trips in Boulder for 1990 and 2003. To reduce emissions, single and multi-occupied vehicle (SOV and MOV) trips will have to become a smaller piece of the pie.
1990
SOV44%
MOV26%
Transit2%
School Bus1%
Bicycle9%
Walk18%
2003
SOV39%
MOV23%
Transit5%
School Bus0%
Bicycle14%
Walk19%
A review of transportation programs in Portland, Seattle, and the San Francisco Bay Area identified successful and cost-effective measures that may be applicable to Boulder. Based on this evaluation, the following is a list of policy recommendations to consider implementing in Boulder.22
22 “An Evaluation of Transportation Greenhouse Gas Emissions for Boulder, Colorado” Hwakong Cheng, 12/07/05
44

CITY OF BOULDER- CLIMATE ACTION PLAN
• Continue to promote and help expand Boulder CarShare • Work with RTD to implement a TravelSmart social marketing program • Support the adoption of the California LEV II standards • Promote local biodiesel and ethanol market development • Promote the use of hybrid technologies • Continue to lead by example by purchasing green vehicles for city fleet • Support state allocation of federal transportation funding on CMAQ projects • Continue to improve transit, walking, and biking infrastructure • Promote changes in land-use planning for long term benefits
Modeling completed by the city’s Transportation Division predicts that there will be no reduction in VMT relative to 2001 levels by 2025. The models do not account for major changes in behavior. The GHG program will attempt to encourage major changes in behavior, but emissions reductions from reduced VMT are not included at this time for planning purposes. Improving the overall fuel economy of passenger vehicles by 5% would reduce the City’s GHG emissions by about 28,700 mtCO2e in 2012, or about one sixth of the 157,000 emissions reduction goal for the transportation sector. Increasing the use of alternative fuels, specifically replacing petrodiesel consumption with biodiesel use and replacing gasoline with ethanol, could play a significant role in reducing the City’s GHG emissions. Ethanol and biodiesel are considered GHG-neutral, though there is some debate on this assertion. The following table summarizes the GHG emissions factors of the selected fuels.23
Type lbs CO2/gallon
CNG 23.598
LNG 13.36
Methanol 19.608
LPG 12.805
B20 23.22
Diesel 27.824
Gasoline 24.116
Hybrid (Diesel) 27.824
Environmental Affairs staff will work with the Transportation Division to better coordinate efforts and increase the visibility of GHG emissions as a transportation-related issue in city planning, policies, and programs. Resources will be focused on education about the GHG Goal and the connection to transportation, the benefits of alternative fuels and high efficiency vehicles, and providing information on federal and state incentives for high efficiency vehicles and alternative fuels. When appropriate, staff will work with local fuel retailers to offer alternative fuels and facilitate use of state and federal incentives. Federal and state grant funds will be sought in coordination with the Transportation Division. A fixed term FTE is being proposed to implement the proposed actions and develop a longer term approach.
23 http://www.travelmatters.org/about/methodology-transit?sid=81d714fb84981596a5905c7e09b56fde
45

CITY OF BOULDER- CLIMATE ACTION PLAN
Costs The current TMP funding program reflects an investment strategy fixed at current funding levels (fiscally constrained), which is estimated at $448 million through 2025. Over 75 percent of these funds are for maintenance of the existing transportation system. Services covered in the current funding level that reduce GHG emissions include:
• Maintain programmatic enhancements for all modes and complete multimodal enhancements on 11 corridor segments;
• Maintain the current, high frequency Community Transit Network bus service (HOP, SKIP, JUMP, BOUND, DASH, DART, STAMPEDE);
• Preserve the existing Eco Pass program (RTD's bus pass program) and transportation demand management efforts to promote and encourage alternatives to driving alone; and
• Increase regional emphasis by initiating actions to support a Boulder County transit vision and regional corridor improvements.
The Action Plan represents the next best steps toward reaching the community's transportation goals if additional funding becomes available. Pursuing and funding the Action Plan would approximately double the number of corridor segments that could be fully developed into multimodal environments. These improvements would significantly change the experience by users of all modes, with intersection improvements moving vehicles more quickly, pedestrians and bicyclists having access to completed facilities, and transit service expanded to those areas expected to see the majority of land use change and mixed use development.
The Action Plan assumes an additional $111 million will become available through various funding sources. While increases are proposed for the expansion of the bus pass program and travel demand efforts, the majority of the additional funds are targeted toward the needed capital improvements along the city's multimodal transportation corridors. As stated earlier, achieving the TMP Action goals would achieve approximately a quarter of the sector’s GHG emissions target.
The Vision Plan reflects the 1996 TMP in representing the completed multimodal system desired by the community. It is fiscally unconstrained and will take longer than 2025 to support financially as it has a total estimated cost of $729 million, more than $300 million over expected revenues by 2025.
Due to the enormous budget shortfall, it is not expected that the GHG funding source would or could be used to fully fund or even partially fund the Vision level for the TMP. As a result, the GHG program’s efforts in the transportation sector will be focused on supporting the Transportation Division’s programs that reduce VMT, providing transportation-related outreach at GHG events, and raising awareness of the connection between vehicle use and GHG emissions.
46

CITY OF BOULDER- CLIMATE ACTION PLAN
City of Boulder Fleet Services
Fleet Services manages the equipment operations and equipment replacement funds, coordinates all fleet acquisitions, repairs equipment or manages outside vendor support, and supports radio acquisition/maintenance for the entire city and limited other governmental and non-profit groups. Fleet Services maintains a fleet inventory of 924 units consisting of 429 vehicles, 238 pieces of motorized equipment and 257 pieces of non-motorized equipment. Currently, the city has 115 alternative fuel units, including nine Toyota Prius hybrids and 67 units running on biodiesel. Vehicle miles traveled in the city fleet declined by 2% between 1997 and 2004, with some years seeing as large as an 8% decrease over the previous year. Similarly, fuel consumption decreased by 3% between 1999 and 2004, with some years seeing a 15% decrease over the previous year. The city is also steadily increasing the amount of renewable fuels used in city vehicles, which reduces emissions beyond what is captured by reduced VMT and fuel consumption. Fleet Services has the following environmental goals, which translate into strategies for reducing emissions from the city fleet:
Exceed Clean Fuel Fleet Program mandate Reduce vehicle miles traveled (VMT), fleet vehicle emissions, use of petroleum-based
fuels Continue membership in the PACE program Purchase alternative fuel vehicles (AFVs) and hybrids when possible Purchase vehicles that are more fuel-efficient
d. Waste Reduction & Recycling
To reduce emissions in this sector, the volume of trash sent to the landfill must decrease. This can be accomplished by using a zero waste or whole systems approach to waste reduction, including reducing, reusing and recycling waste.
In 2004, waste sent to the landfill produced approximately 68,000 metric tons of CO2 equivalent in the form of landfill gas or methane. The solid waste sector is the second smallest contributor to GHG emissions, comprising 4% of total 2004 emissions. To reduce emissions in this sector, the volume of trash sent to the landfill must decrease. The City Council, as part of the 2000 budget process, established a 50 percent waste diversion goal, to be achieved by 2005. The city is rapidly approaching that goal, with statistics in 2004 at:
47

CITY OF BOULDER- CLIMATE ACTION PLAN
• Single-family residential waste diversion24: 48 percent [up from 38 % in 2003]
• Multi-family residential waste diversion: 13 percent [up from 12 % in 2003]
• Commercial and industrial waste diversion25: 25 percent [up from 23 % in 2003]
Because approximately 55 percent of Boulder’s waste stream is generated by business and industry, Boulder’s overall community-wide waste diversion for 2004 was 30 percent, up from 26 percent in 2003. In the first quarter of 2006 the Boulder City Council is expected to accept the Master Plan for Waste Reduction, in effect increasing the community waste reduction goal to 60 percent by the end of 2007, achievable with existing Trash Tax funding levels currently appropriated to waste reduction programs. Despite the city’s waste reduction efforts, the total volume of trash being generated and sent to the landfill may be increasing each year. In keeping with the city’s Zero Waste Resolution and Master Plan for Waste Reduction, aggressive waste prevention and increased producer responsibility initiatives must be employed to stem the overall growth of waste generation over time. The city has only recently begun collecting data on trash generation volumes. Because the GHG inventory is based on the amount of total trash generated and not the percent or quantity of recycling, more data must be gathered and analyzed before reliable emissions reductions can be quantified for the solid waste sector. For the current implementation Plan, no emissions reductions or increases are projected for this sector. As data becomes available, this sector’s contribution to the Goal will be refined.
Existing Activities
Curbside recycling- The city regulates trash haulers in Boulder, requiring them to provide unlimited curbside recycling services to all their residential customers in Boulder. The city requires that the following materials be collected from residents:
• Mixed Office Paper • Glass containers • Sorted “Junk” Mail • Aluminum cans & foil • Magazines & catalogs • Steel food cans • Telephone Books • Plastics #1-#2 bottles • Corrugated cardboard • Newspapers & anything that comes
in the newspaper • Paperboard • Milk cartons & juice boxes The city currently sponsors several waste reduction programs with Trash Tax revenues. These include the following:
Center for Hard-to-Recycle Materials (CHaRM) Yard Waste Drop-off Center Wood Waste Drop-off Center
24 Primarily materials collected through curbside recycling, spring clean-up, and the yard waste drop off center. 25 Predominantly achieved through businesses’ private collection contracts with Eco-Cycle, Western Disposal, Green Girl Recycling, Tri-R Recycling, and several other Denver area recycling companies.
48

CITY OF BOULDER- CLIMATE ACTION PLAN
Spring Clean-up Fall Leaf Drop-off Green Teams, student-to-student outreach in off-campus student residential neighborhoods. Neighborhood Community Gardens Compost Project Boulder Valley School District Education Programs Farmers Market Home Composting Education Business Recycling Coupons: 1st 3 months of recycling service for free Unlimited corrugated cardboard collection on “the Hill” during August move-in time
Many active community organizations and local businesses provide additional waste reduction programs such as Eco-Cycle, ReSource: the used building materials yard, CU Recycling, Extras for Education, Western Disposal and many other privately sponsored recycling programs. Overarching Strategies A group of experts and interested parties from throughout the Front Range carefully analyzed potential waste reduction programs for Boulder over a six month period. A Master Plan for Waste Reduction was created out of these meetings and was accepted in April 2006. The Master Plan was crafted in an effort to create a vision for the future of waste reduction in Boulder, and to act as an effective and long-range context for waste reduction and resource conservation. It recommends re-structuring and expanding the annual Spring Clean-up program to result in more significant diversion of residential organic materials. In addition, the plan calls for creation of “Recycle Row” a one stop shop designed to serve Boulder’s waste reduction and recycling drop-off needs. The Master Plan outlines:
• Current (fiscally constrained) Plan: 60% waste reduction by 2007 • Action Plan: 70% waste reduction by 2012 • Vision Plan: 85% waste reduction by 2017
As part of acceptance of the Master Plan, Council adopted a “Zero Waste” resolution to provide policy direction to staff. Zero Waste is a philosophy and a design principle that goes beyond recycling by taking a “whole system” approach to the flow of resources and waste through society. Zero Waste resolutions act as guiding principles for community programs and policies. Boulder’s Zero Waste Resolution states that the city of Boulder strives to go beyond recycling to try to address the root issues of waste generation. The international Zero Waste movement aims to build on the success of the recycling industries of the past 30 years, going beyond simply handling the waste once it is created, to attack the source of the waste. Zero Waste is a goal—a vision to strive for. When putting Zero Waste principles into practice, communities usually add the tag line, “Zero Waste — or darn near.” This acknowledges that while striving for a true zero waste society, the process may not actually achieve 100 percent waste reduction, but will almost always result in significantly lower levels of waste generation than traditional recycling programs have been able to accomplish.
Many communities have adopted Zero Waste resolutions and subsequently crafted plans for achieving Zero Waste, or darn near. In order to give Council a clear understanding of what it would take to get there, staff feels it is critical to have a plan in place prior to adoption of a
49

CITY OF BOULDER- CLIMATE ACTION PLAN
formal Zero Waste Resolution. The Master Plan for Waste Reduction acts as a roadmap to Zero Waste, as it sets forth the budget, specific programs, and enabling legislation that will be required to get to 85 percent waste diversion—which by any community’s accounts is darn near to Zero Waste.
e. Water Conservation
Conserving water also conserves energy and reduces emissions. Measures that reduce the volume of water that needs to be treated by wastewater treatment plants (WWTP) also save energy. Electricity used by water and wastewater utilities typically represents over half of a city government’s electricity bill. A study from Austin Energy found that 4.77 kWh are used per thousand gallons of processed water. Boulder’s wastewater treatment plant processes over 16 million gallons of water per day. Reducing hot water use also reduces energy use by reducing the amount of cold water that needs to be heated and used or stored. Boulder’s 75th Street WWTP captures the methane produced by the anaerobic digestion process used to treat solids. The anaerobic bacteria produce methane, carbon dioxide and trace amounts of other gases. The average percentage of methane and carbon dioxide in the digester gas in 2004 was relatively unchanged from 2003 levels, averaging 59.3 percent and 39.6 percent, respectively. This digester gas is utilized as fuel for two engine generators that produce both electricity and heat. The electricity is sold to Xcel Energy and the captured heat is used to heat plant buildings and keep anaerobic digestion tanks at an optimal temperature for the bacteria. Existing Activities
• Water Conservation Office • Water Conservation Rebates • Zero in on Xeriscaping • Spray Nozzle Project • Water Audits
The Water Conservation Office (WCO) was established in 1992 to direct the efforts of reducing overall water consumption within the city and specifically to reduce summer peak demand usage. The Program was designed to promote water conservation through voluntary measures that create a greater public awareness of the resource and encourage its wise use. The 2004 Water Conservation Office budget was originally budgeted at $355,000 for the year. Due to decreased water utility revenues, the budget was reduced by 20 percent in the final quarter. Approximately 95 percent of the revised budget was expended at year end. The WCO offers rebates to residents and businesses for high efficiency washing machines, dual flush or ultra-low flow toilets, drip irrigation, sprinkler controllers, heads or nozzles, soil amendments, and turf type buffalo grass. Several hundred rebates were issued in 2004, with the vast majority going to customers purchasing clothes washers. The WCO also offers zero-interest loans of between $1,000 and $3,000 to homeowners in three Boulder neighborhoods that complete xeriscaping projects. Up to 100 percent of the project may be financed over three years.
50

CITY OF BOULDER- CLIMATE ACTION PLAN
The WCO partnered with the PACE Program to install water-saving spray nozzles at local restaurants. In 2005, over forty nozzles were installed, each saving roughly 40,000 gallons of water a year. Overarching Strategies Due to the success of the PACE/ WCO Spray Nozzle Project in reducing hot water use in restaurants, it is recommended that the project be continued. Similarly, the rebates, particularly the clothes washer rebates, should be continued as they have been well utilized and contribute direct water and energy savings, as qualifying washers meet strict energy efficiency guidelines. Water conservation elements should be incorporated into energy efficiency programs and vice versa, where sensible. An example of this would be distributing low-flow showerheads and faucet aerators through a neighborhood sweep program. Similarly, during site visits of homes or businesses, water and energy measures should be evaluated.
f. Urban Forestry
As Boulder has grown, so has the urban forest. Almost 400,000 trees26 have been planted over the last century and a half in Boulder, not only lining the banks of creeks and ditches, but also along the streets of residential, commercial, and industrial areas, in public parks and on private property. The urban forest in Boulder is comprised of two distinct sectors: 1. Public - The Parks and Recreation Urban Forestry Section (Urban Forestry) maintains over 35,000 of the public street and park trees valued at over $69 million. 2. Private – The majority of the urban forest is on private property; in front yards and backyards across Boulder Trees filter pollutants from the air, improve water quality, reduce stormwater runoff, and reduce energy costs. Additionally, carbon removal (sequestration) by trees plays an important role in the global carbon cycle. Trees sequester carbon dioxide from the atmosphere through photosynthesis and return oxygen back to the atmosphere as a byproduct. Trees then store carbon in their biomass (roots, trunk, branches, and leaves) accounting for about half the dry weight of most trees. The amount of carbon stored increases as trees grow in size. Trees store carbon until they die or are allowed to decay completely and are therefore considered a “sink” for excess carbon in the atmosphere. Urban trees also help to reduce soil erosion because their root systems physically hold soil in place, thereby retaining a tremendous amount of underground stored carbon.
26 The ratio of private to public trees used was 10:1 from 2002 City Green report. Numbers updated to reflect existing tree inventory.
51

CITY OF BOULDER- CLIMATE ACTION PLAN
With regard to the Climate Action Plan, the primary benefit from trees citywide is the shade they provide during the summer. Shading reduces solar heating of buildings, directly reducing energy consumption for air conditioning. Trees also cool streets, parking lots and vehicles to reduce the “heat island” effect and gasoline evaporation from parked motor vehicles. Trees also reduce heating costs by blocking cold winds in the winter. Reduced demand for both air conditioning and heating reduces energy needs at power plants and therefore reduces carbon emissions. According to the US Forest Service, trees properly placed around buildings can reduce air conditioning needs by 30 percent and can save 20-50 percent in energy used for heating. Trees in Boulder provide an average of $58/year in energy savings for a one or two story single family detached home, or 950 kWh. This results in approximately $1.65 million in annual savings in Boulder’s residential areas. Boulder’s urban forest consists of an estimated 400,000 public and private trees, storing an estimated 110,000 m tons of carbon and is responsible for an additional annual reduction of 43,000 m tons through both carbon sequestration and avoidance thru reduced emissions.27 The carbon sequestered annually by Boulder’s trees offsets the carbon released through driving approximately 16.1 million miles each year. As of 2000, the estimated vehicle miles traveled in Boulder reached 2.61 million miles per day, or 950 million miles per year.28 Therefore the amount of carbon sequestered by the annual growth of Boulder’s urban forest offsets approximately 1.5% of the carbon produced annually when residents drive their cars. 29 Emissions reductions are captured in the GHG inventory through electricity and natural gas savings. The carbon sequestration benefits of Boulder’s urban forest however are not included in the GHG inventory due to a lack of benchmark data from 1990. Street trees are a good investment. The 2005 study, “The City of Boulder, Colorado Municipal Tree Resource Analysis,” demonstrated that for every dollar spent to maintain public trees, $3.64 worth of benefits are returned in avoided costs for energy consumption and air pollution control, in addition to the trees’ ancillary benefits, which include increased property value and improved human health and well being. Furthermore, many of these benefits extend beyond the site where a tree grows to influence the quality of life in the local neighborhood, community, and region. Because of the high return on the dollar, maintaining and expanding the urban forest is an important starting point in Boulder’s Climate Action Plan efforts. Front Range urban forests are still recovering from the effects of the 2001/2002 drought. The amount of trees removed to date far outweighs the number that have been replanted, mainly due to budget cuts and drought impacts. The Urban Forestry Section has removed 230 trees/year on average (nine-year average) and planted 130 trees/year on average (nine-year average). To maintain the stream of environmental benefits provided by our urban forest, urban trees must be managed to maintain optimal health and the city must have, at a minimum, a replacement
27 Based upon figures from the 2002 report, “Calculating the Value of Boulder’s Urban Forest”, produced by the City of Boulder Water Conservation Office and the 2005 study, “The City of Boulder, Colorado Municipal Tree Resource Analysis,” compiled by USFS consultants and city staff. 28 City of Boulder. Transportation Division of Public Works. Transportation Annual Report of Progress. Boulder, CO. January 2000. http://www.ci.boulder.co.us/publicworks/depts/transportation/pdf_documents/2000annual_report.pdf 29 From the 2002 report, “Calculating the Value of Boulder's Urban Forest”.
52

CITY OF BOULDER- CLIMATE ACTION PLAN
program that offsets the number of removals. Larger, healthy trees store the most carbon and provide the most shade. Existing Activities • Urban Forestry implemented a ten-year pruning rotation for its larger diameter street trees
and an eight-year rotation for its park trees to ensure public safety and maintain tree health. The industry standard for a rotation pruning cycle is a maximum of eight-years.
• Urban Forestry currently plants 80 trees per year with Urban Forestry funding and with in-house staff. Urban Forestry’s budget was reduced by 50% in 1998.
• Staff educates the public about proper tree selection and maintenance of public trees and the benefits of urban trees through phone consultation, the urban forestry website and educational programs.
• Urban Forestry staff presents educational programs each year for Arbor Day to public elementary schools to discuss the benefits of trees, greenhouse gas reduction and global climate change.
• Existing City Policies pertaining to trees: o City of Boulder Design and Construction Standards, Chapter 3, “Streetscape
Design and Tree Protection” and Chapter 10, “Streetscaping Standards” o Boulder Revised Code, Title 6, “Health, Safety and Sanitation”, Chapter 6,
“Protection of Trees and Plants” o Boulder Revised Code, Title 9, ‘Land Use Code”, 9-9-12 “Landscaping and
Screening Standards”, 9-9-13 “Streetscape Design Standards”, and 9-9-14 “Parking Lot Landscaping Standards”
Overarching Strategies Currently the Parks and Recreation Urban Forestry Section provides direct stewardship for only 35,000 of the 400,000 trees in Boulder’s Urban Forest. If the city is to maximize the benefits of the urban forest to promote energy savings and reduce carbon dioxide emissions the city must sometimes launch separate programs for trees on public property and trees on private property. For Boulder’s public trees, increased funding for the city’s Urban Forestry Section would increase tree plantings and ensure proper tree maintenance. Most trees and planting spaces, however, are on private property. A new model is needed to increase plantings and improve maintenance of trees on private property. This model would include elements such as public education, incentive planting programs and public-private partnerships. Alternative funding sources must be sought to create a comprehensive program for trees outside the jurisdiction of the Urban Forestry Section. Some important actions, particularly code changes, have low implementation costs, but can have far-reaching impacts. Private trees have the potential to provide high energy savings due to the ability for strategic planting close to homes to create shade. Public trees provide high energy savings in commercial areas where most tree planting spaces are on public property and in residential areas where homes are closer to the street. Planting on both public and private property benefits the city; if every household in Boulder planted just one tree to shade their home, the amount of CO2 in the
53

CITY OF BOULDER- CLIMATE ACTION PLAN
atmosphere would be reduced by nine million pounds annually once the trees were established and actively growing.30 Goals:
• Increase funding to support Urban Forestry’s programs to maintain the health of the existing municipal urban forest and sustain the current level of safety inspections and pruning for older public trees, as they produce substantial benefits.
• Ensure city code promotes the protection of healthy existing trees and the overall health and vitality of the urban forest in the planning and design of public improvements and private developments. Enforce existing city codes to increase survivability of trees planted through development.
• Maximize tree planting on public property with long term goals to fill the estimated 50,000 empty planting spaces. Increase yearly number of trees planted to offset removals.
• Maximize and facilitate strategic tree planting for shade and energy savings on private and where possible public property. The long term goal is to increase canopy cover in commercial/ industrial areas from an existing 7 percent to the regional goal of 9 percent and in residential areas from 31 to 35 percent.31 There is opportunity for a collaborative approach between city departments, non-profit groups and private property owners to fill this gap.
30 Based upon figures from the 2002 report, “Calculating the Value of Boulder’s Urban Forest”, produced by the City of Boulder Water Conservation Office and the 2005 study, “The City of Boulder, Colorado Municipal Tree Resource Analysis,” compiled by USFS consultants and city staff. 31 American Forests (2002) recommends canopy cover targets for the Southwest and Dry West: Commercial/Industrial = 9%, Suburban = 35%.
54

CITY OF BOULDER- CLIMATE ACTION PLAN
SECTION VI: Implementation Plan for 2007 through 2012 In order to reach the Kyoto Goal, Boulder must reduce its greenhouse gas (GHG) emissions by a total of 350,000 metric tons of carbon dioxide equivalent (mtCO2e) from 2004 levels by 2012. This represents a 24 percent decrease from 2004 levels. The previous sections of the Plan outlined various actions across the sectors that could be implemented to reduce GHG emissions in the community. These actions include continuation of existing activities and programs, as well as initiating new actions that will achieve far greater emissions reductions. Progress reports will track annual emissions and program activities. The Implementation Plan reflects participation rates and results that are believed to be reasonable, achievable, and slightly conservative, so as not to overestimate results or underestimate the necessary budget. The Plan will be updated annually during the budget process and reflect changes in assumptions or conditions. For Boulder to reach its Goal by 2012, it is imperative that in 2007 the city:
• Accelerate and expand existing programs and develop new programs in all areas and sectors, with an initial focus on improving energy efficiency in commercial, industrial, and residential buildings.
• Secure long-term funding resources to implement the recommended actions. • Develop infrastructure to support new and expanded programs and policies.
Implementing the Plan will require ongoing commitments from and partnerships with other city and county departments and City Council, non-profits, business leaders, property owners, the University of Colorado and the federal laboratories, community activists, energy services industry and the public. Working groups comprised of representatives of these groups should guide the implementation process by periodically reevaluating action priorities and subsequent implementation plans and by providing feedback on existing programs. The GHG program will also collaborate with the city staff working on municipalization to ensure consistency between each initiative’s objectives and outcomes. It is anticipated that later versions of the Action Plan and Implementation Plan will incorporate data and actions for Boulder County. External Factors Affecting Emissions Reductions External factors will also impact the level of emissions reductions achieved, but are difficult to quantify. It is important to note that weather conditions can dramatically impact emissions reductions in a positive or negative way, with large GHG impact resulting from the level of use of air conditioning during a hot or cool summer season. For example, hot summers generally lead to increased use of air conditioning, which significantly increases the amount of electricity used during the summer months. Other factors will positively impact emissions reductions. Higher energy prices, more aggressive equipment and building efficiency standards, and greater awareness and availability of high efficiency and renewable energy equipment will likely lead to greater voluntary adoption of efficiency and renewable energy actions. The passage of Amendment 37 and Xcel’s increased use of natural gas-fired power plants, as opposed to coal-fired power plants, will lower the
55

CITY OF BOULDER- CLIMATE ACTION PLAN
carbon intensity of the electricity supplied to Boulder, thereby reducing the carbon dioxide (CO2) emissions associated with each kilowatt-hour used. If the city becomes a municipal utility, Boulder’s energy supply could change, resulting in higher or lower carbon intensity depending on the electricity purchased. Factors that potentially negatively impact the level of emissions reductions achieved include population growth and trends towards larger homes with central air conditioning systems. Growth projections based on city build-out projections are included in the city’s GHG inventory. If actual population growth exceeds the projection, additional funds and activities would likely be required. Conversely, if growth is less than the projection, fewer emissions reductions may be required to meet the Goal. Per capita emissions will be tracked as a progress indicator. The Climate Action Plan includes strategies for addressing large homes, including revisions to the Green Points residential building ordinance. Budget Estimates The summary table found at the end of this section summarizes estimated GHG reductions, city and private sector costs, private sector savings and the net cost per mtCO2e reduced. Subsequent sections provide details on the estimates and proposed actions. The annual total budget required to achieve the necessary reductions ranges from $860,000 in 2007 to $1.07 million in 2012. Funding for energy efficiency actions represents 51 percent of the total GHG budget by 2012.32 Services include but are not limited to energy audits, contractor training, public workshops, light bulb giveaways and neighborhood sweeps. Because energy savings from energy efficiency exceed the implementation costs, the net cost per ton is negative, meaning that for every ton of CO2e that is not emitted, the community as a whole will save $463. The cost per ton estimates consider public and private sector costs and savings, as well as the Xcel rebates. A critical assumption behind the analysis is that energy efficiency should be maximized before or at least in parallel with investments in renewable energy. Energy efficiency saves money and typically results in local economic benefits by keeping dollars in Boulder that would otherwise be sent out of the community and by creating jobs. Additionally, by increasing energy efficiency and reducing the amount of energy needed to power a home or business, less renewable energy is needed to meet a building’s electricity demand. For example, when considering a solar photovoltaic system for a building, first investing in energy efficiency and reducing the electricity demand of the building will likely enable the building owner to purchase a smaller system, thereby reducing the capital investment. Similarly, the less energy a home or business uses, the less it would cost to purchase 100 percent wind power. 32 It is assumed that funding for city projects will not come from the GHG budget. When efficiency improvements for city operations are included, the percentage increases to 60%.
56

CITY OF BOULDER- CLIMATE ACTION PLAN
Because there may be a shortfall in emissions reductions needed to meet the goal in 2012, significant funding for renewable energy purchases may be required in 2012. This shortfall doubles the amount of funds needed in 2012, as compared to the average annual budgets for years 2007 to 201133. Questions and concerns have been raised about the limited scope and effort dedicated to the Transportation Sector. For this reason, a fixed-term FTE is proposed to spend one or two years implementing the actions proposed and developing a longer term plan. Staff is planning to work with the Transportation Division to discuss additional opportunities for increasing emissions reductions from the sector.
Summary of GHG Program Results and Costs
Actions Summary
GHG emissions reduction by 2012 % of target
Lifetime energy cost
savings
Private sector investment by
2012
Public sector cost
by 2012 Xcel Energy
Rebates
Public sector
cost per ton
Energy efficiency 76,222 22 $63,869,500 $35,634,600 $3,332,678 $10,352,400 -$463 Renewable energy 203,778 58 - $893,976 $539,357 - $7 Transportation 40,000 11 not estimated not estimated $528,848 - $1 Education and Outreach 30,000 12 not estimated - $1,190,196 - $20 Funding Source Administration - - - - $42,000 - - Total 350,000 100 $63,869,500 $36,528,576 $5,633,079 $10,352,400 -$92
*Savings assume no increase in energy prices. The city cost for energy efficiency does not include $1.95 M for efficiency projects in city facilities, which will not come from the GHG budget. For cells marked “not estimated” estimates have not been developed for lack of reliable data. All costs factor in inflation.
Summary of Annual City Costs
Annual City Costs 2007 2008 2009 2010 2011 2012 TOTALEnergy efficiency $488,828 $499,992 $545,941 $575,031 $598,888 $623,999 $3,332,678Renewable energy $56,438 $69,292 $81,712 $96,050 $110,385 $125,481 $539,357Transportation $70,875 $77,910 $83,813 $91,413 $98,559 $106,278 $528,848Education and Marketing $202,125 $177,194 $185,878 $197,773 $208,110 $219,116 $1,190,196Admin $42,000 $0 $0 $0 $0 $0 $42,000Total $860,265 $824,389 $897,344 $960,267 $1,015,941 $1,074,873 $5,633,080
*Costs do not include funds for city operation projects. Costs include city renewable energy purchases. Costs are calculated with inflation.
33 On August 29th, 2006, Boulder City Council selected a revenue structure that does not include a large renewable energy purchase in 2012 which was originally proposed as a part of the Climate Action Plan. As a result, the budget for 2012 in the Climate Action Plan has been revised and does not reflect the purchase of a large amount of renewable energy.
57

CITY OF BOULDER- CLIMATE ACTION PLAN
Recommended Actions
Primary Strategies • Increase energy
efficiency • Switch to
renewable energy
• Reduce vehicle miles traveled
This section outlines recommended actions and programs for implementing the Climate Action Plan. Most of the actions are intended to be in place from 2007 to 2012, but the service levels or programmatic details may change in response to new circumstances. Each category has a summary table detailing the estimated GHG emissions reductions, public and private sector costs, private sector savings and the net cost per mtCO2e reduced. The actions represent a diverse portfolio of actions to achieve the goal. INCREASE ENERGY EFFICIENCY: 76,222 mtCO2e by 2012 Energy efficiency is a primary strategy for reducing emissions in the commercial, industrial, and residential sectors. Energy efficiency provides a solid return on investment, makes lasting improvements to the comfort, reliability, and marketability of Boulder’s building stock, and reduces emissions at the power plant. It also has the potential to create new jobs, strengthen the local energy services industry and to increase direct and indirect sales tax revenue, thereby complementing the city’s economic vitality efforts by keeping more money in the community. There is also significant outside funding available, such as Xcel’s rebates, to support energy efficiency and leverage the city’s investment. The total annual budget for energy efficiency actions is estimated to be $488,828 to $623,999 The highest funding level will be needed for years 2009 to 2012, as participation rates in city programs are projected to increase. The budget estimate assumes that the commercial and industrial program has one dedicated FTE and the residential program has one dedicated FTE. A. Commercial Sector: 30,851 mtCO2e by 2012
Energy Audits An energy audit of the Chamber of Commerce identified projects that would reduce electricity and natural gas consumption by 18% and 9%, respectively. Collectively, the recommended projects have paybacks less than three years. If every office building in Boulder reduced electricity and natural gas use by 20% and 15%, it would achieve 17% of the city’s goal.
A primary strategy for reducing GHG emissions from the commercial sector is to increase the efficiency of commercial buildings. The primary strategies for increasing energy efficiency in the commercial sector are to maximize participation in Xcel Energy’s rebate programs and to provide services and information to address the barriers to energy efficiency. The city will promote the services of local contractors and energy service providers. Where service voids exist, the city will seek to fill those voids directly through providing the service or indirectly through partnerships. For example, the city will partner with a local engineering firm(s) to provide energy audits to commercial building owners. Currently, typically only the largest facilities with energy intensive operations pay for energy audits. However, the city’s audit program has shown that energy audits can also benefit smaller buildings. Through the audit program, smaller buildings and businesses that otherwise would not invest in energy audits will receive audits. On average, energy audits of office buildings in Boulder identify projects that can reduce electricity and natural gas use by 20% and 15%, respectively. The analysis assumes that 35 percent of the commercial building stock will reduce electricity and natural gas
58

CITY OF BOULDER- CLIMATE ACTION PLAN
consumption by 20 percent and 5 percent, respectively, by 2012. This represents an eight percent reduction in commercial electricity use over 2004 consumption. It also assumes that Xcel rebates will cover 25 percent of implementation costs for energy efficiency measures. This is conservative as Xcel is designing rebates to cover up to 50 percent of project costs. However, Xcel may reduce incentive levels for some measures, such as lighting, before the rebate program expires in 2014 and some projects may not qualify for rebates. Again, the Plan reflects participation rates and results that are believed to be reasonable, achievable, and slightly conservative, so as not to overestimate results and underestimate the necessary budget. Recommended Actions:
• Continue and expand “Building Performance with ENERGY STAR” program. o 40 buildings a year receive energy audits and ENERGY STAR benchmarking. o Help businesses receive Xcel Energy rebates and federal tax credits for EE
projects. o Create ENERGY STAR and PACE program for small businesses. o Offer technical assistance and workshops for business and property owners. o Education and outreach.
• Work with property and business owners on leasing practices and barriers to energy efficiency.
• Facilitate contractor and building professional training, skill growth and awareness of Xcel rebates.
• Work with Boulder Economic Council and Planning and Development Services to evaluate incentives for the construction and remodeling of high-performance buildings.
• Recognize companies’ commitments and results. • Develop green building strategic or master plan. • Explore regulatory options, including more aggressive building codes and standards, for
future implementation. Progress Indicators:
• Number of audits and benchmarking completed and savings opportunities identified. • Number of ENERGY STAR labeled buildings. • Results from implemented audit measures. • Amount of Xcel Energy rebates spent in Boulder on commercial projects. • Increased collaboration with local business and property owners and contractors. • Annual reduction in energy consumption.
B. Industrial Sector: 10,898 mtCO2e by 2012 A primary strategy for reducing GHG emissions from the industrial sector is to increase the efficiency of industrial facilities by connecting industrial customers with external resources, such as Xcel’s rebate programs, Colorado State Industrial Assessment Center, Climate Leaders Program and energy service companies (ESCOs). A five percent reduction in sector energy use is anticipated by 2012.
Local Climate Leaders The EPA’s Climate Leaders program helps companies manage GHG emissions. Member companies with Boulder operations include: • Ball Corporation • Bank of America Corporation • IBM Corporation • Marriot Hotels • Roche • Target Corporation
Recommended Actions:
59

CITY OF BOULDER- CLIMATE ACTION PLAN
• Create industrial energy users group to share expertise, successes, and lessons learned. • 50 percent of industrial users participate in Xcel Energy’s rebate programs, particularly
recommissioning. • Connect industrial users with external resources. • Facilitate energy service company (ESCO) projects and performance contracting in the
Boulder market. • Support skill development for facility and operations managers. • Recognize companies’ commitments and results.
Progress Indicators:
• Amount of Xcel Energy rebates spent in Boulder on industrial projects. • Number of Climate Leaders participants and measurable goals. • Number of meetings with industrial users. • Annual reduction in energy consumption.
C. Residential Sector: 30,227 mtCO2e by 2012 The primary strategies for increasing energy efficiency in the residential sector are to maximize voluntary emissions reductions through education, outreach and marketing, connecting residents with available rebates and tax credits, and providing services not offered in the Boulder market. Sample services include subsidized energy audits, neighborhood sweeps and light bulb giveaways. Xcel plans to offer rebates for the following measures: evaporative cooling, installing their “Saver’s Switch,” efficient lighting, second refrigerator round-up, and an HVAC rebate program. It is recommended that the residential program in particular include grassroots elements, where actions are promoted and implemented on a neighborhood or block-by-block level. The recommended actions will result in approximately a 15 percent reduction in electricity use over 2004 levels.
Compact Fluorescent Light Bulbs
If every household in Boulder replaced its five most used light bulbs with ENERGY STAR CFL’s, greenhouse gas emissions would be reduced by 8,930 mtCO2e a year.
Recommended Actions:
• Increase promotion of existing resources and services, such as Longs Peak Weatherization, Home Performance with ENERGY STAR, Xcel rebates and federal tax credits.
• Continue city-sponsored weatherization program for households that meet established income qualifications.
• Continue compact fluorescent light bulb giveaways. • Develop user-friendly website that educates residents on how to reduce GHG emissions
in their homes and locate resources to help them implement measures. • Conduct neighborhood sweeps to distribute and install conservation kits to 300
households a year. • Support or implement single- and multi-family energy audit programs. • Work with local retailers and contractors to promote high efficiency equipment and
efficiency best practices to residents. • Explore bulk purchase and installation program for common energy efficiency materials,
such as insulation.
60

CITY OF BOULDER- CLIMATE ACTION PLAN
• Policy for minimum efficiency standards in affordable housing program. • Explore regulatory options, more aggressive building codes and standards, for future
implementation. Progress Indicators:
• Number of low-income and city-sponsored weatherization jobs completed. • Number of homes served under the Home Performance with ENERGY STAR program. • Number of conservation kits installed or distributed. • Increased collaboration with local retailers and contractors to promote high efficiency
products and services. • Annual reduction in energy consumption.
D. City Operations: 4,246 mtCO2e by 2012 Facilities and Asset Management (FAM) practices energy efficiency by continually trying to find ways to save energy in the city organization and improve the comfort of city buildings. While many energy efficiency retrofits were completed in the 1990s, opportunities remain to reduce energy use. Promoting a culture of energy conservation among the city’s employees is an important strategy for reducing energy use and an area of cooperation between FAM and the Office of Environmental Affairs. The analysis for this sub-sector assumes that the city will reduce electricity and natural gas use by 20 and 10 percent respectively from 2004 levels by 2012. It is assumed that funding for city organization efficiency improvements would not be from the GHG funding source. A possible strategy for funding the improvements is to institute a cost-allocation mechanism where each department contributes to an energy efficiency fund. It could operate similar to the Computer Replacement Fund. Additionally, the city could use energy service companies (ESCOs) to finance and implement projects. Recommended Actions:
• Set target of reducing city electricity use and natural gas use by 20% and 10%, respectively from current levels by 2012.
• Explore establishment of a cost-allocation system to fund energy efficiency improvements throughout the organization.
• Promote employee energy conservation. Progress Indicators:
• Annual reduction in energy consumption.
61

CITY OF BOULDER- CLIMATE ACTION PLAN
Summary of Estimated Benefits and Costs of Recommended Energy Efficiency Actions
Program
GHG emissions reduction by 2012
Private sector cost by 2012
Lifetime energy savings
Xcel Energy Rebates
Public sector cost
by 2012 Cost per ton Energy Efficiency: Commercial & Industrial 41,749 $28,874,600 $44,264,100 $9,474,235 $1,578,472 -$558 Residential 30,227 $6,760,000 $15,557,900 $228,165 $1,754,207 -$241 City Operations** 4,246 x $4,047,500 $650,000 $1,950,000 -$647 Total 76,222 $35,634,600 $63,869,500 $10,352,400 $3,332,679 -$437
*Savings assume no increase in energy prices. All costs factor in inflation. ** Total cost to public sector does not include city operations energy efficiency costs ($1.95M). SWITCH TO RENEWABLE ENERGY: 203,778 mtCO2e by 201234
The renewable energy actions focus on marketing, education, and renewable energy credit (REC) purchases for city facilities. They are estimated to require an annual budget of $56,438 to $110,385 for years 2007 to 2011, based on annual increases in renewable energy purchases. The current analysis shows that there will be a 60,000 metric ton deficit in 2012. The city will likely have to purchase over 72,000 MWh of wind power in 2012 to meet the Goal at a cost of around $900,000, factoring in inflation35. If greater emissions reductions are achieved over what is projected in the analysis, the 2012 city purchase will be reduced. The analysis also includes the city’s hydroelectric generation and the impact of Amendment 37. The analysis assumes a $0.01/kwh cost for wind through renewable energy certificates or Xcel’s Windsource program. Emissions reductions from solar PV installations are included in the Amendment 37 impact estimate. Emissions reductions from solar thermal installations are captured in the annual Xcel consumption reports through reduced natural gas consumption. While emissions reductions from solar PV and thermal systems are not directly counted towards the Goal, the city will actively promote solar installations. For example, the city is planning to waive sales tax on solar PV equipment, which will save approximately $1,000 on the cost of an average residential system. A. Commercial Sector: 31,289 mtCO2e by 2012
If 150 businesses sign up for wind power each year between 2007 and 2012, over 30,000 metric tons of carbon dioxide will be saved. This is the equivalent of taking 6,500 cars off the road for one year.
Raising awareness of the benefits of renewable energy and the available options is the primary strategy for increasing renewable energy use in the commercial sector. The Wind Challenge proved to be successful at motivating businesses to sign up and large retailers like Whole Foods and Safeway have acknowledged the value of buying 100 percent wind power. 34 This greenhouse gas emissions reduction estimate includes a 72,000 MWh wind power purchase in 2012. Since Boulder City Council selected a revenue structure on August 29th, 2006 that does not include this large renewable energy purchase in 2012, the greenhouse gas reduction would be 143,998 mtCO2e. Each year, staff will conduct further analysis and plan accordingly on how to meet the Goal through other means besides wind power purchases. 35 On August 29th, 2006, Boulder City Council selected a revenue structure that does not include a large renewable energy purchase in 2012 which was originally proposed as a part of the Climate Action Plan. As a result, the budget for 2012 in the Climate Action Plan has been revised and does not reflect the purchase of a large amount of renewable energy.
62

CITY OF BOULDER- CLIMATE ACTION PLAN
Recommended Actions: • Continue Boulder Wind Challenge with the goal of annually signing up 150 new business
customers for wind power. • Xcel Energy solar rebate and federal tax credit facilitation for onsite generation projects. • Provide education and outreach on technologies, EPA Green Power Partnership, how to
pursue renewable energy and financial resources. • Recognize companies for their renewable energy purchases. • Collaborate with local renewable energy suppliers to maximize visibility and promotion. • Explore program where businesses and/or city offers emissions offsets to customers. • Explore facilitation of bulk purchases of solar thermal and PV equipment for businesses.
Progress Indicators:
• Number of businesses that sign up for wind power. • Number of onsite generation projects. • Number of Green Power Partners. • Percent of electricity load supplied by renewable sources.
B. Industrial Sector: 21,797 mtCO2e by 2012 The primary strategies for increasing renewable energy use in the industrial sector are to educate industrial users on available renewable energy options, including on-site generation and how to subscribe to wind or implement projects. A 10 percent increase in sector renewable power use is anticipated by 2012. Recommended Actions:
• Work with industrial users to increase wind purchases or explore onsite generation projects.
• Provide education and outreach on technologies, EPA Green Power Partnership, how to pursue renewable energy and financial resources.
• Recognize companies for their renewable energy purchases. Progress Indicators:
• Number of businesses that sign up for wind power. • Number of onsite generation projects. • Number of Green Power Partners. • Percent of electricity load supplied by renewable sources.
C. Residential Sector: 16,913 mtCO2e by 2012 Similar to the commercial and industrial strategies, a primary strategy to increasing renewable energy use in Boulder is to raise awareness of the benefits and available options. The 2005 Wind Challenge succeeded in signing up 1,000 new wind power subscribers. Recommended Actions:
• Sign up 1,000 new residential customers for wind power each year. • Work with CRC to help residents understand renewable energy options and receive Xcel
Energy solar rebates and federal tax credits facilitation for solar PV.
63

CITY OF BOULDER- CLIMATE ACTION PLAN
• Collaborate with local renewable energy suppliers to maximize visibility and promotion. • Explore program where neighborhoods meeting a certain percentage of electricity needs
through renewable energy are recognized. • Explore facilitation of bulk purchases of solar thermal and PV equipment for
neighborhoods. • Evaluate a city incentive for PV systems.
Progress Indicators:
• Number of households that sign up for wind power. • Number of onsite generation projects. • Percent of electricity load from renewable sources.
D. City Operations: 3,999 mtCO2e by 2012 The city currently receives approximately 3% of its electricity from wind power. If the city organization receives 20% of its electricity from wind power by 2012, it would result in emissions reduction of 4,000 mtCO2e at cost of $56,670 in 2012 and every year beyond if the city wanted to continue to meet the target. It is assumed that the city would increase renewable energy purchases on an annual basis, arriving at 20% by 2012. The city has partnered with PowerLight to evaluate potential sites for a large solar PV installation and submit a bid to Xcel for its upcoming solar RFP process. Partnership with Boulder County is being explored. Recommended Actions:
• Establish policy of having 20% of the city’s electricity come from renewable sources by 2012.
• Explore additional on-site generation projects on city facilities. Progress Indicators:
• Annual wind power purchases. • Percent of electricity load from renewable sources.
Summary of Estimated Benefits and Costs of Recommended Renewable Energy Actions
Program
GHG emissions reduction by 2012
(mtCO2e)
Private sector cost by
2012
Public sector cost by
2012
Net cost per ton
($/mtCO2e) Renewable Energy: Commercial & Industrial 53,085 $677,976 $192,937 $16 Residential 16,913 $216,000 $158,237 $22 City Operations 3,999 x $188,183 $47 Amendment 37 35,000 x x x Hydroelectric Generation 35,000 x x x Total 143,998* $893,976 $539,357 $10
*This total GHG emissions reduction does not reflect a 72,000 MWh wind power purchase in 2012, since City Council selected a revenue structure on August 29th, 2006 that does not include this 2012 renewable energy purchase.
64

CITY OF BOULDER- CLIMATE ACTION PLAN
TRANSPORTATION: 40,000 mtCO2e by 2012 Although the transportation sector contributes about one third of Boulder’s emissions, currently little budget and emissions reductions are projected for this sector as major transportation initiatives are beyond the scope of the Office of Environmental Affairs and the GHG Program. Similarly, there is currently very limited local infrastructure for renewable fuels, such as ethanol and biodiesel, and only a small percentage of total vehicles that can operate on these fuels. Additionally, the 2005-06 budgets did not include staff or funding for transportation work, which resulted in very little work being completed in this sector.
Primary Transportation Strategies
• Reduce vehicle miles
traveled • Improve fuel economy • Use lower carbon fuels
The estimated annual operating budget for transportation efforts is currently ranges from $70,875 in 2007 to $106,278 in 2012 for an estimated reduction of 40,000 mtCO2e. One fixed-term FTE is being proposed to identify additional opportunities in this sector. Staff’s efforts will be focused on supporting the advance of renewable fuels into the Boulder market and regional or Transportation Division initiatives that will reduce emissions, as well as promoting low or no-carbon transportation options, such as walking, biking, and busing. Similar to other sectors, marketing and outreach are of paramount importance to establish the connection between transportation options, greenhouse gas emissions and global warming. Staff will continue to research new program ideas and will review program changes with Council during annual updates and the budget process. Recommended Actions:
• Support Transportation Master Plan (TMP) initiatives. • Work with Transportation staff to better incorporate GHG emissions reduction strategies
into the TMP. • Support Boulder County transportation initiatives, particularly those that build
infrastructure for ethanol and biodiesel. • Educate auto dealerships and vehicle owners about flexible fuel vehicles and ethanol. • Promote biodiesel and highly fuel efficient cars, including hybrid-electric vehicles. • Include information on website about how to receive rebates for hybrids. • Explore carbon offset program whereby drivers can offset the GHG impact of driving
through the purchase of renewable energy credits. Progress Indicators:
• Volume of ethanol and biodiesel sold in Boulder. • Number of hybrid vehicles registered in Boulder.
EDUCATIONAL CAMPAIGN: 30,000 mtCO2e by 2012 Robust marketing, education and outreach are critical to maximizing voluntary emissions reductions from all sectors and will be a part of every program. The campaign’s main objectives are to frame global warming as a serious problem and to connect residents and businesses with information, tools, and resources to help them take action. The annual budget for general marketing is estimated to be $202,125 to $219,116
65

CITY OF BOULDER- CLIMATE ACTION PLAN
Recommended Actions:
• Create and implement a communications plan to engage all sectors. • Produce creative and informational educational materials for widespread distribution. • Coordinate at least one major awareness-raising event a year. • Collaborate with local social and environmental groups on their events and marketing
efforts. WASTE REDUCTION Despite the city’s waste reduction efforts, the total volume of trash being generated and sent to the landfill may be increasing each year. In keeping with the city’s Zero Waste Resolution and Master Plan for Waste Reduction, aggressive waste prevention and increased producer responsibility initiatives must be employed to stem the overall growth of waste generation over time. The city has only recently begun collecting data on trash generation volumes and because the GHG inventory is based on the amount of total trash generated and not the percent or quantity of recycling, more data must be gathered and analyzed before reliable emissions reductions can be quantified for the solid waste sector. For the current implementation Plan, no emissions reductions or increases are projected for this sector. As data becomes available, this sector’s contribution to the Goal will be refined. WATER CONSERVATION Conserving water saves energy and reduces emissions by reducing the volume of water that needs to be treated by water and wastewater treatment plants. Reducing hot water use saves energy by reducing the amount of cold water that needs to be heated and used or stored. Emissions reductions from water conservation will be captured in the electricity and natural gas records provided by Xcel Energy and entered into the inventory maintenance system. Because the impact is expected to be relatively small and the energy savings will be captured in the community’s aggregate energy reports, no emissions reductions are specified for this sector. URBAN FORESTRY The city can increase emissions reduction benefits from urban trees by carefully maintaining the existing urban forest, both public and private. Key strategies are to plant additional trees to fill all available public planting spaces and bolster private tree planting efforts to increase total canopy cover. Increasing the urban forest canopy and lifespan of urban trees provides a significant positive impact. The recommended actions below relate to the Urban Forestry and Planning and Development Services programs and will follow priorities identified in those programs as budget allows, unless an outside funding source is created. Recommended Actions:
• Develop an Urban Forest Management Plan to better define policies and standards for long term care of the Boulder’s urban forest, including preserving and protecting existing trees, increasing public awareness of the value of our community forest, and maximizing the social, economic and environmental benefits of the community forest for current residents and future generations.
66

CITY OF BOULDER- CLIMATE ACTION PLAN
Public Land
• Increase planting so that, at a minimum, the number of trees being planted offsets the number of trees being removed for a 1:1 ratio. The Parks and Recreation Vision Plan proposes a 2:1 ratio of trees planted to trees removed. Secure additional funding from the Parks and Recreation Department and continue to partner with the Water Conservation Office to meet tree planting goals.
• Coordinate with FAM to consider, along with other budget priorities, planting additional trees in strategic locations around city facilities to maximize energy savings.
• Continue to plant large maturing/longer lived tree species through both city funded projects and private development projects to maximize carbon benefits over time.
• Request funding to improve enforcement of existing city code to increase survivability of trees planted in the public right-of-way through development.
• Consider land use code changes to improve the long-term survivability of trees on private and public land.
• Promote changes in land-use planning for long term benefits Private Land
• Potential collaboration between city departments and non-profits to offer low cost trees to residents to strategically plant for shade. Start with 100 trees in 2007 and increase with demand
• Develop an educational campaign to raise awareness among private property owners about strategic planting of trees for energy savings. Promote U.S. Department of Energy program, “Cool Communities”.
• Consider revisions to the Green Points Program Guidelines to better educate builders and home buyers and require strategic planting of trees for energy conservation for development projects.
• Determine the feasibility of strengthening the tree preservation requirements in the land use code for private development.
Progress Indicators:
• Number of trees planted on public property. • Number of trees planted on private property through partnerships with the City Water
Conservation Office, Trees Across Colorado and the Center for Resource Conservation. • Percent increase in citywide canopy cover measured on 5-year basis. • Percent increase in survivability of trees on both public and private property planted
through development. • Number of public trees removed on citywide basis to number of trees planted.
Due to a current lack of historical and readily verifiable data, emissions reductions from these actions are not included in the inventory. Energy savings are captured in the electricity and natural gas records provided by Xcel Energy. Staff will investigate the possibility of accounting for emissions reductions associated with new tree plantings.
67

CITY OF BOULDER- CLIMATE ACTION PLAN
CONCLUSION As this plan has outlined, achieving the Kyoto Protocol Goal requires not only a substantial financial commitment, but also the dedication of staff resources and political will. While the city recognizes that Boulder’s actions are far too small to impact global greenhouse gas emissions trends and the progression of global warming, Boulder seeks to encourage other communities around the country and world to implement strong greenhouse gas emissions reduction programs, beginning with Boulder County and its member cities. It is possible that partnerships with Boulder County and surrounding cities will reduce the estimated costs of the plan while increasing participation and adoption of emissions reduction measures.
68

CITY OF BOULDER- CLIMATE ACTION PLAN
ATTACHMENT A
RESOLUTION NO. 906
A RESOLUTION OF THE CITY COUNCIL OF THE CITY OF BOULDER ESTABLISHING A POLICY TO TAKE COST-EFFECTIVE ACTIONS THAT BENEFIT THE COMMUNITY BY REDUCING LOCAL GREENHOUSE GAS EMISSIONS
WHEREAS, the City of Boulder has a long history of protecting and enhancing environmental quality in the City; and WHEREAS, in January 2002 City Council reaffirmed their commitment to the environmental sustainability goal as one of four major Council goals; and WHEREAS, the City participates in the Cities for Climate Protection campaign and is developing a greenhouse gas emissions inventory for the City; and WHEREAS, in December of 1997, in Kyoto, Japan the United States joined the Parties to the United Nations Framework Convention on Climate Change in agreeing to reduce the emissions of greenhouse gases by 7 percent below 1990 levels, although the United States has not ratified this protocol; and WHEREAS, 81% of Boulder’s citizens believe reducing air pollution is important in improving the quality of life in Boulder, according to the results of the 2001 Boulder Citizen Survey; and WHEREAS, in August 2001 the Boulder Valley Comprehensive Plan was updated and includes specific policies related to global climate change and energy use aimed at reducing air pollution, increasing energy efficiency and conservation, increasing the use of renewable energy in the community, and limiting growth in the use of all non-renewable energy resources, accommodating new growth by an overall per capita decrease in energy use; and WHEREAS, there is increasing scientific evidence that carbon dioxide (CO2) and other greenhouse gases released into the atmosphere will have a profound effect on the Earth’s climate, increasing the risk to municipal governments from increased extreme weather events, changing rainfall and crop productivity patterns, and migration of infectious diseases; and WHEREAS, local government actions taken to reduce greenhouse gas emissions through increased energy efficiency, reduced vehicle miles traveled, and waste reduction can provide multiple local benefits by decreasing air pollution, creating jobs, extending landfill life, and reducing energy expenditures for the City, its businesses and its citizens; and
69

CITY OF BOULDER- CLIMATE ACTION PLAN
WHEREAS, the Council intends for the City to take a leadership role in increasing energy efficiency and reducing greenhouse gas emissions from municipal operations; NOW THEREFORE, BE IT RESOLVED BY THE COUNCIL OF THE CITY OF BOULDER as follows:
Section 1. Council hereby declares its intent that the City shall identify and implement actions that will reduce Boulder’s contribution to total global greenhouse gas emissions, in direct support of the Boulder Valley Comprehensive Plan and the Council's Environmental Sustainability Goal.
Section 2. The City Manager is hereby directed to develop a local action plan to establish a specific reduction goal for Boulder and an implementation schedule for the reduction measures identified above in section 1 by September 30, 2002. The local action plan will be developed with the initial goal of being in alignment with the Kyoto Protocol target of reducing greenhouse gas emissions 7% below the estimated 1990 level of greenhouse gas emissions generated in the city of Boulder, while achieving cost effectiveness in each program.
Section 3. The City Manager shall annually submit to City Council a report that evaluates the progress of City staff on greenhouse gas reduction efforts, recommends actions for consideration in the upcoming budget cycle, and identifies additional greenhouse gas reducing activities that merit consideration two or more years into the future.
Passed and adopted at a regular meeting of the City Council held this day of 2002.
______________________ Mayor
ATTEST:______________________ City Clerk
70

City of Boulder
Office of Environmental Affairs
303-441-4900
www.environmentalaffairs.com


