1 CITY OF CHICAGO GREEN ROOF TEST PLOT STUDY Kevin LaBerge, Kimberly Worthington Chicago Department of Environment Peter Mulvaney, Rick Bolliger MWH Abstract To investigate temperature and storm water runoff characteristics the City of Chicago Department of Environment conducted an experiment under local conditions comparing green roofs versus conventional roofs. Nine sheds with 36 square feet of roof surface were constructed. Six of the sheds were outfitted with vegetated green roofs, one with a white reflective surface roof, one with a black tar roof, and one with a stone roof. Each roof was imbedded with temperature sensors. Seven of the nine sheds were also equipped to collect and measure the volume and rate of storm water runoff. Data were collected from May through September 2004. Experimental results demonstrated that the green roofs were consistently cooler (up to a 28° C cooler) than the conventional roofs during hot, sunny days. Additionally, the storm water runoff measurements showed the experimental green roofs reduced the volume of rooftop runoff by 5-100% as compared to the white reflective surface roof. Introduction The City of Chicago, led by Mayor Richard M. Daley, is focused on being an international leader in sustainable development and environmentally conscious urban programs. Promoting the installation of green roofs is part of the City’s greening program. The Chicago Green Roof Test Plot Study is an ongoing experiment designed to gather regional information on the performance of green roofs. This paper addresses the stormwater and temperature data that have been collected and analyzed in the years 2003 and 2004. Chicago has a long history of engineering solutions to manage stormwater issues. In 1855 and 1856 the Chicago Drainage Commission adopted resolutions ordering that the grade elevation throughout the city be raised four to seven feet to insure proper drainage to the Chicago River (1). Buildings were literally lifted out of the mud. Chicago then engineered the first river reversal in 1900, forcing the Chicago River to run away from its mouth to protect the City’s drinking water source, helping to resolve Chicago’s epidemics of typhoid fever, cholera, and dysentery (2). In the late 1960’s the Tunnel and Reservoir Plan was designed, and is a keystone piece of the world’s largest sewer system (3). Today, Chicago is once again on the cutting edge of stormwater management by developing the science to make green roof technology a success in Chicago. The Chicago Green Roof Test Plot Study has been engineered to collect data on numerous storm events and compare the results across different green roof and conventional roof applications.
Transcript
1
CITY OF CHICAGO GREEN ROOF TEST PLOT STUDY
Kevin LaBerge, Kimberly Worthington Chicago Department of Environment
Peter Mulvaney, Rick Bolliger
MWH Abstract To investigate temperature and storm water runoff characteristics the City of Chicago Department of Environment conducted an experiment under local conditions comparing green roofs versus conventional roofs. Nine sheds with 36 square feet of roof surface were constructed. Six of the sheds were outfitted with vegetated green roofs, one with a white reflective surface roof, one with a black tar roof, and one with a stone roof. Each roof was imbedded with temperature sensors. Seven of the nine sheds were also equipped to collect and measure the volume and rate of storm water runoff. Data were collected from May through September 2004. Experimental results demonstrated that the green roofs were consistently cooler (up to a 28° C cooler) than the conventional roofs during hot, sunny days. Additionally, the storm water runoff measurements showed the experimental green roofs reduced the volume of rooftop runoff by 5-100% as compared to the white reflective surface roof. Introduction The City of Chicago, led by Mayor Richard M. Daley, is focused on being an international leader in sustainable development and environmentally conscious urban programs. Promoting the installation of green roofs is part of the City’s greening program. The Chicago Green Roof Test Plot Study is an ongoing experiment designed to gather regional information on the performance of green roofs. This paper addresses the stormwater and temperature data that have been collected and analyzed in the years 2003 and 2004. Chicago has a long history of engineering solutions to manage stormwater issues. In 1855 and 1856 the Chicago Drainage Commission adopted resolutions ordering that the grade elevation throughout the city be raised four to seven feet to insure proper drainage to the Chicago River (1). Buildings were literally lifted out of the mud. Chicago then engineered the first river reversal in 1900, forcing the Chicago River to run away from its mouth to protect the City’s drinking water source, helping to resolve Chicago’s epidemics of typhoid fever, cholera, and dysentery (2). In the late 1960’s the Tunnel and Reservoir Plan was designed, and is a keystone piece of the world’s largest sewer system (3). Today, Chicago is once again on the cutting edge of stormwater management by developing the science to make green roof technology a success in Chicago. The Chicago Green Roof Test Plot Study has been engineered to collect data on numerous storm events and compare the results across different green roof and conventional roof applications.
2
As with most major urban areas, high summer temperatures and poor air quality are issues that adversely impact human health, lead to lost business and a reduced quality of life. Urban landscapes tend to capture and store heat more than their rural or natural counterparts, leading
to warmer temperatures and a phenomenon called the Urban Heat Island Effect (4). Warmer temperatures induce residents to increase their use of air conditioning, which is an energy intensive activity. Higher temperatures and increased power plant emissions can, in turn, exacerbate urban air quality issues. Green roofs provide one step towards lowering the urban heat signature. The Chicago Green Roof Test Plot Study attempts to quantify the hypothesized temperature benefits by collecting data at different horizons of the roof plots. Although this experiment has many objectives, all are based upon one central principle: to collect regional data that can assist policy makers in development of the best green roof practices for the Chicago area. Experimental Design Site Layout The design of this experiment allows a direct comparison of
various roofing applications on equivalent structures, under comparable environmental conditions. Nine experimental rooftop units, each 3.5-feet high with 36 square-foot roofs, were designed and constructed for performance comparisons of vegetated green roofs versus conventional roofs. Six of the sheds (the Green Roofs) were outfitted with proprietary green roof applications donated and installed by six vendors (all green roofs were vegetated with the same species composition, consisting of a variety of Sedums). Stone, black tar, and white reflective surface roofs were applied to the remaining three sheds (hereinafter referred as Stone, Black Tar, and WRS sheds, respectively). All nine units were placed on a gravel pad at the Chicago Center for Green Technology (CCGT)1 (Photo Plate and Exhibit 1). Structure Design All nine sheds were constructed according to the same design specifications and materials. The design criteria included the capacity to hold 65 pounds per square foot, the use of recycled
1 CCGT is located at 445 North Sacramento Boulevard, Chicago, Illinois
Exhibit 1 Green Roof Test Plot Concept Design
3
materials (recycled plastic lumber), stormwater runoff collection, and a requirement to be portable by forklift. A conceptual representation is shown in Exhibit 1. Stormwater Collection & Measurement Design The substratum roof of each unit was pitched at two degrees towards a 1.5-inch by 5.5-foot slot drain. The slot drained to an internal PVC gutter system that conveyed water to a 45-gallon plastic rain barrel with a functional rain barrel capacity of 40 gallons, which corresponded to approximately 1.8-inches of rain. A six-inch parapet wall extended above the substratum roof and was designed to route the stormwater runoff to the slot drain. Within the rain barrel was a pressure transducer2 powered by a 12-volt car battery and data were recorded every 6 minutes by a data logger3. Temperature Measurement Design Each Green Roof shed was monitored for temperature at four locations (Exhibit 2). The other three roofs had sensors in comparable locations, with the exception of the soil sensor. Within each shed, a data logger4 recorded temperature readings at 15-minute intervals from sensors5 located at each horizon (Exhibit 2, Table 1).
Table 1 Temperature Sensor Horizons
Horizon ID Temperature Sensor Location Ambient Attached to the weather station located at the project site. Shield Located under a radiation shield, 2” above the roofing surface. Rooftop Located on the roof surface. Soil Buried 1.5 inches below planting medium surface (Green Roofs only). Membrane Located just below the impermeable membrane, sealed with foam
insulation. Each unit had in situ sensors and data logging equipment. Baseline ambient weather conditions (temperature, rainfall, wind speed and direction, and relative humidity) were recorded using an onsite weather station6. Data were periodically downloaded and transferred to a database for analysis.
2 Omega Engineering, Inc.: Pressure Transducer, Model Number PX439-002GI 3 Omega Engineering, Inc.: Two Channel Data Logger, Model OM-42 4 Onset Computer Corporation: HOBO® 4-Channel External Data Logger, Model H08-006-04 5 Onset Computer Corporation: Temperature Sensors, Models TMC-HD and TMC-HA 6 Onset Computer Corporation: HOBO® Weather Station equipped with temperature, wind speed and direction, and rainfall sensors.
Exhibit 2 :Temperature Sensor Locations
4
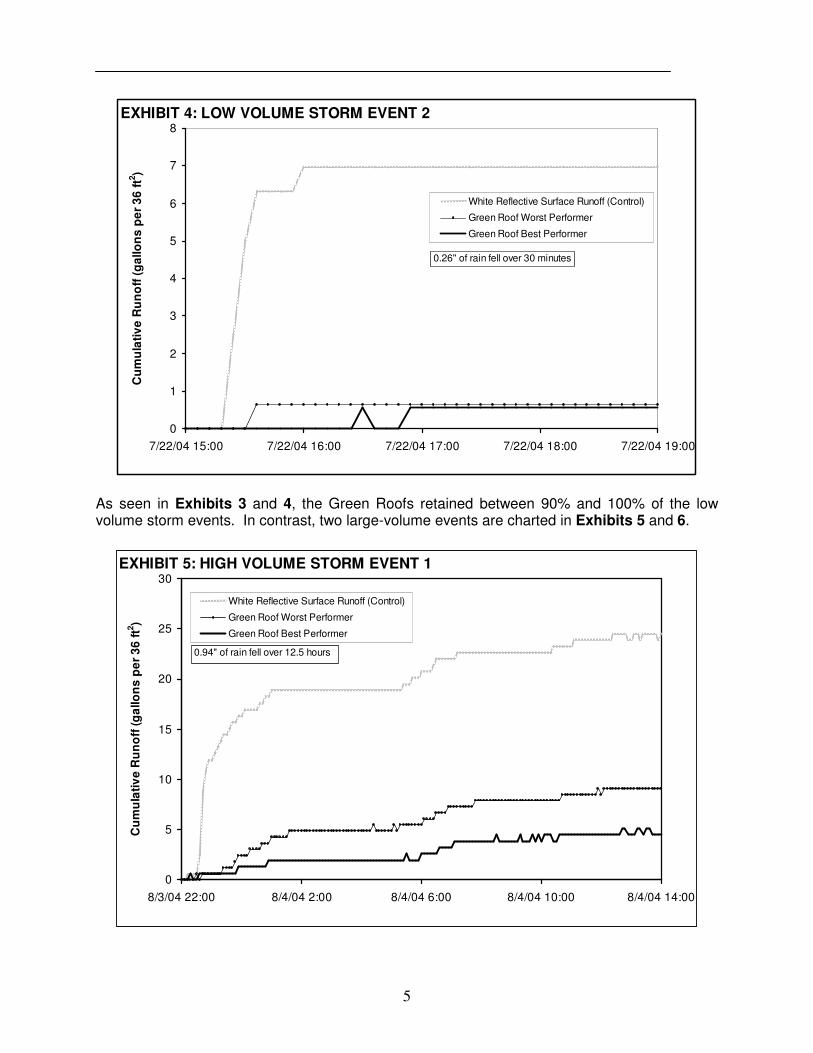
Results Data have been collected during 2003 and 2004. Specific examples cited in this report were collected during 2004, but previously observed patterns and trends demonstrate data reliability. Stormwater Runoff Natural storm events were continuously monitored. Events were classified based on total rainfall rather than intensity or duration: (1) less than 0.3 inches as “low volume” and (2) greater than 0.9 inches as “large volume” events. Data from selected storm events are presented in Exhibits 3, 4, 5 and 6, where time is plotted on the abscissa and rain volume collected (runoff) on the ordinate. Green Roofs were evaluated based on the total runoff collected, compared with the runoff from the WRS shed (control). The storm events were recorded over time by the onsite weather station and noted in the chart graphic.
Exhibits 3 and 4 represent two low volume storm events, when even the most poorly performing Green Roof retained 90% of the water (as a percentage of water running off of the control, WRS roof).
As seen in Exhibits 3 and 4, the Green Roofs retained between 90% and 100% of the low volume storm events. In contrast, two large-volume events are charted in Exhibits 5 and 6.
In each of the two large-volume storm events (Exhibits 5 and 6), roughly one inch of rain fell over a period ranging from six to twelve hours. In Exhibit 5, the Green Roofs retained between 63% and 79% of runoff compared to the WRS roof (the control roof). In Exhibit 6, the WRS rain barrel filled to capacity during the storm, and therefore did not collect the entire storm event. Nevertheless, Exhibit 6 reveals a good example of the test plots during an intense storm event during which the Green Roof quickly became saturated. At the time the rain barrel reached capacity, the Green Roofs had retained between 17.4% and 31.0% of the total rainfall.
Table 2 Stormwater Runoff Retained by Green Roofs
* Not included due to equipment malfunction or data gaps Highlighted data represent retained runoff greater than 80% of WRS roof (control roof).
A cumulative analysis of 2004 storm event periods is tabulated in Table 2, showing the percent of stormwater runoff retained by each green roof (reported as a percentage of the WRS runoff) during two-week data upload periods. These calculations reveal that for individual or cumulative storms less than one inch, the Green Roof retained between 76% and 100% of the runoff (mean 94%). However, for storm events greater than one inch, the results were much more variable: the Green Roofs retained between 5% and 95% of the runoff (mean 43%). The Green Roofs retained, on average, 0.4 gallons per square foot of roof surface. Individual and cumulative rain events analyzed revealed retention values between 0.0 and 1.0 gallons per square foot. Exhibit 7 represents the percent of total runoff collected at five sheds7 from May through September 20048. From this dataset, between 56% and 66% of the rainfall was retained by each of the four Green Roofs. The WRS, which acted as a control, shows close to 11% retention of stormwater. These results are consistent with the results collected in 2003, which average 70% retention by the Green Roofs over a comparable time period.
Exhibit 7: Stormwater Runoff and Retained, May 7 - September 17, 2004
0%
20%
40%
60%
80%
100%
Green Roof #2 Green Roof #3 Green Roof #4 Green Roof #6 WRS
Rai
nfal
l (%
of W
eath
er S
tatio
n To
tal)
Retained Runoff
Temperature Exhibit 8 is a plot of raw temperature data collected from the membrane horizon, which illustrates the best-performing Green Roof9 and the three non-green roof sheds. Exhibit 9 plots temperature data over the same time period at the rooftop horizon. These two days were chosen to represent typical warm summer days. These plots indicate that the Black Tar roof reaches higher maximum temperatures than the other roof sheds. It also indicates that the WRS roof and Stone roof perform similarly to the Green Roof at the rooftop horizon. At the membrane level the Green Roof outperforms the other three roof materials by minimizing daytime temperatures. At the membrane horizon, the
7 Green Roofs #1 and #5 are not shown due to data gaps. 8 The stormwater runoff results in Exhibit 7 are limited to cumulative storm events that did not exceed the capacity of the rain collection barrel during each two-week data collection period (about 40 gallons). 9 Green Roofs were evaluated based upon temperature data. Green Roofs that remained coolest during warm daytime temperatures and minimized daily temperature fluctuations were determined to be the “best performing.”
8
best-performing Green Roof moderated temperature extremes, especially when compared to the Black Tar roof. It is also notable that the Green Roof membrane temperature reaches its daily maximum several hours after the other roofs. Delaying the peak temperatures could reduce air conditioning and peak energy demands.
EXHIBIT 8: TEMPERATURE AT MEMBRANE HORIZON
10
15
20
25
30
35
40
45
50
55
60
31-Jul 1-Aug 2-Aug
Deg
rees
Cel
cius
Black Tar
Stone
White Reflective Paint
Green Roof Best Performer
EXHIBIT 9: TEMPERATURE AT ROOFTOP HORIZON
10
15
20
25
30
35
40
45
50
55
60
31-Jul 1-Aug 2-Aug
Deg
rees
Cel
cius
Black Tar
Stone
White Reflective Paint
Green Roof Best Performer
Exhibits 10 and 11 plot the daily maximum temperature of the three more conventional roofs normalized to the mean maximum temperature of the six Green Roofs at the membrane and rooftop horizons, respectively. The resultant graph shows how peak daily temperatures at the more conventional roofs compare to the average green roof maximum temperature (an error bar shows one standard deviation of the green roof mean).
White Reflective SurfaceBlack TarStoneGR Standard Deviation
EXHIBIT 11: MEMBRANE HORIZONDaily Maximum Temperature Normalized to the Daily Green Roof Maximum Temperature
Exhibits 10 and 11 demonstrate that the Black Tar roof maximum temperatures exceed the average Green Roof maximum temperature at both the rooftop and the membrane horizons. At the rooftop horizon, the WRS and Stone roofs were only occasionally cooler than the average
0.0 on the y-axis represents the mean of the maximum temperatures of the six Green Roofs
0.0 on the y-axis represents the mean of the maximum temperatures of the six Green Roofs
10
Green Roof maxima, but generally within one standard deviation of the Green Roof mean. However, at the membrane horizon, warmer maximum temperatures are evident in the three conventionally roofed sheds. When the comparisons illustrated in Exhibits 10 and 11 are calculated over the entire 2004 study period, on average (mean) the Black Tar roof reached daily maximum temperatures 10.1 ºC and 13.6 ºC warmer than the Green Roofs (mean of the six daily Green Roof maxima) at the rooftop and membrane horizons, respectively. On the day with the greatest difference in temperature peaks, the Black Tar roof was 27.8 ºC warmer than the Green Roofs. The daily peak temperatures at the WRS roof were on average 1.3 ºC and 3.9 ºC warmer than the Green Roof maximum temperatures, respectively at the rooftop and membrane horizons, with a maximum of 14.9 ºC warmer. At the Stone roof, the daily peak temperatures were on average 3.1 ºC and 4.0 ºC warmer than the Green Roof maximum temperatures, respectively at the rooftop and membrane horizons, with a maximum of 16.1 ºC warmer. Discussion This experiment isolated green roofs and three conventional roofing materials (black tar, stone, and white reflective surface) on test plot sheds, and measured temperature and stormwater runoff characteristics of each. The data revealed differences between the roof types for both temperature and stormwater runoff. The results revealed that for storm events less than one inch, the Green Roofs retained between 76% and 100% of the runoff10 (mean 94%). In comparison, for storm events greater than one inch, the Green Roofs retained between 5% and 95% of the runoff (mean 50%). The results of the study indicated that Green Roofs substantially reduced runoff from small storm events. For larger storm events, the benefits primarily occurred in the early stages of the storm, as the growth media and plant matter absorb and retain the early volume. Green Roofs can delay the start of the runoff and potentially moderate the sewer peak flows, but once a roof is saturated, the runoff performance is comparable to a conventional roof. Nonetheless, this retention of storm water has value to the operators of storm sewer systems. In Chicago, most of the stormwater is directed to a central conveyance tunnel (the Tunnel and Reservoir System, TARP). Reduction of flows to this system would reduce treatment costs, and alleviate strain on the system. Moreover, the small areas served by separated storm sewer systems (primarily along the Chicago River System) that produce stormwater discharge could benefit by reducing the urban runoff into the river system. Stormwater runoff data collected in 2004 were consistent with data collected during 2003, yielding several notable results. First, the 3-5 inch Green Roofs revealed greater than 50% reduction of runoff of storm events over each of the two years sampled. Second, not all rain falling on conventional roofs makes it to the sewer systems - factors such as evaporation, impoundment, roof grade, micro-topography, and coating the surface have some retention value. Third, a seasonal and year-round regional estimate of green roof storm water retention would be helpful to understand the long-term impacts of green roofs to Chicago. The temperature results clearly show that the green roofs have reduced maximum temperatures at the membrane (between the subroof and green roof) horizon. If cooler roof temperatures lead to cooler building temperature, this suggests a correlating reduction in energy demands for 10 Reported as a percentage of the runoff compared to the WRS roof (control roof).
11
air conditioning. Moreover, a reduction in energy demand for air-conditioning would, in turn, suggest a reduction in emissions. If lower roof temperatures lead to lower building temperatures, then decreased energy demand, could lead to decreased energy production and lead to enhanced air quality. In terms of rooftop surface temperatures, the green roofs were not significantly cooler than the stone or white reflective surface roofs at the roof surface. This may be due to the local variation on the green roof surface – whether the sensor was in the shade or exposed, or it could simply be that the green roofs absorb comparable levels of energy. There is a growing body of compelling evidence that green roofs behave differently than conventional roof surfaces. In Chicago, the anecdotal evidence is being supported by deductive experimentation. In addition to these measurable benefits, Chicagoans also hope to enjoy the as of yet unquantified increases wildlife, aesthetic, and improved air quality benefits. In short, Chicagoans could expect an improved quality of life.
Photo Plate Photo 1
Test Plot Layout Photo 2
White Reflective Surface Roof
Photo 3 Black Tar Roof
Photo 4
Stone Roof Photo 5
CCGT Green Roof
References 1. Chicago Public Library, Chicago Timeline.
http://www.chipublib.org/004chicago/timeline/stlevels.html 2. Chicago Public Library, Chicago Timeline.
http://www.chipublib.org/004chicago/timeline/riverflow.html 3. Report by the Comptroller General of the United States, NCCPD-5, CED-79-77, May 15,
1979. 4. Stone, B. and M. O. Rodgers. 2001 Urban Form and Thermal Efficiency: How the Design of
Cities Influences the Urban Heat Island Effect. Journal of the American Planning Association, Vol. 67, No. 2.