CITY OF CORSICANA FLOOD PROTECTION PLANNING STUDY The City of Corsicana Navarro County, Texas and the REGEN EO 2 9 '2.G0 1 Texas Water Development Board May 2001 HalfT Associates, Inc. •AS WATER DEVELOPMENT BOARD Dallas • Fort Worth • Houston • McAllen
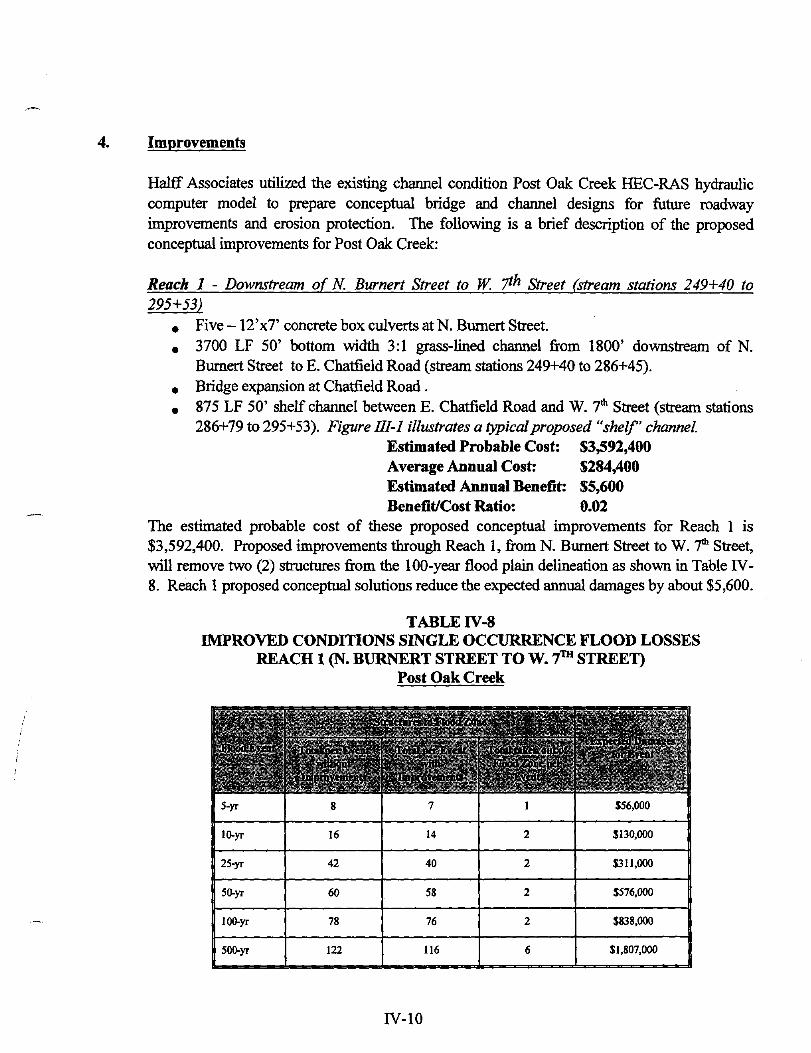
Transcript
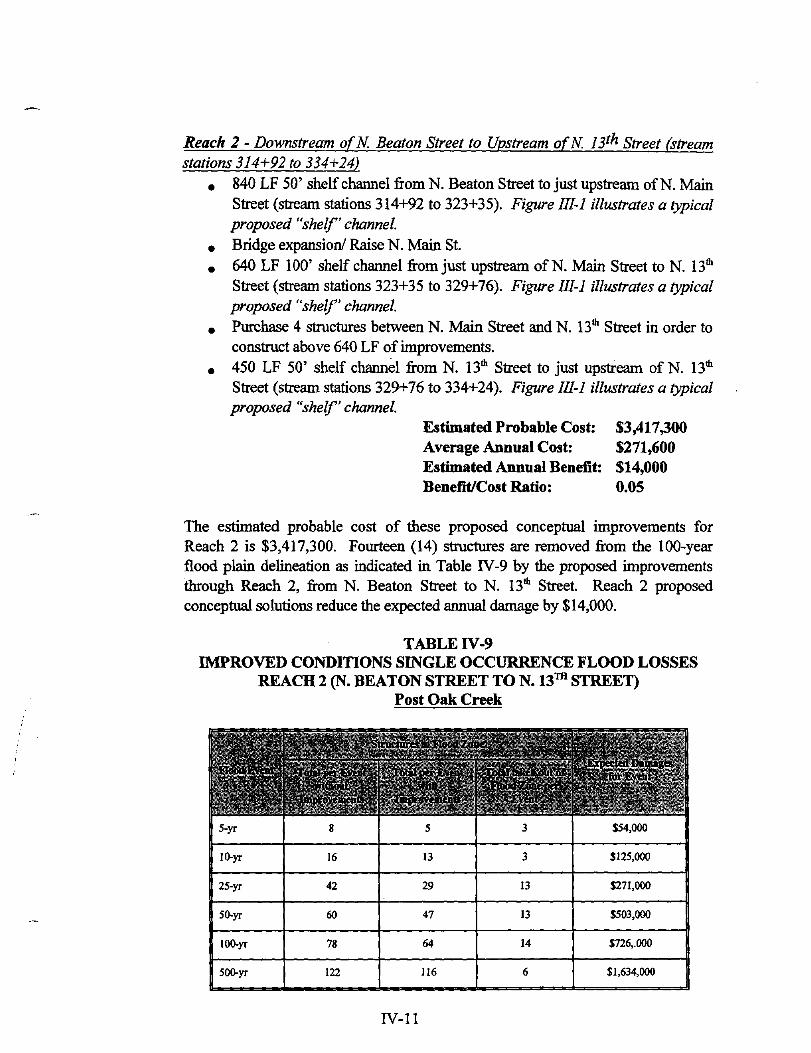
CITY OF CORSICANA
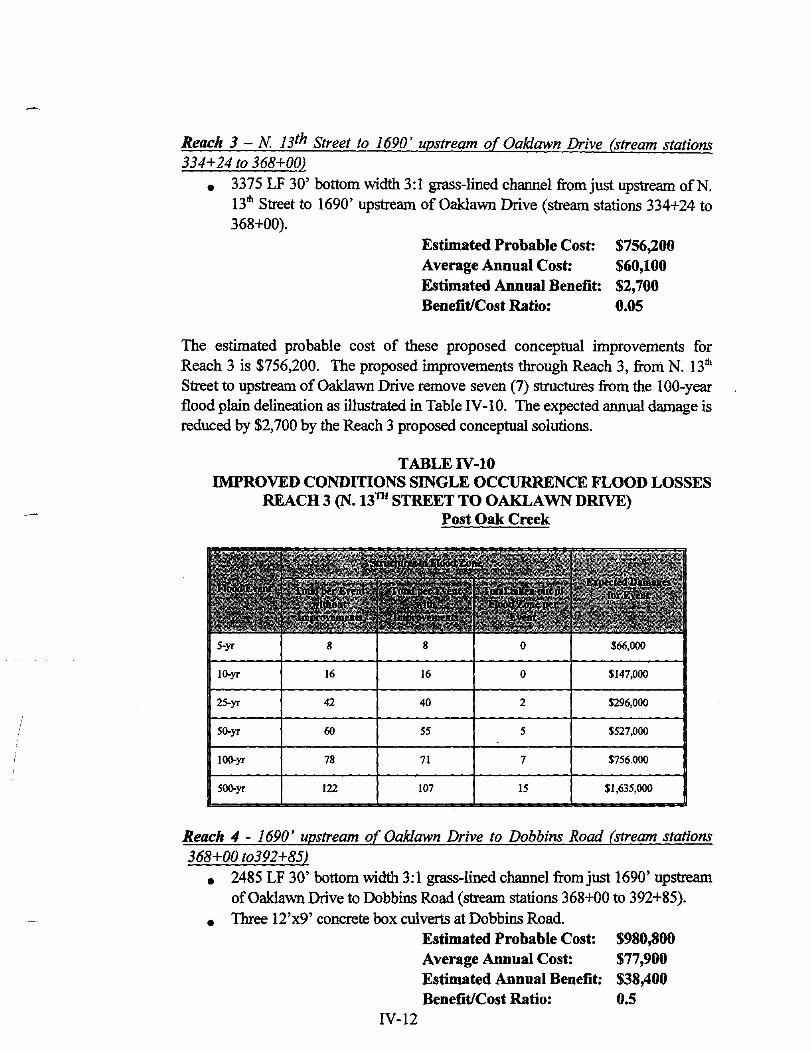
FLOOD PROTECTION PLANNING STUDY
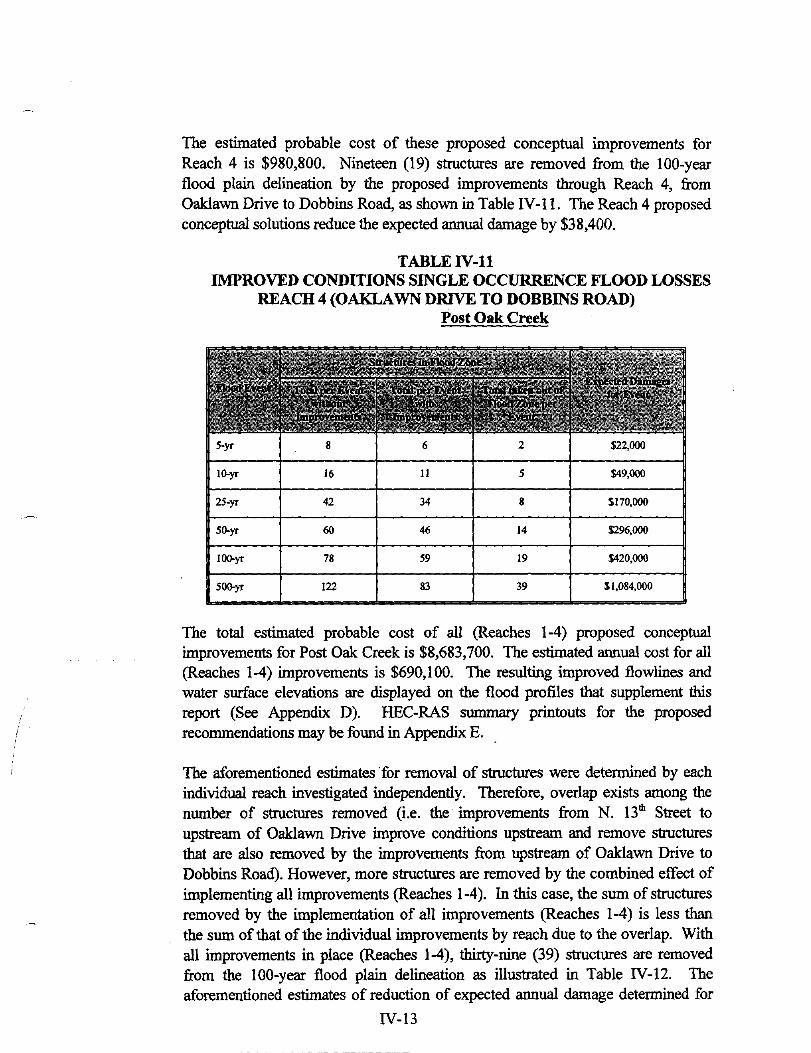
The City of Corsicana Navarro County, Texas
and the
REGEN EO
t-~~i\'l 2 9 '2.G0 1
Texas Water Development Board
May 2001
HalfT Associates, Inc. •AS WATER DEVELOPMENT BOARD
Connie Standridge, PE. City of Corsicana 200 N. 12th Street Corsicana, Texas 75110
Re: Flood Protection Planning Study for the City of Corsicana, Texas
Dear Ms. Standridge:
4000 FOSSIL CREEK BOULEVARD FORT WORTH, TEXAS 76137
(817) 847-1422 METRO (817) 429-9975 FAX (817) 232-9784
May 11,2001 AVO 18175
Transmitted herewith is one (1) unbound and five (5) bound copies of the Final Report entitled Flood Protection Planning Study for the City of Corsicana, Texas.
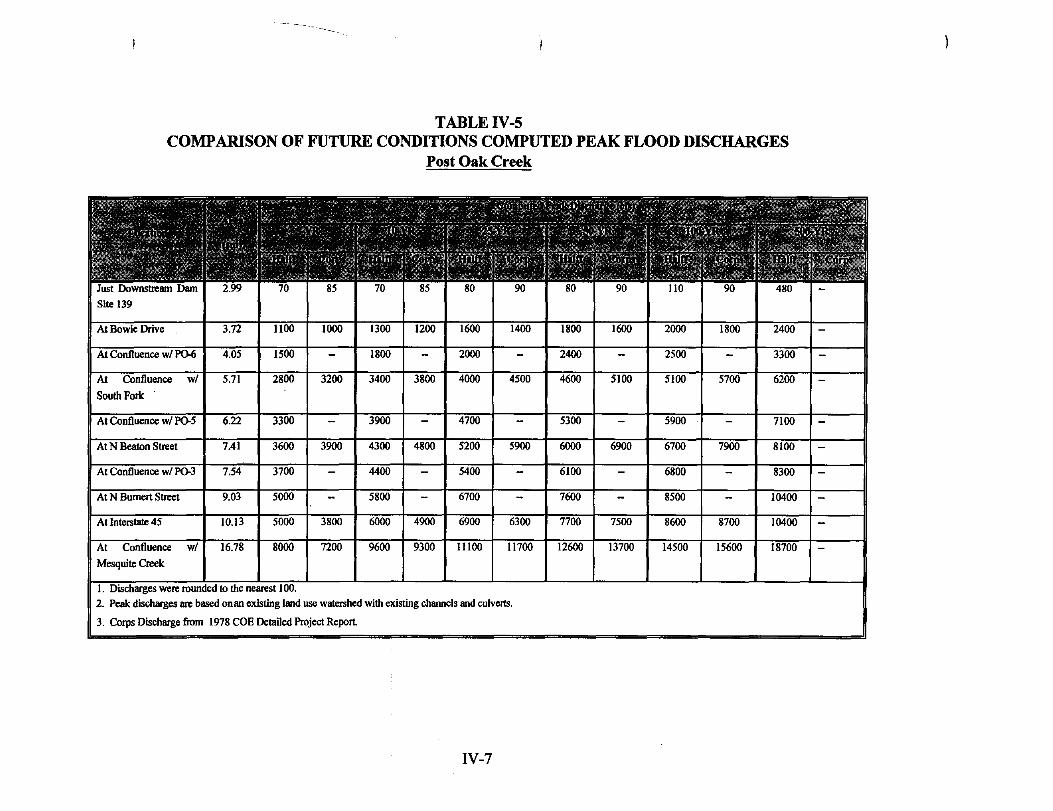
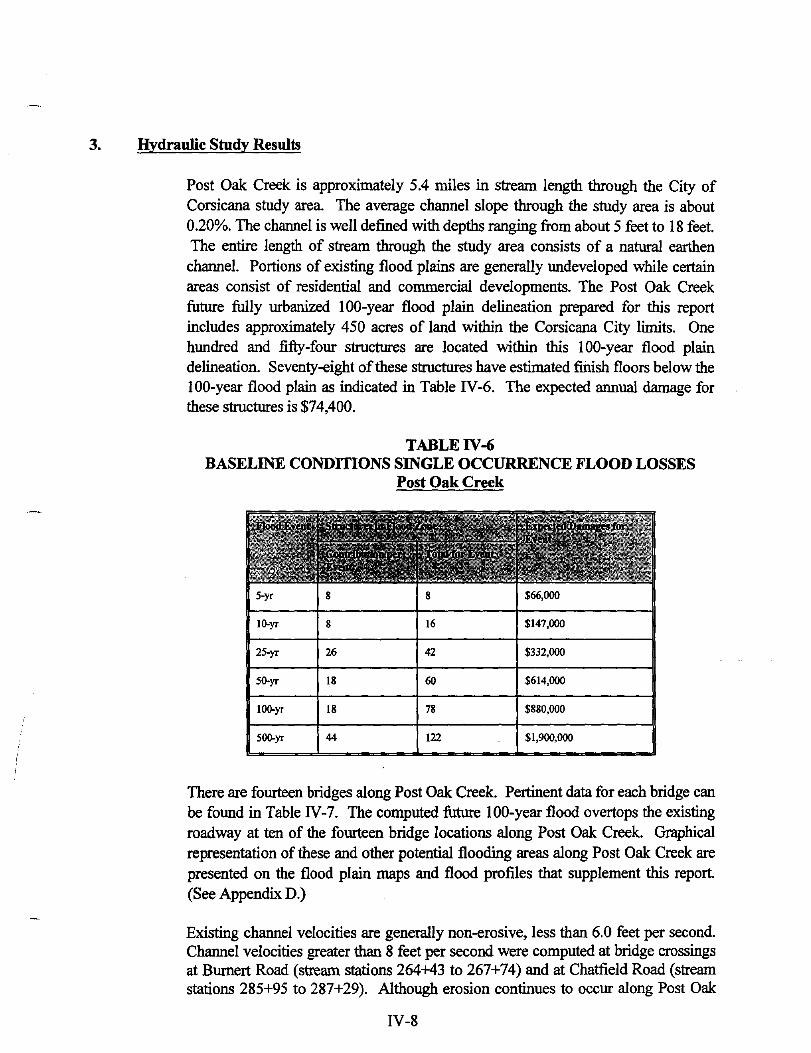
This final report includes a discussion of study procedures, alternative methods of reducing flood damages, results of technical analyses, and recommended plans to help alleviate flood damages in the study area. Final submittal of detailed Post Oak Creek drainage area delineation, I 00-Year Flood plain Maps, and Flood Profiles are presented in Appendix D, which supplement this report.
It has been a privilege and a challenge for our firm to prepare this report and begin developing a storm water management plan for the City. Halff Associates is especially appreciative of the cooperation of the Corsicana residents and landowners as well as the members of the city staff, city council, and Texas Water Development Board who have assisted in the development of this study.
TRANSPORTATION • WATER RESOURCES • LAND DEVELOPMENT • MUNICIPAL • ENVIRONMENTAL • STRUCTURAL MECHANICAL • ELECTRICAL • SURVEYING • GEOGRAPHIC INFORMATION SYSTEMS
ARCHITECTURE • LANDSCAPE ARCHITECTURE • PLANNING
«<IOI'osaCIIIE!lkVD. FaltT ... TM.TEXQ Mill
•tJM?-t411
,_IIUIIM.-TM.tll
·- 11'" !HI• .. ID Ll~l .. •M.UU-MIIil.uQIGIIJICIUAI
Uartl'\.--oum•••ru--u
-;;;:; --
LEGEND I ----- Ull'l. ~ rLOCIO .......
• ._ 100-YEM USE R.0G0 1Lh'A11CII .U
,., - CfiOSS BnDHI J _____ _
"~Ciitll..t
CITY OF CORSICANA RGYRE FLOOD PROTECTION PLANNING STUDY
FLOOD PLAtl OVERALL LAYOUT
TABLE OF CONTENTS
Letter of Transmittal Table of Contents ........................................................................................................... i List of Tables ............................................................................................................... iii List of Figures .............................................................................................................. iv List of Figures in Appendix D ....................................................................................... v Acknowledgements ........................................................................................................ vi Glossary ofTenns .......................................................................................................... vii Executive Summary ....................................................................................................... ix
I. INTRODUCTION A. General ............................................................................................................... I-1 B. Purpose ofReport .............................................................................................. I-1 C. Community Description .................................................................................... I-3 D. Principal Flood Problems .................................................................................. I-4
ll. STUDY PROCEDURES A. Hydrologic Studies ............................................................................................ II-1 B. Hydraulic Analyses ............................................................................................ II-6 C. Flood Plain Delineation ..................................................................................... II -7 D. Design Criteria for Improvements ..................................................................... II-8 E. Design Constraints ............................................................................................. II-8 F. ·Economic Analysis ............................................................................................ II-9
ill. METHODS OF REDUCING FLOOD DAMAGES A. Introduction ........................................................................................................ ill-1 B. NoAction ........................................................................................................... ill-1 C. Non-Structural Measures ................................................................................... ill-2 D. Structural Measures .............................................. -..... -... ; .................................... ill-6 E. Relief Measures ................................................................................................. ill-1 0 F. North Central Texas Council of Governments
Flood Plain Management Policies ..................................................................... ill -11 IV. STUDY RESULTS
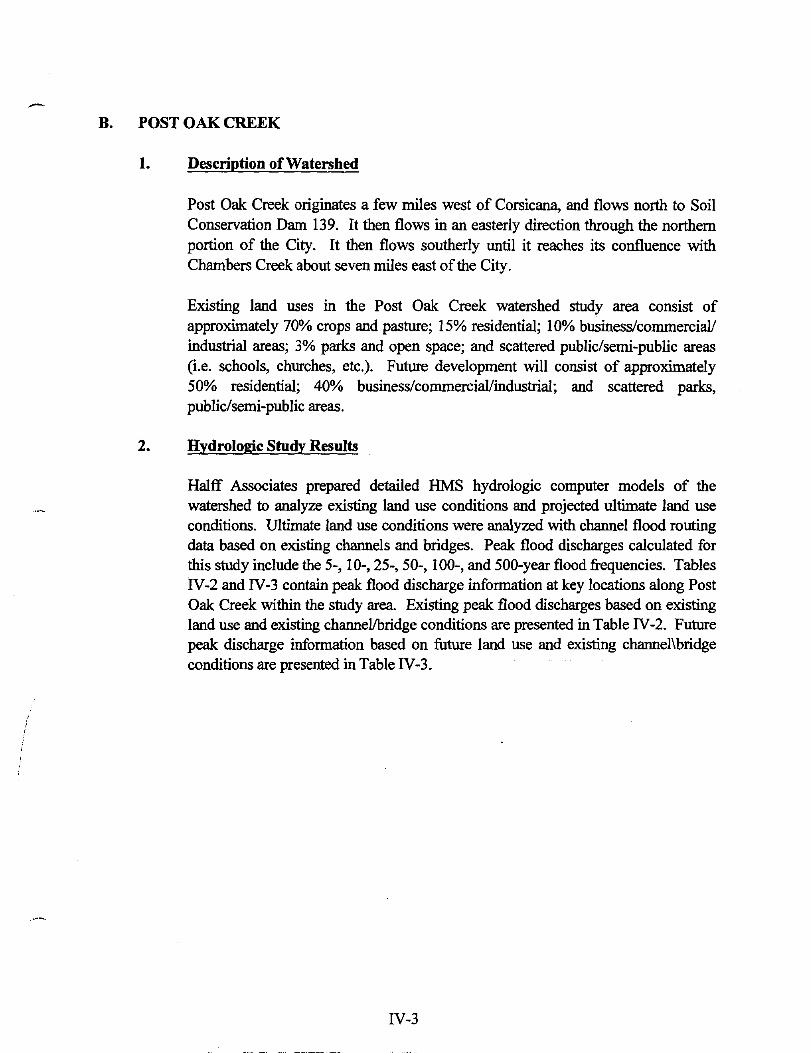
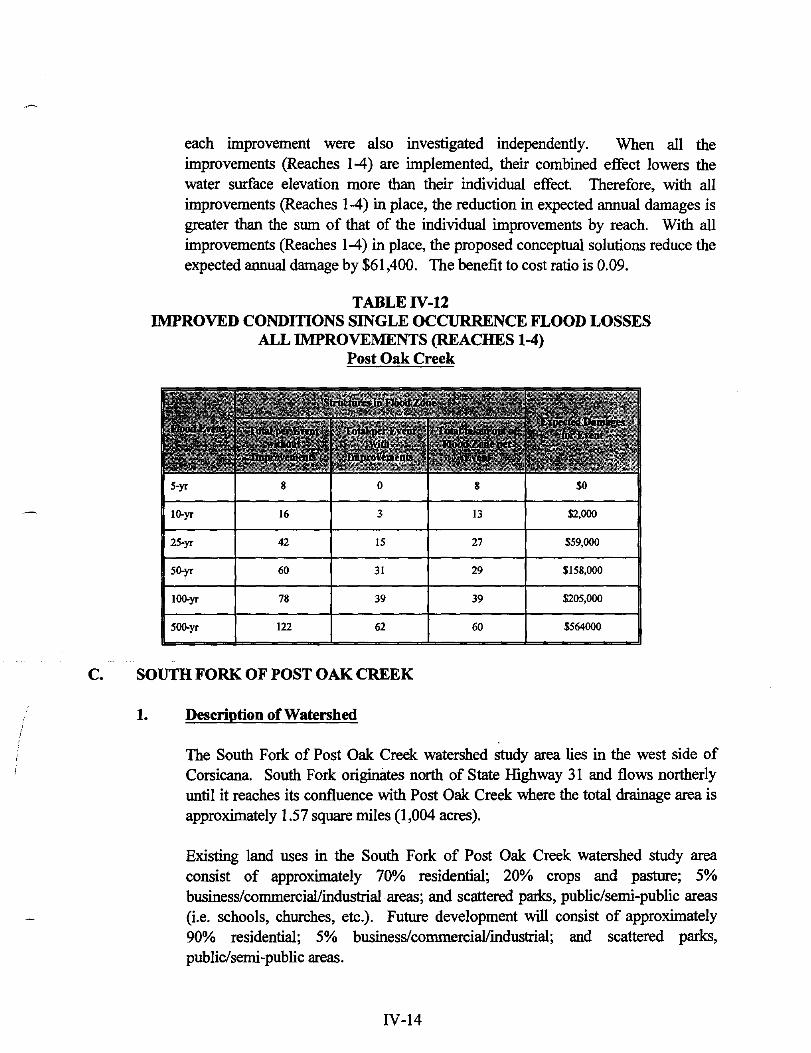
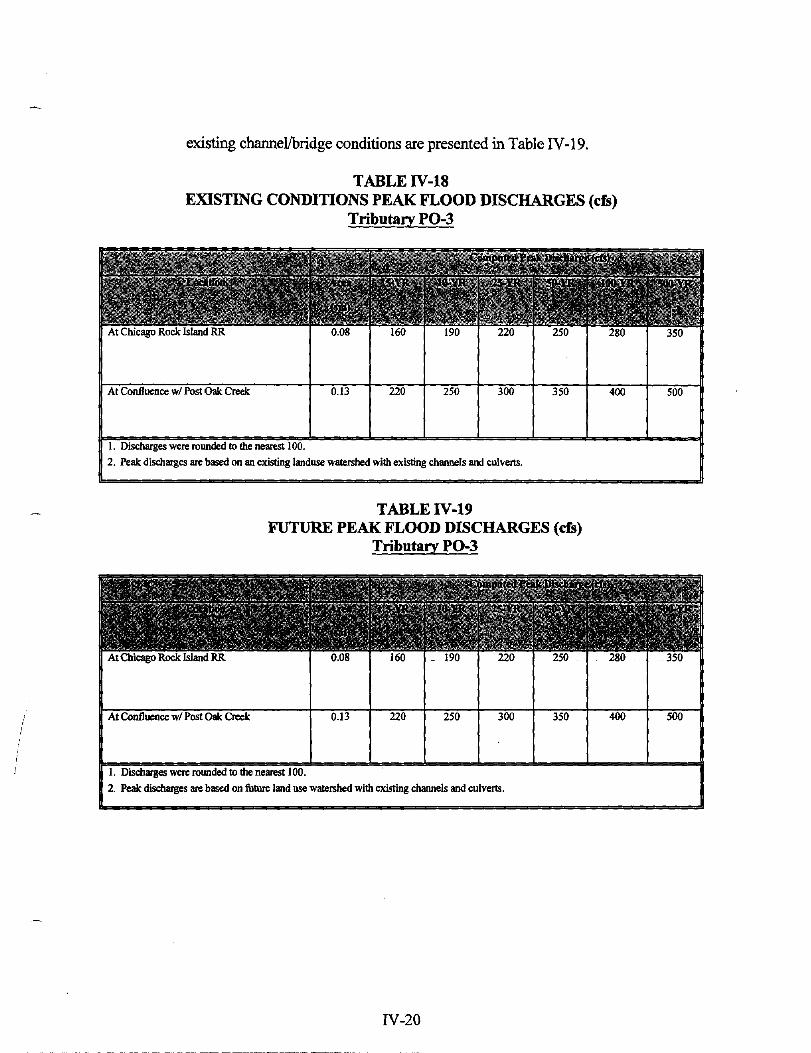
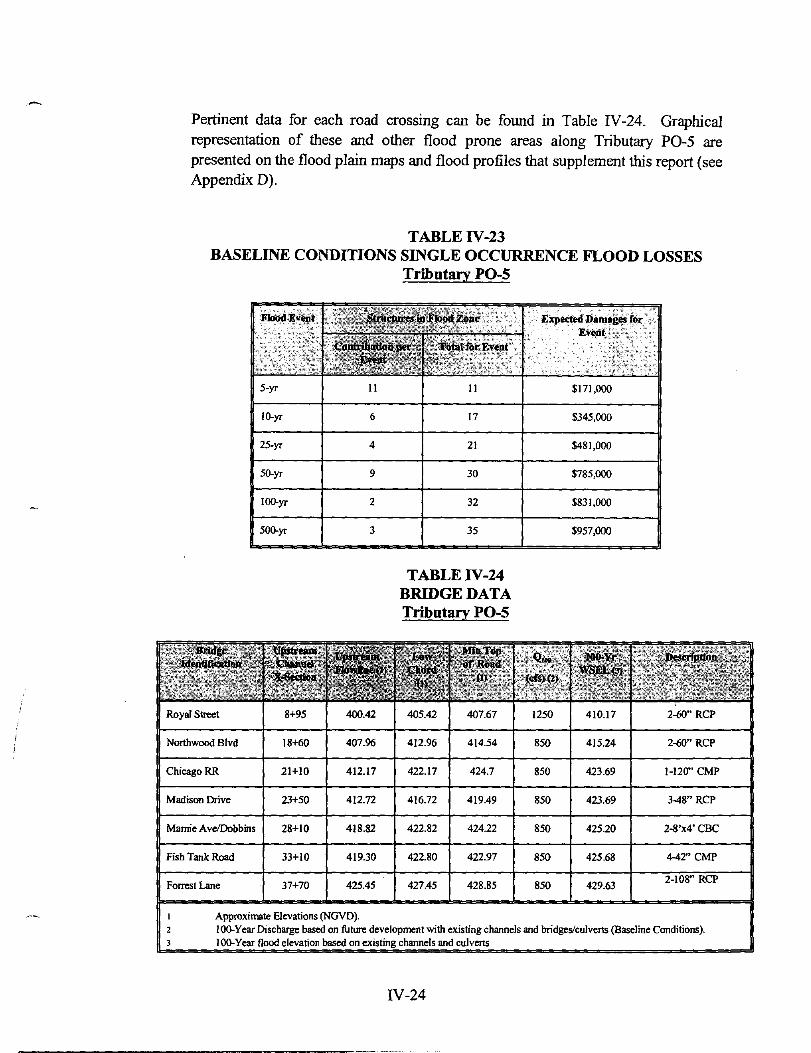
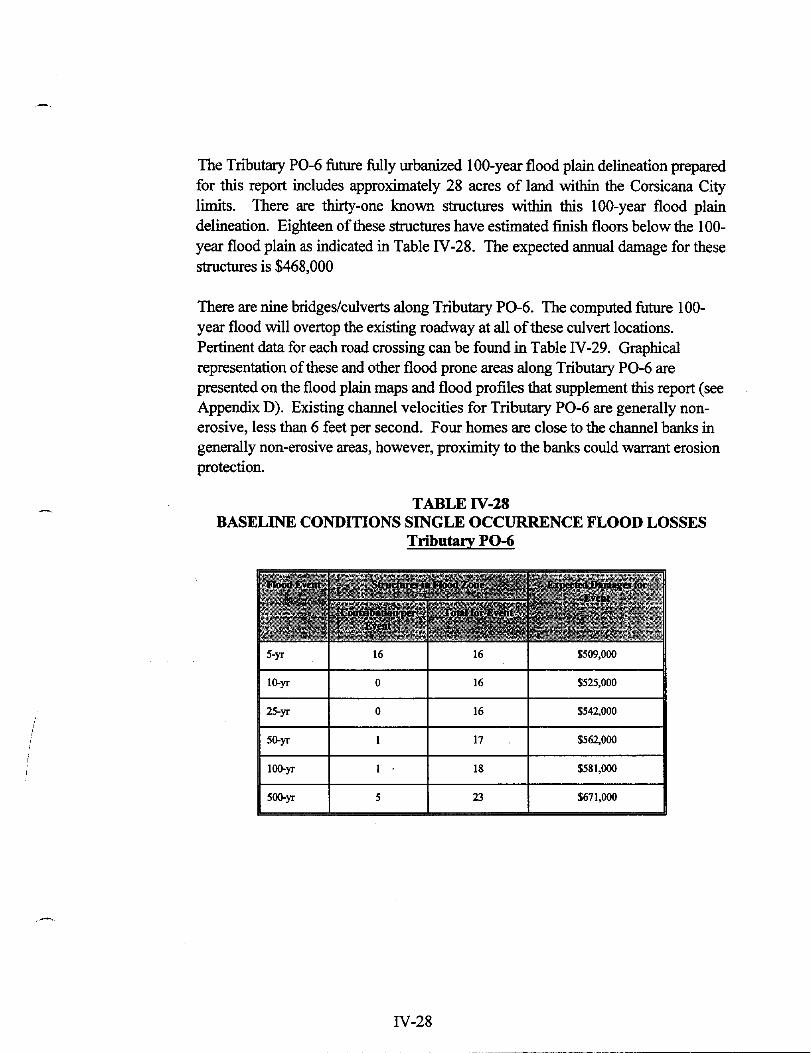
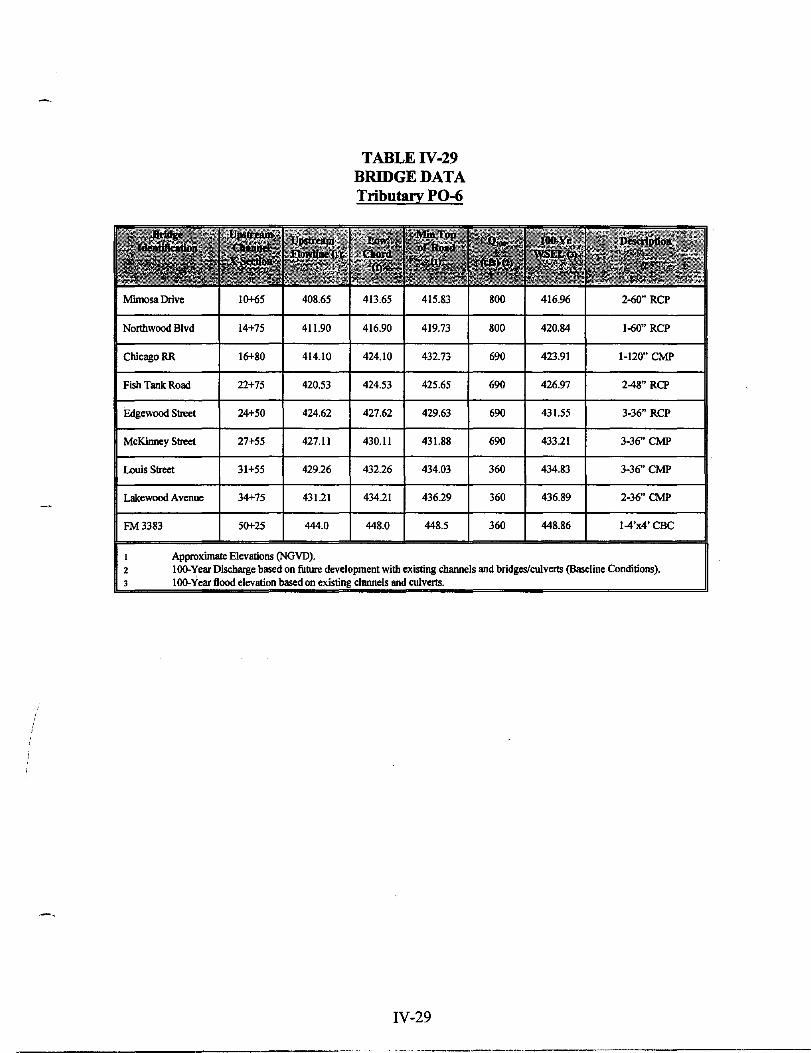
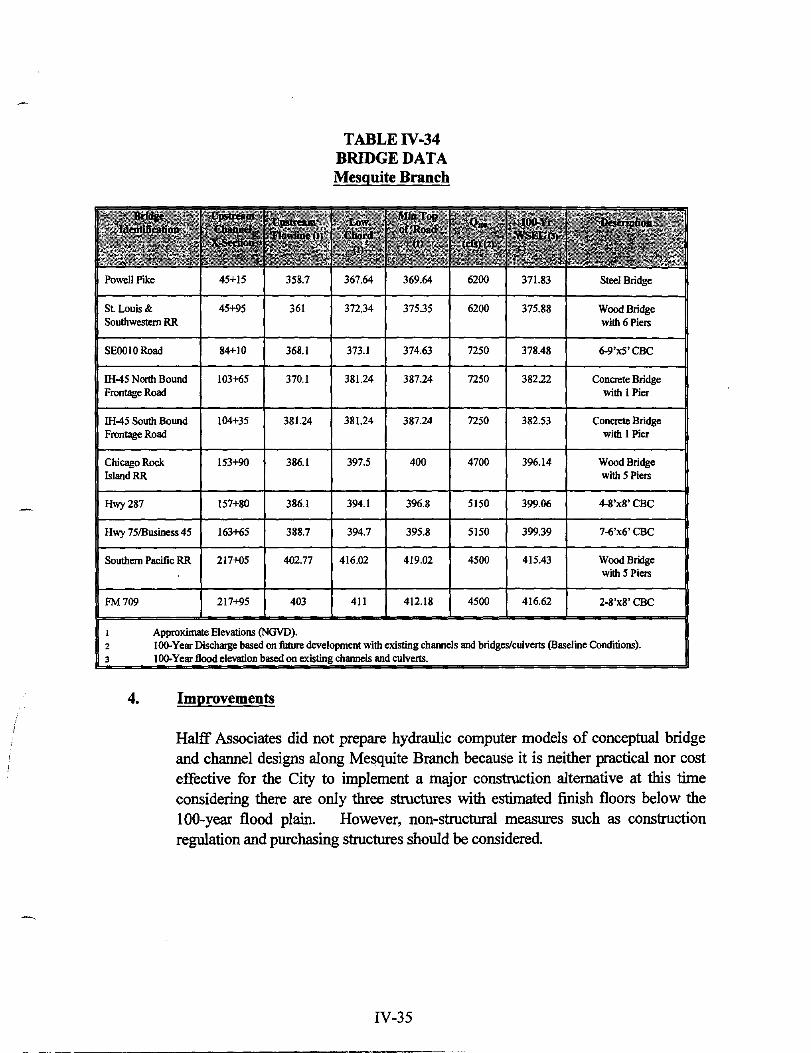
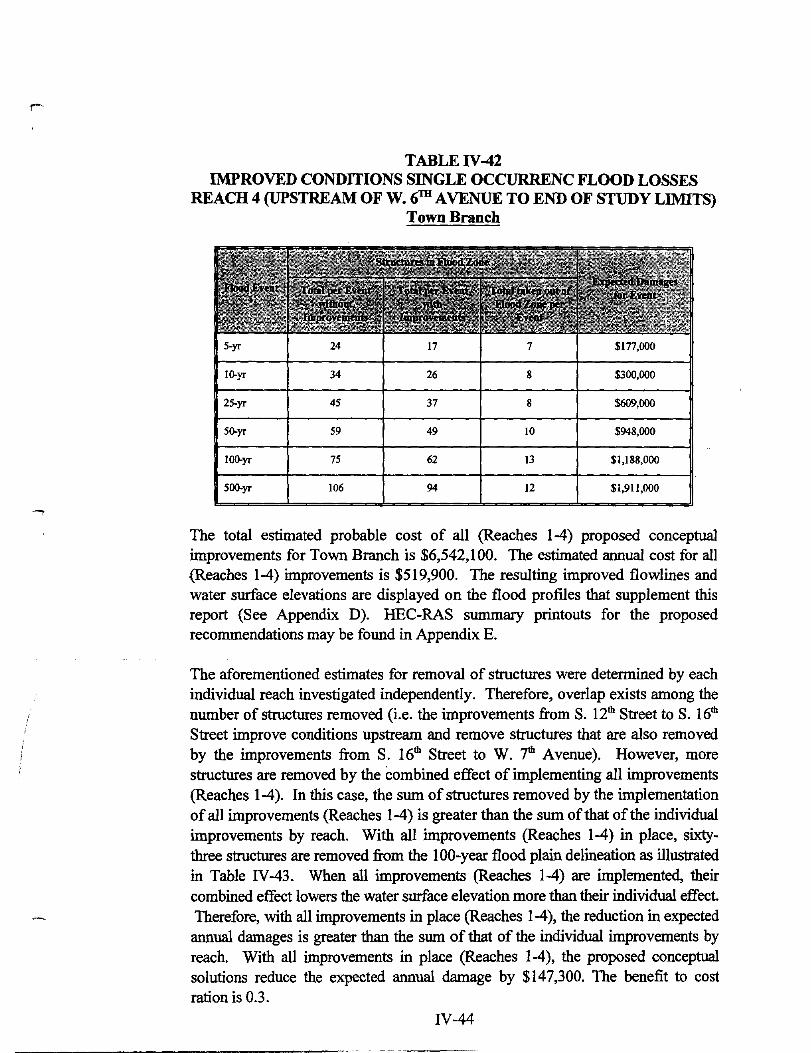
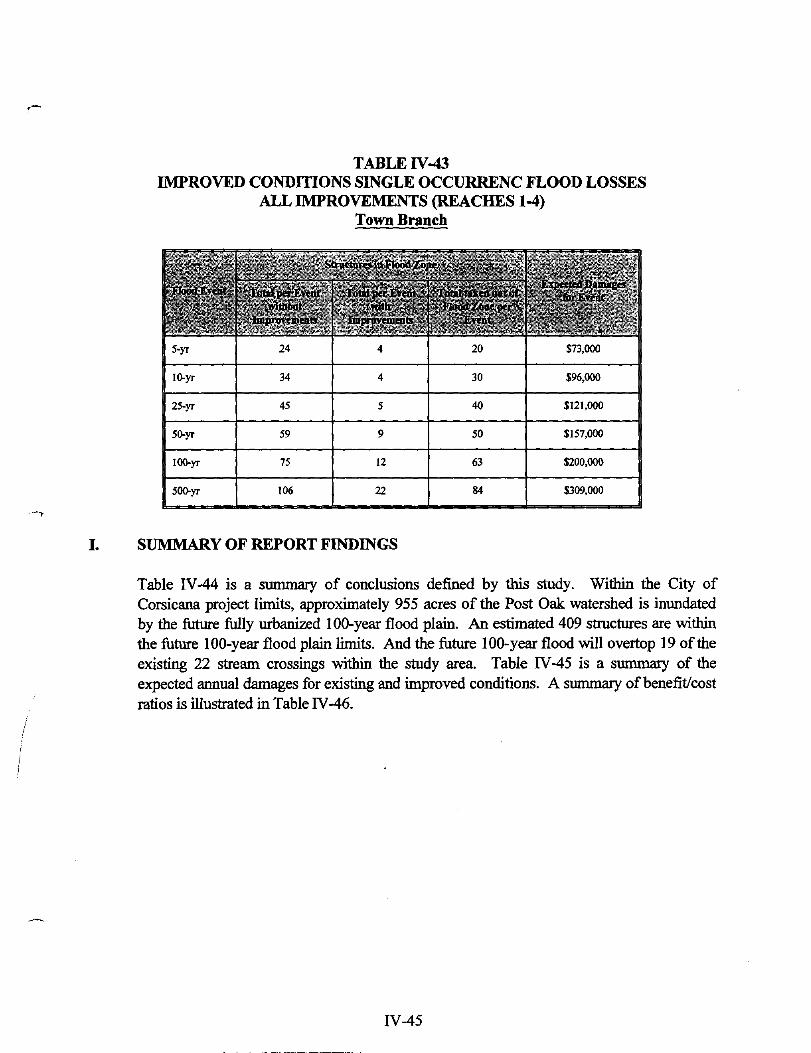
A. General ............................................................................................................... IV -1 B. Post Oak Creek .................................................................................................. IV-3 C. SouthForkCreek ............................................................................................... IV-14 D. TributaryP0-3 ................................................................................................... IV-19 E. Tributary P0-5 ................................................................................................... IV -22 F. Tributary P0-6 ................................................................................................... IV-26 G. Mesquite Branch ................................................................................................ IV-31 H. Town Branch ..................................................................................................... IV-36 I. Summary of Report Findings ............................................................................ IV -45
TABLE OF CONTENTS (Continued)
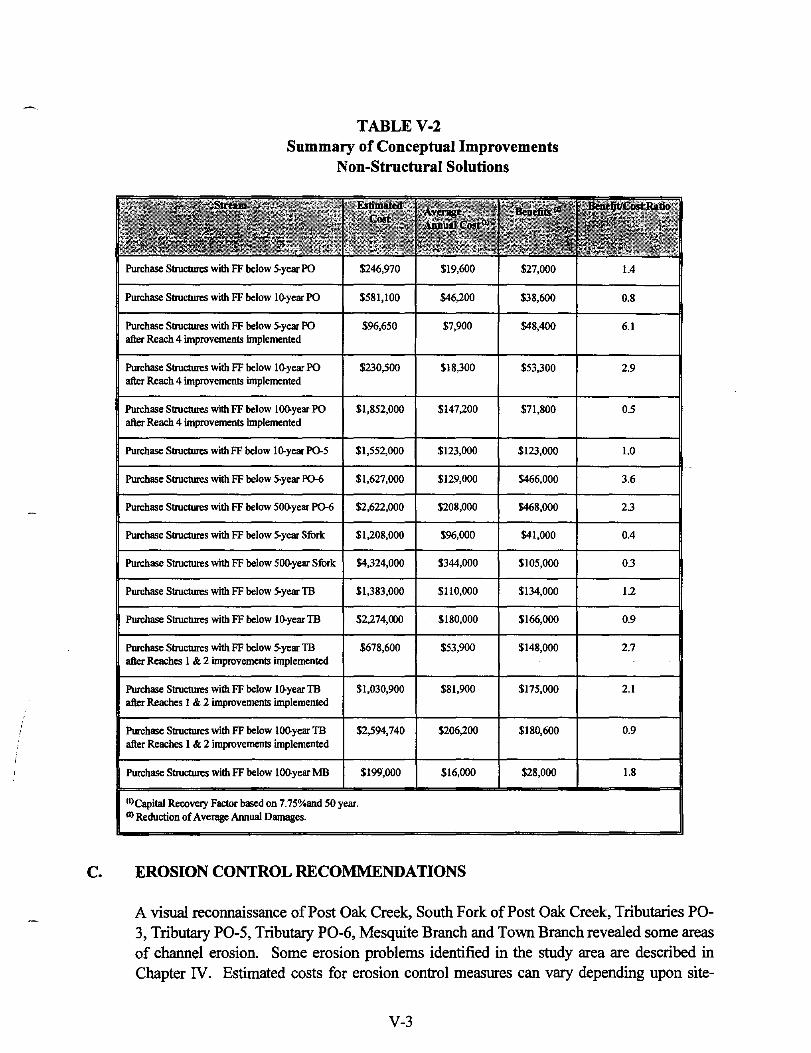
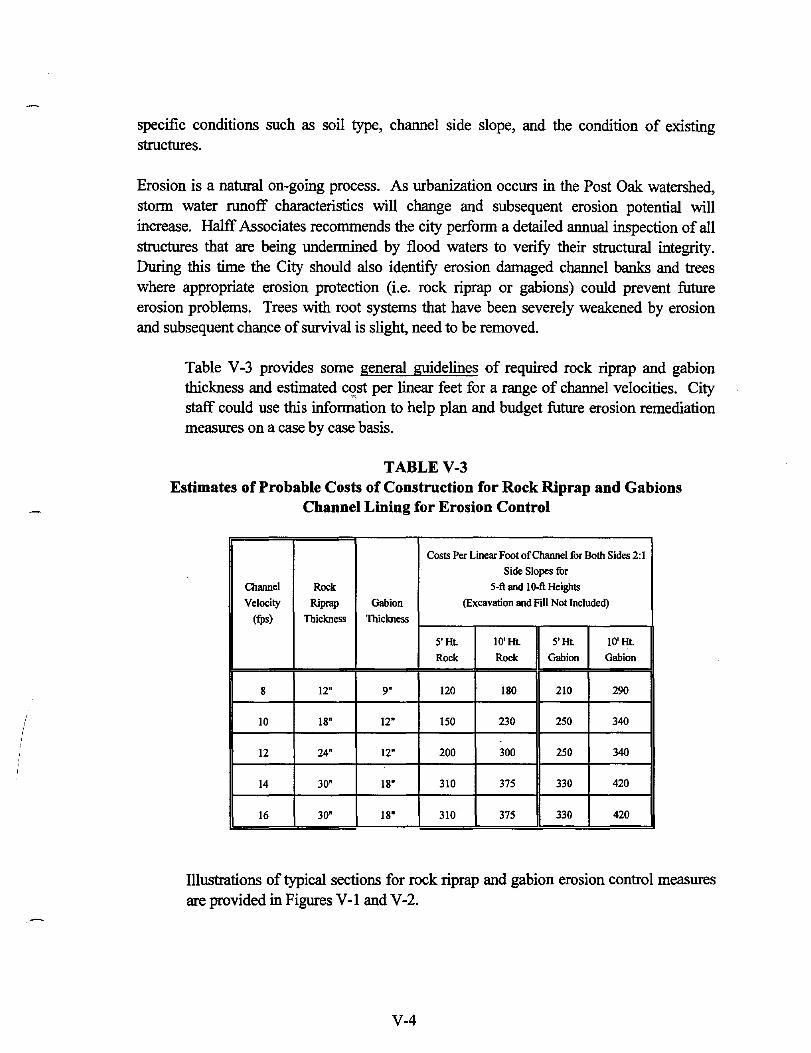
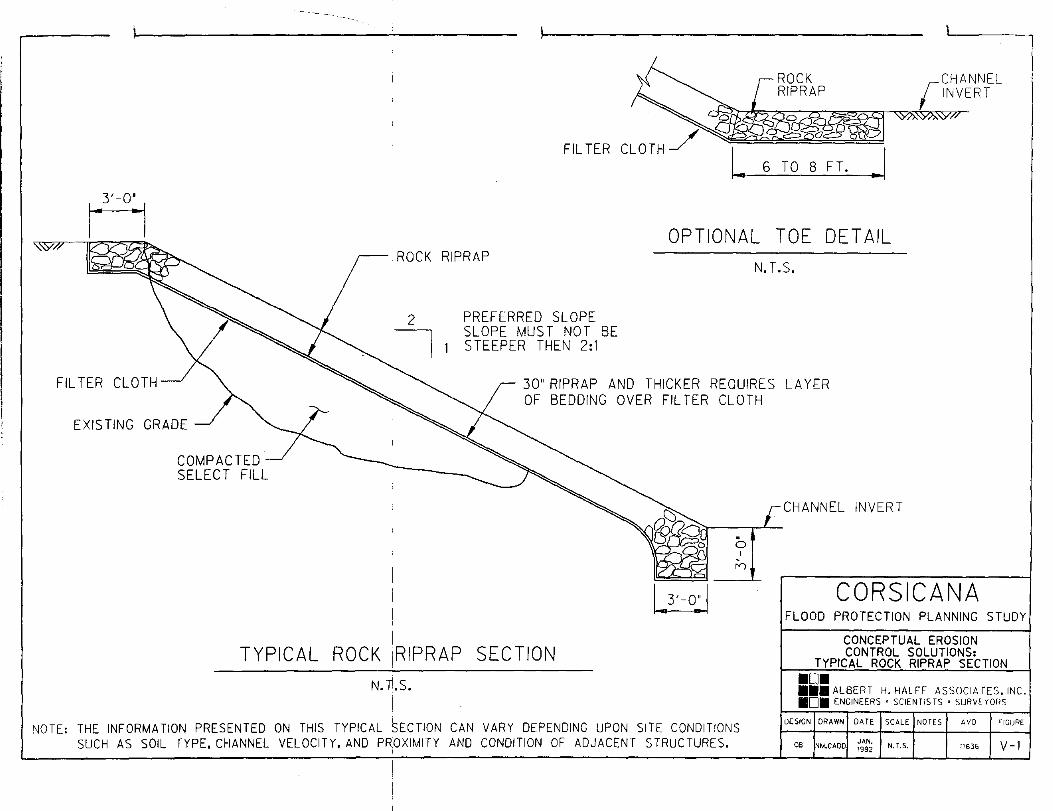
V. RECOMMENDATIONS A. Introduction ........................................................................................................ V-1 B. Recommended Improvetnents ........................................................................... V-1 C. Erosion Control Recommendations .................................................................. V -3 D. General Watershed Recommendations ............................................................. V-5 E. Bridge and Culvert Rating Program .................................................................. V-6 F. Calibration Data for Computer Models... .......................................................... V-6 G. Updating Hydrologic and Hydraulic Computer Models .................................. V-7 H. Flood Plain Managetnent Policies ..................................................................... V-7
Appendix A AppendixB Appendix C AppendixD
AppendixE
APPENDICES
References Vertical Control Benchmarks Preliminary Estimates of Probable Costs Drainage Area Map, 100-Year Flood Plain Maps, and Flood Profiles (Maps and Profiles Suppletnent this Report) Computer Summaries of Hydrologic and Hydraulic Models (Printed in Separate Volume or on Computer Disks)
Summary of Study Findings Characteristic Imperviousness ofLand Use Found in Post Oak Creek Watershed Composite SCS Curve Numbers for Land Use Found in Post Oak Creek Watershed Rainfall Depth!Duration for the Post Oak Creek Study Area Major Damages Categories Post Oak Creek Watershed- Drainage Areas and Estimated SCS Curve Numbers Post Oak Creek Existing Conditions Peak Flood Discharges Post Oak Creek Future Peak Flood Discharges with Existing Channels/Bridges Post Oak Creek Comparison of Existing Conditions Peak Flood Discharges Post Oak Creek Comparison of Future Conditions Peak Flood Discharges Post Oak Creek Baseline Conditions Single Occurrence Flood Losses Post Oak Creek Bridge Data Post Oak Creek Reach 1 Improved Conditions Single Occurrence Flood Losses Post Oak Creek Reach 2 Improved Conditions Single Occurrence Flood Losses Post Oak Creek Reach 3 Improved Conditions Single Occurrence Flood Losses Post Oak Creek Reach 4 Improved Conditions Single Occurrence Flood Losses Post Oak Creek Reaches 1- 4 Improved Conditions Single Occurrence Flood Losses South Fork Creek Existing Conditions Peak Flood Discharges South Fork Creek Future Peak Flood Discharges with Existing Channels/Bridges South Fork Creek Baseline Conditions Single Occurrence Flood Losses
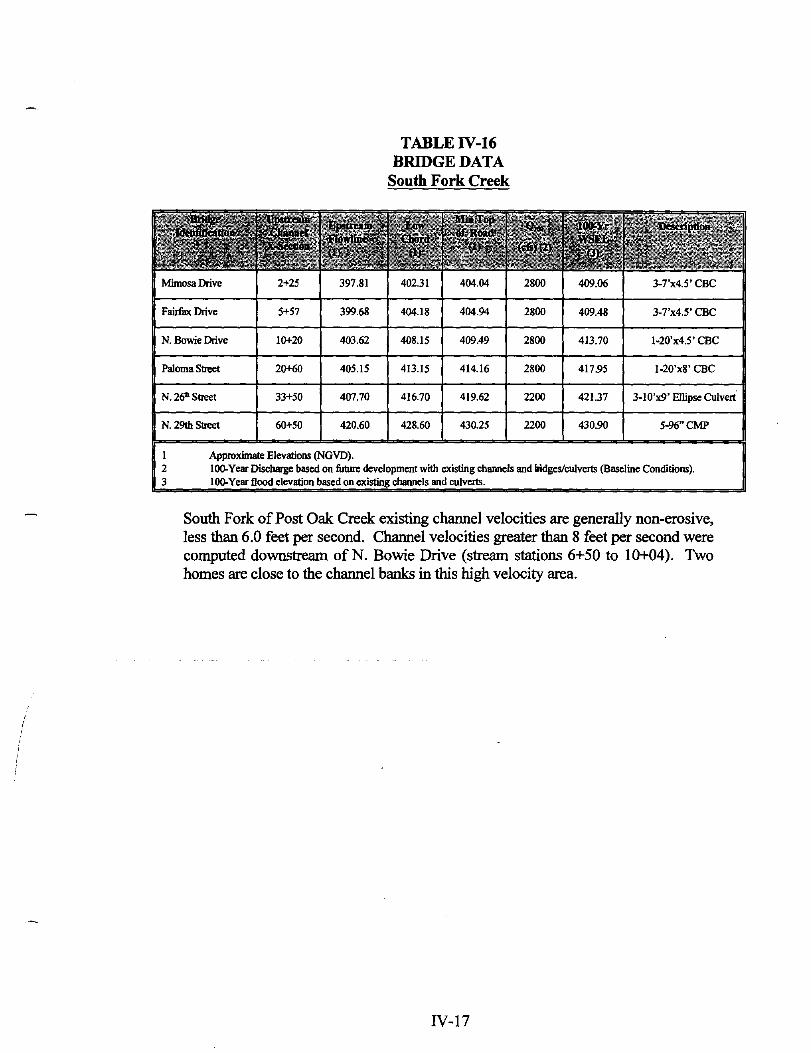
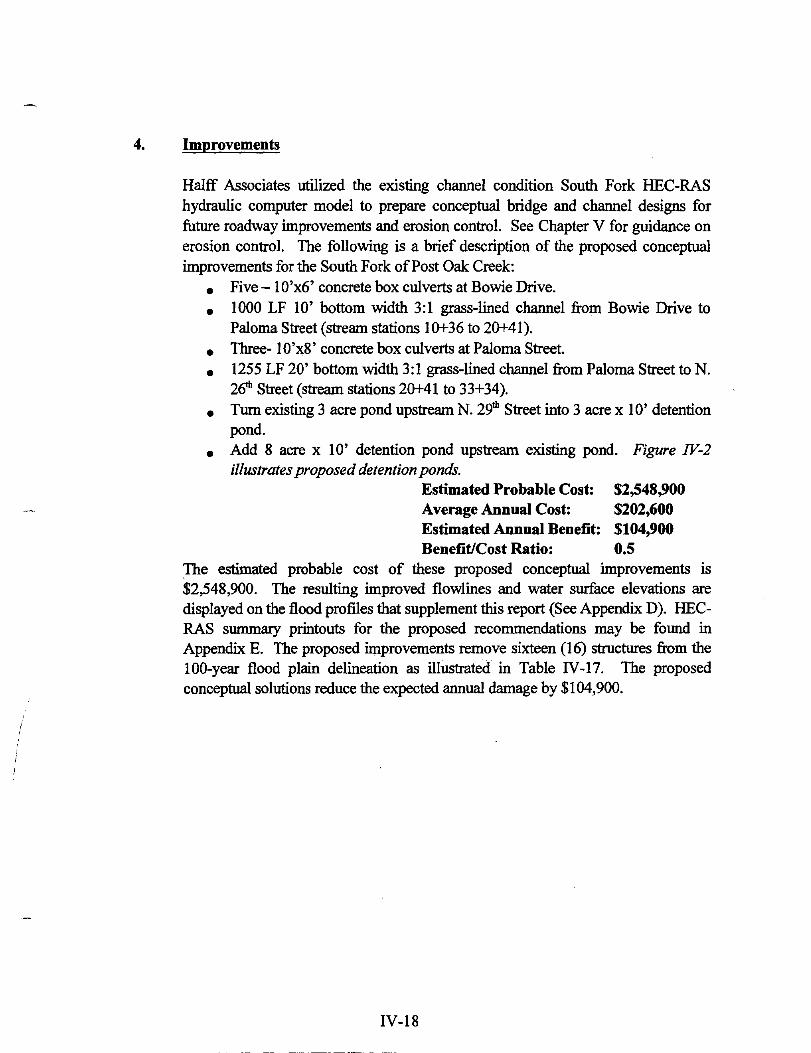
· South Fork Creek Bridge Data South Fork Creek Improved Conditions Single Occurrence Flood Losses Tributary P0-3 Existing Conditions Peak Flood Discharges Tributary P0-3 Future Peak Flood Discharges Tributary P0-3 Bridge Data Tributary P0-5 Existing Conditions Peak Flood Discharges Tributary P0-5 Future Peak Flood Discharges Tributary P0-5 Baseline Conditions Single Occurrence Flood Losses Tributary P0-5 Bridge Data Tributary P0-5 Improved Conditions Single Occurrence Flood Losses Tributary P0-6 Existing Conditions Peak Flood Discharges Tributary P0-6 Future Peak Flood Discharges Tributary P0-6 Baseline Conditions Single Occurrence Flood Losses Tributary P0-6 Bridge Data Tributary P0-6 Improved Conditions Single Occurrence Flood Losses Mesquite Branch Existing Conditions Peak Flood Discharges Mesquite Branch Future Peak Flood Discharges Mesquite Branch Baseline Conditions Single Occurrence Flood Losses Mesquite Branch Bridge Data Town Branch Existing Conditions Peak Flood Discharges Town Branch Future Peak Flood Discharges
Town Branch Baseline Conditions Single Occurrence Flood Losses Town Branch Bridge Data
Town Branch Reach 1 Improved Conditions Single Occurrence Flood Losses Town Branch Reach 2 Improved Conditions Single Occurrence Flood Losses Town Branch Reach 3 Improved Conditions Single Occurrence Flood Losses Town Branch Reach 4 Improved Conditions Single Occurrence Flood Losses Town Branch Reaches 1-4 Improved Conditions Single Occurrence Flood Losses Smnmary of 100-Year Flood Plain Analyses Smnmary of Expected Annual Damages Smnmary of Conceptual Solutions Benefit/Cost Ratios Smnmary of Conceptual Improvements - Structural Solutions Smnmary of Conceptual Improvements -Non-Structural Solutions General Guidelines for Rock Riprap, Gabion, and Concrete Erosion Protection
LIST OF FIGURES 1 Study Area Map ill-1 Flood Damage Mitigation Methods IV -1 Drainage Area Map IV -2 South Fork Tributary Proposed Detention Ponds V -1 Conceptual Erosion Control Solutions: Typical Rock Riprap Section V-2 Conceptual Erosion Control Solutions: Typical Gabion Section
Project Overall Map Project Drainage Area Map Post Oak Creek 1 00-year Flood Plain Post Oak Creek 1 00-year Flood Plain Post Oak Creek 100-year Flood Plain Post Oak Creek I 00-year Flood Plain Post Oak Creek 1 00-year Flood Plain South Fork Creek I 00-year Flood Plain South Fork Creek 100-year Flood Plain Tnbutary PO-3 1 00-year Flood Plain Tributary PO-5 1 00-year Flood Plain Tributary P0-6 1 00-year Flood Plain Mesquite Branch 1 00-year Flood Plain Mesquite Branch l 00-year Flood Plain Mesquite Branch l 00-year Flood Plain Mesquite Branch l 00-year Flood Plain Town Branch 100-year Flood Plain Town Branch 100-year Flood Plain
Post Oak Creek Baseline Conditions Flood Profiles South Fork Creek Baseline Conditions Flood Profiles
Halff Associates, Inc. wishes to acknowledge the valuable assistance of the various organizations and individuals who have assisted in the preparation of the Flood Protection Planning Study for the City of Corsicana, Texas. We wish to express our gratitude to all those listed below who have contributed their time and effort to this study.
Texas Water Development Board, including Gilbert Ward, have provided invaluable assistance and advice throughout this study, in addition to the Flood Protection Grant provided to accomplish this study.
City of Corsicana Staff, including Mrs. Connie Standridge, P.E., City Engineer, Mr. Truitt Gilbreath, City Manager, Ms. Carole Mitchell, Mr. Ricky Jennings, and Mr. Frank Nerthling have provided invaluable assistance and advice throughout this study. The citizens of Corsicana have also provided a tremendous amount of flood data, information on problems, and valuable suggestions on the solutions.
The employees of Halff Associates who have worked most closely with the project include: Mr. Michael A. Moya, P.E., Ms. Cindy Mosier, P.E, Ms. Nancy Sieminski, Ms. Emilia Salcido, P.E., Mr. Troy Lynn Lovell, P.E., Ms. Ronda Visintainer, P.E., Mr. Michael Anderson, E.I.T, and Mr. Brian Agbulos. Halff Associates deeply appreciates the dedicated efforts of all the groups and individuals who have helped in the performance of this study.
Vl
GLOSSARY OF TERMS
BASE FLOOD. The flood having a one percent chance of being equalled or exceeded in any given year, the 100-year flood. Note, for this study the base flood is based on a future fully urbanized watershed and existing channels and bridges with floodway encroachments in-place to account for potential upstream losses in valley storage. The FEMA base flood is based on existing land use and existing channels/bridges.
DISCHARGE. As applied to a stream, the rate of flow, or volume of water flowing in a given stream at a given place and within a given period of time, usually quoted in cubic feet per second (cfs) or gallons per minute (gpm).
DRAINAGE AREA. The area contributing to a lake, stream, sewer, or drain. Also called catchment area, watershed, and river basin.
FLOOD. An overflow ofland not normally covered by water and that is used or usable by man. Floods have two essential characteristics: The inundation of land is temporary; and the land is adjacent to and inundated by overflow from a river or stream or an ocean, lake, or other body of standing water.
Normally, a "flood" is considered as any temporary rise is a streamflow or stage, but not the ponding of surface water, that results in significant advene effects in the vicinity. Adverse effects may include damages from overflow of land areas, temporary backwater effects in sewers and local drainage channels, creation of unsanitary conditions or other unfavorable situations by deposition of materials in stream channels during flood recessions, and rise of ground water coincident with increased streamflow.
FLOOD FREQUENCY. A means of expressing the probability of flood occurrences as determined from a statistical analysis of representative streamflow, railfall and runoff records. A 10-year frequency flood would have an average frequency of occurrence in the order of once in 10 years (a 10 percent chance of being equaled or exceeded in any given year). A 50-year frequency flood would have an average frequency of occurrence in the order of once in 50 years (a 2 percent chance of being equaled or exceeded in any given year). A 100-year frequency flood would have an average frequency of occurrence in the order of once in 100 years (a 1 percent chance of being equaled or exceeded in any given year). A 500-year frequency flood would have an average frequency of occurrence in the order of once in 500 years (a 0.2 percent chance of being equaled or exceeded in any given year).
FLOOD PEAK. The maximum instantaneous discharge of a flood at a given location. It usually occurs at or near the time of the flood crest.
FLOOD PLAIN. The relatively flat area or low lands adjoining the channel of a river, stream or watercourse or ocean, lake or other body of standing water, which has been or may be covered by flood water. FLOOD PROFILE. A graph showing the relationship of water surface elevation to location, the latter generally expressed as distance above the mouth for a stream of water flowing in an open channel. It is generally drawn to show surface elevation for the peak of a specific flood, but may be prepared for conditions at a given time or stage. FLOODWA Y. The channel of a river or other watercourse and the adjacent land areas that must be reserved in order to discharge the base flood without cumulatively increasing the water surface elevation more than a designated height.
vii
GLOSSARY OF TERMS (Continued)
FULLY URBANIZED CONDITIONS. In the context of a drainage study, the watershed or drainage area of a stream is considered to be completely developed, i.e. all land is assumed to be functioning in it's ultimate use. Other descriptions include: Fully Developed, 100 Per Cent Urbanized, Ultimate Development or Land Use, and Maximum Development.
ONE HUNDRED YEAR FLOOD. A flood having an average frequency of occurrence in the order of once in 100 years, at a designated location, although the flood may occur in any year and possibly in successive years. It would have a 1 percent chance of being equaled or exceeded in any year. In the past, this flood has been referred to as the Intermediate Regional Flood.
WATERSHED. The area contained within a divide above a specified point on a stream. VALLEY STORAGE. The term used to describe a channel and flood plain's capacity to store some portion of the runoff volume as a flood wave moves downstream.
Vlll
EXECUTfVES~Y
In August 1999, the City of Corsicana contracted Halff Associates, Inc. to prepare a Flood Protection Planning Study for Post Oak Creek, South Fork Creek, Tributary P0-3, Tributary P0-5, Tributary P0-6, Mesquite Branch and Town Branch. In this study, Halff Associates developed detailed hydrologic (HMS) and hydraulic (HEC-RAS) computer models of the Post Oak watershed. This report was prepared to assist the City of Corsicana to plan and coordinate for future upstream
development, flood plain reclamation, and help minimize existing potential flood damages.
Flood information that was developed for this study includes:
• 5-, 10-,25-,50-, 100-, and 500-year frequency storms
• Future, fully urbanized watershed conditions 100-year "base flood" elevations were delineated onto city topographic maps to show the extent of the 1 00-year flood plain limits.
• Conceptual improvements, such as improved channels and bridges were analyzed for reduction of potential flood and erosion damages. Estimates of probable cost were then prepared for each improvement plan.
Findings
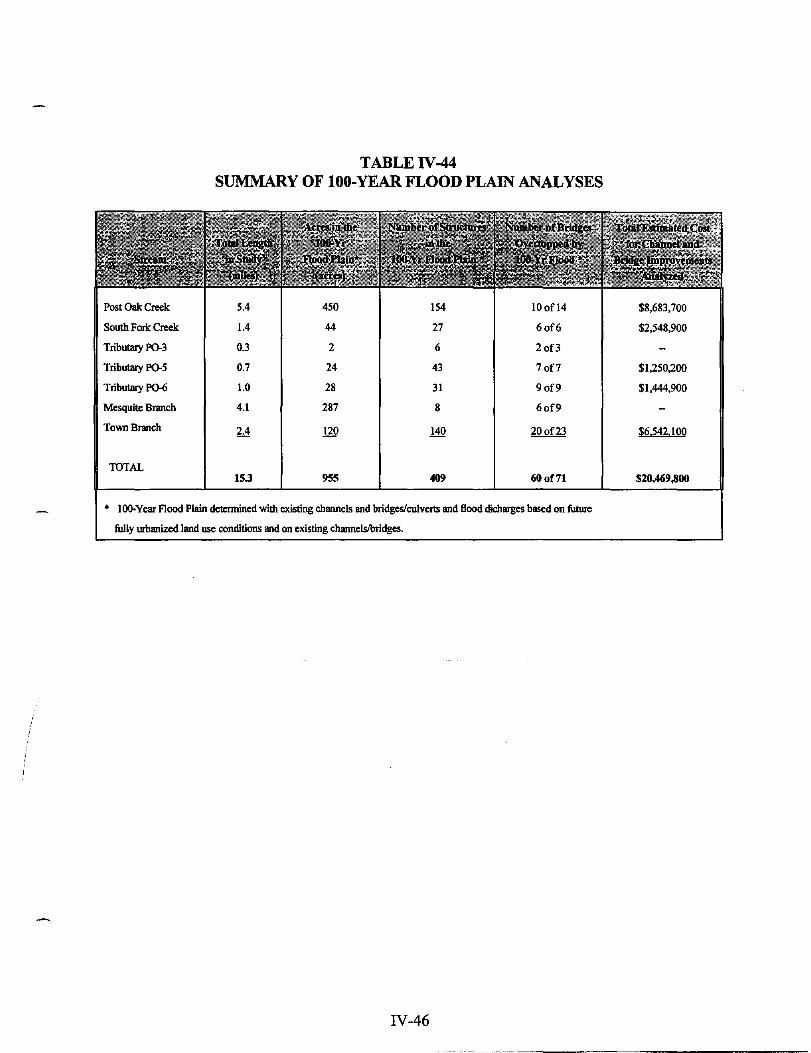
Table A-I is a summary of the study findings. Within the City of Corsicana project limits, approximately 955 acres of the Post Oak watershed is inundated by the future, fully urbanized 100-year flood plain. An estimated 409 homes are within those flood plain limits. This future 100-year ''base flood" would overtop 60 of the existing 71 bridges or culverts within the study area.
Post Oak Creek 5.4
South Fork Creek 1.4
Tributary P0-3 0.3
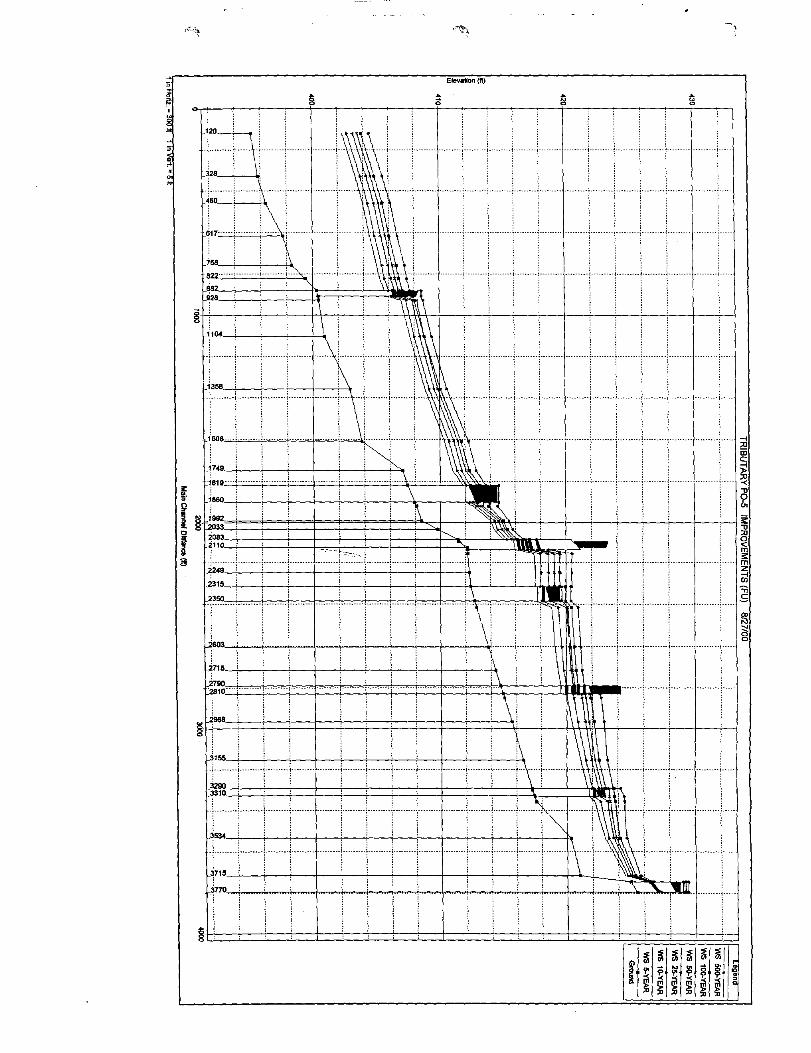
Tnbutary P0-5 0.7
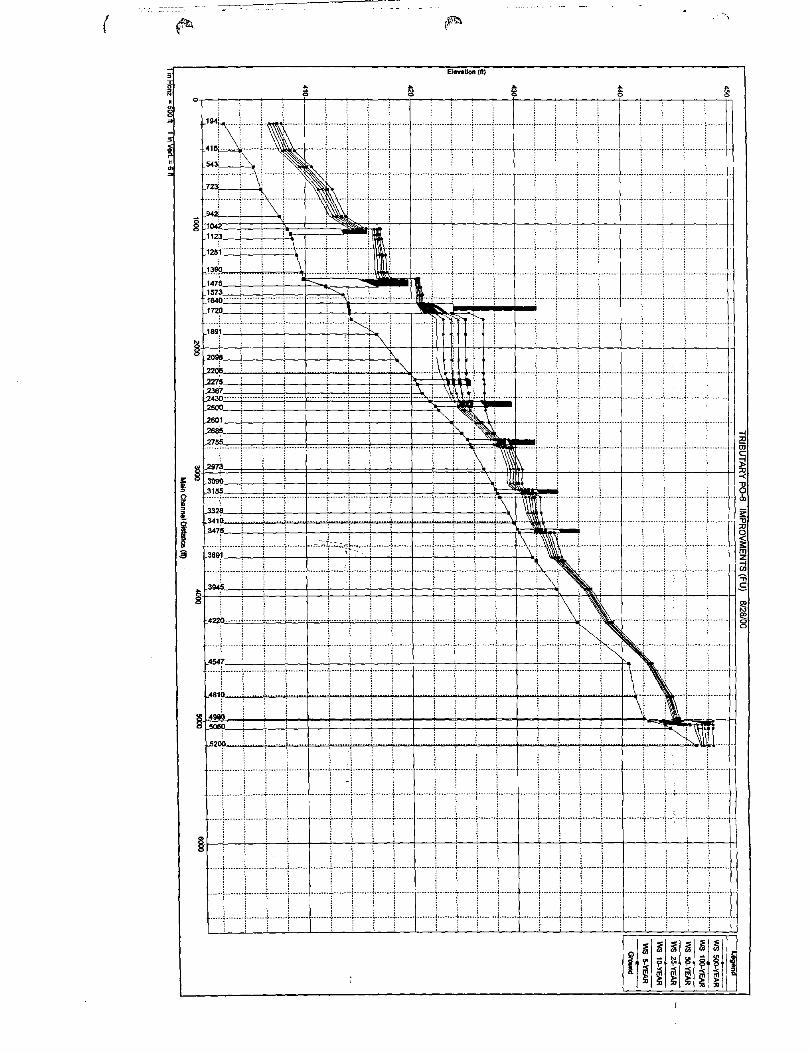
Tributary P0-6 1.0
Mesquite Branch 4.1
Town Branch 2.4
TOTAL 15.3
TABLEA-1 Summary of Study Findings
450 154
44 27
2 6
24 43
28 31
287 8
120 140
955 409
10ofl4
6of6
2of3
7of7
9of9
6of9
20of23
60 of71
• 100. Year Flood Plain determined with existing channels and bridges/culverts and flood tl;charges based on future
fully urbanized land use conditions and on existing channels/bridges.
lX
$8,683,700
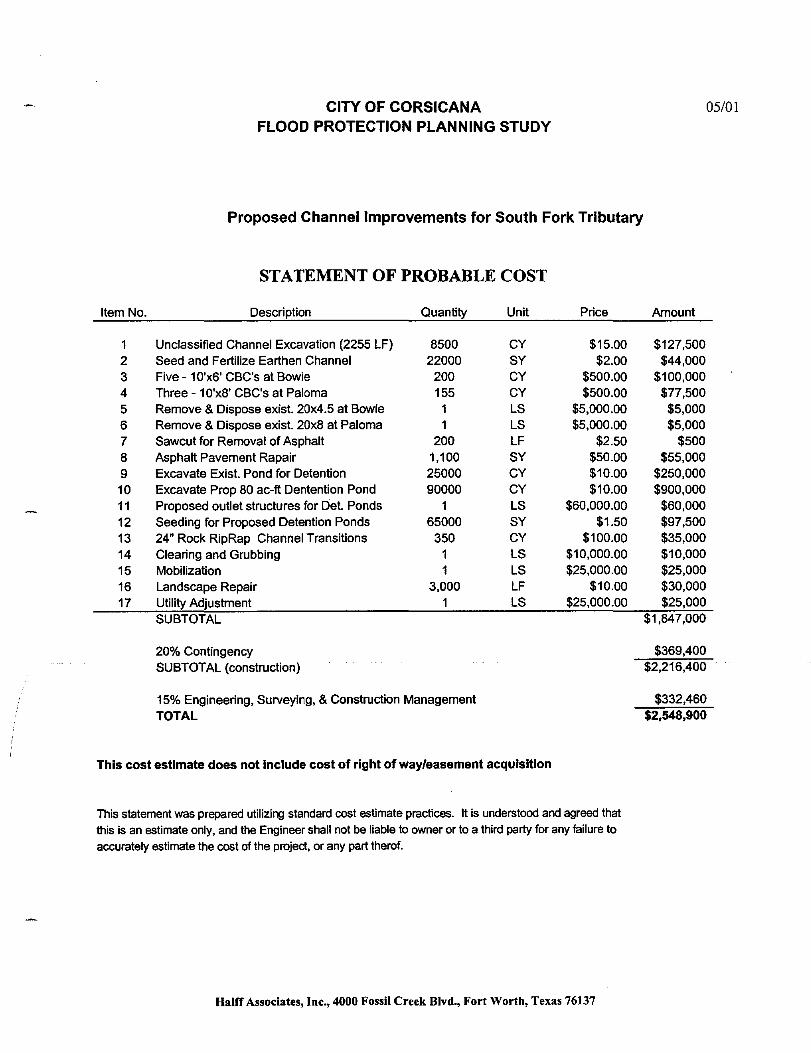
$2,548,900
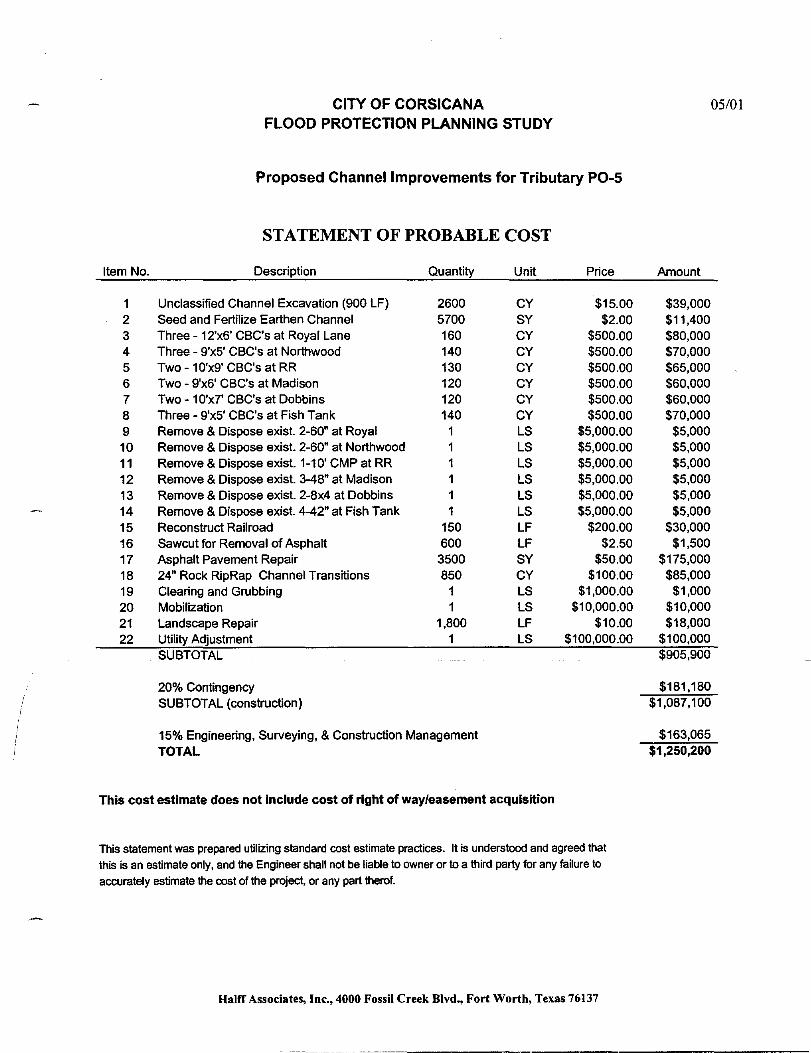
$1,250,200
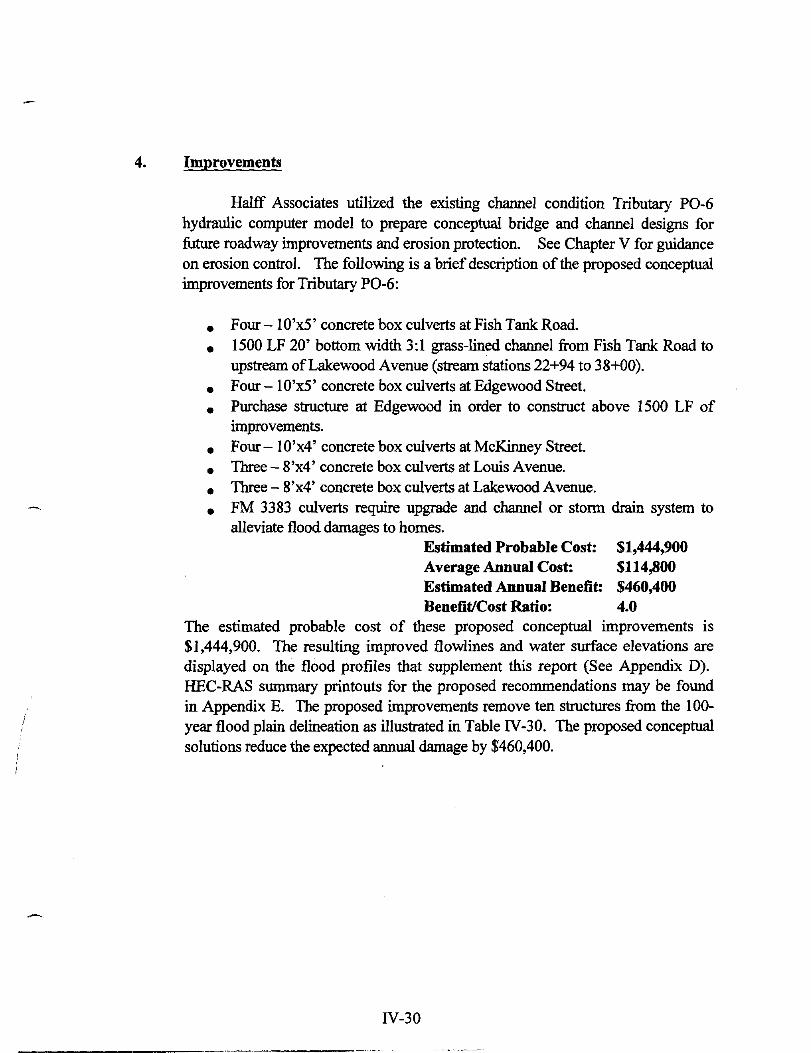
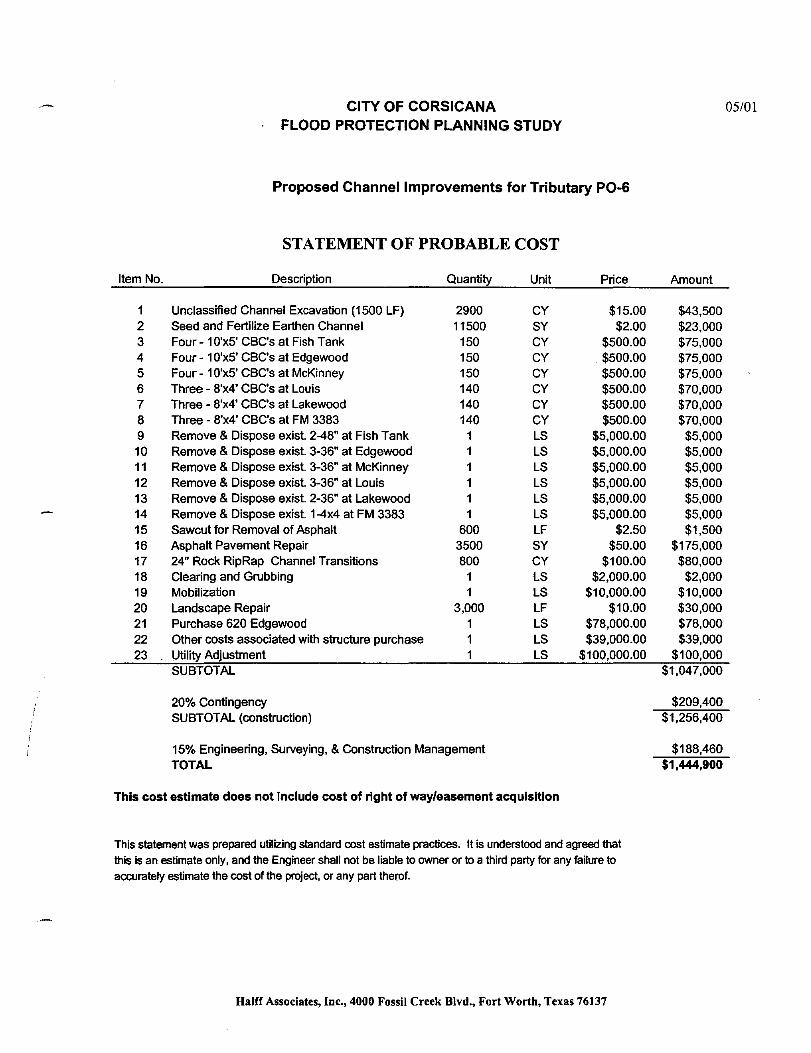
$1,444,900
$6,542,100
$20,469,800
Recommendations
Based on the results of this study, Halff Associates recommends the following:
Initial Flood Damage Reduction Plans:
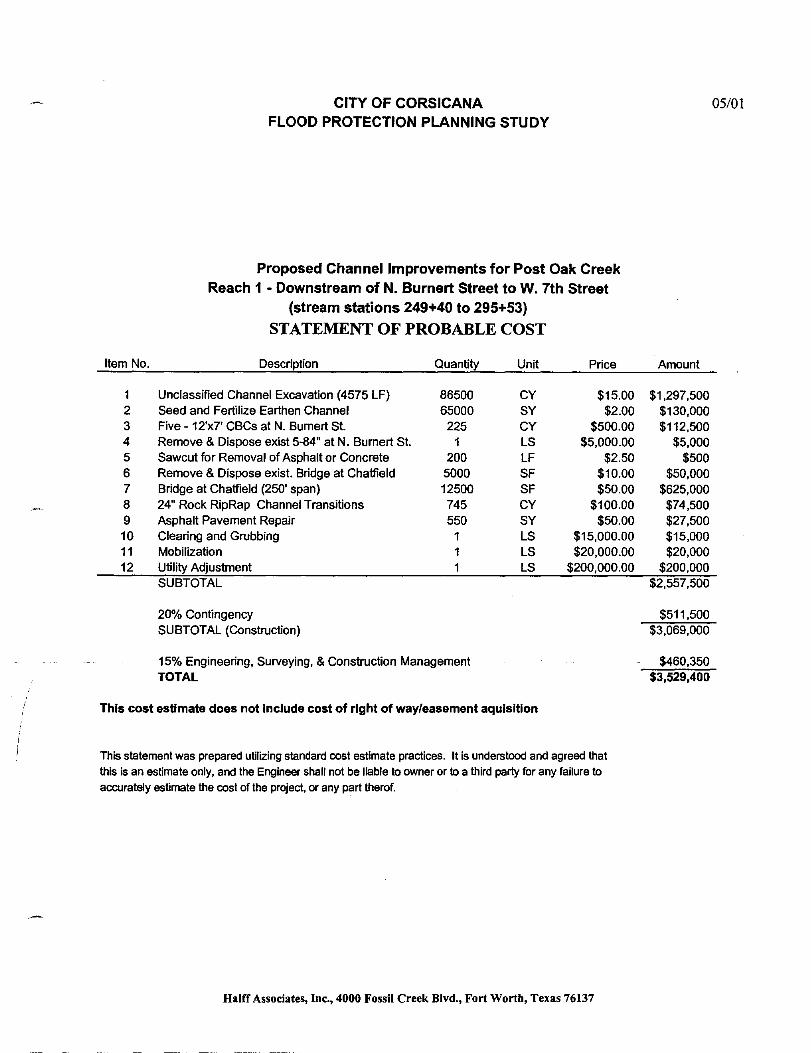
• Tributary P0-6 channel and bridge improvements Estimated Cost= $1,444,900 Benefit to Cost ratio= 4.0
• Tributary P0-5 channel and bridge improvements Estimated Cost= $1,250,200 Benefit to Cost ratio = 1.4
Total Estimated Cost of Initial Recommended Improvements= $2,695,100
Other Recommended Improvement Plans Include:
• South Fork Tributary channel and bridge improvements with Detention Ponds Estimated Cost = $2,548,900 Benefit to Cost ratio = 0.5
• Post Oak Creek Reach 4 (Oaklawn Drive to Dobbins Road) - channel and bridge improvements Estimated Cost= $980,800 Benefit to Cost ratio = 0.5
• Post Oak Creek Structure Purchase in conjunction with Reach 4 improvements Purchase structures inundated by 5-year Flood Plain Estimated Cost= $96,650 Benefit to Cost ratio = 6.1
Or Purchase structures inundated by 1 0-year Flood Plain Estimated Cost = $230,500 Benefit to Cost ratio = 2.9
Or Purchase structures inundated by 1 00-year Flood Plain Estimated Cost= $1,852,000 Benefit to Cost ratio= 0.5
X
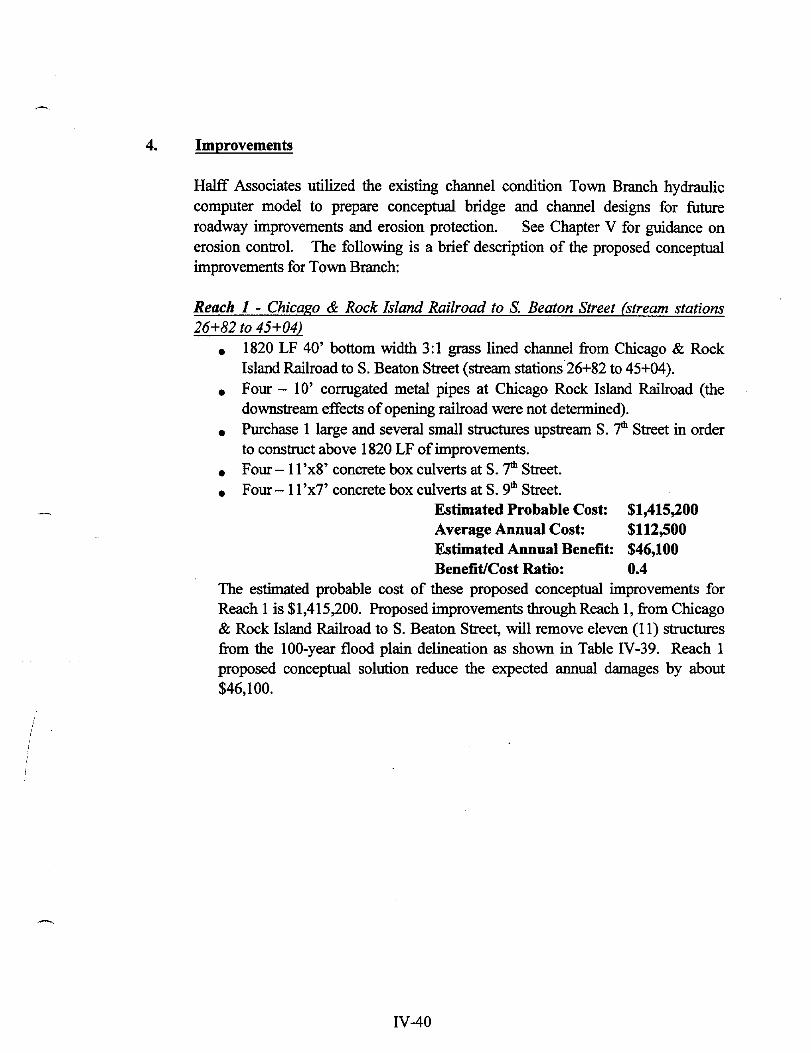
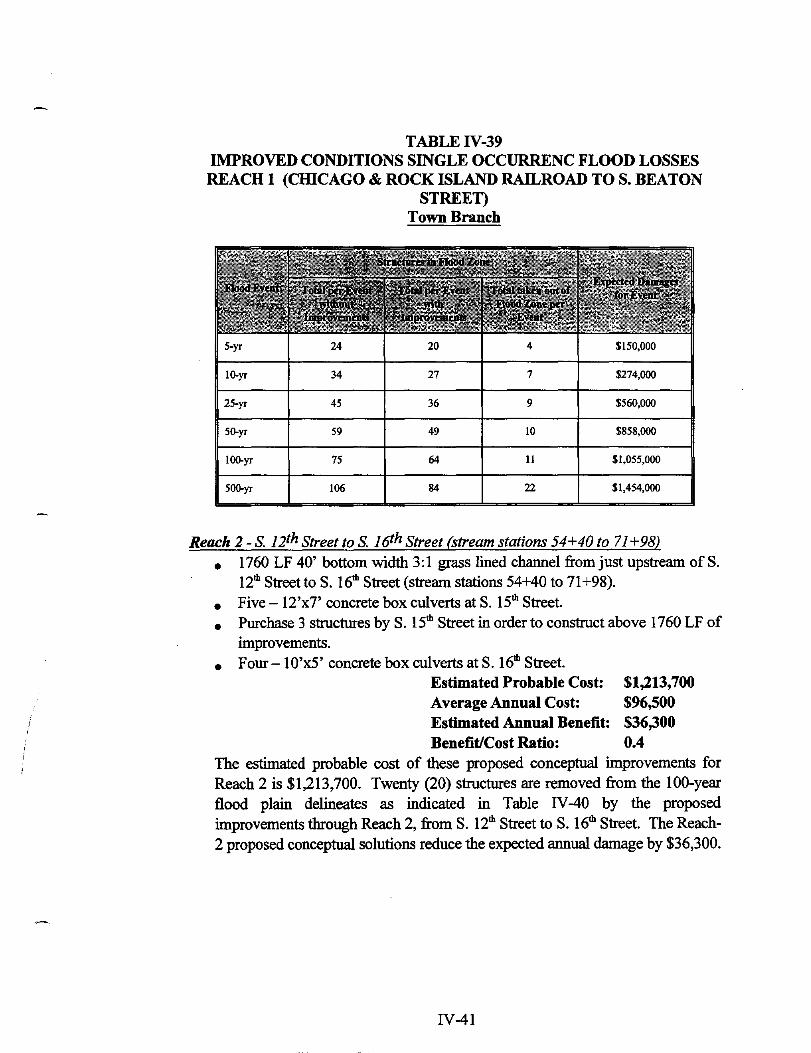
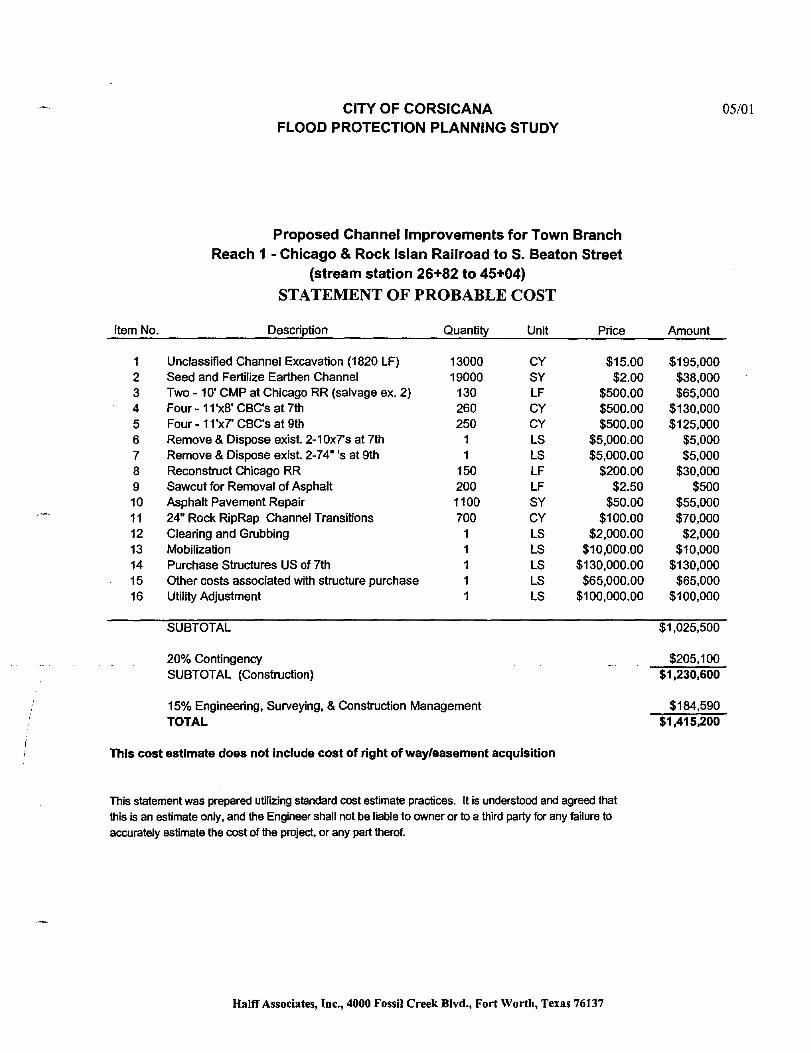
• Town Branch Reach I (Chicago & Rock Island Railroad to S. Beaton Street)- channel and bridge improvements Estimated Cost= $1,415,200 Benefit to Cost ratio= 0.4
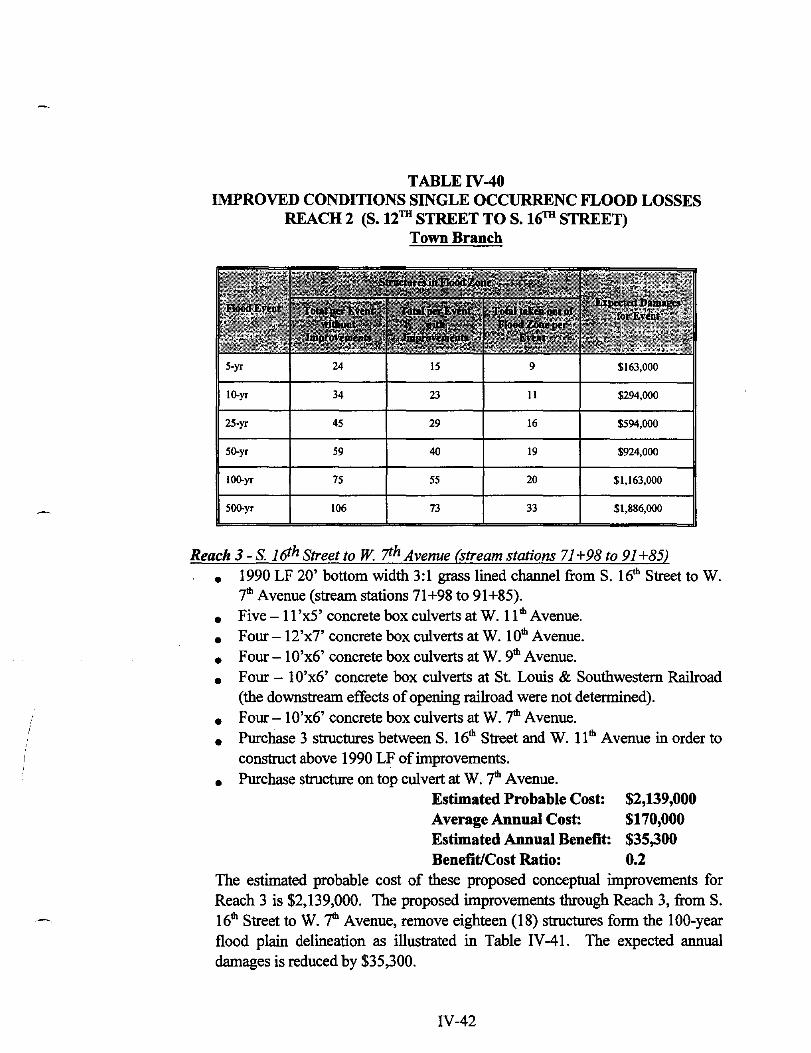
• Town Branch Reach 2 (S. 12th Street to S. 16th Street)- channel and bridge improvements Estimated Cost= $1,213,700 Benefit to Cost ratio = 0.4
• Town Branch structure purchase in conjunction with Reaches 1 and 2 improvements Purchase structures inundated by 5-year Flood Plain Estimated Cost = $678,600 Benefit to Cost ratio= 2. 7
Or Purchase structures inundated by 10-year Flood Plain Estimated Cost= $1,030,900 Benefit to Cost ratio = 2.1
Or Purchase structures inundated by I 00-year Flood Plain Estimated Cost= $2,594,740 Benefit to Cost ratio = 0.9
Other Recommendations:
• The City of Corsicana consider adopting flood plain management policies similar to the North Central Texas Council of Governments Flood plain Management Policies described in Chapter ill.
• All stream crossings be included in a city-wide inspection and rating program for replacing undersized or dangerous bridges/culverts.
• All hazardous flood prone stream crossings should be marked with an active or passive flood warning system.
• The City formally adopt the flood levels shown in this report for its flood plain management program.
• The City periodically update the hydraulic models as channel conditions are modified.
xi
I. INTRODUCTION
A. GENERAL
The City of Corsicana, Texas is a rapidly developing community that is concerned about the increasing threat of flooding and associated damages due to increased urbanization in the Post Oak watershed. Post Oak Creek, South Fork of Post Oak Creek, Town Branch, and Mesquite Branch are the major drainage waterways that flow through the City. These creeks were formed by centuries of flood water erosion and their flood plains include an abundance of scenic and environmental resources. Corsicana's future population growth and associated development will require careful planning and management in order to minimize flood damages and to ensure the maximum possible preservation of the Post Oak drainage corridors.
B. PURPOSE OF REPORT
The purpose of the City of Corsicana Flood Protection Planning Study is to provide a comprehensive, updated flood control-flood plain management master plan for Post Oak Creek, South Fork of Post Oak Creek, Post Oak Tributary-3, Post Oak Tributary-5, Post Oak Tributary-6, Mesquite Branch, and Town Branch within the Corsicana City Limits. This study addresses existing flooding/erosion problems within the city and provides planning alternatives and design concepts to help alleviate potential flood damages. The information presented in this report will provide the City with the necessary updated drainage information to coordinate future development and help minimize existing potential flood damages along Corsicana's major stream corridors.
This report provides a summary of the procedures used to analyze the existing flood problems and the results and recommendations that were derived from the analyses. Additional information (i.e. field survey notes, photographs, and work maps) and computer files used in the production of this report are available from Halff Associates, Inc. and from the City of Corsicana.
I-I
Specific objectives of the Flood Protection Planning Study are:
I. Compile pertinent existing engineering data and newly developed information into a comprehensive report with an up-to-date, (tilly developed watershed, I 00-year flood plain delineation of the study area.
2. Formulate conceptual plans and analyze the effects of proposed improvements to reduce the flooding potential along the streams. Consideration of improving channel flow characteristics and enlarging bridges or culverts is included. Prepare predesign estimates of probable cost for the various channel/bridge improvement plans.
3. Formulate conceptual plans and analyze the effects of non-structural solutions to reduce the flooding potential along the streams. Determine the number of properties to be acquired and removed from flood prone areas. Prepare estimates of probable costs.
4. Based on the analysis of various alternative plans to reduce flooding, make recommendations to the City. These recommendations are presented in Chapter V, with accompanying engineering data to guide the City in a planned program of needed improvements.
5. Coordinate all phases of the study, from data gathering to final design recommendations, with the City Engineering Staff.
In addition to the basic objectives listed above, Halff Associates always attempts to fulfill the following criteria in the planning of any proposed improvements:
1. Acquire community acceptance through neighborhood enhancement.
2. Preserve, to the extent possible, the flood plain's natural environmental resources.
3. Minimize relocation or alteration of residential and business properties and disruption of services to citizens.
4. Formulate and recommend practical, flexible, and affordable alternative plans to solve flooding problems.
1-2
C. COMMUNITY DESCRIPTION
The City of Corsicana is the county seat of Navarro County and is located in north central Texas. According to 1998-1999 Texas Almanac (Reference 1) the estimated population of the City of Corsicana is 24,042. Existing development in Corsicana consists primarily of single family residential neighborhoods with commercial development throughout the city.
The City of Corsicana lies within the Blackland Prairie subdivision of the Coastal Plains physiographic province. The topography is gently rolling to almost level with narrow streams being well incised. Elevations vary from approximately 320 to 500 feet above the National Geodetic Vertical Datum of 1929 (NGVD). The soils in the area generally consist of sandy, silty clay soils with loamy surface layers and clays subsoils. Native vegetation consists of bunch and short grasses with scattered overstory trees (Reference 2).
The climate of the study area is humid subtropical with hot summers. Summers are hot, and winters are short and mild. Extremes of temperature and precipitation are of relatively short duration. The mean annual precipitation is about 37 inches. Record temperature extremes range from a maximum of 113"F to a minimum of -7°F (Reference 2).
Post Oak Creek and Mesquite Branch are the major drainage collectors for the City of Corsicana. However, many smaller tributaries such as South Fork of Post Oak Creek and Town Branch also traverse through the City providing drainageways for existing and future development. Generally, storm water from the northern portion of the City drains to Post Oak Creek. Storm water from the southern portion of the city generally drains to Mesquite Branch. These two major creeks flow in an easterly direction joining downstream at the east side of the City.
I-3
' I I
D. PRINCIPAL FLOOD PROBLEMS
Most of the flood producing storms that occur in the Corsicana area are experienced in the spring and fall. Many of the higher floods that have occurred are a result of prolonged or successive storms that produce heavy rainfall. However, intense localized thunderstorms are common throughout the year and flash flooding may occur at any time.
The City of Corsicana has a history of flood problems and damages within the Post Oak Creek drainage basin. Urbanization of the watershed and reclamation within the flood plain have resulted in increased flood flows and flood elevations. Many of the city's flood damages or related problems are caused by inadequate capacities of the existing channels and bridges. Existing development, subject to overbank flooding, is primarily residential but also includes some commercial property especially along the major creeks. An estimated 409 homes are within the limits of the future fully urbanized 100-year flood plain, which covers approximately 955 acres within the Corsicana study area.
Major flooding events have occurred in Corsicana in April1957, May 1968, October 1974, November 1974, July 1982, May 1989, and March 1990. There are no stream gauging records and no adequate high-water marks to estimate flows for the Streams for any of these periods. However, following the May 1989 flood, the City of Corsicana conducted a detail survey of flooded structures throughout the City. Approximately 308 structures reported flooding. About 174 of these structures reported damages totaling about $2.7 million. Damages were not tallied for the remaining 134 flood inundated structures. See Chapter IV for descriptions of potential flooding problems along each creek.
1-4
II. STUDY PROCEDURES
A. HYDROLOGIC STUDIES
1. General
Hydrologic analyses were conducted by Halff Associates for the Post Oak Creek, South Fork of Post Oak Creek, Post Oak Tributary-3, Post Oak Tributary-5, Post Oak Tributary-6, Mesquite Branch, and Town Branch Watershed basins (hereon referenced as Post Oak Watershed) using the Corps of Engineers hydrologic computer program HEC-HMS Version 2.0 (Reference 3). Halff Associates' hydrologic analysis for this study was prepared using existing (2000) and future, fully-urbanized watershed conditions. Flood events of a magnitude which are expected to be equaled . or exceeded once on the average of any 5-, 10-, 25-, 50-, 100-, and 500-years have been selected as having special significance for this study. These events have a 20, 10, 4, 2, 1, and 0.2 percent chance, respectively, of being equaled or exceeded during any one year. Tables of peak flood discharges can be found in Chapter N. Although the recurrence interval represents the long term, average period between floods of a specific magnitude, rare floods could occur at short intervals or even within the same year. The risk of experiencing a rare flood increases when periods greater than one year are considered. For example, the risk ofhaving a flood which equals or exceeds the 100-year flood (one percent chance of annual occurrence) in any 50-year period is
·about 40 percent (4 in 10), and for any 90-year period, the risk increases to about 60 percent (6 in 10).
The Post Oak drainage watershed was sub-divided into approximately 30 subwatershed basins. Watershed characteristics such as drainage area, watercourse
-------- - - - - length, location of centroid, basin slope; land use, ~soil type;- and channeltflood plain------~ storage were determined for each sub-watershed basin. The hydrologic procedure used in the preparation of this report includes the development of synthetic unit hydro graphs at each of these sub-basin locations. Derived runoff hydrographs were then combined and routed through existing channels. The program HMS (Reference 3) was used to compute storm runoff based on Soil Conservation Service (SCS) curve numbers, derived from land use and hydrologic soil type. The Snyder's unit hydrograph method and the Modified Puis routing method were used to determine peak flood discharges for a given frequency rainfall.
2. Land Use
As communities such as Corsicana develop, farms and pastures are replaced with residential, commercial, and industrial land uses. Halff Associates used the City of Corsicana Existing Land Use Map (Reference 4) and aerial photographs flown by
II-I
I I
Dallas Aerial Surveys, Inc. in January 1999 to detennine existing land use conditions. Land use classifications in the City of Corsicana were verified and adjusted based on field observations. Existing land use trends and information provided by the City of Corsicana was compiled to predict future land use and growth patterns within the watershed.
3. Impervious Coverage
Percent impervious is a function of land use of the drainage area. Residential impervious cover typically reflects the housing market by allowing greater building and pavement coverage as land prices increase. The assumed impervious coverage for land uses found in the Post Oak watershed study area can be found in Table ll-1.
Percent impervious values were derived by Halff Associates using Corps of Engineers . and Soil Conservation Service (SCS) publications and using drainage design manuals from various Texas cities. Halff Associates has also derived impervious coverage values for Dallas-Fort Worth Metroplex residential areas using detailed measurements of developed areas, as shown in Halff Associates' 1980 study for the City of University Park (Reference 5).
TABLE Il-l Characteristic Imperviousness for Land Use found in the Post Oak Watershed
Moderate Density Residential (R-20 maximum)
55% High Density Residential -(R-15~--R~lO~-RD) --·----!----- ------ -----
Commercial I Industrial
Mixed Urban!Connnercial
Industrial with Open Space
Schools I Public and Semipublic
Parks I Golf Courses I Cemeteries I Open Space
Crops I Pasture
Impervious Areas (Pavement, Water)
II-2
85%
60%
55%
30"/o
5%
5%
100%
4. Soil Types
Hydrologic soil types are divided into four groups (A, B, C, and D). Group A soils have the highest infiltration rates and the lowest runoff potential of the four soil types. Group B soils have moderate infiltration rates. Group C soils have slow infiltration rates. Group D soils have the slowest infiltration rates and the highest runoff potential. Group A soils are usually well drained and consist of sand or gravel. Group D soils, on the other hand, are often clayey, have a high water table, or consist of bedrock or other nearly impervious material. Hydrologic Soil Types for the Post Oak watershed basin were estimated from the Soil Conservation Service Navarro County, Texas Soil Survey (Reference 6).
The antecedent moisture condition (AMC) defmes the soil moisture condition prior to a storm. The Soil Conservation Service has defined three levels of antecedent moisture conditions (Reference 7) listed below. AMC ll soil conditions were assumed for this study.
AMC-I AMC-II AMC-III
5. Loss Rates
Dry soils and low runoff potential Average soil moisture conditions Saturated soil condition from antecedent rains
'The SCS Curve Number Method is a technique, developed by the Soil Conservation Service (SCS), for classifying land use and soil type using a single parameter called the Curve Number (CN). The curve number is dependent on the land use, impervious coverage, soil classification, and antecedent runoff conditions. Table ll-2 is a list of composite CN's for land uses, with AMC-ll hydrologic soil types,
-----,epresentative ofthe study area.
Halff Associates computed SCS Curve Number's using a weighted average percent imperviousness for individual soil types and land use within each sub-watershed basin. The composite CN's shown in Table ll-2 were computed using the percent impervious values from Table ll-1.
The initial abstraction (IA) was computed for AMC-II (average) soil conditions using the following equation (Reference 3):
IA= 0.2 * (1000 -10 * CN)/ CN
II-3
-------~---------------------
TABLEII-2 Composite SCS Curve Numbers for the Land Use found in the Post Oak Watershed
Moderate Density Residential 61.4 74.6 82.4 86.0
High Density Residential7 69.8 79.7 85.6 88.3
Commercial I Industrial 86.6 89.9 91.9 92.8
Mixed Urban/Commercial 72.6 81.4 86.6 89.0
Industrial with Open Space 69.8 79.7 85.6 88.3
Schools I Public and Semipublic 55.8 71.2 80.3 84.5
Parks I Golf Courses I Cemeteries I Open 41.8 62.7 75.1 80.8 Space
Crops I Pasture 41.8 62.7 75.1 80.8
Composite Curve Numbers were computed using the average percentage of impervious area shown on Table ll-1. These curve numbers were computed assuming all impervious areas have a curve number of95. Pervious areas are considered equivalent to open space in good hydrologic soil conditions (CN for soil A= 39, soil B = 61, soil C = 74, and soil D = 80).
6. Snyder's Unit Hydrograph
Time of Concentration is the time required for runoff to travel from the most distant part, hydraulically,_of_tl!f:_~O_!Ill area to Qle watershed outlet. _Tltn_<::~ _ _<>.f_ ______ _
------------~
Concentration were determined by dividing the total stream and overland flow length by the average velocity. Average velocities were determined from an SCS chart (Reference 7) utilizing basin slope and type of cover.
Halff Associates computed lag times using the following equation (Reference 9):
Tp = 0.6 *Time of Concentration
Snyder's Unit Hydrograph Lag Times (Tp) were also determined from watercourse length, basin slope, from regional relationships, developed by the Corps of Engineers, of sub-basin geometry and percent urbanization (Reference 2). These regional relationships are a function of watercourse length, location of centroid, basin slope, percent urbanization, and soil type. Typically, these values were in the same range as the SCS method, therefore, the SCS method was utilized.
II-4
Snyder's Peaking Coefficient (Cp) was determined from information developed specifically for the Dallas-Fort Worth Metroplex by the U.S. Anny Corps of Engineers Fort Worth District (Reference 8).
7. Rainfall
10-year -----
25-Year
50-Year
100-Year
500-Year
Point rainfall depths for the Post Oak watershed were taken from the National Weather Service Publication Technical Paper No. 40 (Reference I 0) and from the National Oceanic and Atmospheric Administration (NOAA) Technical Memorandum Hydro-35 (Reference 11). The National Weather Service has developed a relationship to convert point rainfall depths to aerial average rainfall based on the size of the drainage area and the duration of the storm. However, because of the small drainage basin studied, aerial reduction of point rainfall depths was not necessary for this study.
Table IT-3 are the point rainfall depths used for this study for the 5-, 10-, 25-, 50-, I 00-, and 500-year flood frequencies.
TABLED-3 * Rainfall Depth I Duration for the Corsicana Study Area
0.64 1.38 3.67 4.08 5.82
1.58 4.34 4.76 6.80
0.81 1.74 3.63 4.84 5.36 6.52 7.72
0.88 1.89 4.00 5.34 5.88 7.29 8.70 9.97
1.2 2.3 4.6 6.5 7.1 9.0 10.8 12.4
* Data taken from Technical Paper No. 40 (Ref. 11) and Technical Memorandum Hydro-35 (Ref. 12).
8. Flood Routinr;
The Modified Puis routing method was utilized for this study by establishing storage-outflow relationships from steady-flow water surface profiles determined from HEC-RAS hydraulic analyses. Storage-outflow relationships were determined for existing (2000) channel/flood plain conditions.
II-5
-- ---
B. HYDRAULICANALYSES
1. General
Flood profiles for Post Oak Creek, South Fork of Post Oak Creek, Post Oak Tributary-3, Post Oak Tributary-5, Post Oak Tributary-6, Mesquite Branch, and Town Branch were developed using the Corps of Engineer's backwater computer program HEC-RAS Version 2.2(Reference 12).
2. Existing Channel and Bridge Conditions
Cross-sections used in the HEC-RAS computer models were located at close intervals above and below bridges and culverts in order to compute the significant effective flow and backwater effects of these structures. Synthetic cross-sections were taken from two-foot contour interval mapping compiled from January 1999 aerial photographs, prepared by Dallas Aerial Surveys, Inc. The mapping was supplemented with data from previous Corps' studies, as-built bridge and roadway plans, and field surveyed cross sections provided by the City of Corsicana taken in March and April 2000. All elevations are measured from National Geodetic Vertical Datum of 1929 (NGVD). A list of vertical control benchmarks is provided in Appendix B.
Channel roughness factors (Manning's "n") were assigned on the basis of field · inspections of flood plain areas and from previous studies by the Corps of Engineers. For study purposes, it was assumed that no clogging would occur and that all bridge structures would stand intact. Significant changes in this premise, imposed by differing conditions of a future flood, could alter the estimated flood elevations and flood limits shown on the profiles and flood plain maps that
The location of cross-sections and the results of this analysis are displayed in Appendix D on the flood plain maps and flood profiles that supplement this report. Appendix E contains the HEC-RAS summary printout for the existing channel condition hydraulic runs with the future fully developed 5-, 10-,25-, 50-, 100-, and 500-year flood results. Appendices D and E were not published with this report but are available from the City of Corsicana or from Halff Associates, Inc. Computer disks containing copies of all hydrologic and hydraulic computer models used in the preparation of this report were also provided to the City of Corsicana.
3. Improved Channel and Bridge Conditions
Halff Associates modified the existing channel conditions HEC-RAS hydraulic computer models to analyze conceptual design alternatives of proposed channel and
Il-6
bridge improvements. The basic design objective was to reduce potential flood heights and damages while minimizing the destruction of waters of the U.S. and to provide the City Engineering Staff with conceptual channel/bridge designs for future development and roadway improvements. Descriptions and sketches of these proposed designs are provided in Chapter N. The resulting improved flowlines and water surface elevations are displayed on the flood profiles that supplement this report. Note, there are some reaches of the streams where no improvements are recommended, and the existing channel should remain in its natural state, unless a specific plan is formulated. Summary HEC-RAS computer printouts for the proposed recommendations may be found in Appendix E.
C. FLOOD PLAIN DELINEATION
The City's current flood regulatory maps are the FEMA Flood Insurance Rate Maps effective date August 1981 (Reference 13). The National Flood Insurance Program uses the 100-year flood (existing conditions) as the "base flood" for insurance and mapping purposes. Since floods greater than the 1 00-year flood may occur, citizens should bear in mind that if the level of protection is for a 100-year flood, it is possible for flood levels to exceed this limit.
For this study, the "Base Flood" 100-year flood plain limits and flood profiles were prepared for existing channel and bridge conditions with future, fully urbanized flood discharges. For this study, this condition is referred to as Baseline Conditions. Flood plain maps and flood profiles are presented in Appendix D which supplements this report. The delineation of the future fully urbanized 1 00-year flood plain for Post Oak Creek, South Fork of Post Oak Creek, Post Oak Tributary-3, Post Oak Tributary-5, Post Oak Tributary-6, Mesquite Branch, and Town Branch provides the City of Corsicana with one of the basic tools of flood plain management. This data will be instrumental in the performance of many
·----flood plain managementrunctioris, some ofwmCliarelisted below-. -- ------ ----- ---·
1. Formulation of flood plain management alternatives; 2. Outlining of flood-hazard areas; 3. Planning for parks and recreation in flood-prone areas; 4. Compliance with requirements of federal flood insurance programs; 5. Establishment of safe finished-floor elevations; 6. Planning of subdivisions to provide room for the passage of floodwater; 7. Design of roads, bridges, and utilities; and 8. Designation of easements or land to be purchased and used for open space.
Included in this study are computer ·data disks containing copies of all hydrologic and hydraulic computer models used in the production of this report. These baseline computer models will enable City Engineering staff to predict flood levels for flows based on existing and/or future land use conditions. The city will also have the ability to periodically update
II-7
/ I
and modifY the models prepared for this study to predict anticipated changes in land use and/or watershed characteristics.
D. DESIGN CRITERIA FOR IMPROVEMENTS
For each creek in the study, channel and/or bridge conceptual design HEC-RAS computer models were developed. Possible flood control improvements include enlarged grass-lined or rock-lined channels, bridge/culvert modifications and replacements, erosion control features, drop structures, and detention ponds. The proposed improvements have been designed to best achieve the following criteria:
1. Where practical, contain the future fully-urbanized 100-year flood discharge within the proposed channel;
2. Maintain non-erosive or non-damaging velocities (approximately 6 ips for grass-lined channels and about 8 to 10 ips for natural rock-lined channels);
3. Minimize rises in flood elevation due to new roadway alignments and flood plain reclamation;
4. Minimize the amount of additional R.O.W. to be acquired;
5. Minimize or avoid major utility relocations;
6. Minimize environmental damage where possible.
E. DESIGN CONSTRAINTS
In addition to thebas1cdesign-cnterialisted above,-'the.followmg1temswere also considered in the conceptual design phase of this study:
1. Restricted Right-of-Way - Based on subdivision plans and plat maps, drainage easements along the creeks and tributaries are limited or non-existent in many reaches. Where drainage easements do exist, they are often too narrow for significant channel improvements. These narrow corridors restrict the viable alternatives considerably, and in some places, rule out a grass-lined trapezoidal channel.
2. Steep Existing Channel Slope - Portions of the existing channel slopes are relatively steep and create high, erosive velocities in the natural channel.
3. Inadequate Road Crossings - Many existing bridges and culverts are generally undersized in comparison with future fully urbanized 100-year flood flows. When
II-8
existing culverts are relatively low with respect to the channel, higher head losses are common at road crossings. These low culverts are also prone to catch debris and dam up flood waters. From a design perspective, some of the existing streets, driveways, and sidewalks in the vicinity of some road crossings are often too low, when compared to 100-year flood elevations, and must be rebuilt or adjusted if larger drainage structures are to be installed.
4. Natural Beauty of Streams - The existing environment along most of the streams is generally of a high quality with many large trees, considerable landscaping, and much natural beauty. It is difficult to design flood control improvements that will not destroy or significantly alter these attributes. Also, the potential loss of trees located immediately adjacent to the creek bank is often unavoidable due to continual channel erosion and subsequent damage to the tree's root system.
5. Preservation of Waters of the U.S. -Proposed improvements shall adhere to the requirements of The U.S. Army Corps of Engineers Section 404 permits. Projects impacting more than 1110 acre ofwaters ofthe U.S. shall require formal notification of the U.S. Army Corps of Engineers. An Individual Permit will be required for channel projects impacting greater than lt2 acre or 300 linear feet of perennial and intermittent stream beds.
6. Existing Water and Sewer Lines - These and other utilities dictate the design channel flowline elevations and alignment in some reaches.
7. Houses and business are extremely close to the channel banks in some locations.
F. ECONOMIC ANALYSIS
----r.-·-Puroose-:; Thepffifcip-al purpose fOr an economic aruilysisistoidennf)' ana quantity- -- - - -
the extent of flood problems and, on a comparable basis, evaluate solutions to reduce flood losses. Estimates of flood damages and benefits presented in this report reflect 2000 prices with future fully urbanized development. Corps of Engineer's procedures were generally used for this economic analysis.
The computer program HEC-Flood Damage Analysis With Risk (Reference 21) was used in the economic analyses as described below.
2. Inventory of Structures - The economic analysis study area included all properties lying within the 500-year flood plain limits for Post Oak Creek, South Fork of Post Oak Creek, Post Oak Tributary-3, Post Oak Tributary-5, Post Oak Tributary-6, Mesquite Branch, and Town Branch. Topographic maps, compiled from aerial photography flown January 1999, served as base maps to identify the flood-prone properties. Finished floor elevations for all structures within the future 100-year
II-9
flood limits were estimated from the topographic maps assuming one (1) foot above the estimated ground elevation. Information provided by the City of Corsicana was utilized to inventory the flood plain lands along Post Oak Creek and its tributaries in order to identify the current types and level of flood plain development. This included enumeration of the types and numbers of structures within the 500-year flood plain limits.
3. Evaluation of Flood Damages- The water surface profile elevations for 1-, 2-, 5-, 10-,25-,50-, 100-, and 500-year flood events, based on existing (2000) channel and bridge conditions with future fully developed watersheds, were used to evaluate flood damages. These flood profiles aided in delineating the flood plain limits and in determining the relationship of damageable properties to both elevation and frequency of flood occurrence.
The current market values of the structures identified were estimated through the assistance of the City of Corsicana. Existing damageable properties were classified into the major damage categories shown in Table ll-4. Estimates were made on the value of flood plain investment (structure and contents) for each of the damage categories. Note, the value of existing residential contents was estimated to be 50 percent of the value of the structure.
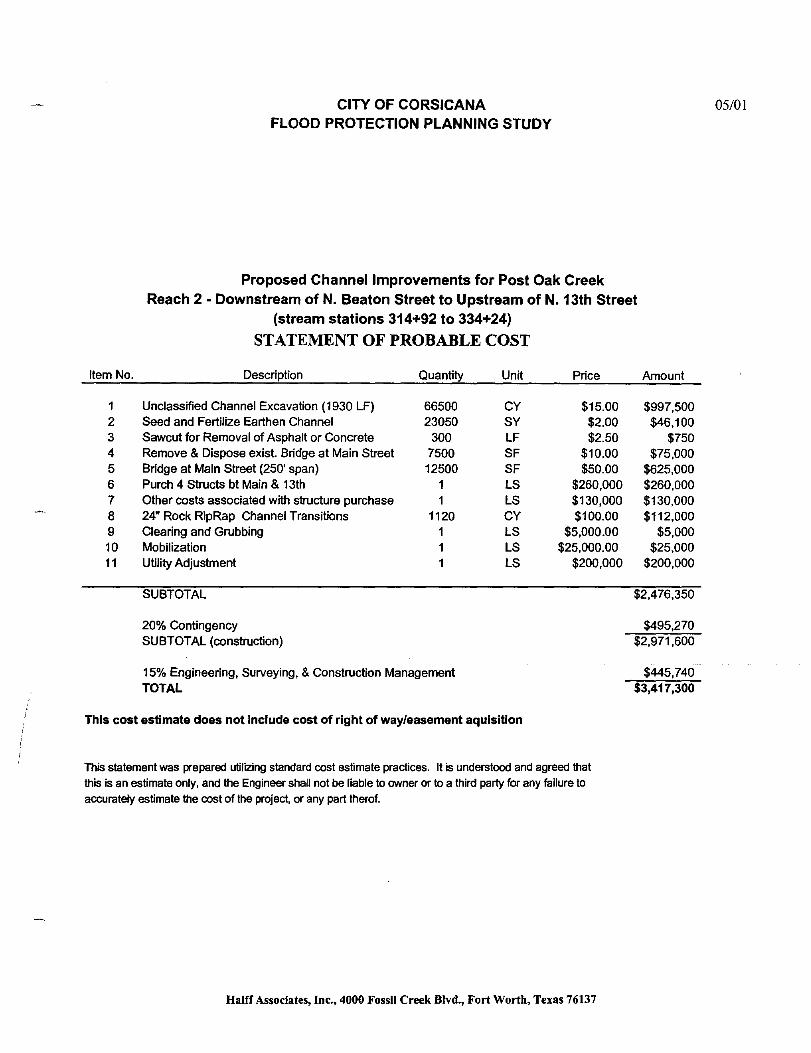
4. Estimated Project Costs - For each of the alternatives considered, a preliminary estimate of implementation (construction) costs was prepared. These costs were based on preliminary quantities and estimated unit prices from recent bids. No geotechnical borings were obtained for the study, and no detailed grading plans, utility relocation investigations, or right-of-way computations were prepared. Preliminary estimates of probable cost for each alternative are shown in Appendix C and are summarized in Chapter IV, of this report.
II-10
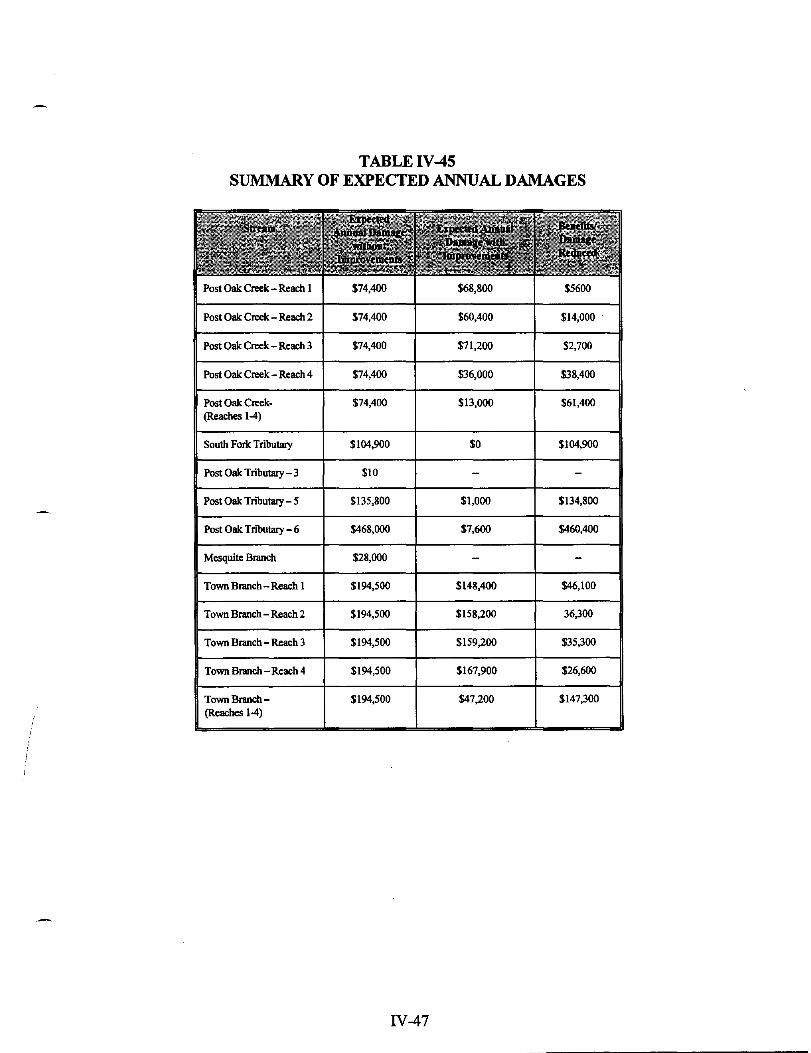
5. Benefit-Cost Comparisons - Benefit-cost calculations were made only for those areas that had significant existing flood damages. Average annual benefits were computed by subtracting the proposed (improved) channel conditions average annual damages, from the existing channel conditions average annual damages. Annual damages and benefits for specific reaches of the study area are contained in Chapter IV. Note that the primary benefit, to be derived from a proposed plan of improvement, is a reduction in flood damages. Social, environmental, and other intangible benefits are not quantified in monetary terms and were not considered in this benefit-cost analysis.
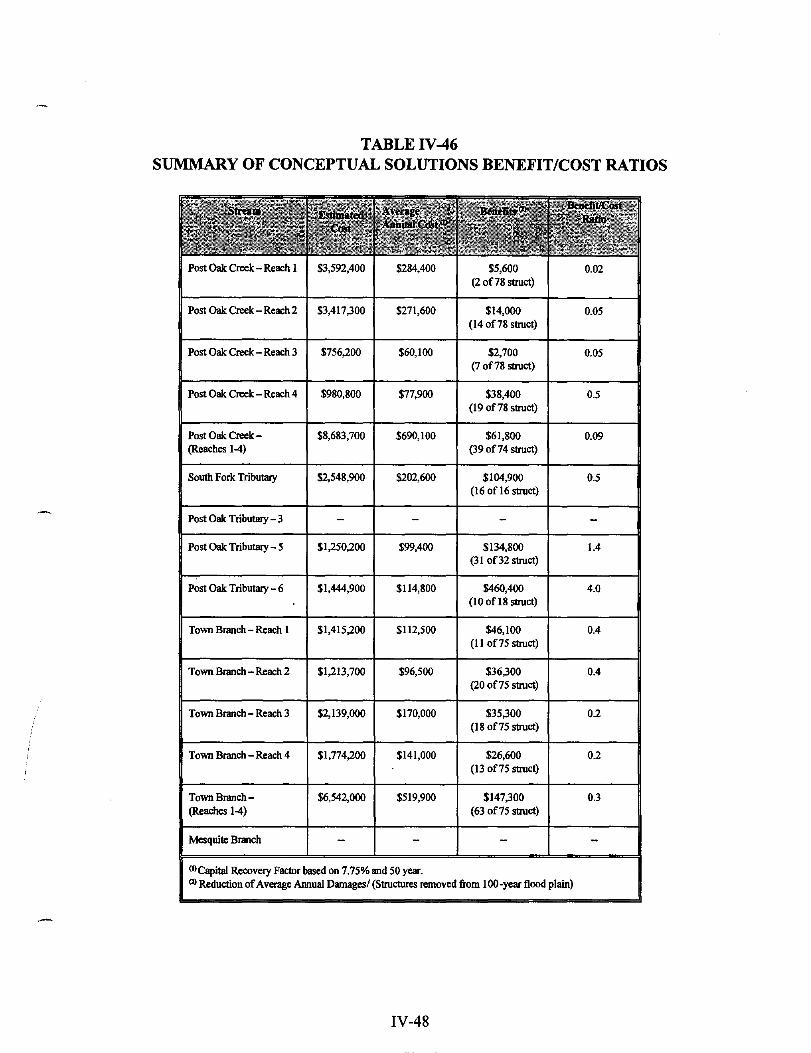
The average annual costs and benefits were calculated for a 50-year period of analysis. Benefit and cost accruals were made comparable by conversion to an equivalent annual basis using an interest rate of 7. 75 percent (Assumed Average Current Federal Discount Rate). The normal measure of economic feasibility, as· used in Federal projects, is a benefit-cost ratio being greater than or equal to 1.0. See Chapter IV for proposed alternative details and the overall benefit-cost ratio of alternatives considered.
Il-11
ill. METHODS OF REDUCING FLOOD DAMAGES
A. INTRODUCTION
A munber of alternative measures can be used, either separately or collectively, to reduce the threat of flooding. The alternatives can be grouped into four broad categories: (1) No Action; (2) Non-Structural Measures; (3) Structural Measures; and (4) Relief Measures. This chapter discusses the alternatives to flood reduction and their applicability to the Post Oak Creek drainage basin within the Corsicana city limits.
B. NOACTION
Taking no action is a non-structural measure that must always be considered. Taking no action towards the flooding problems identified would mean that the City of Corsicana would rely on its current flood plain zoning and subdivision ordinances to regulate all future development along the creeks, and on its Flood Insurance Program regulations to manage future and existing development in the 100-year flood plain and floodway fringe. The interest and significant effort undertaken in the production of this study indicates that the City of Corsicana desires to initiate some action towards alleviating existing and future flooding problems in the study area.
No action constitutes rejection of most mitigation methods of flood plain management. The flood plain would be defined based on existing land use discharges. FEMA regulations would be used to govern the reclamation of flood plain land. The flood plain would be developed or preserved on a piecemeal basis with no consistency or continuity. For example, one owner may preserve his entire flood plain, while the upstream owner may channelize and fill to the floodway limits. This could result in higher discharges downstream and could increase channel velocities and flood elevations through the property of the downstream owner. The development of a predictable flood plain elevation could not be achieved with any certainty. Therefore, each development would have to be handled on an individual basis. This would create considerably more work for the Corsicana city staff, whereas, each flood plain development would be evaluated on an individual basis.
III-1
C. NON-STRUCTURAL MEASURES
Non-structural methods are the management techniques and/or legislative safeguards intended to decrease flooding and reduce flood damage to individual structures or to land in or around a community. Structures can be protected by elevating in place or by regulating or acquiring specific areas of land in fee or easement. Non-structural measures considered for this study are discussed below:
1. Land Use Zoning and Subdivision Regulations
One means of preventing flood damage is to keep industrial, commercial, and residential structures from being built within the flood plain. Flood plain zoning restricts flood plain utilization to uses that can sustain floods without endangering life or valuable property. Regulatory ordinances are intended to secure the maximum benefits and productivity of flood-prone land by allowing flood plains to convey the design flood; promoting the public's health, safety and general welfare; and minimizing potential flood losses.
Non-structural measures such as land use zoning and subdivision regulations allow a community to regulate development within the flood plain. As participants in the National Flood Insurance Program, the City of Corsicana has adopted regulations that equal or exceed the minimal FEMA requirements of controlling the existing 100-year flood plain.
2. Construction Regulations
Construction regulations constitute an important means of preventing flood damage in a developing watershed. Some cities have building codes that contain general flood-protection· provisions whereby the building inspector tries to route all building-permit applications in flood-prone areas through the City Engineer. The City Engineer should then carefully review each application to determine if the proposed building may be flooded and ensure· that all buildings adjacent to a flood-hazard area are built with a ground elevation that is at least 1-foot above, and a finished floor elevation that is at least 2-feet above the fully urbanized 100-year flood elevation. The City should require that all finished floor elevations be specified on the final plat of each new subdivision to help ensure all new structures are built above 1 00-year flood plain elevations.
To limit erosion and downstream sediment, construction projects should be phased to limit the land area that is bare at any one time, and vegetation should be left undisturbed wherever possible. Other practices, such as proper placement of hay bales and silt fences, should also be required. Graded areas should be replanted as soon as possible, and mulches should be used during periods that are not suitable for
III-2
replanting.
3. Municipal Purchase or Private Donation of Land for Public Use
The municipal purchase or private donation of flood plain land is the most secure way for a city to control flood-prone areas. A flood plain could be used as dedicated open spaces, recreational areas, lakes, streets, or wildlife refuges. Greenbelt parks are an example of municipally owned land that serves as a drainage comse and a popular recreational area. Municipal parks can often improve the quality of urban life and enhance property values.
The City may acquire land in the flood plain by three avenues: (I) dedication to municipal ownership on the final plat of a new subdivision; (2) purchase; or (3) gift. The land should be permanently reserved for flood conveyance, open spaces, and/or recreation.
4. Informing the Public
A study of flood-related deaths in the Dallas area indicates that most deaths occur at undersized bridges that are either overtopped or washed out by floodwaters (Reference 14). Using the hydrologic and hydraulic methods discussed in Chapter IT, the frequency of flooding and the depth of water overtopping each roadway can be calculated. Computed future I 00-year flood depths at existing roadway crossings in the Corsicana study area are presented in Chapter IV and are illustrated in the flood profiles that supplement this report.
An alternative to improving dangerous bridges and culverts is to install flood warning signs, barricades, or other systems to inform and alert motorists of hazardous crossings. The City should consider the need for a flood warning sign at all crossings that are overtopped by water during the 100-year and more frequent floods.
Flood warning systems can be passive or active. A passive system would be a warning sign, such as "BEWARE OF HIGH WATER", which would notify people using the bridge that flooding may occur. A gage with easy-to-read depth markings, measured in feet, should show motorists the height of water over the roadway. Guardrails can be installed to prevent vehicles from being washed off a dangerous road crossing, and can be used to identify the edge of the road surface where it may be obscured by floodwater.
Passive warning systems are feasible on lightly traveled residential streets where the motorists are familiar with the area, and are used at crossings with minor flooding. Installation of a passive warning system would be relatively inexpensive. Features
111-3
include warning signs, staff gages, and guardrails.
Active warning systems use a sensing device which monitor the water level in the channel and alerts motorists before the water is actually flowing over the roadway. The active system could be an automatic unfolding warning sign with flashing lights and sirens, or a relayed signal that would alert city workers to barricade the crossings. An active system could also be used to alert local residents of rising floodwaters and to evacuate prior to the flood. Active warning systems are necessary on heavily traveled thoroughfares or at crossings which are extremely hazardous.
The National Weather Service uses radar to locate severe and turbulent weather. The Weather Service declares a flash-flood watch when potentially severe storms are likely. A flash-flood warning is issued when a severe storm has developed and flooding is imminent. The warning is sent to weather wire services, counties and municipalities in the area, and to local Civil Defense authorities. Flood-prediction and early-warning systems usually give populated areas time to prepare flood defenses, evacuate flood-hazard areas, and close dangerous stream crossings.
A Corsicana flood-warning system could be used to alert city officials to barricade flood-prone streets along Post Oak Creek, South Fork of Post Oak Creek, Post Oak Tributary-3, Post Oak Tributary-5, Post Oak Tributary-6, Mesquite Branch, and Town Branch that become treacherous when overtopped. This system would not
·reduce or prevent property inundation or flood damages; however, it would increase public safety.
Many developed areas are flood prone, even if floods have not occurred within the memory of local residents. Flood-hazard maps delineating flood-prone areas, such as those included with this report, have been prepared by the Federal Emergency Management Agency (Reference 13) and by the U.S. Army Corps of Engineers (Reference 2). Dissemination of such flood-hazard information helps landowners to understand the need for compliance with flood plain zoning regulations. It also gives residents in dangerous flood-prone areas evidence of the need to consider relocating their families and businesses.
This report, by accurately updating and delineating the flood-prone areas, pinpoints dangerous flood-prone stream crossings, makes residents aware of local flood hazards, and helps the city and the public evaluate proposed plans to minimize existing and future flood problems.
5. Watershed Management
The reduction of runoff in a watershed lowers peak discharges and flood stages.
III-4
Soil conservation and the maintenance of vegetative ground cover retain water on the soil's surface, allowing infiltration into the soil. Urban development increases the percentage of impervious surfaces in an area, which generally increases the runoff potential. The preservation of trees, the maintenance of lawns, and the discharge of roof drains into vegetated areas all increase the infiltration of storm water into soils in developed areas.
Bare soils are easily eroded, resulting in transportation of sediment through water courses. The flood-carrying capacity of creeks and the storage capacity of flood-control reservoirs are greatly reduced by deposits of this sediment. To limit erosion, vegetation should be left undisturbed wherever possible. Graded areas should be replanted as soon as possible, and mulches should be used during periods that are not suitable for replanting. Some potential erosion problems along Post Oak Creek, South Fork of Post Oak Creek, Post Oak Tributary-3, Post Oak Tributary-5, Post Oak Tributary-6, Mesquite Branch, and Town Branch are discussed in Chapter IV.
6. Debris Removal
The accumulation of trees, brush, sediment, and other debris at bridges, culverts, pipe crossings, or other obstructions has several dangerous consequences. Obstructions to flow could cause higher flood stage elevations upstream of the crossing. In addition, masses of debris can break loose as flood flows increase, producing a destructive wall of water and debris that surges downstream. The force of water on the upstream side of a bridge plugged by debris may exceed the structural capacity of the bridge, causing it to fail. Prevention of debris obstructions can reduce flood damage and potential hazards.
The City should designate a maintenance division responsible for creek-debris removal. This department could inspect bridges quarterly, or upon request, and remove debris from bridge openings. It is not always economically practical for the city to take responsibility for debris removal on private property especially in Corsicana where a significant portion of the flood plain land is privately owned. The removal of debris is an essential flood-reduction technique, the use of which should be continued and increased.
Creeks should be inspected periodically to identify, cut, and remove dead trees or trees whose root systems have been undermined by erosion. An inspection program of this type should be aimed at the prevention of stream obstructions before they occur. Erosion-prevention measures should be instituted in areas where significant trees would be in danger of being uprooted by floodwaters. The inspection program should also identify areas in which siltation and debris could significantly decrease the flood-carrying capacity of the stream channel or the waterway under a bridge
Ill-S
7. Raising of Finished Floor Elevations
Another non-structural measure is the physical raising of structures affected by flooding. Such a measure requires the placement of the structure on a raised pier foundation, adjusting utilities and site aesthetics, and flood proofing utility connections. The types of structures ideally suited for raising are residential and light commercial structures with pier and beam foundations. Slab-on-grade structures are not normally feasible to raise. Federal studies (Reference 15) show that raising of structures is generally not cost-effective if the buildings are above the 1 0-year flood level. Within the study area, the majority of damages to structures appears to occur above a 1 0-year flood, therefore, this alternative would probably not be cost effective.
8. Greenbelt Alternatives
Generally, greenbelt/park alternatives are based on the results of an Environmental Inventory. Greenbelt alternatives can be developed as individual projects, or combined with several other alternatives. Greenbelt plans can be integrated with other flood plain management options. Some alternatives that could be considered include:
o Establislunent of Low Maintenance Greenbelts, o Hike and Bike Trails, o Equestrian Trails, o Active Recreation in Broad Flood Plain Areas.
D. STRUCTURAL MEASURES
Structural measures are actions taken to alter sections of a watercourse within a watershed to prevent flood losses. Structural measures include dams, levees, diversion, dikes, channels, pump stations, and pipe systems. The structural measures considered for this study are discussed below and in Chapter IV.
1. Channel Improvements
Channelization is the widening, deepening, and/or straightening of a stream to improve its conveyance. Channel side slopes may be grass-lined when the slopes are relatively flat (usually 3:1 or flatter), or gabion-lined when the slopes are steep. Channelization is unnecessary wherever an adequate natural drainage-way is available for flood conveyance. Maintenance is a requirement associated with channelization. Deposits of sediment may lead to vegetative growth, causing a reduction in flow capacity. Therefore, sediment should be periodically removed.
III-6
Grass-lined channels must be mowed periodically to maintain conveyance. Concrete-lined channels may also need to be cleaned periodically. Channel improvements were considered in conjunction with alternative flood improvements along each of the creeks in the study area. Specific channel improvement plans are discussed in Chapter IV in sections relating to the individual streams.
2. Bridge and Culvert Improvements
An analysis of existing bridges and culverts for replacement or removal should consider both upstream and downstream effects. Undersized bridges and culverts constrict the flow of flood waters and raise backwater elevations. This temporary storage may be beneficial in lowering downstream flood peaks but can endanger upstream property or make the road crossing dangerous. The replacement or removal of these bridges and culverts would reduce backwater flooding, but could increase downstream flood levels. Halff Associates recommends that the City of Corsicana implement a city-wide bridge rating program as outlined in Chapter V, Section F. Bridges should be rated according to the following criteria: structural safety; flood depths and velocities; hydraulic efficiency; and traffic. Alternatives for improving the flooded bridges and culverts along Post Oak Creek, South Fork of Post Oak Creek, Post Oak Tributary-3, Post Oak Tributary-5, Post Oak Tributary-6, Mesquite Branch, and Town Branch are presented in Chapter IV.
3. Storm water Detention Basins
A detention basin is a reservoir with an outlet device that is designed to release storm water at a slower rate than it's free flow rate in the stream. Detention basins have an emergency overflow that is utilized when the capacity of the outlet and the storage in the pond are exceeded. The outlet may act either by gravity or by pumping.
An on-site detention policy could help the City of Corsicana reduce the impact of urbanization on undeveloped portions of a watershed. Such a policy would require developers to provide temporary storage of storm water within their development or subdivision. This structural alternative proposes to require all future developments to construct on-site detention basins to prevent an increase ofrunoffbeyond existing conditions. A thorough understanding of a detention basin is necessary in order to adopt a detention basin policy. The basic objective of such a detention policy would be to minimize the increase in peak discharges and runoff volumes resulting from increased impervious cover due to development.
As an example, this policy could require that small to medium sized detention basins would be constructed by the developer at the time of paving and drainage construction, and that the basins be designed to contain the I 00-year frequency
III-7
flood and/or provide storm water discharges that are no greater than predevelopment conditions. The ownership and maintenance of the basins would be decided on a case by case basis during the planning and zoning stage of the development.
A variation of the on-site detention policy would be the retention of storm water by homeowners using underground cisterns on their lots. The water could be used by homeowners for irrigation of their lawns and gardens. Previous studies of the feasibility of this measure (Reference 16) have shown that the cost of a cistern retention system is too large to be offset by the reduced water use costs, and would require the city to offer incentives to cover the disparity.
Some of the factors that need to be addressed in connection with detention basins include: design criteria, ownership, safety, health, aesthetics, operation and maintenance, and legal issues. Brief discussion of these factors are listed below:
a. Design - The design frequency often depends on the capacity of the stream or storm sewer below the basin. The pond is presumed to detain enough storm water to reduce the outflow rate to the capacity of the outlet channel or pipe.
The design of dams, spillways, and structures is described in engineering literature and need not be repeated here. A commonly used reference is the Design of Small Dams, a publication of the U, S. Bureau of Reclamation (Reference 17).
b. Ownership -Ownership of the facility by a municipality or public agency is highly preferable. Detention basins are designed based on certain design criteria and zoning coverage that apply at the time of design changes and revisions may be desirable if the conditions change. These changes are more easily accomplished if the basin is publicly owned. Furthermore, accessibility for maintenance and sediment removal is minimized.
c. Safety - Safety of small detention basins is usually improved by fencing. Inlet structures should be screened to prevent a person from being swept into a storm sewer.
Detention basins may also breed mosquitoes that are a health hazard. Standard preventive measures are available for their control. Odors may also become a nuisance in retention ponds. Aeration by a fountain may reduce these problems.
Detention basins can often be made into multi-purpose projects that are both
III-8
useful and aesthetically pleasing. In a park setting, the basins can contain athletic facilities that will not be damaged by infrequent flooding. A retention basin that holds water can be an attractive park feature.
d. Operation and Maintenance - Operation and maintenance of detention basins may include pump operation and maintenance, trash clean up, water treatment, and sediment removal. Operation and maintenance requires that the basin have access for the type of equipment to be used, such as trucks for trash removal, front-end loaders or draglines for sediment removal, etc. Over the years a substantial amount of sediment can accumulate and reduce the flood control effectiveness of the basin. Removal of silt or a designed sediment allowance volume is important.
The cost of acquiring and operating detention basins should be weighed against the cost of providing adequate stream corridors. While the first cost of detention basins may seem to be extremely favorable if the developer is made to pay total cost, the long term operation and maintenance cost should be included in any analysis.
e. Legal - Legally one cloud on the horizon is that the EPA (Environmental Protection Agency) could require some treatment of urban run-off. If this occurs, then detention basins could conceivably retain the storm water long enough to provide the required treatment. A study, "Results of the Nationwide Urban Runoff Program" by U.S.E.P.A., December 1983, reported, "Detention basins are capable of providing very effective removal of pollutants in urban runoff" (Reference 18).
Detention basins may be advantageous to a landowner in meeting his legal requirements not to increase the flow of water onto the landowner below him.
The other legal problems are those involving safety, health, and nuisances which have already been discussed. Municipal laws of the state involved should be followed.
4. Regional Storm water Detention Basins
A relatively large regional storm water detention basin could be located and sized to retain a specified volume of storm water so that the peak of the runoff would be reduced.
Such regional basins will be large enough to require the city to construct and maintain the facilities. Basins could be incorporated into a community or regional
ill-9
park site and function as a major recreational amenity to the park. The same design consideration and other issues that were previously described for on-site detention basins apply to regional detention basins as well.
5. Selective Reclamation
This alternative would include selective reclamation for development of the flood plain based on fully-developed conditions. This alternative would allow property owners to reclaim a portion of their flood plain land, while preserving the environmentally sensitive areas. Under this alternative, the future tax base of the city could increase as the land is reclaimed and added to the tax rolls.
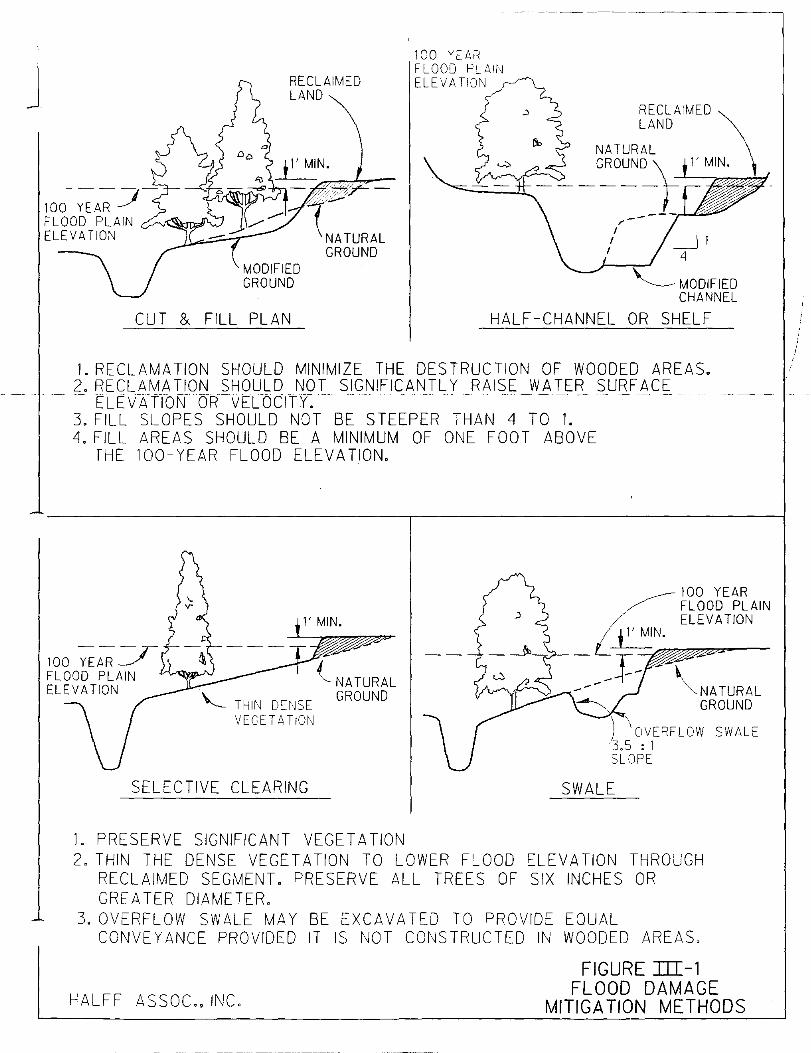
6. Reclamation with Compensating Conveyance
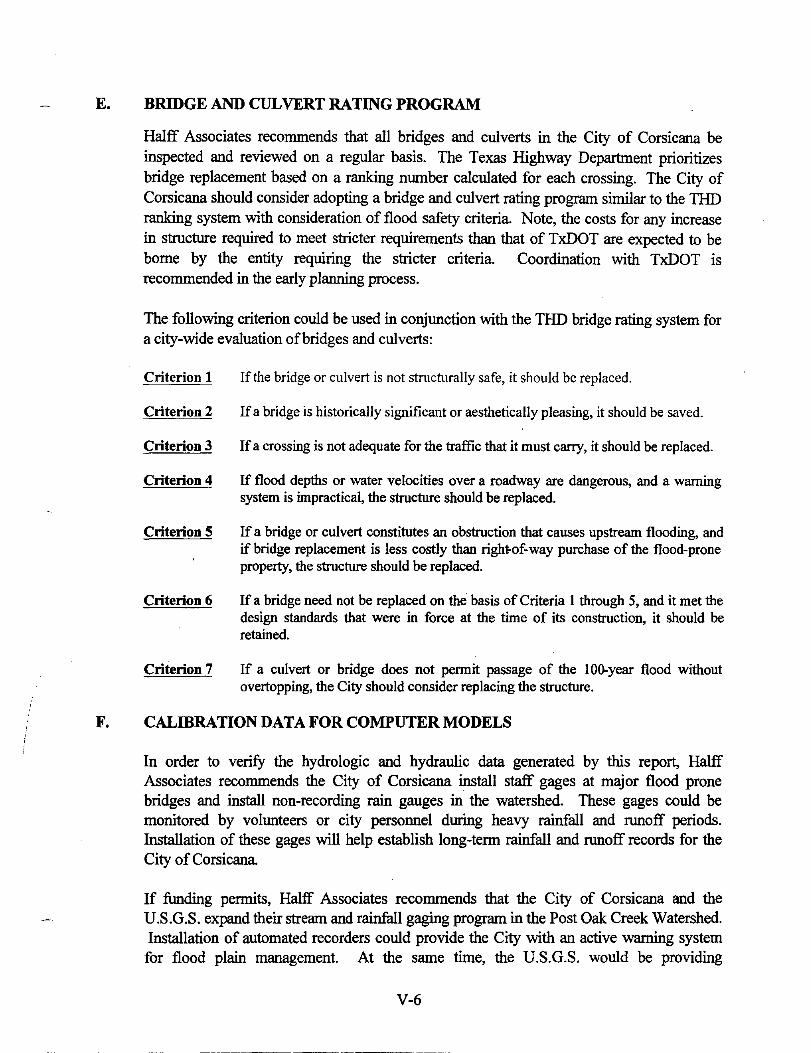
This alternative allows reclamation of a portion of the flood plain fringe by providing additional conveyance in the remaining flood plain. Reclamation would hopefully be limited to broad non-wooded flood plain land or in areas with minimal environmental assets. Possible methods of reclaiming flood plain fringe land, as shown in Figure III-1, are listed below:
• Cut and fill which provides equal or greater flood conveyance for the area which was reclaimed,
• Half channel or shelf,
• Reduce roughness coefficient of stream by providing greater maintenance, i.e., selective clearing, remove heavy underbrush, monthly mowing,
• Overflow swales.
E. RELIEF MEASURES
1. Public Disaster Action
The City of Corsicana has procedures to be followed when flooding is anticipated at specific locations. City officials monitor areas that are likely to flood, and when flooding becomes imminent, personnel are dispatched to the areas to warn the residents, and to barricade dangerous roads. The potential need for public disaster action in the Corsicana study area could be greatly reduced by improvements recommended in Chapter IV.
III-10
J
CUT & FILL PLAN
100 YEAR FLOOD PLAir" ELEVATION
--~--------------,
RECLAIMED LAND
MODIFIED CHANNEL
HALF-CHANNEL OR SHELF
1. RECLAMATION SHOULD MINIMIZE THE DESTRUCTION OF WOODED AREAS. 2. RECLAMATION SHOULD NOT SIGNIFICANTLY RAISE WATER SURF ACE
- - E.u::vATTOf\f OR-VELOCIT'l'~ -- - - -- - ---3. FILL SLOPES SHOULD NOT BE STEEPER THAN 4 TO 1. 4. FILL AREAS SHOULD BE A MINIMUM OF ONE FOOT ABOVE
THE 100- YEAR FLOOD ELEVATION.
(_NATURAL
"-._ THIN DEr,ISE GROUND VEGETATION
\NATURAL GROUND
J 'OVERFLOW SWALE '3.5 : 1 SLOPE
SELECTIVE CLEARING SWALE
1. PRESERVE SIGNIFICANT VEGETATION 2. THIN THE DENSE VEGETATION TO LOWER FLOOD ELEVATION THROUGH
RECLAIMED SEGMENT. PRESERVE ALL TREES OF SIX INCHES OR GREATER DIAMETER.
3. OVERFLOW SWALE MAY BE EXCAVATED TO PROVIDE EOUAL CONVEYANCE PROVIDED IT IS NOT CONSTRUCTED IN WOODED AREAS.
HALFF ASSOC., INC.
FIGURE ill-1 FLOOD DAMAGE
MITIGATION METHODS
2. Flood Insurance
Flood insurance helps to alleviate the cost to individuals of flood damages after flooding has occurred. However, flood insurance does not prevent damaging floods, which remain burdensome to insurance institutions, property owners, and local and Federal Governments. Purchase of more flood insurance for property owners in the study area will offer some relief from expensive flood damages. This alternative may be advantageous in areas too infrequently flooded to justify any other flood damage mitigation measure. The City of Corsicana is a participant in the National Flood Insurance Program (NFIP). Currently, there are 84 policies in force. As a condition to property owners purchasing flood insurance offered by the NFIP, participating communities have agreed to adopt and administer local flood plain management measures aimed at protecting lives and new construction from future flooding. The Federal Emergency Management Agency (FEMA), as part of this program, published Flood Insurance Rate Maps (FIRM) as part of the Corsicana Flood Insurance Study (Reference 13). In communities where a flood map has been published, Section 102 of the Flood Disaster Protection Act of 1973, as amended, requires the purchase of flood insurance as a condition of Federal or Federally-related financial assistance for acquisition or construction of buildings in special flood hazard areas, as shown on the FIRMs. The act also requires local Governments to furnish the following:
• Copies ofland use and control measures, • Maps identifying jurisdictional limits and flood plain areas, • Estimates of buildings and populations in flood plains, • A local depository where flood-insurance and flood-hazard maps
will be available for public inspection, and • A summary of the community's history of flooding.
Communities currently participating in the NFIP that enforce more restrictive measures than the minimum criteria can reduce.flood insurance rates for citizens within their jurisdiction .. by-applying for the "Community Rating System" (CRS). _.
F. NORTH CENTRAL TEXAS COUNCIL OF GOVERNMENTS FLOOD PLAIN MANAGEMENT POLICIES
The North Central Texas Council of Governments (NCTCOG) has developed a program of cooperative watershed management policies for effective storm water management and stream corridor planning at the local government level. Eight broad policies have been developed in other NCTCOG watersheds such as Rowlett Creek (Reference 19), which addressed flood plain delineation and management, greenbelt planning, and design standards.
III-11
The City of Corsicana should consider adopting some or all of these policies, with modifications to reflect the results of this study. The City staff should determine if the policies should be adopted as presented or modified prior to presentation to the City Council for consideration.
The eight North Central Texas Council of Government policies and supporting justification as developed are presented as follows.
Policy No.1
BFE: 100-Year Flood Plain- Fullv Developed Watershed Land Use. The base flood elevation (BFE) and flood plain used for design and planning should be evaluated upon total storm water discharge quantities that will, through future urbanization, be generated from a fully developed watershed
Basing flood plain maps and discharge quantities on fully developed land use conditions is required to assure that buildings, bridges, and reclaimed flood plain areas are safe and can adequately accommodate anticipated hydrologic changes created by a maturing watershed. Developing a storm water discharge computer model for fully developed watershed conditions will help identify needed capital improvements or other special conditions that warrant preventative actions.
Policy No. 2*
Allow No Rise in Base Flood Elevation. Reclamation of the flood plain should be permitted only if it can be demonstrated that there will be no rise in the base flood elevation.
The FEMA "floodway" concept contained in the National Flood Insurance Program allows up to a one foot rise in flood elevations assuming current development conditions only. Reclamation which allows a rise in flood elevation could predictably create adverse impacts either upstream or downstream. Therefore, it is stron_sly recommended.that no rise in base flood elevation be allowed. Note, if the No Rise policy is acfopted, coordination with TxDOT is recommended when evaluating bridge improvements. '
Policy No.3
Velocitv Controls. Velocity controls should be established which specify maximum allowable flow rates for specific channel, bed and bank treatments.
Uncontrolled flow velocities which are excessive could cause damage to the channel, bank, water body and the downstream reservoir. Erosion could also cause severe damage to structures (e.g. bridges) or even cause channel modifications which result in additional downstream flooding. , .•
III-12
Policy No.4
Minimize Alteration or Channelization of Post Oak Creek and its Major Tributaries (except where required for safety and public welfare). The drainage-way of the creek and its major tributaries should be left in a natural state to control erosive velocities, prevent excessive downstream discharges and preserve the natural effict of the stream.
Historic efforts in managing storm flow consisted of simple routing of storm water through gutters and channels with the simple objective of removing the storm water as quickly as possible. It has long been recognized that simply bypassing storm flows really shifts the location of the problem and very often aggravates the problem by compounding downstream flows. The end result is often an increase in total flow, peak flow rate and stream velocity.
A more effective approach to storm water management for Post Oak Creek, Mesquite Creek, and Tributaries is to maintain as nearly as possible the natural runoff flow characteristics.
Policy No.5
Seek Public Ownership of Remaining Flood Plain. Any flood plain remaining after final reclamation should be deeded or dedicated to the city to prevent further encroachment and assure proper drainage maintenance.
As reclamation proceeds, the remaining flood plain land provides critical drainage during major storm events. In a functional sense, the flood plain remaining after reclamation has evolved into the classical definition of a floodway. In other words, the flood plain will have been reduced to the channel and adjacent land area required to provide passage of the base flood.
pd{;cyNo. 6
Buffer Zones. Where practical, the City of Corsicana should require parallel streets, greenbelts, etc. along the stream corridor to assure access and to create buffer zones between the flood plain and development.
A buffer zone should function as a clear transition between natural areas which may be subject to flooding and areas of other land uses. Buffer zones should visually define the flood plain and be available to provide additional water conveyance during major storm events.
Ill-13
PolicyNo. 7
Linear Park. Cooperation in development of a contiguous linear park along the Post Oak Creek stream corridor should be actively pursued
The use of the natural stream corridor for drainage requirements can be combined with other valuable non-competing uses such as public recreation. By combining these uses with drainage and flood protection requirements, the community can maximize the total beneficial use of the flood plain and adjacent areas.
Policy No.8
Pursue Discussion of Specific Development Standards. Further evaluation and discussion of specific development standards such as detention policies and minimum floor slab elevations should be jointly pursued to insure adequate water quality protection and flood water control.
Several specific flood plain management rules and requirements have been identified as needing further attention. For example, Halff Associates has recommended requiring finished floor elevations be at least a minimum of two feet above the "base flood" elevation. Local implementation of Policy No. 3 will result in development standards which specify maximum flow velocities. Also, Corsicana will need to establish minimum requirements for acceptable drainage easements. Drainage easements will require sufficient room for access of necessary maintenance equipment and/or sufficient suitable land to construct and maintain existing and future walking and bicycling paths.
III-14
i I
IV. STUDY RESULTS
A. GENERAL
Halff Associates updated the previous Corps of Engineers' hydrologic data in the Post Oak watershed basin, to develop the drainage area map illustrated on Figure IV-1. (A detailed map is provided in Appendix D.) This detailed drainage area map includes approximately 30 sub-basins.
Table IV-1 is a list of computed drainage areas and estimated SCS Curve Numbers (for existing and ultimate land use conditions) for each sub-watershed basin in the study area
This study includes flood information for the following land use and flood plain conditions:
o Flood discharges based on existing land use conditions and existing channels and bridges. Note, this data could be very useful if the city of Corsicana decides to submit a city-wide update of the current FEMA. Flood Insurance Rate Maps.
o Flood discharges based on future land use conditions (fully urbanized watershed) and existing channels and bridges. For this study, this condition is referred to as Baseline Conditions.
o 100-Year flood plain delineation and flood profiles for existing channels and bridges with flood discharges based on future land use conditions (fully urbanized watershed). (See Appendix D)
o Selective channel and bridge improvements and accompanying flood profiles with flood discharges based on future land use conditions (fully urbanized watershed) and existing channels/.
Post Oak Creek originates a few miles west of Corsicana, and flows north to Soil Conservation Dam 139. It then flows in an easterly direction through the northern portion of the City. It then flows southerly until it reaches its confluence with Chambers Creek about seven miles east of the City.
Existing land uses in the Post Oak Creek watershed study area consist of approximately 70% crops and pasture; 15% residential; 10% business/commercial/ industrial areas; 3% parks and open space; and scattered public/semi-public areas (i.e. schools, churches, etc.). Future development will consist of approximately 50% residential; 40% business/commercial/industrial; and scattered parks, public/semi-public areas.
2. Hydrologic Study Results
Halff Associates prepared detailed HMS hydrologic computer models of the watershed to analyze existing land use conditions and projected ultimate land use conditions. Ultimate land use conditions were analyzed with channel flood routing data based on existing channels and bridges. Peak flood discharges calculated for this study include the 5-, 10-, 25-, 50-, I 00-, and 500-year flood frequencies. Tables IV-2 and IV-3 contain peak flood discharge information at key locations along Post Oak Creek within the study area Existing peak flood discharges based on existing land use and existing channel/bridge conditions are presented in Table IV-2. Future peak discharge information based on future land use and existing channel\bridge conditions are presented in Table IV-3.
IV-3
At N Beaton Street
At N Bumert Street
TABLEIV-3 FUTURE PEAK FLOOD DISCHARGES (cfs)
(With Existing Channels and Bridges) Post Oak Creek
16.78
were nearest 2. Peak discharges are based on future land use watershed with existing channels and culverts.
14500
A comparison of existing conditions I 00-year peak flood discharges computed for this study and the peak discharges published in the I99I COE Post Oak Creek Reconnaissance Report (Reference 2) and the I98I Corsicana Flood Insurance Rate Study (Reference 13) are presented in Table IV -4. The difference between existing development discharges and FEMA published discharges can be attributed to increased urbanization and level of detail. A comparison of future conditions I 00-year peak flood discharges computed for this study and the peak discharges published in the I978 COE Detailed Project Report (Reference 2I) are presented in Table IV-5. The difference between future development discharges and the COE published discharges can be attributed to level of detail such as detailed routing throughout model for this study. Differences between existing discharges and ultimate discharges is attributed to urbanization of the watershed as outlined above.
IV-5
TABLEIV-4 COMP ARISON OF EXISTING CONDITIONS COMPUTED PEAK FLOOD DISCHARGES
Post Oak Creek
9100
Mesquite Oeek
I. Discharges were rounded to the nearest 100.
2. Peak discharges are based on an existing land use watershed with existing channels and culverts.
3. Corps Disdlarge from 1991 COE Reconnaissance Report
4. FEMA Flood Insurance Study for the Town of Corsicana, Tx, Effective Date I 981.
IV-6
6500 I 6700
15200 I 18000
------.
TABLEIV-5 COMPARISON OF FUTURE CONDITIONS COMPUTED PEAK FLOOD DISCHARGES
Post Oak Creek
7100
8100
45
At 14500
Mesquite Creek
I. Discharges were rounded to the nearest 2. Peak discharges are based on an existing land use watershed with existing channels and culverts.
3. Corps Discharge from 1978 COE Detailed Project Report.
IV-7
3. Hydraulic Study Results
Post Oak Creek is approximately 5.4 miles in stream length through the City of Corsicana study area. The average channel slope through the study area is about 0.20%. The channel is well defined with depths ranging from about 5 feet to 18 feet The entire length of stream through the study area consists of a natural earthen channel. Portions of existing flood plains are generally undeveloped while certain areas consist of residential and commercial developments. The Post Oak Creek future fully urbanized 100-year flood plain delineation prepared for this report includes approximately 450 acres of land within the Corsicana City limits. One hundred and fifty-four structures are located within this I 00-year flood plain delineation. Seventy-eight of these structures have estimated finish floors below the 100-year flood plain as indicated in Table IV-6. The expected annual damage for these structures is $74,400.
TABLEIV-6 BASELINE CONDIDONS SINGLE OCCURRENCE FLOOD LOSSES
Post Oak Creek
5-yr 8 8 $66,000
10-yr 8 16 $147,000
25-yr 26 42 $332,000
50-yr 18 60 $614,000
100-yr 18 78 $880,000
500-yr 44 122 $1,900,000
There are fourteen bridges along Post Oak Creek. Pertinent data for each bridge can be found in Table N-7. The computed future 100-year flood overtops the existing roadway at ten of the fourteen bridge locations along Post Oak Creek. Graphical representation of these and other potential flooding areas along Post Oak Creek are presented on the flood plain maps and flood profiles that supplement this report. (See Appendix D.)
Existing channel velocities are generally non-erosive, less than 6.0 feet per second. Channel velocities greater than 8 feet per second were computed at bridge crossings at Burnert Road (stream stations 264+43 to 267+74) and at Chatfield Road (stream stations 285+95 to 287+29). Although erosion continues to occur along Post Oak
IV-8
-----------··-·-··----···--
Creek, there were no identified instances of high potential loss of private property or areas classified as severe erosion problems.
IH-45 North Bound 209+40 360.09 Fronlllge Road
IH-45 South Bound 210+25 362.55 Fronlllge Road
E. S"'Avenue 240+95 381.22
Bumert Street 268+00 372.97
N. 3"' Street 286-+{;2 376.5
N. 7"' Street 295+80 380.8
Southern Pacific RR 303+50 385.9
N.IO"'Street 313+79 384.7
Beaton Street 316+99 384.7
N. Main Street 322+69 386.4
N. 13"Street 330+49 389
Oaklawn Drive 350+99 388.53
Dobbins Road 393+04 396.2
Bowie Drive 409+29 403.11
I Approximate Elevations (NGVD).
TABLEIV-7 BRIDGE DATA Post Oak Creek
375.3 381.3
376.8 383.44
382 387.17
37997 38126
388.88 39433
392.7 395.7
394.08 398.08
390.53 393.53
396.65 402.32
3942 3972
399.07 402.07
396.53 397.61
405.2 407.16
407.11 4109
8600 378.82 Concrete Bridge with 2 Piers
8600 380.52 Concrete Bridge with2Piers
8600 382.91 Concrete Bridge with 2 Piers
8500 388.07 5-84" RCP
8500 391.33 Concrete Bridge with I Pier
6800 395.06 Concrete Bridge with 3 Piers
6800 396.50 Concrete Bridge with 3 Piers
6800 39726 Concrete Bridge with2 Piers
6700 39826 Concrete Bridge with2Piers
6700 399.13
6700 40128
5900 403.28 1-20'x8' CBC
2500 410.92 1-12'x9' CBC
2000 412.61 448"RCP
2 100-Year Discharge based on future development with existing channels and bridges/culverts (Baseline Conditions). I 00-Year flood elevation based on channels and culverts.
IV-9
4. Improvements
Halff Associates utilized the existing channel condition Post Oak Creek HEC-RAS hydraulic computer model to prepare conceptual bridge and channel designs for future roadway improvements and erosion protection. The following is a brief description of the proposed conceptual improvements for Post Oak Creek:
Reach 1 - Downstream of N. Burnert Street to W. 'Jih Street (stream stations 249+40 to 295+53)
• Five -12'x7' concrete box culverts at N. Burnert Street. • 3700 LF 50' bottom width 3:1 grass-lined channel from 1800' downstream of N.
Burnert Street to E. Chatfield Road (stream stations 249+40 to 286+45). • Bridge expansion at Chatfield Road . • 875 LF 50' shelf channel between E. Chatfield Road and W. -rm Street (stream stations
286+79 to 295+53). Figure /II-I illustrates a typical proposed "shelf' channel. Estimated Probable Cost: $3,592,400 Average Annual Cost: $284,400 Estimated Annual Benefit: $5,600 Benefit/Cost Ratio: 0.02
The estimated probable cost of these proposed conceptual improvements for Reach 1 is $3,592,400. Proposed improvements through Reach I, from N. Bumert Street toW. -rm Street, will remove two (2) structures from the 1 00-year flood plain delineation as shown in Table IV-8. Reach 1 proposed conceptual solutions reduce the expected annual damages by about $5,600.
TABLEIV-8 IMPROVED CONDITIONS SINGLE OCCURRENCE FLOOD LOSSES
REACH 1 (N. BURNERT STREET TOW. 7™ STREET) Post Oak Creek
5-yr 8 7 $56,000
10-yr 16 14 2 $130,000
25-yr 42 40 2 $311,000
50-yr 60 58 2 $576,000
100-yr 78 76 2 $838,000
500-yr 122 116 6 $1,807,000
IV-10
Reach 2 - Downstream of N Beaton Street to Upstream o{N I 3th Street (stream stations 314+92 to 334+24)
• 840 LF 50' shelf channel :from N. Beaton Street to just upstream ofN. Main Street (stream stations 314+92 to 323+35). Figure III-I illustrates a typical proposed "shelf" channel.
• Bridge expansion/ Raise N. Main St • 640 LF 100' shelf channel from just upstream ofN. Main Street toN. 13th
Street (stream stations 323+35 to 329+76). Figure III-I illustrates a typical proposed "shelf' channel.
• Purchase 4 structures between N. Main Street and N. 13th Street in order to construct above 640 LF of improvements.
• 450 LF 50' shelf channel from N. 13th Street to just upstream of N. 13th Street (stream stations 329+76 to 334+24). Figure III-I illustrates a typical proposed "shelf' channel.
The estimated probable cost of these proposed conceptual improvements for Reach 2 is $3,417,300. Fourteen (14) structures are removed :from the 100-year flood plain delineation as indicated in Table IV-9 by the proposed improvements through Reach 2, :from N. Beaton Street to N. 13th Street. Reach 2 proposed conceptual solutions reduce the expected annual damage by $14,000.
TABLEIV-9 IMPROVED CONDITIONS SINGLE OCCURRENCE FLOOD LOSSES
REACH 2 (N. BEATON STREET TON. 13m STREET) Post Oak Creek
5-yr 8 5 3 $54,000
10-yr 16 13 3 $125,000
25-yr 42 29 13 $271,000
50-yr 60 47 13 $503,000
100-yr 78 64 14 $726,.000
500-yr 122 116 6 $1,634,000
IV-11
Reach 3- N J3fh Street to 1690' upstream of Oak/awn Drive (stream stations 334+24 to 368+00)
• 3375 LF 30' bottom width 3:1 grass-lined channel from just upstream ofN. 13th Street to 1690' upstream of Oaklawn Drive (stream stations 334+24 to 368+00).
The estimated probable cost of these proposed conceptual improvements for Reach 3 is $756,200. The proposed improvements through Reach 3, from N. 13th Street to upstream of Oaklawn Drive remove seven (7) structures from the 1 00-year flood plain delineation as illustrated in Table IV -10. The expected annual damage is reduced by $2,700 by the Reach 3 proposed conceptual solutions.
TABLEIV-10 IMPROVED CONDITIONS SINGLE OCCURRENCE FLOOD LOSSES
REACH 3 (N. 13111 STREET TO OAKLA WN DRIVE) Post Oak Creek
5-yr 8 8 0 $66,000
10-yr 16 16 0 $147,000
25-yr 42 40 2 $296,000
50-yr 60 55 s $527,000
100-yr 78 71 7 $756.000
500-yr 122 107 IS $1,635,000
Reach 4 - 1690' upstream of Oak/awn Drive to Dobbins Road (stream stations 368+00 to392+85)
• 2485 LF 30' bottom width 3:1 grass-lined channel from just 1690' upstream ofOaklawn Drive to Dobbins Road (stream stations 368+00 to 392+85).
• Three 12'x9' concrete box culverts at Dobbins Road. Estimated Probable Cost: Average Annual Cost: Estimated Annual Benefit: Benefit/Cost Ratio:
IV-12
$980,800 $77,900 $38,400 0.5
The estimated probable cost of these proposed conceptual improvements for Reach 4 is $980,800. Nineteen (19) structures are removed from the 100-year flood plain delineation by the proposed improvements through Reach 4, from Oaklawn Drive to Dobbins Road, as shown in Table IV -11. The Reach 4 proposed conceptual solutions reduce the expected annual damage by $38,400.
TABLEIV-11 IMPROVED CONDITIONS SINGLE OCCURRENCE FLOOD LOSSES
REACH 4 (OAKLA WN DRIVE TO DOBBINS ROAD) Post Oak Creek
S·yr 8 6 2 $22,000
10-yr 16 11 5 $49,000
25-yr 42 34 8 $170,000
50-yr 60 46 14 $296,000
100-yr 78 59 19 $420,000
500-yr 122 83 39 $1,084,000
The total estimated probable cost of all (Reaches 1-4) proposed conceptual improvements for Post Oak Creek is $8,683,700. The estimated annual cost for all (Reaches 1-4) improvements is $690,100. The resulting improved flowlines and water surface elevations are displayed on the flood profiles that supplement this report (See Appendix D). HEC-RAS summary printouts for the proposed recommendations may be found in Appendix E.
The aforementioned estimates ·for removal of structures were determined by each individual reach investigated independently. Therefore, overlap exists among the number of structures removed (i.e. the improvements from N. 13th Street to upstream of Oaklawn Drive improve conditions upstream and remove structures that are also removed by the improvements from upstream of Oaklawn Drive to Dobbins Road). However, more structures are removed by the combined effect of implementing all improvements (Reaches 1-4 ). In this case, the sum of structures removed by the implementation of all improvements (Reaches 1-4) is less than the sum of that of the individual improvements by reach due to the overlap. With all improvements in place (Reaches 1-4), thirty-nine (39) structures are removed from the 100-year flood plain delineation as illustrated in Table IV-12. The aforementioned estimates of reduction of expected annual damage determined for
IV-13
c.
each improvement were also investigated independently. When all the improvements (Reaches 1-4) are implemented, their combined effect lowers the water surface elevation more than their individual effect. Therefore, with all improvements (Reaches 1-4) in place, the reduction in expected annual damages is greater than the sum of that of the individual improvements by reach. With all improvements (Reaches 1-4) in place, the proposed conceptual solutions reduce the expected annual damage by $61,400. The benefit to cost ratio is 0.09.
TABLEIV-12 IMPROVED CONDITIONS SINGLE OCCURRENCE FLOOD LOSSES
ALL IMPROVEMENTS (REACHES 1-4) Post Oak Creek
S-yr 8 0 8 so
J().yr 16 3 13 $2.000
25-yr 42 IS 27 $59,000
S().yr 60 31 29 $158,000
JO().yr 78 39 39 $205,000
SO().yr 122 62 60 $564000
SOUTH FORK OF POST OAK CREEK
1. Descril!tion of Watershed
The South Fork of Post Oak Creek watershed study area lies in the west side of Corsicana. South Fork originates north of State Highway 31 and flows northerly until it reaches its confluence with Post Oak Creek where the total drainage area is approximately 1.57 square miles (I ,004 acres).
Existing land uses in the South Fork of Post Oak Creek watershed study area consist of approximately 70% residential; 20% crops and pasture; 5% business/commercial/industrial. areas; and scattered parks, public/semi-public areas (i.e. schools, churches, etc.). Future development will consist of approximately 90% residential; 5% business/commercial/industrial; and scattered parks, public/semi-public areas.
IV-14
i
I I
2. Hydrologic Study Results
2. Peak
Halff Associates prepared detailed HMS hydrologic computer models of the watershed to analyze existing and projected ultimate land use conditions. Ultimate land use conditions were analyzed with channel flood routing data based on existing channels and bridges. Peak flood discharges calculated for this study include the 5-, 10-, 25-, 50-, 100-, and 500-year flood frequencies. Tables IV-13 and IV-14 contain peak flood discharge information at key locations along South Fork. Existing peak flood discharges based on existing land use and existing channel/bridge conditions are presented in Table IV-13. Future peak discharge information based on future land use and existing channel/bridge conditions are presented in Table IV -14.
(With Existing Channels and Bridges) South Fork Creek
channels and culverts.
IV-15
3. Hydraulic Study Results
South Fork of Post Oak Creek is approximately 1.6 miles in stream length through the City of Corsicana of whichl.4 miles was studied. The average channel slope through the study area is about 0.5%. The channel is well defined with depths ranging from 3 feet to 12 feet. The entire length of stream through the study area consists of an earthen channel with some concrete occurring at bridges. An existing 3 acre pond is located upstream ofN. 2~ Street.
The South Fork of Post Oak Creek future fully urbanized 100-year flood plain delineation prepared for this report includes approximately 44 acres of land within the Corsicana City limits. Twenty-seven structures are located within this I 00-year flood plain delineation. Sixteen of these structures have estimated finish floors below the 100-year flood plain as indicated in Table IV-15. The South Fork expected annual damages for these structures is $104,900.
TABLEIV-15 BASELINE CONDITIONS SINGLE OCCURRENCE FLOOD LOSSES
South Fork Creek
5-yr 5 5 $159,000
10-yr 6 II $346,000
25-yr 2 13 $539,000
50-yr 2 15 $692,000
100-yr 16 $826,000
500-yr 6 22 $1,150,000
In the City of Corsicana, there are six bridges along South Fork of Post Oak Creek. Pertinent data for each bridge can be found in Table IV-16. The computed future 100-year flood will overtop the existing roadway at all six of these bridge locations. Graphical representation of these and other potential flooding areas along South Fork of Post Oak Creek are presented on the flood plain maps and flood profiles that supplement this report. (See Appendix D.)
IV-16
Mimosa Drive 2+25 397.81
Fairfax Drive 5+51 399.68
N. Bowie Drive 10+20 403.62
Paloma Street 20+60 405.15
N. 2fl' Street 33+50 407.70
N. 29th Street 60+50 420.60
Approximate Elevations (NGVD).
TABLEIV-16 BRIDGE DATA
South Fork Creek
402.31 404.04
404.18 404.94
408.15 409.49
413.15 414.16
416.70 419.62
428.60 430.25
2800
2800
2800
2800
2200
2200
409.06 3-7'x4.5' CBC
409.48 3-7'x4.5' CBC
413.70 1-20'x4.5' CBC
417.95 1-20'x8' CBC
421.37 3-!0'x9' Ellipse Culvert'
430.90 S-96"CMP
2 I 00-Year Discharge based on future development with existing channels and iidges/culverts (Baseline Conditions). 3 I 00-Year flood elevation based channels and culverts.
South Fork of Post Oak Creek existing channel velocities are generally non-erosive, less than 6.0 feet per second. Channel velocities greater than 8 feet per second were computed downstream ofN. Bowie Drive (stream stations 6+50 to 10+04). Two homes are close to the channel banks in this high velocity area.
IV-17
(/) 0
~z a::O <(a_ t-
N:::lz .mo >a::i= - z wt-w a::~t:::la::W (.!)00 l.J..l.J.. 0
:r:W t-V> ::JO oa.. (/)0
a:: a_
4. Improvements
Halff Associates utilized the existing channel condition South Fork HEC-RAS hydraulic computer model to prepare conceptual bridge and channel designs for future roadway improvements and erosion control. See Chapter V for guidance on erosion control. The following is a brief description of the proposed conceptual improvements for the South Fork of Post Oak Creek:
• Five -10'x6' concrete box culverts at Bowie Drive. • 1000 LF 10' bottom width 3:1 grass-lined channel from Bowie Drive to
Paloma Street (stream stations 10+36 to 20+41). • Three- 10'x8' concrete box culverts at Paloma Street. • 1255 LF 20' bottom width 3:1 grass-lined channel from Paloma Street toN.
2et' Street (stream stations 20+41 to 33+34). • Turn existing 3 acre pond upstream N. 2gth Street into 3 acre x 1 0' detention
The estimated probable cost of these proposed conceptual improvements is $2,548,900. The resulting improved flowlines and water surface elevations are displayed on the flood profiles that supplement this report (See Appendix D). HECRAS summary printouts for the proposed recommendations may be found in Appendix E. The proposed improvements remove sixteen (16) structures from the 100-year flood plain delineation as illustrated in Table IV-17. The proposed conceptual solutions reduce the expected annual damage by $104,900.
IV-18
D.
TABLEIV-17 IMPROVED CONDffiONS SINGLE OCCURRENCE FLOOD LOSSES
South Fork Creek
5-yr 5 0 5 $0
10-yr 11 0 11 $0
25-yr 13 0 13 $0
50-yr 15 0 15 $0
100-yr 16 0 16 so
500-yr 22 0 22 $0
TRIBUTARY P0-3
1. Descri~tion of Watershed
Tributary P0-3 (Post Oak 3) is located in the north-central quadrant of the City of Corsicana. Tributary P0-3 originates just downstream of Chicago Rock Island Railroad and flows in southerly until it reaches its confluence with Post Oak Creek. The total drainage area of the Tributary P0-3 watershed is 0.13 square miles (89
acres).
The Tributary P0-3 watershed is approaching its maximum projected development stage in 2000. Existing land uses in the Tributary P0-3 watershed consist of approximately 60% residential, 20% business/commercial/industrial areas; 15% crops and pasture; and scattered public/semi-public areas (i.e. schools, churches etc.). Future development will consist of approximately 75% residential, 20% business/commercial/industrial areas; and scattered public/semi-public areas.
2. Hydrologic Study Results
Halff Associates prepared detailed HMS hydrologic computer models of the watershed to analyze existing land use and projected ultimate land use conditions. All hydrologic analyses were prepared with flood routing data based on existing channels and bridges. Peak flood discharges calculated for this study include the 5-, 10-, 25-, 50-, 100-, and 500-year flood frequencies. Existing peak flood discharges based on existing land use and existing channel/bridge conditions are presented in Table IV -18. Future peak discharge information based on future land use and
IV-19
I
existing channel/bridge conditions are presented in Table IV-19.
2. Peak dischm:ges are based on an existing landuse watershed with existing channels and culverts.
I. Dischm:ges were
TABLEIV-19 FUTURE PEAK FLOOD DISCHARGES (d's)
Tributary P0-3
350
2. Peak discharges are based on future land use watershed with existing channels and culverts.
IV-20
500
3. Hydraulic Study Results
AvenueF
I 0"' Street
Tributary P0-3 is approximately 0.3 miles in stream length through the City of Corsicana study area. The entire length of stream through the study area consists of a natural earthen channel. The average channel slope through the study area is about 0.70%. The channel is well defined with depths ranging from about 3 feet to 10 feet.
The Tributary P0-3 future fully urbanized I 00-year flood plain delineation prepared for this report includes approximately 2 acres of land within the Corsicana City limits. There are six known structures within this I 00-year flood plain delineation. None of which have estimated finish floors below the IOO-year flood plain.
There are 3 bridge/culverts along Tributary P0-3 within the City of Corsicana study limits. The computed future I 00-year flood will overtop the existing roadway at two of these three culvert locations. Pertinent data for each bridge can be found in Table IV -20. Graphical representation of these and other potential flooding areas along Tributary P0-3 are presented on the flood plain maps and flood profiles that supplement this report (see Appendix D). Channel velocities along Tributary P0-3 are generally non-erosive, less than 6.0 feet per second. Although erosion continues to occur along Tributary P0-3, there were no identified instances of high potential loss of private property or areas classified as severe erosion problems.
9+35 392.15
13+73 396.93
TABLEIV-20 BRIDGE DATA Tributary P0-3
397.15 396.65 400
399.93 400.11 280
397.88 1-60'' CMP
400.65 3-36" RCP
Burlington Northern RR
15+08 397.45 405.45 405.55 280 401.90 2-96" CMP
1 Approximate Elevations (NGVD). 2 I 00. Year Discharge based on future development with existing channels and bridges/culverts (Baseline Conditions).
I 00. Year flood elevation based on channels and culverts.
IV-21
4. Improvements
Halff Associates did not prepare hydraulic computer models of conceptual bridge and channel designs along Tributary P0-3 since there are no known structures with estimated finish floors below the 100-year flood plain delineation for the area studied.
E. TRIBUTARY P0-5
1. Description ofWatershed
The Tributary P0-5 (Post Oak 5) watershed lies in the northwest to north-central side of Corsicana. Tributary P0-5 flows southerly until it reaches its confluence with Post Oak Creek. The total drainage area of the Tributary P0-5 watershed is 0.51 square miles (328 acres).
The lower portion of the Tributary P0-5 watershed is predominantly single family residential while the upper watershed consists of predominantly residential and commercial development. The Tributary P0-5 watershed is approaching its maximum projected development stage in 2000. Existing land uses in the Tributary P0-5 watershed consist of approximately 50% residential; 45% business/commercial/industrial areas; and scattered parks, public/semi-public areas (i.e. schools, churches, etc.). The projected future development is similar to existing landuse conditions.
2. Hydrologic Study Results
Halff Associates prepared detailed HMS hydrologic computer models of the watershed to analyze existing land use and projected ultimate land use conditions. All hydrologic analyses were prepared with flood routing data based on existing channels and bridges. Peak flood discharges were calculated for the 5-, 10-, 25-, 50-, 100-, and 500-year flood frequencies. Existing peak flood discharges based on existing land use and existing channel/bridge conditions are presented in Table IV-21. Future peak discharge information based on future land use and existing channel\bridge conditions are presented in Table IV -22.
2. Peak discharges me based on future land use watershed with existing channels and culverts.
3. Hydraulic Study Results
Tributary P0-5 is approximately 0.7 miles in stream length from the confluence with Post Oak Creek to the study limits. The average channel slope of Tributary P0-5 is about 0.8%. The entire length of stream consists of a natural earthen channel with depths ranging from 3-feet to 14-feet. Residential development has occurred along the majority of the stream corridor.
The Tributary P0-5 future fully urbanized 1 00-year flood plain delineation prepared for this report includes approximately 24 acres of land within the Corsicana City limits. There are forty-three known structures within this 1 00-year flood plain delineation. Thirty-two of these structures have estimated finish floors below the 100-year flood plain as indicated in Table IV-23. The expected annual damage for these structures is $135,800. There are seven bridges/culverts along Tributary P0-5. The computed future 100-year flood will overtop the existing roadway at all of these culvert locations.
IV-23
Pertinent data for each road crossing can be found in Table IV-24. Graphical representation of these and other flood prone areas along Tributary P0-5 are presented on the flood plain maps and flood profiles that supplement this report (see Appendix D).
TABLEIV-23 BASELINE CONDITIONS SINGLE OCCURRENCE FLOOD LOSSES
Tributary P0-5
5-yr II II $171,000
10-yr 6 17 $345,000
25-yr 4 21 $481,000
50-yr 9 30 $785,000
100-yr 2 32 $831,000
500-yr 3 35 $957,000
TABLEIV-24 BRIDGE DATA Tributary P0-5
Royal Street 8+95 400.42 405.42 407.67 1250 410.17 2-60" RCP
Fish Tank Road 33+10 419.30 422.80 422.97 850 425.68 4-42" CMP
Forrest Lane 37+70 425.45 427.45 428.85 850 429.63
Approximate Elevations (NGVD). I 00-Year Discharge based on future development with existing channels and bridges/culverts (Baseline Conditions). I 00-Year flood elevation based on channels and culverts
IV-24
Existing channel velocities for Tributary P0-5 are generally non-erosive, less than 6 feet per second. Channel velocities greater than 8 feet per second were computed near the existing culvert crossing at Chicago Railroad (stream station 21 + 1 0). Three homes are close to the channel banks in generally non-erosive areas, however, proximity to the banks could warrant erosion protection.
4. Improvements
Halff Associates utilized the existing channel condition Tributary P0-5 hydraulic computer model to prepare conceptual bridge and channel designs for future roadway improvements and erosion protection. See Chapter V for guidance on erosion control. The folloWing is a brief description of the proposed conceptual improvements for Tributary P0-5:
• Three- 12'x6' concrete box culverts at Royal Lane. • Three- 9'x5' concrete box culverts at Northwood Boulevard. • Two - 1 O'x9' concrete box culverts at Chicago Rock Island Railroad (the
downstream effect of opening the railroad were not determined). • Two- 9'x6' concrete box culverts at Madison Drive. • 900 LF 10' bottom width 3:1 grass-lined channel from Madison Drive to
Fish Tank Road (stream stations 23+85 to 32+90). • Two- 1 O'x7' concrete box culverts at Dobbins Road. • Three- 9'x5' concrete box culverts at Fish Tank Road.
Estimated Probable Cost: Average Annual Cost:
· Estimated Annual Benefit: Benefit/Cost Ratio:
$1,250,200 $99,400 $134,800 1.4
The estimated probable cost of these proposed conceptual improvements is $1,250,200. The resulting improved flowlines and water surface elevations are displayed on the flood profiles that supplement this report (See Appendix D). HEC-RAS summary printouts for the proposed· recommendations may be found in Appendix E. The proposed improvements remove thirty-one (31) structures from the 100-year flood plain delineation as illustrated in Table IV-25. The proposed conceptual solutions reduce the expected annual damage by $134,800.
IV-25
TABLEIV-25 IMPROVED CONDITIONS SINGLE OCCURRENCE FLOOD LOSSES
Tributary P0-5
5-yr II 0 11 $0
1Q-yr 17 0 17 $0
25-yr 21 0 21 $0
5Q-yr 30 29 $500
10Q-yr 32 31 $12,.000
50Q-yr 35 3 32 $50,000
F. TRIBUTARY P0-6
1. Descri~tion of Watershed
The Tributary P0-6 (Post Oak 6) watershed lies in the northwest side of Corsicana Tributary P0-6 flows southerly until it reaches its confluence with Post Oak Creek. The total drainage area of the Tributary P0-6 watershed is 0.42 square miles (276 acres).
The northwestern portion of the Tributary P0-6 watershed is generally undeveloped at this time; however, the remainder of the watershed consists predominantly of single family residential units. Existing land uses in the Tributary P0-6 watershed consist of approximately 75% residential; 20% crops and pasture; 4% parks and open space; and scattered public/semi-public areas (i.e. schools, churches, etc.). Projected future development will consist of approximately 97% residentiallanduse; 2% parks and open space; and scattered public/semi-public areas.
2. Hydrologic Study Results
Halff Associates prepared detailed HMS hydrologic computer models of the watershed to analyze existing land use and projected ultimate land use conditions. All hydrologic analyses were prepared with flood routing data based on existing channels and bridges. Peak flood discharges were calculated for the 5-, I 0-, 25-, 50-, 100-, and 500-year flood frequencies. Existing peak flood discharges based on existing land use and existing channel/bridge conditions are presented in Table IV-26. Future peak discharge information based on future land use and existing
IV-26
I I I
were
channel\bridge conditions are presented in Table N-27.
2. Peak discharges are based on future land use watershed with existing cbamels and culverts.
3. Hydraulic Study Results
Tributary P0-6 is approximately 1.0 miles in stream length from the confluence with Post Oak Creek to the study limits. The average channel slope of Tributary P0-6 is about 0.9%. The entire length of stream consists of a natural earthen channel with depths ranging from 2-feet to 1 0-feet. Residential development has occurred along the majority of the stream corridor.
IV-27
The Tributary P0-6 future fully urbanized I 00-year flood plain delineation prepared for this report includes approximately 28 acres of land within the Corsicana City limits. There are thirty-one known structures within this 1 00-year flood plain delineation. Eighteen of these structures have estimated finish floors below the I 00-year flood plain as indicated in Table IV-28. The expected annual damage for these structures is $468,000
There are nine bridges/culverts along Tributary P0-6. The computed future I 00-year flood will overtop the existing roadway at all of these culvert locations. Pertinent data for each road crossing can be found in Table IV-29. Graphical representation of these and other flood prone areas along Tributary P0-6 are presented on the flood plain maps and flood profiles that supplement this report (see Appendix D). Existing channel velocities for Tributary P0-6 are generally nonerosive, less than 6 feet per second. Four homes are close to the channel banks in generally non-erosive areas, however, proximity to the banks could warrant erosion protection.
TABLEIV-28 BASELINE CONDITIONS SINGLE OCCURRENCE FLOOD LOSSES
Tributary P0-6
5-yr 16 16 $509,000
10-yr 0 16 $525,000
25-yr 0 16 $542,000
50-yr 17 $562,000
100-yr I 18 $581,000
500-yr 5 23 $671,000
IV-28
----~~--------- --~~~~~~~~-
Mimosa Drive 10+65 408.65
Northwood Blvd 14+75 411.90
ChicagoRR 16+80 414.10
Fish Tank Road 22+75 420.53
Edgewood Stn:et 24+50 424.62
McKinney Street 27+55 427.11
Louis Street 31+55 429.26
Lakewood Avenue 34+75 43121
FM3383 50+25 444.0
Approximate Elevations (NGVD).
TABLEIV-29 BRIDGE DATA Tributary P0-6
413.65 415.83
416.90 419.73
424.10 432.73
424.53 425.65
427.62 429.63
430.11 431.88
432.26 434.03
43421 43629
448.0 448.5
800 416.96 2-60" RCP
800 420.84 1-60" RCP
690 423.91 1-120" CMP
690 426.97 2-48" RCP
690 431.55 3-36" RCP
690 433.21 3-36" CMP
360 434.83 3-36" CMP
360 436.89 2-36" CMP
360 448.86 l-4'x4' CBC
2 100-Year Discharge based on future development with existing channels and bridges/culverts (Baseline Conditions). 100-Year flood elevation based on clmmels and culverts.
IV-29
I I
4. Improvements
Halff Associates utilized the existing channel condition Tributary P0-6 hydraulic computer model to prepare conceptual bridge and channel designs for future roadway improvements and erosion protection. See Chapter V for guidance on erosion control. The following is a brief description of the proposed conceptual improvements for Tributary P0-6:
• Four -10'x5' concrete box culverts at Fish Tank Road. • 1500 LF 20' bottom width 3:1 grass-lined channel from Fish Tank Road to
upstream of Lakewood Avenue (stream stations 22+94 to 38+00). • Four-IO'x5' concrete box culverts at Edgewood Street. • Purchase structure at Edgewood in order to construct above 1500 LF of
improvements. • Four-10'x4' concrete box culverts at McKinney Street. • Three- 8'x4' concrete box culverts at Louis Avenue. • Three- 8'x4' concrete box culverts at Lakewood A venue. • FM 3383 culverts require upgrade and channel or storm drain system to
alleviate flood damages to homes. Estimated Probable Cost: Average Annual Cost: Estimated Annual Benefit: Benefit/Cost Ratio:
$1,444,900 $114,800 $460,400 4.0
The estimated probable cost of these proposed conceptual improvements is $1,444,900. The resulting improved flowlines and water surface elevations are displayed on the flood profiles that supplement this report (See Appendix D). HEC-RAS summary printouts for the proposed recommendations may be found in Appendix E. The proposed improvements remove ten structures from the I 00-year flood plain delineation as illustrated in Table IV-30. The proposed conceptual solutions reduce the expected annual damage by $460,400.
IV-30
I I
TABLEIV-30 IMPROVED CONDITIONS SINGLE OCCURRENCE FLOOD LOSSES
Tributary P0-6
5-yr 16 15 $13,000
10-yr 16 15 $19,000
25-yr 16 15 $26,000
50-yr 17 2 15 $44,000
100-yr 18 8 10 $104,000
500-yr 23 8 15 $154,000
G. MESQUITE BRANCH
1. Description of Watershed
2.
Mesquite Branch originates southwest ofthe city limits of Corsicana. It then flows in a northeasterly direction through the southern portion of the City until it reaches its confluence with Post Oak Creek. The total drainage area of the Mesquite Branch watershed is 4.73 square miles (3026 acres).
The Mesquite Branch watershed is generally undeveloped at this time. Existing land uses in the Mesquite Branch watershed consist of approximately 55% crops and pasture; 30% business/commercial/industrial areas; 8% residential; 2% parks and open space; and scattered public/semi-public areas (i.e. schools, churches, etc.). Projected future development will consist of approximately 45% residential; 45% business/commercial/industrial areas; 5% parks and open space; and scattered public/semi-public areas (i.e. schools, churches, etc.).
Hydrologic Study Results
Halff Associates prepared detailed HMS hydrologic computer models of the watershed to analyze existing land use and projected ultimate land use conditions. All hydrologic analyses were prepared with flood routing data based on existing channels and bridges. Peak flood discharges were calculated for the 5-, I 0-, 25-, 50-, 100-, and 500-year flood frequencies. Existing peak flood discharges based on
IV-31
existing land use and existing channel/bridge conditions are presented in Table IV-31. Future peak discharge information based on future land use and existing channel\bridge conditions are presented in Table IV-32.
were nearest 2. Peak discharges are based on future land use watershed with existing channels and culverts.
3. Hydraulic Study Results
Mesquite Branch is approximately 4.1 miles in stream length from the confluence with Post Oak Creek to the study limits. The average channel slope of Mesquite Branch is about 0.2%. The entire length of stream consists of a natural earthen channel with depths ranging from 4-feet to 14-feet.
The Mesquite Branch future fully urbanized 1 00-year flood plain delineation prepared for this report includes approximately 287 acres of land within the Corsicana City limits. There are eight structures within this 1 00-year flood plain delineation. Three of these structures have estimated finish floors below the 1 00-year flood plain as indicated in Table IV-33. The expected annual damage for these structures is $28,000.
There are nine bridges/culverts along Mesquite Branch. The computed future 100-year flood will overtop the existing roadway at six of these nine culvert locations. Pertinent data for each road crossing can be found in Table IV-34. Graphical representation of these and other flood prone areas along Mesquite Branch are presented on the flood plain maps and flood profiles that supplement this report (see Appendix D).
IV-33
Existing channel velocities for Mesquite Branch are generally non- erosive, less than 6 feet per second. Channel velocities greater than 8 feet per second were computed at bridge crossings at Chicago and Rock Island Railroad (stream stations 152+33 to 153+97). Although erosion continues to occur along Mesquite Branch, there were no identified instances of high potential loss of private property or areas classified as severe erosion problems.
TABLEIV-33 BASELINE CONDITIONS SINGLE OCCURRENCE FLOOD LOSSES
Mesquite Branch
5-yr 3 3 $44,000
J()..yr 0 3 $52,000
25-yr 0 3 $60,000
50-yr 0 3 $64,000
100-yr 0 3 $68,000
500-yr 2 5 $79,000
IV-34
Powell Pike 45+15 358.7
StLouis& 45+95 361 Southwestern RR
SEOOIORoad 84+10 368.1
lli-45 North Bound 103+65 370.1 Frontage Road
lli-45 South Bound 104+35 381.24 Frontage Road
Chicago Rock 153+90 386.1 IslandRR
Hwy287 157+80 386.1
Hwy 75/Business 45 163+65 388.7
Southern Pacific RR 217+05 402.77
FM709 217+95 403
Approximate Elevations (NGVD).
TABLEIV-34 BRIDGE DATA Mesquite Branch
367.64 369.64
372.34 375.35
373.1 374.63
381.24 387.24
381.24 387.24
397.5 400
394.1 396.8
394.7 395.8
416.02 419.02
411 412.18
6200 371.83 Steel Bridge
6200 375.88 WoodBridge with 6 Piers
7250 378.48 6-9'x5'CBC
7250 382.22 Concrete Bridge with I Pier
7250 382.53 Concrete Bridge with I Pier
4700 396.14 WoodBridge with 5 Piers
5150 399.06 4-8'x8'CBC
5150 399.39 7-{;'x6' CBC
4500 415.43 WoodBridge with 5 Piers
4500 416.62 2-8'x8' CBC
2 I 00-Year Discharge based on future development with existing channels and bridges/culverts (Baseline Conditions). 3
4.
I 00-Year flood elevation based on channels and culverts.
Im~rovements
Halff Associates did not prepare hydraulic computer models of conceptual bridge and channel designs along Mesquite Branch because it is neither practical nor cost effective for the City to implement a major construction alternative at this time considering there are only three structures with estimated finish floors below the I 00-year flood plain. However, non-structural measures such as construction regulation and purchasing structures should be considered.
IV-35
H. TOWN BRANCH
1. Description of Watershed
The Town Branch watershed lies in the south-central quadrant of the City of Corsicana. Town Branch easterly until it reaches its confluence with Mesquite Branch. The total drainage area of the Town Branch watershed is 1.36 square miles (870 acres).
The Town Branch watershed is approaching its maximum projected development stage in 2000. Existing land uses in the Town Branch watershed consist of approximately 70% residential; 20% business/commerciaVindustrial areas; 5% parks and open space; and scattered public/semi-public areas (i.e. schools, churches, etc.). The projected future development is similar to existing landuse conditions.
2. Hydrologic Study Results
Halff Associates prepared detailed HMS hydrologic computer models of the watershed to analyze existing land use and projected ultimate land use conditions. All hydrologic analyses were prepared with flood routing data based on existing channels and bridges. Peak flood discharges were calculated for the 5-, 10-, 25-, 50-, 100-, and 500-year flood frequencies. Existing peak flood discharges based on existing land use and existing channel/bridge conditions are presented in Table IV-35. Future peak discharge information based on future land use and existing channel\bridge conditions are presented in Table IV -36.
I. Discharges were to the nearest 2. Peak discharges are based on futore land use watershed with existilg channels and culverts.
3. Hydraulic Study Results
Town Branch is approximately 2.4 miles in stream length from the confluence with Mesquite Branch to the study limits. The average channel slope of Town Branch is about 0.5%. The stream consists of natural earthen channel for approximately 9200 linear feet from downstream to W. Jh Avenue. Upstream of W. Th Avenue, the stream consists of approximately 200 linear feet of 1 0 foot bottom width concrete pilot channel with grass-lined slopes. The stream then transitions back to natural earthen channel for approximately 700 linear feet toW. 6th Avenue. Upstream of W. 6th Avenue, the stream consists of 200 linear feet of a 5 foot bottom width concrete channel. The stream then transitions to natural earthen channel for the remaining length of stream. The stream has depths ranging from 3-feet to 11-feet.
The Town Branch future fully urbanized 1 00-year flood plain delineation prepared for this report includes approximately 120 acres of land within the Corsicana City limits. There are one hundred and forty known structures within this 1 00-year flood plain delineation. Seventy-five of these structures have estimated finish floors below the 100-year flood plain as indicated in Table IV-37. The expected annual damage for these structures is $194,500.
There are twenty-three bridges/culverts along Town Branch. The computed future 100-year flood will overtop the existing roadway at twenty of these twenty-three culvert locations. Pertinent data for each road crossing can be found in Table IV-38. Graphical representation of these and other flood prone areas along Town Branch
are presented on the flood plain maps and flood profiles that supplement this report
IV-37
I I
(see Appendix D). Existing channel velocities are generally non-erosive, less than 6.0 feet per second. Channel velocities greater than 8 feet per second were computed at several bridge/culvert crossings. Six homes are close to the channel banks in generally non-erosive areas, however, proximity to the banks could warrant erosion protection.
TABLEIV-37 BASELINE CONDITIONS SINGLE OCCURRENC FLOOD LOSSES
Town Branch
5-yr 24 24 $2!1,000
10-yr 10 34 $354,000
25-yr 11 45 $679,000
50-yr 14 59 $1,032,000
100-yr 16 75 $1,290,000
500-yr 31 106 $2,066,000
IV-38
S. 5"' Street 20+75 388.21387.1
Chicago Rock Island RR 26+50 389.5
S. 7"' Street 31+10 39!.38
9" Street/Brewer 38+15 394.25
S. Beaton Street 45+20 394.5
II"' Street/Main 49+04 3972
S. 12"' Street 53+02 398.5
Old City Iron Works #I 54+60 399
Old City Iron Works #2 58+52 401.02
Southern Pacific RR 59+77 402
S. 15"' Street 65+42 404.5
W.l3"' 71+75 406.4
W. II" Avenue 77+62 410.47
W.10"'Avenue 82+57 411.3
W. 9" Avenue 86+02 413.69
StLouisRR 89+52 415.52
W. 7"'Avenue 93+42 418.57
W. 6"' Avenue 104+05 427.19
Just Upstream of W. 6"' Avenue 105+83 427.3
Collins Avenue 113+20 433.1
Just Upstream of Collins at Old 23" 114+62 433.53 Street
23Y, Street 117+55 437.76
24" Street 121+90 441.95
I Approximate Elevations (NGVD).
TABLEIV-38 BRIDGE DATA
Town Branch
392.21392.1 392.32
399.5 406.22
398.48 400.15
40125 401.7
401.5 401.51
403.7 404
404.5 405.65
408 408.24
410.02 410.6
411.49 415.49
410.5 411.51
411.4 414.14
414.97 415.73
417.5 418.53
419.19 420.55
415.52 427.94
423.57 424.33
430.19 430
4313 432
437.1 437.58
437.53 437.58
440.76 441.15
444.95 44724
1840
1840
2110
2110
2110
2110
2110
2110
2110
2110
2110
1500
1500
1500
1500
1500
1500
860
860
770
770
770
770
394.47 2-48" RCP & 2-60" RCP
40227 2-120"CMP
402.38 2-IO'x7.1' CBC
402.66 2-84"RCP
403.68 3-84"RCP
405.71 2-78"CMP
409.03 2-72"CMP
409.76 I-108"CMP
412.60 1-8'x9' Ellipse Culvert
414.09
414.79 2-IO'x6' CBC
415.56 2-IO'x5' CBC
418.10 2-IO'x4.5' CBC
420.23 2-9'x6.2' Ellipse Culvert
42137 2-9'x5'CBC
428.62 3-6'x5'CBC
428.61 1-10.5'x5' CBC
433.67 I-IO'x5' & BOXDS &
433.93 I-48"CMP
439.41 1-IO'xJ' & 1-10'x5' CBC DS & l-13'x4' CBC US
439.58 2-48"RCP
442.92 2-36"RCP
447.90 I-5.5'x3 Ellipse Culvert
2 100. Year Discharge based on future development with existing channels and bridges/culverts (Baseline Conditions). 3 I 00. Year flood elevation based on channels and culverts.
IV-39
4. Improvements
Halff Associates utilized the existing channel condition Town Branch hydraulic computer model to prepare conceptual bridge and channel designs for future roadway improvements and erosion protection. See Chapter V for guidance on erosion control. The following is a brief description of the proposed conceptual improvements for Town Branch:
Reach I - Chicago & Rock Island Railroad to S. Beaton Street (stream stations 26+82 to 45+04)
• 1820 LF 40' bottom width 3:1 grass lined channel from Chicago & Rock Island Railroad to S. Beaton Street (stream stations 26+82 to 45+04).
• Four- 10' corrugated metal pipes at Chicago Rock Island Railroad (the downstream effects of opening railroad were not determined).
• Purchase 1 large and several small structures upstream S. "J'h Street in order to construct above 1820 LF of improvements.
• Four- 11 'x8' concrete box culverts at S. Jh Street. • Four- 11 'x7' concrete box culverts at S. 9th Street.
The estimated probable cost of these proposed conceptual improvements for Reach 1 is $1,415,200. Proposed improvements through Reach 1, from Chicago & Rock Island Railroad to S. Beaton Street, will remove eleven (11) structures from the 100-year flood plain delineation as shown in Table IV-39. Reach 1 proposed conceptual solution reduce the expected annual damages by about $46,100.
IV-40
' I I
TABLEIV-39 IMPROVED CONDITIONS SINGLE OCCURRENC FLOOD LOSSES
REACH 1 (CIDCAGO & ROCK ISLAND RAILROAD TO S. BEATON STREET)
Town Branch
5-yr 24 20 4 $150,000
10-yr 34 27 7 $274,000
25-yr 45 36 9 $560,000
50-yr 59 49 10 $858,000
100-yr 75 64 11 $1,055,000
500-yr 106 84 22 $1,454,000
Reach 2- S. J2fh Street to S. 1 (ifh Street (stream stations 54+40 to 71+98) • 1760 LF 40' bottom width 3:1 grass lined channel from just upstream ofS.
121h Street to S. 161h Street (stream stations 54+40 to 71 +98). • Five -12'x7' concrete box culverts at S. 151h Street. • Purchase 3 structures by S. 151h Street in order to construct above 1760 LF of
improvements. • Four-10'x5' concrete box culverts at S. 161h Street.
The estimated probable cost of these proposed conceptual improvements for Reach 2 is $1,213,700. Twenty (20) structures are removed from the 100-year flood plain delineates as indicated in Table IV -40 by the proposed improvements through Reach 2, from S. 121h Street to S. 1~ Street. The Reach-2 proposed conceptual solutions reduce the expected annual damage by $36,300.
IV-41
TABLEIV-40 IMPROVED CONDITIONS SINGLE OCCURRENC FLOOD LOSSES
REACH 2 (S. 12m STREET TO S. 16m STREET) Town Branch
5-yr 24 15 9 $163,000
10-yr 34 23 11 $294,000
25-yr 45 29 16 $594,000
50-yr 59 40 19 $924,000
100-yr 75 55 20 $1,163,000
500-yr 106 73 33 $1,886,000
Reach 3- S. 1(ifh Street toW. ?fh Avenue (stream stations 71+98 to 91+85) • 1990 LF 20' bottom width 3:1 grass lined channel from S. 16th Street toW.
7th Avenue (stream stations 71+98 to 91+85). • Five- 11 'x5' concrete box culverts at W. lllh Avenue. • Four- 12'x7' concrete box culverts at W. 101h Avenue. • Four-10'x6' concrete box culverts at W. 9th Avenue. • Four- 10'x6' concrete box culverts at St Louis & Southwestern Railroad
(the downstream effects of opening railroad were not determined). • Four-10'x6' concrete box culverts at W. ~Avenue. • Purchase 3 structures betweerJ S. 1 ~ Street and W. 11th A venue in order to
construct above 1990 LF of improvements. • Purchase structure on top culvert at W. ~Avenue.
The estimated probable cost of these proposed conceptual improvements for Reach 3 is $2,139,000. The proposed improvements through Reach 3, from S. 1~ Street toW.~ Avenue, remove eighteen (18) structures form the 100-year flood plain delineation as illustrated in Table IV-41. The expected annual damages is reduced by $35,300.
IV-42
TABLEIV-41 IMPROVED CONDmONS SINGLE OCCURRENC FLOOD LOSSES
REACH 3 (S. 16TH STREET TOW. 7TH A VENUE) Town Branch
5-yr 24 24 0 $220,000
10-yr 34 30 4 $292,000
25-yr 45 38 7 $401,000
50-yr 59 47 12 $525,000
100-yr 75 57 18 $683,000
500-yr 106 86 20 $1,348,000
Reach 4 - Upstream of W (ilh Avenue to end of Study Limits (stream stations 1 06+00 to 128+07)
• Three -10'x4' concrete box culverts at W. 6th Avenue. • 550 LF 10' bottom width 3:1 grass lined channel from upstream of W. ()'h
A venue to Collins A venue (stream stations 1 06+00 to 111 +50). • Three -12'x4' concrete box culverts at Collins Avenue. • 1335 LF 10' bottom width 3:1 grass lined channel from Collins Avenue to
end of study limits (stream stations 114+ 72 to 128+07). • Three- 8'x4' concrete box culverts at N. 23 Y2 Street. • Three- 7'x4' concrete box culverts at N. 24th Street. • Purchase 1 structure at :i4th Street in order to construct above 1335 LF of
The estimated probable cost of these proposed conceptual improvements for Reach 4 is $1,774,200. Thirteen (13) structures are removed from the 100-year flood plain delineation by the proposed improvements through Reach 4, from upstream of W. 6th Avenue to the end of study limits, as shown in Table IV -42. Reach 4 proposed conceptual solutions reduce the expected annual damages by $26,600.
IV-43
TABLEIV-42 IMPROVED CONDITIONS SINGLE OCCURRENC FLOOD LOSSES
REACH 4 (UPSTREAM OF W. 6111 A VENUE TO END OF STUDY LIMITS) Town Branch
5-yr 24 17 7 $177,000
10-yr 34 26 8 $300,000
25-yr 45 37 8 $609,000
50-yr 59 49 10 $948,000
100-yr 75 62 13 $1,188,000
500-yr 106 94 12 $1,911,000
The total estimated probable cost of all (Reaches 1-4) proposed conceptual improvements for Town Branch is $6,542,100. The estimated annual cost for all (Reaches 1-4) improvements is $519,900. The resulting improved flowlines and water surface elevations are displayed on the flood profiles that supplement this report (See Appendix D). HEC-RAS summary printouts for the proposed recommendations may be found in Appendix E.
The aforementioned estimates for removal of structures were determined by each individual reach investigated independently. Therefore, overlap exists among the number of structures removed (i.e. the improvements from S. 12th Street to S. 16th Street improve conditions upstream and remove structures that are also removed by the improvements from S. 16th Street to W. Jlh Avenue). However, more structures are removed by the combined effect of implementing all improvements (Reaches 1-4). In this case, the sum of structures removed by the implementation of all improvements (Reaches 1-4) is greater than the sum ofthat of the individual improvements by reach. With all improvements (Reaches 1-4) in place, sixtythree structures are removed from the I 00-year flood plain delineation as illustrated in Table IV-43. When all improvements (Reaches 1-4) are implemented, their combined effect lowers the water surface elevation more than their individual effect. Therefore, with all improvements in place (Reaches 1-4), the reduction in expected annual damages is greater than the sum of that of the individual improvements by reach. With all improvements in place (Reaches 1-4 ), the proposed conceptual solutions reduce the expected annual damage by $147,300. The benefit to cost ration is 0.3.
IV-44
TABLEIV-43 IMPROVED CONDITIONS SINGLE OCCURRENC FLOOD LOSSES
ALL IMPROVEMENTS (REACHES 1-4) Town Branch
5-yr 24 4 20 $73,000
10-yr 34 4 30 $96,000
25-yr 45 5 40 $121,000
50-yr 59 9 50 $157,000
100-yr 75 12 63 $200,000
500-yr 106 22 84 $309,000
I. SUMMARY OF REPORT FINDINGS
Table IV-44 is a summary of conclusions defined by this study. Within the City of Corsicana project limits, approximately 955 acres of the Post Oak watershed is inundated by the future fully urbanized 100-year flood plain. An estimated 409 structures are within the future 100-year flood plain limits. And the future 100-year flood will overtop 19 of the existing 22 stream crossings within the study area. Table IV -45 is a summary of the expected annual damages for existing and improved conditions. A summary of benefit/cost ratios is illustrated in Table IV -46.
IV-45
TABLEIV-44 SUMMARY OF 100-YEAR FLOOD PLAIN ANALYSES
Post Oak Creek 5.4 450 154 10 ofl4 $8,683,700
South Folk Creek 1.4 44 27 6of6 $2,548,900
Tributary P0-3 03 2 6 2of3
Tributary P0-5 0.7 24 43 7of7 $1,250,200
Tributary P0-6 1.0 28 31 9of9 $1,444,900
Mesquite Branch 4.1 287 8 6of9
Town Branch 2.4 120 140 20of23 $6,542,100
TOTAL 15.3 955 409 60of71 $20,469,800
• IOO.Year Aood Plain detennined with existing channels and bridges/culverts and flood dicharges based on future
fully urbanized land use conditions and on existing channels/bridges.
I I
IV-46
TABLEIV-45 SUMMARY OF EXPECTED ANNUAL DAMAGES
Post Oak Creek- Reach I $74,400 $68,800 $5600
Post Oak Creek- Reach 2 $74,400 $60,400 $14,000
Post Oak Creek- Reach 3 $74,400 $71,200 $2,700
Post Oak Creek- Reach 4 $74,400 $36,000 $38,400
Post Oak Creek- $74,400 $13,000 $61,400 (Reaches 1-4)
South Fork TributaJ:y $104,900 $0 $104,900
Post Oak TributaJ:y- 3 $10
Post Oak TributaJ:y- 5 $135,800 $1,000 $134,800
Post Oak Tributary- 6 $468,000 $7,600 $460,400
Mesquite Branch $28,000
Town Branch-Reach I $194,500 $148,400 $46,100
Town Branch- Reach 2 $194,500 $158,200 36,300
Town Branch- Reach 3 $194,500 $159,200 $35,300
Town Branch-Reach 4 $194,500 $167,900 $26,600
Town Branch- $194,500 $47,200 $147,300 (Reaches 1-4)
IV-47
TABLEIV-46 SUMMARY OF CONCEPTUAL SOLUTIONS BENEFIT/COST RATIOS
Post Oak Creek- Reach I $3,592,400 $284,400 $5,600 0.02 (2 of78 struct)
Post Oak Creek- Reach 2 $3,417,300 $271,600 $14,000 0.05 (14 of78 sbuct)
Post Oak Creek- Reach 3 $756,200 $60,100 $2,700 0.05 (7 of78 struct)
Post Oak Creek- Reach 4 $980,800 $77,900 $38,400 0.5 (19 of78 sbuct)
Post Oak Creek- $8,683,700 $690,100 $61,800 0.09 (Reaches 1-4) (39 of74 struct)
South Fork Tributary $2,548,900 $202,600 $104,900 0.5 (16 of 16 sbuct)
Post Oak Tributary- 3
Post Oak Tributary- 5 $1,250,200 $99,400 $134,800 1.4 (31 of32 sbuct)
Post Oak Tributary- 6 $1,444,900 $114,800 $460,400 4.0 (10 of 18 struct)
Town Branch- Reach I $1,415,200 $112,500 $46,100 0.4 {II of75 struct)
(I! Capital Recovery Factor based on 7.75% and SO year. Cll Reduction of Average Annual Damages/ (Sbuctures removed from 100-year flood plain)
IV-48
V. RECOMMENDATIONS
A. INTRODUCTION
The recommended improvement plans that follow have been formulated and prioritized to reduce the potential flooding of buildings, bridges and culverts; minimize the impact on the natural flood plain environment; and provide practical and affordable solutions to render the most benefits for each tax-dollar expended.
B. RECOMMENDED IMPROVEMENTS
Halff Associates recommends the City investigate improvements described in Chapter IV for Post Oak Creek, Tributaries P0-3, Tributary P0-5, Tributary P0-6, Mesquite Branch and Town Branch. Halff Associates recommends the City implement the following improvements in the following order of priority:
• Structural improvements for Tributary P0-6 and Tributary P0-5 based on benefit/cost ratio as indicated on Table V -1.
• Structural improvements for South Fork Tributary including detention ponds. Although these improvements have a relatively low benefit to cost ratio as shown on Table V-1, the improvements remove 16 of 16 structures from the 100-year flood plain, and is, therefore, a feasible alternative.
• Structural improvements for Reach 4 of Post Oak Creek. These Reach 4 improvements benefit to cost ratio is relatively low as indicated in Table V-1, but the improvements remove 19 of 78 structures from the 1 00-year flood plain. The City could then consider purchasing the structures remaining in the 5-year to 100-year flood plain after the implementation of Reach 4 improvements as shown in Table V-2. Purchasing structures in the Post Oak Creek flood plain with no structural improvements should also be considered as shown on Table V -2.
• Structural improvements for R~aches 1 and 2 of Town Branch. These two reaches have relatively low benefit to cost ratios as shown on Table V-1, however, Reach 1 improvements remove 11 of75 structures and Reach 2 improvements remove 20 of 75 structures. The City could then consider purchasing the structures remaining in the 5-year to 1 00-year flood plain after the implementation of Reaches 1 and 2 improvements as shown in Table V-2. Purchasing structures in the Town Branch flood plain with no structural improvements should also be considered.
• Purchasing the three structures inundated by the 1 00-year storm for Mesquite Branch is also cost effective as indicated on Table V-2.
V-1
TABLEV-1 Summary of Conceptual Improvements
Structural Solutions
Post Oak Creek- Reach I $3,592,400 $284,400 $5,600 (2 of78 struct)
Post Oak Creek-Reach 2 $3,417,300 $271,600 $14,000 (14 of78 struct)
Post Oak Creek- Reach 3 $756,200 $60,100 $2,700 (7 of78 struct)
Post Oak Creek-Reach 4 $980,800 $77,900 $38,400 (19 of78 struct)
Post Oak Creek- $8,683,700 $690,100 $61,800 (Reaches 1-4) (39 of74 struct)
South Fork Tributary $2,548,900 $202,600 $104,900 (16 of!6 struct)
Post Oak Tributary- 3
Post Oak Tnbutary- 5 $1,250,200 $99,400 $134,800 (31 of32 struct)
Post Oak Tributary- 6 $1,444,900 $114,800 $460,400 (10 ofl8 struct)
Town Branch- Reach I $1,415,200 $112,500 $46,100 (II of75 struct)
Town Branch- Reach 2 $1,213,700 $96,500 $36,300 (20 of75 struct)
Town Branch-Reach 3 $2,139,000 $170,000 $35,300 (18 of75 struct)
Town Branch- Reach 4 $1,774,200 $141,000 $26,600 (13 of75 struct)
Town Branch- $6,542,000 $519,900 $147,300 (Reaches 1-4) (63 of75 struct)
Mesquite Branch
<•lCapital Recovery Factor based on 7.75% and 50 year. ro Reduction of Average Annual Damages I (Structures removed from I OO.year flood plain)
V-2
0.02
0.05
0.05
0.5
0.09
0.5
1.4
4.0
0.4
0.4
0.2
0.2
0.3
TABLEV-2 Summary of Conceptual Improvements
Non-Structural Solutions
Purchase Structures with FF below >year PO $246,970 $19,600 $27,000
Purchase S1ructures with FF below !().year PO $581,100 $46,200 $38,600
Purchase S1ructures with FF below >year PO $96,650 $7,900 $48,400 after Reach 4 improvements implemented
Purchase S1ructures with FF below !().year PO $230,500 $18,300 $53,300 after Reach 4 improvements implemented
Purchase S1ructures with FF below IOO.year PO $1,852,000 $147,200 $71,800 after Reach 4 improvements implemented
Purchase S1ructures with FF below IO.year P0-5 $1,552,000 $123,000 $123,000
Purchase S1ructures with FF below 5-year P0-6 $1,627,000 $129,000 $466,000
Purchase S1ructures with FF below SOO.year P0-6 $2,622,000 $208,000 $468,000
Purchase S1ructures with FF below 5-year Sfork $1,208,000 $96,000 $41,000
Purchase S1ructures with FF below SOQ.year Sfork $4,324,000 $344,000 $105,000
Purchase S1ructures with FF below >year TB $1,383,000 $110,000 $134,000
Purchase S1ructures with FF below !().year TB $2,274,000 $180,000 $166,000
Purchase S1ructures with FF below 5-year TB $678,600 $53,900 $148,000 after Reaches I & 2 improvements implemented
Purchase S1ructures with FF below !().year TB $1,030,900 $8!,900 $175,000 after Reaches I & 2 improvements implemented
Purchase S1ructures with FF below I OQ.year TB $2,594,740 $206,200 $180,600 after Reaches I & 2 improvements implemented
Purchase S1ructures with FF below IOO.year MB $199,000 $16,000 $28,000
It> capital Recovery Factor based on 7.75'%and 50 year. (2) Reduction of Average Annual Damages.
C. EROSION CONTROL RECOMMENDATIONS
1.4
0.8
6.1
2.9
0.5
1.0
3.6
23
0.4
0.3
12
0.9
2.7
2.1
0.9
1.8
A visual reconnaissance of Post Oak Creek, South Fork of Post Oak Creek, Tributaries P0-3, Tributary P0-5, Tributary P0-6, Mesquite Branch and Town Branch revealed some areas of channel erosion. Some erosion problems identified in the study area are described in Chapter IV. Estimated costs for erosion control measures can vary depending upon site-
V-3
specific conditions such as soil type, channel side slope, and the condition of existing structures.
Erosion is a natural on-going process. As urbanization occurs in the Post Oak watershed, storm water runoff characteristics will change and subsequent erosion potential will increase. Halff Associates recommends the city perform a detailed annual inspection of all structures that are being undermined by flood waters to verify their structural integrity. During this time the City should also identify erosion damaged channel banks and trees where appropriate erosion protection (i.e. rock riprap or gabions) could prevent future erosion problems. Trees with root systems that have been severely weakened by erosion and subsequent chance of survival is slight, need to be removed.
Table V-3 provides some general guidelines of required rock riprap and gabion thickness and estimated C<:!st per linear feet for a range of channel velocities. City staff could use this information to help plan and budget future erosion remediation measures on a case by case basis.
TABLE V-3 Estimates of Probable Costs of Construction for Rock Riprap and Gabions
Channel Lining for Erosion Control
Costs Per Linear Foot of Channel for Both Sides 2:1
Side Slopes for Channel Rock 5-ft and I ().ft Heights
Velocity Riprap Gab ion (Excavation and Fill Not Included)
(fj>s) Thickness Thickness
5'Ht IO'Ht 5'Ht IO'Ht
Rock Rock Gab ion Gab ion
8 12'' 9" 120 180 210 290
10 18" 12" 150 230 250 340
12 24" 12" 200 300 250 340
14 30" 18'' 310 375 330 420
16 30" 18" 310 375 330 420
Illustrations of typical sections for rock riprap and gabion erosion control measures are provided in Figures V-1 and V-2.
V-4
3'-0"
H
FILTER CLOTH
EXISTING
COMPACTED SELECT FILL
-----
!
I
2
FILTER
RIPRAP
PREFERRED SLOPE SLOPE MUST NOT BE STEEPER THEN 2:1
OPTIONAL TOE DETAIL
N. T.S.
30" RIPRAP AND THICKER REQUIRES LAYER OF BEDDING OVER FILTER CLOTH
CHANNEL INVERT
r0
(
CHANNEL INVERT
y;v-
lL9J CORSICANA
TYPICAL ROCK 1RIPRAP SECTION
FLOOD PROTECTION PLANNING STUDY
CONCEPTUAL EROSION CONTROL SOLUTIONS:
TYPICAL ROCK RIPRAP SECTION
N.ll.S. •o• • •• ALBERT H. HALFF ASSOCIATES. INC.
I •o• ENGINEERS • SCIENTISTS • SURVEYORS
NOTE: THE INFORMATION PRESENTED ON THIS TYPICAL SECTION CAN VARY DEPENDING UPON SITE CONDITIONS SUCH AS SOIL TYPE, CHANNEL VELOCITY, AND PROXIMITY AND CONDITION OF ADJACENT STRUCTURES.
FIGURE
CB INM,CADDI ;;;; I N. T.S. I I IIG3G I v -1 '
FILTER CLOTH
OPTIONAL TOE DETAIL
VARIES
,I
FILTER CLOTH_/ '
NOT STEEPER THEN 2:1
,--- GABION MATTRESS
TYPICAL GABION MATTRESS SECTION
N.T1
.S.
I I
NOTE: THE INFORMATION PRESENTED ON THIS TYPICAL SECTION CAN VARY DEPENDING UPON SITE CONDITIONS SUCH AS SOIL TYPE, CHANNEL VELOCITY, AND PROXIMITY AND CONDITION OF ADJACENT STRUCTURES.
N. T.S.
r CHANNEL INVERT
I ~~\Y//
CORSICANA FLOOD PROTECTION PLANNING STUDY
CONCEPTUAL EROSION CONTROL SOLUTIONS:
TYPICAL GABION SECTION •o• ••• ALBERT H. HALFF ASSOCIATES, INC. •o• ENGINEERS • SCIENTISTS • SURVEYORS
FIGURE
CB INM,CADDI ;:9~ I N. T.S. I I 11636 I v-2
D. GENERAL WATERSHED RECOMMENDATIONS
1. To minimize land erosion and the subsequent sediment loading and siltation in the streams, the City should consider requiring large construction projects to be phased to limit the land area that is bare at any one time. Vegetation should be left undisturbed wherever possible. Graded areas should be replanted as soon as possible, and mulches should be used during periods that are not suitable for replanting. Hay bales and/or silt fences should be properly located and included in general construction plans and specifications.
2. Halff Associates recommends that the City of Corsicana inspect all channels periodically to identify potential stream obstructions before they occur. Fallen trees or trees whose root systems have been weakened by erosion need to be identified and removed. Periodic inspections should identify City controlled floodway areas in which siltation has decreased the flood-carrying capacity of the stream and culverts. The City should also consider removing existing fences which impede channel flows.
3. Natural vegetation should be preserved, where possible, in the channel and 20-feet beyond the top of the banks.
4. City flood plain zoning maps should be revised to correspond to the revised 100-year flood delineation at the appropriate time.
5. Stream crossings that are hazardous during floods with a return period of 100 years or less, should be marked with an active or passive flood warning system. Passive warning systems are feasible on lightly traveled streets where motorists are familiar with the area and at crossings with minor flooding. Active flood warning systems are necessary on heavily traveled thoroughfares. Guardrails should be installed at hazardous crossings where a vehicle may be washed off the road surface. Guardrails are also useful in indicating the edge of the trafficable road surface to pedestrians and motorists, where floodwaters may mask the location of the road surface. Tables IV-7, IV-16,. IV-20, IV-24, IV-29, IV-34, and IV-38 provide pertinent information for each bridge/culvert in the Corsicana study area.
6. The City should continue with its present policy of monitoring new development and requiring developers to submit a detailed drainage study of existing (pre-development) and post-development conditions with corresponding hydrologic and/or hydraulic computer models. Halff Associates also recommends the City require an analysis for a full range of flood frequency events (minimum of 2-, 5-, 10-, 25-, 50-, and 100-year flood events), this is especially important in the development of an effective detention pond design.
V-5
E. BRIDGE AND CULVERT RATING PROGRAM
Halff Associates recommends that all bridges and culverts in the City of Corsicana be inspected and reviewed on a regular basis. The Texas Highway Department prioritizes bridge replacement based on a ranking number calculated for each crossing. The City of Corsicana should consider adopting a bridge and culvert rating program similar to the THD ranking system with consideration of flood safety criteria. Note, the costs for any increase in structure required to meet stricter requirements than that of TxDOT are expected to be borne by the entity requiring the stricter criteria Coordination with TxDOT is recommended in the early planning process.
The following criterion could be used in conjunction with the THD bridge rating system for a city-wide evaluation of bridges and culverts:
Criterion 1
Criterion 2
Criterion 3
Criterion 4
Criterion 5
Criterion 6
Criterion 7
If the bridge or culvert is not stmcturally safe, it should be replaced.
If a bridge is historically significant or aesthetically pleasing, it should be saved.
If a crossing is not adequate for the traffic that it must carry, it should be replaced.
If flood depths or water velocities over a roadway are dangerous, and a warning system is impractical, the structure should be replaced.
If a bridge or culvert constitutes an obstruction that causes upstream flooding, and if bridge replacement is less costly than right-of-way purchase of the flood-prone property, the structure should be replaced.
If a bridge need not be replaced on the basis of Criteria 1 through 5, and it met the design standards that were in force at the time of its construction, it should be retained.
If a culvert or bridge does not permit passage of the 100-year flood without overtopping, the City should consider replacing the structure.
F. CALffiRATION DATA FOR COMPUTER MODELS
In order to verify the hydrologic and hydraulic data generated by this report, Halff Associates recommends the City of Corsicana install staff gages at major flood prone bridges and install non-recording rain gauges in the watershed. These gages could be monitored by volunteers or city personnel during heavy rainfall and runoff periods. Installation of these gages will help establish long-term rainfall and runoff records for the City of Corsicana
If funding permits, Halff Associates recommends that the City of Corsicana and the U.S.G.S. expand their stream and rainfall gaging program in the Post Oak Creek Watershed. Installation of automated recorders could provide the City with an active warning system
for flood plain management. At the same time, the U.S.G.S. would be providing
V-6
hydrologists with the basic data they need to address the requirements for urban water quantity and quality problems.
G. UPDATING HYDROLOGIC AND HYDRAULIC COMPUTER MODELS
Included in this report are the computer data diskettes containing the hydrologic and hydraulic computer models used in the production of this report. These baseline models will enable the Corsicana City Engineering staff to predict effects of anticipated changes in land use and/or watershed characteristics upon flood levels using an IBM or compatible Personal Computer. Halff Associates recommends that the City of Corsicana require developers to provide updated "as-built" HEC-RAS hydraulic computer models as channel and/or flood plain conditions are modified. The HMS hydrologic computer model used in this report should be applicable for a fully developed watershed, provided development occurs as predicted by the future land use maps of the cities within the watershed.
H. FLOOD PLAIN MANAGEMENT POLICIES
Halff Associates recommends that the City of Corsicana consider adopting flood plain management policies similar to the North Central Texas Council of Governments Flood plain Management Policies described in Chapter III. This would allow the City the ability to regulate: allowable rises in water surface due to development; limitation of velocity increases for erosion control, and preservation of existing/natural flood plain land.
It is further recommended that the City of Corsicana formally adopt the flood levels shown in this report for its flood plain management program. The City has been provided with hydrologic and hydraulic computer models of the entire watershed.
V-7
APPENDIX A
References
APPENDIX A
REFERENCES
1. 1998-1999 Texas Almanac, The Dallas Morning News, Dallas, Texas.
2. Post Oak Creek, Corsican, Texas, Reconnaissance Report, U.S. Army Corps of Engineers, Fort Worth District, Fort Worth, Texas, October 1991.
3. HEC Hydrologic Modeling System (HMS) Version 2.0, U.S. Army Corps of Engineers, Hydrologic Engineering Center, Davis, California, March 1990.
4. Existing Land Use Map for City of Corsicana, Texas, Kindle Stone & Associates, Inc., Longview Texas, 1984.
5. Master Drainage Study, City ofUniversity Park, Prepared by Halff Associates, Inc., 1980.
6. Soil Survey of Navarro County, Texas, United State Department of Agriculture Soil Conservation Service, December 1974.
7. SCS National Engineering Handbook, Section 4, Hydrology, United States Department of Agriculture Soil Conservation Service, 1969.
8. NUDALLAS Documentation and Supporting Appendices, U.S. Army Corps of Engineers, Fort Worth, Texas, September 1986.
9. Hydrology and Hydraulic of Flood Plain Studies for the City of Dallas, prepared by Halff Associates, January 1976.
10. Technical Paper No. 40, Rainfall Frequency Atlas of the United States, National Weather Service, May 1961.
11. Technical Memorandum HYDR0-35, National Oceanic and Atmospheric Administration, June 1977.
12. HEC-RAS River Analysis System Version 2.2, U.S. Army Corps of Engineers, Hydrologic Engineering Center, Davis, California, September 1998.
13. Flood Insurance Study, Town of Corsicana, Texas, Navarro Counties, prepared for the Federal Emergency Management Agency by the U.S. Army Corps of Engineers, Fort Worth District, Fort Worth, Texas, August 17,1981.
14. Flood-Loss Prevention in Bachman Branch Basin, Dallas, Texas, Prepared by Halff Associates, Inc., June 15, 1969.
APPENDIX A (Continued)
REFERENCES
15. Physical and Economic Feasibility of Non-Structural Flood Plain Management Measures, U.S. Army Corps of Engineers, Hydrologic Engineering Center, March 1978.
16. Aquifer Recharge Utilizing Playa Lake Water and Filter Underdrains, Phase IV, Lloyd V. Urban, B.J. Claborn, RH. Ramsey, Texas Tech University, Water Resources Center, January 1988.
17. Design of Small Dams, United States Department of the Interior, Bureau of Reclamation, 1973.
18. Results of the Nationwide Urban Runoff Program, United States Environmental Protection Agency, Water Planning Division WH-554, December 1983.
19. Rowlett Creek Interjurisdictional Watershed Management Program, North Central Texas Council of Governments, Flood plain Management Policies for the Cities of Allen, Dallas, Garland, McKinney, Plano, and Richardson, Texas, January 1985.
20. Detailed Project Report for Flood Control, Post Oak Creek, Corsicana, Texas, U.S. Army Corps ofEngineers, Fort Worth District, Fort Worth, Texas, June 1978.
21. HEC Flood Damage Analysis with Risk (FDA) Version 1.2, U.S. Army Corps of Engineers, Hydrologic Engineering Center, Davis, California, March 2000.
I I j
APPENDIXB
Vertical Control Benchmarks
APPENDIXC
Preliminary Estimates of Probable Costs
Item No.
1 2 3 4 5 6 7 8 9 10 11 12
CITY OF CORSICANA FLOOD PROTECTION PLANNING STUDY
Proposed Channel Improvements for Post Oak Creek Reach 1 -Downstream of N. Burnert Street toW. 7th Street
(stream stations 249+40 to 295+53)
STATEMENT OF PROBABLE COST
Description Quantity Unit Price
Unclassified Channel Excavation (4575 LF) 86500 CY $15.00 Seed and Fertilize Earthen Channel 65000 SY $2.00 Five- 12'x7' CBCs at N. Bumert St. 225 CY $500.00 Remove & Dispose exist 5-84" at N. Bumert St. 1 LS $5,000.00 Sawcut for Removal of Asphalt or Concrete 200 LF $2.50 Remove & Dispose exist. Bridge at Chatfield 5000 SF $10.00 Bridge at Chatfield (250' span) 12500 SF $50.00 24" Rock RipRap Channel Transitions 745 CY $100.00 Asphalt Pavement Repair 550 SY $50.00 Clearing and Grubbing 1 LS $15,000.00 Mobilization 1 LS $20,000.00 Utility Adjustment LS $200,000.00 SUBTOTAL
20% Contingency SUBTOTAL (Construction)
15% Engineering, Surveying, & Construction Management TOTAL
This cost estimate does not include cost of right of way/easement aquisition
This statement was prepared utilizing standard cost estimate practices. It is understood and agreed that this is an estimate only, and the Engineer shall not be liable to owner or to a third party for any failure to accurately estimate the cost of the project, or any part therof.
Halff Associates, Inc., 4000 Fossil Creek Blvd., Fort Worth, Texas 76137
05/01
Amount
$1,297,500 $130,000 $112,500
$5,000 $500
$50,000 $625,000
$74,500 $27,500 $15,000 $20,000
$200,000 $2,557,500
$511,500 $3,069,000
$460,350 $3,529,400
CITY OF CORSICANA FLOOD PROTECTION PLANNING STUDY
Proposed Channel Improvements for Post Oak Creek Reach 2 - Downstream of N. Beaton Street to Upstream of N. 13th Street
(stream stations 314+92 to 334+24)
STATEMENT OF PROBABLE COST
Item No. Description Quantity Unit Price
1 Unclassified Channel Excavation (1930 LF) 66500 CY $15.00 2 Seed and Fertilize Earthen Channel 23050 SY $2.00 3 Sawcut for Removal of Asphalt or Concrete 300 LF $2.50 4 Remove & Dispose exist. Bridge at Main Street 7500 SF $10.00 5 Bridge at Main Street (250' span) 12500 SF $50.00 6 Purch 4 Structs bt Main & 13th 1 LS $260,000 7 Other costs associated with structure purchase LS $130,000 8 24" Rock RipRap Channel Transitions 1120 CY $100.00 9 Clearing and Grubbing 1 LS $5,000.00 10 Mobilization 1 LS $25,000.00 11 Utility Adjustment 1 LS $200,000
SUBTOTAL
20% Contingency SUBTOTAL (construction)
15% Engineering, Surveying, & Construction Management TOTAL
This cost estimate does not include cost of right of way/easement aqulsition
This statement was prepared utilizing standard cost estimate practices. It is understood and agreed that this is an estimate only, and the Engineer shall not be liable to owner or to a third party for any failure to accurately estimate the cost of the project, or any part therof.
Halff Associates, Inc., 4000 Fossil Creek Blvd., Fort Worth, Texas 76137
Amount
$997,500 $46,100
$750 $75,000
$625,000 $260,000 $130,000 $112,000
$5,000 $25,000
$200,000
$2,476,350
$495,270 $2,971,600
$445,740 $3,417,300
05/01
Item No.
1 2 3 4 5 6
CITY OF CORSICANA FLOOD PROTECTION PLANNING STUDY
Proposed Channel Improvements for Post Oak Creek Reach 3 - N. 13th Street to 1690' upstream of Oaklawn Drive
(stream stations 334+24 to 368+00)
STATEMENT OF PROBABLE COST
Description Quantity Unit Price
Unclassified Channel Excavation (3375 LF) 23000 CY $15.00 Seed and Fertilize Earthen Channel 43500 SY $2.00 24" Rock RipRap Channel Transitions 560 CY $100.00 Clearing and Grubbing 1 LS $5,000.00 Mobilization 1 LS $5,000.00 Utility Adjustment LS $50,000.00
SUBTOTAL
20% Contingency SUBTOTAL (construction)
15% Engineering, Surveying, & Construction Management TOTAL
This cost estimate does not include cost of right of way/easement aquisltion
This statement was prepared utilizing standard cost estimate practices. It is understood and agreed that this is an estimate only, and the Engineer shall not be liable to owner or to a third party for any failure to accurately estimate the cost of the project, or any part therof.
Halff Associates, Inc., 4000 Fossil Creek Blvd., Fort Worth, Texas 76137
05/01
Amount
$345,000 $87,000 $56,000
$5,000 $5,000
$50,000
$548,000
$109,600 $657,600
$98,640 $756,200
Item No.
1 2 3 4 5 6 7 8 9 10 11
CITY OF CORSICANA FLOOD PROTECTION PLANNING STUDY
Proposed Channel Improvements for Post Oak Creek Reach 4 -1690' Upstream Oaklawn Drive to Dobbins Road
(stream stations 368+00 to 392+85)
STATEMENT OF PROBABLE COST
Description ·auantity Unit Price
Unclassified Channel Excavation (2485 LF) 26100 CY $15.00 Seed and Fertilize Earthen Channel 32000 SY $2.00 Three- 12'x9' CBC's at Dobbins 180 CY $500.00 Remove & Dispose exist 12x9 CBC at Dobbins 1 LS $5,000.00 Sawcut for Removal of Asphalt or Concrete 100 LF $2.50 Asphalt Pavement Repair 550 SY $50.00 24" Rock RipRap Channel Transitions 375 CY $100.00 Clearing and Grubbing 1 LS $5,000.00 Mobilization 1 LS $10,000.00 Landscape Repair 1,500 LF $10.00 Utility Adjustment 1 LS $65,000
SUBTOTAL
20% Contingency SUBTOTAL (construction)
15% Engineering, Surveying, & Construction Management TOTAL
This cost estimate does not include cost of right of way/easement aquisition
This statement was prepared utilizing standard cost estimate practices. It is understood and agreed that this is an estimate only, and the Engineer shall not be liable to owner or to a third party for any failure to accurately estimate the cost of the project, or any part therof.
Halff Associates, Inc., 4000 FossU Creek Blvd., Fort Worth, Texas 76137
05/01
Amount
$391,500 $64,000 $90,000
$5,000 $250
$27,500 $37,500
$5,000 $10,000 $15,000 $65,000
$710,750
$142,150 $852,900
CITY OF CORSICANA FLOOD PROTECTION PLANNING STUDY
Proposed Channel Improvements for South Fork Tributary
STATEMENT OF PROBABLE COST
Item No. Description Quantity Unit Price
1 Unclassified Channel Excavation (2255 LF) 8500 CY $15.00 2 Seed and Fertilize Earthen Channel 22000 SY $2.00 3 Five - 1 O'x6' CBC's at Bowie 200 CY $500.00 4 Three - 1 O'x8' CBC's at Paloma 155 CY $500.00 5 Remove & Dispose exist. 20x4.5 at Bowie 1 LS $5,000.00 6 Remove & Dispose exist. 20x8 at Paloma 1 LS $5,000.00 7 Sawcut for Removal of Asphalt 200 LF $2.50 8 Asphalt Pavement Rapair 1,100 SY $50.00 9 Excavate Exist. Pond for Detention 25000 CY $10.00
10 Excavate Prop 80 ac-ft Dentention Pond 90000 CY $10.00 11 Proposed outlet structures for Det. Ponds 1 LS $60,000.00 12 Seeding for Proposed Detention Ponds 65000 SY $1.50 13 24 • Rock Rip Rap Channel Transitions 350 CY $100.00
14 Clearing and Grubbing LS $10,000.00 15 Mobilization 1 LS $25,000.00
15% Engineering, Surveying, & Construction Management TOTAL
This cost estimate does not include cost of right of way/easement acquisition
This statement was prepared utilizing standard cost estimate practices. It is understood and agreed that this is an estimate only, and the Engineer shall not be liable to owner or to a third party for any failure to accurately estimate the cost of the project, or any part therof.
Halff Associates, Inc., 4000 Fossil Creek Blvd., Fort Worth, Texas 76137
Unclassified Channel Excavation (900 LF) 2600 CY $15.00 2 Seed and Fertilize Earthen Channel 5700 SY $2.00 3 Three - 12'x6' CBC's at Royal Lane 160 CY $500.00 4 Three - 9'x5' CBC's at Northwood 140 CY $500.00 5 Two -10'x9' CBC's at RR 130 CY $500.00 6 Two - 9'x6' CBC's at Madison 120 CY $500.00 7 Two- 10'x7' CBC's at Dobbins 120 CY $500.00 8 Three- 9'x5' CBC's at Fish Tank 140 CY $500.00 9 Remove & Dispose exist. 2-60" at Royal LS $5,000.00 10 Remove & Dispose exist. 2-60" at Northwood LS $5,000.00 11 Remove & Dispose exist. 1-10' CMP at RR 1 LS $5,000.00 12 Remove & Dispose exist. 3-48" at Madison 1 LS $5,000.00 13 Remove & Dispose exist. 2-8x4 at Dobbins 1 LS $5,000.00 14 Remove & Dispose exist. 4-42" at Fish Tank 1 LS $5,000.00 15 Reconstruct Railroad 150 LF $200.00 16 Sawcut for Removal of Asphalt 600 LF $2.50 17 Asphalt Pavement Repair 3500 SY $50.00 18 24" Rock RipRap Channel Transitions 850 CY $100.00 19 Clearing and Grubbing 1 LS $1,000.00 20 Mobilization 1 LS $10,000.00 21 Landscape Repair 1,800 LF $10.00 22 Utility Adjustment 1 LS $100,000.00
SUBTOTAL
20% Contingency SUBTOTAL (construction)
15% Engineering, Surveying, & Construction Management TOTAL
This cost estimate does not include cost of right of way/easement acquisition
This statement was prepared utilizing standard cost estimate practices. It is understood and agreed that this is an estimate only, and the Engineer shall not be liable to owner or to a third party for any failure to accurately estimate the cost of the project, or any part therof.
Halff Associates, Inc., 4000 Fossil Creek Blvd., Fort Worth, Texas 76137
1 Unclassified Channel Excavation (1500 LF) 2900 CY $15.00 2 Seed and Fertilize Earthen Channel 11500 SY $2.00 3 Four-10'x5' CBC's at Fish Tank 150 CY $500.00 4 Four- 1 O'x5' CBC's at Edgewood 150 CY $500.00 5 Four- 1 O'x5' CBC's at McKinney 150 CY $500.00 6 Three- 8'x4' CBC's at Louis 140 CY $500.00 7 Three- 8'x4' CBC's at Lakewood 140 CY $500.00 8 Three- 8'x4' CBC's at FM 3383 140 CY $500.00 9 Remove & Dispose exist. 2-48" at Fish Tank 1 LS $5,000.00 10 Remove & Dispose exist. 3-36" at Edgewood LS $5,000.00 11 Remove & Dispose exist. 3-36" at McKinney 1 LS $5,000.00 12 Remove & Dispose exist. 3-36" at Louis 1 LS $5,000.00 13 Remove & Dispose exist. 2-36" at Lakewood LS $5,000.00 14 Remove & Dispose exist. 1-4x4 at FM 3383 1 LS $5,000.00 15 Sawcut for Removal of Asphalt 600 LF $2.50 16 Asphalt Pavement Repair 3500 SY $50.00 17 24" Rock RipRap Channel Transitions 800 CY $100.00 18 Clearing and Grubbing 1 LS $2,000.00 19 Mobilization 1 LS $10,000.00 20 Landscape Repair 3,000 LF $10.00 21 Purchase 620 Edgewood 1 LS $78,000.00 22 Other costs associated with structure purchase 1 LS $39,000.00 23 Utility Adjustment LS $100,000.00
SUBTOTAL
20% Contingency SUBTOTAL (construction)
15% Engineering, Surveying, & Construction Management TOTAL
This cost estimate does not include cost of right of way/easement acquisition
This statement was prepared utilizing standard cost estimate practices. It is understood and agreed that this is an estimate only, and the Engineer shall not be liable to owner or to a third party for any failure to accurately estimate the cost of the project, or any part therof.
Halff Associates, Inc., 4000 Fossil Creek Blvd., Fort Worth, Texas 76137
Proposed Channel Improvements for Town Branch Reach 1 - Chicago & Rock lslan Railroad to S. Beaton Street
(stream station 26+82 to 45+04)
STATEMENT OF PROBABLE COST
Description Quantity Unit Price
Unclassified Channel Excavation (1820 LF) 13000 CY $15.00 Seed and Fertilize Earthen Channel 19000 SY $2.00 Two -10' CMP at Chicago RR (salvage ex. 2) 130 LF $500.00 Four- 11'x8' CBC's at 7th 260 CY $500.00 Four- 11'x7' CBC's at 9th 250 CY $500.00 Remove & Dispose exist. 2-10x7's at 7th 1 LS $5,000.00 Remove & Dispose exist. 2-74" 'sat 9th 1 LS $5,000.00 Reconstruct Chicago RR 150 LF $200.00 Sawcut for Removal of Asphalt 200 LF $2.50 Asphalt Pavement Repair 1100 SY $50.00 24" Rock RipRap Channel Transitions 700 CY $100.00 Clearing and Grubbing 1 LS $2,000.00 Mobilization 1 LS $10,000.00 Purchase Structures US of 7th 1 LS $130,000.00 Other costs associated with structure purchase LS $65,000.00 Utility Adjustment 1 LS $100,000.00
SUBTOTAL
20% Contingency SUBTOTAL (Construction)
15% Engineering, Surveying, & Construction Management TOTAL
This cost estimate does not Include cost of right of way/easement acquisition
This statement was prepared utilizing standard cost estimate practices. It is understood and agreed that this is an estimate only, and the Engineer shall not be liable to owner or to a third party for any failure to accurately estimate the cost of the project, or any part therof.
RaitT Associates, Inc., 4000 Fossil Creek Blvd., Fort Worth, Texas 76137
05/01
Amount
$195,000 $38,000 $65,000
$130,000 $125,000
$5,000 $5,000
$30,000 $500
$55,000 $70,000
$2,000 $10,000
$130,000 $65,000
$100,000
$1,025,500
$205,100 $1,230,600
$184,590 $1,415,200
Item No.
1 2 3 4 5 6 7 8 9 10 11 12 13 14
CITY OF CORSICANA FLOOD PROTECTION PLANNING STUDY
Proposed Channel Improvements for Town Branch Reach 2 - S. 12th Street to S. 16th Street
(stream stations 54+40 to 71 +98)
STATEMENT OF PROBABLE COST
Description Quantity Unit Price
Unclassified Channel Excavation (1760 LF) 19500 CY $15.00 Seed and Fertilize Earthen Channel 20000 SY $2.00 Five- 12'x7' CBC's at 15th 225 CY $500.00 Two -10'x5' CBC's at 16th (Salvage exist. 2) 110 CY $500.00 Remove & Dispose exist. 2-10x6 at 15th LS $5,000.00 Sawcut for Removal of Asphalt 200 LF $2.50 Asphalt Pavement Repair 1100 SY $50.00 24" Rock RipRap Channel Transitions 550 CY $100.00 Clearing and Grubbing LS $2,000.00 Mobilization 1 LS $10,000.00 Landscape Repair 700 LF $10.00 Purchase 3 Structures by 15th 1 LS $97,000.00 Other costs associated with structure purchase 1 LS $48,000.00 Utility Adjustment 1 LS $100,000.00
SUBTOTAL
20% Contingency SUBTOTAL (Construction)
15% Engineering, Surveying, & Construction Management TOTAL
This cost estimate does not Include cost of right of way/easement acquisition
This statement was prepared utilizing standard cost estimate practices. It is understood and agreed that this is an estimate only, and the Engineer shall not be liable to owner or to a third party for any failure to accurately estimate the cost of the project, or any part therof.
Halff Associates, Inc., 4000 Fossil Creek Blvd., Fort Wortb, Texas 76137
05/01
Amount
$292,500 $40,000
$112,500 $55,000
$5,000 $500
$55,000 $55,000 $2,000
$10,000 $7,000
$97,000 $48,000
$100,000
$879,500
$175,900 $1,055,400
$158,310 $1,213,700
I I
CITY OF CORSICANA FLOOD PROTECTION PLANNING STUDY
Proposed Channel Improvements for Town Branch Reach 3- S. 16th Street toW. 7th Avenue
{stream stations 71+98 to 91 +85)
STATEMENT OF PROBABLE COST
Item No. Description Quantity Unit Price
1 Unclassified Channel Excavation (1990 LF) 10000 CY $15.00 2 Seed and Fertilize Earthen Channel 16500 SY $2.00 3 Five - 11'x5' CBC's at 11th 200 CY $500.00 4 Four-12'x7' CBC's at 10th 190 CY $500.00 5 Four -10'x6' CBC's at 9th 170 CY $500.00 6 Four- 10'x6' CBC's at St. Louis RR 170 CY $500.00 7 Four - 1 O'x6' CBC's at 7th 240 If 800 CY $500.00 8 Remove & Dispose exist. 2-1 Ox4.5 at 11th 1 LS $5,000.00 9 Remove & Dispose exist. 2-9x6 at 1Oth 1 LS $5,000.00 10 Remove & Dispose exist. 2-9x5.5 at 9th LS $5,000.00 11 Remove & Dispose exist. 3-6x5 at RR 1 LS $5,000.00 12 Remove & Dispose exist. 1-10.5x5 at 7th 1 LS $5,000.00 13 Reconstruct St. Louis RR 200 LF $200.00 14 Sawcut for Removal of Asphalt 400 LF $2.50 15 Asphalt Pavement Repair 2500 SY $50.00 16 24" Rock RipRap Channel Transitions 1100 CY $100.00 17 Clearing and Grubbing 1 LS $3,000.00 18 Mobilization LS $15,000.00 19 Landscape Repair 3,500 LF $10.00 20 Purchase 4 Structures between 16th & 11th 1 LS $35,000.00 21 Other costs associated with structure purchase 1 LS $18,000.00 22 Purchase Structure on culvert at 7th Avenue 1 LS $30,000.00 23 Other costs associated with structure purchase 1 LS $15,000.00 24 __ Utility Adjustment 1 LS $150,000.00
SUBTOTAL
20% Contingency SUBTOTAL (Construction)
15% Engineering, Surveying, & Construction Management TOTAL
This cost estimate does not include cost of right of way/easement acquisition
This statement was prepared utilizing standard cost estimate practices. It is understood and agreed that this is an estimate only, and the Engineer shall not be liable to owner or to a third party for any failure to accurately estimate the cost of the project, or any part therof.
• Halff Associates, Inc., 4000 Fossil Creek Blvd., Fort Worth, Texas 76137
Proposed Channel Improvements for Town Branch Reach 4 - W. 6th Avenue to Study Limits
{stream stations 106+00 to 128+07)
STATEMENT OF PROBABLE COST
Description Quantity Unit
Unclassified Channel Excavation (1335 LF) 7000 CY Seed and Fertilize Earthen Channel 8600 SY Three - 1 O'x4' CBC's at 6th 220 If 500 CY Three- 12'x4' CBC's at Collins 282 If 650 CY Three- 8'x4' CBC's at 23 1/2 St 140 CY Three- 7'x4' CBC's at 24th St 110 CY Remove & Dispose Ex 2-36",10x5arch, 2-48" @6th LS Remove & Dispose exist. 1-12x4 & 2-48" at Collins LS Remove & Dispose exist. 2-36" RCP's at 23 1/2 St 1 LS Remove & Dispose exist. 1-5.5x3 at 24th St. 1 LS Sawcut for Removal of Asphalt 600 LF Asphalt Pavement Repair 3500 SY 24" Rock RipRap Channel Transitions 900 CY Clearing and Grubbing 1 LS Mobil,ization 1 LS Landscape Repair 2,500 LF Purchase 1 Structures by 24th 1 LS Other costs associated with structure purchase 1 LS Utility Adjustment 1 LS
SUBTOTAL
20% Contingency SUBTOTAL (Construction)
15% Engineering, Surveying, & Construction Management TOTAL
Price
$15.00 $2.00
$500.00 $500.00 $500.00 $500.00
$10,000.00 $10,000.00 $5,000.00 $5,000.00
$2.50 $50.00
$100.00 $2,000.00
$15,000.00 $10.00
$10,000.00 $5,000.00
$110,000.00
This cost estimate does not include cost of right of way/easement acquisition
This statement was prepared utilizing standard cost estimate practices. It is understood and agreed that
this is an estimate only, and the Engineer shall not be liable to owner or to a third party for any failure to
accurately estimate the cost of the project, or any part therof.
Halff Associates, Inc., 4000 Fossil Creek Blvd., Fort Wortb, Texas 76137