209
COMPREHENSIVE ANNUAL FINANCIAL REPORT FISCAL YEAR ENDED SEPTEMBER 30, 2020 CITY OF DEL RIO, TEXAS

COMPREHENSIVE ANNUAL FINANCIAL REPORT
FISCAL YEAR ENDED SEPTEMBER 30, 2020
CITY OF DEL RIO, TEXAS


COMPREHENSIVE ANNUAL FINANCIAL REPORT
CITY OF DEL RIO Del Rio, Texas
Fiscal Year Ended September 30, 2020
Prepared by the Finance Department:
Alberta S. Barrett Finance Director
Patricia Molina Assistant Finance Director
Fernando Chapa Chief Accountant
Flavio Aguilar Assistant Chief Accountant
Roxy Soto Budget Analyst
Dora Garcia Accounts Receivable Clerk
Cecilia Zapata Accounts Payable Specialist
Maria D. Martinez Payroll Specialist
Sylvia Y. Garza Fixed Asset Clerk
Rose Roach Grants Coordinator
Lorinda Castillo Risk Manager Director
Tamara Cruz Collection Specialist


CITY OF DEL RIO, TEXAS
COMPREHENSIVE ANNUAL FINANCIAL REPORT
For the year ended September 30, 2020
TABLE OF CONTENTS
PAGE INTRODUCTORY SECTION
Principal Public Officials i Letter of Transmittal iii-vii Organizational Chart ix
FINANCIAL SECTION
Independent Auditors’ Report 1-3
Management’s Discussion and Analysis 5-5J
Basic Financial Statements:
Government-Wide Financial Statements:
Statement of Net Position 8-9
Statement of Activities 10-11
Fund Financial Statements: Balance Sheet – Governmental Funds 12
Reconciliation of Government Funds Balance Sheet to
Governmental Activities Statement of Net Position 13
Statement of Revenues, Expenditures and Changes in Fund Balances – Governmental Funds 14
Reconciliation of the Statement of Revenues, Expenditures and Changes in Fund Balances of Governmental Funds to the Statement of Activities 15
Statement of Fund Net Position – Proprietary Funds 16-19
Statement of Revenues, Expenses, and Changes in Fund Net Position - Proprietary Funds 20-21
Statement of Cash Flows – Proprietary Funds 22-25 Statement of Fiduciary Net Position – Fiduciary Funds 26
Notes to Financial Statements 29-73
CITY OF DEL RIO, TEXAS
COMPREHENSIVE ANNUAL FINANCIAL REPORT
For the year ended September 30, 2020
TABLE OF CONTENTS PAGE FINANCIAL SECTION (Continued)
Required Supplementary Information:
Schedule of Revenues, Expenditures and Changes in Fund Balance -
Budget and Actual – General Fund 77 Texas Municipal Retirement System (TMRS): Schedule of Changes in Net Pension Liability and Related Ratios 78 Schedule of Contributions – Pension 79 Schedule of Changes in Other Postemployment Benefit Liability (OPEB) and Related Ratios – Supplemental Death Benefit Fund 80 Schedule of Contributions – Supplementary Death Benefit Fund 81 Schedule of Changes in the OPEB Liability - Retiree Health Insurance 82
Other Supplementary Information: Combining and Individual Fund Statements and Schedules: Nonmajor Governmental Funds:
Combining Balance Sheet – Nonmajor Governmental Funds 84-87
Combining Statement of Revenues, Expenditures, and Changes in Fund Balances – Nonmajor Governmental Funds 88-91
Schedule of Revenues, Expenditures, and Changes in Fund Balance -
Budget to Actual – Debt Service Fund 94
Schedule of Revenues, Expenditures, and Changes in Fund Balance - Budget to Actual – Intermodal Transit 95
Schedule of Revenues, Expenditures, and Changes in Fund Balance - Budget to Actual – Women, Infants and Children 96
Schedule of Revenues, Expenditures, and Changes in Fund Balance - Budget to Actual – Nutrition and Social Services 97
Schedule of Revenues, Expenditures, and Changes in Fund Balance - Budget to Actual – Room Tax 98
Schedule of Revenues, Expenditures, and Changes in Fund Balance - Budget to Actual – PEG Channel 99
CITY OF DEL RIO, TEXAS
COMPREHENSIVE ANNUAL FINANCIAL REPORT
For the year ended September 30, 2020
TABLE OF CONTENTS PAGE FINANCIAL SECTION (Continued)
Other Supplementary Information (Continued):
Schedule of Revenues, Expenditures, and Changes in Fund Balance -
Budget to Actual – Property and Forfeiture 100
Schedule of Revenues, Expenditures, and Changes in Fund Balance - Budget to Actual – LEOSE Continuing Education 101
Schedule of Revenues, Expenditures, and Changes in Fund Balance - Budget to Actual – Economic Development 102
Combining Statement of Net Position 104-105
Combining Statement of Revenues, Expenses, and Changes in Fund Net Position 106
Combining Statement of Cash Flows – Nonmajor Enterprise Funds 107-108 Combining Statement of Net Position – Internal Service Funds 110
Combining Statement of Revenues, Expenses, and Changes
in Fund Net Position – Internal Service Funds 111
Combining Statement of Assets and Liabilities – Internal Service Funds 112 Combining Statement of Assets and Liabilities – Agency Funds 114
TABLE STATISTICAL SECTION (UNAUDITED) Net Position by Component 1 118-119 Changes in Net Position 2 120-123 Fund Balances - Governmental Funds 3 124-125 Changes in Fund Balances - Governmental Funds 4 126-127 Assessed Value and Estimated Actual Value of Taxable Property 5 128-129 Direct and Overlapping Property Tax Rates 6 130-131 Principal Property Taxpayers 7 132 Property Tax Levies and Collections 8 133

CITY OF DEL RIO, TEXAS
COMPREHENSIVE ANNUAL FINANCIAL REPORT
For the year ended September 30, 2020
TABLE OF CONTENTS
TABLE PAGE STATISTICAL SECTION (UNAUDITED) (Continued) Water Pumped and Water Billed 9 134 New Water and Sewer Connections 10 135 Number of Water and Sewer Connections 11 136 Water and Sewer Rates 12 138-139 Water Billed by User (Gallons) 13 140-141 Ratios of Net General Bonded Debt Outstanding 14 142 Direct and Overlapping Governmental Activities Debt 15 143 Debt Margin Information 16 144-145 Ratios of Outstanding Debt by Type 17 146-147 Pledged Revenue Coverage Wasterwater Fund Bonded Debt 18 148 Bond Coverage -Utility Commission / Water Fund Bonded Debt 19 149 Bond Coverage – International Bridge Fund Bonded Debt 20 150 Bond Coverage – Refuse Fund Bonded Debt 21 151 Bond Coverage – Gas Fund Bonded Debt 22 152 Demographic and Economic Statistics 23 153 Principal Employers 24 154 Schedule of International Bridge Fund Traffic and Revenue 25 156-157 Full-Time Equivalent City Government Employees by Function/Program 26 158 Operating Indicators by Function/Program 27 159 Capital Asset Statistics by Function/Program 28 160
CITY OF DEL RIO, TEXAS
COMPREHENSIVE ANNUAL FINANCIAL REPORT
For the year ended September 30, 2020
TABLE OF CONTENTS
PAGE COMPLIANCE SECTION Independent Auditors’ Report on Internal Control Over Financial Reporting and on Compliance and Other Matters Based on an Audit of Financial Statements Performed in Accordance with Government Auditing Standards 163-164 Independent Auditors’ Report on Compliance for Each Major Program and on Internal Control Over Compliance Required by the Uniform Guidance 165-166 Schedule of Findings and Questioned Costs 167-168 . Summary Schedule of Prior Audit Findings 169-172 Schedule of Expenditures of Federal Awards 173-174 Note to the Schedule of Expenditures of Federal Awards 175


INTRODUCTORY SECTION


CITY OF DEL RIO, TEXAS
COMPREHENSIVE ANNUAL FINANCIAL REPORT
For the year ended September 30, 2020
PRINCIPAL PUBLIC OFFICIALS
i
CITY COUNCIL
Bruno Lozano Mayor
Diana Salgado Councilwoman-At-Large
Place A
Rowland Garza Councilman-At-Large
Place B
Raul Ojeda Councilman-At-Large
Place C
Alfredo Carranza, Jr. Councilman
District I
James DeReus Councilman
District II
Elizabeth Elizalde-Calderon Councilwoman
District III
CITY STAFF
Matt Wojnowski
City Manager
Manuel Chavez
Assistant City Manager Raul Casso
City Attorney
Maria Acosta
City Secretary
Alberta Barrett
Finance Director
Fred Knoll
Police Chief
Joe Harrington
Fire Chief
Mario Garcia
Human Resources Director
Esmeralda Meza
Community Services Director
Oriana Fernandez
Economic Development Director
Matt Evans
Utilities Director


iii
April 30, 2021 Honorable Mayor and Council Members Citizens of the City of Del Rio, Texas The Comprehensive Annual Financial Report of the City of Del Rio for the fiscal year ended September 30, 2020 is hereby submitted. This report has been prepared pursuant to, and to demonstrate compliance with, Article II, Section 31, of the City Charter. Responsibility for both the accuracy of the data, and the completeness and fairness of the presentation, including all disclosures, rests with the City. To the best of our knowledge and belief, the enclosed data is accurate in all material respects and is reported in a manner designed to present fairly the financial position and results of operations. All disclosures necessary to enable the reader to gain an understanding of the City’s financial activities have been included. The City’s management has established and maintained an internal control structure to ensure that the assets of the City are protected from loss, theft or misuse and to compile sufficient reliable information for the preparation of financial statements in conformity with GAAP. Because the cost of internal controls should not outweigh their benefits, the City of Del Rio’s comprehensive framework of internal controls has been designed to provide reasonable rather than absolute assurance that the financial statements will be free from material misstatement. The City of Del Rio’s financial statements have been audited by ABIP, PC, a firm of licensed certified public accountants. The goal of the independent audit was to provide reasonable assurance that the financial statements of the City of Del Rio for the fiscal year ended September 30, 2020, are free of material misstatement. As management, we assert that, to the best of our knowledge and belief, this financial report is complete and reliable in all material respects. The independent audit involved examining, on a test basis, evidence supporting the amounts and disclosures in the financial statements; and evaluating the overall financial statement presentation. The independent auditor concluded, based upon the audit, that there was a reasonable basis for rendering an unqualified opinion that the City of Del Rio’s financial statements for the fiscal year ended September 30, 2020, are fairly presented in conformity with GAAP. The independent auditor’s report is presented as the first component of the financial section of this report. The City of Del Rio is also required to undergo a mandated “Single Audit” designed to meet the special needs of federal grantor agencies. The standards governing Single Audit engagements require the independent auditor to report not only on the fair presentation of the financial statements, but also on the audited government’s internal controls and legal requirements involving the administration of federal awards. These reports are included in this report.

iv
GAAP requires that management provide a narrative introduction, overview, and analysis to accompany the basic financial statements in the form of Management’s Discussion and Analysis (MD&A). This letter of transmittal is designed to complement the MD&A and should be read in conjunction with it. The City of Del Rio’s MD&A can be found immediately following the report of the independent auditors. Profile of the Government The City of Del Rio was originally incorporated as a municipality in 1905 but was reincorporated in 1911. The City of Del Rio is located on the Rio Grande Plains of Southwest Texas, 150 miles due west of San Antonio, Texas. The most southern perimeter borders the Rio Grande River, one of the natural boundaries separating the United States and Mexico. The City of Del Rio incorporated area encompasses 20.15 square miles of the Val Verde County’s 3,144.75 square miles of total area. The City of Del Rio serves a population of approximately 35,846 and is empowered to levy tax on both real and personal properties located within its boundaries. It is also empowered by state statute to extend its corporate limits by annexation, which occurs occasionally when deemed appropriate by the governing council. The City of Del Rio is a home-rule town with a “Council-Manager” form of government. The first version of its present charter was initially adopted in 1967, and was subsequently revised in 1981, 1998 and 2010. Policy-making and legislative authority are vested in its City Council consisting of the Mayor and six other members. The City Council is responsible, among other things, for passing ordinances, adopting the budget, appointing citizens to serve on advisory boards, and hiring the city manager, attorney, city secretary and municipal court judge. The city manager is responsible for carrying out the policies and ordinances of the city council, for overseeing the day-to-day operations of the city, and for appointing the heads of various departments subject to the approval of council. The council is elected on a non-partisan basis. The mayor’s term of office is for two years. The council members serve four years staggered terms, with three council members elected every two years. The mayor and three council members are elected at large. The other three council members are residents of and elected from one of the three numbered districts. The mayor can serve no more than four consecutive terms and the council members no more than two consecutive terms. The City of Del Rio provides a full range of services, including police and fire protection; the construction and maintenance of streets and other infrastructure; recreational activities and cultural events. The City of Del Rio provides water and natural gas through its water and gas systems. It also provides sanitation services through a sanitary sewer system. The City of Del Rio has its own landfill and provides for handling and disposition of garbage, trash and rubbish through a private contract and through its health department. These systems are included as an integral parts of the City of Del Rio’s financial statements. The annual budget serves as the foundation for the City of Del Rio’s financial planning and control. All departments of the City of Del Rio are required to submit requests for appropriations to the City Manager as specified on the budget process timeline. The City Manager uses the requests, historical data and trends information as a starting point for developing a proposed budget. The City Manager then presents this proposed budget to the council at least forty-five days prior to the beginning of each budget year. The City Council is required to hold a public hearing on the budget and to adopt a final budget no later than September 30, which is the close of the City of Del Rio’s fiscal year. The appropriated budget is prepared by fund, department/division and object class (e.g., personnel costs, supplies, contractual, capital outlay). The city manager may at any time transfer up to ten thousand dollars in budget allocations between one-line item and another among departments and divisions within the same fund. The authority may be delegated by the City Manager in the interest of efficiency. Budget-to-actual comparisons are provided in this report for each individual governmental fund for which an appropriated annual budget has been adopted. For non-major governmental funds with appropriated annual budgets, this comparison is presented in the non-major governmental fund subsection of this report. For proprietary funds with appropriated annual budgets, this comparison is presented in the proprietary funds subsection of this report.
v
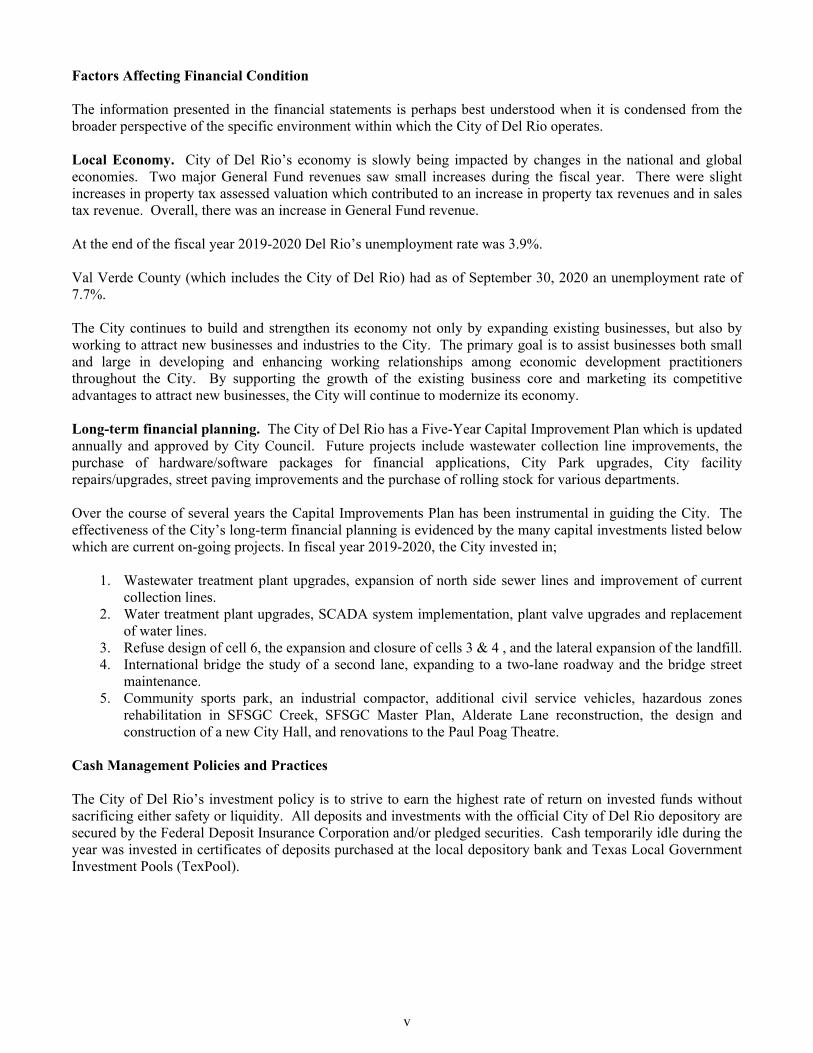
Factors Affecting Financial Condition The information presented in the financial statements is perhaps best understood when it is condensed from the broader perspective of the specific environment within which the City of Del Rio operates. Local Economy. City of Del Rio’s economy is slowly being impacted by changes in the national and global economies. Two major General Fund revenues saw small increases during the fiscal year. There were slight increases in property tax assessed valuation which contributed to an increase in property tax revenues and in sales tax revenue. Overall, there was an increase in General Fund revenue. At the end of the fiscal year 2019-2020 Del Rio’s unemployment rate was 3.9%. Val Verde County (which includes the City of Del Rio) had as of September 30, 2020 an unemployment rate of 7.7%. The City continues to build and strengthen its economy not only by expanding existing businesses, but also by working to attract new businesses and industries to the City. The primary goal is to assist businesses both small and large in developing and enhancing working relationships among economic development practitioners throughout the City. By supporting the growth of the existing business core and marketing its competitive advantages to attract new businesses, the City will continue to modernize its economy. Long-term financial planning. The City of Del Rio has a Five-Year Capital Improvement Plan which is updated annually and approved by City Council. Future projects include wastewater collection line improvements, the purchase of hardware/software packages for financial applications, City Park upgrades, City facility repairs/upgrades, street paving improvements and the purchase of rolling stock for various departments. Over the course of several years the Capital Improvements Plan has been instrumental in guiding the City. The effectiveness of the City’s long-term financial planning is evidenced by the many capital investments listed below which are current on-going projects. In fiscal year 2019-2020, the City invested in;
1. Wastewater treatment plant upgrades, expansion of north side sewer lines and improvement of current collection lines.
2. Water treatment plant upgrades, SCADA system implementation, plant valve upgrades and replacement of water lines.
3. Refuse design of cell 6, the expansion and closure of cells 3 & 4 , and the lateral expansion of the landfill. 4. International bridge the study of a second lane, expanding to a two-lane roadway and the bridge street
maintenance. 5. Community sports park, an industrial compactor, additional civil service vehicles, hazardous zones
rehabilitation in SFSGC Creek, SFSGC Master Plan, Alderate Lane reconstruction, the design and construction of a new City Hall, and renovations to the Paul Poag Theatre.
Cash Management Policies and Practices The City of Del Rio’s investment policy is to strive to earn the highest rate of return on invested funds without sacrificing either safety or liquidity. All deposits and investments with the official City of Del Rio depository are secured by the Federal Deposit Insurance Corporation and/or pledged securities. Cash temporarily idle during the year was invested in certificates of deposits purchased at the local depository bank and Texas Local Government Investment Pools (TexPool).
vi
Debt Management The primary goal of the City’s debt management practices is to access capital markets at the lowest possible cost (interest rate) without endangering its ability to finance essential services. The City’s conservative financial practices have earned its general obligation debt the ratings available from national bond rating services as follows:
Moody’s Investor Services – Aa3 Fitch Rating – AA Standard and Poors− AA-
Risk Management The City is exposed to various risks of loss related to torts; damage to, and destruction of assets; errors and omissions; injuries to employees; and natural disasters. The City of Del Rio has insurance coverage through the Texas Municipal League Intergovernmental Risk Pool for claims in excess of the deductible. Under this pool the City of Del Rio provides coverage for up to a maximum of $25,000 for each workers’ compensation claim, $1,000 for each general liability claim, $10,000 for each property damage claim, $2,500 for law enforcement liability, $2,500 for errors and omissions liability, $500 each vehicle and $10,000 for each occurrence for automobile physical damage, $1,000 for each automobile liability claim, $5,000 for public employee dishonesty loss, $500 for mobile equipment loss and $25,000 for cyber liability & data breach response. Costs related to workers’ compensation claims are accounted for in the fund under which the affected employee is classified. Other claims are accounted for in the fund related to the property or liability claim. The Health Claims Self-Insurance Fund (an Internal Service Fund) accounts for and finances its uninsured risk of loss from health and dental claims of eligible City of Del Rio employees, their spouses and dependents. Under this program, the Fund provides coverage for up to a maximum of $125,000 per claimant per year. The City of Del Rio purchased health stop loss insurance from a private carrier for claims in excess of coverage provided by the fund. The City covers one hundred percent of the employee’s health and dental insurance premium. All City of Del Rio employees participate in these programs and pay their share of insurance premiums for dependents. Pension and Other Postemployment Benefits The City of Del Rio entered into a defined contribution plan on August 1, 1970 with the ING Life Insurance and Annuity Company, the Plan Administrator (formally Aetna Life Insurance Annuity Company and the Participating Annuity Life Insurance Company), to provide pension benefits for all full-time employees with six months continuous service. The plan was restated effective October 1, 1989. The City Council on September 13, 2005 by Resolution No. R:2005-134 resolved that the City of Del Rio Employees Retirement Plan (as restated effective October 1, 1989) be frozen effective October 1, 2005 and that all Employer and Employee contributions to the Plan continue for compensation earned through September 30, 2005 and then cease, and that all Employer Contribution Accounts under the Plan held for participants (other than those whose last date of termination was more than five years prior to September 30, 2005) be fully vested as of that date. The City Council on August 23, 2005 passed an ordinance to participate in the Texas Municipal Retirement System and the supplemental death benefits fund by the City of Del Rio, Texas; and to make current service and prior service contributions to the City’s account in the Municipal Accumulation Fund of the Texas Municipal Retirement System at the Actuarially determined rate of total employee compensation; and allowing certain employees of the City, who performed or hereafter perform active service in the armed forces (or their reserves or auxiliaries) of the United States under honorable conditions, to apply and receive special credit with the Texas Municipal Retirement System for limited portions of such military service. Under the plan, all eligible employees are required to participate and contribute at the rate of five percent of the full earnings and the City of Del Rio is required to match participating employee current contributions and prior service contributions.

vii
Each employee of the City who is a member of the TMRS is eligible to retire and receive a service retirement annuity if the member has at least 20 years of credited service in the System performed for one or more municipalities that have adopted a like provision under Section 854.202(g) of the TMRS Act. The City of Del Rio elected to provide post-retirement group medical insurance coverage for eligible retirees. This coverage became available for individuals who retired on or after February 14, 2001. The City of Del Rio will be responsible for the entire cost of these post-retirement benefits. Expenditures for the post-retirement health care benefits are recognized as retirees incur claims through the City’s health insurance program. Relevant Financial Policies In fiscal year 2006-2007, the City, by resolution, adopted as its guideline in the preparation of the annual budget to schedule a balance of not less than 25% of the budgeted annual expenditures in order to maintain from fiscal year to fiscal year a surplus in the annual budget of at least 25% of the annual expenditures. This guideline is to be the goal of City staff in the preparation of the annual budget. Each fiscal year, staff uses this guideline when it prepares the annual budget. Major Initiatives
Stimulate creation and growth of locally owned businesses Expand street maintenance and sewer rehabilitation projects throughout the City Maintain a long-range Capital Improvement Plan Maintain multi-year equipment replacement program
Awards and Acknowledgements The City of Del Rio was awarded a Certificate of Achievement for Excellence in Financial Reporting during the fiscal years ending 2000 through 2013. For the fiscal years ending in 2014 through 2019, the City did not participate in this program. In order to be awarded a Certificate of Achievement, the City published an easily readable and efficiently organized Comprehensive Annual Financial Report. A certificate of Achievement is valid for a period of one year only. This report satisfies both generally accepted accounting principles and applicable legal requirements. We believe that the City of Del Rio’s September 30, 2020 Comprehensive Annual Financial Report meets the Certificate of Achievement program requirements. The preparation of the Comprehensive Annual Financial Report involves the entire staff. The discipline of the budget and other financial plans of the various funds involve management and the departmental supervisors. We are grateful for their participation in making this system work smoothly and efficiently. Without the interest and support of the members of the City Council in planning and conducting the affairs of the City of Del Rio in a responsible and progressive manner, preparation of this report would not have been possible. Respectfully submitted,
Matt Wojnowski Alberta S. Barrett City Manager Finance Director


CITY OF DEL RIO, TEXAS
ORGANIZATIONAL CHART 2019-2020
ix


FINANCIAL SECTION


1
INDEPENDENT AUDITORS’ REPORT
To Honorable Mayor and Members of the City Council City of Del Rio, Texas
Report on the Financial Statements
We have audited the accompanying financial statements of the governmental activities, the business-type activities, the discretely presented component unit, each major fund, the aggregate remaining fund information of the City of Del Rio, Texas (the “City”) as of and for the year ended September 30, 2020, and the related notes to the financial statements, which collectively comprise the City’s basic financial statements as listed in the table of contents.
Management’s Responsibility for the Financial Statements
Management is responsible for the preparation and fair presentation of these financial statements in accordance with accounting principles generally accepted in the United States of America; this includes the design, implementation, and maintenance of internal control relevant to the preparation and fair presentation of financial statements that are free from material misstatement, whether due to fraud or error.
Auditors’ Responsibility
Our responsibility is to express opinions on these financial statements based on our audit. We conducted our audit in accordance with auditing standards generally accepted in the United States of America and the standards applicable to financial audits contained in Government Auditing Standards, issued by the Comptroller General of the United States. Those standards require that we plan and perform the audit to obtain reasonable assurance about whether the financial statements are free from material misstatement.
An audit involves performing procedures to obtain audit evidence about the amounts and disclosures in the financial statements. The procedures selected depend on the auditor’s judgment, including the assessment of the risks of material misstatement of the financial statements, whether due to fraud or error. In making those risk assessments, the auditor considers internal control relevant to the entity’s preparation and fair presentation of the financial statements in order to design audit procedures that are appropriate in the circumstances, but not for the purpose of expressing an opinion on the effectiveness of the entity’s internal control. Accordingly, we express no such opinion. An audit also includes evaluating the appropriateness of accounting policies used and the reasonableness of significant accounting estimates made by management, as well as evaluating the overall presentation of the financial statements.
We believe that the audit evidence we have obtained is sufficient and appropriate to provide a basis for our audit opinions.
2
Opinions In our opinion, the financial statements referred to above present fairly, in all material respects, the respective financial position of the governmental activities, the business-type activities, the discretely presented component unit, each major fund, and the aggregate remaining fund information of the City of Del Rio, Texas as of September 30, 2020, and the respective changes in financial position, and where applicable, cash flows thereof for the year then ended in accordance with accounting principles generally accepted in the United States of America. Other Matters Required Supplementary Information Accounting principles generally accepted in the United States of America require that the management’s discussion and analysis on pages 5 – 5J, schedule of revenues, expenditures and changes in fund balance – budget and actual – general fund on page 77, schedule of changes in net pension liability and related ratios, schedules of contributions – net pension liability, schedule of changes in total other postemployment benefit liabilities (OPEB) and related ratios – supplemental death benefit fund and retiree health care plan, schedule of contributions – OPEB liabilities – supplemental death benefit fund and retiree health care plan on pages 78-82 be presented to supplement the financial statements. Such information, although not a part of the financial statements, is required by the Governmental Accounting Standards Board, who considers it to be an essential part of financial reporting for placing the financial statements in an appropriate operational, economic, or historical context. We have applied certain limited procedures to the required supplementary information in accordance with auditing standards generally accepted in the United States of America, which consisted of inquiries of management about the methods of preparing the information and comparing the information for consistency with management’s responses to our inquiries, the financial statements, and other knowledge we obtained during our audit of the financial statements. We do not express an opinion or provide any assurance on the information because the limited procedures do not provide us with sufficient evidence to express an opinion or provide any assurance. Other Information Our audit was conducted for the purpose of forming opinions on the financial statements referred to in the first paragraph. The introductory section, combining and individual nonmajor fund financial statements, other supplementary information, and statistical section are presented for purposes of additional analysis and are not a required part of the financial statements referred to om the first paragraph. The accompanying schedule of expenditures of federal and state awards is presented for purposes of additional analysis as required by Title 2 U.S. Code of Federal Regulations Part 200, Uniform Administrative Requirements, Cost Principles, and Audit Requirements for Federal Awards (Uniform Guidance), and is also not a required part of the financial statements referred to in the first paragraph. The combining and individual nonmajor fund financial statements, other supplementary information, and the schedule of expenditures of federal awards are the responsibility of management and were derived from and relate directly to the underlying accounting and other records used to prepare the financial statements referred to in the first paragraph. Such information has been subjected to the auditing procedures applied in the audit of the financial statements referred to in the first paragraph and certain additional procedures, including comparing and reconciling such information directly to the underlying accounting and other records used to prepare the financial statements referred to in the first paragraph or to the financial statements referred to in the first paragraph themselves, and other additional procedures in accordance with auditing statements generally accepted in the United States of America. In our opinion, the combining and individual nonmajor fund financial statements, other supplementary information, and the schedule of expenditures of federal awards are fairly stated, in all material respects, in relation to the financial statements, referred to in the first paragraph, as a whole. The introductory and statistical sections have not been subjected to the auditing procedures applied in the audit of the basic financial statements and, accordingly, we do not express an opinion or provide any assurance on them.
3
Other Reporting Required by Government Auditing Standards In accordance with Government Auditing Standards, we have also issued our report dated April 30, 2021, on our consideration of the City of Del Rio, Texas’ internal control over financial reporting and on our tests of its compliance with certain provisions of laws, regulations, contracts, and grant agreements and other matters. The purpose of that report is solely to describe the scope of our testing of internal control over financial reporting and compliance and the results of that testing, and not to provide an opinion on the effectiveness of the City’s internal control over financial reporting or on compliance. That report is an integral part of an audit performed in accordance with Government Auditing Standards in considering the City’s internal control over financial reporting and compliance. San Antonio, Texas April 30, 2021

CITY OF DEL RIO, TEXAS
MANAGEMENT’S DISCUSSION AND ANALYSIS (MD&A)
September 30, 2020
5
This section of the City of Del Rio’s annual financial report presents our discussion and analysis of the City’s financial performance during the fiscal year that ended on September 30, 2020.
FINANCIAL HIGHLIGHTS Government Wide The assets and deferred outflows of resources of the City of Del Rio exceeded its liabilities and deferred inflows
of resources by $117,304,959, a decrease of $43,343,441 in net position, after restatement. The main cause of the decrease was due to prior period adjustments related to the City’s capital assets.
The City’s governmental revenues exceeded it’s expenses by $5,939,567 (operations). This increase was primarily a result of increased ad valorem taxes on appraised values, sales taxes, and increased grant funding due to the pandemic.
The City’s business-type activities expenses exceeded its revenues by $2,941,518, before the restatement. This was due to the decrease in traffic on bridge and airport operations due to the pandemic as well as climate fluctuations that drive the consumption for the City’s utilities.
Fund Level The governmental funds report a combined fund balance of $33,836,591 of which $19,875,761 is unassigned,
$3,904,768 is restricted for the retirement of long-term debt, $9,032,385 is restricted for ongoing capital acquisitions and contractual obligations, and $828,804 is restricted for special purposes such as grants, special revenues, and donor restrictions. The remaining fund balance of $194,873 is classified as non-spendable as it will be expended in future periods..
The City’s governmental fund balances reported an increase of $4,348,055, after the restatement. Of this
amount, the general fund increased $1,704,147, an increase of $191,333 for the debt service fund, an increase of $1,667,856 for the capital improvement fund, and a increase in other nonmajor funds of $784,719.
The general fund reported a fund balance of $21,395,381, which represents a $1,704,147 increase from last
year. Of this amount, $21,229,822 is unassigned to be used for ongoing City business. This unassigned fund balance represents 11.5 months operating reserve of overall expenditures.
OVERVIEW OF THE FINANCIAL STATEMENTS
This annual report consists of four parts – management’s discussion and analysis (this section), the basic financial statements, required supplementary information, and an option section that presents combining statements for nonmajor enterprise funds and internal revenue funds. The basic financial statements include two kinds of statements that present different views of the City.
The first two statements are government-wide financial statements that provide both long-term and short-term information about the City’s overall financial status.
The remaining statements are fund financial statements that focus on individual parts of the City
government, reporting the City’s operations in more detail than the government-wide statements.
5A
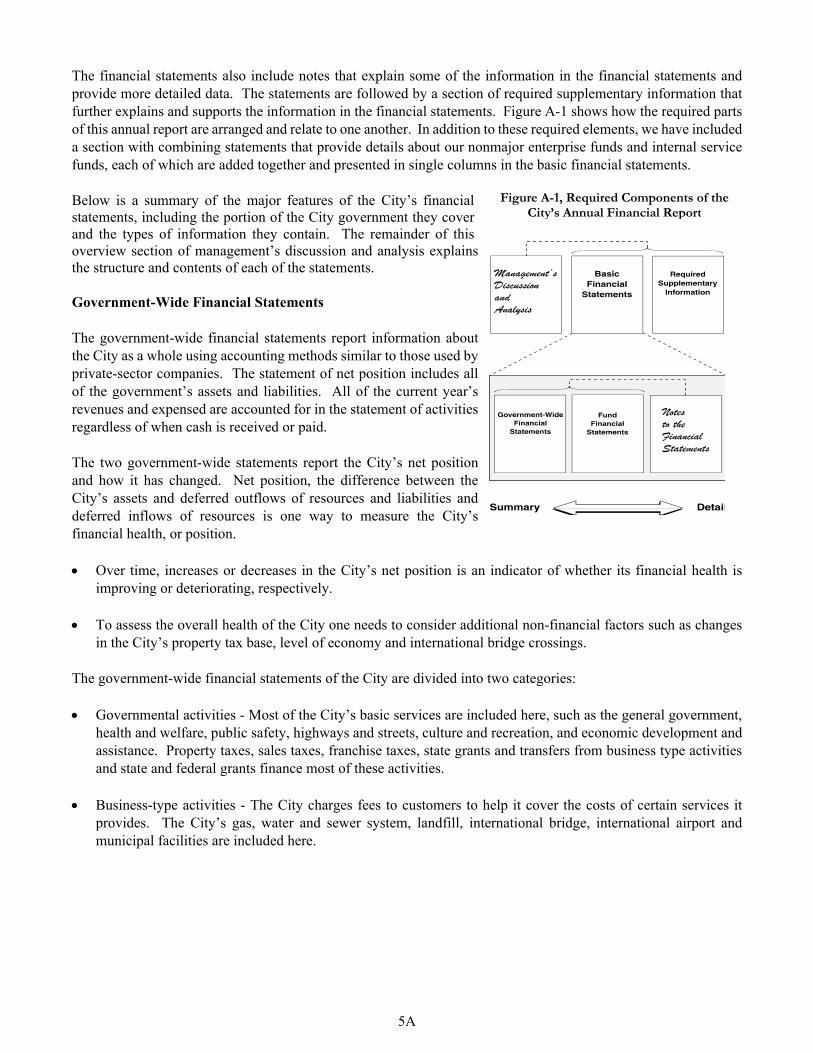
The financial statements also include notes that explain some of the information in the financial statements and provide more detailed data. The statements are followed by a section of required supplementary information that further explains and supports the information in the financial statements. Figure A-1 shows how the required parts of this annual report are arranged and relate to one another. In addition to these required elements, we have included a section with combining statements that provide details about our nonmajor enterprise funds and internal service funds, each of which are added together and presented in single columns in the basic financial statements.
Below is a summary of the major features of the City’s financial statements, including the portion of the City government they cover and the types of information they contain. The remainder of this overview section of management’s discussion and analysis explains the structure and contents of each of the statements.
Government-Wide Financial Statements The government-wide financial statements report information about the City as a whole using accounting methods similar to those used by private-sector companies. The statement of net position includes all of the government’s assets and liabilities. All of the current year’s revenues and expensed are accounted for in the statement of activities regardless of when cash is received or paid. The two government-wide statements report the City’s net position and how it has changed. Net position, the difference between the City’s assets and deferred outflows of resources and liabilities and deferred inflows of resources is one way to measure the City’s financial health, or position. Over time, increases or decreases in the City’s net position is an indicator of whether its financial health is
improving or deteriorating, respectively. To assess the overall health of the City one needs to consider additional non-financial factors such as changes
in the City’s property tax base, level of economy and international bridge crossings. The government-wide financial statements of the City are divided into two categories: Governmental activities - Most of the City’s basic services are included here, such as the general government,
health and welfare, public safety, highways and streets, culture and recreation, and economic development and assistance. Property taxes, sales taxes, franchise taxes, state grants and transfers from business type activities and state and federal grants finance most of these activities.
Business-type activities - The City charges fees to customers to help it cover the costs of certain services it
provides. The City’s gas, water and sewer system, landfill, international bridge, international airport and municipal facilities are included here.
Figure A-1, Required Components of the City’s Annual Financial Report
5B
Fund financial statements The fund financial statements provide more detailed information about the City’s most significant funds not the City as a whole. Funds are accounting devices that the City uses to keep track of specific sources of funding and spending or particular purposes. Some funds are required by City Charter, State law and by bond covenants. The City Council establishes other funds to control and manage money for particular purposes or show that it
is properly using certain taxes and grants (like aid from the Texas Department of Transportation). The City has three kinds of funds: Governmental funds - Most of the City’s basic services are included in governmental funds, which focus on (1) how cash and other financial assets that can readily be converted to cash flow in and out and (2) the balances left at year end that are available for spending. Consequently, the governmental funds statements provide a detailed short-term view that helps one determine whether there are more or fewer financial resources that can be spent in the near future to finance the City’s programs. Because this information does not encompass the additional long-term focus of the governmental funds statement, there is a reconciliation on the subsequent page that explains the relationship (or differences) between the governmental fund statements and the government-wide statements. Proprietary funds - Services for which the City charges customers a fee are generally reported in proprietary funds. Proprietary funds, like the government-wide statements, provide both long-term and short-term financial information.
In fact, the City’s enterprise funds (one type of proprietary fund) are the same as its business-type activities, but provide more detail and additional information, such as cash flows.
The City uses internal service funds (the other kind of proprietary fund) to report activities that provide
supplies and services for the City’s other programs and activities; such as the utility billing fund. Fiduciary funds – The City’s fiduciary funds consist of various agency funds. The City is responsible for ensuring that the assets reported in these funds are used for their intended purposes. All of the City’s fiduciary activities are reported in a separate statement of fiduciary net assets. We exclude these activities from the City’s government-wide financial statements because the City cannot use these assets to finance its operations.

5C
FINANCIAL ANALYSIS OF THE CITY AS A WHOLE
Net position The City’s combined net position was $111,746,250 as of September 30, 2020.
TABLE 1
CITY OF DEL RIO’S NET POSITION
2020 2019 2020 2019 2020 2019
AssetsCurrent and other assets $ 38,941,256 35,087,572$ $ 48,718,212 49,337,811$ 87,659,468$ 84,425,383$ Capital assets 35,425,366 66,104,535 112,607,448 126,414,902 148,032,814 192,519,437
Total assets 74,366,622 101,192,107 161,325,660 175,752,713 235,692,282 276,944,820
Deferred outflows of resources 1,405,631 2,455,598 745,134 1,085,581 2,150,765 3,541,179
LiabilitiesCurrent liabilities 7,216,337 7,689,282 8,562,769 8,166,202 15,779,106 15,855,484 Long-term liabilities 42,655,479 46,437,152 60,310,901 56,725,478 102,966,380 103,162,630
Total liabilities 49,871,816 54,126,434 68,873,670 64,891,680 118,745,486 119,018,114
Deferred inflows of resources 1,338,235 619,121 454,367 200,364 1,792,602 819,485
Net positionNet investment in capital assets 9,250,544 30,452,890 52,656,054 91,916,109 61,906,598 122,368,999 Restricted 4,733,572 11,728,626 16,121,500 10,665,595 20,855,072 22,394,221 Unrestricted 10,578,086 6,720,634 23,965,203 9,164,546 34,543,289 15,885,180
Total net position 24,562,202$ 48,902,150$ 92,742,757$ 111,746,250$ 117,304,959$ 160,648,400$
GOVERNMENTAL
ACTIVITIES
BUSINESS-TYPE
ACTIVITIES TOTAL
The City’s combined change in net position was a decrease of $(43,343,441), after the restatement. Governmental activities realized an increase of $(24,339,948) while the business-type activities experienced a decrease of $(19,003,493).
TABLE 2 CITY OF DEL RIO’S CHANGES IN NET POSITION
2020 2019 2020 2019 2020 2019
Net (expenses) revenues (21,563,914)$ (24,567,473)$ 4,808,921$ 8,370,386$ (16,754,993)$ (16,197,087)$
General revenues 19,064,297 21,347,460 688,745 1,044,975 19,753,042 22,392,435
Excess before transfers (2,499,617) (3,220,013) 5,497,666 9,415,361 2,998,049 6,195,348
Transfers 8,439,184 8,426,606 (8,439,184) (8,426,606) - -
Changes in net position 5,939,567 5,206,593 (2,941,518) 988,755 2,998,049 6,195,348
Net position - beginning 48,902,150 43,695,557 111,746,250 110,757,495 160,648,400 154,453,052
Prior period adjustment (30,279,515) - (16,061,975) - (46,341,490) -
Net position - ending 24,562,202$ 48,902,150$ 92,742,757$ 111,746,250$ 117,304,959$ 160,648,400$
ACTIVITIES ACTIVITIES TOTAL
GOVERNMENTAL BUSINESS-TYPE

5D
Governmental activities Revenues for the City’s governmental activities were $36,034,120. The revenue was derived from major sources as listed below and as reflected on Figure A-2.
INCREASE2020 2019 (DECREASE)
Property taxes 8,899,916$ 10,104,661$ (1,204,745)$ Sales, franchise and other taxes 9,581,565 9,590,382 (8,817) Charges for services 2,555,100 323,402 2,231,698 Operating grants and contributions 5,146,039 599,064 4,546,975 Capital grants and contributions 1,106,848 - 1,106,848 Investment earning 8,439,184 641,425 7,797,759 Other revenues 305,468 88,526 216,942
36,034,120$ 21,347,460$ 14,686,660$
Property taxes25%
Sales, franchise and other taxes
27%Charges for services
7%
Operating grants and contributions
14%
Capital grants and contributions
3%
Investment earning23%
Other revenues1%
Figure A-2
The City’s adopted property tax rate for fiscal year 2019-2020 is $0.730908 which increased from that of the
previous fiscal year at $0.1575 per $100 of valuation. Property value increased $60,804,092 to $1,199,231,602 from the prior year’s valuation of $1,138,427,510.

5E
Sales tax revenues were $6,540,230. This represents a decrease of $3,958 from the prior year of $6,544,188. In addition to the revenue, the City transferred a net $8,439,184 from proprietary funds to fund its
governmental operations. Expenses for the City’s governmental activities were $30,371,901. Expenses were incurred in the major categories as listed below and as reflected on Figure A-3. Functional expenses by category
INCREASE2020 2019 (DECREASE)
General government 5,857,764$ 5,570,359$ 287,405$ Public safety 14,341,323 14,624,005 (282,682) Highways and streets 4,424,114 2,391,841 2,032,273 Health and welfare 1,373,962 1,197,126 176,836 Culture and recreation 2,856,215 3,279,251 (423,036) Economic development 137,074 14,383 122,691 Interest on long-term debt 1,381,449 1,102,269 279,180
30,371,901$ 28,179,234$ 2,192,667$
General government19%
Public safety47%
Highways and streets
15%
Health and welfare
5%
Culture and recreation9%
Economic development
0% Interest on long-term debt5%
Figure A-3
The City monitored its budget very closely during the year in order to ensure that expenses were within budgeted amounts.

5F
Business-type activities Revenues of the City’s business-type activities totaled $32,323,002 as shown on Figure A-4.
INCREASE2020 2019 (DECREASE)
Charges for services 30,769,408$ 36,239,210$ (5,469,802)$ Operating grants and contributions 519,000 1,765,352 (1,246,352) Other revenues 214,597 224,998 (10,401) Investment earnings 474,148 819,997 (345,849)
31,977,153$ 39,049,557$ (7,072,404)$
Charges for services96%
Operating grants and contributions
2%
Other revenues1%
Investment earnings1%
Figure A-4
The amount realized from charges for services for the gas fund was $3,152,953 which is a decrease of $1,267,494 from the prior year charges for service of $4,420,447. The gas rates fluctuated during the year due to the changes in price of natural gas purchased for resale. The amount realized for charges for services for the water fund was $9,703,874 which is a decrease of $122,829 from the prior year charges for service of $9,581,045. The increase could be attributed to a change in the local climate lower consumption. The amount realized for international bridge tolls was $6,479,801 which is a decrease of $1,603,438 from the prior year charges for service of $8,083,239. Overall bridge crossings showed a slight decrease from the previous year, particularly in regular traffic due to the COVID-19 pandemic. The amount realized for charges for services for the refuse fund was $6,316,821, an increase of $477,502 from the prior year charges for service of $5,839,319.
5G
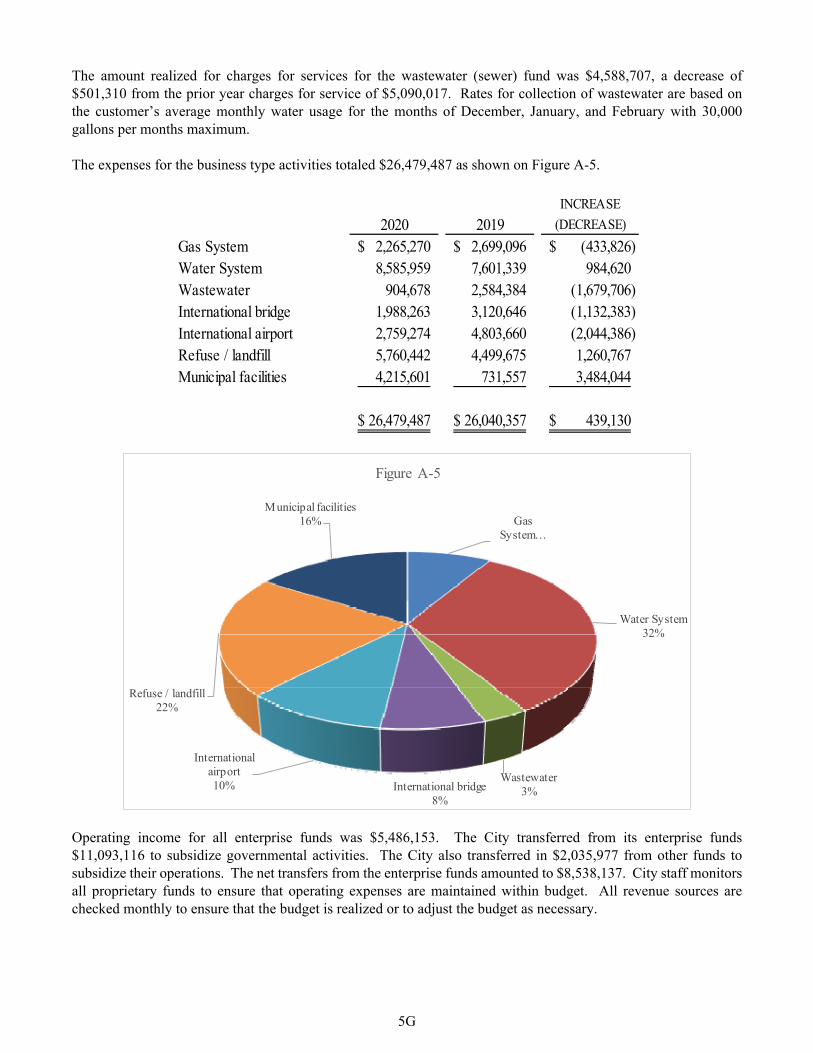
The amount realized for charges for services for the wastewater (sewer) fund was $4,588,707, a decrease of $501,310 from the prior year charges for service of $5,090,017. Rates for collection of wastewater are based on the customer’s average monthly water usage for the months of December, January, and February with 30,000 gallons per months maximum. The expenses for the business type activities totaled $26,479,487 as shown on Figure A-5.
INCREASE
2020 2019 (DECREASE)
Gas System 2,265,270$ 2,699,096$ (433,826)$ Water System 8,585,959 7,601,339 984,620 Wastewater 904,678 2,584,384 (1,679,706) International bridge 1,988,263 3,120,646 (1,132,383) International airport 2,759,274 4,803,660 (2,044,386) Refuse / landfill 5,760,442 4,499,675 1,260,767 Municipal facilities 4,215,601 731,557 3,484,044
26,479,487$ 26,040,357$ 439,130$
Gas System…
Water System32%
Wastewater3%International bridge
8%
International airport10%
Refuse / landfill22%
Municipal facilities16%
Figure A-5
Operating income for all enterprise funds was $5,486,153. The City transferred from its enterprise funds $11,093,116 to subsidize governmental activities. The City also transferred in $2,035,977 from other funds to subsidize their operations. The net transfers from the enterprise funds amounted to $8,538,137. City staff monitors all proprietary funds to ensure that operating expenses are maintained within budget. All revenue sources are checked monthly to ensure that the budget is realized or to adjust the budget as necessary.

5H
FINANCIAL ANALYSIS OF THE CITY’S FUNDS
Significant changes in fund balance / net position Overall, fund balances in the governmental funds increased by $4,348,055, after the restatement. Revenues increased from the prior year by $4,407,174 while expenditures also increased by $3,138,668 and other financing sources and uses decreased by $1,059,861. The main cause for the increases was due to the completion of capital projects as well as increased grant revenues and expenditures. The general fund increased its fund balance by $1,704,147 after the restatement. The fund balance in the debt service fund increased by $191,333 because during the year the overall revenues and other sources exceeded bonds retired and interest paid. The fund balance in the capital project fund increased $1,667,856 during the year. In all other governmental funds, there was a net increase in fund balances of $784,719, after the restatement. The increase resulted primarily from the net change in the grant revenue. The business type funds realized an overall increase in net position of $(18,993,553), after the restatement. In part, the business type funds decrease their net position by $(1,630,981) because of investment earnings resulting from the careful and prudent investment strategies employed by the City. In addition, the business type funds contributed to other City operations by transferring out $(9,928,925) overall. The gas fund transferred out $(1,387,509), the international bridge transferred out $(4,832,113) and other business type funds transferred out a total of $(2,988). The business type funds also received assistance from the other funds. Combined, the enterprise funds received $1,489,741 during the year. General fund budgetary highlights Over the course of the year, the City Council revised the City’s budget several times. These amendments fall into six categories:
Supplemental appropriations revising the budget adopted in September 2020.
Amendments to appropriate funds maintained in reserve at the beginning of the year.
Changes in appropriations for grant matching funds and other contracted services.
Increases in appropriations to cover anticipated budget overruns.
Decrease in appropriations because of budget unexpected balances.
Changes in the amount budgeted for transfer of funds to general fund from other funds. The City monitors its budget to ensure that anticipated revenues are realized and to ensure that expenditures remain within budgeted amounts. For the year, the general fund experienced a positive variance of $2,914,048 in the overall budgeted change in fund balance. In total, the general fund experienced a positive variance of $2,065,458 in revenues, a positive variance in total expenditures of $120,859 and a positive variance in other financing sources of $969,449 for the year as compared to the final amended budget.
5I
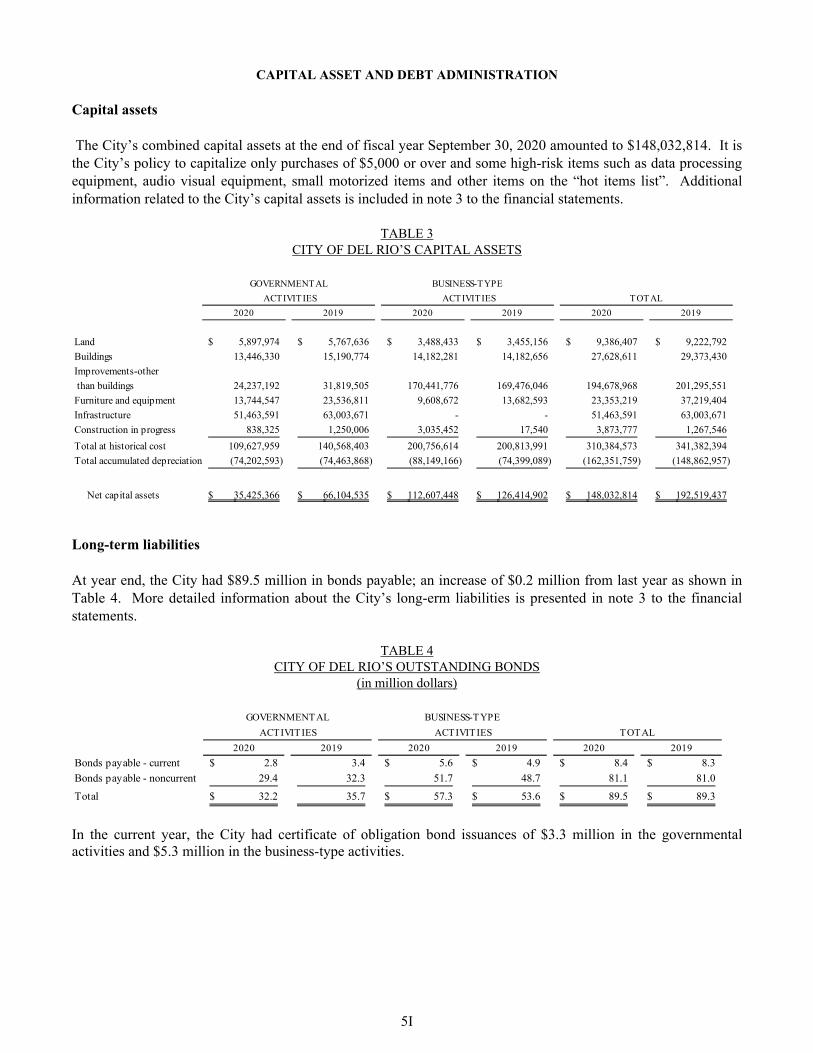
CAPITAL ASSET AND DEBT ADMINISTRATION Capital assets The City’s combined capital assets at the end of fiscal year September 30, 2020 amounted to $148,032,814. It is the City’s policy to capitalize only purchases of $5,000 or over and some high-risk items such as data processing equipment, audio visual equipment, small motorized items and other items on the “hot items list”. Additional information related to the City’s capital assets is included in note 3 to the financial statements.
TABLE 3 CITY OF DEL RIO’S CAPITAL ASSETS
2020 2019 2020 2019 2020 2019
Land 5,897,974$ 5,767,636$ 3,488,433$ 3,455,156$ 9,386,407$ 9,222,792$
Buildings 13,446,330 15,190,774 14,182,281 14,182,656 27,628,611 29,373,430
Improvements-other
than buildings 24,237,192 31,819,505 170,441,776 169,476,046 194,678,968 201,295,551
Furniture and equipment 13,744,547 23,536,811 9,608,672 13,682,593 23,353,219 37,219,404
Infrastructure 51,463,591 63,003,671 - - 51,463,591 63,003,671
Construction in progress 838,325 1,250,006 3,035,452 17,540 3,873,777 1,267,546
Total at historical cost 109,627,959 140,568,403 200,756,614 200,813,991 310,384,573 341,382,394
Total accumulated depreciation (74,202,593) (74,463,868) (88,149,166) (74,399,089) (162,351,759) (148,862,957)
Net capital assets 35,425,366$ 66,104,535$ 112,607,448$ 126,414,902$ 148,032,814$ 192,519,437$
ACTIVITIES ACTIVITIES TOTAL
GOVERNMENTAL BUSINESS-TYPE
Long-term liabilities At year end, the City had $89.5 million in bonds payable; an increase of $0.2 million from last year as shown in Table 4. More detailed information about the City’s long-erm liabilities is presented in note 3 to the financial statements.
TABLE 4 CITY OF DEL RIO’S OUTSTANDING BONDS
(in million dollars)
2020 2019 2020 2019 2020 2019
Bonds payable - current 2.8$ 3.4 5.6$ 4.9$ 8.4$ 8.3$
Bonds payable - noncurrent 29.4 32.3 51.7 48.7 81.1 81.0
Total 32.2$ 35.7 57.3$ 53.6$ 89.5$ 89.3$
GOVERNMENTAL BUSINESS-TYPE
ACTIVITIES ACTIVITIES TOTAL
In the current year, the City had certificate of obligation bond issuances of $3.3 million in the governmental activities and $5.3 million in the business-type activities.
5J
ECONOMIC FACTORS AND NEXT YEAR’S BUDGETS AND RATES
The City’s economy during the fiscal year showed a slight increase as reflected by some key indicators. Property tax revenues increased by $446,374 from the prior year revenues of $10,179,526. Unemployment rate decreased to 3.3% in fiscal year ending September 30, 2020. The management of the City considered the local and state economy in preparing the City’s budget of fiscal year 2020-2021. The City’s property tax rate decreased from .7309 a year ago to .7209 per $100 value for tax year 2020. The City expects to realize $5,106,069 in property tax revenues to operate its general fund and realize $5,174,778 for its debt service fund. The City expects to transfer approximately $9,152,100 from propriety funds to finance the cost of its governmental activities.
CONTACTING THE CITY’S FINANCIAL MANAGEMENT
This financial report is designed to provide our citizens, taxpayers, customers, and investors and creditors with a general overview of the City’s finances and to demonstrate the City’s accountability for the money it receives. If you have questions about this report or need additional financial information, contact the City of Del Rio Finance Department office at (830) 774-8555.


BASIC FINANCIAL STATEMENTS
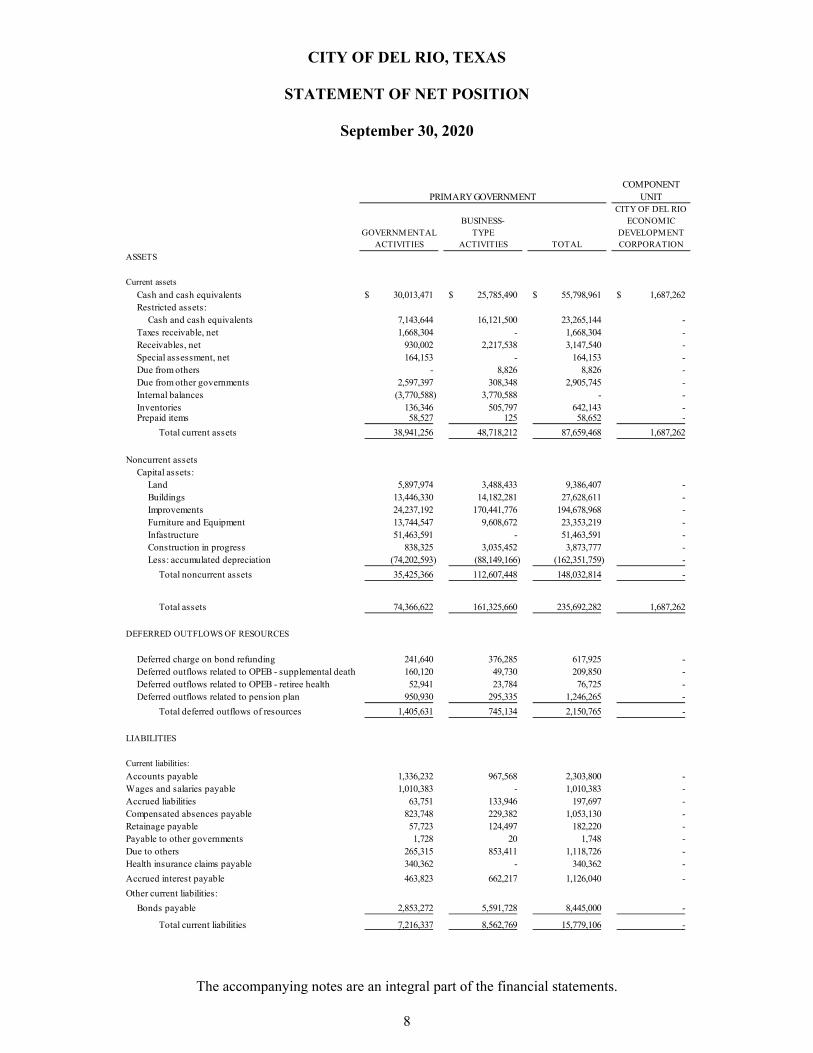
CITY OF DEL RIO, TEXAS
STATEMENT OF NET POSITION
September 30, 2020
The accompanying notes are an integral part of the financial statements.
8
COMPONENTUNIT
CITY OF DEL RIOBUSINESS- ECONOMIC
GOVERNMENTAL TYPE DEVELOPMENTACTIVITIES ACTIVITIES TOTAL CORPORATION
Current assets
Cash and cash equivalents 30,013,471$ 25,785,490$ 55,798,961$ 1,687,262$ Restricted assets:
Cash and cash equivalents 7,143,644 16,121,500 23,265,144 - Taxes receivable, net 1,668,304 - 1,668,304 - Receivables, net 930,002 2,217,538 3,147,540 - Special assessment, net 164,153 - 164,153 - Due from others - 8,826 8,826 - Due from other governments 2,597,397 308,348 2,905,745 - Internal balances (3,770,588) 3,770,588 - - Inventories 136,346 505,797 642,143 - Prepaid items 58,527 125 58,652 -
Total current assets 38,941,256 48,718,212 87,659,468 1,687,262
Noncurrent assetsCapital assets:
Land 5,897,974 3,488,433 9,386,407 - Buildings 13,446,330 14,182,281 27,628,611 - Improvements 24,237,192 170,441,776 194,678,968 - Furniture and Equipment 13,744,547 9,608,672 23,353,219 - Infastructure 51,463,591 - 51,463,591 - Construction in progress 838,325 3,035,452 3,873,777 - Less: accumulated depreciation (74,202,593) (88,149,166) (162,351,759) -
Total noncurrent assets 35,425,366 112,607,448 148,032,814 -
Total assets 74,366,622 161,325,660 235,692,282 1,687,262
Deferred charge on bond refunding 241,640 376,285 617,925 - Deferred outflows related to OPEB - supplemental death 160,120 49,730 209,850 - Deferred outflows related to OPEB - retiree health 52,941 23,784 76,725 - Deferred outflows related to pension plan 950,930 295,335 1,246,265 -
Total deferred outflows of resources 1,405,631 745,134 2,150,765 -
Accounts payable 1,336,232 967,568 2,303,800 - Wages and salaries payable 1,010,383 - 1,010,383 - Accrued liabilities 63,751 133,946 197,697 - Compensated absences payable 823,748 229,382 1,053,130 - Retainage payable 57,723 124,497 182,220 - Payable to other governments 1,728 20 1,748 - Due to others 265,315 853,411 1,118,726 - Health insurance claims payable 340,362 - 340,362 -
Accrued interest payable 463,823 662,217 1,126,040 -
Other current liabilities:
Bonds payable 2,853,272 5,591,728 8,445,000 -
Total current liabilities 7,216,337 8,562,769 15,779,106 -
PRIMARY GOVERNMENT
ASSETS
LIABILITIES
DEFERRED OUTFLOWS OF RESOURCES
Current liabilities:

CITY OF DEL RIO, TEXAS
STATEMENT OF NET POSITION
September 30, 2020
The accompanying notes are an integral part of the financial statements.
9
COMPONENT
UNIT
CITY OF DEL RIOBUSINESS- ECONOMIC
GOVERNMENTAL TYPE DEVELOPMENTACTIVITIES ACTIVITIES TOTAL CORPORATION
Noncurrent liabilities:
Bonds payable 29,409,531$ 51,740,430$ 81,149,961$ -$
Compensated absences 1,679,183 380,706 2,059,889 -
Unamortized premiums (discounts) on bonds 3,186,044 2,619,236 5,805,280 -
Closure and post-closure costs - 2,842,770 2,842,770 -
OPEB liability - supplemental death 897,257 278,665 1,175,922 -
OPEB liability - retiree health 900,620 404,632 1,305,252 - Net pension liability 6,582,844 2,044,462 8,627,306 -
Total noncurrent liabilities 42,655,479 60,310,901 102,966,380 -
Total liabilities 49,871,816 68,873,670 118,745,486 -
Deferred inflows related to OPEB - supplemental death 70,821 21,995 92,816 -
Deferred inflows related to OPEB - retiree health 279,338 125,501 404,839 - Deferred inflows related to pension plan 988,076 306,871 1,294,947 -
Total deferred outflows of resources 1,338,235 454,367 1,792,602 -
NET POSITION
Net investment in capital assets 9,250,544 52,656,054 61,906,598 - Restricted for:
Debt service 3,904,768 16,121,500 20,026,268 - Special purpose 828,804 - 828,804 -
Unrestricted 10,578,086 23,965,203 34,543,289 1,687,262 Total net position 24,562,202$ 92,742,757$ 117,304,959$ 1,687,262$
DEFERRED INFLOWS OF RESOURCES
LIABILITIES (continued)
PRIMARY GOVERNMENT

CITY OF DEL RIO, TEXAS
STATEMENT OF ACTIVITIES
For the year ended September 30, 2020
The accompanying notes are an integral part of the financial statements.
10
OPERATING CAPITALCHARGES FOR GRANTS AND GRANTS AND
EXPENSES SERVICES CONTRIBUTIONS CONTRIBUTIONS
Primary GovernmentGovernmental activities
General government 5,857,764$ 1,653,606$ 13,798$ -$ Public safety 14,341,323 303,526 2,118,694 - Public works: Highways and streets 4,424,114 279,647 1,855,360 1,106,848 Health and welfare 1,373,962 5,584 1,015,512 Culture and recreation 2,856,215 312,737 142,675 - Conservation and development: Economic development and assistance 137,074 - - - Interest on long-term debt 1,381,449 - - -
Total governmental activities 30,371,901 2,555,100 5,146,039 1,106,848
Business-type activitiesGas system 2,265,270 3,152,953 - - Water system 8,585,959 9,703,874 450,000 - International bridge 1,988,263 6,479,801 - - Wastewater 904,678 4,588,707 - - Refuse / landfill 5,760,442 6,316,821 - -
International airport 2,759,274 409,054 69,000 - Municipal facilities 4,215,601 118,198 - -
Total business-type activities 26,479,487 30,769,408 519,000 -
Total primary government 56,851,388$ 33,324,508$ 5,665,039$ 1,106,848$
Component Unit
City of Del Rio Economic Development
Corporation 275,667$ -$ -$
General RevenuesTaxes:
Property taxes, levied for general purposesProperty taxes, levied for debt serviceSales taxesFranchise taxesOther taxes
Miscellaneous revenueInvestment earnings
Transfers in (out)
Total general revenues and transfers Change in net position
NET POSITION - BEGINNING
RESTATEMENT OF BEGINNING NET POSITION
NET POSITION AT BEGINNING OF YEAR - AS RESTATED
NET POSITION - ENDING
FUNCTIONS/PROGRAMS
PROGRAM REVENUEPRIMARY

11
COMPONENTUNIT
CITY OF DEL RIOBUSINESS- ECONOMIC
GOVERNMENTAL TYPE DEVELOPMENTACTIVITIES ACTIVITIES TOTAL CORPORATION
(4,190,360)$ - (4,190,360) - (11,919,103) - (11,919,103) -
(1,182,259) - (1,182,259) - (352,866) (352,866) -
(2,400,803) - (2,400,803) -
(137,074) - (137,074) - (1,381,449) - (1,381,449) -
(21,563,914) - (21,563,914) -
- 887,683 887,683 - - 1,567,915 1,567,915 - - 4,491,538 4,491,538 - - 3,684,029 3,684,029 - - 556,379 556,379 - - (2,281,220) (2,281,220) - - (4,097,403) (4,097,403) -
- 4,808,921 4,808,921 -
(21,563,914) 4,808,921 (16,754,993) -
- - - (275,667)
4,551,935 - 4,551,935 - 4,347,981 - 4,347,981 - 6,540,230 - 6,540,230 645,275 2,294,044 - 2,294,044 -
747,291 - 747,291 - 305,468 214,597 520,065 - 277,348 474,148 751,496 21,004
8,439,184 (8,439,184) - -
27,503,481 (7,750,439) 19,753,042 666,279
5,939,567 (2,941,518) 2,998,049 390,612
48,902,150 111,746,250 160,648,400 -
(30,279,515) (16,061,975) (46,341,490) 1,296,650
18,622,635 95,684,275 114,306,910 1,296,650
24,562,202$ 92,742,757$ 117,304,959$ 1,687,262$
NET (EXPENSES) REVENUES AND CHANGES IN NET POSITIONGOVERNMENT

CITY OF DEL RIO, TEXAS
BALANCE SHEET – GOVERNMENTAL FUNDS
September 30, 2020
The accompanying notes are an integral part of the financial statements.
12
DEBT CAPITAL OTHER TOTALGENERAL SERVICE IMPROVEMENT GOVERNMENTAL GOVERNMENTAL
FUND FUND FUND FUNDS FUNDSASSETS
Cash and cash equivalents 11,016,897$ 672,932$ 10,156,822$ 7,244,658$ 29,091,309$ Taxes receivable, net 958,560 638,590 - 71,154 1,668,304 Special assessment receivables, net 164,153 - - - 164,153 Receivables, net 929,647 - - 355 930,002 Due from other governments 1,325,718 - - 1,271,679 2,597,397 Due from other funds 6,360,203 95,986 280,858 822,964 7,560,011 Inventories 136,346 - - - 136,346 Prepaid items 29,213 29,314 - - 58,527 Restricted cash:
Cash and cash equivalents 4,003,293 3,140,351 - - 7,143,644
Total assets 24,924,030$ 4,577,173$ 10,437,680$ 9,410,810$ 49,349,693$
LIABILITIES
Accounts payable 431,452$ 2,161$ 491,082$ 295,964$ 1,220,659$ Wages and salaries payable 1,010,383 - - - 1,010,383 Accrued liabilities 63,751 - - - 63,751 Retainage Payable - - - 57,723 57,723 Payable to other governments 1,728 - - - 1,728 Due to others - 41 - 44,688 44,729 Due to other funds 241,726 2,299 8,195,254 2,172,462 10,611,741 Other payables 136,397 - 83,488 701 220,586
Total liabilities 1,885,437 4,501 8,769,824 2,571,538 13,231,300
DEFERRED INFLOWS OF RESOURCES
Unavailable revenue - taxes 958,560 638,590 - - 1,597,150 Unavailable revenue - special assessments 164,153 - - - 164,153 Unavailable revenue - court 520,499 - - - 520,499
Total deferred inflows of resources 1,643,212 638,590 - - 2,281,802
FUND BALANCES
Nonspendable:Inventories 136,346 - - - 136,346 Prepaid items 29,213 29,314 - - 58,527
Restricted fund balance:
Capital acquisition and contractual
obligations - - 1,667,856 7,364,529 9,032,385
Retirement of long-term debt - 3,904,768 - - 3,904,768
Special purpose - - - 828,804 828,804 Unassigned fund balance 21,229,822 - - (1,354,061) 19,875,761
Total fund balances 21,395,381 3,934,082 1,667,856 6,839,272 33,836,591
Total liabilities, deferred inflows of resources and fund balances 24,924,030$ 4,577,173$ 10,437,680$ 9,410,810$ 49,349,693$

CITY OF DEL RIO, TEXAS
RECONCILIATION OF GOVERNMENT FUNDS BALANCE SHEET TO GOVERNMENTAL ACTIVITIES STATEMENT OF NET POSITION
September 30, 2020
The accompanying notes are an integral part of the financial statements.
13
Total fund balances - governmental funds 33,836,591$
Amounts reported for governmental activities in the statement of net position are different because:
Assets and liabilities of the internal service funds allocated to governmental activities (210,349)
Capital assets used in governmental activities are not financial resources and, therefore, are not reported in the funds. 35,002,666
Other long-term assets are not available to pay for current period expenditures and, therefore, are deferred inflows of resources in the funds. 2,281,802
Long-term liabilities are not due and payable in the current period and therefore, are not reported in the funds:
Bonds payable (32,262,803)$ Unamortized premium on bonds sold (3,186,044) Compensated absences (2,418,981) Accrued interest on bonds (457,585)
Unamortized loss on bond refundings 241,640 (38,083,773)
Recognition of the City's net pension liability required by GASB 68 and the changes in the deferred outflows and inflows of resources related to the TMRS pension liability are not due and payable in the current period and therefore, not reported in the funds:
Net pension liability Deferred outflows of resources - pension
Deferred inflows of resources - pension (6,404,297)
Recognition of the City's other postemployment benefit liability (OPEB) required by GASB 75 and the changes in the deferred outflows and inflows of resources related to the TMRS OPEB liability are not due and payable in the current period and therefore, are not reported in the funds:
OPEB liability Deferred outflows of resources - OPEBDeferred inflows of resources - OPEB (1,860,438)
Total net position of governmental activities 24,562,202$

CITY OF DEL RIO, TEXAS
STATEMENT OF REVENUES, EXPENDITURES, AND CHANGES IN FUND BALANCES - GOVERNMENTAL FUNDS
For the year ended September 30, 2020
The accompanying notes are an integral part of the financial statements.
14
DEBT CAPITAL OTHER TOTALGENERAL SERVICE IMPROVEMENT GOVERNMENTAL GOVERNMENTAL
FUND FUND FUND FUNDS FUNDSREVENUES
Taxes:Property taxes 5,282,646$ 4,695,637$ -$ -$ 9,978,283$ General sales and use taxes 6,540,230 - - - 6,540,230 Franchise tax 2,232,089 - - 61,955 2,294,044 Other taxes - - - 747,291 747,291 Penalty and interest on taxes 315,472 138,820 - - 454,292 Licenses and permits 581,335 - - - 581,335 Intergovernmental revenue and grants 1,624,451 - - 4,628,436 6,252,887 Charges for services 699,618 - - 216,882 916,500 Fines and forfeitures 272,386 - - 8,711 281,097 Investment earnings 115,204 42,996 99,082 7,648 264,930 Rents and royalties 47,543 - - 27,641 75,184 Other revenue 292,354 1,817 - 7,157 301,328
Total revenues 18,003,328 4,879,270 99,082 5,705,721 28,687,401
EXPENDITURES
Current:General government 5,042,361 - 36,459 131,676 5,210,496 Public safety 12,796,541 - - 461,776 13,258,317 Public works: Highways and streets 2,033,177 - - 2,079,413 4,112,590 Health and welfare - - - 1,273,111 1,273,111 Culture and recreation 2,047,869 - - 580,179 2,628,048 Conservation and development: Economic development and assistance - - - 121,208 121,208
Debt service:Bond principal - 2,738,985 - - 2,738,985 Bond interest - 1,444,664 - - 1,444,664 Bond issuance cost / fees - 4,288 49,563 - 53,851
Capital outlay:Capital outlay 221,163 - 3,381,825 1,240,635 4,843,623
Total expenditures 22,141,111 4,187,937 3,467,847 5,887,998 35,684,893
Excess (deficiency) of revenues over (under) expenditures (4,137,783) 691,333 (3,368,765) (182,277) (6,997,492)
OTHER FINANCING SOURCES (USES)
Issuance of bonds - - 3,280,000 - 3,280,000 Sale of real and personal property 650 - - 2,587 3,237 Transfers in 9,203,507 - 1,300,000 395,253 10,898,760 Premium or discount on issuance of bonds - - 456,621 - 456,621 Transfers out (1,949,708) (500,000) - (307,137) (2,756,845)
Total other financing sources (uses) 7,254,449 (500,000) 5,036,621 90,703 11,881,773
Net change in fund balances 3,116,666 191,333 1,667,856 (91,574) 4,884,281
FUND BALANCES - BEGINNING 19,691,234 3,742,749 - 6,054,553 29,488,536
Prior period adjustment (1,412,519) - - 876,293 (536,226)
FUND BALANCE - BEGINNING AS RESTATED 18,278,715 3,742,749 - 6,930,846 28,952,310
FUND BALANCES – ENDING 21,395,381$ 3,934,082$ 1,667,856$ 6,839,272$ 33,836,591$
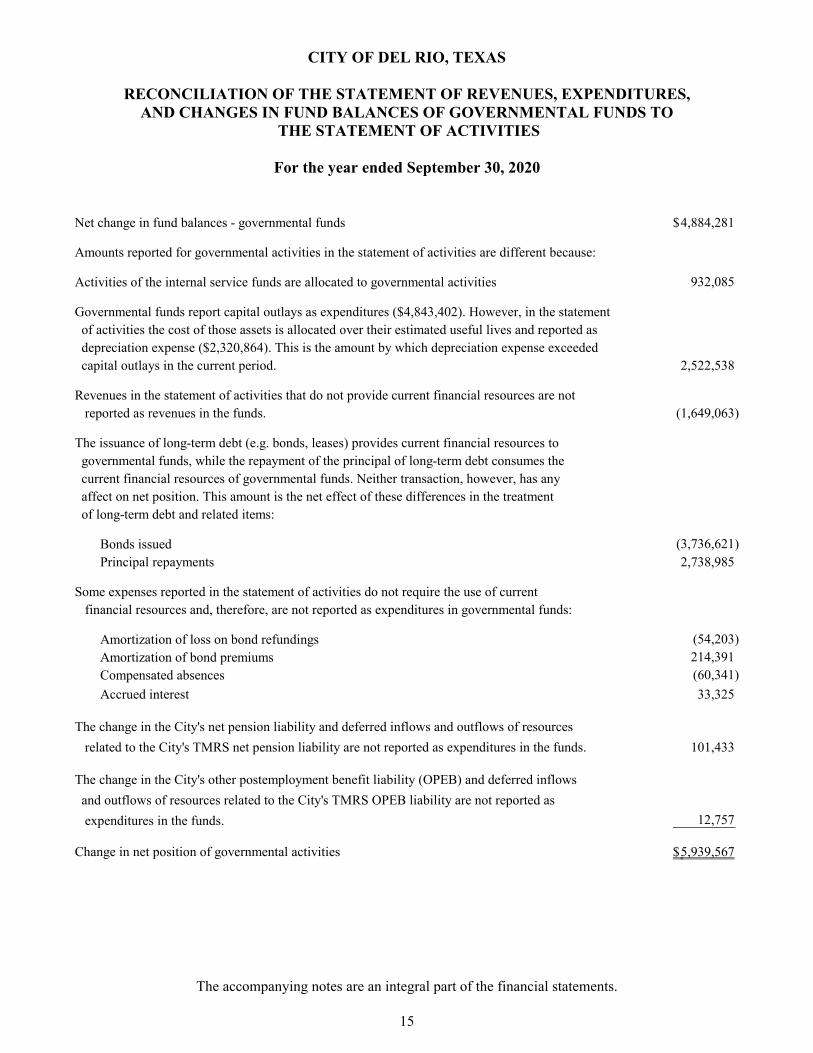
CITY OF DEL RIO, TEXAS
RECONCILIATION OF THE STATEMENT OF REVENUES, EXPENDITURES, AND CHANGES IN FUND BALANCES OF GOVERNMENTAL FUNDS TO
THE STATEMENT OF ACTIVITIES
For the year ended September 30, 2020
The accompanying notes are an integral part of the financial statements.
15
Net change in fund balances - governmental funds 4,884,281$
Amounts reported for governmental activities in the statement of activities are different because:
Activities of the internal service funds are allocated to governmental activities 932,085
Governmental funds report capital outlays as expenditures ($4,843,402). However, in the statement of activities the cost of those assets is allocated over their estimated useful lives and reported as depreciation expense ($2,320,864). This is the amount by which depreciation expense exceeded capital outlays in the current period. 2,522,538
Revenues in the statement of activities that do not provide current financial resources are not reported as revenues in the funds. (1,649,063)
The issuance of long-term debt (e.g. bonds, leases) provides current financial resources to governmental funds, while the repayment of the principal of long-term debt consumes the current financial resources of governmental funds. Neither transaction, however, has any affect on net position. This amount is the net effect of these differences in the treatment of long-term debt and related items:
Bonds issued (3,736,621) Principal repayments 2,738,985
Some expenses reported in the statement of activities do not require the use of current financial resources and, therefore, are not reported as expenditures in governmental funds:
Amortization of loss on bond refundings (54,203) Amortization of bond premiums 214,391 Compensated absences (60,341)
Accrued interest 33,325
The change in the City's net pension liability and deferred inflows and outflows of resources
related to the City's TMRS net pension liability are not reported as expenditures in the funds. 101,433 The change in the City's other postemployment benefit liability (OPEB) and deferred inflows
and outflows of resources related to the City's TMRS OPEB liability are not reported as
expenditures in the funds. 12,757
Change in net position of governmental activities 5,939,567$
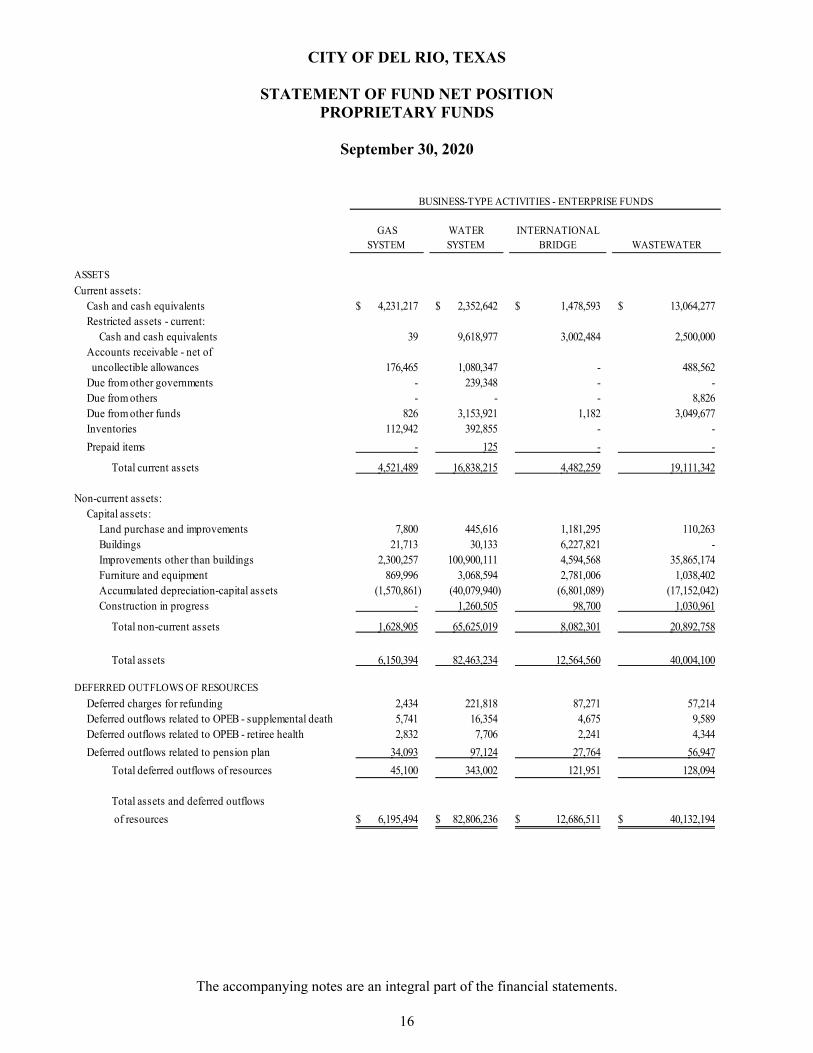
CITY OF DEL RIO, TEXAS
STATEMENT OF FUND NET POSITION PROPRIETARY FUNDS
September 30, 2020
The accompanying notes are an integral part of the financial statements.
16
GAS WATER INTERNATIONALSYSTEM SYSTEM BRIDGE WASTEWATER
ASSETS
Current assets:Cash and cash equivalents 4,231,217$ 2,352,642$ 1,478,593$ 13,064,277$ Restricted assets - current:
Cash and cash equivalents 39 9,618,977 3,002,484 2,500,000 Accounts receivable - net of uncollectible allowances 176,465 1,080,347 - 488,562 Due from other governments - 239,348 - - Due from others - - - 8,826 Due from other funds 826 3,153,921 1,182 3,049,677 Inventories 112,942 392,855 - -
Prepaid items - 125 - -
Total current assets 4,521,489 16,838,215 4,482,259 19,111,342
Non-current assets:Capital assets:
Land purchase and improvements 7,800 445,616 1,181,295 110,263 Buildings 21,713 30,133 6,227,821 - Improvements other than buildings 2,300,257 100,900,111 4,594,568 35,865,174 Furniture and equipment 869,996 3,068,594 2,781,006 1,038,402 Accumulated depreciation-capital assets (1,570,861) (40,079,940) (6,801,089) (17,152,042) Construction in progress - 1,260,505 98,700 1,030,961
Total non-current assets 1,628,905 65,625,019 8,082,301 20,892,758
Total assets 6,150,394 82,463,234 12,564,560 40,004,100
DEFERRED OUTFLOWS OF RESOURCES
Deferred charges for refunding 2,434 221,818 87,271 57,214 Deferred outflows related to OPEB - supplemental death 5,741 16,354 4,675 9,589 Deferred outflows related to OPEB - retiree health 2,832 7,706 2,241 4,344
Deferred outflows related to pension plan 34,093 97,124 27,764 56,947
Total deferred outflows of resources 45,100 343,002 121,951 128,094
Total assets and deferred outflows
of resources 6,195,494$ 82,806,236$ 12,686,511$ 40,132,194$
BUSINESS-TYPE ACTIVITIES - ENTERPRISE FUNDS
17
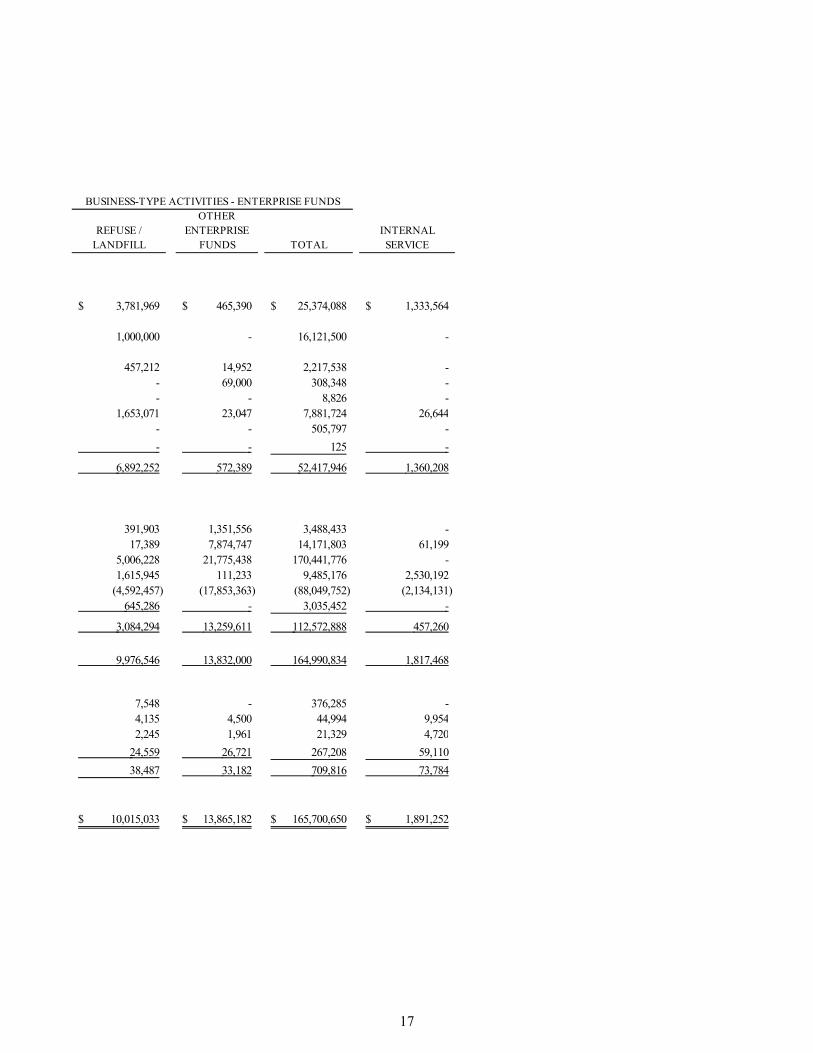
OTHERREFUSE / ENTERPRISE INTERNAL
LANDFILL FUNDS TOTAL SERVICE
3,781,969$ 465,390$ 25,374,088$ 1,333,564$
1,000,000 - 16,121,500 -
457,212 14,952 2,217,538 - - 69,000 308,348 - - - 8,826 -
1,653,071 23,047 7,881,724 26,644 - - 505,797 -
- - 125 -
6,892,252 572,389 52,417,946 1,360,208
391,903 1,351,556 3,488,433 - 17,389 7,874,747 14,171,803 61,199
5,006,228 21,775,438 170,441,776 - 1,615,945 111,233 9,485,176 2,530,192
(4,592,457) (17,853,363) (88,049,752) (2,134,131) 645,286 - 3,035,452 -
3,084,294 13,259,611 112,572,888 457,260
9,976,546 13,832,000 164,990,834 1,817,468
7,548 - 376,285 - 4,135 4,500 44,994 9,954 2,245 1,961 21,329 4,720
24,559 26,721 267,208 59,110
38,487 33,182 709,816 73,784
10,015,033$ 13,865,182$ 165,700,650$ 1,891,252$
BUSINESS-TYPE ACTIVITIES - ENTERPRISE FUNDS

CITY OF DEL RIO, TEXAS
STATEMENT OF FUND NET POSITION PROPRIETARY FUNDS
September 30, 2020
The accompanying notes are an integral part of the financial statements.
18
GAS WATER INTERNATIONALSYSTEM SYSTEM BRIDGE WASTEWATER
LIABILITIES
Current liabilities:Accounts payable 85,787$ 248,902$ 18,877$ 134,275$ Accrued liabilities 47,597 43,913 - 17,789 Compensated absences payable 30,150 71,682 23,825 36,391 Retainage payable - 124,497 - - Intergovernmental payable - - 20 - Due to other funds 22,972 3,060,269 196,900 258,360 Due to others 151,658 605,872 - - Health insurance claims payable - - - - Accrued interest payable 979 344,173 80,517 176,997
Other current liabilities:Bonds payable 15,762 2,867,962 857,425 1,287,068
Total current liabilities 354,905 7,367,270 1,177,564 1,910,880
Non-current liabilities:Bonds payable 70,968 24,154,102 5,233,679 18,936,720 Compensated absesnces 61,727 97,655 63,899 30,205 Unamortized premiums (discounts) on bonds - 1,316,485 330,210 524,835 Closure and post-closure costs - - - - OPEB liability - supplemental death 32,169 91,642 26,197 53,733 OPEB liability - retiree health 48,186 131,097 38,127 73,901 Net pension liability 236,012 672,341 192,199 394,218
Total non-current liabilities 449,062 26,463,322 5,884,311 20,013,612
Total liabilities 803,967 33,830,592 7,061,875 21,924,492
DEFERRED INFLOWS OF RESOURCES
Deferred inflows related to OPEB - supplemental death 2,539 7,233 2,068 4,241
Deferred inflows related to OPEB - retiree health 14,945 40,661 11,826 22,921
Deferred inflows related to pension 35,425 100,917 28,849 59,172
Total deferred inflows of resources 52,909 148,811 42,743 86,334
NET POSITION
Net investment in capital assets 1,542,175 37,286,470 1,660,987 144,135 Restricted for debt service 39 9,618,977 3,002,484 2,500,000
Unrestricted 3,796,404 1,921,386 918,422 15,477,233
Total net position 5,338,618 48,826,833 5,581,893 18,121,368
Total liabilities, deferred inflows of resources, and net position 6,195,494$ 82,806,236$ 12,686,511$ 40,132,194$
Adjustments to reflect the consolidation of internal service fund activities related to enterprise funds
Net position of business-type activities
BUSINESS-TYPE ACTIVITIES - ENTERPRISE FUNDS
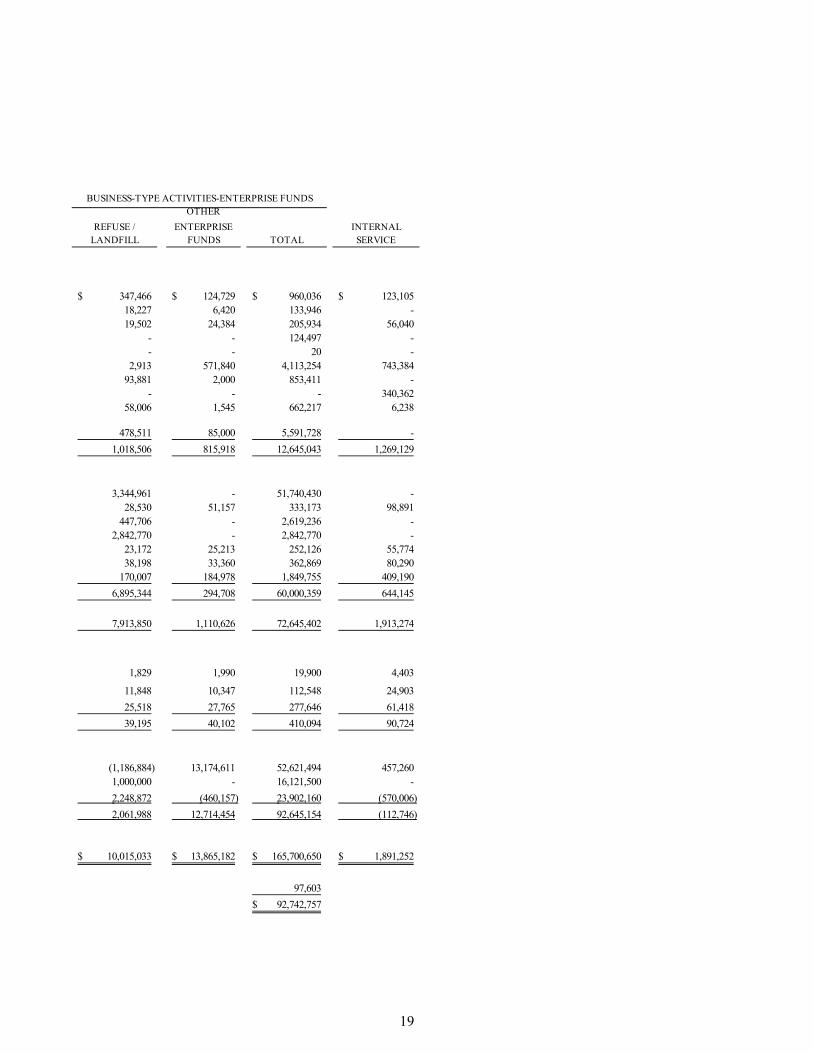
19
OTHER
REFUSE / ENTERPRISE INTERNALLANDFILL FUNDS TOTAL SERVICE
347,466$ 124,729$ 960,036$ 123,105$ 18,227 6,420 133,946 - 19,502 24,384 205,934 56,040
- - 124,497 - - - 20 -
2,913 571,840 4,113,254 743,384 93,881 2,000 853,411 -
- - - 340,362 58,006 1,545 662,217 6,238
478,511 85,000 5,591,728 -
1,018,506 815,918 12,645,043 1,269,129
3,344,961 - 51,740,430 - 28,530 51,157 333,173 98,891
447,706 - 2,619,236 - 2,842,770 - 2,842,770 -
23,172 25,213 252,126 55,774 38,198 33,360 362,869 80,290
170,007 184,978 1,849,755 409,190
6,895,344 294,708 60,000,359 644,145
7,913,850 1,110,626 72,645,402 1,913,274
1,829 1,990 19,900 4,403
11,848 10,347 112,548 24,903
25,518 27,765 277,646 61,418
39,195 40,102 410,094 90,724
(1,186,884) 13,174,611 52,621,494 457,260 1,000,000 - 16,121,500 -
2,248,872 (460,157) 23,902,160 (570,006)
2,061,988 12,714,454 92,645,154 (112,746)
10,015,033$ 13,865,182$ 165,700,650$ 1,891,252$
97,603
92,742,757$
BUSINESS-TYPE ACTIVITIES-ENTERPRISE FUNDS
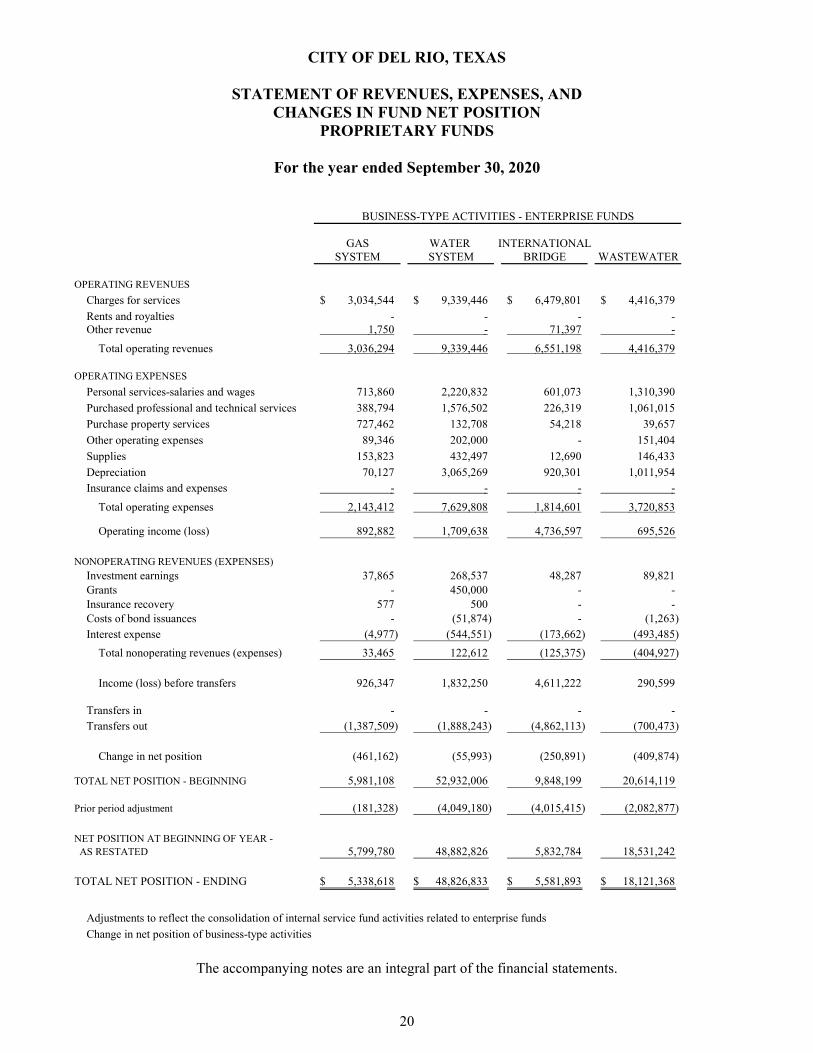
CITY OF DEL RIO, TEXAS
STATEMENT OF REVENUES, EXPENSES, AND CHANGES IN FUND NET POSITION
PROPRIETARY FUNDS
For the year ended September 30, 2020
The accompanying notes are an integral part of the financial statements.
20
GAS WATER INTERNATIONALSYSTEM SYSTEM BRIDGE WASTEWATER
OPERATING REVENUES
Charges for services 3,034,544$ 9,339,446$ 6,479,801$ 4,416,379$
Rents and royalties - - - - Other revenue 1,750 - 71,397 -
Total operating revenues 3,036,294 9,339,446 6,551,198 4,416,379
OPERATING EXPENSES
Personal services-salaries and wages 713,860 2,220,832 601,073 1,310,390
Purchased professional and technical services 388,794 1,576,502 226,319 1,061,015
Purchase property services 727,462 132,708 54,218 39,657
Other operating expenses 89,346 202,000 - 151,404
Supplies 153,823 432,497 12,690 146,433
Depreciation 70,127 3,065,269 920,301 1,011,954 Insurance claims and expenses - - - -
Total operating expenses 2,143,412 7,629,808 1,814,601 3,720,853
Operating income (loss) 892,882 1,709,638 4,736,597 695,526
NONOPERATING REVENUES (EXPENSES)Investment earnings 37,865 268,537 48,287 89,821 Grants - 450,000 - - Insurance recovery 577 500 - - Costs of bond issuances - (51,874) - (1,263) Interest expense (4,977) (544,551) (173,662) (493,485)
Total nonoperating revenues (expenses) 33,465 122,612 (125,375) (404,927)
Income (loss) before transfers 926,347 1,832,250 4,611,222 290,599
Transfers in - - - - Transfers out (1,387,509) (1,888,243) (4,862,113) (700,473)
Change in net position (461,162) (55,993) (250,891) (409,874)
TOTAL NET POSITION - BEGINNING 5,981,108 52,932,006 9,848,199 20,614,119
Prior period adjustment (181,328) (4,049,180) (4,015,415) (2,082,877)
NET POSITION AT BEGINNING OF YEAR - AS RESTATED 5,799,780 48,882,826 5,832,784 18,531,242
TOTAL NET POSITION - ENDING 5,338,618$ 48,826,833$ 5,581,893$ 18,121,368$
Adjustments to reflect the consolidation of internal service fund activities related to enterprise funds
Change in net position of business-type activities
BUSINESS-TYPE ACTIVITIES - ENTERPRISE FUNDS

21
OTHERREFUSE / ENTERPRISE INTERNAL
LANDFILL FUNDS TOTAL SERVICE
6,079,594$ 201,097$ 29,550,861$ 6,410,586$
- 326,155 326,155 - - 117,828 190,975 11,631
6,079,594 645,080 30,067,991 6,422,217
576,843 621,324 6,044,322 1,324,865
4,462,914 1,560,827 9,276,371 746,840
- 23,770 977,815 88,150
155,366 3,101 601,217 -
31,105 28,237 804,785 308,934
283,816 1,242,737 6,594,204 184,647 - - - 3,210,508
5,510,044 3,479,996 24,298,714 5,863,944
569,550 (2,834,916) 5,769,277 558,273
25,031 4,607 474,148 13,321 - 69,000 519,000 -
8,270 14,275 23,622 151,182 (16,231) - (69,368) -
- (13,851) (1,230,526) (76,447)
17,070 74,031 (283,124) 88,056
586,620 (2,760,885) 5,486,153 646,329
- 1,489,741 1,489,741 377,199 (1,087,599) (2,988) (9,928,925) (79,930)
(500,979) (1,274,132) (2,953,031) 943,598
3,340,561 18,922,714 111,638,707 (1,630,981)
(777,594) (4,934,128) (16,040,522) 574,637
2,562,967 13,988,586 95,598,185 (1,056,344)
2,061,988$ 12,714,454$ 92,645,154$ (112,746)$
11,513$
(2,941,518)
BUSINESS-TYPE ACTIVITIES - ENTERPRISE FUNDS
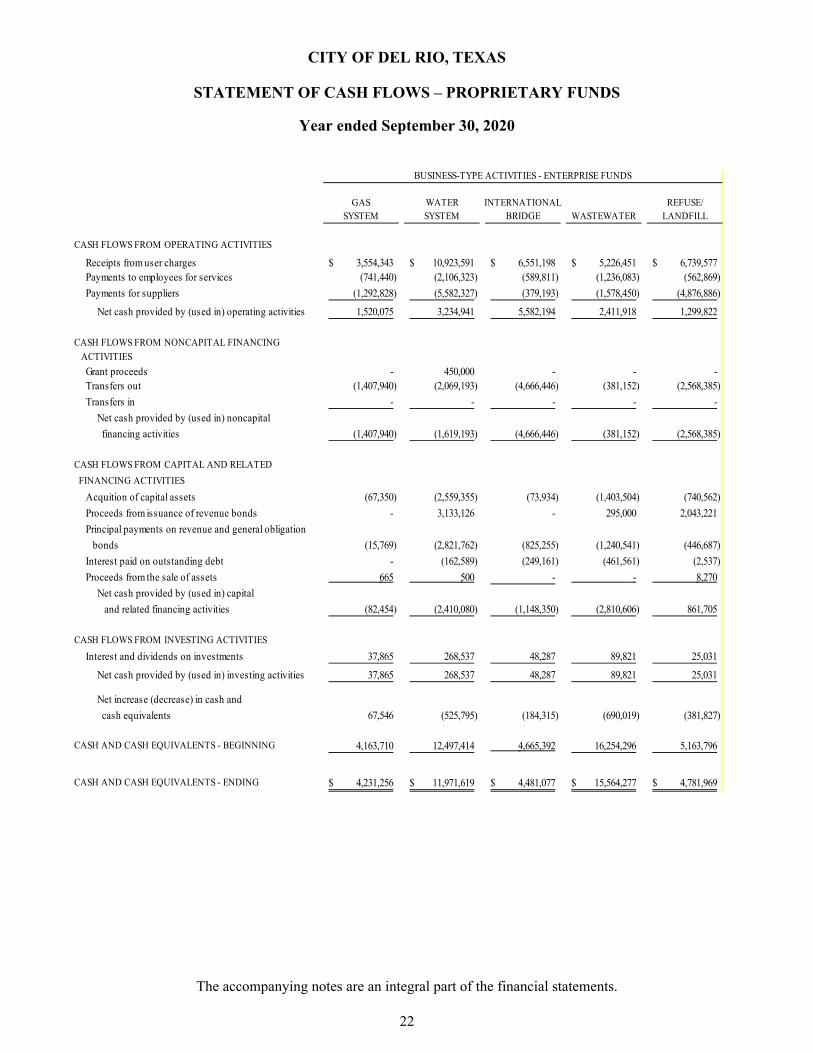
CITY OF DEL RIO, TEXAS
STATEMENT OF CASH FLOWS – PROPRIETARY FUNDS
Year ended September 30, 2020
The accompanying notes are an integral part of the financial statements.
22
GAS WATER INTERNATIONAL REFUSE/SYSTEM SYSTEM BRIDGE WASTEWATER LANDFILL
CASH FLOWS FROM OPERATING ACTIVITIES
Receipts from user charges 3,554,343$ 10,923,591$ 6,551,198$ 5,226,451$ 6,739,577$ Payments to employees for services (741,440) (2,106,323) (589,811) (1,236,083) (562,869)
Payments for suppliers (1,292,828) (5,582,327) (379,193) (1,578,450) (4,876,886)
Net cash provided by (used in) operating activities 1,520,075 3,234,941 5,582,194 2,411,918 1,299,822
CASH FLOWS FROM NONCAPITAL FINANCING
ACTIVITIES
Grant proceeds - 450,000 - - - Transfers out (1,407,940) (2,069,193) (4,666,446) (381,152) (2,568,385)
Transfers in - - - - -
Net cash provided by (used in) noncapital
financing activities (1,407,940) (1,619,193) (4,666,446) (381,152) (2,568,385)
CASH FLOWS FROM CAPITAL AND RELATED
FINANCING ACTIVITIES
Acquition of capital assets (67,350) (2,559,355) (73,934) (1,403,504) (740,562)
Proceeds from issuance of revenue bonds - 3,133,126 - 295,000 2,043,221
Principal payments on revenue and general obligation
bonds (15,769) (2,821,762) (825,255) (1,240,541) (446,687)
Interest paid on outstanding debt - (162,589) (249,161) (461,561) (2,537)
Proceeds from the sale of assets 665 500 - - 8,270
Net cash provided by (used in) capital
and related financing activities (82,454) (2,410,080) (1,148,350) (2,810,606) 861,705
CASH FLOWS FROM INVESTING ACTIVITIES
Interest and dividends on investments 37,865 268,537 48,287 89,821 25,031
Net cash provided by (used in) investing activities 37,865 268,537 48,287 89,821 25,031
Net increase (decrease) in cash and
cash equivalents 67,546 (525,795) (184,315) (690,019) (381,827)
CASH AND CASH EQUIVALENTS - BEGINNING 4,163,710 12,497,414 4,665,392 16,254,296 5,163,796
CASH AND CASH EQUIVALENTS - ENDING 4,231,256$ 11,971,619$ 4,481,077$ 15,564,277$ 4,781,969$
BUSINESS-TYPE ACTIVITIES - ENTERPRISE FUNDS

23
OTHER TOTALENTERPRISE ENTERPRISE INTERNAL
FUNDS FUNDS SERVICE
586,106$ 33,581,266$ 6,410,586$ (580,188) (5,816,714) (4,910,309)
(1,543,167) (15,252,851) (1,170,998)
(1,537,249) 12,511,701 329,279
69,000 519,000 - (11,093,116) (1,876)
2,035,977 2,035,977 736,074
2,104,977 (8,538,139) 734,198
(29,265) (4,873,970) -
(80,000) 5,391,347 -
- (5,350,014) -
(12,307) (888,155) (76,447)
14,275 23,710 151,182
(107,297) (5,697,082) 74,735
4,607 474,148 13,321
4,607 474,148 13,321
465,038 (1,249,372) 1,151,533
352 42,744,960 182,031
465,390$ 41,495,588$ 1,333,564$
BUSINESS-TYPE ACTIVITIES-ENTERPRISE FUNDS
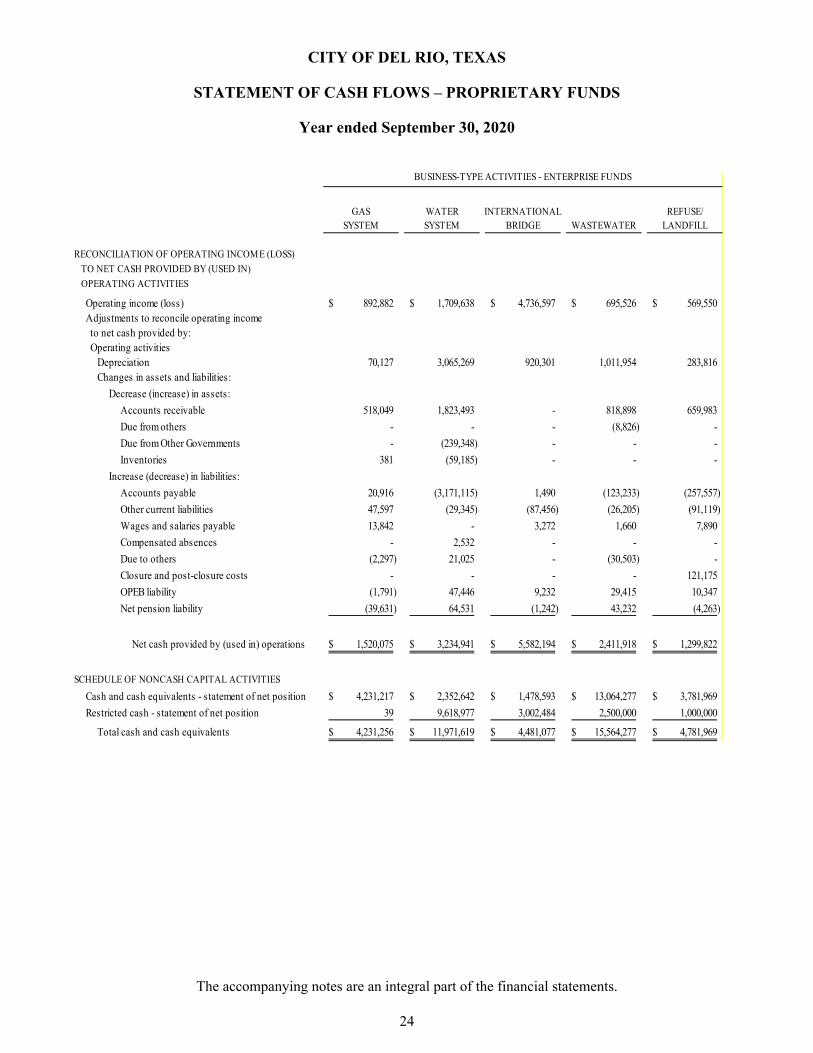
CITY OF DEL RIO, TEXAS
STATEMENT OF CASH FLOWS – PROPRIETARY FUNDS
Year ended September 30, 2020
The accompanying notes are an integral part of the financial statements.
24
GAS WATER INTERNATIONAL REFUSE/SYSTEM SYSTEM BRIDGE WASTEWATER LANDFILL
RECONCILIATION OF OPERATING INCOME (LOSS)
TO NET CASH PROVIDED BY (USED IN)
OPERATING ACTIVITIES
Operating income (loss) 892,882$ 1,709,638$ 4,736,597$ 695,526$ 569,550$ Adjustments to reconcile operating income to net cash provided by: Operating activities
Depreciation 70,127 3,065,269 920,301 1,011,954 283,816 Changes in assets and liabilities:
Decrease (increase) in assets:
Accounts receivable 518,049 1,823,493 - 818,898 659,983
Due from others - - - (8,826) -
Due from Other Governments - (239,348) - - -
Inventories 381 (59,185) - - -
Increase (decrease) in liabilities:
Accounts payable 20,916 (3,171,115) 1,490 (123,233) (257,557)
Other current liabilities 47,597 (29,345) (87,456) (26,205) (91,119)
Wages and salaries payable 13,842 - 3,272 1,660 7,890
Compensated absences - 2,532 - - -
Due to others (2,297) 21,025 - (30,503) -
Closure and post-closure costs - - - - 121,175
OPEB liability (1,791) 47,446 9,232 29,415 10,347
Net pension liability (39,631) 64,531 (1,242) 43,232 (4,263)
Net cash provided by (used in) operations 1,520,075$ 3,234,941$ 5,582,194$ 2,411,918$ 1,299,822$
SCHEDULE OF NONCASH CAPITAL ACTIVITIES
Cash and cash equivalents - statement of net position 4,231,217$ 2,352,642$ 1,478,593$ 13,064,277$ 3,781,969$
Restricted cash - statement of net position 39 9,618,977 3,002,484 2,500,000 1,000,000
Total cash and cash equivalents 4,231,256$ 11,971,619$ 4,481,077$ 15,564,277$ 4,781,969$
BUSINESS-TYPE ACTIVITIES - ENTERPRISE FUNDS
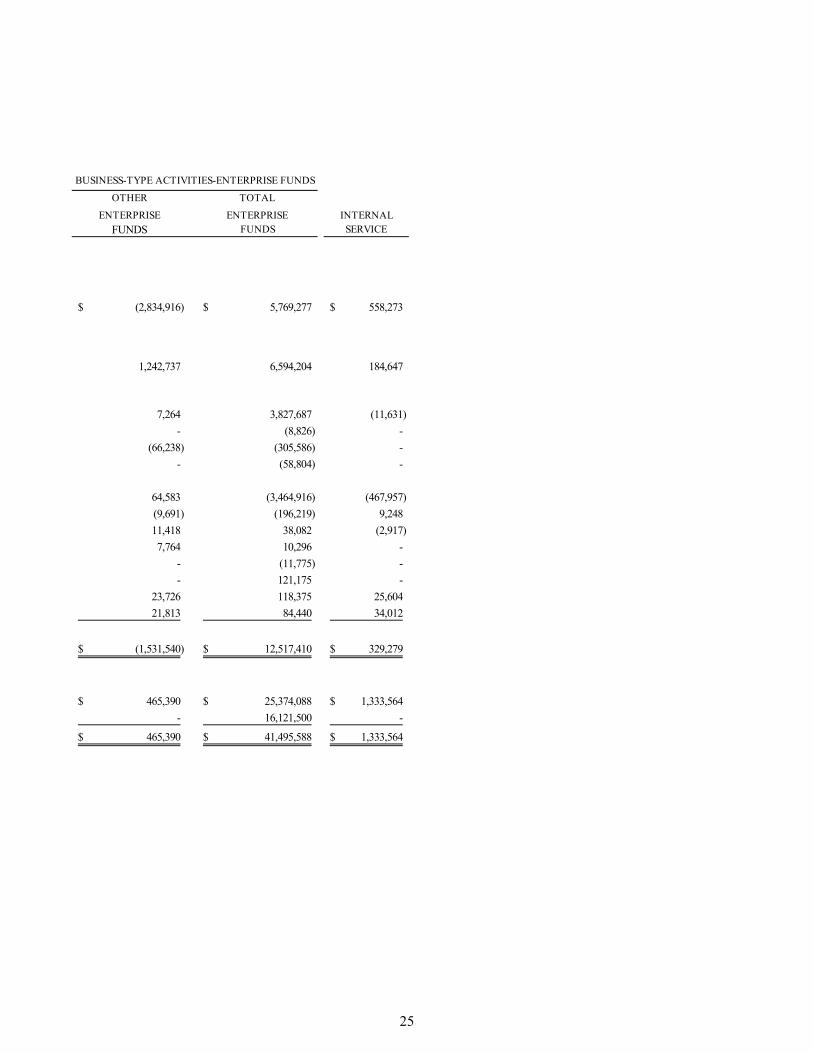
25
OTHER TOTAL
ENTERPRISE ENTERPRISE INTERNAL
FUNDS FUNDS SERVICE
(2,834,916)$ 5,769,277$ 558,273$
1,242,737 6,594,204 184,647
7,264 3,827,687 (11,631)
- (8,826) -
(66,238) (305,586) -
- (58,804) -
64,583 (3,464,916) (467,957)
(9,691) (196,219) 9,248
11,418 38,082 (2,917)
7,764 10,296 -
- (11,775) -
- 121,175 -
23,726 118,375 25,604
21,813 84,440 34,012
(1,531,540)$ 12,517,410$ 329,279$
465,390$ 25,374,088$ 1,333,564$
- 16,121,500 -
465,390$ 41,495,588$ 1,333,564$
BUSINESS-TYPE ACTIVITIES-ENTERPRISE FUNDS

CITY OF DEL RIO, TEXAS
STATEMENT OF FIDUCIARY NET POSITION FIDUCIARY FUNDS
September 30, 2020
The accompanying notes are an integral part of the financial statements.
26
AgencyFunds
AssetsCash and cash equivalents 2,923$ Due from other funds 1,102
Total assets 4,025$
LiabilitiesIntergovernmental payable 4,025$
Total liabilities 4,025$

NOTES TO BASIC FINANCIAL STATEMENTS


CITY OF DEL RIO, TEXAS
NOTES TO FINANCIAL STATEMENTS
September 30, 2020
29
(1) Summary of significant accounting policies
The financial statements of the City of Del Rio, Texas (the “City”) have been prepared in conformity with U.S. Generally Accepted Accounting Principles (GAAP) for local governmental entities. The Governmental Accounting Standards Board (GASB) is the accepted standard-setting body for establishing governmental accounting and financial reporting principles. The more significant of the City’s accounting policies are described below.
Reporting entity
The City of Del Rio, Texas, operates under a council-manager form of City government, with all powers of the City vested in an elective City Council, and provides the following services as authorized by its charter: general administrative services, public safety, public works (streets, bridge, airport, and utilities), cultural and educational, planning and zoning, and health and social services. Financial reporting entity consists of the primary government (as presented in these financial statements) including all governmental and business-type activities of the City and its component unit. Blended component units, although legally separate entities, are, in substance, part of the government’s operations, and data from these units are combined with the data of the primary government. Discretely presented component units are reported in a separate column in the government-wide financial statements to emphasize that they are legally separate from the government. The City has one discretely presented component unit with a September 30 fiscal year end. Discretely presented component unit The City of Del Rio Economic Development Corporation (EDC) is governed by a nine-member board, appointed by city council of the City of Del Rio. The EDC is focused on promoting balanced job opportunities, economic development and tourism in the City of Del Rio. The EDC is funded through a one-eighth (1/8) cent sales tax under the provisions of Chapter 504, Type A Corporations of the Texas Local Government Code. The EDC provides direct services and benefits to the City of Del Rio, its business community, and citizens and functions as an integral part of the City’s operations by promoting and incentivizing economic growth and development for the community. The EDC and the City of Del Rio have both a financial and operational relationship which requires that the EDC’s financial statements be discretely presented into the City’s financial statements. Separate financial statements are not issued for the EDC.
Basic financial statements
The basic financial statements include three components: (1) government-wide financial statements, (2) fund financial statements, and (3) notes to financial statements. The government-wide financial statements report information on all non-fiduciary activities of the primary government and its component units. Management’s discussion and analysis introduces the basic financial statements and provides an analytical overview of the City’s financial activities. The statement of net position reflects both short-term and long-term assets and liabilities, as well as deferred inflows and outflows. In the government-wide statement of net position, governmental activities are reported separately from business-type activities. Governmental activities are supported by taxes and intergovernmental revenues whereas business-type activities are normally supported by fees and charges for services. Long-term assets, such as capital assets, long-term obligations, such as debt, and any deferred outflows and inflows are reported with the assets and liabilities of the governmental activities.

CITY OF DEL RIO, TEXAS
NOTES TO FINANCIAL STATEMENTS
September 30, 2020
30
(1) Summary of significant accounting policies (continued) Basic financial statements (continued)
The components of net position are presented in three separate categories: (1) net investment in capital assets, (2) restricted, and (3) unrestricted. Interfund receivables and payables within governmental and business-type activities are eliminated in the governmental-wide statement of net position, which minimizes the duplicating of assets and liabilities within governmental and business-type activities. The net amount of interfund transfers between governmental and business type activities in the balance is reported in the statement of net position as internal balances. The statement of activities reflects both gross and net cost format. The net cost (by function or business-type activity) is usually covered by general revenues (property taxes, sales tax, intergovernmental revenues, etc.). Direct expenses of a given function or segment are offset by program revenues, such as licenses and permits, fines, fees and fire and ambulance services to others, and operating and capital grants. Direct expenses are those that are clearly identifiable with a specific function or segment. Program revenue must be directly associated with the function or business-type activity. This presentation allows users to determine which functions are self-supporting, and which rely on the tax base in order to complete City requirements. Internal service fund balances, whether positive or negative, have been eliminated against expenses and program revenues shown in the governmental and business-type activities of the statement of activities. A reconciliation detailing the change in net position between the government-wide financial statements and fund financial statements is presented separately for governmental funds. Separate financial statements are provided for governmental funds, proprietary funds, and fiduciary funds, even though the latter are excluded form the government-wide financial statements. Major individual governmental funds and major individual enterprise funds are reported as separate columns in the fund financial statements.
Measurement focus, basis of accounting and financial statement presentation
The government-wide financial statements are reported using the economic resources measurement focus and the full accrual basis of accounting. Revenues are recorded when earned and expenses are recorded at the time liabilities are incurred, regardless of when the related cash flows take place. Program revenues are presented in the government-wide statement of activities. The City reports program revenues in three categories: (1) charges for services, (2) operating grants and contributions, and (3) capital grants and contributions. They are presented separately as a reduction of the total expense to arrive at the net expense of each functional activity. 1. Charges for services are revenues generated by those who purchase goods or services from the City.
Examples of charges for services include solid waste collection and disposal fees. Fines and forfeitures, license and permits and intergovernmental revenues as reported in the general fund are also reported under charges for services.
2. Operating grants and contributions are those revenues that are restricted in the way they may be spent for operations of a particular program.
3. Capital grants and contributions are also restricted revenues whose resources may only be spent to purchase,
build or use capital assets for specified programs.
CITY OF DEL RIO, TEXAS
NOTES TO FINANCIAL STATEMENTS
September 30, 2020
31
(1) Summary of significant accounting policies (continued)
Measurement focus, basis of accounting and financial statement presentation (continued)
Governmental fund financial statements are reported using the current financial resources measurement focus and the modified accrual basis of accounting. Revenue is recognized as soon as it is both measurable and available. Revenue is considered to be available when it is collectible within the current period or soon enough thereafter to pay liabilities of the current period. For this purpose, the government considers revenue to be available if collected within 60 days of the end of the current fiscal period. Expenditures generally are recorded when a liability is incurred, as under accrual accounting. However, debt service expenditures, as well as expenditures related to compensated absences and claims and judgments, are recorded only when payment is due. Property taxes, franchise taxes, sales taxes, and interest associated with the current fiscal period are all considered to be susceptible to accrual and so have been recognized as revenue of the current fiscal period. The City uses funds to report its financial positions and the results of its operations. Fund accounting is designed to demonstrate legal compliance and to aid financial management by segregating transactions related to certain City functions or activities. City resources are allocated to, and accounted for, in individual funds based on the purpose for which they are to be spent and the means by which spending activities are controlled. A fund is a separate accounting entity with a self-balancing set of accounts that comprise its assets, liabilities, fund equity, revenues, and expenditures or expense. Separate financial statements are provided for governmental funds, proprietary funds and fiduciary funds, even though the latter are excluded from the government-wide financial statements. The fund financial statements provide information about the City’s funds, with separate statements presented for each fund category. The emphasis of fund financial statements is on major governmental funds, each displayed in a separate column. All remaining governmental funds are aggregated and reported as nonmajor funds. The City reports the following major governmental funds:
General Fund: This is the City’s primary operating fund. It accounts for all financial resources of the City except those required to be accounted for in another fund. It is the basic fund of the City and covers all activities for which a special revenue fund has not been established. Debt Service Fund: The debt service fund is used to account for the resources accumulated for and the payment of principal and interest on long-term debt of the City. Capital Improvements Fund: The capital improvement fund is used to account for the on-going project as noted on the capital improvement plan including repair and maintenance of streets and infrastructure that were primarily funded by bond issuances.
In addition, the City reports the following fund types: Special Revenue Funds. These funds are used to account for and report the proceeds of specific revenue sources that are restricted or committed to expenditure for specified purposes other than debt service and capital projects. The specific revenue sources are the foundation for the fund’s designation and are expected to continue to comprise a substantial portion of the inflows and will derive from restricted or committed revenue sources, the fund’s remaining resources and activities are reported in the general fund.
CITY OF DEL RIO, TEXAS
NOTES TO FINANCIAL STATEMENTS
September 30, 2020
32
(1) Summary of significant accounting policies (continued)
Measurement focus, basis of accounting and financial statement presentation (continued) Capital Project Funds. These funds are used to account for and report financial resources that are restricted, committed or assigned to expenditures of capital outlays, including the acquisition or construction of capital facilities and other capital assets, except those financed by enterprise funds. Proprietary funds Enterprise Funds. Enterprise funds are used to account for operations that are financed and operated in a manner similar to private business enterprises where the intent of the governing body is that the cost (expenses, including depreciation) of providing goods or services to the general public on a continuing basis should be financed or recovered primarily through user charges. The City reports the following major enterprise funds:
Gas Fund. This fund accounts for the activities of the natural gas distribution system including billing and collection from customers for usage as well as the maintenance of infrastructure assets. Water Fund. This fund accounts for the activities of the water distribution system including billing and collection from customers for usage as well as the maintenance of infrastructure assets. International Bridge Fund. This fund accounts for the activities of the toll bridge between the City and Mexico. Wastewater Fund. This fund accounts for the activities of the sewer system including billing and collection from customers for usage as well as the maintenance of infrastructure assets. Refuse/Landfill Fund. This fund accounts for the activities for collection of solid waste and landfill use.
Internal service fund. The internal service fund is used to account for the utility billings, computer services, fleet management services, and self-insurance provided to other departments on a cost reimbursement basis. Proprietary funds report both operating and non-operating revenues and expenses in the statement of activities. Operating revenues and expenses generally result from providing services and producing and delivering goods in connection with a proprietary fund’s principal ongoing operations. Operating expenses from enterprise funds and internal service funds include the cost of sales and services, administrative expenses, and depreciation on capital assets. All revenues and expenses not meeting this definition are reported as nonoperating revenues and expenses. When both restricted and unrestricted are available for use, it is the City’s policy to use restricted resources first, then unrestricted resources as they are needed.

CITY OF DEL RIO, TEXAS
NOTES TO FINANCIAL STATEMENTS
September 30, 2020
33
(1) Summary of significant accounting policies (continued)
Measurement focus, basis of accounting and financial statement presentation (continued)
Fiduciary funds
Agency funds – are used to report funds held in a custodial capacity for certain nonprofit organizations. Agency funds use the accrual basis of accounting and are used to account for assets held on behalf of outside parties, including other governments, or on behalf of other funds with the City. Government-wide financial statements exclude both fiduciary funds and fiduciary component units.
Assets, liabilities, fund balance or net position
Cash and cash equivalents and investments Cash and cash equivalents are short-term highly liquid investments that are readily convertible to known amounts of cash and so near maturity that there is no significant risk of changes in value due to changes in interest rates. Cash equivalents include investments with original maturities of three months or less. The City’s cash and cash equivalents are considered to be cash on hand, demand deposits, investment pools, and certificates of deposits.
State statutes authorize the City to invest in obligations of the U.S. Treasury, commercial paper, corporate bonds, repurchase agreements, and the State Treasurer’s investment pool. The investment in the local government investment pools are reported at amortized costs. Investments are stated at fair value, based on publicly quoted market prices or the best available estimate.
Receivables and payables Activity between funds that are representative of lending/borrowing arrangements outstanding at the end of the fiscal year are referred to as “due to/from other funds” (i.e., the current portion of interfund loans) or “advances to/from other funds” (i.e., the non-current portion of interfund loans). All other outstanding balances between funds are reported as “due to/from other funds”. Any residual balances outstanding between the governmental activities and business-type activities are reported in the government-wide financial statements as “internal balances.” All trade and property tax receivables are shown net of an allowance for uncollectibles. Trade accounts receivable in excess of 180 days comprise the trade accounts receivable allowance for uncollectibles. The property tax receivable allowance is based on the historical collectability of outstanding property taxes at September 30, 2020.
CITY OF DEL RIO, TEXAS
NOTES TO FINANCIAL STATEMENTS
September 30, 2020
34
(1) Summary of significant accounting policies (continued)
Assets, liabilities, fund balance or net position (continued) Property taxes are levied by October 1 on the assessed value listed as of the prior January 1 for all real and business personal property in conformity with Subtitle E, Texas Property Tax Code. Taxes are due on receipt of the tax bill and are delinquent if not paid before February 1 of the year following the year in which imposed. On January 1 of each year, a tax lien attaches to the property to secure the payment of all taxes, penalties, and interest ultimately imposed. Taxes collected from February 1st through June 30th are considered past due and are assessed a late payment of penalty and interest. On July 1st, any remaining uncollected taxes become delinquent. Thereafter, the City may file suit for collection of the unpaid delinquent taxes, which then become subject to additional penalties and attorney fees. A schedule of tax rates and other pertinent ad valorem information is presented as part of the statistical section of this report. Allowances for uncollectible tax receivables within the general fund and debt service funds are based upon historical experience in collecting property taxes. As of September 30, 2020, the allowance for doubtful accounts in the general fund and debt service funds was $9,523 and $5,557 respectively. Inventories All inventories are valued using the average weighted cost method. Inventories consist of expendable supplies held for consumption. Inventories of governmental funds are recorded as expenditures when consumed rather than when purchased. Prepaid items Certain payments to vendors reflect costs applicable to future accounting periods and are recorded as prepaid items in both government-wide and fund financial statements. Prepaids of governmental funds are recorded as expenditures when consumed rather than when purchased. Restricted assets Restricted assets consist of bond reserve and sinking funds on various revenue bonds and projects designated by the City Council and/or bond requirements. The bond reserve and sinking funds are segregated as required by certain bond indentures. Capital assets Capital assets, which include property, plant, equipment and infrastructure assets (e.g. roads, bridges, sidewalks and similar items) and intangible assets are reported in the applicable governmental or business-type activities columns in the government-wide financial statements. The City defines capital assets as assets with an initial, individual cost of more than $5,000 and an estimated useful life in excess of one year. Such assets are recorded at historical cost or estimated historical cost if purchased or constructed. In addition, items with a cost below $5,000 included in a “hot items” list (computer, software, etc.) are also capitalized. Contributed capital assets are recorded at acquisition value as of the date received.

CITY OF DEL RIO, TEXAS
NOTES TO FINANCIAL STATEMENTS
September 30, 2020
35
(1) Summary of significant accounting policies (continued) Assets, liabilities, fund balance or net position (continued)
Capital assets (continued) The costs of normal maintenance and repairs that do not add to the value of the asset or materially extend assets’ lives are not capitalized.
Major outlays for capital assets and improvements are presented as construction-in-progress and are capitalized when substantially completed. Capital assets are depreciated using the straight–line method over the following useful lives: ASSET YEARS Buildings and building improvements 25 - 50 years Improvements 20 - 50 years Park and other improvements 5 - 10 years Machinery and equipment 2 - 10 years Computer equipment 3 years Vehicles 6 years Transit buses 12 years Infrastructure 25 years
Interfund activity Interfund activity is reported as either loans, services provided, reimbursements or transfers. Loans are reported as interfund receivables and payables as appropriate and are subject to elimination in the government-wide financial statements. Services provided, deemed to be at market or near market rates, are treated as revenues and expenditures/expenses. Reimbursements are when one fund incurs a cost, charges the appropriate benefiting fund and reduces its related cost as a reimbursement. All other interfund transactions are treated as transfers. Transfers between governmental or proprietary funds are netted as part of the reconciliation to the government-wide financial statements. As a general rule, the effect of interfund activity has been eliminated from the government-wide financial statements. Exceptions to this general rule are charges between the City’s gas system, water system, wastewater system, and refuse collection services and various other functions of the City. Elimination of these charges would distort the direct costs and program revenues reported for the various functions concerned.
CITY OF DEL RIO, TEXAS
NOTES TO FINANCIAL STATEMENTS
September 30, 2020
36
(1) Summary of significant accounting policies (continued)
Assets, liabilities, net position or equity (continued) Deferred outflows and inflows of resources In addition to assets, deferred outflows of resources represent a consumption of net position that applies to a future period(s) and so will not be recognized as an outflow of resources (expense/expenditures) until that time. The City reports deferred outflows of resources in the government-wide statement of net position for the unamortized loss on refunding of debt as well as amounts related to the City’s net pension liability and other postemployment benefit liabilities. In addition to liabilities, deferred inflows of resources represent an acquisition of net position that applies to a future period(s) and will not be recognized as an inflow of resources (revenue) until that time. The City reports deferred inflows of resources on the balance sheet of the general and debt service funds related to uncollectible property taxes and warrants less the allowance for uncollectible. In addition, the City also reports deferred inflows of resources in the government-wide statement of net position related to the City’s net pension liability and other postemployment benefit liabilities. Compensated absences City – The personnel policies allow employees to accrue sick leave and vacation leave at various rates during the fiscal year. Accumulated leave vested with the employee is allowed to be used by the employee or may be paid to the employee upon termination. Vested sick leave for all employees, with the exception of public safety employees, is limited to 90 days and vested vacation leave is limited to 15 days. Public safety – The public safety employees, with the exception of certain public safety positions which accumulate leave as other civilian employees do, accumulate leave as stated under the Civil Service laws. Vested sick leave for the public safety employees is limited to 90 days and vested personal leave is limited to 45 days. A liability for these amounts has been accrued in the government-wide and proprietary fund financial statements. Long-term obligations In the government-wide financial statements and proprietary fund types in the fund financial statements, long-term debt and other long-term obligations are reported as liabilities in the applicable governmental activities, business-type activities, or proprietary fund type statement of net position. Bond premiums and discounts are capitalized and amortized over the life of the bonds using the straight-line method. In the fund financial statements, governmental fund types recognize bond premiums and discounts, as well as bond issuance costs, during the current period. The face amount of debt issued is reported as other financing sources. Premiums received on debt issuances are reported as other financing sources while discounts on debt issuances are reported as other financing uses. Issuance costs, whether or not withheld from the actual debt proceeds received, are reported as debt service expenditures.

CITY OF DEL RIO, TEXAS
NOTES TO FINANCIAL STATEMENTS
September 30, 2020
37
(1) Summary of significant accounting policies (continued)
Assets, liabilities, net position or equity (continued) Unearned Revenue Revenues not expected to be available for the current period are reflected as unearned revenue. Unearned revenues arise when assets are recognized before revenue recognition criteria have been satisfied. Revenues received in advance of the costs being incurred are recorded as unearned revenue in the fund statements. Grants and reimbursement revenues received in advance of expenses/ expenditures are reflected as unearned revenue. Pensions For purposes of measuring the net pension liability, deferred outflows of resources and deferred inflows of resources related to pensions, and pension expense, information about the fiduciary net position of the Texas Municipal Retirement System (TMRS) and additions to/deductions from TMRS’s fiduciary net position have been determined on the same basis as they are reported by TMRS. For this purpose, plan contributions are recognized in the period that compensation is reported for the employee, which is when contributions are legally due. Benefit payments and refunds are recognized when due and payable in accordance with the benefit terms. Investments are reported at fair value. Postemployment benefits other than pensions (OPEB) For purposes of measuring the OPEB liability related to the supplemental death benefit fund, deferred outflows of resources and deferred inflows of resources related to OPEB and OPEB expense, information about the fiduciary net position of the Texas Municipal Retirement System (TMRS) and additions to/deductions from the TMRS’s fiduciary net position have been determined on the same basis as they are reported by TMRS. For this purpose, plan contributions are recognized in the period that compensation is reported for the employee, which is when contributions are legally due. Benefit payments and refunds are recognized when due and payable in accordance with the benefit terms. Investments are reported at fair value.
For purposes of measuring the OPEB liability related to the cost for retiree healthcare, deferred outflows of resources and deferred inflows of resources related to OPEB and OPEB expense is required to be measured and disclosed using the accrual basis of accounting, regardless of the amount recognized as OPEB expense on the modified accrual basis of accounting. Changes in OPEB liability will be immediately recognized as OPEB expense on the statement of activities or reported as deferred inflows/outflows of resources depending on the nature of the change.

CITY OF DEL RIO, TEXAS
NOTES TO FINANCIAL STATEMENTS
September 30, 2020
38
(1) Summary of significant accounting policies (continued)
Assets, liabilities, net position or equity (continued)
Encumbrance accounting Encumbrance accounting, under which purchase orders, contracts and other commitments for the expenditure of monies are recorded in order to reserve that portion of the applicable appropriation, is used as an extension of formal budgetary integration in the budgeted funds. Encumbrances lapse at year end. Estimates The preparation of financial statements, in conformity with generally accepted accounting principles, requires management to make estimates and assumptions that affect certain reported amounts and disclosures. Accordingly, actual results could differ from those estimated. Fund balance and net position Governmental funds
In the fund financial statements, governmental funds report reservations of fund balance for amounts that are not available for appropriation or are legally restricted by outside parties for use for a specific purpose. Designations of fund balance represent tentative management plans that are subject to change. The initial distinction made in reporting fund balance information is identifying amounts that are considered non-spendable (i.e., fund balance associated with inventories) then identifying other amounts to be classified as restricted, committed, assigned and unassigned based on the relative strength of the constraints that control how specific amounts can be spent. A detailed description of the classification of fund balance, the spending order and the use of restricted and unrestricted resources under GASB 54 adopted by the City is as follows:
Nonspendable – is amounts not available for appropriation or legally earmarked for a specific use such as inventories, prepaid items, and deferred expenditures.
Restricted – is amounts constrained to specific purposes by their providers (such as grantors, bondholders, and higher levels of governments), through constitutional provisions, or by enabling legislation.

CITY OF DEL RIO, TEXAS
NOTES TO FINANCIAL STATEMENTS
September 30, 2020
39
(1) Summary of significant accounting policies (continued)
Assets, liabilities, fund balance or net position (continued) Fund balance and net position (continued) Committed – is amounts than can be used only for the specific purposes determined by formal action, as
resolution of the Council (the highest level of decision-making authority) such as construction improvements not funded by bond proceeds. Formal action of the Council would be those actions which are voted on at Council meetings that are in compliance with Texas law. Similar action of the Council is required to modify or rescind such commitments.
Assigned – is amounts that do not require Council approval but are intended to be used for a specific purpose, as determined by an official or body to which the Council has delegated the authority. When appropriate for fund balances to be assigned, City Council has delegated the authority to the City Manager or his designee pursuant to the City’s fund balance policy adopted by Resolution No. R: 2011-113.
Unassigned – are residual amounts reported in the general fund which are available to finance operating expenditures. In other funds, the classification is used only to report a deficit balance related to previously restricted or assigned amounts.
Spending order – fund balances shall be considered released from restriction, commitment or assignment as expenditures are incurred for the purpose of the restrictions, commitment or assignment. Where expenditure is made for a purpose for which amounts are available in multiple fund balance classifications, the order in which resources will be expended is as follows: restricted, committed, assigned and unassigned fund balance.
Net position
Net position represents the difference between assets plus deferred outflows of resources and liabilities plus deferred inflows of resources. Net position invested in capital assets, net of related debt consists of capital assets, net of accumulated depreciation, reduced by the outstanding balances of any borrowing used for the acquisition, construction or improvements of those assets, and adding back unspent proceeds. Net position is reported as restricted when there are limitations imposed on their use either through the enabling legislations adopted by the City or through external restrictions imposed by creditors, grantors or laws or regulations of other governments.

CITY OF DEL RIO, TEXAS
NOTES TO FINANCIAL STATEMENTS
September 30, 2020
40
(1) Summary of significant accounting policies (continued)
Assets, liabilities, fund balance or net position (continued) Net position (continued) Net investment in capital assets The unspent proceeds of capital debt are not considered to be capital assets until they are actually spent. Accordingly, only the portion of debt equal to the amount spent is included in the calculation of net position invested in capital assets, net of related debt. Upon completion of the project, all the remaining debt will be considered to be capital-related and included as part of future calculations of net position invested in capital assets, net of related debt. Restricted/unrestricted resources Under the terms of grant agreements, the City funds certain programs by a combination of specific cost-reimbursement grants and general revenues. Thus, when program expenditures are incurred, there are both restricted and unrestricted resources available to finance the program. It is the City’s policy to first apply cost-reimbursement grant (restricted) resources to such programs and then general revenues.
(2) Stewardship, compliance and accountability
Budgets and budgetary accounting
The City Charter establishes requirements for the adoption of a budget and budgetary control. Under provisions of the Charter, expenditures of each City department or agency cannot legally exceed the final departmental budget as amended and legally enacted. Budgets are legally adopted for the general fund and the debt service fund.
The City follows these procedures in establishing the budgetary data reflected in the financial statements: 1. At least 45 days prior to the beginning of the fiscal year, the City Manager is required to submit to the City
Council a proposed budget for the fiscal year beginning on the following October 1. The budget includes proposed expenditures and the means of financing them.
2. Public hearings are held to obtain taxpayer comments.
3. Prior to October 1, the budget is legally enacted through passage of an ordinance, or alternatively, the
budget submitted by the City Manager on or before the 20th day of September if no final ordinance is enacted.
4. The City Manager may at any time transfer up to ten thousand dollars ($10,000) in budgeted allocations
between one-line item and another amount departments and divisions within the same fund. Other transfers of unencumbered appropriation balances or portions thereof must be approved by official action of the City Council.

CITY OF DEL RIO, TEXAS
NOTES TO FINANCIAL STATEMENTS
September 30, 2020
41
(2) Stewardship, compliance and accountability (continued)
Budgets and budgetary accounting (continued)
5. The City can appropriate an amount of not more than three percent of the total general and utility funds expenditure appropriations for contingent use by the City Manager with the approval of the City Council. These contingent appropriations are distributed to other departmental appropriations and can only be transferred on an established emergency basis.
6. The City, by resolution, adopted as it’s guidance in the preparation of the annual budget to schedule a
balance of not less than 25% of the budget annual expenditures in order to maintain from fiscal year to fiscal year a surplus in the annual budget of at least 25% of the annual expenditures.
7. Formal budgetary integration is required by the City Charter as a management control device for all funds.
Capital projects and special revenue funds are budgeted on a project-length or grant-length basis or remaining project-length basis. Annual budgets are adopted on a basis consistent with generally accepted accounting principles.
Annual budgets for proprietary funds are adopted on a basis consistent with generally accepted accounting principles except that the City includes bond proceeds, bond principal payments, and capital asset acquisitions in its annual budget and does not include depreciation expense.
8. All appropriations lapse at the end of the budget year to the extent that they shall not have been expended
or lawfully encumbered. Supplemental budgetary appropriations were necessary during the year and were approved through resolution by the City Council.
(3) Detailed notes on all funds
Deposits and investments
The City’s deposits and investments as of September 30, 2020, consist of the following:
WEIGHTED AVERAGE
FAIR VALUE MATURITY (IN YEARS)
CashCash on hand 6,932$ -Cash in bank 12,823,870 -Escrow 8,923,105 -
Total cash 21,753,907
Investments categorized as cash equivalentsCertificates of deposit 20,165,256 0.39Texas Term 2,467,428 0.16TexPool 34,677,514 0.11
Total investments categorized as cash equivalents 57,310,198 0.22
Total cash and cash equivalents 79,064,105$
Discretely Presented Component UnitCash in bank 623,866$ N/ATexPool 1,063,396 0.11
Total cash and cash equivalents 1,687,262$
CITY OF DEL RIO, TEXAS
NOTES TO FINANCIAL STATEMENTS
September 30, 2020
42
(3) Detailed notes on all funds (continued) Custodial credit risk for deposits and investments
The City’s policy regarding types of deposits allowed and collateral requirements is as follows: deposits and investments of the City and its’ component unit’s funds, other than direct purchases of United States Treasury instruments or its agencies, is secured by pledged collateral. Collateralization levels of the City and component unit funds are pledged at an amount equal to the highest daily balance of all deposits and investments less an amount insured by the Federal Deposit Insurance Corporation (FDIC) or Federal Savings and Loan Insurance Corporation (FSLIC). Acceptable collateral, exclusive of FDIC and FSLIC coverage, is (1) a bond, certificate of indebtedness, or Treasury Note of the United States, or other evidence of indebtedness of the United States, its agencies or instrumentalities, (2) obligations, the principal and interest on which, are unconditionally guaranteed or insured by the State of Texas, or (3) a bond of the State of Texas or of a county, city or other political subdivision of the State of Texas rates as investment grade (no less than “A” or its equivalent) by a national rating agency with a remaining maturity of ten (10) years or less. The City is not exposed to custodial credit risk for its deposits as all are covered by depository insurance and collateral coverage. In the case of deposits, this is the risk that in the event of a bank failure, the City’s deposits may not be returned to it. As of September 30, 2020, the City’s cash on hand was $6,932. The carrying amount of deposits was $12,823,870 and a bank balance of $14,244,914. The Del Rio Economic Development Corporation carrying amount of deposits was $623,866 and the bank balance was $625,291. The City maintains its cash balances at one financial institution. Funds held at participating financial institution have unlimited FDIC coverage for all non-interest bearing accounts, and $250,000 FDIC coverage for interest bearing accounts, including certificates of deposit. Therefore, the bank balance was covered by federal deposit insurance and the City’s depository had pledged securities having a market value of $1,425,171 as collateral for the City’s deposits at fiscal year end. Funds were fully insured and collateralized. To limit the risk that, in the event of the failure of the counterparty to a transaction, the City will not be able to recover the value of investment or collateral securities that are in possession of an outside party, the City requires counterparties to register the securities in the name of the City and hand them over to the City or its designated agent. This includes securities in securities lending transactions. All the securities are in the City’s name and held by the City or its agent.
Interest rate risk State law does not permit investments with maturities greater than five (5) years. As a means of limiting its exposure to fair value losses arising from rising interest rates, the City’s investment policy limits the average maturity of investments to one (1) year from the time of purchase. City policy limits the average maturity of investment to three (3) years. As of September 30, 2020, all investments held by the City have maturities of less than one (1) year.
Credit risk for deposits and investments Texas Local Government Investment Pool (TexPool) operates in a manner consistent with the SEC’s Rule 2a7 of the Investment Company Act of 1940. The Texas Comptroller of Public Accounts is the sole officer, director and shareholder of the Texas Treasury Safekeeping Trust Company, which is authorized to operate TexPool. In addition, the TexPool Advisory Board advises on TexPool’s investment policy. This Board is composed equally of participants in TexPool and other persons who do not have a business relationship with TexPool who are qualified to advise TexPool.

CITY OF DEL RIO, TEXAS
NOTES TO FINANCIAL STATEMENTS
September 30, 2020
43
(3) Detailed notes on all funds (continued)
Credit risk for deposits and investments (continued) Financial information on TexPool can be obtained from the Internet website, www.texpool.com. TexPool is valued at amortized cost rather than market value to report assets to compute share prices. Accordingly, the fair value of the position in the pool is the same as the value of the shares in each pool.
TexasTERM was created by and for Texas Local Governments to provide investment programs tailored to the needs of Texas cities, counties, school districts and other public investors. TexasTERM investments are designed to comply with all Texas statutes, including regulations for the allowable investments of public funds. Texas TERM is owned and operated by the TexasTERM investors. The investors elect advisory board members who are responsible for the overall management of Texas TERM including overall formulation and implementation of investment and operating policies. Financial information on Texas TERM can be obtained from the internet website, www.texasterm.net In accordance with state law and the City’s investment policy, investments in investment pools must be rated at least AAA or AAA-m or have an equivalent rating by at least one nationally recognized rating service. As of September 30, 2020, TexPool was rated AAAm and TexasTERM was rated AAAm by Standard & Poor’s.
Concentration of credit risk
The City places no limit on the amount the City may invest in any one issuer, rather investments are governed by the objectives of preservation and safety of principal and liquidity. The City mitigates risk by limiting investments to those allowed by the Public Funds Investment Act, avoiding over-concentration of assets in a specific maturity sector, limitation of average maturity of operating funds to one year, avoidance of over-concentration of assets in other than U.S. Treasury securities or collateralized certificates of deposit. The liquidity risk is controlled by the selection of securities dealers.
Investment Policy
The City is required by the Public Funds Investment Act, Chapter 2256, State of Texas Government Code, to adopt and implement an investment policy. The City has adopted such a policy. That policy addresses the following areas: safety of principal and liquidity, portfolio diversification, allowable investments, acceptable risk levels, expected rates of return, maximum allowable stated maturity of portfolio investments, maximum average dollar-weighted maturity allowed based on the stated maturity date for the portfolio, investment staff quality and capabilities and bid solicitation preferences for certificates of deposit.
The Public Fund Investment Act also requires the City to have independent accountants perform procedures related to investment practices as provided by the Act. State statutes and Council policy authorize the City to invest in the following types of investments meeting criteria and eligibility requirements established by Texas Government Code 2256: obligations of , or guaranteed by, governmental entities, certificates of deposit and share certificates, fully collateralized repurchase agreements, a securities lending program, bankers’ acceptance, commercial paper, no-load money mutual funds and no-load mutual funds, guaranteed investment contracts as an investment vehicle for bond proceeds and public funds investment pools. The City is in compliance with the requirements of the Act and City policy.

CITY OF DEL RIO, TEXAS
NOTES TO FINANCIAL STATEMENTS
September 30, 2020
44
(3) Detailed notes on all funds (continued)
Property tax
Property taxes are assessed on the appraised value of taxable property on January 1 and levied on October 1 of the tax year. Property taxes are payable on or before January 31 following the levy date. Unpaid property taxes attach as an enforceable lien on property as of January 1. The appraisal of property values is performed by Val Verde County Appraisal District jointly for the City and other local taxing entities. The billing and collecting of tax levies are the responsibility of the City and the other taxing entities individually.
Receivables
Governmental funds OTHER
GENERAL GOVERNMENTALFUND FUNDS TOTAL
Court fines 520,499$ -$ 520,499$ Franchise 139,500 - 139,500 Golf course 19,273 - 19,273 Returned checks 3,653 - 3,653 Miscellaneous 246,722 355 247,077
Total general fund 929,647$ 355$ 930,002$ Enterprise funds
GAS WATER REFUSE / NONMAJOR
SYSTEM SYSTEM LANDFILL WASTEWATER ENTERPRISE TOTAL
Customer charges 172,465$ 717,374$ 319,212$ 350,602$ 8,171$ 1,567,824$ Connections and repairs - 163,432 - - - 163,432 Unbilled charges 119,000 563,000 313,000 278,000 - 1,273,000 Miscellaneous - 11,541 - 39,960 6,781 58,282 Estimate for uncollectibles (115,000) (375,000) (175,000) (180,000) - (845,000)
Total net receivables 176,465$ 1,080,347$ 457,212$ 488,562$ 14,952$ 2,217,538$

CITY OF DEL RIO, TEXAS
NOTES TO FINANCIAL STATEMENTS
September 30, 2020
45
(3) Detailed notes on all funds (continued)
Unavailable revenue At September 30, 2020, unavailable revenue reported as deferred inflows of resources in the governmental funds are as follows:
General Debt ServiceFund Fund Total
Governmental:Property taxes receivable 968,083$ 644,147$ 1,612,230$ Allowance for uncollectible taxes (9,523) (5,557) (15,080)
Unavailable revenue - property taxes 958,560 638,590 1,597,150
Court fines receivable 2,602,496 - 2,602,496 Allowance for uncollectible fines (2,081,997) - (2,081,997)
Unavailable revenue - court fines 520,499 - 520,499
Paving and lot clearing 6,023 - 6,023 Special assessment receivable 786,320 - 786,320 Allowance for uncollectible assessments (628,190) - (628,190)
Unavailable revenue - special assessments 164,153 - 164,153
Total unavailable revenue 1,643,212$ 638,590$ 2,281,802$

CITY OF DEL RIO, TEXAS
NOTES TO FINANCIAL STATEMENTS
September 30, 2020
46
(3) Detailed notes on all funds (continued)
Interfund receivable and payables
The following summary of interfund receivables and payables for the City as of September 30, 2020.
Due From Due To AmountDebt service General fund 2,299$ Capital improvement fund General fund 3,011,105 Gas system General fund 22,299 Water system General fund 3,548 International bridge fund General fund 114,885 Wastewater fund General fund 8,251 Nonmajor governmental fund General fund 1,887,090 Nonmajor proprietary fund General fund 567,342 Internal service fund General fund 743,384 International bridge fund Debt service 82,015 Wastewater fund Debt service 9,473 Nonmajor proprietary fund Debt service 4,498 Wastewater fund Capital improvement fund 231,928 Nonmajor governmental fund Capital improvement fund 48,930 Nonmajor governmental fund Gas system 826 Capital improvement fund Water system 3,151,626 Nonmajor governmental fund Water system 2,295 Nonmajor governmental fund International bridge fund 1,182 General fund Refuse / Landfill 1,332 Capital improvement fund Refuse / Landfill 1,650,676 Nonmajor governmental fund Refuse / Landfill 1,063 Water system Wastewater fund 3,047,391 Nonmajor governmental fund Wastewater fund 2,286 General fund Internal service fund 1,470 Nonmajor governmental fund Internal service fund 3,810 Gas system Internal service fund 673 Water system Internal service fund 9,070 Wastewater fund Internal service fund 8,708 Refuse / Landfill Internal service fund 2,913 General fund Nonmajor governmental fund 238,924 Nonmajor governmental fund Nonmajor governmental fund 224,017 Capital improvement fund Nonmajor governmental fund 360,023 Capital improvement fund Nonmajor proprietary fund 21,824 Water system Nonmajor proprietary fund 260 Nonmajor governmental fund Nonmajor proprietary fund 963
15,468,379$
CITY OF DEL RIO, TEXAS
NOTES TO FINANCIAL STATEMENTS
September 30, 2020
47
(3) Detailed notes on all funds (continued)
The outstanding balances as of September 30, 2020, result mainly from short-term loans between funds (primarily the general fund) which are caused by differences between the date that transactions are recorded in the accounting system and the date that payment between funds occur. Advances between funds consist of amounts that are not expected to be paid within one year. Due from other governments
Amounts due from other governments include:
Governmental fundsMajor funds
General fund 1,325,718$
Nonmajor special revenue fundsSection 5311 grant fund (Texas Department of Transportation) 345,068 Women infant childeren (Texas Department of State Health Services) 93,357 Nutrition social services (Texas Department of Aging and Disability) 184,086 CARES act grant (Texas Division of Emergency Management) 251,770 VCR grant (Texas Deparment of Transportation) 18,000
Total nonmajor special revenue funds 892,281
Nonmajor capital projects fundsQualia relief fund (Texas Department of Transportation) 379,398
Total nonmajor governmental funds 379,398
Total governmental funds 2,597,397
Enterprise fundsWater fund (Texas Department of Agriculture) 239,348 Nonmajor enterprise fund
Airport fund (Texas Division of Emergency Management) 69,000
Total enterprise funds 308,348
Total due from other governments 2,905,745$

CITY OF DEL RIO, TEXAS
NOTES TO FINANCIAL STATEMENTS
September 30, 2020
48
(3) Detailed notes on all funds (continued)
Capital assets
Capital asset activity for the year ended September 30, 2020 was as follows:
BEGINNING ENDINGBALANCE BALANCE
10/1/2019 INCREASES DECREASES 9/30/2020
Governmental activitiesCapital assets not being depreciated
Land 5,897,974$ -$ -$ 5,897,974$ Construction in progress 1,587,957 1,976,504 (2,726,136) 838,325
Total capital assets not being depreciated 7,485,931 1,976,504 (2,726,136) 6,736,299
Capital assets being depreciatedBuildings 13,446,330 - - 13,446,330 Improvements other than buildings 24,075,235 161,957 - 24,237,192 Equipment 10,553,649 3,190,898 - 13,744,547
Infrastructure 49,223,412 2,240,179 - 51,463,591
Total capital assets being depreciated 97,298,626 5,593,034 - 102,891,660
Less accumulated depreciaton:
Buildings (9,997,271) (926,141) - (10,923,412) Improvements other than buildings (5,912,956) (687,689) - (6,600,645) Equipment (8,021,497) (652,922) - (8,674,419)
Infrastructure (47,950,005) (54,112) - (48,004,117)
Total accumulated depreciation (71,881,729) (2,320,864) - (74,202,593)
Total capital assets being depreciated - net 25,416,897 3,272,170 - 28,689,067
Governmental activities capital assets - net 32,902,828$ 5,248,674$ (2,726,136)$ 35,425,366$
Summary:
Capital assets, net 31,314,871$ 3,272,170$ -$ 34,587,041$
Construction in progress 1,587,957 1,976,504 (2,726,136) 838,325
Total 32,902,828$ 5,248,674$ (2,726,136)$ 35,425,366$

CITY OF DEL RIO, TEXAS
NOTES TO FINANCIAL STATEMENTS
September 30, 2020
49
(3) Detailed notes on all funds (continued) Capital assets (continued)
BEGINNING ENDINGBALANCE BALANCE
10/1/2019 INCREASES DECREASES 9/30/2020
Business-Type Activities
Capital assets not being depreciated
Land 3,488,433$ -$ -$ 3,488,433$ Construction in progress 85,277 4,806,620 (1,856,445) 3,035,452
Total capital assets not being depreciated 3,573,710 4,806,620 (1,856,445) 6,523,885
Capital assets being depreciated
Buildings 14,182,281 - - 14,182,281
Improvements other than buildings 168,956,774 1,485,002 - 170,441,776 Furniture and equipment 9,143,908 464,764 - 9,608,672
Total capital assets being depreciated 192,282,963 1,949,766 - 194,232,729
Less accumulated depreciaton:
Buildings (5,501,725) (194,721) - (5,696,446)
Improvements other than buildings (70,854,859) (4,922,752) - (75,777,611) Furniture and equipment (5,193,233) (1,481,876) - (6,675,109)
Total accumulated depreciation (81,549,817) (6,599,349) - (88,149,166)
Total capital assets being depreciated - net 110,733,146 (4,649,583) - 106,083,563
Business-type capital assets - net 114,306,856$ 157,037$ (1,856,445)$ 112,607,448$
Summary:
Capital assets, net 114,221,579$ (4,649,583)$ -$ 109,571,996$ Construction in progress 85,277 4,806,620 (1,856,445) 3,035,452
Total 114,306,856$ 157,037$ (1,856,445)$ 112,607,448$
Current year depreciation expense was charged to functions/programs of the primary government as follows: Governmental activities
General government 419,400$ Public safety 1,067,168 Highways and streets 331,028 Health and Welfare 102,475 Culture and recreation 211,535 Economic Development 9,756 Internal service fund* 179,502
Total depreciation expense - governmental activities 2,320,864$ * Capital assets held by the government’s internal service funds are charged to various functions based on their usage of the assets.

CITY OF DEL RIO, TEXAS
NOTES TO FINANCIAL STATEMENTS
September 30, 2020
50
(3) Detailed notes on all funds (continued) Capital assets (continued)
Business-type activitiesGas system 70,127$ Water system 3,065,269 International bridge 920,301 Wastewater 1,011,954 Refuse / landfill 283,816 International airport 1,199,853 Municipal facilities 42,884 Internal service fund* 5,145
Total depreciation expense - business-type activities 6,599,349$ * Capital assets held by the City’s internal service funds are charged to various functions based on their usage of the assets.
Transfers
The City made $8,470,881 in transfers from the enterprise funds to the general fund to subsidize the operations of general government functions. The enterprise fund also supplemented operations of the internal service funds (fleet and computer services). In addition, the general fund also made transfers to subsidize the airport fund and the municipal facilities enterprise fund and the fleet and computer services internal services funds. Subsidies from the general fund will be used to reduce deficits. Normal operations and reductions in transfers to other funds for purchases of fleet vehicles will reduce the deficit in internal services funds.
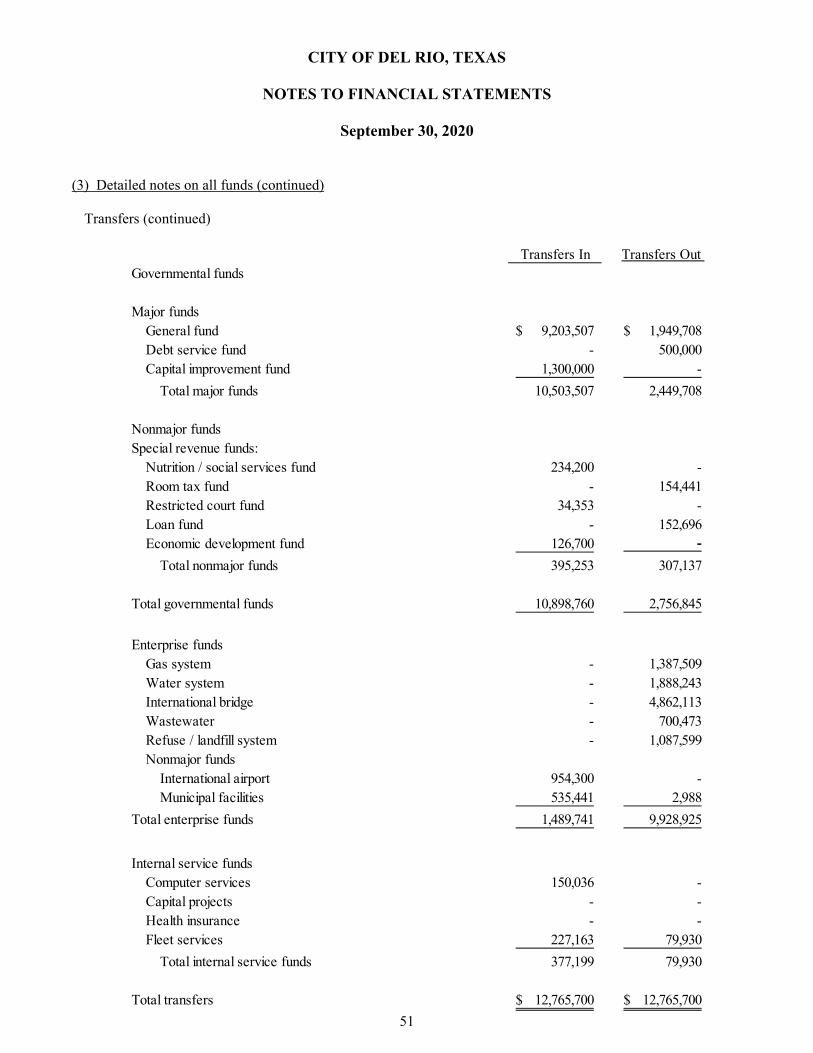
CITY OF DEL RIO, TEXAS
NOTES TO FINANCIAL STATEMENTS
September 30, 2020
51
(3) Detailed notes on all funds (continued)
Transfers (continued)
Transfers In Transfers Out Governmental funds
Major fundsGeneral fund 9,203,507$ 1,949,708$ Debt service fund - 500,000 Capital improvement fund 1,300,000 -
Total major funds 10,503,507 2,449,708
Nonmajor fundsSpecial revenue funds:
Nutrition / social services fund 234,200 - Room tax fund - 154,441 Restricted court fund 34,353 - Loan fund - 152,696 Economic development fund 126,700 -
Total nonmajor funds 395,253 307,137
Total governmental funds 10,898,760 2,756,845
Enterprise fundsGas system - 1,387,509 Water system - 1,888,243 International bridge - 4,862,113 Wastewater - 700,473 Refuse / landfill system - 1,087,599 Nonmajor funds
International airport 954,300 - Municipal facilities 535,441 2,988
Total enterprise funds 1,489,741 9,928,925
Internal service fundsComputer services 150,036 - Capital projects - - Health insurance - - Fleet services 227,163 79,930
Total internal service funds 377,199 79,930
Total transfers 12,765,700$ 12,765,700$
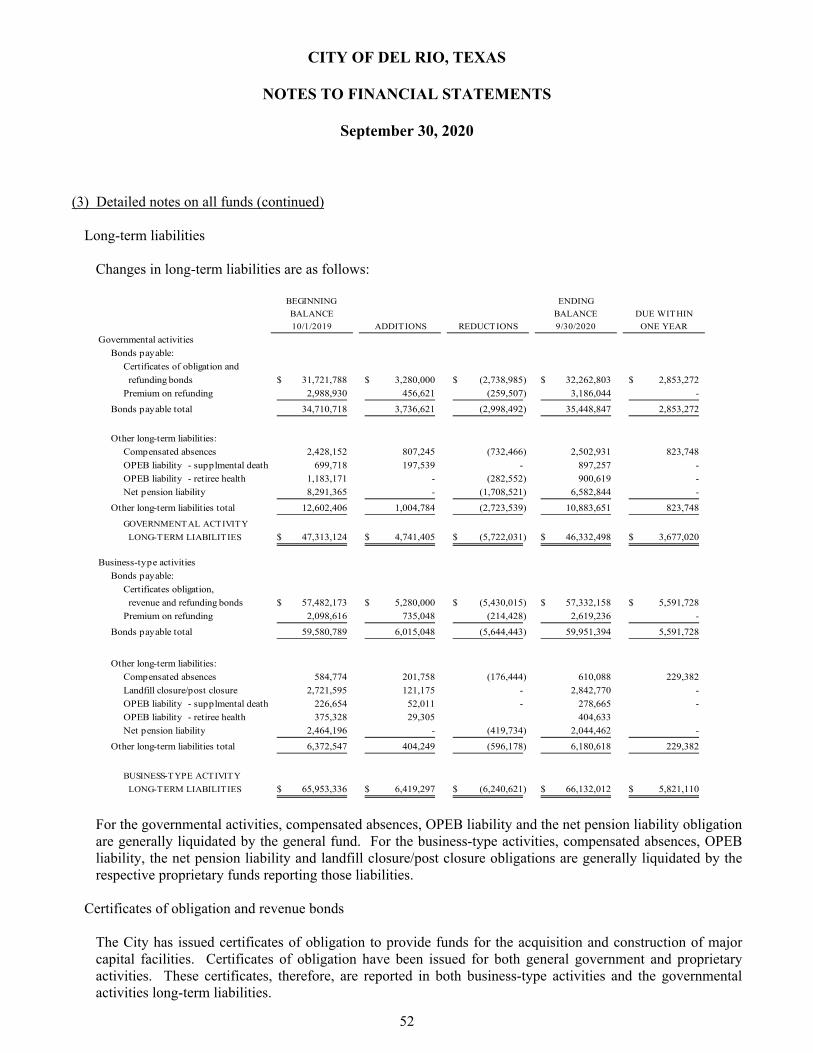
CITY OF DEL RIO, TEXAS
NOTES TO FINANCIAL STATEMENTS
September 30, 2020
52
(3) Detailed notes on all funds (continued)
Long-term liabilities
Changes in long-term liabilities are as follows:
BEGINNING ENDING
BALANCE BALANCE DUE WITHIN
10/1/2019 ADDITIONS REDUCTIONS 9/30/2020 ONE YEAR
Governmental activities
Bonds payable:
Certificates of obligation and
refunding bonds 31,721,788$ 3,280,000$ (2,738,985)$ 32,262,803$ 2,853,272$
Premium on refunding 2,988,930 456,621 (259,507) 3,186,044 -
Bonds payable total 34,710,718 3,736,621 (2,998,492) 35,448,847 2,853,272
Other long-term liabilities:
Compensated absences 2,428,152 807,245 (732,466) 2,502,931 823,748
OPEB liability - supplmental death 699,718 197,539 - 897,257 -
OPEB liability - retiree health 1,183,171 - (282,552) 900,619 -
Net pension liability 8,291,365 - (1,708,521) 6,582,844 -
Other long-term liabilities total 12,602,406 1,004,784 (2,723,539) 10,883,651 823,748
GOVERNMENTAL ACTIVITY
LONG-TERM LIABILITIES 47,313,124$ 4,741,405$ (5,722,031)$ 46,332,498$ 3,677,020$
Business-type activities
Bonds payable:
Certificates obligation,
revenue and refunding bonds 57,482,173$ 5,280,000$ (5,430,015)$ 57,332,158$ 5,591,728$
Premium on refunding 2,098,616 735,048 (214,428) 2,619,236 -
Bonds payable total 59,580,789 6,015,048 (5,644,443) 59,951,394 5,591,728
Other long-term liabilities:
Compensated absences 584,774 201,758 (176,444) 610,088 229,382
Landfill closure/post closure 2,721,595 121,175 - 2,842,770 -
OPEB liability - supplmental death 226,654 52,011 - 278,665 -
OPEB liability - retiree health 375,328 29,305 404,633
Net pension liability 2,464,196 - (419,734) 2,044,462 -
Other long-term liabilities total 6,372,547 404,249 (596,178) 6,180,618 229,382
BUSINESS-TYPE ACTIVITY
LONG-TERM LIABILITIES 65,953,336$ 6,419,297$ (6,240,621)$ 66,132,012$ 5,821,110$ For the governmental activities, compensated absences, OPEB liability and the net pension liability obligation are generally liquidated by the general fund. For the business-type activities, compensated absences, OPEB liability, the net pension liability and landfill closure/post closure obligations are generally liquidated by the respective proprietary funds reporting those liabilities.
Certificates of obligation and revenue bonds
The City has issued certificates of obligation to provide funds for the acquisition and construction of major capital facilities. Certificates of obligation have been issued for both general government and proprietary activities. These certificates, therefore, are reported in both business-type activities and the governmental activities long-term liabilities.

CITY OF DEL RIO, TEXAS
NOTES TO FINANCIAL STATEMENTS
September 30, 2020
53
(3) Detailed notes on all funds (continued)
Long-term liabilities (continued)
The following is a summary of changes in liabilities for bonds by issue for the year ended September 30, 2020:
ORIGINAL MATURITY INTEREST BALANCE BALANCE DUE WITHIN
ISSUE ISSUE DATE RATES 10/1/19 ADDITIONS PAYMENTS 9/30/2020 ONE YEAR
GOVERNMENTAL ACTIVITIES
Certificate of Obligation:
Series 2010 4,560,000 6/1/2030 2.0% - 4.0% 1,090,000$ -$ (80,000)$ 1,010,000$ 85,000$
Series 2011 6,675,000 6/1/2031 2.0% - 3.0% 330,597 - (22,761) 307,836 23,507
Series 2012 4,260,000 6/1/2032 2.0% - 4.0% 2,320,000 - (225,000) 2,095,000 200,000
Series 2013A 3,635,000 6/1/2028 2.0% - 3.0% 445,000 - (65,000) 380,000 65,000
Series 2015 10,260,000 6/1/2030 3.0% - 4.0% 3,590,000 - (415,000) 3,175,000 430,000
Series 2016 13,760,000 6/1/2030 2.0% - 5.0% 8,535,000 - (820,000) 7,715,000 865,000
Series 2017 12,450,000 6/1/2036 2.0% - 5.0% 6,985,000 - (95,000) 6,890,000 130,000
Series 2018 6,740,000 6/1/2032 2.0% - 5.0% 1,150,000 - (175,000) 975,000 175,000
Series 2019 8,565,000 6/1/2038 3.75% - 5/0% 4,405,000 - (330,000) 4,075,000 340,000
Series 2019D 8,560,000 6/1/2034 4.0%-5.0% - 3,280,000 (215,000) 3,065,000 225,000
Total certificate of obligations 28,850,597 3,280,000 (2,442,761) 29,687,836 2,538,507
Refunding bonds - CO:
Series 2011 2,370,000 7/1/2021 2.0% - 3.0% 95,000 - (20,000) 75,000 25,000
Series 2014 4,145,000 6/1/2029 2.05% 42,293 - (9,959) 32,334 7,472
Series 2015 9,280,000 6/1/2038 0.00% 1,331,407 - (199,356) 1,132,051 203,793
Series 2017 6,695,000 6/1/2048 0.00% 1,155,738 - (45,784) 1,109,954 52,616
Series 2018 3,475,000 6/1/2048 2.0% - 5.0% 246,753 - (21,125) 225,628 25,884
Total Refunding Bonds 2,871,191 - (296,224) 2,574,967 314,765
TOTAL GOVERNMENTAL ACTIVITIES 31,721,788$ 3,280,000$ (2,738,985)$ 32,262,803$ 2,853,272$

CITY OF DEL RIO, TEXAS
NOTES TO FINANCIAL STATEMENTS
September 30, 2020
54
(3) Detailed notes on all funds (continued)
Long-term liabilities (continued)
ORIGINAL MATURITY INTEREST BALANCE BALANCE DUE WITHIN
ISSUE ISSUE DATE RATES 10/1/19 ADDITIONS PAYMENTS 9/30/2020 ONE YEAR
BUSINESS-TYPE ACTIVITIES
Certificate of Obligation:
Series 2001B 1,100,000 7/1/2021 4.625% - 5.50% 165,000$ -$ (80,000)$ 85,000$ 85,000$
Series 2009A 4,695,000 6/1/2029 2.5% - 4.625% 2,785,000 - (230,000) 2,555,000 240,000
Series 2009C (1) ######## 6/1/2038 .55% - 1.85% 6,855,000 - (250,000) 6,605,000 260,000
Series 2010 4,560,000 6/1/2030 2.0% - 4.0% 1,290,000 - (130,000) 1,160,000 130,000
Series 2011 6,675,000 6/1/2031 2.0% - 3.0% 4,099,403 - (282,239) 3,817,164 291,493
Series 2012A 5,000,000 6/1/2042 0.0% - 2.12% 4,260,000 - (120,000) 4,140,000 125,000 Series 2013A 3,635,000 6/1/2028 2.0% - 3.0% 1,460,000 - (205,000) 1,255,000 210,000
Series 2015 ######## 6/1/2030 3.0% - 4.0% 3,735,000 - (400,000) 3,335,000 415,000
Series 2016 ######## 6/1/2030 2.0% - 5.0% 1,995,000 - (220,000) 1,775,000 230,000
Series 2017 ######## 6/1/2036 2.0% - 5.0% 3,105,000 - (335,000) 2,770,000 345,000
Series 2018 6,740,000 6/1/2032 2.0% - 5.0% 4,045,000 - (310,000) 3,735,000 335,000
Series 2019 8,565,000 6/1/2038 3.75% - 5/0% 3,395,000 - (220,000) 3,175,000 225,000
Series 2019A 500,000 6/1/2048 .02% - 1.55% 500,000 - - 500,000 -
Series 2019B 3,000,000 6/1/2048 .27% - 1.63% 3,000,000 - - 3,000,000 -
Series 2019C 3,500,000 6/1/2048 .02% - 1.55% 5,500,000 - - 5,500,000 -
Series 2019D 8,560,000 6/1/2034 4.0%-5.0% - 5,280,000 (375,000) 4,905,000 390,000
Total certificate of obligations 46,189,403 5,280,000 (3,157,239) 48,312,164 3,281,493
Refunding bonds - CO:
Series 2001B 5,400,000 6/1/2019 0.00% 540,000 - (270,000) 270,000 270,000
Series 2014 4,145,000 6/1/2029 2.05% 747,707 - (145,041) 602,666 147,528
Series 2015 9,280,000 6/1/2038 0.00% 3,413,554 - (460,644) 2,952,910 476,206 Series 2017 6,695,000 6/1/2048 0.00% 3,904,262 - (804,216) 3,100,046 837,385
Series 2018 3,475,000 6/1/2048 2.0% - 5.0% 2,643,247 - (548,875) 2,094,372 579,116
Total Refunding Bonds 11,248,770 - (2,228,776) 9,019,994 2,310,235
Revenue bonds:Series 2000 533,000 6/1/2020 4.5% - 5.2% 44,000 - (44,000) - -
TOTAL BUSINESS-TYPE ACTIVITIES ######### 5,280,000$ ######### ######### 5,591,728$

CITY OF DEL RIO, TEXAS
NOTES TO FINANCIAL STATEMENTS
September 30, 2020
55
(3) Detailed notes on all funds (continued)
Long-term liabilities (continued)
Bond covenant compliance
There are a number of limitations and restrictions contained in the bond indentures for the Certificates of Obligation, Revenue, and Refunding Bonds and City ordinances authorizing the bond indentures. The City is in compliance with all significant debt limitations and restrictions. The annual requirements to amortize the bonds outstanding as of September 30, 2020, are as follows:
Year EndingSeptember 30, Principal Interest Principal Interest
2021 2,853,272$ 1,408,661$ 5,591,728$ 2,005,547$ 2022 3,212,459 1,284,533 4,987,541 1,786,052 2023 3,178,570 1,139,584 4,941,429 1,593,116 2024 3,004,831 998,829 4,920,167 1,414,775 2025 3,106,350 862,930 4,708,651 1,225,664
2026-2030 11,453,738 2,610,489 17,446,264 3,791,372 2031-2035 4,703,583 779,681 7,881,378 1,688,599 2036-2040 750,000 42,314 4,350,000 479,669 2041-2045 - - 1,740,000 130,977 2046-2048 - - 765,000 23,769
Total 32,262,803$ 9,127,021$ 57,332,158$ 14,139,540$
Governmental Activities Business-Type ActivitiesCertificates of Obligation
Texas water code
The City is compliant with applicable requirements of Section 16.356 of the Texas Water Code relating to transfers of funds associated with Economically Distressed Areas Program (EDAP) funded projects. All revenues derived from EDAP funded projects are used solely for utility purposes.
Accrued compensated absences For the governmental activities, claims and judgments are generally liquidated by the general fund. Compensated absences are generally liquidated by the general fund, the MIT-5311 grant fund, the women, infants and children fund, the nutrition/social services fund and the economic development administration fund.

CITY OF DEL RIO, TEXAS
NOTES TO FINANCIAL STATEMENTS
September 30, 2020
56
(3) Detailed notes on all funds (continued)
Landfill closure and post-closure care costs The City currently operates one active landfill site. State and federal laws and regulations require the City to place a final cover on its landfill when it stops accepting waste and to perform certain maintenance and monitoring functions at landfill sites closed after 1991, for thirty years after closure. Although the majority of closure and post-closure care costs will be paid only near or after the date that a landfill stops accepting waste, the City reports a portion of these closure and post-closure care costs as an operating expense in each period based on landfill capacity used as of each statement of net position date. The $2,842,770 reported as landfill closure and post-closure liabilities at September 30, 2020, represents the cumulative amount reported to that date based on the use of 85% of the estimated capacity of the operating landfill. The increase in closure and post-closure costs of $121,175 is due to an increase in landfill percentage used from 82% to 85% in fiscal year 2020 as well as an increase in total closure and post-closure costs. The City will recognize the remaining estimated cost of closure and post-closure care of approximately $501,665 as the remaining estimated capacity of the landfill is filled. The estimated remaining life of the landfill is 4.6 years. These amounts are based on what it would cost to perform all closure and post-closure care in 2020. Based on the current demographic information and engineering estimates of landfill consumption, the City expects to close the landfill in approximately 2026. Actual costs may be higher due to inflation, changes in technology, or changes in applicable laws or regulations. On April 9, 1997, the financial responsibility requirements found in Environmental Protection Agency Subtitle D regulations as they relate to publicly owned or operated municipal solid waste landfill facilities became effective. The regulations require that financial assurance to perform closure, post-closure, and corrective activities for landfill operations be provided. The City has chosen to provide this assurance through use of the Local Government Financial Test and Government Guarantee. This guarantee consists of three basic components, which are a financial component, public notice component, and a record keeping and reporting component. The public notice component of the Local Governmental Financial Test and Government Guarantee demonstrating financial assurance for closure, post-closure, or corrective action required by Environmental Protection Agency Subtitle D regulations for landfills operated by local government requires the following disclosures to be made.
1. The specific facility covered is the City of Del Rio Municipal Solid Waste Landfill, Permit #207A. 2. Financial assurance costs are anticipated in the following categories of expenditures and in the amount of the
corresponding cost estimates. The original estimates will be adjusted for inflation. Closure cost $2,007,277 Post-closure cost 1,337,158 Total $3,344,435 3. The anticipated year of closure is 2026 with closure costs having been fully incurred within that time. It is
anticipated that post-closure costs will be incurred evenly across the 30 year post-closure monitoring period at $44,572 per year.
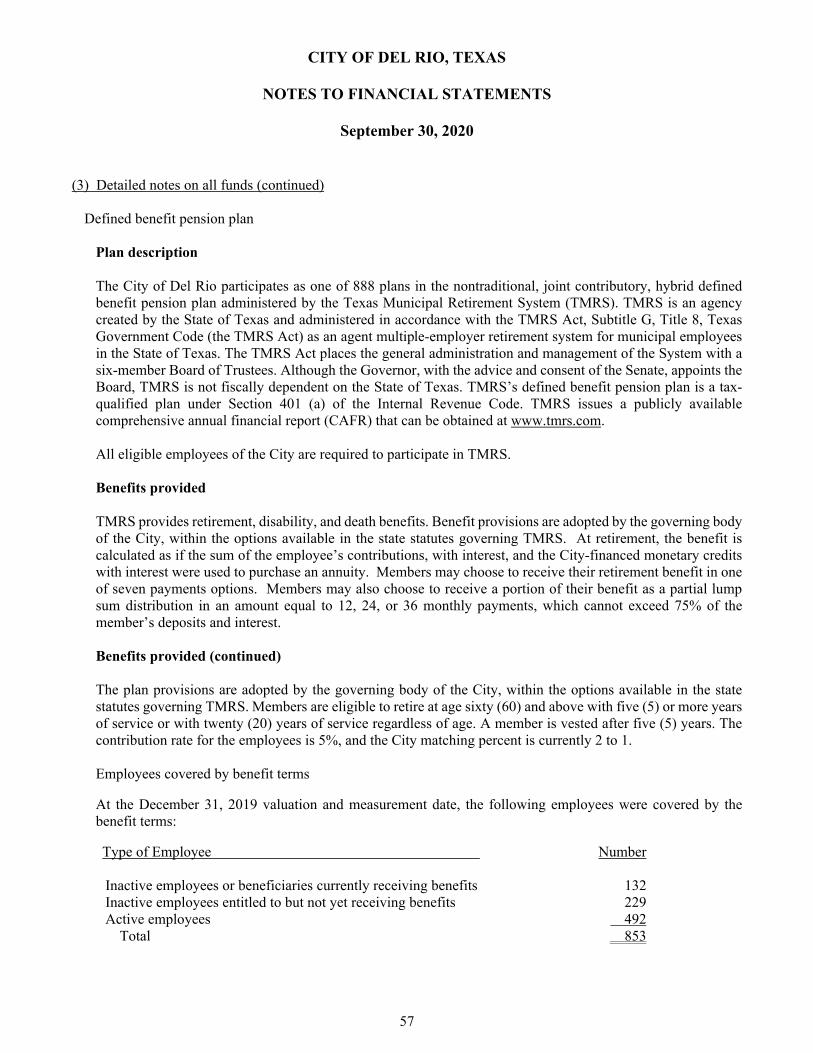
CITY OF DEL RIO, TEXAS
NOTES TO FINANCIAL STATEMENTS
September 30, 2020
57
(3) Detailed notes on all funds (continued) Defined benefit pension plan
Plan description The City of Del Rio participates as one of 888 plans in the nontraditional, joint contributory, hybrid defined benefit pension plan administered by the Texas Municipal Retirement System (TMRS). TMRS is an agency created by the State of Texas and administered in accordance with the TMRS Act, Subtitle G, Title 8, Texas Government Code (the TMRS Act) as an agent multiple-employer retirement system for municipal employees in the State of Texas. The TMRS Act places the general administration and management of the System with a six-member Board of Trustees. Although the Governor, with the advice and consent of the Senate, appoints the Board, TMRS is not fiscally dependent on the State of Texas. TMRS’s defined benefit pension plan is a tax-qualified plan under Section 401 (a) of the Internal Revenue Code. TMRS issues a publicly available comprehensive annual financial report (CAFR) that can be obtained at www.tmrs.com. All eligible employees of the City are required to participate in TMRS. Benefits provided TMRS provides retirement, disability, and death benefits. Benefit provisions are adopted by the governing body of the City, within the options available in the state statutes governing TMRS. At retirement, the benefit is calculated as if the sum of the employee’s contributions, with interest, and the City-financed monetary credits with interest were used to purchase an annuity. Members may choose to receive their retirement benefit in one of seven payments options. Members may also choose to receive a portion of their benefit as a partial lump sum distribution in an amount equal to 12, 24, or 36 monthly payments, which cannot exceed 75% of the member’s deposits and interest. Benefits provided (continued)
The plan provisions are adopted by the governing body of the City, within the options available in the state statutes governing TMRS. Members are eligible to retire at age sixty (60) and above with five (5) or more years of service or with twenty (20) years of service regardless of age. A member is vested after five (5) years. The contribution rate for the employees is 5%, and the City matching percent is currently 2 to 1. Employees covered by benefit terms At the December 31, 2019 valuation and measurement date, the following employees were covered by the benefit terms: Type of Employee Number
Inactive employees or beneficiaries currently receiving benefits 132 Inactive employees entitled to but not yet receiving benefits 229 Active employees 492
Total 853
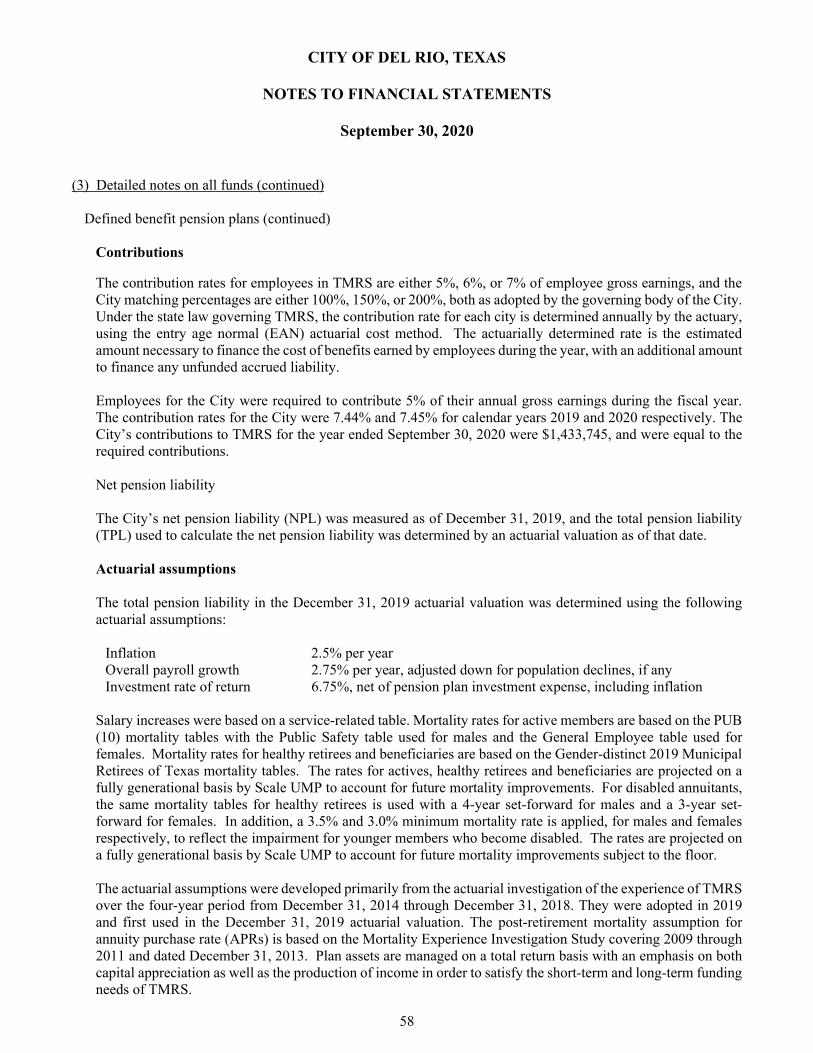
CITY OF DEL RIO, TEXAS
NOTES TO FINANCIAL STATEMENTS
September 30, 2020
58
(3) Detailed notes on all funds (continued) Defined benefit pension plans (continued)
Contributions The contribution rates for employees in TMRS are either 5%, 6%, or 7% of employee gross earnings, and the City matching percentages are either 100%, 150%, or 200%, both as adopted by the governing body of the City. Under the state law governing TMRS, the contribution rate for each city is determined annually by the actuary, using the entry age normal (EAN) actuarial cost method. The actuarially determined rate is the estimated amount necessary to finance the cost of benefits earned by employees during the year, with an additional amount to finance any unfunded accrued liability. Employees for the City were required to contribute 5% of their annual gross earnings during the fiscal year. The contribution rates for the City were 7.44% and 7.45% for calendar years 2019 and 2020 respectively. The City’s contributions to TMRS for the year ended September 30, 2020 were $1,433,745, and were equal to the required contributions. Net pension liability The City’s net pension liability (NPL) was measured as of December 31, 2019, and the total pension liability (TPL) used to calculate the net pension liability was determined by an actuarial valuation as of that date.
Actuarial assumptions The total pension liability in the December 31, 2019 actuarial valuation was determined using the following actuarial assumptions:
Inflation 2.5% per year Overall payroll growth 2.75% per year, adjusted down for population declines, if any Investment rate of return 6.75%, net of pension plan investment expense, including inflation
Salary increases were based on a service-related table. Mortality rates for active members are based on the PUB (10) mortality tables with the Public Safety table used for males and the General Employee table used for females. Mortality rates for healthy retirees and beneficiaries are based on the Gender-distinct 2019 Municipal Retirees of Texas mortality tables. The rates for actives, healthy retirees and beneficiaries are projected on a fully generational basis by Scale UMP to account for future mortality improvements. For disabled annuitants, the same mortality tables for healthy retirees is used with a 4-year set-forward for males and a 3-year set-forward for females. In addition, a 3.5% and 3.0% minimum mortality rate is applied, for males and females respectively, to reflect the impairment for younger members who become disabled. The rates are projected on a fully generational basis by Scale UMP to account for future mortality improvements subject to the floor. The actuarial assumptions were developed primarily from the actuarial investigation of the experience of TMRS over the four-year period from December 31, 2014 through December 31, 2018. They were adopted in 2019 and first used in the December 31, 2019 actuarial valuation. The post-retirement mortality assumption for annuity purchase rate (APRs) is based on the Mortality Experience Investigation Study covering 2009 through 2011 and dated December 31, 2013. Plan assets are managed on a total return basis with an emphasis on both capital appreciation as well as the production of income in order to satisfy the short-term and long-term funding needs of TMRS.

CITY OF DEL RIO, TEXAS
NOTES TO FINANCIAL STATEMENTS
September 30, 2020
59
(3) Detailed notes on all funds (continued) Defined benefit pension plans (continued)
Net pension liability (continued) The long-term expected rate of return on pension plan investments was determined using a building-block method in which best estimate ranges of expected future real rates of return (expected returns, net of pension plan investment expense and inflation) are developed for each major asset class. These ranges are combined to produce the long-term expected rate of return by weighting the expected future real rates of return by the target asset allocation percentage and by adding expected inflation. In determining their best estimate of a recommended investment return assumption under the various alternative asset allocation portfolios, GRS focused on the area between (1) arithmetic mean (aggressive) without an adjustment for time (conservative) and (2) the geometric mean (conservative) with an adjustment for time (aggressive). The target allocation and best estimates of arithmetic real rates of return for each major asset class are summarized in the following table:
LONG-TERM
EXPECTED REAL
TARGET RATE OF RETURN
ASSET CLASS ALLOCATION (ARITHMETIC)
Global equity 30.0% 5.30%Core fixed income 10.0% 1.25%Non-core fixed income 20.0% 4.14%Real return 10.0% 3.85%Real estate 10.0% 4.00%Absolute return 10.0% 3.48%Private equity 10.0% 7.75%
Total 100.0% Discount rate The discount rate used to measure the total pension asset was 6.75%. The projection of cash flows used to determine the discount rate assumed that employee and employer contributions will be made at the rates specified in statute. Based on that assumption, the pension plan’s fiduciary net position was projected to be available to make all projected future benefit payments of current active and inactive employees. Therefore, the long-term expected rate of return on pension plan investments was applied to all periods of projected benefit payments to determine the total pension liability.

CITY OF DEL RIO, TEXAS
NOTES TO FINANCIAL STATEMENTS
September 30, 2020
60
(3) Detailed notes on all funds (continued) Defined benefit pension plans (continued)
Net pension liability (continued) Changes in the net pension liability
Total Pension Plan Fiduciary Net Pension
Liability Net Position Liability
(a) (b) (a) - (b)
Balance at December 31, 2018 34,485,371$ 23,729,810$ 10,755,561$
Changes for the year:
Service cost 1,658,801 - 1,658,801
Interest 2,333,586 - 2,333,586
Change of benefit terms - - -
Difference between expected and actual experience (69,221) - (69,221)
Changes of assumptions (25,972) - (25,972)
Contributions - employer - 1,420,011 (1,420,011)
Contributions - employee - 954,431 (954,431)
Net investment income - 3,672,358 (3,672,358)
Benefit payments, including refunds
of employee contributions (1,486,261) (1,486,261) -
Administrative expense - (20,729) 20,729
Other changes - (622) 622
Net changes 2,410,933 4,539,188 (2,128,255)
Balance at December 31, 2019 36,896,304$ 28,268,998$ 8,627,306$
Increase (Decrease)
Sensitivity of the net pension liability to changes in the discount rate
The following presents the net pension liability of the City, calculated using the discount rate of 6.75%, as well as what the City’s net pension liability would be if it were calculated using a discount rate that is 1-percentage-point lower (5.75%) or 1-percentage-point higher (7.75%) than the current rate:
1% Decrease in 1% Increase in Discount Rate Discount Rate Discount Rate
(5.75%) (6.75%) (7.75%)City's net pension liability 13,683,057$ 8,627,306$ 4,410,454$
Pension plan fiduciary net position Detailed information about the pension plan’s fiduciary net position is available in a separately-issued TMRS financial report. That report may be obtained on the Internet at www.tmrs.com.

CITY OF DEL RIO, TEXAS
NOTES TO FINANCIAL STATEMENTS
September 30, 2020
61
(3) Detailed notes on all funds (continued) Defined benefit pension plans (continued)
Net pension liability (continued)
Pension expense and deferred outflows of resources and deferred inflows of resources related to pensions
For the year ended September 30, 2020, the City recognized pension expense of $1,459,976.
At September 30, 2020, the City reported deferred outflows of resources and deferred inflows of resources related to pensions from the following sources: The above deferred outflow and deferred inflow of resources represent the combined primary government.
Deferred Outflows Deferred Inflowsof Resources of Resources
Difference between expected and actual economic expense -$ 424,960$ Changes in actuarial assumptions 209,393 21,144 Difference between projected and actual investment earnings - 848,843 Contributions to pension subsequent to the measurement date 1,036,872 -
Total 1,246,265$ 1,294,947$ The City reported $1,036,872 as deferred outflows of resources related to pensions resulting from contributions subsequent to the measurement date will be recognized as a reduction of the net pension liability for the year ending September 30, 2021. Other amounts reported as deferred outflows and inflows of resources related to pensions will be recognized in pension expense as follows:
September 30,2021 (221,023)$ 2022 (308,606) 2023 (63,313) 2024 (485,889) 2025 (6,723)
Thereafter -
Total (1,085,554)$
CITY OF DEL RIO, TEXAS
NOTES TO FINANCIAL STATEMENTS
September 30, 2020
62
(3) Detailed notes on all funds (continued) Other postemployment benefits other than pensions (OPEB)
Retiree Health Care Plan
Plan description The City of Del Rio administers a single-employer defined benefit OPEB plan, the “Retiree Health Plan”. The plan provides OPEB through the City’s group health insurance plan, which covers both active and retired members (see funding policy below). Contributions are established through City policy as approved by City Council. No assets are accumulated in a trust that meets the criteria in paragraph 4 of GASB Statement No. 75. The Retiree Health Plan does not issue a publicly available financial report. Normal retirement benefits For a retiree to quality for the City-paid health plan, a retiree must meet the following criteria: 1. City will continue to pay 100% of the employee cost for the retiree’s coverage.
2. Coverage will only be allowed for those employees being at least age 62 and having 25 years of service
with the City at the time they retire or, for those older than 62, any combination of age and years of service that equal the benchmark figure of 87 (e.g., 62 years of age and 25 years of service =87).
3. Coverage will be allowed to age 65 or when the retiree becomes eligible for Medicare or Medicaid.
Retirees wishing to continue dental coverage may do so at their own expense under COBRA. Retirees having dependent coverage have the option to continue the same dependent coverage if the retiree had his/her dependents on the plan prior to retirement. Premiums for dependents would remain the same as prior to retirement. Medicare eligibility The retiree health care ceases when the retiree becomes eligible for Medicare. The retiree health plan does not cover any Medicare premiums. If a retiree is not eligible for Medicare, the retiree health care continues until he/she turns 65 years old. An active employee who is Medicare-eligible will continue to have the employer health coverage as long as he/she remains an active employee. Benefits for spouses/dependents of eligible Spouses of all current and future retirees receive coverage only if the retiree had his/her spouse on the plan prior to retirement. Spouse coverage will continue up to when the spouse is 65 years old or Medicare eligible, whichever comes first. Spouse coverage will continue upon death of the retiree for 36 months through COBRA at the employee rate. Surviving spouses of deceased active members are not eligible for retiree health care benefits and a retiree cannot purchase coverage for beneficiaries. Dependents of all current and future retirees receive coverage only if the retiree had his/her dependents on the plan prior to retirement. There is no change in coverage. A dependent child is eligible to receive coverage until the age of 26 regardless if a full-time student.

CITY OF DEL RIO, TEXAS
NOTES TO FINANCIAL STATEMENTS
September 30, 2020
63
(3) Detailed notes on all funds (continued) Other postemployment benefits other than pensions (OPEB) (Continued)
Retiree Health Care Plan (continued)
Benefits for spouses/dependents of eligible (continued) All benefits remain the same for the retiree and dependents as was prior to retirement. The following are the rates for qualified retirees who wish to continue coverage for their dependents:
Coverage Medical Premium
Retiree Only -$
Retiree & Child (1) 177.57
Retiree & Children (2+) 355.14
Retiree & Spouse 386.95
Retiree & Family 743.76
Qualified Retiree
An employee who retires but does not qualify for the employer paid health coverage is offered the same health coverage under COBRA. Employees having dependent coverage have the option to continue the same dependent coverage under COBRA only if the employee had his/her dependents on the plan prior to leaving employment. Premiums for dependents would remain the same as prior to employment. The following are the rates for employees who wish to continue coverage for themselves or their dependents:
Coverage Medical Premium
Retiree Only 687.99$
Retiree & Child (1) 865.56
Retiree & Children (2+) 1,043.13
Retiree & Spouse 1,074.94
Retiree & Family 1,431.75
Nonqualified Retiree (COBRA)
Employees covered by benefit terms
At the December 31, 2019 valuation and measurement date, the following employees were covered by the benefit terms: Type of Employee Number
Retirees and beneficiaries 2 Inactive, nonretired members 0 Active employees 355
Total 357
CITY OF DEL RIO, TEXAS
NOTES TO FINANCIAL STATEMENTS
September 30, 2020
64
(3) Detailed notes on all funds (continued) Other postemployment benefits (OPEB) (continued)
Retiree Health Care Plan (continued)
Total OPEB liability The City’s total OPEB liability of $1,305,252 was measured as of December 31, 2019, and was determined by an actuarial valuation as of December 31, 2019. Actuarial assumptions: The total OPEB liability in the December 31, 2019 actuarial valuation was determined using the following actuarial assumptions and other inputs, applied to all periods included in the measurement, unless otherwise specified:
Valuation date: Deember 31, 2019
Methods and assumption used to determine contribution rates:
Actuarial cost method Individual Entry-Age Normal
Discount rate 2.75% as of December 31, 2019Inflation 2.50%Salary increases 3.5% to 11.50%, including inflation
Demographic assumptions Based on the experience study covering the four-year period ending December 31, 2018 as conducted for the Texas Municipal Retirement System (TMRS). For the OPEB valuation, the standard TMRS retirement rates were adjusted to reflect the impact of the City's retiree medical plan design.
Mortality For healthy retirees, the gender-distinct 2019 Municipal Retirees of Texas mortality tables are used. The rates are projected on a fully generational basis using the ultimate mortality improvement rates in the MP tables to account for future mortality improvements.
Health care trend rates Initial rate of 7.00% declining to an ultimate rate of 4.15% after 15 years
Participation rates 95% of retirees who qualify for the City's subsidy; 0% of those with coverage elect 2-person coverage.
Other information:
Notes The discount rate changed from 3.71% as of December 31, 2018 to 2.75% as of December 31, 2019. Additionally, the demographic assumptions were updated to reflect the 2019
CITY OF DEL RIO, TEXAS
NOTES TO FINANCIAL STATEMENTS
September 30, 2020
65
(3) Detailed notes on all funds (continued) Other postemployment benefits (OPEB) (continued)
Retiree Health Care Plan (continued) Changes in total OPEB liability
Balance at December 31, 2018 1,558,499$ Changes for the year:Service cost 81,910 Interest on the total OPEB liability 58,912 Changes of benefit terms - Difference between expected and actual experience (82,778) Change of assumptions (288,224) Benefit payments (23,067)
Net changes (253,247)
Balance at December 31, 2019 1,305,252$
There were no changes in benefit terms during the year. Changes of assumptions reflect a change in the discount rate from 3.71% as of December 31, 2018 to 2.75% as of December 31, 2019, revised TMRS demographic assumptions, updates to the health care trend assumption, and updates to the dependent coverage assumption. Sensitivity of the total OPEB liability to changes in the discount rate: Regarding the sensitivity of the total OPEB liability to changes in the discount rate, the following presents the plan’s total OPEB liability, calculated using a discount rate of 2.75%, as well as what the plan’s total OPEB liability would be if it were calculated using a discount rate that is one percent lower or one percent higher:
1% Decrease in 1% Increase in Discount Rate (1.75%) Discount Rate (2.75%) Discount Rate (3.75%)
Total OPEB liability 1,457,099$ 1,305,252$ 1,168,785$
Sensitivity of the total OPEB liability to the healthcare cost trend rate assumption: Regarding the sensitivity of the total OPEB liability to changes in the healthcare cost trend rates, the following presents the plan’s total OPEB liability, calculated using the assumed trend rates as well as what the plan’s total OPEB liability would be if it were calculated using a trend rate that is one percent lower or one percent higher:

CITY OF DEL RIO, TEXAS
NOTES TO FINANCIAL STATEMENTS
September 30, 2020
66
(3) Detailed notes on all funds (continued) Other postemployment benefits (OPEB) (continued)
Retiree Health Care Plan (continued)
Current Healthcare Cost
1% Decrease Trend Rate Assumption 1% Increase
1,126,715$ 1,305,252$ 1,522,760$
OPEB expense and deferred outflows of resources and deferred inflows of resources related to OPEB For the year ended September 30, 2020, the City recognized OPEB expense of $104,897 related to retiree healthcare. At September 30, 2020, the City reported deferred outflows of resources and deferred inflows of resources related to OPEB from the following sources:
Deferred Outflows Deferred Inflows
of Resources of Resources
Difference between expected and actual economic experience -$ 87,314$ Changes in actuarial assumptions 59,425 317,525 Difference between projected and actual investment earnings - - Contributions subsequent to the measurement date 17,300 -
Total 76,725$ 404,839$
The amount of $17,300 reported as deferred outflows of resources related to the OPEB resulting from contributions subsequent to the measurement date which will be recognized as a reduction of the OPEB liability for the year ended September 30, 2021. Other amounts reported as deferred outflows of resources and deferred inflows of resources related to OPEB will be recognized in OPEB expense as follows:
September 30,2021 (35,925)$ 2022 (35,925) 2023 (35,925) 2024 (35,925) 2025 (35,925)
Thereafter (165,789)
Total (345,414)$

CITY OF DEL RIO, TEXAS
NOTES TO FINANCIAL STATEMENTS
September 30, 2020
67
(3) Detailed notes on all funds (continued) Other postemployment benefits (OPEB) (continued)
Supplemental Death Benefits Fund (SDBF)
Plan description The City also participates in the single-employer defined benefit group-term life insurance plan operated by TMRS known as the Supplemental Death Benefits Fund (SDBF). The City elected, by ordinance, to provide group-term life insurance coverage to both current and retired employees. The City may terminate coverage under and discontinue participation in the SDBF by adopting an ordinance before November 1 of any year to be effective the following January 1. Benefits provided The death benefit for active employees provides a lump-sum payment approximately equal to the employee’s annual salary calculated based on the employee’s actual earnings, for the 12-month period preceding the month of death. Retired employees are insured for $7,500; this coverage is an “other postemployment benefit” or OPEB. As the SDBF covers both active and retiree participants, with no segregation of assets, the SDBF is considered to be an unfunded OPEB plan (i.e. no assets are accumulated).
Contributions The City contributes to the SDBF at a contractually required rate as determined by an annual actuarial valuation. The rate is equal to the cost of providing one-year term life insurance. The funding policy for the SDBF program is to assure that adequate resources are available to meet all death benefit payments for the upcoming year; the intent is not to pre-fund retiree term life insurance during employees’ entire careers.
The City contribution rate is equal to the cost of providing one-year term life insurance. The contribution rate for the City was 0.22% and 0.21% for calendar years 2020 and 2019, respectively. The City’s contributions to TMRS were $41,821 and $38,880 for the fiscal year ended September 30, 2020 and 2019, respectively, and were equal to the required contributions. Employees covered by benefit terms
At the December 31, 2019 valuation and measurement date, the following employees were covered by the benefit terms:
Inactive employees or beneficiaries currently receiving benefits 127 Inactive employees entitled to but not yet receiving benefits 39 Active employees 492 Total 658
OPEB liability
The City’s total OPEB liability of $1,175,922 was measured as of December 31, 2019, and was determined by an actuary valuation as of that date.

CITY OF DEL RIO, TEXAS
NOTES TO FINANCIAL STATEMENTS
September 30, 2020
68
(3) Detailed notes on all funds (continued) Other postemployment benefits (OPEB) (continued)
Supplemental Death Benefits Fund (SDBF) (continued) Actuary assumptions
The total OPEB liability in the December 31, 2019 actuarial valuation was determined using the following actuarial assumptions and other inputs, applied to all periods included in the measurement, unless otherwise specified: Inflation 2.50% Salary increases 3.50% to 11.5% including inflation Discount rate * 2.75% Retirees' share of benefit-related costs $0 Administrative expenses All administrative expenses are paid through the Pension Trust and accounted for under
reporting requirements under GASB Statement No. 68.
Mortality rates - service retirees 2019 Municipal Retirees of Texas Mortality Tables. The rates are projected on a fully generational basis with scale UMP.
Mortality rates - disabled retirees 2019 Municipal Retirees of Texas Mortality Tables with a 4 year set-forward for males and a 3 year set-forward for females. In addition, a 3.5% and 3% minimum mortality rate will be applied to reflect the impairment for younger members who become disabled for males and females, respectively. The rates are projected on a fully generational basis by Scale UMP to account for future mortality improvements subject to the floor.
* The discount rate was based on the Fidelity Index’s “20-Year Municipal GO AA Index” rate as of December 31, 2019. The actuarial assumptions used in the December 31, 2019 valuation were based on the results of an actuarial experience study for the period December 31, 2014 to December 31, 2018.
Changes in the total OPEB liability:
Balance at December 31, 2018 926,372$ Changes for the year:
Service cost 62,992 Interest on the total OPEB liability 35,431 Changes of benefit terms - Difference between expected and actual experience (33,627) Change of assumptions 190,481 Benefit payments (5,727)
Net changes 249,550
Balance at December 31, 2019 1,175,922$

CITY OF DEL RIO, TEXAS
NOTES TO FINANCIAL STATEMENTS
September 30, 2020
69
(3) Detailed notes on all funds (continued) Other postemployment benefits (OPEB) (continued)
Supplemental Death Benefits Fund (SDBF) (continued) Sensitivity of the total OPEB liability to changes in the discount rate:
The following presents the total OPEB liability of the City, calculated using the discount rate of 2.75%, as well as what the City’s OPEB liability would be if it were calculated using a discount rate that is 1-percentage-point lower (1.75%) or 1-percentage-point higher (3.75%) than the current rate:
1% Decrease in 1% Increase in
Discount Rate (1.75%) Discount Rate (2.75%) Discount Rate (3.75%)
1,412,016$ 1,175,922$ 989,052$
OPEB expenses, deferred outflows of resources and deferred inflows of resources related to OPEB
For the year ended September 30, 2020, the City recognized OPEB expense of $118,946. At September 30, 2020, the City reported deferred outflows of resources and deferred inflows of resources related to OPEB from the following sources:
Deferred Outflows Deferred Inflowsof Resources of Resources
Difference between expected and actual economic experience -$ 44,970$ Changes in actuarial assumptions 205,675 47,846 Difference between projected and actual investment earnings - - Contributions subsequent to the measurement date 4,175 -
Total 209,850$ 92,816$
The City reported $4,175 as deferred outflows of resources related to the OPEB liability resulting from contributions subsequent to the measurement date will be recognized as a reduction of the OPEB liability for the year ending September 30, 2021. Other amounts reported as deferred outflows and inflows of resources related to the OPEB liability will be recognized in OPEB expenses as follows:
September 30,2021 20,523$ 2022 20,523 2023 20,523 2024 20,523 2025 12,018
Thereafter 18,749
Total 112,859$

CITY OF DEL RIO, TEXAS
NOTES TO FINANCIAL STATEMENTS
September 30, 2020
70
(3) Detailed notes on all funds (continued)
Deficit net position/fund balances
The following funds have deficit net position/fund balances:
AmountNonmajor special revenue funds
Section 5311 grant (1,209,142)$ Women, Infant, Children (23,450) Nutrition and social services (1,969) TxDOT VCR grant (36,037) TxDOT Section 5310 grant (8,971)
Nonmajor capital projects fundsAnimal shelter (71,520) Fire station (2,972)
Internal service fundsFleet maintenance (656,504) Health claims self-insurance (172,538)
Total deficit net position/fund balance (2,183,103)$ Subsidies from the general fund will be used to reduce deficits for the Section 5311 grants and other special revenue and capital projects funds. Normal operations and reductions in transfers to other funds for purchases of fleet vehicles will reduce the deficit in the fleet services fund. Health claims deficit will be offset with future rate adjustment charges to other funds.
Prior period adjustment
During fiscal year 2020, the City performed a review of its capital assets to properly inventory all assets maintained by the City as well as a review of the allocations of long-term debt obligations between proprietary funds based on how the funds were issued and spent. The result was a decrease to governmental activities of $30,279,515, and a decrease to the business-type activities of $16,061,975. The general fund was restated by $(1,412,519) for various receivables that been collected in prior years but not recognized as being received. Nonmajor governmental funds were restated by $876,293 for a capital projects fund which had not be recognized in prior years.
CITY OF DEL RIO, TEXAS
NOTES TO FINANCIAL STATEMENTS
September 30, 2020
71
(3) Detailed notes on all funds (continued)
Commitments and contingencies
Construction commitments The total contractual commitment for construction in progress by project at September 30, 2020, is as follows:
Project Description Commitments
Government activityDR Community Sports Park 27,005$ Compactor (Holt) 95,900 TXCDBG #7218110 13,050 Rescue & Fire Fighting Vehicle 677,838 San Felipe Creekwalk Hazardous Areas Rehabilitation 21,300 San Felipe Golf Course Master Plan & Development 45,200 Alderete Lane Reconstruction 6,969 City Hall Design & Construction 135,547 Paul Poag Theatre Renovations 86,075
Total government activity 1,108,884
Business-type activityTreatment Plant Upgrades (Precision Pumps) 848,630 Feasibility Report WWP Assess & Impr (Tetra Tech) TWDB 591,963 Northside Sewer Line Project (Tetra Tech) 862,094 Wastewater Collection Lines 230,592 Water Treatment Plant Upgrades (All American Pumps) 320,531 SCADA 704,255 Water Treatment Plant Valve Upgrades 538,886 Water Pipeline Replacement, Phase 2 (Tetra Tech) 488,390 Design of Cell 6 226,113 Vertical Expansion & Closing of Cells 3 & 4 172,578 Closure of Cells 3 & 4 64,296 Landfill Lateral Expansion (75 acres) 401,901 Second Int'l Bridge Study 24,766 Two Lane Roadway at Bridge 3,937 Int'l Bridge Mill & Overlay 13,624
Total business-type activity 5,492,556
Total commitments 6,601,440$
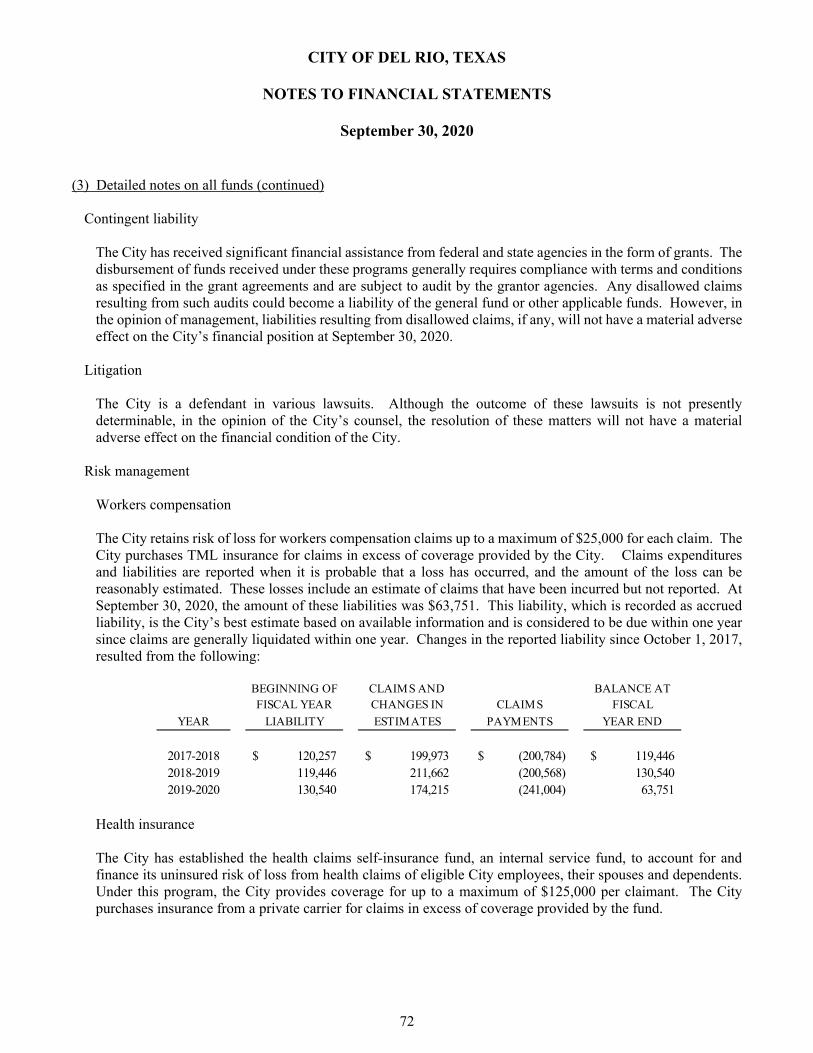
CITY OF DEL RIO, TEXAS
NOTES TO FINANCIAL STATEMENTS
September 30, 2020
72
(3) Detailed notes on all funds (continued)
Contingent liability The City has received significant financial assistance from federal and state agencies in the form of grants. The disbursement of funds received under these programs generally requires compliance with terms and conditions as specified in the grant agreements and are subject to audit by the grantor agencies. Any disallowed claims resulting from such audits could become a liability of the general fund or other applicable funds. However, in the opinion of management, liabilities resulting from disallowed claims, if any, will not have a material adverse effect on the City’s financial position at September 30, 2020.
Litigation
The City is a defendant in various lawsuits. Although the outcome of these lawsuits is not presently determinable, in the opinion of the City’s counsel, the resolution of these matters will not have a material adverse effect on the financial condition of the City.
Risk management
Workers compensation The City retains risk of loss for workers compensation claims up to a maximum of $25,000 for each claim. The City purchases TML insurance for claims in excess of coverage provided by the City. Claims expenditures and liabilities are reported when it is probable that a loss has occurred, and the amount of the loss can be reasonably estimated. These losses include an estimate of claims that have been incurred but not reported. At September 30, 2020, the amount of these liabilities was $63,751. This liability, which is recorded as accrued liability, is the City’s best estimate based on available information and is considered to be due within one year since claims are generally liquidated within one year. Changes in the reported liability since October 1, 2017, resulted from the following:
BEGINNING OF CLAIMS AND BALANCE ATFISCAL YEAR CHANGES IN CLAIMS FISCAL
YEAR LIABILITY ESTIMATES PAYMENTS YEAR END
2017-2018 120,257$ 199,973$ (200,784)$ 119,446$ 2018-2019 119,446 211,662 (200,568) 130,540 2019-2020 130,540 174,215 (241,004) 63,751
Health insurance The City has established the health claims self-insurance fund, an internal service fund, to account for and finance its uninsured risk of loss from health claims of eligible City employees, their spouses and dependents. Under this program, the City provides coverage for up to a maximum of $125,000 per claimant. The City purchases insurance from a private carrier for claims in excess of coverage provided by the fund.

CITY OF DEL RIO, TEXAS
NOTES TO FINANCIAL STATEMENTS
September 30, 2020
73
(3) Detailed notes on all funds (continued) Risk management (continued)
Health insurance (continued) All departments participate in these programs and make payments to the self-insurance fund based on management’s estimates of the amounts needed to pay current year claims. The claims liabilities of $340,362 for the health claims self-insurance fund are based on the requirement that a liability for claims be reported if information prior to the issuance of the financial statements indicates that it is probable that a liability has been incurred at the date of the financial statements and the amount of the loss can be reasonably estimated. Health insurance claims are not considered long-term liabilities and, accordingly are not included in the changes in long-term debt disclosure. Health claims are generally liquidated within one year. Change in claims payable for the last three years were as follows:
BEGINNING OF CLAIMS AND BALANCE AT AMOUNT DUE
FISCAL YEAR CHANGES IN CLAIMS FISCAL WITHIN
YEAR LIABILITY ESTIMATES PAYMENTS YEAR END ONE YEAR
2017-2018 643,862$ 3,441,129$ (3,517,488)$ 567,503$ 567,503$
2018-2019 567,503 2,837,506 (3,101,553) 303,456 303,456
2019-2020 303,456 2,149,844 (2,112,938) 340,362 340,362
Tort claims and insurance The City is exposed to various risks of loss related to torts; theft of, damage to, and destruction of assets; errors and omissions; injuries to employees; and natural disasters. The City accounts for these risk management operations in its general fund. The City participates in the Texas Municipal League Intergovernmental Risk Pool Insurance Program. The City is a member of the Texas Municipal League (TML), an unincorporated association of political subdivisions of the State of Texas. The TML is not intended to operate as an insurance company, but rather is intended to be a contracting mechanism, which the City, as a member, utilizes to administer its self-insurance program. Under this program, the City retains risk for up to a maximum of $1,000 for each genera l liability claim, $10,000 for each property damage claim, $2,500 for law enforcement liability, $2,500 for errors and omissions liability, $500 each vehicle and $10,000 each occurrence for automobile physical damage, $1,000 for each automobile liability claim, $5,000 for public employee dishonesty loss, $5,000 for forgery or alteration liability, $5,000 for theft disappearance and destruction, $2,500 for cyber and data breach liability, $1,000 for boiler and machinery loss, and $500 for mobile equipment loss. Settled claims have not exceeded this coverage in any of the past three (3) fiscal years.


REQUIRED SUPPLEMENTARY INFORMATION


CITY OF DEL RIO, TEXAS
SCHEDULE OF REVENUES, EXPENDITURES AND CHANGES IN FUND BALANCE BUDGET AND ACTUAL – GENERAL FUND
For the year ended September 30, 2020
77
VARIANCE WITH
FINAL BUDGET -
2020 ACTUAL POSITIVE
ORIGINAL FINAL GAAP BASIS (NEGATIVE)
REVENUES
Taxes:
Property taxes 5,316,200$ 5,390,000$ 5,282,646$ (107,354)$
General sales and use taxes 6,112,893 6,172,600 6,540,230 367,630 Franchise tax 1,970,000 2,036,770 2,232,089 195,319
Penalty and interest on taxes 209,000 250,000 315,472 65,472
Licenses and permits 436,400 524,000 581,335 57,335
Intergovernmental revenue and grants 16,000 282,800 1,624,451 1,341,651
Charges for services 782,600 606,300 699,618 93,318
Fines and forfeitures 391,550 281,700 272,386 (9,314)
Investment earnings 223,881 150,000 115,204 (34,796)
Rents and royalties 59,250 45,700 47,543 1,843
Other revenue 15,500 198,000 292,354 94,354
Total revenues 15,533,274 15,937,870 18,003,328 2,065,458
EXPENDITURES
Current:
General government 5,336,002$ 5,071,945$ 5,042,361$ 29,584$
Public safety 13,512,745 12,937,625 12,796,541 141,084
Public works:
Highway and streets 2,238,756 2,064,700 2,033,177 31,523
Culture and recreation 2,362,236 2,107,200 2,047,869 59,331
Capital outlay:
Capital outlay 79,930 80,500 221,163 (140,663)
Total expenditures 23,529,669 22,261,970 22,141,111 120,859
Excess (deficiency) of revenues
over (under) expenditures (7,996,395) (6,324,100) (4,137,783) 1,944,599
OTHER FINANCING SOURCES (USES)
Sale of real and personal property 7,500 - 650 650
Transfers in 10,208,622 8,549,700 9,203,507 653,807
Transfers out (2,777,434) (2,264,700) (1,949,708) 314,992
Total other financing
sources (uses) 7,438,688 6,285,000 7,254,449 969,449
Net change in fund balance (557,707) (39,100) 3,116,666 2,914,048
FUND BALANCE - BEGINNING 19,691,234 19,691,234 19,691,234 -
Prior period adjustment - - (1,412,519) (1,412,519)
FUND BALANCES - BEGINNING, AS RESTATED 19,691,234 19,691,234 18,278,715 (1,412,519)
FUND BALANCE - ENDING 19,133,527$ 19,652,134$ 21,395,381$ 1,501,529$
BUDGETED AMOUNTS
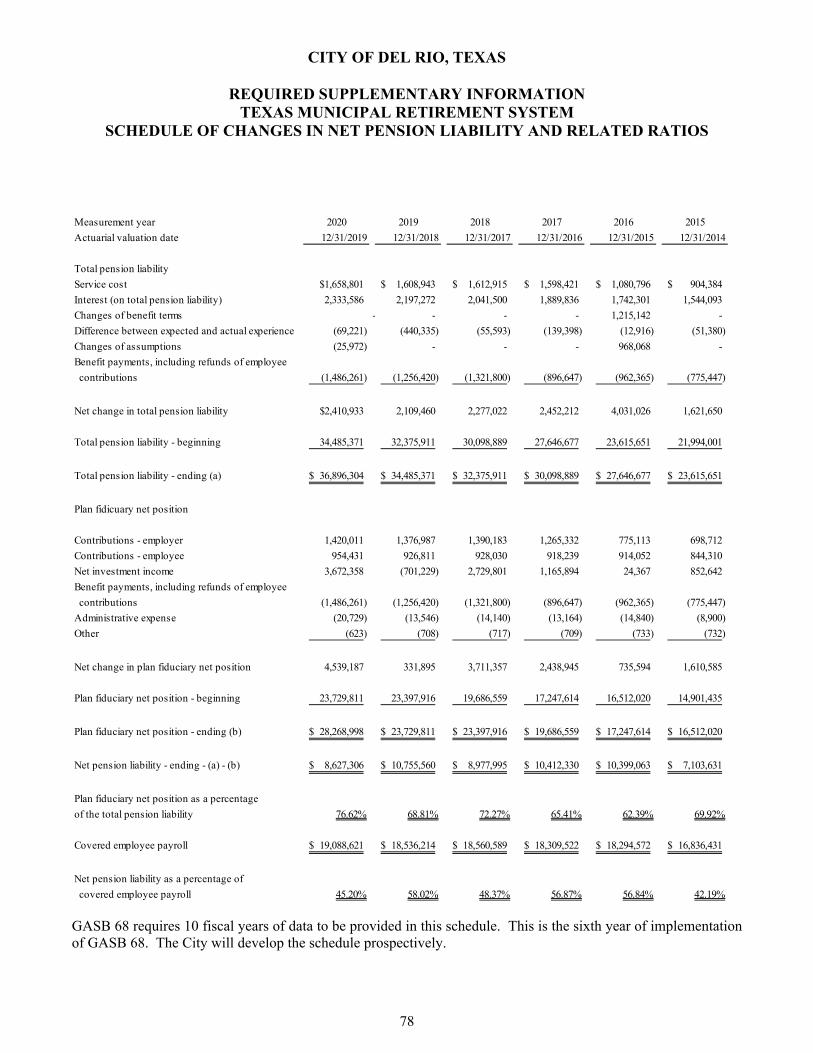
CITY OF DEL RIO, TEXAS
REQUIRED SUPPLEMENTARY INFORMATION TEXAS MUNICIPAL RETIREMENT SYSTEM
SCHEDULE OF CHANGES IN NET PENSION LIABILITY AND RELATED RATIOS
78
Measurement year 2020 2019 2018 2017 2016 2015
Actuarial valuation date 12/31/2019 12/31/2018 12/31/2017 12/31/2016 12/31/2015 12/31/2014
Total pension liability
Service cost $1,658,801 1,608,943$ 1,612,915$ 1,598,421$ 1,080,796$ 904,384$
Interest (on total pension liability) 2,333,586 2,197,272 2,041,500 1,889,836 1,742,301 1,544,093
Changes of benefit terms - - - - 1,215,142 -
Difference between expected and actual experience (69,221) (440,335) (55,593) (139,398) (12,916) (51,380)
Changes of assumptions (25,972) - - - 968,068 -
Benefit payments, including refunds of employee
contributions (1,486,261) (1,256,420) (1,321,800) (896,647) (962,365) (775,447)
Net change in total pension liability $2,410,933 2,109,460 2,277,022 2,452,212 4,031,026 1,621,650
Total pension liability - beginning 34,485,371 32,375,911 30,098,889 27,646,677 23,615,651 21,994,001
Total pension liability - ending (a) 36,896,304$ 34,485,371$ 32,375,911$ 30,098,889$ 27,646,677$ 23,615,651$
Plan fidicuary net position
Contributions - employer 1,420,011 1,376,987 1,390,183 1,265,332 775,113 698,712
Contributions - employee 954,431 926,811 928,030 918,239 914,052 844,310
Net investment income 3,672,358 (701,229) 2,729,801 1,165,894 24,367 852,642
Benefit payments, including refunds of employee
contributions (1,486,261) (1,256,420) (1,321,800) (896,647) (962,365) (775,447)
Administrative expense (20,729) (13,546) (14,140) (13,164) (14,840) (8,900)
Other (623) (708) (717) (709) (733) (732)
Net change in plan fiduciary net position 4,539,187 331,895 3,711,357 2,438,945 735,594 1,610,585
Plan fiduciary net position - beginning 23,729,811 23,397,916 19,686,559 17,247,614 16,512,020 14,901,435
Plan fiduciary net position - ending (b) 28,268,998$ 23,729,811$ 23,397,916$ 19,686,559$ 17,247,614$ 16,512,020$
Net pension liability - ending - (a) - (b) 8,627,306$ 10,755,560$ 8,977,995$ 10,412,330$ 10,399,063$ 7,103,631$
Plan fiduciary net position as a percentage
of the total pension liability 76.62% 68.81% 72.27% 65.41% 62.39% 69.92%
Covered employee payroll 19,088,621$ 18,536,214$ 18,560,589$ 18,309,522$ 18,294,572$ 16,836,431$
Net pension liability as a percentage of
covered employee payroll 45.20% 58.02% 48.37% 56.87% 56.84% 42.19%
GASB 68 requires 10 fiscal years of data to be provided in this schedule. This is the sixth year of implementation of GASB 68. The City will develop the schedule prospectively.
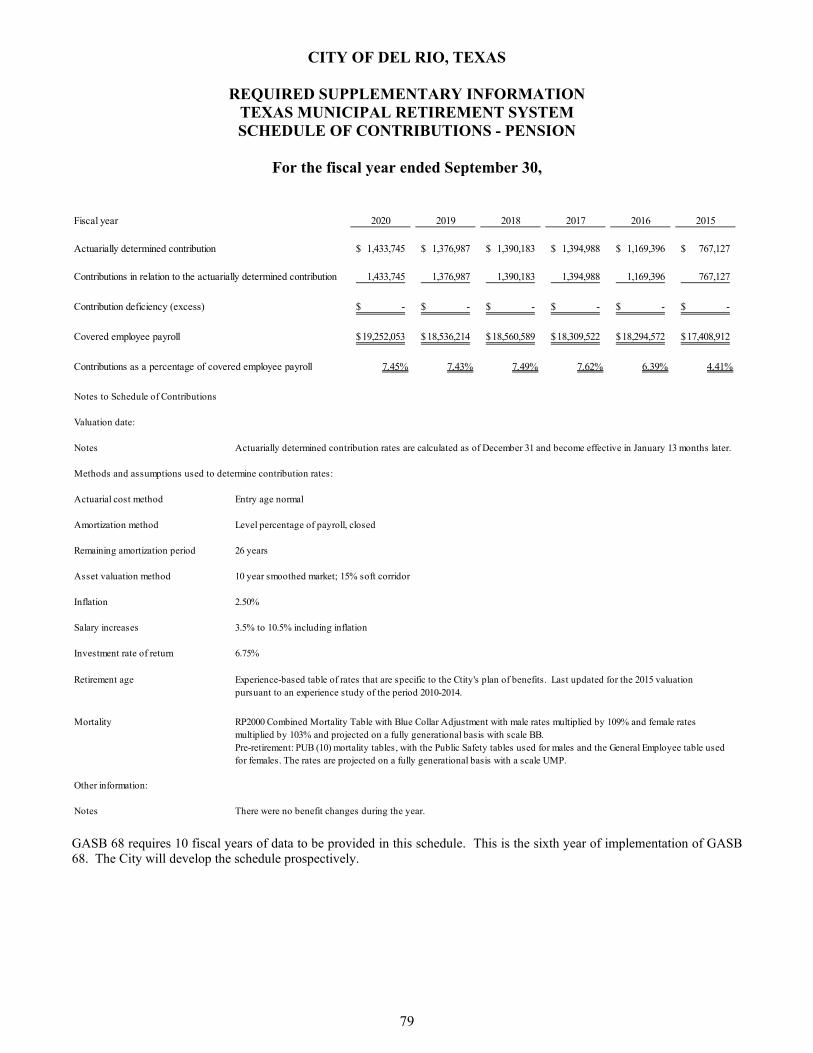
CITY OF DEL RIO, TEXAS
REQUIRED SUPPLEMENTARY INFORMATION TEXAS MUNICIPAL RETIREMENT SYSTEM SCHEDULE OF CONTRIBUTIONS - PENSION
For the fiscal year ended September 30,
79
Fiscal year 2020 2019 2018 2017 2016 2015
Actuarially determined contribution 1,433,745$ 1,376,987$ 1,390,183$ 1,394,988$ 1,169,396$ 767,127$
Contributions in relation to the actuarially determined contribution 1,433,745 1,376,987 1,390,183 1,394,988 1,169,396 767,127
Contribution deficiency (excess) -$ -$ -$ -$ -$ -$
Covered employee payroll 19,252,053$ 18,536,214$ 18,560,589$ 18,309,522$ 18,294,572$ 17,408,912$
Contributions as a percentage of covered employee payroll 7.45% 7.43% 7.49% 7.62% 6.39% 4.41% Notes to Schedule of Contributions
Valuation date:
Notes Actuarially determined contribution rates are calculated as of December 31 and become effective in January 13 months later.
Methods and assumptions used to determine contribution rates:
Actuarial cost method Entry age normal
Amortization method Level percentage of payroll, closed
Remaining amortization period 26 years
Asset valuation method 10 year smoothed market; 15% soft corridor
Inflation 2.50%
Salary increases 3.5% to 10.5% including inflation
Investment rate of return 6.75%
Retirement age Experience-based table of rates that are specific to the Ctity's plan of benefits. Last updated for the 2015 valuation pursuant to an experience study of the period 2010-2014.
Mortality RP2000 Combined Mortality Table with Blue Collar Adjustment with male rates multiplied by 109% and female rates multiplied by 103% and projected on a fully generational basis with scale BB.Pre-retirement: PUB (10) mortality tables, with the Public Safety tables used for males and the General Employee table used for females. The rates are projected on a fully generational basis with a scale UMP.
Other information:
Notes There were no benefit changes during the year. GASB 68 requires 10 fiscal years of data to be provided in this schedule. This is the sixth year of implementation of GASB 68. The City will develop the schedule prospectively.

CITY OF DEL RIO, TEXAS
REQUIRED SUPPLEMENTARY INFORMATION TEXAS MUNICIPAL RETIREMENT SYSTEM
SCHEDULE OF CHANGES IN OTHER POSTEMPLOYMENT BENEFIT LIABILITY (OPEB) AND RELATED RATIOS – SUPPLEMENTAL DEATH BENEFIT FUND
For the fiscal year ended September 30,
80
2019 2018 2017
Total OPEB liability
Service cost 62,992$ 68,584$ 59,394$
Interest (on the total OPEB liability) 35,431 31,487 29,777
Changes of benefit terms - - -
Difference between expected and actual experience (33,627) (22,470) -
Change of assumptions 190,481 (66,356) 73,455
Benefit payments ** (5,727) (3,707) (3,712)
Net change in total OPEB liability 249,550 7,538 158,914
Total OPEB liability - beginning 926,372 918,834 759,920
Total OPEB liability - ending 1,175,922$ 926,372$ 918,834$
Covered payroll 19,252,053$ 18,536,214$ 18,560,589$
OPEB liability as a percentage
of total covered payroll 6.11% 5.00% 4.95%

CITY OF DEL RIO, TEXAS
REQUIRED SUPPLEMENTARY INFORMATION TEXAS MUNICIPAL RETIREMENT SYSTEM
SCHEDULE OF CONTRIBUTIONS – SUPPLEMENAL DEATH BENEFIT FUND
For the fiscal year ended September 30,
81
Fiscal year 2020 2019
Actuarially determined contribution 41,821$ 38,880$
Contributions in relation to the actuarially determined contribution 41,821 38,880
Contribution deficiency (excess) -$ -$
Covered employee payroll 19,252,053$ 18,536,214$
Contributions as a percentage of covered employee payroll 0.22% 0.21%
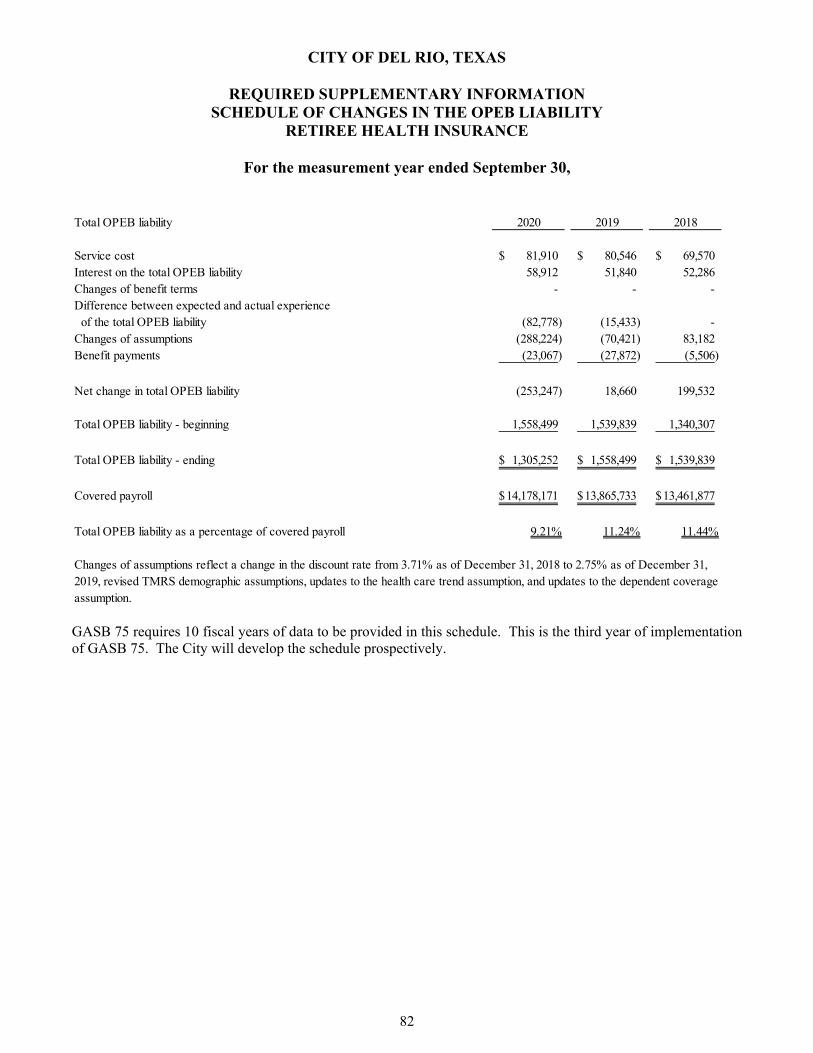
CITY OF DEL RIO, TEXAS
REQUIRED SUPPLEMENTARY INFORMATION SCHEDULE OF CHANGES IN THE OPEB LIABILITY
RETIREE HEALTH INSURANCE
For the measurement year ended September 30,
82
Total OPEB liability 2020 2019 2018
Service cost 81,910$ 80,546$ 69,570$ Interest on the total OPEB liability 58,912 51,840 52,286 Changes of benefit terms - - - Difference between expected and actual experience of the total OPEB liability (82,778) (15,433) - Changes of assumptions (288,224) (70,421) 83,182 Benefit payments (23,067) (27,872) (5,506)
Net change in total OPEB liability (253,247) 18,660 199,532
Total OPEB liability - beginning 1,558,499 1,539,839 1,340,307
Total OPEB liability - ending 1,305,252$ 1,558,499$ 1,539,839$
Covered payroll 14,178,171$ 13,865,733$ 13,461,877$
Total OPEB liability as a percentage of covered payroll 9.21% 11.24% 11.44%
Changes of assumptions reflect a change in the discount rate from 3.71% as of December 31, 2018 to 2.75% as of December 31, 2019, revised TMRS demographic assumptions, updates to the health care trend assumption, and updates to the dependent coverage assumption.
GASB 75 requires 10 fiscal years of data to be provided in this schedule. This is the third year of implementation of GASB 75. The City will develop the schedule prospectively.
OTHER SUPPLEMENTARY INFORMATION

CITY OF DEL RIO, TEXAS
COMBINING BALANCE SHEET NONMAJOR GOVERNMENTAL FUNDS
September 30, 2020
84
SECTION 5311 WOMEN INFANT NUTRITION AND
GRANT CHILDREN SOCIAL SERVICES ROOM TAX PEG CHANNEL
ASSETS
Cash and cash equivalents 23,922$ 15,654$ 18,066$ 315,411$ 9,273$
Taxes receivable, net - - - 71,154 -
Receivables, net - - - - -
Special assessment receivables, net - - - - -
Due from other governments 345,068 93,357 184,086 - -
Due from other funds - 46,707 22,472 - 213,128
Inventories - - - - -
Prepaid items - - - - -
Restricted cash:
Cash and cash equivalents - - - - -
Total assets 368,990$ 155,718$ 224,624$ 386,565$ 222,401$
LIABILITIES AND FUND BALANCES
Liabilities:
Accounts payable 39,129$ 32,044$ 28,363$ 58,768$ 25,786$
Wages and salaries payable - - - - -
Accrued liabilities - - - - -
Retainage payable - - - - -
Payable to other governments - - - - -
Due to others 500 - - - -
Due to other funds 1,538,031 147,124 198,001 - -
Other payables 472 - 229 - -
Total liabilities 1,578,132 179,168 226,593 58,768 25,786
Fund balances
Nonspendable fund balance:
Inventories - - - - -
Prepaid items - - - - -
Restricted fund balance:
Capital acquisition and contractual
obligations - - - - -
Special purpose - - - 327,797 196,615
Committed fund balance:
Self-insurance - - - - -
Assigned fund balance:
Construction - - - - -
Other assigned fund balance - - - - -
Unassigned fund balance (1,209,142) (23,450) (1,969) - -
Total fund balances (1,209,142) (23,450) (1,969) 327,797 196,615
Total liabilities and fund balances 368,990$ 155,718$ 224,624$ 386,565$ 222,401$
NONMAJOR SPECIAL REVENUE FUNDS

85
RESTRICTIVE CARES ACT PROPERTY AND LAW ENFORCEMENT TXDOT VCR TXDOT SECTION
COURT GRANT LOAN FOREFEITURE CONT. ED. GRANT 5310
34,823$ 111,652$ -$ 35,514$ 686$ -$ -$
- - - - - - -
- - - - - - -
- - - - - - -
- 251,770 - - - 18,000 -
- - - 108 8,712 - -
- - - - - - -
- - - - - - -
- - - - - - -
34,823$ 363,422$ -$ 35,622$ 9,398$ 18,000$ -$
-$ 104,484$ -$ 4,700$ -$ -$ -$
- - - - - - -
- - - - - - -
- - - - - - -
- - - - - - -
- - - - - 44,188 -
- 66,891 - - - 9,849 8,971
- - - - - - -
- 171,375 - 4,700 - 54,037 8,971
- - - - - - -
- - - - - - -
- - - - - - -
34,823 192,047 - 30,922 9,398 - -
- - - - - - -
- - - - - - -
- - - - - - -
- - - - - (36,037) (8,971)
34,823 192,047 - 30,922 9,398 (36,037) (8,971)
34,823$ 363,422$ -$ 35,622$ 9,398$ 18,000$ -$
NONMAJOR SPECIAL REVENUE FUNDS
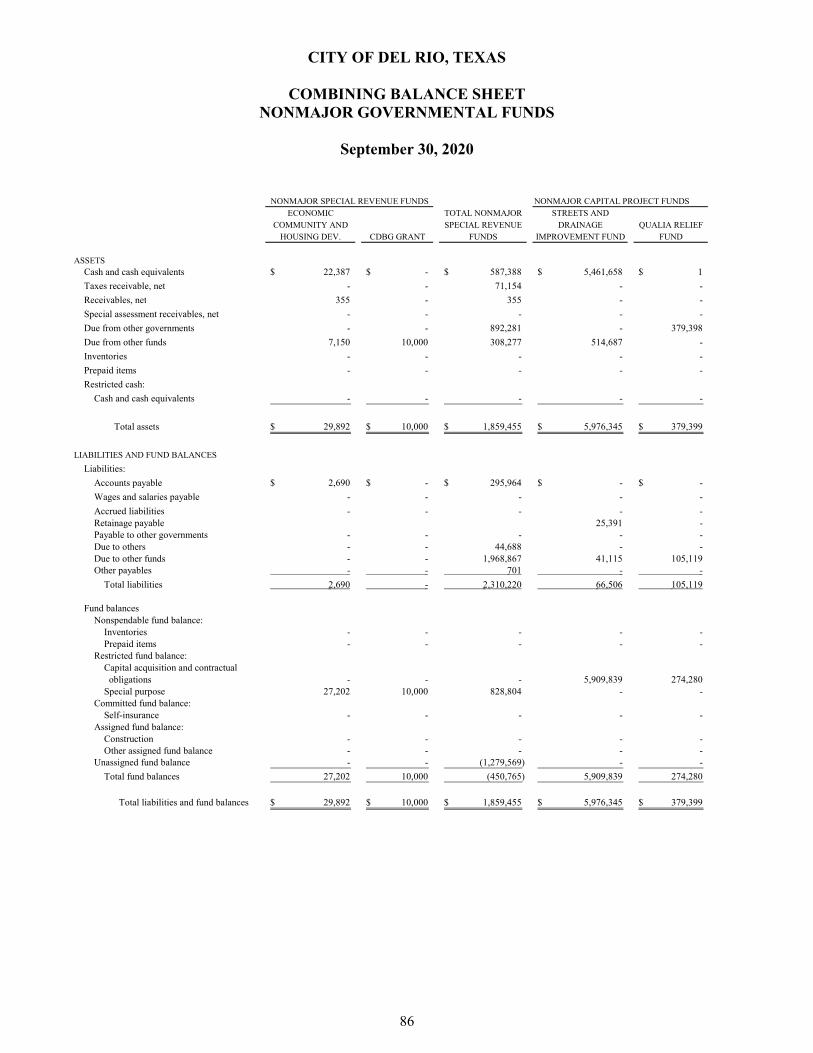
CITY OF DEL RIO, TEXAS
COMBINING BALANCE SHEET NONMAJOR GOVERNMENTAL FUNDS
September 30, 2020
86
NONMAJOR CAPITAL PROJECT FUNDSECONOMIC TOTAL NONMAJOR STREETS AND
COMMUNITY AND SPECIAL REVENUE DRAINAGE QUALIA RELIEFHOUSING DEV. CDBG GRANT FUNDS IMPROVEMENT FUND FUND
ASSETSCash and cash equivalents 22,387$ -$ 587,388$ 5,461,658$ 1$
Taxes receivable, net - - 71,154 - -
Receivables, net 355 - 355 - -
Special assessment receivables, net - - - - -
Due from other governments - - 892,281 - 379,398
Due from other funds 7,150 10,000 308,277 514,687 -
Inventories - - - - -
Prepaid items - - - - -
Restricted cash:
Cash and cash equivalents - - - - -
Total assets 29,892$ 10,000$ 1,859,455$ 5,976,345$ 379,399$
LIABILITIES AND FUND BALANCES
Liabilities:
Accounts payable 2,690$ -$ 295,964$ -$ -$
Wages and salaries payable - - - - -
Accrued liabilities - - - - - Retainage payable 25,391 - Payable to other governments - - - - - Due to others - - 44,688 - - Due to other funds - - 1,968,867 41,115 105,119 Other payables - - 701 - -
Total liabilities 2,690 - 2,310,220 66,506 105,119
Fund balancesNonspendable fund balance:
Inventories - - - - - Prepaid items - - - - -
Restricted fund balance:Capital acquisition and contractual obligations - - - 5,909,839 274,280 Special purpose 27,202 10,000 828,804 - -
Committed fund balance:Self-insurance - - - - -
Assigned fund balance:Construction - - - - - Other assigned fund balance - - - - -
Unassigned fund balance - - (1,279,569) - -
Total fund balances 27,202 10,000 (450,765) 5,909,839 274,280
Total liabilities and fund balances 29,892$ 10,000$ 1,859,455$ 5,976,345$ 379,399$
NONMAJOR SPECIAL REVENUE FUNDS

CITY OF DEL RIO, TEXAS
COMBINING BALANCE SHEET NONMAJOR GOVERNMENTAL FUNDS
September 30, 2020
87
ANIMAL BICYCLE AND EMERGENCY ALDERETE TOTAL NONMAJOR TOTAL NONMAJORCITY HALL SHELTER WALKING POLICE FIRE OPERATIONS LANE CAPITAL PROJECT GOVERNMENTAL BUILDING FUND TRAIL STATION STATION CENTER PROJECT FUNDS FUNDS
69,747$ 1$ 21,038$ 73,692$ 7,384$ 160,439$ 863,310$ 6,657,270$ 7,244,658$
- - - - - - - - 71,154
- - - - - - - - 355
- - - - - - - - -
- - - - - - - 379,398 1,271,679
- - - - - - - 514,687 822,964
- - - - - - - - -
- - - - - - - - -
- - - - - - - - -
69,747$ 1$ 21,038$ 73,692$ 7,384$ 160,439$ 863,310$ 7,551,355$ 9,410,810$
-$ -$ -$ -$ -$ -$ -$ -$ 295,964$
- - - - - - - - -
- - - - - - - - - - 21,976 - - 10,356 - - 57,723 57,723 - - - - - - - - - - - - - - - - - 44,688 - 49,545 - - - - 7,816 203,595 2,172,462 - - - - - - - - 701
- 71,521 - - 10,356 - 7,816 253,502 2,563,722
- - - - - - - - - - - - - - - - - -
69,747 - 21,038 73,692 - 160,439 855,494 7,364,529 7,364,529 - - - - - - - - 828,804
- - - - - - - - -
- - - - - - - - - - - - - - - - - - - (71,520) - - (2,972) - - (74,492) (1,354,061)
69,747 (71,520) 21,038 73,692 (2,972) 160,439 855,494 7,290,037 6,839,272
69,747$ 1$ 21,038$ 73,692$ 7,384$ 160,439$ 863,310$ 7,551,355$ 9,410,810$
NONMAJOR CAPITAL PROJECT FUNDS

CITY OF DEL RIO, TEXAS
COMBINING STATEMENT OF REVENUES, EXPENDITURES, AND CHANGES IN FUND BALANCES
NONMAJOR GOVERNMENTAL FUNDS
For the year ended September 30, 2020
88
NUTRITION
SECTION 5311 WOMAN INFANT AND
GRANT CHILDREN SOCIAL SERVICES ROOM TAX PEG CHANNEL
REVENUES
Property taxes -$ -$ -$ -$ -$ General sales and use taxes - - - - - Franchise tax - - - - 61,955 Other taxes - - - 747,291 - Penalty and interest in taxes - - - - - License and permits - - - - - Intergovernmental revenue and grants 1,855,360 545,383 470,129 - - Charges for services 216,882 - - - - Fines and forfeitures - - - - - Investment earnings 39 3 17 - - Rents and royalties 22,057 - 5,584 - - Contributions and donations from private sources - - - - -
Other revenue 1,663 - 4,292 - -
Total revenues 2,096,001 545,386 480,022 747,291 61,955
EXPENDITURES
Current:General government 122,049 4,625 - - - Public safety - - - - - Public works
Highway and streets 2,035,225 - - - - Health and welfare - 547,863 629,156 - 96,092 Culture and recreation - - - 580,179 - Conservation and development:
Economic development and assistance - - - - - Debt service:
Bond principal - - - - - Bond interest - - - - - Issuance costs - - - - -
Capital outlay:Capital outlay - - - - -
Total expenditures 2,157,274 552,488 629,156 580,179 96,092
Excess (deficiency) of revenuesover (under) expenditures (61,273) (7,102) (149,134) 167,112 (34,137)
OTHER FINANCING SOURCES (USES)
Issuance of bonds - - - - - Sale of real and personal property 2,587 - - - - Transfers in - - 234,200 - - Premium or discount on issuance of bonds - - - - - Transfers out - - - (154,441) -
Total other financing sources (uses) 2,587 - 234,200 (154,441) -
Net change in fund balance (58,686) (7,102) 85,066 12,671 (34,137)
FUND BALANCES - BEGINNING (1,150,456) (16,348) (87,035) 315,126 230,752
Prior period restatement - - - - -
FUND BALANCES - BEGINNING AS RESTATED (1,150,456) (16,348) (87,035) 315,126 230,752
FUND BALANCES - ENDING (1,209,142)$ (23,450)$ (1,969)$ 327,797$ 196,615$
NONMAJOR SPECIAL REVENUE FUNDS

89
RESTRICTIVE CARES ACT PROPERTY AND LAW ENFORCEMENT TXDOT VCR TXDOT SECTION
COURT GRANT LOAN FOREFEITURE CONT. ED. GRANT 5310
-$ -$ -$ -$ -$ -$ -$ - - - - - - - - - - - - - - - - - - - - - - - - - - - - - - - - - - - - 646,142 - - 4,574 18,000 - - - - - - - -
467 - - 8,244 - - - 3 31 - 227 - - - - - - - - - -
- - - - - - -
- - - - - - 1
470 646,173 - 8,471 4,574 18,000 1
- - - 5,001 - - 1 - 454,126 - - 7,650 - -
- - - - - 44,188 - - - - - - - - - - - - - - -
- - - - - - -
- - - - - - - - - - - - - - - - - - - - -
- - - - - - -
- 454,126 - 5,001 7,650 44,188 1
470 192,047 - 3,470 (3,076) (26,188) -
- - - - - - - - - - - - - -
34,353 - - - - - - - - - - - - - - - (152,696) - - - -
34,353 - (152,696) - - - -
34,823 192,047 (152,696) 3,470 (3,076) (26,188) -
- - 152,696 27,452 12,474 (9,849) (8,971)
- - - - - - -
- - 152,696 27,452 12,474 (9,849) (8,971)
34,823$ 192,047$ -$ 30,922$ 9,398$ (36,037)$ (8,971)$

CITY OF DEL RIO, TEXAS
COMBINING STATEMENT OF REVENUES, EXPENDITURES, AND CHANGES IN FUND BALANCES
NONMAJOR GOVERNMENTAL FUNDS
For the year ended September 30, 2020
90
NONMAJOR SPECIAL REVENUE FUNDS
ECONOMIC TOTAL NONMAJOR STREETS AND
COMMUNITY AND CDBG SPECIAL REVENUE DRAINAGE QUALIA RELIEF
HOUSING DEV. GRANT FUNDS IMPROVEMENT FUND FUND
REVENUES
Property taxes -$ -$ -$ -$ -$ General sales and use taxes - - - - - Franchise tax - - 61,955 - - Other taxes - - 747,291 - - Penalty and interest in taxes - - - - - License and permits - - - - - Intergovernmental revenue and grants - - 3,539,588 - 1,088,848 Charges for services - - 216,882 - - Fines and forfeitures - - 8,711 - -
Investment earnings 7 - 327 5,164 - Rents and royalties - - 27,641 - - Contributions and donations from private sources - - - - - Other revenue 1 - 5,957 1,140 -
Total revenues 8 - 4,608,352 6,304 1,088,848
EXPENDITURES
Current:General government - - 131,676 - - Public safety - - 461,776 - - Public works:
Highway and streets - - 2,079,413 - - Health and welfare - - 1,273,111 - -
Culture and recreation - - 580,179 - - Conservation and development:
Economic development and assistance 121,208 - 121,208 - - Debt service:
Bond principal - - - - -
Bond interest - - - - - Issuance costs - - - - -
Capital outlay:Capital outlay - - - - 1,240,635
Total expenditures 121,208 - 4,647,363 - 1,240,635
Excess (deficiency) of revenuesover (under) expenditures (121,200) - (39,011) 6,304 (151,787)
OTHER FINANCING SOURCES (USES)
Issuance of bonds - - - - - Sale of real and personal property - - 2,587 - - Transfers in 126,700 - 395,253 - - Premium or discount on issuance of bonds - - - - - Transfers out - - (307,137) - -
Total other financing sources (uses) 126,700 - 90,703 - -
Net change in fund balance 5,500 - 51,692 6,304 (151,787)
FUND BALANCES - BEGINNING - 10,000 (524,159) 5,903,535 426,067
Prior period adjustment 21,702 - 21,702 - -
FUND BALANCES - BEGINNING AS RESTATED 21,702 10,000 (502,457) 5,903,535 426,067
FUND BALANCES - ENDING 27,202$ 10,000$ (450,765)$ 5,909,839$ 274,280$
NONMAJOR CAPITAL PROJECT FUNDS

CITY OF SAN MARCOS, TEXAS
COMBINING STATEMENT OF REVENUES, EXPENDITURES, AND CHANGES IN FUND BALANCES
NONMAJOR GOVERNMENTAL FUNDS
For the year ended September 30,
91
ANIMAL BICYCLE AND EMERGENCY ALDERETE TOTAL NONMAJOR TOTAL NONMAJOR
CITY HALL SHELTER WALKING POLICE FIRE OPERATIONS LANE CAPITAL PROJECT GOVERNMENTAL
BUILDING FUND TRAIL STATION STATION CENTER PROJECT FUNDS FUNDS
-$ -$ -$ -$ -$ -$ -$ -$ -$ - - - - - - - - - - - - - - - - - 61,955 - - - - - - - - 747,291 - - - - - - - - - - - - - - - - - - - - - - - - - 1,088,848 4,628,436 - - - - - - - - 216,882 - - - - - - - - 8,711
- 169 - - - 1,085 903 7,321 7,648 - - - - - - - - 27,641
- - - - - - - - - - - - - - 60 - 1,200 7,157
- 169 - - - 1,145 903 1,097,369 5,705,721
- - - - - - - - 131,676 - - - - - - - - 461,776
- - - - - - - - 2,079,413 - - - - - - - - 1,273,111
- - - - - - - - 580,179
- - - - - - - - 121,208
- - - - - - - - -
- - - - - - - - - - - - - - - - - -
- - - - - - - 1,240,635 1,240,635
- - - - - - - 1,240,635 5,887,998
- 169 - - - 1,145 903 (143,266) (182,277)
- - - - - - - - - - - - - - - - - 2,587 - - - - - - - - 395,253 - - - - - - - - - - - - - - - - - (307,137)
- - - - - - - - 90,703
- 169 - - - 1,145 903 (143,266) (91,574)
69,747 (71,689) 21,038 73,692 (2,972) 159,294 - 6,578,712 6,054,553
- - - - - - 854,591 854,591 876,293
69,747 (71,689) 21,038 73,692 (2,972) 159,294 854,591 7,433,303 6,930,846
69,747$ (71,520)$ 21,038$ 73,692$ (2,972)$ 160,439$ 855,494$ 7,290,037$ 6,839,272$
NONMAJOR CAPITAL PROJECT FUNDS

CITY OF SAN MARCOS, TEXAS
COMBINING STATEMENT OF REVENUES, EXPENDITURES, AND CHANGES IN FUND BALANCES
NONMAJOR GOVERNMENTAL FUNDS
For the year ended September 30,
CITY OF SAN MARCOS, TEXAS
COMBINING STATEMENT OF REVENUES, EXPENDITURES, AND CHANGES IN FUND BALANCES
NONMAJOR GOVERNMENTAL FUNDS
For the year ended September 30,
DEBT SERVICE FUND
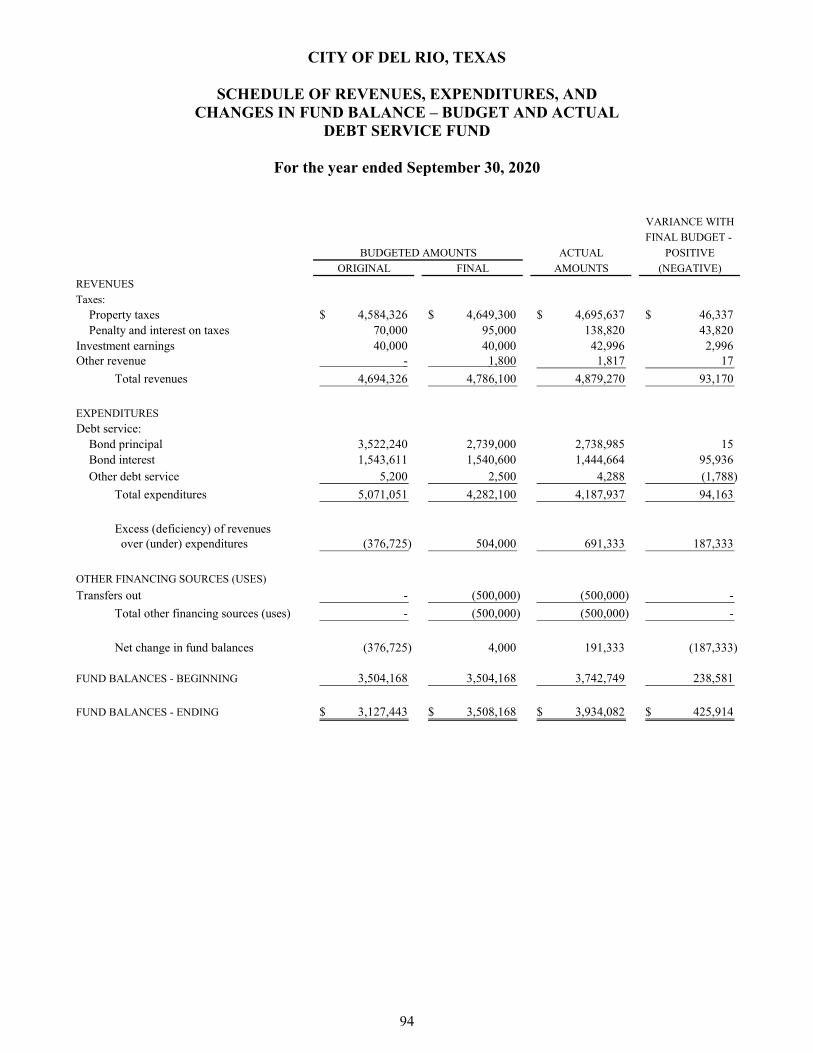
CITY OF DEL RIO, TEXAS
SCHEDULE OF REVENUES, EXPENDITURES, AND CHANGES IN FUND BALANCE – BUDGET AND ACTUAL
DEBT SERVICE FUND
For the year ended September 30, 2020
94
VARIANCE WITH
FINAL BUDGET -
ACTUAL POSITIVE
ORIGINAL FINAL AMOUNTS (NEGATIVE)
REVENUES
Taxes:
Property taxes 4,584,326$ 4,649,300$ 4,695,637$ 46,337$ Penalty and interest on taxes 70,000 95,000 138,820 43,820
Investment earnings 40,000 40,000 42,996 2,996 Other revenue - 1,800 1,817 17
Total revenues 4,694,326 4,786,100 4,879,270 93,170
EXPENDITURES
Debt service:Bond principal 3,522,240 2,739,000 2,738,985 15 Bond interest 1,543,611 1,540,600 1,444,664 95,936 Other debt service 5,200 2,500 4,288 (1,788)
Total expenditures 5,071,051 4,282,100 4,187,937 94,163
Excess (deficiency) of revenues over (under) expenditures (376,725) 504,000 691,333 187,333
OTHER FINANCING SOURCES (USES)
Transfers out - (500,000) (500,000) -
Total other financing sources (uses) - (500,000) (500,000) -
Net change in fund balances (376,725) 4,000 191,333 (187,333)
FUND BALANCES - BEGINNING 3,504,168 3,504,168 3,742,749 238,581
FUND BALANCES - ENDING 3,127,443$ 3,508,168$ 3,934,082$ 425,914$
BUDGETED AMOUNTS
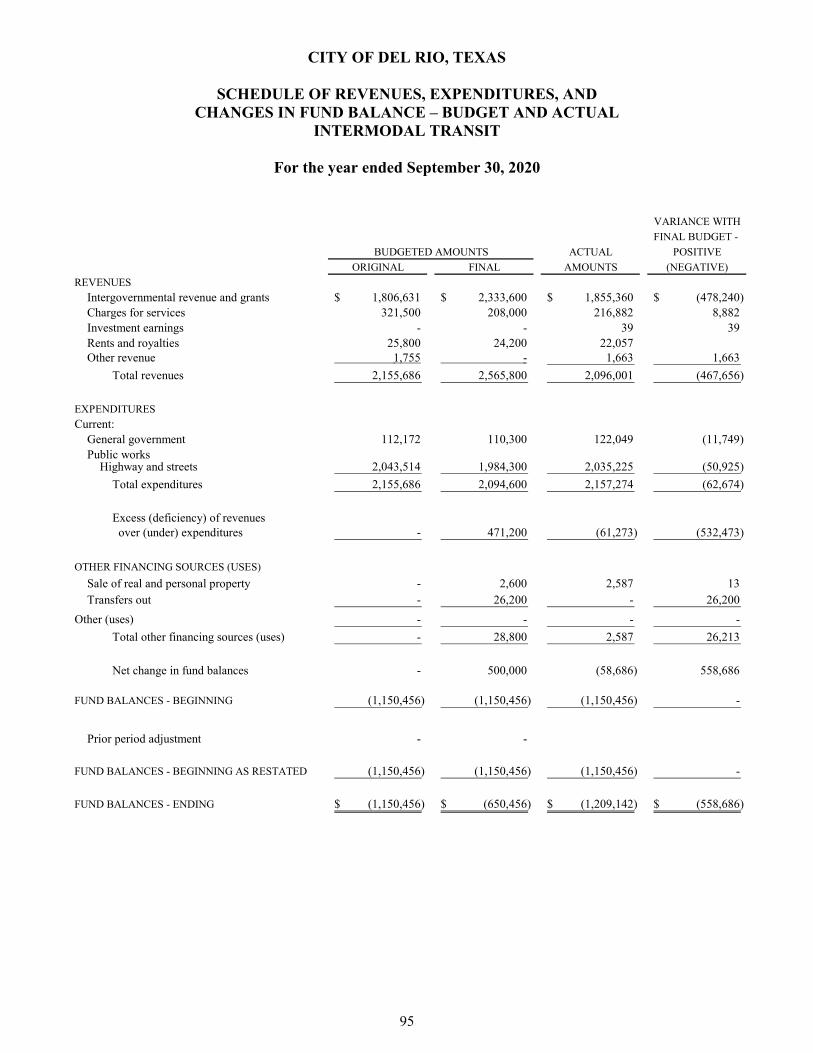
CITY OF DEL RIO, TEXAS
SCHEDULE OF REVENUES, EXPENDITURES, AND CHANGES IN FUND BALANCE – BUDGET AND ACTUAL
INTERMODAL TRANSIT
For the year ended September 30, 2020
95
VARIANCE WITH
FINAL BUDGET -
ACTUAL POSITIVE
ORIGINAL FINAL AMOUNTS (NEGATIVE)
REVENUES
Intergovernmental revenue and grants 1,806,631$ 2,333,600$ 1,855,360$ (478,240)$ Charges for services 321,500 208,000 216,882 8,882 Investment earnings - - 39 39 Rents and royalties 25,800 24,200 22,057 Other revenue 1,755 - 1,663 1,663
Total revenues 2,155,686 2,565,800 2,096,001 (467,656)
EXPENDITURES
Current:General government 112,172 110,300 122,049 (11,749) Public works
Highway and streets 2,043,514 1,984,300 2,035,225 (50,925)
Total expenditures 2,155,686 2,094,600 2,157,274 (62,674)
Excess (deficiency) of revenues over (under) expenditures - 471,200 (61,273) (532,473)
OTHER FINANCING SOURCES (USES)
Sale of real and personal property - 2,600 2,587 13 Transfers out - 26,200 - 26,200
Other (uses) - - - -
Total other financing sources (uses) - 28,800 2,587 26,213
Net change in fund balances - 500,000 (58,686) 558,686
FUND BALANCES - BEGINNING (1,150,456) (1,150,456) (1,150,456) -
Prior period adjustment - -
FUND BALANCES - BEGINNING AS RESTATED (1,150,456) (1,150,456) (1,150,456) -
FUND BALANCES - ENDING (1,150,456)$ (650,456)$ (1,209,142)$ (558,686)$
BUDGETED AMOUNTS
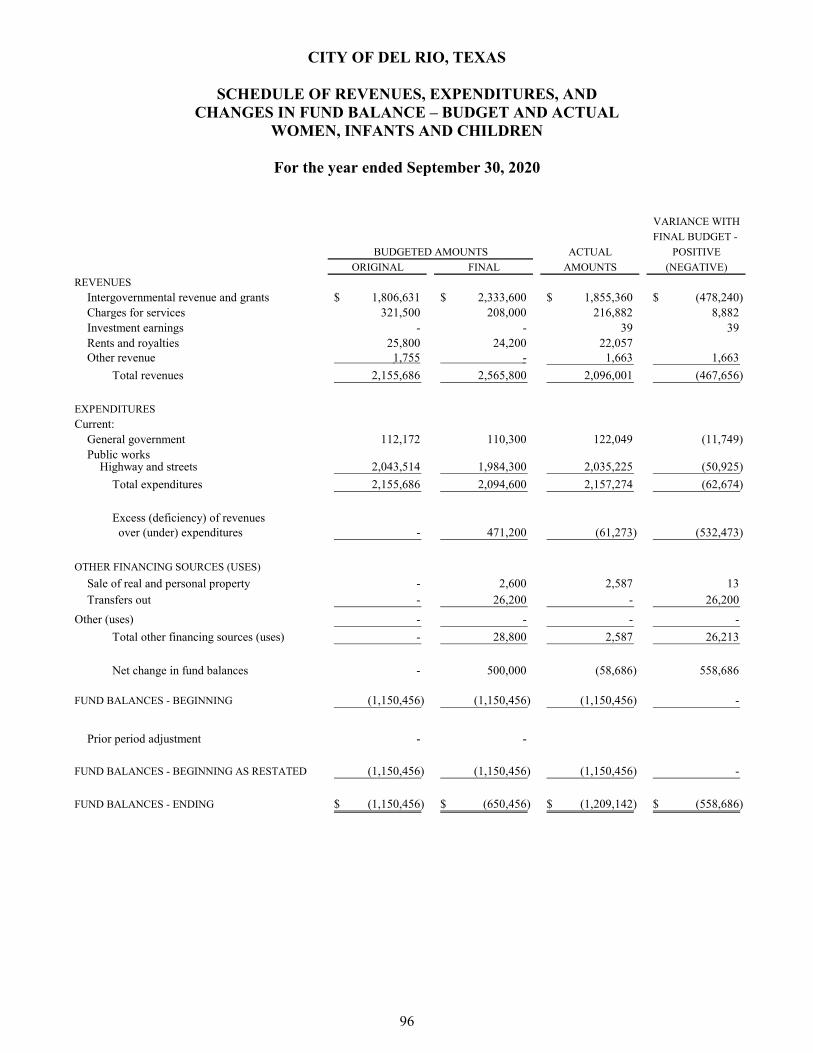
CITY OF DEL RIO, TEXAS
SCHEDULE OF REVENUES, EXPENDITURES, AND CHANGES IN FUND BALANCE – BUDGET AND ACTUAL
WOMEN, INFANTS AND CHILDREN
For the year ended September 30, 2020
96
VARIANCE WITH
FINAL BUDGET -
ACTUAL POSITIVE
ORIGINAL FINAL AMOUNTS (NEGATIVE)
REVENUES
Intergovernmental revenue and grants 1,806,631$ 2,333,600$ 1,855,360$ (478,240)$ Charges for services 321,500 208,000 216,882 8,882 Investment earnings - - 39 39 Rents and royalties 25,800 24,200 22,057 Other revenue 1,755 - 1,663 1,663
Total revenues 2,155,686 2,565,800 2,096,001 (467,656)
EXPENDITURES
Current:General government 112,172 110,300 122,049 (11,749) Public works
Highway and streets 2,043,514 1,984,300 2,035,225 (50,925)
Total expenditures 2,155,686 2,094,600 2,157,274 (62,674)
Excess (deficiency) of revenues over (under) expenditures - 471,200 (61,273) (532,473)
OTHER FINANCING SOURCES (USES)
Sale of real and personal property - 2,600 2,587 13 Transfers out - 26,200 - 26,200
Other (uses) - - - -
Total other financing sources (uses) - 28,800 2,587 26,213
Net change in fund balances - 500,000 (58,686) 558,686
FUND BALANCES - BEGINNING (1,150,456) (1,150,456) (1,150,456) -
Prior period adjustment - -
FUND BALANCES - BEGINNING AS RESTATED (1,150,456) (1,150,456) (1,150,456) -
FUND BALANCES - ENDING (1,150,456)$ (650,456)$ (1,209,142)$ (558,686)$
BUDGETED AMOUNTS
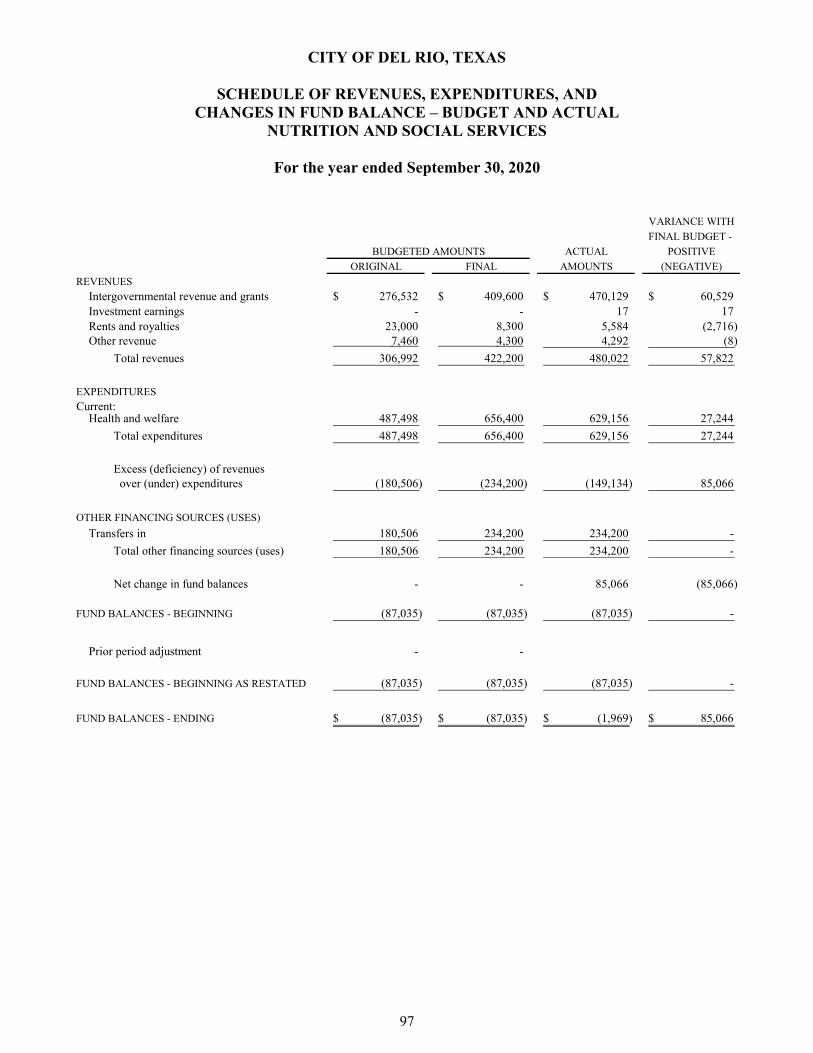
CITY OF DEL RIO, TEXAS
SCHEDULE OF REVENUES, EXPENDITURES, AND CHANGES IN FUND BALANCE – BUDGET AND ACTUAL
NUTRITION AND SOCIAL SERVICES
For the year ended September 30, 2020
97
VARIANCE WITH
FINAL BUDGET -
ACTUAL POSITIVE
ORIGINAL FINAL AMOUNTS (NEGATIVE)
REVENUES
Intergovernmental revenue and grants 276,532$ 409,600$ 470,129$ 60,529$ Investment earnings - - 17 17 Rents and royalties 23,000 8,300 5,584 (2,716) Other revenue 7,460 4,300 4,292 (8)
Total revenues 306,992 422,200 480,022 57,822
EXPENDITURES
Current:Health and welfare 487,498 656,400 629,156 27,244
Total expenditures 487,498 656,400 629,156 27,244
Excess (deficiency) of revenues over (under) expenditures (180,506) (234,200) (149,134) 85,066
OTHER FINANCING SOURCES (USES)
Transfers in 180,506 234,200 234,200 -
Total other financing sources (uses) 180,506 234,200 234,200 -
Net change in fund balances - - 85,066 (85,066)
FUND BALANCES - BEGINNING (87,035) (87,035) (87,035) -
Prior period adjustment - -
FUND BALANCES - BEGINNING AS RESTATED (87,035) (87,035) (87,035) -
FUND BALANCES - ENDING (87,035)$ (87,035)$ (1,969)$ 85,066$
BUDGETED AMOUNTS
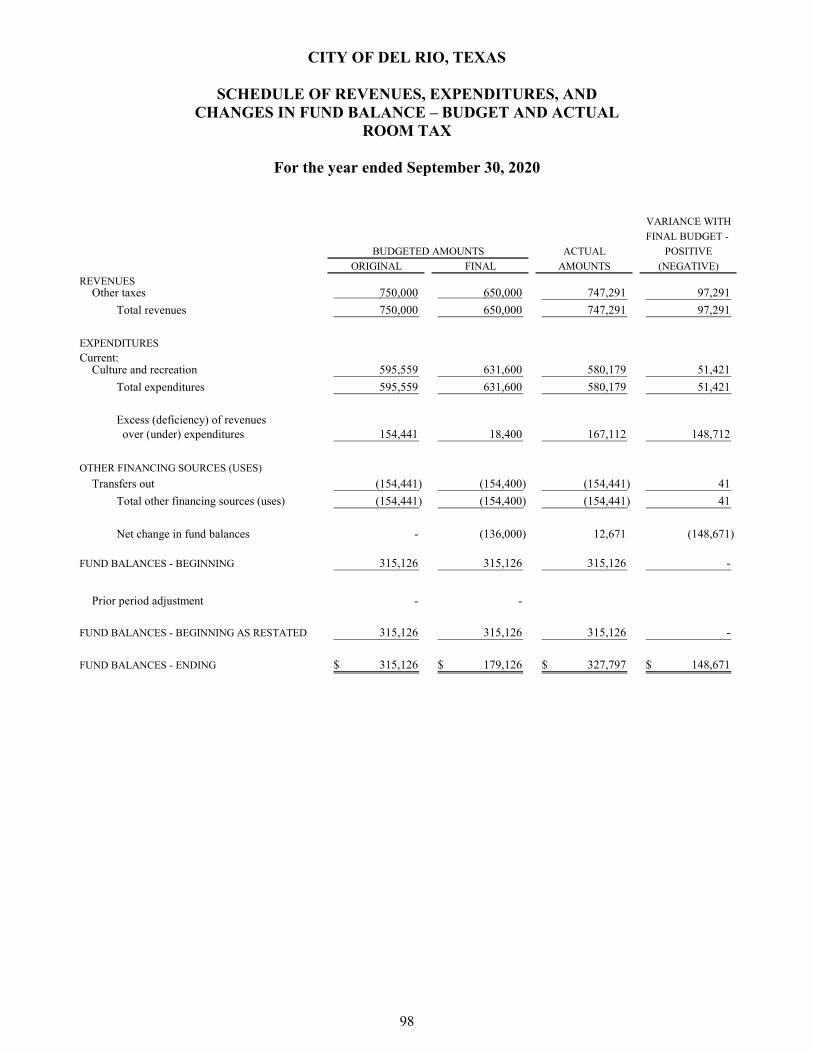
CITY OF DEL RIO, TEXAS
SCHEDULE OF REVENUES, EXPENDITURES, AND CHANGES IN FUND BALANCE – BUDGET AND ACTUAL
ROOM TAX
For the year ended September 30, 2020
98
VARIANCE WITH
FINAL BUDGET -
ACTUAL POSITIVE
ORIGINAL FINAL AMOUNTS (NEGATIVE)
REVENUESOther taxes 750,000 650,000 747,291 97,291
Total revenues 750,000 650,000 747,291 97,291
EXPENDITURES
Current:Culture and recreation 595,559 631,600 580,179 51,421
Total expenditures 595,559 631,600 580,179 51,421
Excess (deficiency) of revenues over (under) expenditures 154,441 18,400 167,112 148,712
OTHER FINANCING SOURCES (USES)
Transfers out (154,441) (154,400) (154,441) 41
Total other financing sources (uses) (154,441) (154,400) (154,441) 41
Net change in fund balances - (136,000) 12,671 (148,671)
FUND BALANCES - BEGINNING 315,126 315,126 315,126 -
Prior period adjustment - -
FUND BALANCES - BEGINNING AS RESTATED 315,126 315,126 315,126 -
FUND BALANCES - ENDING 315,126$ 179,126$ 327,797$ 148,671$
BUDGETED AMOUNTS
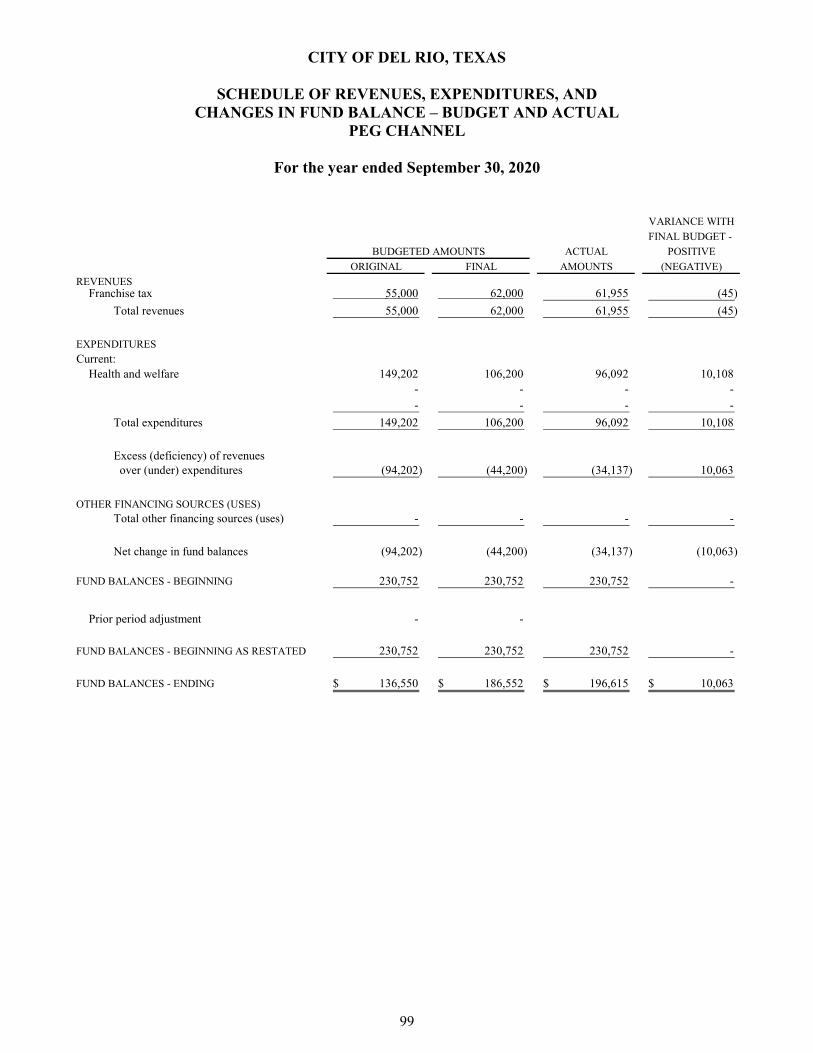
CITY OF DEL RIO, TEXAS
SCHEDULE OF REVENUES, EXPENDITURES, AND CHANGES IN FUND BALANCE – BUDGET AND ACTUAL
PEG CHANNEL
For the year ended September 30, 2020
99
VARIANCE WITH
FINAL BUDGET -
ACTUAL POSITIVE
ORIGINAL FINAL AMOUNTS (NEGATIVE)
REVENUESFranchise tax 55,000 62,000 61,955 (45)
Total revenues 55,000 62,000 61,955 (45)
EXPENDITURES
Current:Health and welfare 149,202 106,200 96,092 10,108
- - - - - - - -
Total expenditures 149,202 106,200 96,092 10,108
Excess (deficiency) of revenues over (under) expenditures (94,202) (44,200) (34,137) 10,063
OTHER FINANCING SOURCES (USES)Total other financing sources (uses) - - - -
Net change in fund balances (94,202) (44,200) (34,137) (10,063)
FUND BALANCES - BEGINNING 230,752 230,752 230,752 -
Prior period adjustment - -
FUND BALANCES - BEGINNING AS RESTATED 230,752 230,752 230,752 -
FUND BALANCES - ENDING 136,550$ 186,552$ 196,615$ 10,063$
BUDGETED AMOUNTS
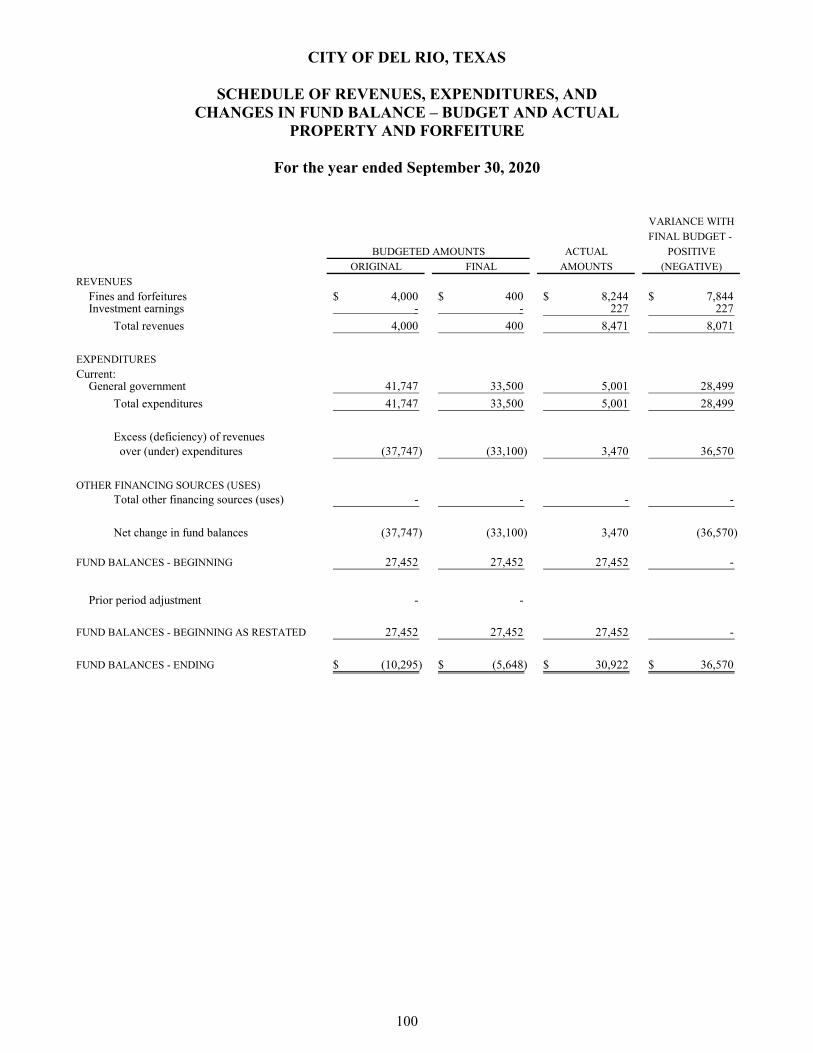
CITY OF DEL RIO, TEXAS
SCHEDULE OF REVENUES, EXPENDITURES, AND CHANGES IN FUND BALANCE – BUDGET AND ACTUAL
PROPERTY AND FORFEITURE
For the year ended September 30, 2020
100
VARIANCE WITH
FINAL BUDGET -
ACTUAL POSITIVE
ORIGINAL FINAL AMOUNTS (NEGATIVE)
REVENUES
Fines and forfeitures 4,000$ 400$ 8,244$ 7,844$ Investment earnings - - 227 227
Total revenues 4,000 400 8,471 8,071
EXPENDITURES
Current:General government 41,747 33,500 5,001 28,499
Total expenditures 41,747 33,500 5,001 28,499
Excess (deficiency) of revenues over (under) expenditures (37,747) (33,100) 3,470 36,570
OTHER FINANCING SOURCES (USES)Total other financing sources (uses) - - - -
Net change in fund balances (37,747) (33,100) 3,470 (36,570)
FUND BALANCES - BEGINNING 27,452 27,452 27,452 -
Prior period adjustment - -
FUND BALANCES - BEGINNING AS RESTATED 27,452 27,452 27,452 -
FUND BALANCES - ENDING (10,295)$ (5,648)$ 30,922$ 36,570$
BUDGETED AMOUNTS

CITY OF DEL RIO, TEXAS
SCHEDULE OF REVENUES, EXPENDITURES, AND CHANGES IN FUND BALANCE – BUDGET AND ACTUAL
LEOSE CONTINUING EDUCATION
For the year ended September 30, 2020
101
VARIANCE WITH
FINAL BUDGET -
ACTUAL POSITIVE
ORIGINAL FINAL AMOUNTS (NEGATIVE)
REVENUESIntergovernmental revenue and grants 5,000 4,600 4,574 (26)
Total revenues 5,000 4,600 4,574 (26)
EXPENDITURES
Current:Public safety 18,797 4,600 7,650 (3,050)
Total expenditures 18,797 4,600 7,650 (3,050)
Excess (deficiency) of revenues over (under) expenditures (13,797) - (3,076) (3,076)
OTHER FINANCING SOURCES (USES)Total other financing sources (uses) - - - -
Net change in fund balances (13,797) - (3,076) 3,076
FUND BALANCES - BEGINNING 12,474 12,474 12,474 -
Prior period adjustment - -
FUND BALANCES - BEGINNING AS RESTATED 12,474 12,474 12,474 -
FUND BALANCES - ENDING (1,323)$ 12,474$ 9,398$ (3,076)$
BUDGETED AMOUNTS
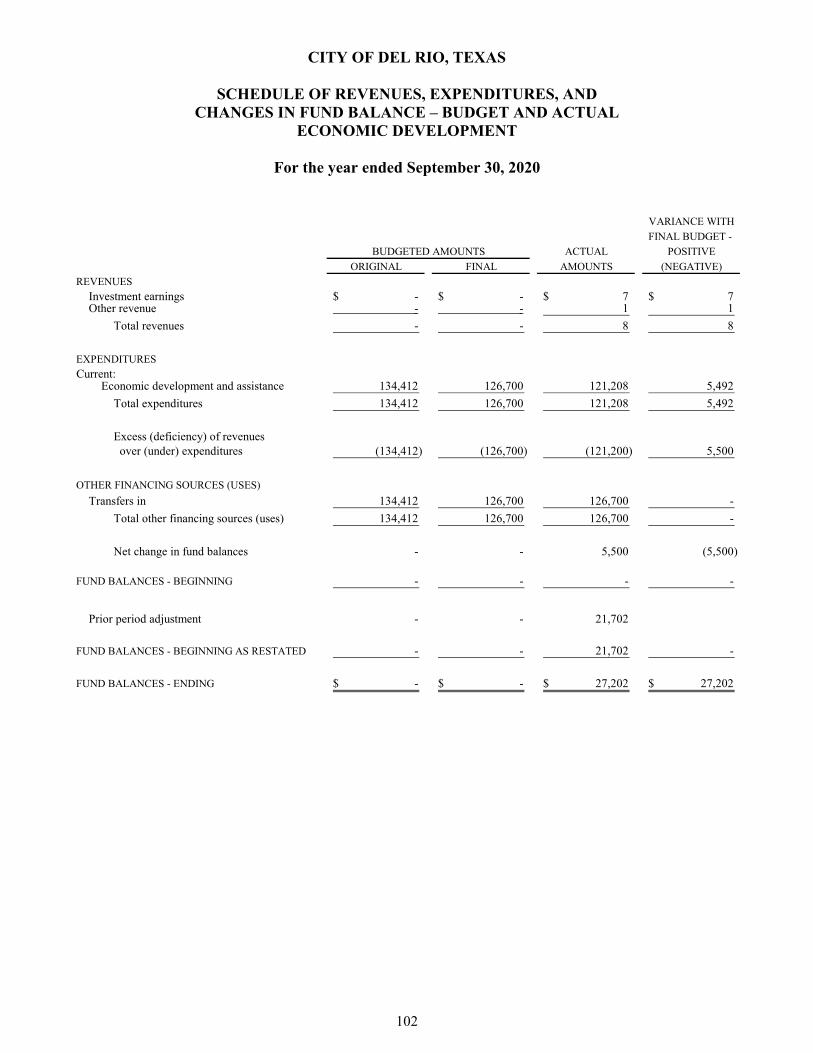
CITY OF DEL RIO, TEXAS
SCHEDULE OF REVENUES, EXPENDITURES, AND CHANGES IN FUND BALANCE – BUDGET AND ACTUAL
ECONOMIC DEVELOPMENT
For the year ended September 30, 2020
102
VARIANCE WITH
FINAL BUDGET -
ACTUAL POSITIVE
ORIGINAL FINAL AMOUNTS (NEGATIVE)
REVENUES
Investment earnings -$ -$ 7$ 7$ Other revenue - - 1 1
Total revenues - - 8 8
EXPENDITURES
Current:Economic development and assistance 134,412 126,700 121,208 5,492
Total expenditures 134,412 126,700 121,208 5,492
Excess (deficiency) of revenues over (under) expenditures (134,412) (126,700) (121,200) 5,500
OTHER FINANCING SOURCES (USES)
Transfers in 134,412 126,700 126,700 -
Total other financing sources (uses) 134,412 126,700 126,700 -
Net change in fund balances - - 5,500 (5,500)
FUND BALANCES - BEGINNING - - - -
Prior period adjustment - - 21,702
FUND BALANCES - BEGINNING AS RESTATED - - 21,702 -
FUND BALANCES - ENDING -$ -$ 27,202$ 27,202$
BUDGETED AMOUNTS

NONMAJOR ENTERPRISE FUNDS

CITY OF DEL RIO, TEXAS
COMBINING STATEMENT OF NET POSITION NONMAJOR ENTERPRISE FUNDS
For the year ended September 30, 2020
104
INTERNATIONAL MUNICIPALAIRPORT FACILITIES TOTAL
ASSETS
Current assets:Cash and cash equivalents -$ 465,390$ 465,390$ Accounts receivable - net of
uncollectible allowances 6,781 8,171 14,952 Due from other governments 69,000 - 69,000 Due from other funds 624 22,423 23,047
Total current assets 76,405 495,984 572,389
Non-current assets:Capital assets:
Land purchase and improvements 1,262,356 89,200 1,351,556 Buildings 4,519,800 3,354,947 7,874,747 Improvements other than buildings 21,740,579 34,859 21,775,438 Furniture and equipment 66,025 45,208 111,233 Accumulated depreciation-capital assets (15,049,938) (2,803,425) (17,853,363)
Total non-current assets 12,538,822 720,789 13,259,611
Total assets 12,615,227 1,216,773 13,832,000
DEFERRED OUTFLOWS OF RESOURCES
Deferred outflows related to OPEB - supplemental death 1,876 2,624 4,500 Deferred outflows related to OPEB - retiree health 788 1,173 1,961
Deferred outflows related to pension plan 11,139 15,582 26,721 Total deferred outflows of resources 13,803 19,379 33,182
Total assets and deferred outflows
of resources 12,629,030$ 1,236,152$ 13,865,182$
BUSINESS-TYPE ACTIVITIES - ENTERPRISE FUNDS
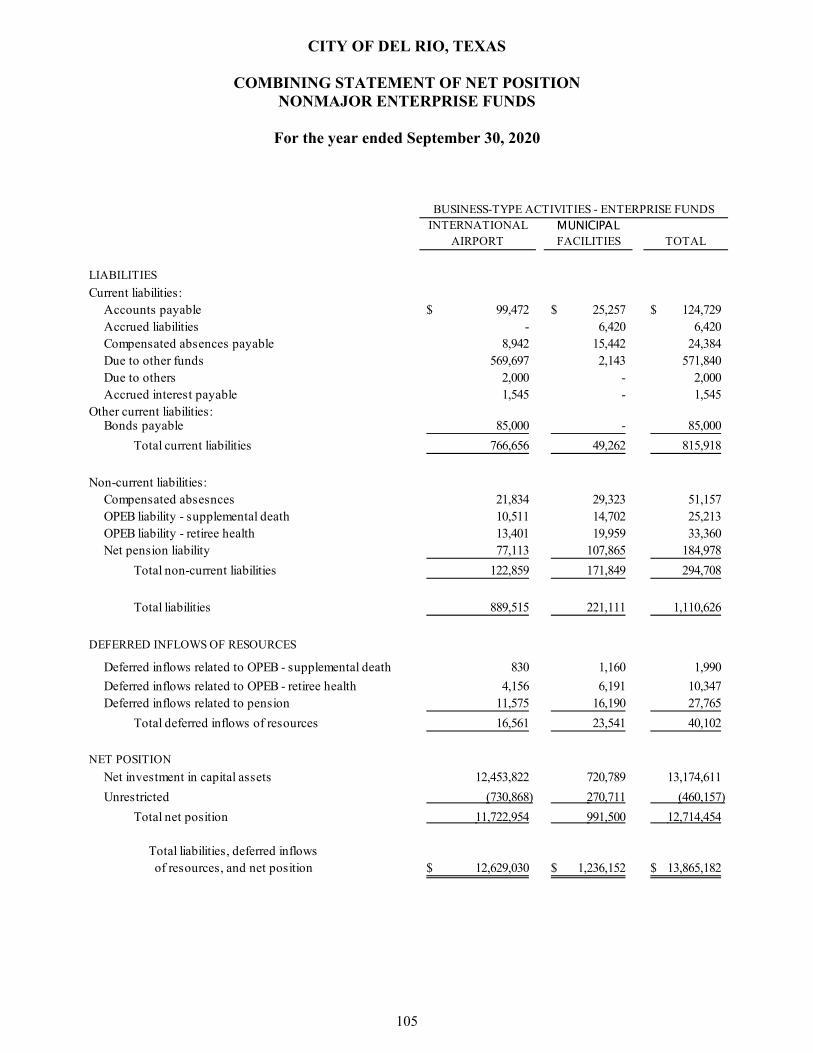
CITY OF DEL RIO, TEXAS
COMBINING STATEMENT OF NET POSITION NONMAJOR ENTERPRISE FUNDS
For the year ended September 30, 2020
105
INTERNATIONAL MUNICIPALAIRPORT FACILITIES TOTAL
LIABILITIES
Current liabilities:Accounts payable 99,472$ 25,257$ 124,729$ Accrued liabilities - 6,420 6,420 Compensated absences payable 8,942 15,442 24,384 Due to other funds 569,697 2,143 571,840 Due to others 2,000 - 2,000 Accrued interest payable 1,545 - 1,545
Other current liabilities:Bonds payable 85,000 - 85,000
Total current liabilities 766,656 49,262 815,918
Non-current liabilities:Compensated absesnces 21,834 29,323 51,157 OPEB liability - supplemental death 10,511 14,702 25,213 OPEB liability - retiree health 13,401 19,959 33,360 Net pension liability 77,113 107,865 184,978
Total non-current liabilities 122,859 171,849 294,708
Total liabilities 889,515 221,111 1,110,626
DEFERRED INFLOWS OF RESOURCES
Deferred inflows related to OPEB - supplemental death 830 1,160 1,990
Deferred inflows related to OPEB - retiree health 4,156 6,191 10,347 Deferred inflows related to pension 11,575 16,190 27,765
Total deferred inflows of resources 16,561 23,541 40,102
NET POSITION
Net investment in capital assets 12,453,822 720,789 13,174,611
Unrestricted (730,868) 270,711 (460,157)
Total net position 11,722,954 991,500 12,714,454
Total liabilities, deferred inflows of resources, and net position 12,629,030$ 1,236,152$ 13,865,182$
BUSINESS-TYPE ACTIVITIES - ENTERPRISE FUNDS
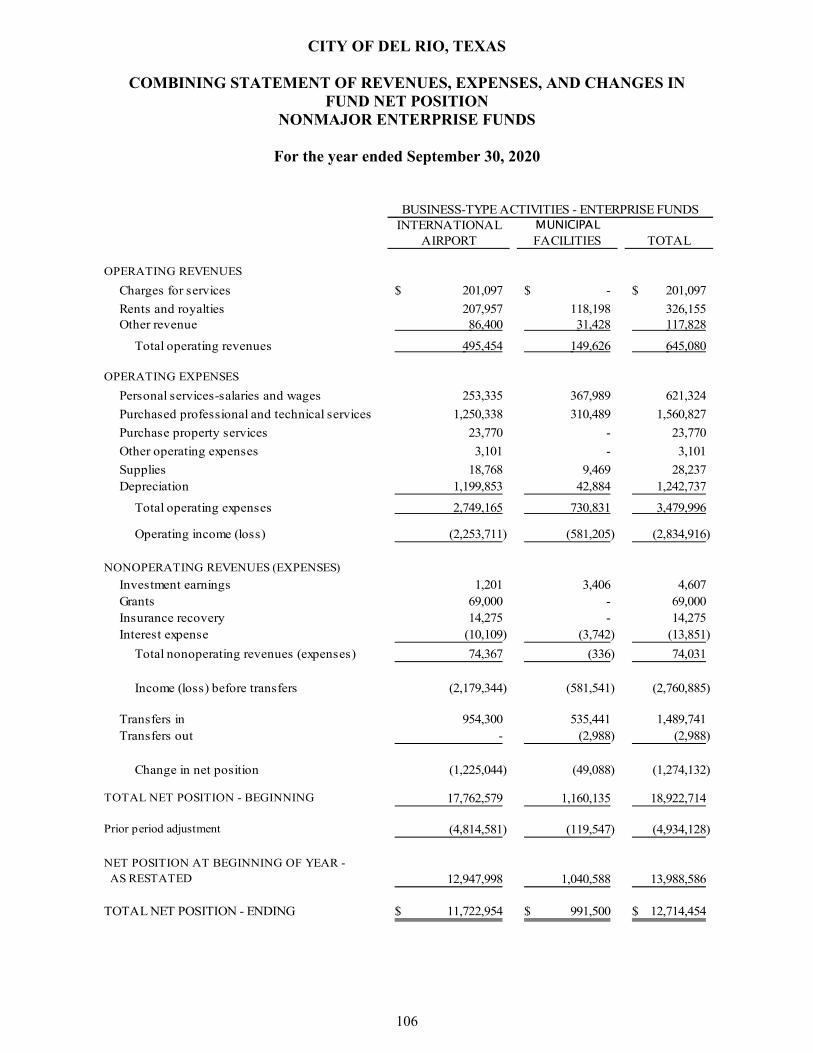
CITY OF DEL RIO, TEXAS
COMBINING STATEMENT OF REVENUES, EXPENSES, AND CHANGES IN FUND NET POSITION
NONMAJOR ENTERPRISE FUNDS
For the year ended September 30, 2020
106
INTERNATIONAL MUNICIPALAIRPORT FACILITIES TOTAL
OPERATING REVENUES
Charges for services 201,097$ -$ 201,097$
Rents and royalties 207,957 118,198 326,155 Other revenue 86,400 31,428 117,828
Total operating revenues 495,454 149,626 645,080
OPERATING EXPENSES
Personal services-salaries and wages 253,335 367,989 621,324
Purchased professional and technical services 1,250,338 310,489 1,560,827
Purchase property services 23,770 - 23,770
Other operating expenses 3,101 - 3,101
Supplies 18,768 9,469 28,237 Depreciation 1,199,853 42,884 1,242,737
Total operating expenses 2,749,165 730,831 3,479,996
Operating income (loss) (2,253,711) (581,205) (2,834,916)
NONOPERATING REVENUES (EXPENSES)
Investment earnings 1,201 3,406 4,607 Grants 69,000 - 69,000 Insurance recovery 14,275 - 14,275 Interest expense (10,109) (3,742) (13,851)
Total nonoperating revenues (expenses) 74,367 (336) 74,031
Income (loss) before transfers (2,179,344) (581,541) (2,760,885)
Transfers in 954,300 535,441 1,489,741 Transfers out - (2,988) (2,988)
Change in net position (1,225,044) (49,088) (1,274,132)
TOTAL NET POSITION - BEGINNING 17,762,579 1,160,135 18,922,714
Prior period adjustment (4,814,581) (119,547) (4,934,128)
NET POSITION AT BEGINNING OF YEAR - AS RESTATED 12,947,998 1,040,588 13,988,586
TOTAL NET POSITION - ENDING 11,722,954$ 991,500$ 12,714,454$
BUSINESS-TYPE ACTIVITIES - ENTERPRISE FUNDS

CITY OF DEL RIO, TEXAS
COMBINING STATEMENT OF CASH FLOWS NONMAJOR ENTERPRISE FUNDS
For the year ended September 30, 2020
107
TOTALINTERNATIONAL MUNICIPAL ENTERPRISE
AIRPORT FACILITIES FUNDS
CASH FLOWS FROM OPERATING ACTIVITIES
Receipts from user charges 438,239$ 147,867$ 586,106$ Payments to employees for services (232,536) (347,652) (580,188)
Payments for suppliers (1,212,508) (330,659) (1,543,167)
Net cash provided by (used in) operating activities (1,006,805) (530,444) (1,537,249)
CASH FLOWS FROM NONCAPITAL FINANCING
ACTIVITIES
Grant proceeds 69,000 - 69,000
Transfers in 1,523,700 512,277 2,035,977
Net cash provided by (used in) noncapital
financing activities 1,592,700 512,277 2,104,977
CASH FLOWS FROM CAPITAL AND RELATED
FINANCING ACTIVITIES
Acquition of capital assets (29,265) - (29,265)
Principal payments on revenue and general obligation
bonds (80,000) - (80,000)
Interest paid on outstanding debt (8,564) (3,743) (12,307)
Proceeds from sale of assets 14,275 - 14,275
Net cash provided by (used in) capital
and related financing activities (103,554) (3,743) (107,297)
CASH FLOWS FROM INVESTING ACTIVITIES
Interest and dividends on investments 1,201 3,406 4,607
Net cash provided by (used in) investing activities 1,201 3,406 4,607
Net increase (decrease) in cash and
cash equivalents 483,542 (18,504) 465,038
CASH AND CASH EQUIVALENTS - BEGINNING (483,542) 483,894 352
CASH AND CASH EQUIVALENTS - ENDING -$ 465,390$ 465,390$
BUSINESS-TYPE ACTIVITIES-ENTERPRISE FUNDS
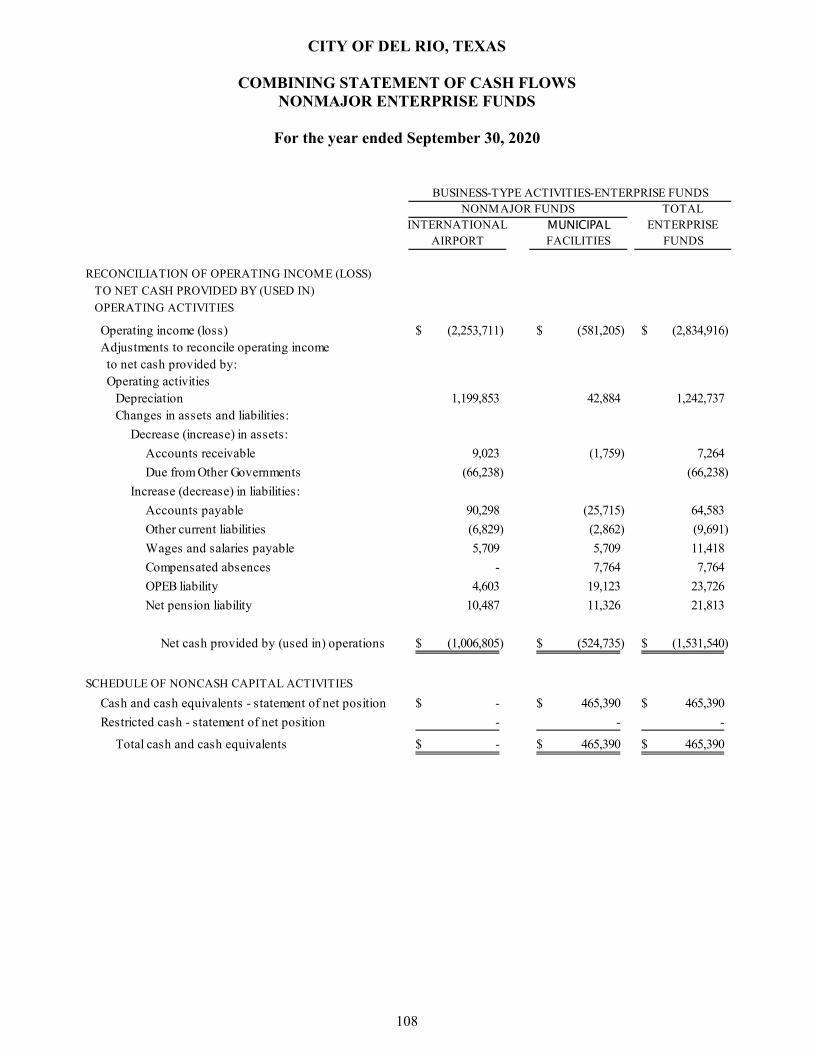
CITY OF DEL RIO, TEXAS
COMBINING STATEMENT OF CASH FLOWS NONMAJOR ENTERPRISE FUNDS
For the year ended September 30, 2020
108
TOTALINTERNATIONAL MUNICIPAL ENTERPRISE
AIRPORT FACILITIES FUNDS
RECONCILIATION OF OPERATING INCOME (LOSS)
TO NET CASH PROVIDED BY (USED IN)
OPERATING ACTIVITIES
Operating income (loss) (2,253,711)$ (581,205)$ (2,834,916)$ Adjustments to reconcile operating income to net cash provided by: Operating activities
Depreciation 1,199,853 42,884 1,242,737 Changes in assets and liabilities:
Decrease (increase) in assets:
Accounts receivable 9,023 (1,759) 7,264
Due from Other Governments (66,238) (66,238)
Increase (decrease) in liabilities:
Accounts payable 90,298 (25,715) 64,583
Other current liabilities (6,829) (2,862) (9,691)
Wages and salaries payable 5,709 5,709 11,418
Compensated absences - 7,764 7,764
OPEB liability 4,603 19,123 23,726
Net pension liability 10,487 11,326 21,813
Net cash provided by (used in) operations (1,006,805)$ (524,735)$ (1,531,540)$
SCHEDULE OF NONCASH CAPITAL ACTIVITIES
Cash and cash equivalents - statement of net position -$ 465,390$ 465,390$
Restricted cash - statement of net position - - -
Total cash and cash equivalents -$ 465,390$ 465,390$
BUSINESS-TYPE ACTIVITIES-ENTERPRISE FUNDSNONMAJOR FUNDS
INTERNAL SERVICE FUNDS
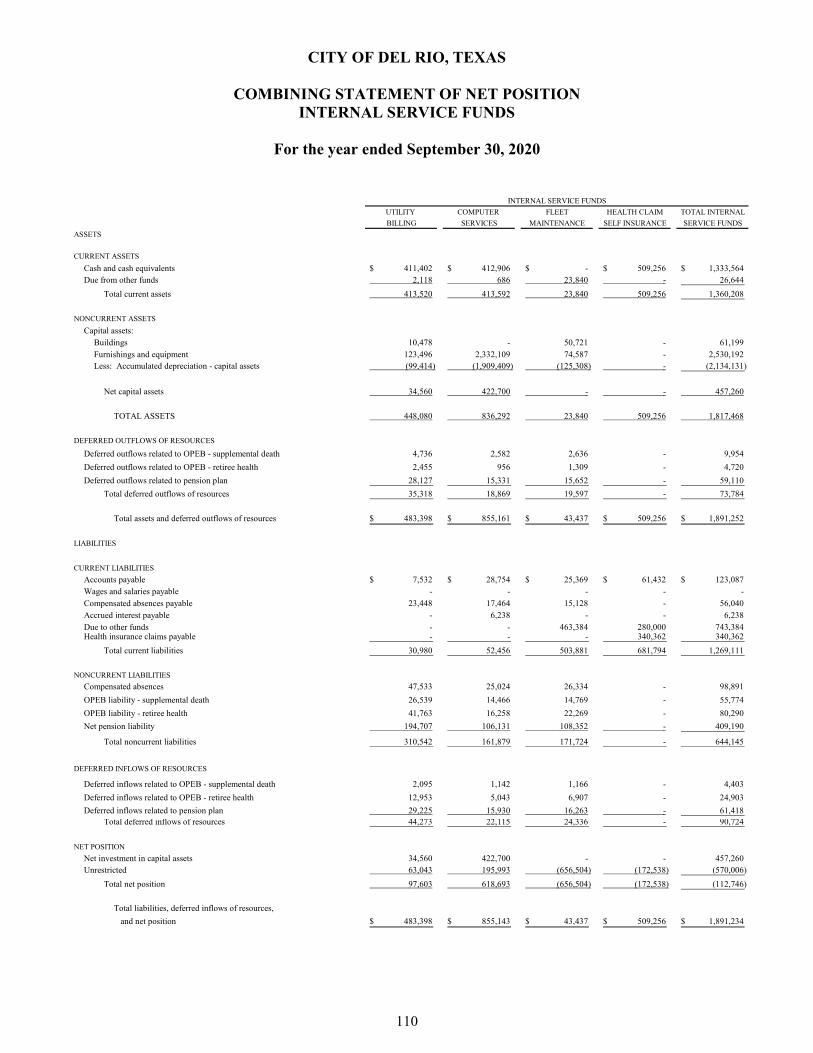
CITY OF DEL RIO, TEXAS
COMBINING STATEMENT OF NET POSITION INTERNAL SERVICE FUNDS
For the year ended September 30, 2020
110
UTILITY COMPUTER FLEET HEALTH CLAIM TOTAL INTERNAL
BILLING SERVICES MAINTENANCE SELF INSURANCE SERVICE FUNDS
ASSETS
CURRENT ASSETS
Cash and cash equivalents 411,402$ 412,906$ -$ 509,256$ 1,333,564$ Due from other funds 2,118 686 23,840 - 26,644
Total current assets 413,520 413,592 23,840 509,256 1,360,208
NONCURRENT ASSETS
Capital assets:Buildings 10,478 - 50,721 - 61,199 Furnishings and equipment 123,496 2,332,109 74,587 - 2,530,192 Less: Accumulated depreciation - capital assets (99,414) (1,909,409) (125,308) - (2,134,131)
Net capital assets 34,560 422,700 - - 457,260
TOTAL ASSETS 448,080 836,292 23,840 509,256 1,817,468
DEFERRED OUTFLOWS OF RESOURCES
Deferred outflows related to OPEB - supplemental death 4,736 2,582 2,636 - 9,954
Deferred outflows related to OPEB - retiree health 2,455 956 1,309 - 4,720
Deferred outflows related to pension plan 28,127 15,331 15,652 - 59,110
Total deferred outflows of resources 35,318 18,869 19,597 - 73,784
Total assets and deferred outflows of resources 483,398$ 855,161$ 43,437$ 509,256$ 1,891,252$
LIABILITIES
CURRENT LIABILITIES
Accounts payable 7,532$ 28,754$ 25,369$ 61,432$ 123,087$ Wages and salaries payable - - - - - Compensated absences payable 23,448 17,464 15,128 - 56,040 Accrued interest payable - 6,238 - - 6,238 Due to other funds - - 463,384 280,000 743,384 Health insurance claims payable - - - 340,362 340,362
Total current liabilities 30,980 52,456 503,881 681,794 1,269,111
NONCURRENT LIABILITIES
Compensated absences 47,533 25,024 26,334 - 98,891
OPEB liability - supplemental death 26,539 14,466 14,769 - 55,774
OPEB liability - retiree health 41,763 16,258 22,269 - 80,290
Net pension liability 194,707 106,131 108,352 - 409,190
Total noncurrent liabilities 310,542 161,879 171,724 - 644,145
DEFERRED INFLOWS OF RESOURCES
Deferred inflows related to OPEB - supplemental death 2,095 1,142 1,166 - 4,403
Deferred inflows related to OPEB - retiree health 12,953 5,043 6,907 - 24,903
Deferred inflows related to pension plan 29,225 15,930 16,263 - 61,418 Total deferred inflows of resources 44,273 22,115 24,336 - 90,724
NET POSITION
Net investment in capital assets 34,560 422,700 - - 457,260 Unrestricted 63,043 195,993 (656,504) (172,538) (570,006)
Total net position 97,603 618,693 (656,504) (172,538) (112,746)
Total liabilities, deferred inflows of resources,
and net position 483,398$ 855,143$ 43,437$ 509,256$ 1,891,234$
INTERNAL SERVICE FUNDS
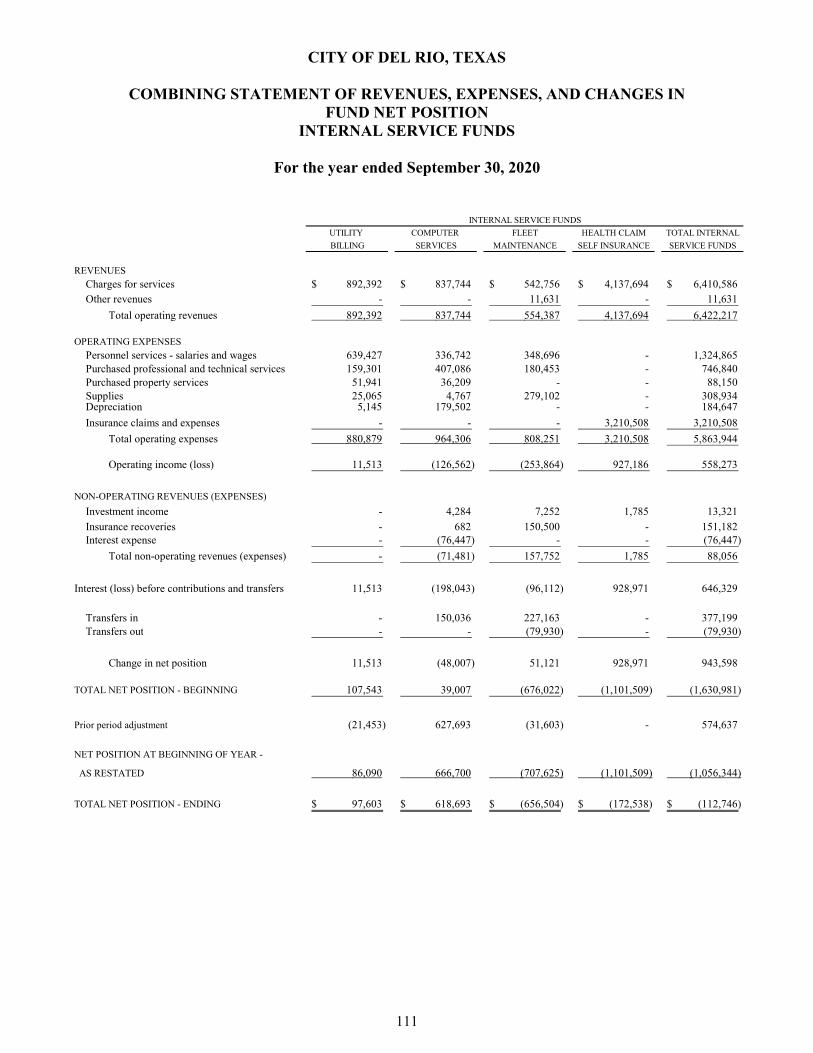
CITY OF DEL RIO, TEXAS
COMBINING STATEMENT OF REVENUES, EXPENSES, AND CHANGES IN FUND NET POSITION
INTERNAL SERVICE FUNDS
For the year ended September 30, 2020
111
UTILITY COMPUTER FLEET HEALTH CLAIM TOTAL INTERNAL
BILLING SERVICES MAINTENANCE SELF INSURANCE SERVICE FUNDS
REVENUES
Charges for services 892,392$ 837,744$ 542,756$ 4,137,694$ 6,410,586$ Other revenues - - 11,631 - 11,631
Total operating revenues 892,392 837,744 554,387 4,137,694 6,422,217
OPERATING EXPENSES
Personnel services - salaries and wages 639,427 336,742 348,696 - 1,324,865 Purchased professional and technical services 159,301 407,086 180,453 - 746,840 Purchased property services 51,941 36,209 - - 88,150 Supplies 25,065 4,767 279,102 - 308,934 Depreciation 5,145 179,502 - - 184,647
Insurance claims and expenses - - - 3,210,508 3,210,508
Total operating expenses 880,879 964,306 808,251 3,210,508 5,863,944
Operating income (loss) 11,513 (126,562) (253,864) 927,186 558,273
NON-OPERATING REVENUES (EXPENSES)
Investment income - 4,284 7,252 1,785 13,321
Insurance recoveries - 682 150,500 - 151,182 Interest expense - (76,447) - - (76,447)
Total non-operating revenues (expenses) - (71,481) 157,752 1,785 88,056
Interest (loss) before contributions and transfers 11,513 (198,043) (96,112) 928,971 646,329
Transfers in - 150,036 227,163 - 377,199 Transfers out - - (79,930) - (79,930)
Change in net position 11,513 (48,007) 51,121 928,971 943,598
TOTAL NET POSITION - BEGINNING 107,543 39,007 (676,022) (1,101,509) (1,630,981)
Prior period adjustment (21,453) 627,693 (31,603) - 574,637
NET POSITION AT BEGINNING OF YEAR -
AS RESTATED 86,090 666,700 (707,625) (1,101,509) (1,056,344)
TOTAL NET POSITION - ENDING 97,603$ 618,693$ (656,504)$ (172,538)$ (112,746)$
INTERNAL SERVICE FUNDS
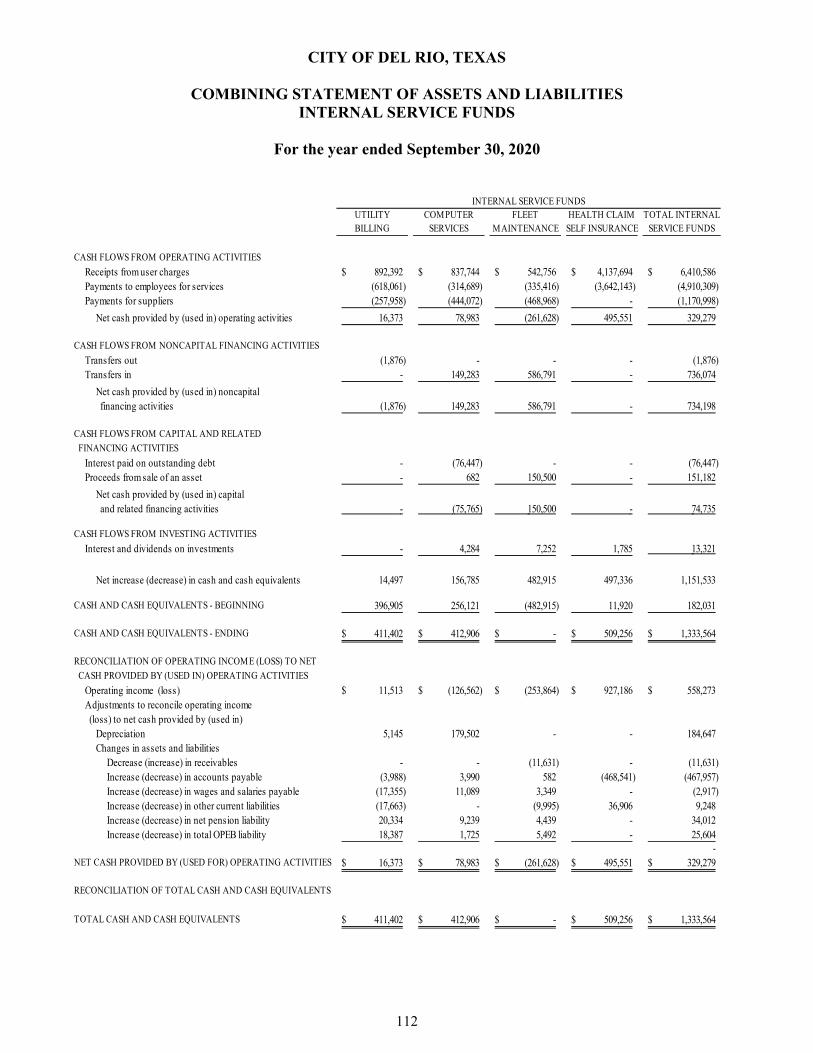
CITY OF DEL RIO, TEXAS
COMBINING STATEMENT OF ASSETS AND LIABILITIES INTERNAL SERVICE FUNDS
For the year ended September 30, 2020
112
UTILITY COMPUTER FLEET HEALTH CLAIM TOTAL INTERNALBILLING SERVICES MAINTENANCE SELF INSURANCE SERVICE FUNDS
CASH FLOWS FROM OPERATING ACTIVITIES
Receipts from user charges 892,392$ 837,744$ 542,756$ 4,137,694$ 6,410,586$ Payments to employees for services (618,061) (314,689) (335,416) (3,642,143) (4,910,309) Payments for suppliers (257,958) (444,072) (468,968) - (1,170,998)
Net cash provided by (used in) operating activities 16,373 78,983 (261,628) 495,551 329,279
CASH FLOWS FROM NONCAPITAL FINANCING ACTIVITIES
Transfers out (1,876) - - - (1,876) Transfers in - 149,283 586,791 - 736,074
Net cash provided by (used in) noncapital financing activities (1,876) 149,283 586,791 - 734,198
CASH FLOWS FROM CAPITAL AND RELATED
FINANCING ACTIVITIES
Interest paid on outstanding debt - (76,447) - - (76,447) Proceeds from sale of an asset - 682 150,500 - 151,182
Net cash provided by (used in) capital and related financing activities - (75,765) 150,500 - 74,735
CASH FLOWS FROM INVESTING ACTIVITIES
Interest and dividends on investments - 4,284 7,252 1,785 13,321
Net increase (decrease) in cash and cash equivalents 14,497 156,785 482,915 497,336 1,151,533
CASH AND CASH EQUIVALENTS - BEGINNING 396,905 256,121 (482,915) 11,920 182,031
CASH AND CASH EQUIVALENTS - ENDING 411,402$ 412,906$ -$ 509,256$ 1,333,564$
RECONCILIATION OF OPERATING INCOME (LOSS) TO NET
CASH PROVIDED BY (USED IN) OPERATING ACTIVITIES
Operating income (loss) 11,513$ (126,562)$ (253,864)$ 927,186$ 558,273$ Adjustments to reconcile operating income (loss) to net cash provided by (used in)
Depreciation 5,145 179,502 - - 184,647 Changes in assets and liabilities
Decrease (increase) in receivables - - (11,631) - (11,631) Increase (decrease) in accounts payable (3,988) 3,990 582 (468,541) (467,957) Increase (decrease) in wages and salaries payable (17,355) 11,089 3,349 - (2,917) Increase (decrease) in other current liabilities (17,663) - (9,995) 36,906 9,248 Increase (decrease) in net pension liability 20,334 9,239 4,439 - 34,012 Increase (decrease) in total OPEB liability 18,387 1,725 5,492 - 25,604
- NET CASH PROVIDED BY (USED FOR) OPERATING ACTIVITIES 16,373$ 78,983$ (261,628)$ 495,551$ 329,279$
RECONCILIATION OF TOTAL CASH AND CASH EQUIVALENTS
TOTAL CASH AND CASH EQUIVALENTS 411,402$ 412,906$ -$ 509,256$ 1,333,564$
INTERNAL SERVICE FUNDS

AGENCY FUNDS

CITY OF DEL RIO, TEXAS
COMBINING STATEMENT OF ASSETS AND LIABILITIES AGENCY FUNDS
For the year ended September 30, 2020
114
BALANCE BALANCE
SEPTEMBER 30, 2019 ADDITIONS DEDUCTIONS SEPTEMBER 30, 2020
VAL VERDE MIGRATORY
Assets:
Due from other funds 1,102$ -$ -$ 1,102$
Total assets 1,102$ -$ -$ 1,102$
Liabilities:
Intergovernmental payable 1,102$ -$ -$ 1,102$
Total liabilities 1,102$ -$ -$ 1,102$
BROWN PLAZA ASSOCIATION
Assets:
Accounts receivable 7,580$ -$ (7,580)$ -$
Total assets -$ -$ -$ -$
Liabilities:
Intergovernmental payable 7,580$ -$ (7,580)$ -$
Total liabilities 7,580$ -$ (7,580)$ -$
FAMILIAS UNIDAS FUND
Assets:
Cash and cash equivalents 2,909$ 14$ -$ 2,923$
Total assets 2,909$ 14$ -$ 2,923$
Liabilities:
Intergovernmental payable 2,909$ 14$ -$ 2,923$
Total liabilities 2,909$ 14$ -$ 2,923$
TOTAL AGENCY FUNDS
Assets:
Cash and cash equivalents 2,909$ 14$ -$ 2,923$
Accounts receivable 7,580 - (7,580) -
Due from other funds 1,102 - - 1,102
Total assets 11,591$ 14$ (7,580)$ 4,025$
Liabilities:

STATISTICAL SECTION

117
STATISTICAL SECTION
This portion of the City of Del Rio, Texas’ comprehensive annual financial report presents multiple years of data to provide a historical perspective for understanding the information available in the financial statements, note disclosures, and required supplementary information and for assessing the City’s overall financial health. Contents Schedules Financial Trends 1 through 4 These schedules contain trend information to help the reader understand how the City’s financial performance and well-being have changed over time. Revenue Capacity 5 through 16 These schedules contain trend information to help the reader assess the City’s most significant own-source revenues. This section covers the City’s most significant own-source revenues and property tax. Additionally, water revenues, the City’s most significant own- source revenue is presented. Debt Capacity 17 through 21 These schedules contain trend information to help the reader assess the affordability of the City’s current levels of outstanding debt and the City’s ability to issue additional debt in the future. Demographic and Economic Information 22 through 24 These schedules contain demographic and economic indicators to help the reader understand the environment within which the City’s financial activities take place. Operating Information 25 through 28 These schedules contain service and infrastructure data to help the reader understand how the information in the City’s financial report relates to the services the City provides and the activities it performs.
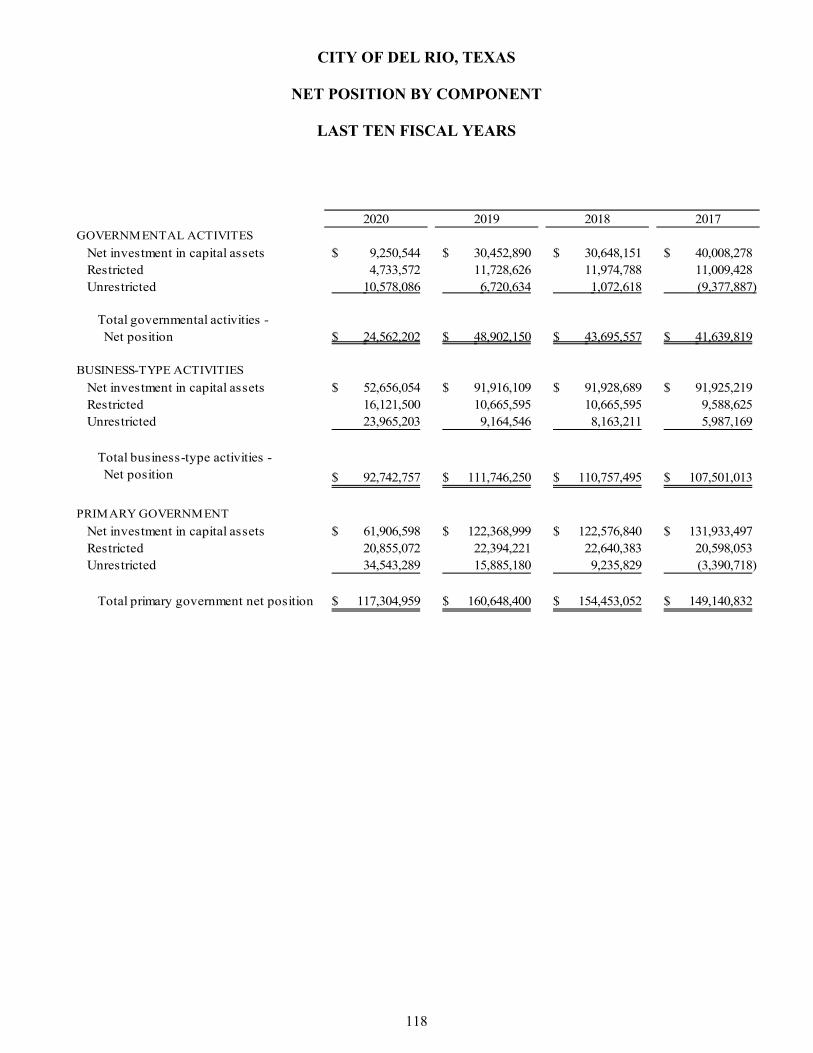
CITY OF DEL RIO, TEXAS
NET POSITION BY COMPONENT
LAST TEN FISCAL YEARS
118
2020 2019 2018 2017GOVERNMENTAL ACTIVITES
Net investment in capital assets 9,250,544$ 30,452,890$ 30,648,151$ 40,008,278$ Restricted 4,733,572 11,728,626 11,974,788 11,009,428 Unrestricted 10,578,086 6,720,634 1,072,618 (9,377,887)
Total governmental activities - Net position 24,562,202$ 48,902,150$ 43,695,557$ 41,639,819$
BUSINESS-TYPE ACTIVITIES
Net investment in capital assets 52,656,054$ 91,916,109$ 91,928,689$ 91,925,219$ Restricted 16,121,500 10,665,595 10,665,595 9,588,625 Unrestricted 23,965,203 9,164,546 8,163,211 5,987,169
Total business-type activities - Net position 92,742,757$ 111,746,250$ 110,757,495$ 107,501,013$
PRIMARY GOVERNMENT
Net investment in capital assets 61,906,598$ 122,368,999$ 122,576,840$ 131,933,497$ Restricted 20,855,072 22,394,221 22,640,383 20,598,053 Unrestricted 34,543,289 15,885,180 9,235,829 (3,390,718)
Total primary government net position 117,304,959$ 160,648,400$ 154,453,052$ 149,140,832$

119
TABLE 1
2016 2015 2014 2013 2012 2011
35,027,514$ 40,825,627$ 32,532,955$ 21,239,563$ 30,094,478$ 28,439,174$ 11,855,072 8,373,481 9,685,551 10,715,001 3,275,235 2,779,842 (6,902,428) (7,649,221) 1,737,881 9,406,353 4,375,410 2,781,774
39,980,158$ 41,549,887$ 43,956,387$ 41,360,917$ 37,745,123$ 34,000,790$
85,769,004$ -$ 92,403,125$ 85,158,552$ 85,686,393$ 77,061,062$ 6,465,764 85,769,004 4,072,376 4,235,870 4,568,985 5,472,357
11,007,831 6,465,764 738,870 8,344,411 2,806,854 5,983,993 7,529,438
103,242,599$ 99,764,206$ 97,214,371$ 97,738,833$ 93,062,232$ 88,517,412$
120,796,518$ 126,594,631$ 124,936,080$ 106,398,115$ 115,780,871$ 105,500,236$ 18,320,836 14,839,245 13,757,927 14,950,871 7,844,220 8,252,199 4,105,403 (119,783) 2,476,751 17,750,764 7,182,264 8,765,767
143,222,757$ 141,314,093$ 141,170,758$ 139,099,750$ 130,807,355$ 122,518,202$

CITY OF DEL RIO, TEXAS
CHANGES IN NET POSITION
LAST TEN FISCAL YEARS
120
2020 2019 2018 2017EXPENSES
Governmental activitiesGeneral government 5,857,764$ 5,570,359$ 5,963,317$ 4,854,557$ Public safety 14,341,323 14,624,005 14,233,556 14,405,970 Highway and streets 4,424,114 2,391,841 3,803,318 4,647,003 Health and welfare 1,373,962 1,197,126 964,785 1,343,231 Culture and recreation 2,856,215 3,279,251 3,393,409 2,893,674 Economic development and assistance 137,074 14,383 90,130 138,535 Intergovernmental - - - 3,478,339 Debt service 1,381,449 1,102,269 1,729,669 1,859,915
Total governmental activities 30,371,901 28,179,234 30,178,184 33,621,224
Business-type activitiesGas system fund 2,265,270 2,591,363 2,454,760 2,426,143 Water fund 8,585,959 7,261,565 7,378,265 7,651,657 Wastewater fund 904,678 2,426,928 3,455,699 3,877,611 International bridge 1,988,263 3,120,646 1,196,366 1,166,073 International airport 2,759,274 4,803,660 1,217,028 2,050,002 Refuse / landfill fund 5,760,442 4,275,922 4,928,483 4,364,904 Municipal facility 4,215,601 731,557 797,319 811,213 Utility billing - 828,716 840,282 -
Total business-type activities 26,479,487 26,040,357 22,268,202 22,347,603
Total primary government expenses 56,851,388$ 54,219,591$ 52,446,386$ 55,968,827$
PROGRAM REVENUES
Governmental activitiesCharges for services
General government 1,653,606 1,143,451 1,273,290 1,228,851 Public safety 303,526 343,982 467,064 484,153 Highway and streets 279,647 286,856 367,446 452,437 Health and welfare 5,584 - - 19,206 Culture and recreation 312,737 96,387 72,250 367,182
Operating grants and contributions 5,146,039 1,741,085 2,263,264 1,813,860 Capital grants and contributions 1,106,848 - - -
Total governmental activities program revenues 8,807,987 3,611,761 4,443,314 4,365,689
Business-type activitiesCharges for services
Gas system fund 3,152,953 4,420,447 4,070,259 3,708,192 Water fund 9,703,874 9,581,045 11,016,562 10,440,660 Wastewater fund 4,588,707 5,090,017 4,535,420 4,503,704 International bridge 6,479,801 8,083,239 8,234,072 7,856,149 International airport 409,054 344,493 453,932 74,052 Refuse fund 6,316,821 5,839,319 5,550,424 5,894,198 Municipal facility 118,198 182,442 215,959 280,134 Utility billing - 827,532 816,652 -
Operating grants and contributions 519,000 24,267 15,838 - Capital grants and contributions - - - -
Total business-type activities program revenues 31,288,408 34,392,801 34,909,118 32,757,089
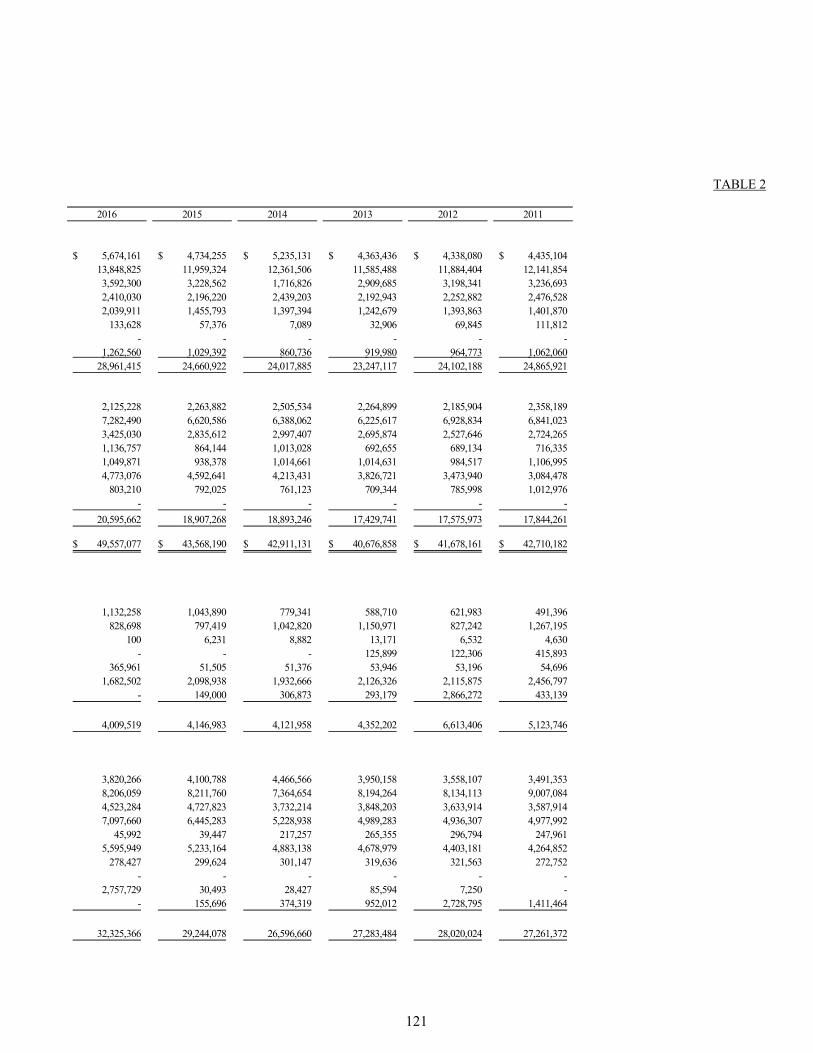
121
TABLE 2
2016 2015 2014 2013 2012 2011
5,674,161$ 4,734,255$ 5,235,131$ 4,363,436$ 4,338,080$ 4,435,104$ 13,848,825 11,959,324 12,361,506 11,585,488 11,884,404 12,141,854 3,592,300 3,228,562 1,716,826 2,909,685 3,198,341 3,236,693 2,410,030 2,196,220 2,439,203 2,192,943 2,252,882 2,476,528 2,039,911 1,455,793 1,397,394 1,242,679 1,393,863 1,401,870
133,628 57,376 7,089 32,906 69,845 111,812 - - - - - -
1,262,560 1,029,392 860,736 919,980 964,773 1,062,060 28,961,415 24,660,922 24,017,885 23,247,117 24,102,188 24,865,921
2,125,228 2,263,882 2,505,534 2,264,899 2,185,904 2,358,189 7,282,490 6,620,586 6,388,062 6,225,617 6,928,834 6,841,023 3,425,030 2,835,612 2,997,407 2,695,874 2,527,646 2,724,265 1,136,757 864,144 1,013,028 692,655 689,134 716,335 1,049,871 938,378 1,014,661 1,014,631 984,517 1,106,995 4,773,076 4,592,641 4,213,431 3,826,721 3,473,940 3,084,478
803,210 792,025 761,123 709,344 785,998 1,012,976 - - - - - -
20,595,662 18,907,268 18,893,246 17,429,741 17,575,973 17,844,261
49,557,077$ 43,568,190$ 42,911,131$ 40,676,858$ 41,678,161$ 42,710,182$
1,132,258 1,043,890 779,341 588,710 621,983 491,396 828,698 797,419 1,042,820 1,150,971 827,242 1,267,195
100 6,231 8,882 13,171 6,532 4,630 - - - 125,899 122,306 415,893
365,961 51,505 51,376 53,946 53,196 54,696 1,682,502 2,098,938 1,932,666 2,126,326 2,115,875 2,456,797
- 149,000 306,873 293,179 2,866,272 433,139
4,009,519 4,146,983 4,121,958 4,352,202 6,613,406 5,123,746
3,820,266 4,100,788 4,466,566 3,950,158 3,558,107 3,491,353 8,206,059 8,211,760 7,364,654 8,194,264 8,134,113 9,007,084 4,523,284 4,727,823 3,732,214 3,848,203 3,633,914 3,587,914 7,097,660 6,445,283 5,228,938 4,989,283 4,936,307 4,977,992
45,992 39,447 217,257 265,355 296,794 247,961 5,595,949 5,233,164 4,883,138 4,678,979 4,403,181 4,264,852
278,427 299,624 301,147 319,636 321,563 272,752 - - - - - -
2,757,729 30,493 28,427 85,594 7,250 - - 155,696 374,319 952,012 2,728,795 1,411,464
32,325,366 29,244,078 26,596,660 27,283,484 28,020,024 27,261,372
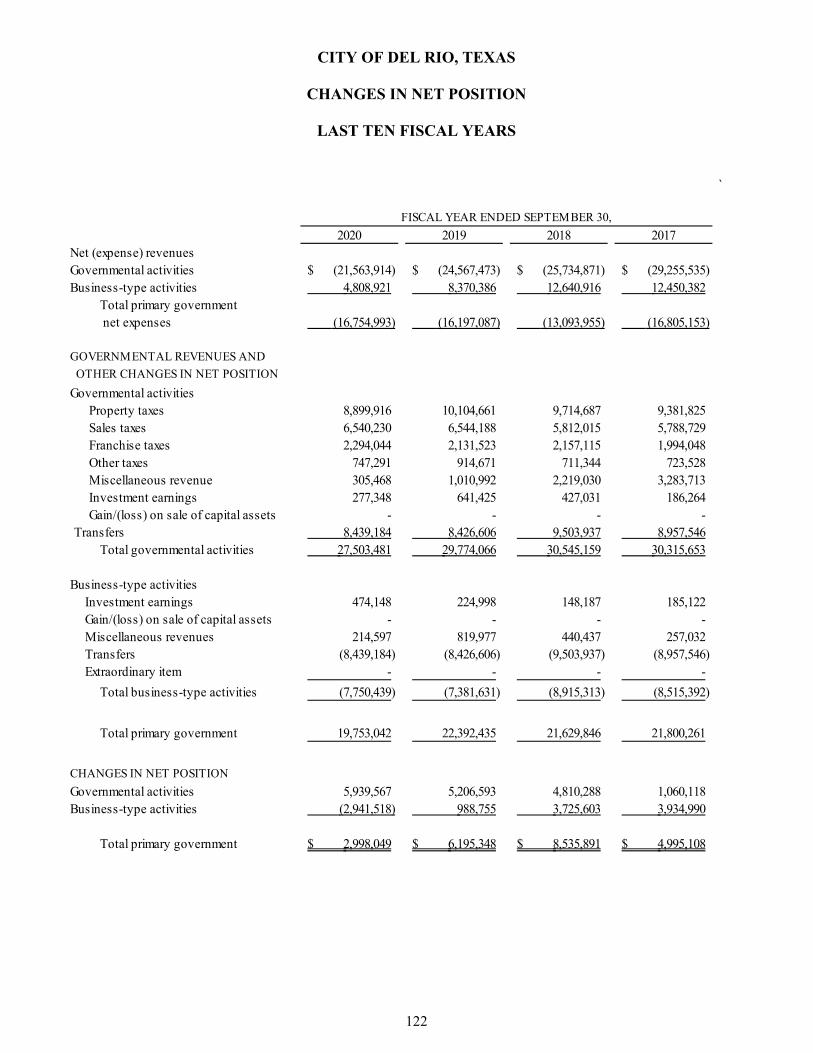
CITY OF DEL RIO, TEXAS
CHANGES IN NET POSITION
LAST TEN FISCAL YEARS
122
`
2020 2019 2018 2017Net (expense) revenuesGovernmental activities (21,563,914)$ (24,567,473)$ (25,734,871)$ (29,255,535)$ Business-type activities 4,808,921 8,370,386 12,640,916 12,450,382
Total primary government net expenses (16,754,993) (16,197,087) (13,093,955) (16,805,153)
GOVERNMENTAL REVENUES AND
OTHER CHANGES IN NET POSITION
Governmental activitiesProperty taxes 8,899,916 10,104,661 9,714,687 9,381,825 Sales taxes 6,540,230 6,544,188 5,812,015 5,788,729 Franchise taxes 2,294,044 2,131,523 2,157,115 1,994,048 Other taxes 747,291 914,671 711,344 723,528 Miscellaneous revenue 305,468 1,010,992 2,219,030 3,283,713 Investment earnings 277,348 641,425 427,031 186,264 Gain/(loss) on sale of capital assets - - - -
Transfers 8,439,184 8,426,606 9,503,937 8,957,546 Total governmental activities 27,503,481 29,774,066 30,545,159 30,315,653
Business-type activitiesInvestment earnings 474,148 224,998 148,187 185,122 Gain/(loss) on sale of capital assets - - - - Miscellaneous revenues 214,597 819,977 440,437 257,032 Transfers (8,439,184) (8,426,606) (9,503,937) (8,957,546) Extraordinary item - - - -
Total business-type activities (7,750,439) (7,381,631) (8,915,313) (8,515,392)
Total primary government 19,753,042 22,392,435 21,629,846 21,800,261
CHANGES IN NET POSITION
Governmental activities 5,939,567 5,206,593 4,810,288 1,060,118 Business-type activities (2,941,518) 988,755 3,725,603 3,934,990
Total primary government 2,998,049$ 6,195,348$ 8,535,891$ 4,995,108$
FISCAL YEAR ENDED SEPTEMBER 30,

123
TABLE 2 (continued)
2016 2015 2014 2013 2012 2011
(24,951,896)$ (20,513,939)$ (19,895,927)$ (18,894,915)$ (17,488,782)$ (19,742,175)$ 11,729,704 10,336,813 7,703,414 9,853,743 10,444,051 9,417,111
(13,222,192) (10,177,126) (12,192,513) (9,041,172) (7,044,731) (10,325,064)
8,275,120 7,505,986 7,332,506 7,062,447 6,985,551 6,912,233 6,272,967 6,073,376 5,882,474 5,738,923 5,411,954 5,238,347 2,037,414 2,024,004 1,976,006 1,841,464 1,992,396 1,974,405
720,565 705,870 631,427 626,721 654,379 624,430 1,060,195 299,149 542,462 582,266 137,336 63,978
40,409 12,888 7,400 12,822 14,050 19,618 - - - 35,103 81,446 (16,111)
7,429,600 6,547,158 6,594,540 6,610,962 5,956,002 5,264,793 25,836,270 23,168,431 22,966,815 22,510,708 21,233,114 20,081,693
57,219 27,459 22,982 26,431 45,892 55,110 - - 8,325 7,389 10,879 16,343
276,064 244,447 - - - 85,000 (7,429,600) (6,547,158) (6,594,540) (6,610,962) (5,956,002) (5,264,793)
- - - 1,400,000 - -
(7,096,317) (6,275,252) (6,563,233) (5,177,142) (5,899,231) (5,108,340)
18,739,953 16,893,179 16,403,582 17,333,566 15,333,883 14,973,353
884,374 2,654,492 3,070,888 3,615,793 3,744,332 339,518 4,633,387 4,061,561 1,140,181 4,676,601 4,544,820 4,308,771
5,517,761$ 6,716,053$ 4,211,069$ 8,292,394$ 8,289,152$ 4,648,289$
FISCAL YEAR ENDED SEPTEMBER 30,

CITY OF DEL RIO, TEXAS
FUND BALANCES GOVERNMENTAL FUNDS
LAST TEN FISCAL YEARS
124
2020 2019 2018 2017GENERAL FUND
Nonspendable $ 165,559 141,417$ 139,814$ 71,083$ Restricted - 3,958,229 3,958,229 191,148 Assigned - 30,550 30,550 3,534,494 Unassigned 21,229,822 15,561,038 11,976,448 11,749,285
Total general fund 21,395,381 19,691,234 16,105,041$ 15,546,010$
ALL OTHER
GOVERNMENTAL FUNDS
Nonspendable $ 29,314 -$ -$ -$
Restricted 13,765,957 7,734,299 7,734,299 10,899,474
Assigned - 6,618,472 (510,068) 571,204
Unassigned (1,354,061) (4,555,469) 1,483,628 (1,609,154)
Total all other governmental funds 12,441,210$ 9,797,302$ 8,707,859$ 9,861,524$
Total fund balance 33,836,591$ 29,488,536$ 24,812,900$ 25,407,534$
FISCAL YEAR ENDED SEPTEMBER 30,
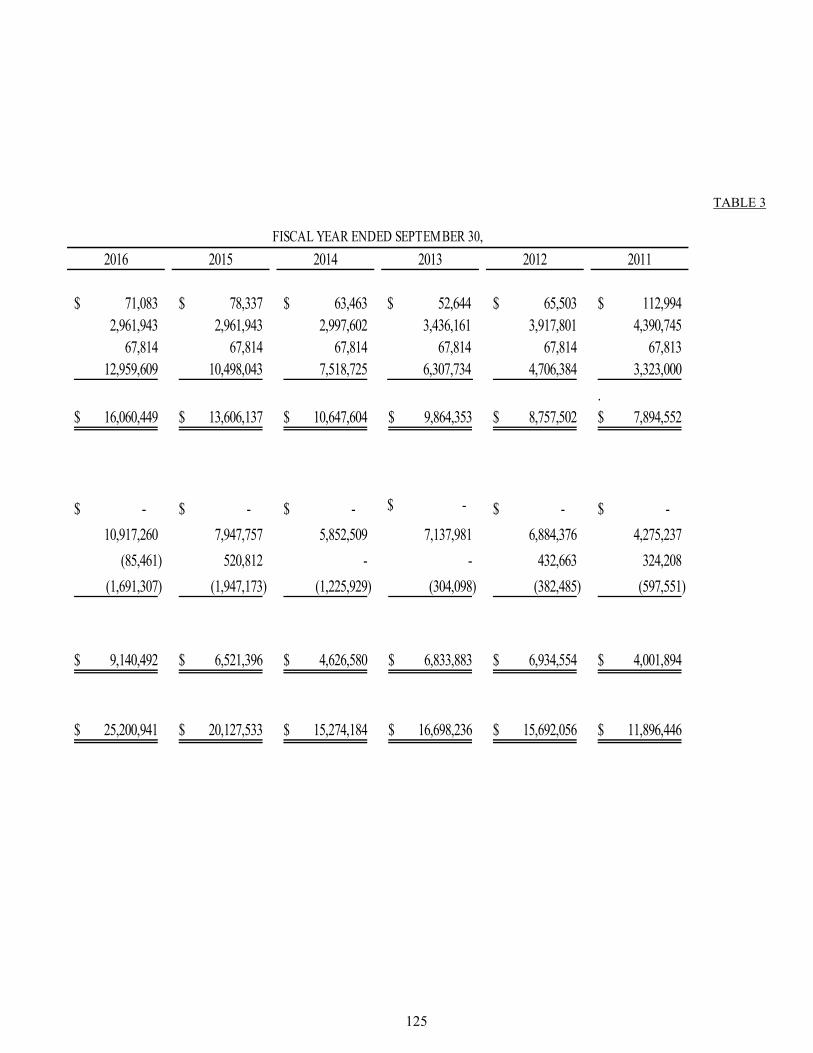
125
TABLE 3
2016 2015 2014 2013 2012 2011
71,083$ 78,337$ 63,463$ $ 52,644 65,503$ 112,994$ 2,961,943 2,961,943 2,997,602 3,436,161 3,917,801 4,390,745
67,814 67,814 67,814 67,814 67,814 67,813 12,959,609 10,498,043 7,518,725 6,307,734 4,706,384 3,323,000
.16,060,449$ 13,606,137$ 10,647,604$ 9,864,353$ 8,757,502$ 7,894,552$
-$ -$ -$ $ - -$ -$
10,917,260 7,947,757 5,852,509 7,137,981 6,884,376 4,275,237
(85,461) 520,812 - - 432,663 324,208
(1,691,307) (1,947,173) (1,225,929) (304,098) (382,485) (597,551)
9,140,492$ 6,521,396$ 4,626,580$ 6,833,883$ 6,934,554$ 4,001,894$
25,200,941$ 20,127,533$ 15,274,184$ 16,698,236$ 15,692,056$ 11,896,446$
FISCAL YEAR ENDED SEPTEMBER 30,
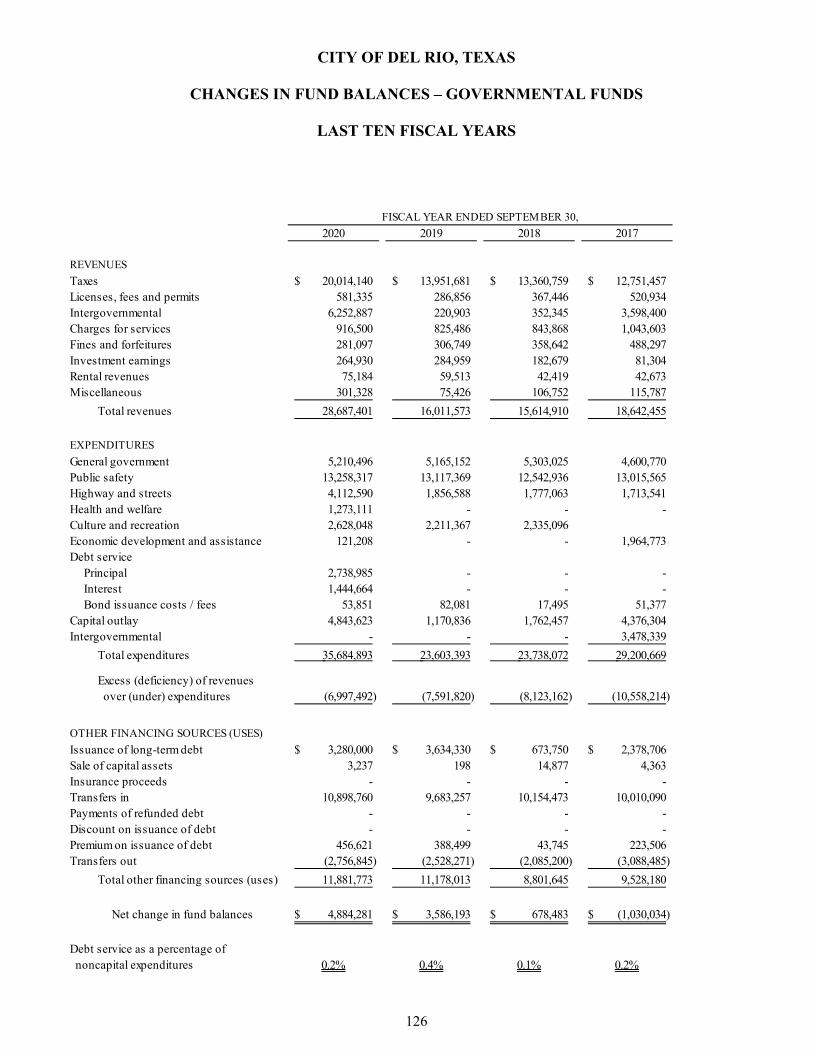
CITY OF DEL RIO, TEXAS
CHANGES IN FUND BALANCES – GOVERNMENTAL FUNDS
LAST TEN FISCAL YEARS
126
2020 2019 2018 2017
REVENUES
Taxes 20,014,140$ 13,951,681$ 13,360,759$ 12,751,457$ Licenses, fees and permits 581,335 286,856 367,446 520,934 Intergovernmental 6,252,887 220,903 352,345 3,598,400 Charges for services 916,500 825,486 843,868 1,043,603 Fines and forfeitures 281,097 306,749 358,642 488,297 Investment earnings 264,930 284,959 182,679 81,304 Rental revenues 75,184 59,513 42,419 42,673 Miscellaneous 301,328 75,426 106,752 115,787
Total revenues 28,687,401 16,011,573 15,614,910 18,642,455
EXPENDITURES
General government 5,210,496 5,165,152 5,303,025 4,600,770 Public safety 13,258,317 13,117,369 12,542,936 13,015,565 Highway and streets 4,112,590 1,856,588 1,777,063 1,713,541 Health and welfare 1,273,111 - - - Culture and recreation 2,628,048 2,211,367 2,335,096 Economic development and assistance 121,208 - - 1,964,773 Debt service
Principal 2,738,985 - - - Interest 1,444,664 - - - Bond issuance costs / fees 53,851 82,081 17,495 51,377
Capital outlay 4,843,623 1,170,836 1,762,457 4,376,304 Intergovernmental - - - 3,478,339
Total expenditures 35,684,893 23,603,393 23,738,072 29,200,669
Excess (deficiency) of revenues over (under) expenditures (6,997,492) (7,591,820) (8,123,162) (10,558,214)
OTHER FINANCING SOURCES (USES)
Issuance of long-term debt 3,280,000$ 3,634,330$ 673,750$ 2,378,706$ Sale of capital assets 3,237 198 14,877 4,363 Insurance proceeds - - - - Transfers in 10,898,760 9,683,257 10,154,473 10,010,090 Payments of refunded debt - - - - Discount on issuance of debt - - - - Premium on issuance of debt 456,621 388,499 43,745 223,506 Transfers out (2,756,845) (2,528,271) (2,085,200) (3,088,485)
Total other financing sources (uses) 11,881,773 11,178,013 8,801,645 9,528,180
Net change in fund balances 4,884,281$ 3,586,193$ 678,483$ (1,030,034)$
Debt service as a percentage of noncapital expenditures 0.2% 0.4% 0.1% 0.2%
FISCAL YEAR ENDED SEPTEMBER 30,

127
TABLE 4
2016 2015 2014 2013 2012 2011
13,309,639$ 13,012,244$ 15,726,892$ 15,188,483$ 14,985,035$ 14,643,583$ 547,539 550,772 365,842 423,404 412,251 501,714 232,755 228,201 2,239,539 2,214,224 4,746,566 2,889,936 957,695 557,890 767,696 774,052 1,072,062 1,339,367 821,783 790,383 1,028,273 1,107,812 783,442 724,047 17,179 4,198 6,551 12,196 13,136 18,986
111,671 27,240 57,265 61,056 69,017 68,350 475,320 90,962 136,547 586,044 150,366 62,383
16,473,581 15,261,890 20,328,605 20,367,271 22,231,875 20,248,366
4,591,281 4,186,897 4,674,541 4,322,928 4,272,769 4,458,863 12,380,362 12,160,539 11,152,847 11,471,735 11,573,041 11,716,760 1,653,314 1,529,923 1,516,886 1,452,588 1,928,797 2,226,133
- - 2,205,687 2,096,736 2,170,036 2,364,034 1,863,428 1,432,748 1,253,812 1,207,258 1,325,031 1,397,891
- 1,523 6,444 36,086 69,856 111,882
- - 2,651,412 2,463,100 2,170,970 2,159,324 - - 916,088 995,049 944,427 1,032,047
74,883 147,173 4,016 15,693 125,608 2,064 2,903,755 728,911 3,359,310 2,480,133 4,030,655 4,586,604
- - - - - -
23,467,023 20,187,714 27,741,043 26,541,306 28,611,190 30,055,602
(6,993,442) (4,925,824) (7,412,438) (6,174,035) (6,379,315) (9,807,236)
3,840,000$ 6,735,770$ -$ -$ 6,040,549$ -$ 11,057 16,941 - 712,000 6,560 30,588
- - - 6,525 - - 8,084,395 7,568,328 - - 8,624,846 8,941,411
- (5,372,773) 9,587,059 9,168,274 (1,741,052) - - - - - - -
487,116 592,158 - (107) 58,933 - (2,974,815) (1,656,067) (3,598,673) (2,706,477) (2,814,911) (3,341,972)
9,447,753 7,884,357 5,988,386 7,180,215 10,174,925 5,630,027
2,454,311$ 2,958,533$ (1,424,052)$ 1,006,180$ 3,795,610$ (4,177,209)$
0.4% 0.8% 0.0% 0.1% 0.5% 0.0%
FISCAL YEAR ENDED SEPTEMBER 30,

CITY OF DEL RIO, TEXAS
ASSESSED VALUE AND ESTIMATED ACTUAL VALUE OF TAXABLE PROPERTY
LAST TEN FISCAL YEARS
128
LESS:
FISCAL TAX RESIDENTIAL AGRICULTURAL COMMERCIAL PERSONAL TAX-EXEMPT
YEAR YEAR PROPERTY PROPERTY PROPERTY PROPERTY PROPERTY
2011 2010 892,426,147$ 11,834,100$ 236,179,154$ 150,775,250$ 110,841,437$ 2012 2011 918,298,747 11,385,330 230,830,004 155,073,980 107,192,764 2013 2012 919,902,239 10,900,800 234,891,584 160,904,940 106,512,329 2014 2013 947,474,553 9,762,680 258,160,449 306,558,130 252,406,012 2015 2014 958,733,473 9,504,940 266,388,827 330,663,087 273,864,440 2016 2015 969,584,942 13,343,700 298,274,360 326,207,700 268,342,217 2017 2016 1,016,220,080 13,952,020 293,160,090 336,015,334 23,207,259 2018 2017 1,009,976,536 7,214,843 307,533,482 105,637,086 293,520,757 2019 2018 1,020,384,214 7,368,828 304,417,267 104,141,286 297,884,085 2020 2019 1,082,496,537 7,540,537 317,217,410 100,997,592 309,020,474
Source: Val Verde County Appraisal District
Note: Property in Val Verde County is reassessed once every three years on average. Tax rates are per $100 of assessed value.
REAL PROPERTY

129
TABLE 5
ESTIMATED ASSESSED VALUE
TOTAL TAXABLE TOTAL ACTUAL AS A PERCENTAGE
ASSESSED DIRECT TAX TAXABLE OF ACTUAL
VALUE RATE PER $100 VALUE VALUE
1,180,373,214$ 0.57555 1,291,214,651$ 91.42%1,208,395,297 0.57555 1,315,588,061 91.85%1,220,087,234 0.57555 1,326,599,563 91.97%1,269,549,800 0.57881 1,521,955,812 83.42%1,291,425,887 0.58881 1,565,290,327 82.50%1,339,068,485 0.64000 1,607,410,702 83.31%1,636,140,265 0.68458 1,659,347,524 98.60%1,136,841,190 0.68458 1,430,361,947 79.48%1,138,427,510 0.71516 1,436,311,595 79.26%1,199,231,602 0.73091 1,508,252,076 79.51%

CITY OF DEL RIO, TEXAS
DIRECT AND OVERLAPPING PROPERTY TAX RATES
LAST TEN FISCAL YEARS
130
GENERAL
FISCAL YEAR MAINTENANCE OBLIGATION TOTALENDED TAX AND DEBT DIRECT
SEPTEMBER 30, YEAR OPERATIONS SERVICE RATE
2011 2010 0.432950 0.142600 0.57555
2012 2011 0.433050 0.142500 0.57555
2013 2012 0.430450 0.145100 0.57555
2014 2013 0.433990 0.144820 0.57881
2015 2014 0.387700 0.201110 0.58881
2016 2015 0.376750 0.263250 0.64000
2017 2016 0.376517 0.308059 0.68458
2018 2017 0.385856 0.298720 0.68458
2019 2018 0.386741 0.328418 0.71516
2020 2019 0.388649 0.34226 0.730910
Source: Val Verde County Tax Office
CITY DIRECT RATES

131
TABLE 6
SAN FELIPE VAL VERDE TOTAL DIRECT
DEL RIO VAL VERDE REGIONAL AND OVERLAPPING
SCHOOL DISTRICT COUNTY HOSPITAL DEBT
1.185000 0.445700 0.12458 2.330830
1.188720 0.445700 0.12420 2.334170
1.179500 0.445700 0.12513 2.325880
1.172400 0.445700 0.11920 2.316110
1.167900 0.481800 0.11650 2.355010
1.160300 0.481800 0.11130 2.393400
1.159800 0.495500 0.10614 2.446019
1.159800 0.499300 0.10770 2.451376
1.159800 0.500200 0.10640 2.481559
1.061730 0.499900 0.10100 2.393538

CITY OF DEL RIO, TEXAS
PRINCIPAL PROPERTY TAXPAYERS
CURRENT AND NINE YEARS AGO
132
TABLE 7
PERCENTAGE OF PERCENTAGE OFTOTAL CITY TOTAL CITY
TAXABLE TAXABLE TAXABLE TAXABLEASSESSED ASSESSED ASSESSED ASSESSED
TAXPAYER VALUE RANK VALUE VALUE RANK VALUE
ROUNDSPRINGS VAL VERDE WING 164,690,860$ 1 13.73% -$ 0.00%UNION PACIFIC RAILROAD CO. 80,028,800 2 6.67% 37,376,900 3.17%ELECTRIC TRANSMISSION OF TX 60,433,960 3 5.04% - 0.00%PLAINS PIPELINE LP 59,341,370 4 4.95% - 0.00%AEP TEXAS CENTRAL COMPANY 47,305,470 5 3.94% 23,401,130 1.98%CACTUS II PIPELINE LLC 38,777,420 6 3.23% - 0.00%THE GEO GROUP INCORPORATED 22,006,270 7 1.84% 25,080,070 2.12%LINE STAR NGL PIPELINE LLC 16,501,710 8 1.38% - 0.00%PLAZA-AI LLC 12,997,230 9 1.08% 9,222,150 0.78%USGP DEL RIO CH LP 9,598,180 10 0.80% 6,311,730 0.53%WAL MART REAL ESTATE - 0.00% 9,505,120 0.81%MALL SHOPPING CENTER INC - 0.00% 9,200,000 0.78%MAX & MAX, INC. - 0.00% 8,266,880 0.70%HOME DEPOT USA INC 7,655,420 0.65%DRASUR HOLDINGS LLC - 0.00% 6,391,270 0.54%
TOTAL 511,681,270$ 42.66% 142,410,670$ 12.06%
TOTAL TAXABLE ASSESSED VALUE 1,199,231,602$ 1,180,373,214$
Source: Val Verde County Appraisal District
FISCAL YEAR ENDED SEPTEMBER 30, 2020 FISCAL YEAR ENDED SEPTEMBER 30, 2011

CITY OF DEL RIO, TEXAS
PROPERTY TAX LEVIES AND COLLECTIONS
LAST TEN FISCAL YEARS (amounts expressed in thousands)
133
TABLE 8
FISCAL YEAR TAXES LEVIED COLLECTIONS TOTAL COLLECTIONS TO DATE
ENDED TAX FOR THE PERCENTAGE IN SUBSEQUENT PERCENTAGESEPTEMBER 30, YEAR FISCAL YEAR AMOUNT OF LEVY YEARS ADJUSTMENTS AMOUNT OF LEVY
2011 2010 6,524$ 6,126$ 93.90% 298$ (42)$ 6,424$ 98.47%2012 2011 6,654 6,294 94.59% 269 (25) 6,563 98.63%2013 2012 6,723 6,407 95.30% 233 (7) 6,640 98.77%2014 2013 7,053 6,683 94.75% 225 (44) 6,908 97.94%2015 2014 7,292 6,971 95.60% 172 (28) 7,143 97.96%2016 2015 8,154 7,799 95.65% 117 (17) 7,916 97.08%2017 2016 9,027 8,615 95.44% - (18) 8,615 95.44%2018 2017 9,194 8,760 95.28% 154 (53) 8,914 96.95%2019 2018 9,654 9,150 94.78% 142 (31) 9,292 96.25%2020 2019 10,297 9,773 94.91% 183 (28) 9,956 96.69%
Source: Val Verde County Tax Office
FISCAL YEAR OF THE LEVY
COLLECTED WITH THE
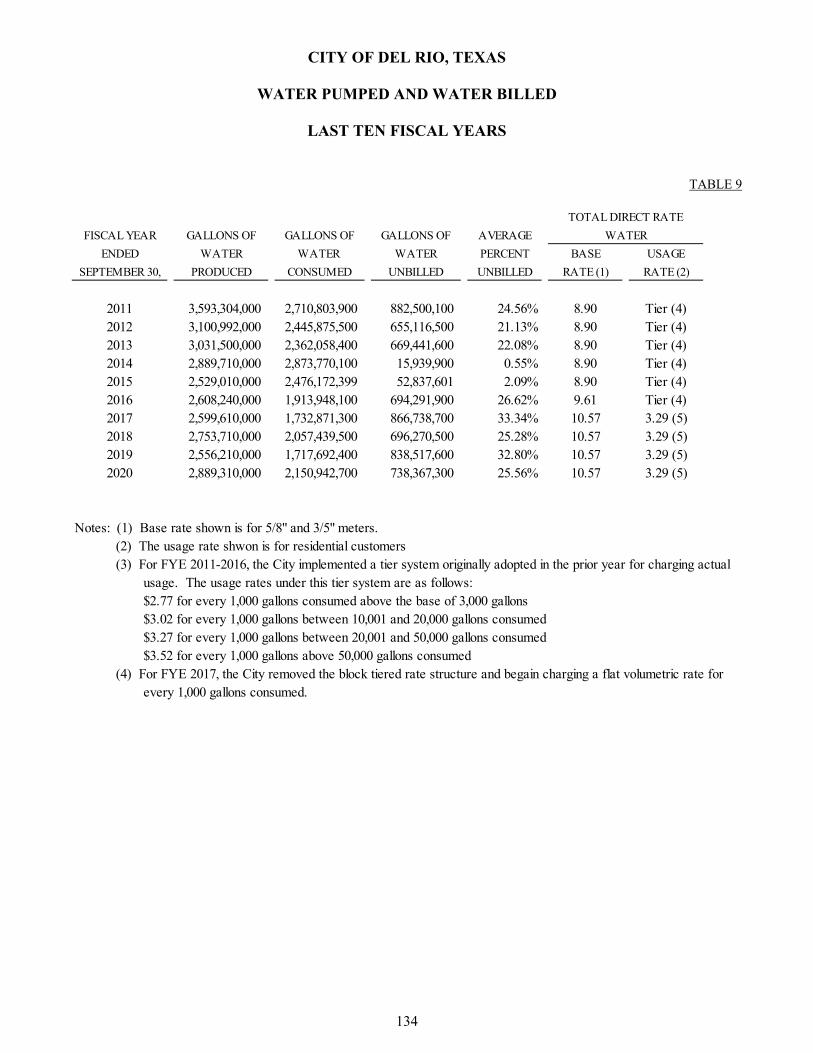
CITY OF DEL RIO, TEXAS
WATER PUMPED AND WATER BILLED
LAST TEN FISCAL YEARS
134
TABLE 9
FISCAL YEAR GALLONS OF GALLONS OF GALLONS OF AVERAGE
ENDED WATER WATER WATER PERCENT BASE USAGE
SEPTEMBER 30, PRODUCED CONSUMED UNBILLED UNBILLED RATE (1) RATE (2)
2011 3,593,304,000 2,710,803,900 882,500,100 24.56% 8.90 Tier (4)2012 3,100,992,000 2,445,875,500 655,116,500 21.13% 8.90 Tier (4)2013 3,031,500,000 2,362,058,400 669,441,600 22.08% 8.90 Tier (4)2014 2,889,710,000 2,873,770,100 15,939,900 0.55% 8.90 Tier (4)2015 2,529,010,000 2,476,172,399 52,837,601 2.09% 8.90 Tier (4)2016 2,608,240,000 1,913,948,100 694,291,900 26.62% 9.61 Tier (4)2017 2,599,610,000 1,732,871,300 866,738,700 33.34% 10.57 3.29 (5)2018 2,753,710,000 2,057,439,500 696,270,500 25.28% 10.57 3.29 (5)2019 2,556,210,000 1,717,692,400 838,517,600 32.80% 10.57 3.29 (5)2020 2,889,310,000 2,150,942,700 738,367,300 25.56% 10.57 3.29 (5)
Notes: (1) Base rate shown is for 5/8" and 3/5" meters. (2) The usage rate shwon is for residential customers(3) For FYE 2011-2016, the City implemented a tier system originally adopted in the prior year for charging actual
usage. The usage rates under this tier system are as follows:$2.77 for every 1,000 gallons consumed above the base of 3,000 gallons$3.02 for every 1,000 gallons between 10,001 and 20,000 gallons consumed$3.27 for every 1,000 gallons between 20,001 and 50,000 gallons consumed$3.52 for every 1,000 gallons above 50,000 gallons consumed
(4) For FYE 2017, the City removed the block tiered rate structure and begain charging a flat volumetric rate forevery 1,000 gallons consumed.
WATER
TOTAL DIRECT RATE
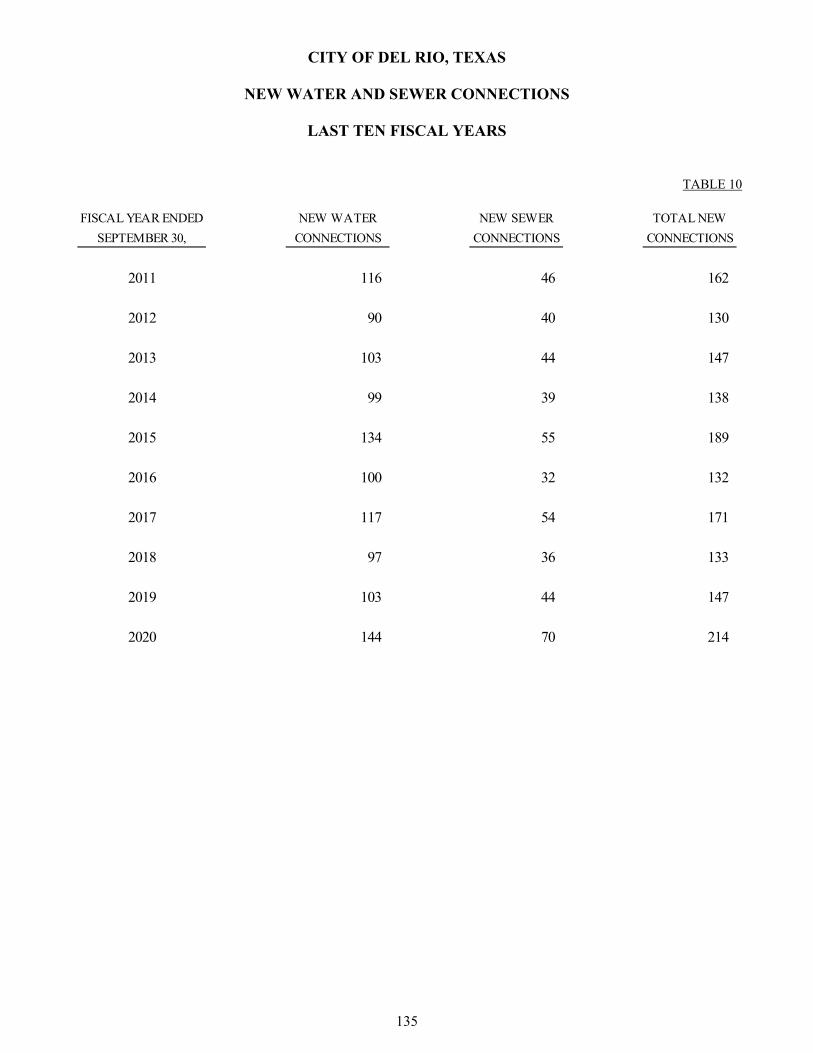
CITY OF DEL RIO, TEXAS
NEW WATER AND SEWER CONNECTIONS
LAST TEN FISCAL YEARS
135
TABLE 10
FISCAL YEAR ENDED NEW WATER NEW SEWER TOTAL NEW
SEPTEMBER 30, CONNECTIONS CONNECTIONS CONNECTIONS
2011 116 46 162
2012 90 40 130
2013 103 44 147
2014 99 39 138
2015 134 55 189
2016 100 32 132
2017 117 54 171
2018 97 36 133
2019 103 44 147
2020 144 70 214

CITY OF DEL RIO, TEXAS
NUMBER OF WATER AND SEWER CONNECTIONS
LAST TEN FISCAL YEARS
136
TABLE 11
FISCAL YEAR
ENDED
SEPTEMBER 30, INSIDE CITY OUTSIDE CITY INSIDE CITY OUTSIDE CITY CEMETARIES TOTAL SEWER
2011 12,067 1,320 1,484 85 14 14,970 13,148
2012 11,814 1,348 1,618 84 18 14,882 13,111
2013 11,903 1,441 1,576 97 18 15,035 13,228
2014 11,998 1,473 1,593 99 16 15,179 13,384
2015 12,031 1,485 1,610 103 15 15,244 13,450
2016 12,018 1,491 1,628 101 13 15,251 13,441
2017 11,568 1,999 1,615 113 7 15,302 13,490
2018 11,463 2,005 1,586 115 7 15,176 13,374
2019 11,393 2,017 1,556 116 5 15,087 13,341
2020 11,925 2,098 1,584 112 5 15,724 13,893
Note: (1) Commercial meter counts include governments.
RESIDENTIAL COMMERCIAL (1)
WATER

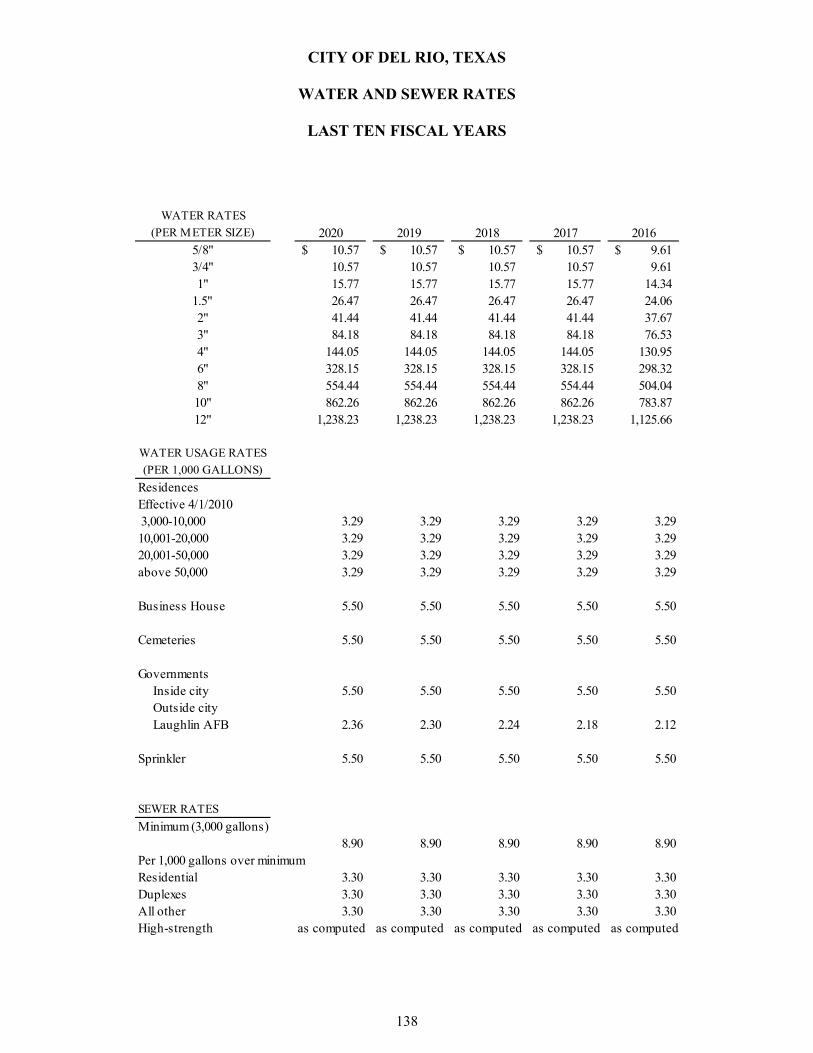
CITY OF DEL RIO, TEXAS
WATER AND SEWER RATES
LAST TEN FISCAL YEARS
138
WATER RATES
(PER METER SIZE) 2020 2019 2018 2017 20165/8" 10.57$ 10.57$ 10.57$ 10.57$ 9.61$ 3/4" 10.57 10.57 10.57 10.57 9.61 1" 15.77 15.77 15.77 15.77 14.34
1.5" 26.47 26.47 26.47 26.47 24.06 2" 41.44 41.44 41.44 41.44 37.67 3" 84.18 84.18 84.18 84.18 76.53 4" 144.05 144.05 144.05 144.05 130.95 6" 328.15 328.15 328.15 328.15 298.32 8" 554.44 554.44 554.44 554.44 504.04 10" 862.26 862.26 862.26 862.26 783.87 12" 1,238.23 1,238.23 1,238.23 1,238.23 1,125.66
WATER USAGE RATES
(PER 1,000 GALLONS)
Residences Effective 4/1/2010 3,000-10,000 3.29 3.29 3.29 3.29 3.2910,001-20,000 3.29 3.29 3.29 3.29 3.2920,001-50,000 3.29 3.29 3.29 3.29 3.29above 50,000 3.29 3.29 3.29 3.29 3.29
Business House 5.50 5.50 5.50 5.50 5.50
Cemeteries 5.50 5.50 5.50 5.50 5.50
GovernmentsInside city 5.50 5.50 5.50 5.50 5.50Outside cityLaughlin AFB 2.36 2.30 2.24 2.18 2.12
Sprinkler 5.50 5.50 5.50 5.50 5.50
SEWER RATES
Minimum (3,000 gallons)8.90 8.90 8.90 8.90 8.90
Per 1,000 gallons over minimumResidential 3.30 3.30 3.30 3.30 3.30Duplexes 3.30 3.30 3.30 3.30 3.30All other 3.30 3.30 3.30 3.30 3.30High-strength as computed as computed as computed as computed as computed

139
TABLE 12
2015 2014 2013 2012 20118.90$ 8.90$ 8.90$ 8.90$ 8.90$ 8.90 8.90 8.90 8.90 8.90
13.28 13.28 13.28 13.28 13.28 22.28 22.28 22.28 22.28 22.28 34.88 34.88 34.88 34.88 34.88 70.86 70.86 70.86 70.86 70.86
121.25 121.25 121.25 121.25 121.25 276.22 276.22 276.22 276.22 276.22 466.70 466.70 466.70 466.70 466.70 725.81 725.81 725.81 725.81 725.81
1,042.48 1,042.48 1,042.48 1,042.48 1,042.48
2.77 2.77 2.77 2.77 2.773.02 3.02 3.02 3.02 3.023.27 3.27 3.27 3.27 3.273.52 3.52 3.52 3.52 3.52
3.45 3.45 3.45 3.45 3.45
3.45 3.45 3.45 3.45 3.45
3.45 3.45 3.45 3.45 3.454.14 4.14 4.14 4.14 4.141.89 1.89 1.89 1.89 1.89
3.52 3.52 3.52 3.52 3.76
8.19 8.19 8.19 8.19 8.19
2.68 2.68 2.68 2.68 2.682.68 2.68 2.68 2.68 2.682.68 2.68 2.68 2.68 2.68
as computed as computed as computed as computed as computed

CITY OF DEL RIO, TEXAS
WATER BILLED BY USER (GALLONS)
LAST TEN FISCAL YEARS
140
FISCAL YEAR
ENDED CITY OF
SEPTEMBER 30, RESIDENTIAL COMMERCIAL INDUSTRIAL CEMETERIES DEL RIO
2011 1,785,276,200$ 384,008,000$ 5,028,800$ 7,213,000$ 86,287,400$
2012 1,607,481,700 349,115,000 5,686,000 6,534,000 77,248,200
2013 1,591,169,100 310,362,200 7,867,000 4,140,000 68,393,400
2014 1,465,959,300 297,974,500 7,698,500 1,636,000 69,239,000
2015 1,222,282,400 279,173,100 7,600,700 865,800 64,795,700
2016 1,250,550,000 308,483,900 7,741,800 377,500 72,977,800
2017 1,131,704,300 328,337,600 4,595,400 245,400 79,321,900
2018 1,352,439,000 341,035,200 6,720,600 69,200 104,333,900
2019 1,134,070,200 335,064,100 7,013,800 175,300 90,348,900
2020 1,443,425,000 327,141,000 5,863,400 138,700 83,689,100
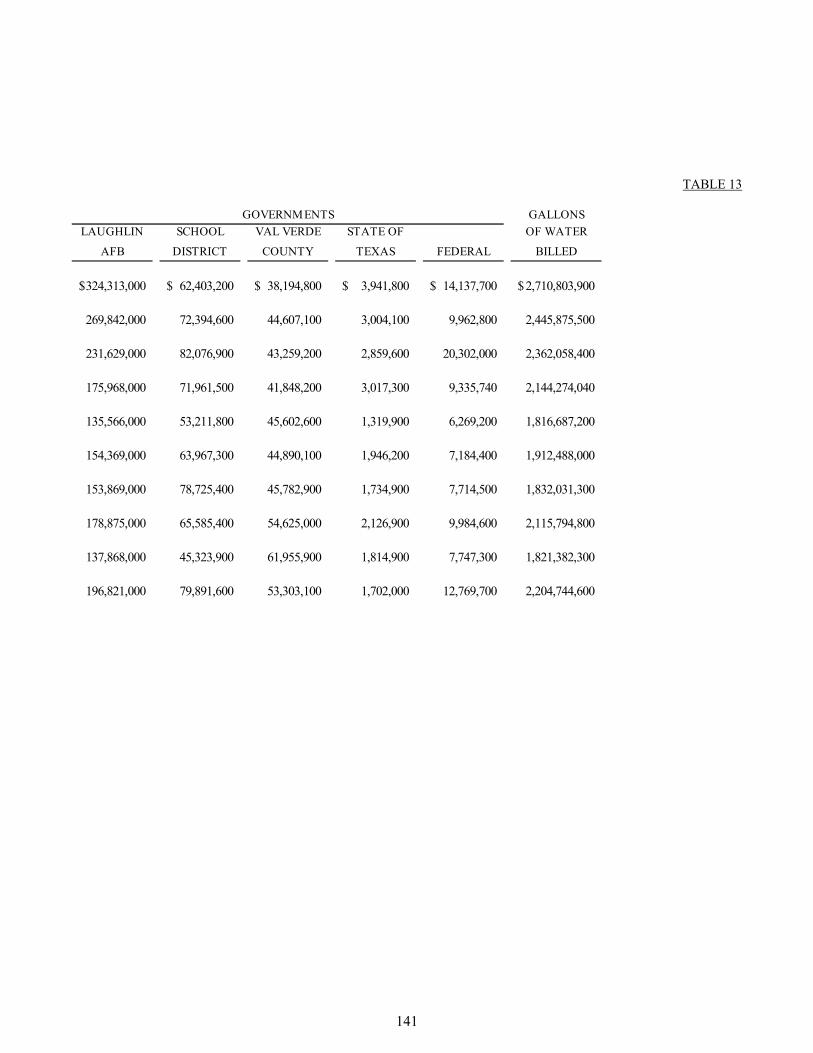
141
TABLE 13
GALLONS
LAUGHLIN SCHOOL VAL VERDE STATE OF OF WATER
AFB DISTRICT COUNTY TEXAS FEDERAL BILLED
324,313,000$ 62,403,200$ 38,194,800$ 3,941,800$ 14,137,700$ 2,710,803,900$
269,842,000 72,394,600 44,607,100 3,004,100 9,962,800 2,445,875,500
231,629,000 82,076,900 43,259,200 2,859,600 20,302,000 2,362,058,400
175,968,000 71,961,500 41,848,200 3,017,300 9,335,740 2,144,274,040
135,566,000 53,211,800 45,602,600 1,319,900 6,269,200 1,816,687,200
154,369,000 63,967,300 44,890,100 1,946,200 7,184,400 1,912,488,000
153,869,000 78,725,400 45,782,900 1,734,900 7,714,500 1,832,031,300
178,875,000 65,585,400 54,625,000 2,126,900 9,984,600 2,115,794,800
137,868,000 45,323,900 61,955,900 1,814,900 7,747,300 1,821,382,300
196,821,000 79,891,600 53,303,100 1,702,000 12,769,700 2,204,744,600
GOVERNMENTS

CITY OF DEL RIO, TEXAS
RATIOS OF NET GENERAL BONDED DEBT OUTSTANDING
LAST TEN FISCAL YEARS (amounts expressed in thousands)
142
TABLE 14
FISCAL YEAR GENERAL LESS PERCENTAGE OF
ENDED OBLIGATION DEBT ACTUAL TAXABLE PER
SEPTEMBER 30, BONDS SERVICE TOTAL VALUE OF PROPERTY CAPITA
2011 24,327$ 1,681$ 22,646$ 1.92% 636
2012 26,340 1,885 24,455 2.02% 684
2013 24,589 2,143 22,446 1.84% 632
2014 22,080 2,368 19,712 2.17% 540
2015 24,616 2,203 22,413 2.26% 614 2016 32,319 2,631 29,688 2.74% 814 2017 36,437 2,825 33,612 2.99% 921 2018 34,885 3,232 31,653 2.68% 889 2019 31,723 3,743 27,980 2.64% 892 2020 32,263 3,934 28,329 2.36% 790
Notes: Details regarding the City's outstanding debt can be found in the notes to the financial statements.
GENERAL BONDED DEBT OUTSTANDING

CITY OF DEL RIO, TEXAS
DIRECT AND OVERLAPPING GOVERNMENTAL ACTIVITIES DEBT
As of September 30, 2020 (amounts expressed in thousands)
143
TABLE 15
Estimated ShareEstimated of Direct and
Debt Percentage OverlappingGovernmental Unit Outstanding Applicable Debt
City of Del Rio 32,263$ 100.00% 32,263$
Total direct debt 32,263
San Felipe Del Rio Independent School District 58,935 68.15% 40,165
Val Verde County 1,541 50.85% 784 Val Verde County Hospital 21,541 50.60% 10,901
Total overlapping debt 51,850
Total direct and overlapping debt 84,113$
Note: The percentage of overlapping debt applicable is estimated as a percentage of the taxable assessed propertyvalue of the City of Del Rio to the taxable assessed property value of the overlapping government.
Source: San Felipe Del Rio Consolidated Independent School DistrictVal Verde County Treasurer's Office

CITY OF DEL RIO, TEXAS
DEBT MARGIN INFORMATION
LAST TEN FISCAL YEARS (amounts expressed in thousands)
144
2011 2012 2013 2014
Debt limit 118,037$ 120,840$ 122,009$ 126,912$
Total net debt applicable to limit 15,267 17,980 21,485 26,819
Legal debt margin 102,770$ 102,860$ 100,524$ 100,093$
Total net debt applicable to the limit
as a percentage of debt limit 13% 15% 18% 21%
Notes: (1) Starting in the fiscal year ended in 2003, the City computes its debt limit as 10% of assessed valuation as a guide for itself. The City operates under a home-rule charter as authorized by the Constitution of the State of Texas. The Constitution and the City Charter provide that taxes levied for general purposes and for paying debt cannot exceed $2.50 of assessed valuation. There is no constitutional or statutory limitation within the $2.50 for interest and sinking fund purposes. However, the Texas Attorney General adopted an administrative policy prohibiting issuance of debt if the issuance produces debt service requirements exceeding that which can be paid from $1.50 of the $2.50 tax rate calculated at 90% collection.

145
TABLE 16
Assessed value 1,199,231$
Debt limit (10% of assessed value) 119,923
Debt applicable to limit
General obligation bonds 32,263
Less: amount set aside for repayment
of general obligation debt (3,934)
Total net debt applicable to limit 28,329
LEGAL DEBT MARGIN 91,594$
2015 2016 2017 2018 2019 2020
129,109$ 132,360$ 136,641$ 138,181$ 143,294$ 119,923$
44,704 41,158 30,106 29,317 31,503 28,329
84,405$ 91,202$ 106,535$ 108,864$ 111,791$ 91,594$
35% 31% 22% 21% 22% 24%
LEGAL DEBT MARGIN CALCULATION FOR FISCAL YEAR 2020

CITY OF DEL RIO, TEXAS
RATIOS OF OUTSTANDING DEBT BY TYPE
LAST TEN FISCAL YEARS (amounts expressed in thousands)
146
FISCAL YEAR CERTIFICATES REFUNDING CERTIFICATES REFUNDING REFUNDINGENDED OF BONDS CAPITAL OF BONDS BONDS CAPITAL
SEPTEMBER 30, OBLIGATION NOTE LEASES OBLIGATION NOTE NOTE LEASES
2011 22,303$ 2,023$ -$ 21,281$ 497$ 18,647$ -$ 2012 22,945 3,395 - 23,522 435 16,850 - 2013 21,753 2,835 - 29,887 371 14,615 - 2014 18,206 3,874 - 26,640 305 13,986 - 2015 16,836 7,780 - 33,038 195 13,455 - 2016 25,686 6,634 - 34,331 161 11,566 - 2017 36,437 2,495 - 47,252 124 10,498 - 2018 34,885 2,117 - 44,980 85 8,581 - 2019 28,850 2,871 - 46,189 44 11,249 - 2020 29,687 2,575 - 48,312 - 9,019 -
GOVERNMENTAL ACTIVITIES BUSINESS-TYPE ACTIVITIES

147
TABLE 17
TOTAL PER PERCENTAGEPRIMARY CAPITA OF PERSONAL PER
GOVERNMENT INCOME INCOME POPULATION CAPITA
64,751$ 16,528$ 11.01% 35,591$ 1,819 67,147 16,625 11.29% 35,766 1,877 69,461 17107 11.42% 35,543 1,954 63,011 18,301 9.54% 36,081 1,746 71,304 17,898 11.20% 35,578 2,004 78,378 18,519 11.75% 36,007 2,177 96,806 19,415 13.87% 35,591 2,693 90,648 20,125 12.54% 35,921 2,524 89,203 20,660 13.08% 35,846 2,703 89,593 20,660 12.42% 35,846 2,499

CITY OF DEL RIO, TEXAS
PLEDGED REVENUE COVERAGE WASTEWATER FUND BONDED DEBT
LAST TEN FISCAL YEARS
(amounts expressed in thousands)
148
TABLE 18
FISCAL NET REVENUE
YEAR ENDED GROSS OPERATING AVAILABLE FOR
SEPTEMBER 30, REVENUES EXPENSES DEBT SERVICE PRINCIPAL INTEREST TOTAL COVERAGE
2011 3,588$ 1,721$ 1,867$ 1,180$ 459$ 1,639$ 1.14
2012 3,634 1,554 2,080 1,225 412 1,636 1.27
2013 3,848 1,680 2,168 1,244 465 1,708 1.27
2014 3,732 1,915 1,817 1,470 491 1,962 0.93
2015 4,741 1,874 2,867 1,542 491 2,033 1.41
2016 4,524 2,194 2,330 1,001 491 1,492 1.56
2017 4,504 2,172 2,332 1,080 764 1,845 1.26
2018 4,536 2,338 2,197 1,189 374 1,562 1.41
2019 5,090 2,620 2,470 1,221 388 1,609 1.54
2020 4,416 3,720 696 1,241 493 1,734 0.40
DEBT SERVICE REQUIREMENTS

CITY OF DEL RIO, TEXAS
BOND COVERAGE – UTILITY COMMISSION / WATER FUND BONDED DEBT
LAST TEN FISCAL YEARS (amounts expressed in thousands)
149
TABLE 19
FISCAL NET REVENUE
YEAR ENDED GROSS OPERATING AVAILABLE FOR
SEPTEMBER 30, REVENUES EXPENSES DEBT SERVICE PRINCIPAL INTEREST TOTAL COVERAGE
2011 9,007$ 4,131$ 4,876$ 2,387$ 976$ 3,364$ 1.45
2012 8,134 4,070 4,064 2,743 1,077 3,821 1.06
2013 8,194 3,453 4,741 2,753 1,044 3,798 1.25
2014 7,365 3,802 3,563 2,888 835 3,723 0.96
2015 8,215 4,092 4,123 3,011 790 3,801 1.08
2016 8,206 4,536 3,670 3,169 864 4,033 0.91
2017 10,441 4,710 5,731 3,256 958 4,214 1.36
2018 11,110 4,267 6,843 3,650 1,159 4,809 1.42
2019 9,589 4,073 5,516 2,891 1,144 4,035 1.37
2020 9,339 7,629 1,710 2,822 545 3,367 0.51
DEBT SERVICE REQUIREMENTS
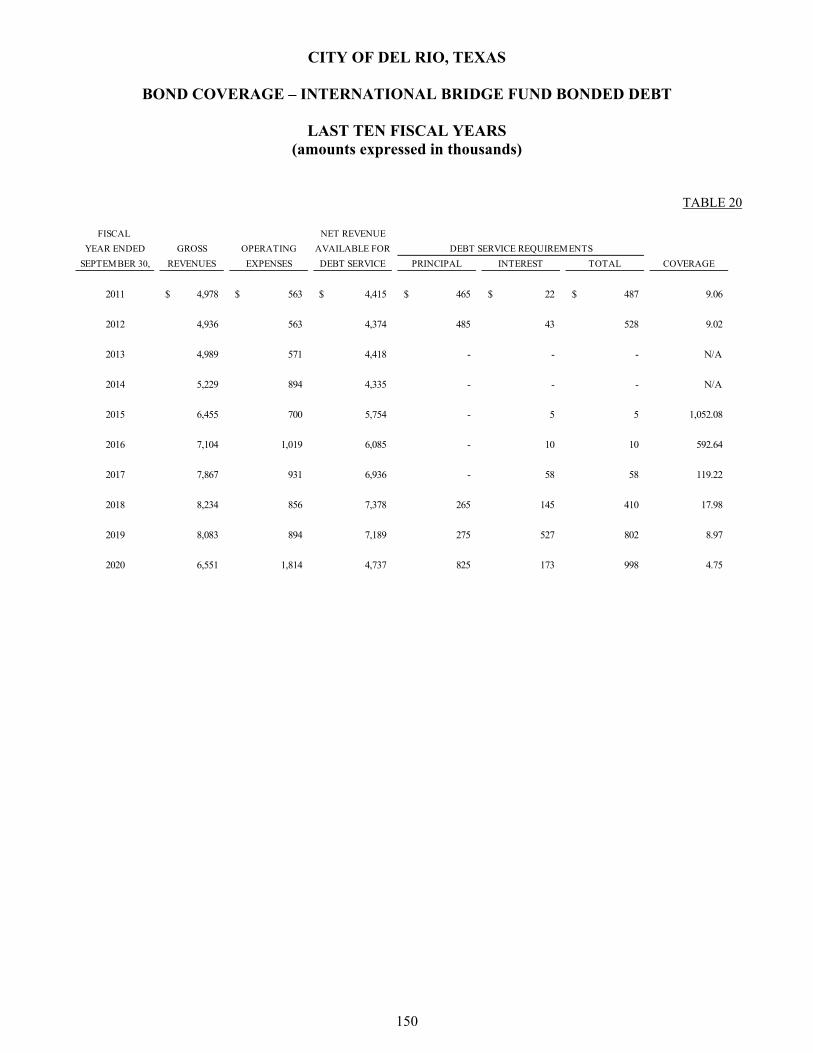
CITY OF DEL RIO, TEXAS
BOND COVERAGE – INTERNATIONAL BRIDGE FUND BONDED DEBT
LAST TEN FISCAL YEARS (amounts expressed in thousands)
150
TABLE 20
FISCAL NET REVENUE
YEAR ENDED GROSS OPERATING AVAILABLE FOR
SEPTEMBER 30, REVENUES EXPENSES DEBT SERVICE PRINCIPAL INTEREST TOTAL COVERAGE
2011 4,978$ 563$ 4,415$ 465$ 22$ 487$ 9.06
2012 4,936 563 4,374 485 43 528 9.02
2013 4,989 571 4,418 - - - N/A
2014 5,229 894 4,335 - - - N/A
2015 6,455 700 5,754 - 5 5 1,052.08
2016 7,104 1,019 6,085 - 10 10 592.64
2017 7,867 931 6,936 - 58 58 119.22
2018 8,234 856 7,378 265 145 410 17.98
2019 8,083 894 7,189 275 527 802 8.97
2020 6,551 1,814 4,737 825 173 998 4.75
DEBT SERVICE REQUIREMENTS

CITY OF DEL RIO, TEXAS
BOND COVERAGE – REFUSE FUND BONDED DEBT
LAST TEN FISCAL YEARS (amounts expressed in thousands)
151
TABLE 21
FISCAL NET REVENUE
YEAR ENDED GROSS OPERATING AVAILABLE FOR
SEPTEMBER 30, REVENUES EXPENSES DEBT SERVICE PRINCIPAL INTEREST TOTAL COVERAGE
2011 3,491$ 2,275$ 1,216$ 65$ 26$ 91$ 13.37
2012 3,558 2,078 1,480 65 25 90 16.42
2013 3,950 2,172 1,778 90 30 120 14.88
2014 4,467 2,406 2,061 100 27 126 16.31
2015 4,106 2,231 1,875 104 3 108 17.41
2016 3,825 2,074 1,751 104 23 128 13.72
2017 3,713 2,279 1,434 104 3 107 13.44
2018 4,084 2,357 1,728 113 10 123 14.07
2019 4,424 2,497 1,927 117 6 123 15.67
2020 6,080 5,510 570 447 - 447 1.28
DEBT SERVICE REQUIREMENTS
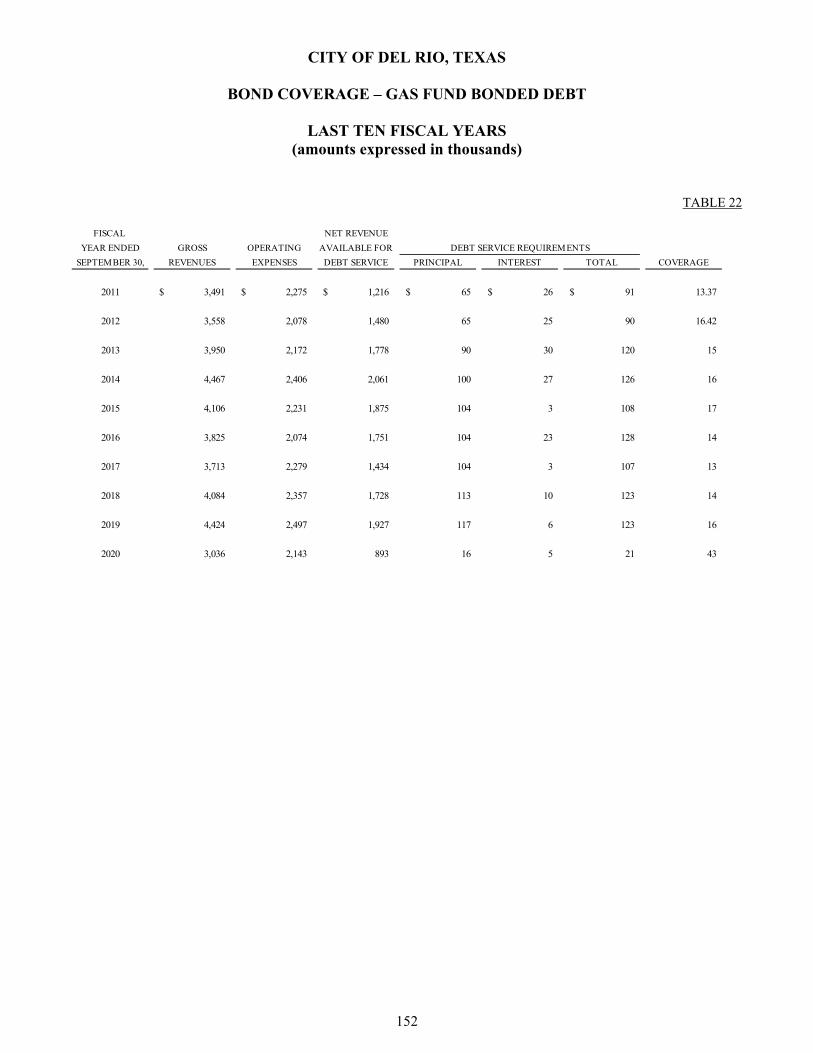
CITY OF DEL RIO, TEXAS
BOND COVERAGE – GAS FUND BONDED DEBT
LAST TEN FISCAL YEARS (amounts expressed in thousands)
152
TABLE 22
FISCAL NET REVENUE
YEAR ENDED GROSS OPERATING AVAILABLE FOR
SEPTEMBER 30, REVENUES EXPENSES DEBT SERVICE PRINCIPAL INTEREST TOTAL COVERAGE
2011 3,491$ 2,275$ 1,216$ 65$ 26$ 91$ 13.37
2012 3,558 2,078 1,480 65 25 90 16.42
2013 3,950 2,172 1,778 90 30 120 15
2014 4,467 2,406 2,061 100 27 126 16
2015 4,106 2,231 1,875 104 3 108 17
2016 3,825 2,074 1,751 104 23 128 14
2017 3,713 2,279 1,434 104 3 107 13
2018 4,084 2,357 1,728 113 10 123 14
2019 4,424 2,497 1,927 117 6 123 16
2020 3,036 2,143 893 16 5 21 43
DEBT SERVICE REQUIREMENTS
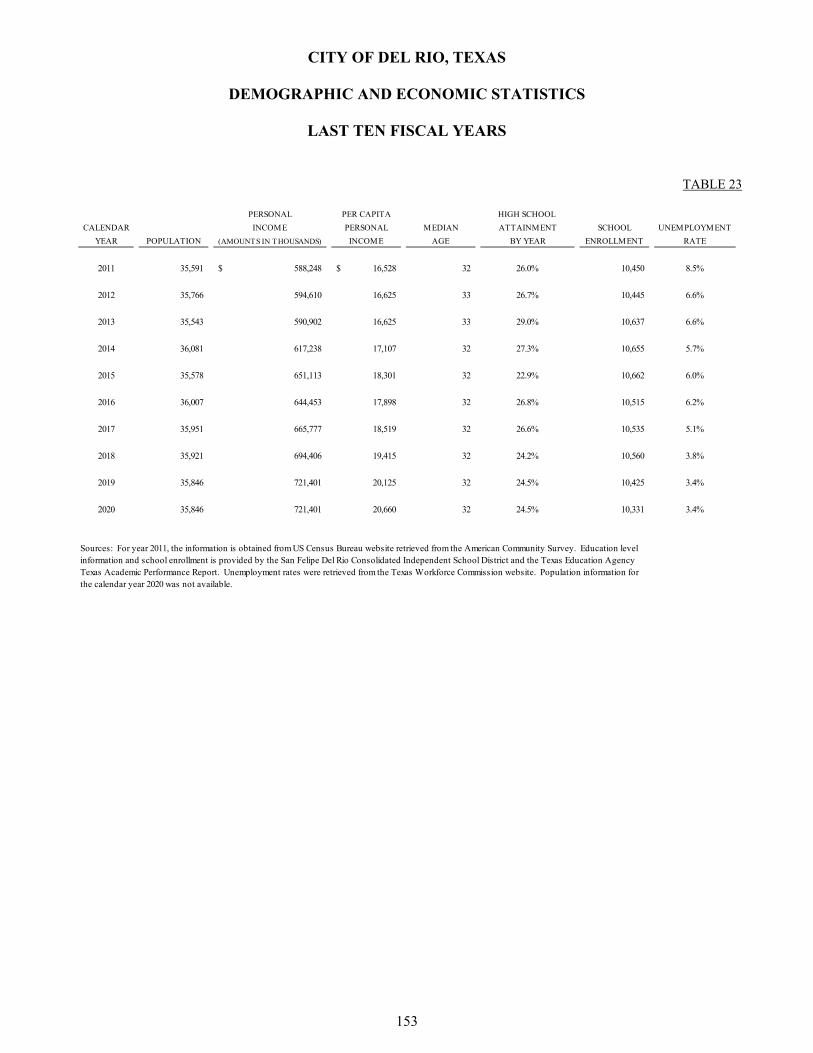
CITY OF DEL RIO, TEXAS
DEMOGRAPHIC AND ECONOMIC STATISTICS
LAST TEN FISCAL YEARS
153
TABLE 23
PERSONAL PER CAPITA HIGH SCHOOL
CALENDAR INCOME PERSONAL MEDIAN ATTAINMENT SCHOOL UNEMPLOYMENT
YEAR POPULATION (AMOUNTS IN THOUSANDS) INCOME AGE BY YEAR ENROLLMENT RATE
2011 35,591 588,248$ 16,528$ 32 26.0% 10,450 8.5%
2012 35,766 594,610 16,625 33 26.7% 10,445 6.6%
2013 35,543 590,902 16,625 33 29.0% 10,637 6.6%
2014 36,081 617,238 17,107 32 27.3% 10,655 5.7%
2015 35,578 651,113 18,301 32 22.9% 10,662 6.0%
2016 36,007 644,453 17,898 32 26.8% 10,515 6.2%
2017 35,951 665,777 18,519 32 26.6% 10,535 5.1%
2018 35,921 694,406 19,415 32 24.2% 10,560 3.8%
2019 35,846 721,401 20,125 32 24.5% 10,425 3.4%
2020 35,846 721,401 20,660 32 24.5% 10,331 3.4%
Sources: For year 2011, the information is obtained from US Census Bureau website retrieved from the American Community Survey. Education level information and school enrollment is provided by the San Felipe Del Rio Consolidated Independent School District and the Texas Education Agency Texas Academic Performance Report. Unemployment rates were retrieved from the Texas Workforce Commission website. Population information for the calendar year 2020 was not available.

CITY OF DEL RIO, TEXAS
PRINCIPAL EMPLOYERS
CURRENT YEAR AND NINE YEARS AGO
154
TABLE 24
PERCENTAGE PERCENTAGEOF TOTAL CITY OF TOTAL CITY
EMPLOYER EMPLOYEES EMPLOYMENT EMPLOYEES EMPLOYMENT
Laughlin Airforce Base 3,420 17.77% 4,707 21.83%Federal Agencies 2,063 10.72% 3,715 17.23%San Felipe Del Rio CISD 1,994 10.36% 1,453 6.74%Manufacturers - 0.00% 1,500 6.96%Retail 1,295 6.73% 1,216 5.64%City of Del Rio 494 2.57% 450 2.09%Val Verde Regional Medical Center 430 2.23% 525 2.44%GEO Correctional Facility 301 1.56% 301 1.40%Val Verde County 207 1.08% 207 0.96%Union Pacific Railroad 150 0.78% 150 0.70%
TOTAL 10,354 53.81% 14,224 65.97%
Source: Del Rio Chamber of Commerce website.
Note: Information for 2020 is not available; 2018 and 2012 is the latest information available.
2012 2018


CITY OF DEL RIO, TEXAS
SCHEDULE OF INTERNATIONAL BRIDGE FUND TRAFFIC AND REVENUE
LAST TEN FISCAL YEARS
156
Fiscal
Year Ended Number Revenue Number Revenue Number Revenue
2011 59,171 839,605 1,312,655 3,937,965 58,064 43,548
2012 60,798 879,025 1,294,240 3,882,720 60,007 45,006
2013 61,226 1,026,180 1,293,965 3,881,895 63,754 47,816
2014 63,974 1,773,209 1,439,765 5,312,783 61,174 42,159
2015 66,935 1,855,281 1,522,653 5,618,642 59,683 41,132
2016 68,429 1,896,691 1,580,929 5,833,683 54,938 37,862
2017 70,978 1,967,344 1,604,453 5,920,487 61,095 42,105
2018 71,700 2,045,450 1,484,730 5,698,024 82,986 60,828
2019 63,313 1,810,623 1,163,285 4,502,912 72,009 52,823
2020 35,356 1,005,532 570,929 2,261,664 28,221 20,923
Notes: (1) Motorcycles and carts are included with the figures for automobiles.
Trucks Automobiles (1) Pedestrians/Bicycles

157
TABLE 25
Number Number
Number Revenue of Vehicles of People Revenue
416 2,912 1,372,242 58,064 4,824,030
879 6,153 1,355,917 60,007 4,812,904
1,119 8,952 1,356,310 63,754 4,964,843
818 6,544 1,504,557 61,174 7,134,695
933 7,464 1,590,521 59,683 7,522,519
738 5,904 1,650,096 54,938 7,774,140
571 7,499 1,676,002 61,095 7,937,435
372 5,009 1,556,802 82,986 7,809,311
352 4,698 1,226,950 72,009 6,371,056
119 1,607 606,404 28,221 3,289,726
Total
Buses/Trucks

CITY OF DEL RIO, TEXAS
FULL-TIME EQUIVALENT CITY GOVERNMENT EMPLOYEES BY FUNCTION/PROGRAM
LAST TEN FISCAL YEARS
158
TABLE 26
FUNCTION/PROGRAM 2020 2019 2018 2017 2016 2015 2014 2013 2012 2011
General Government 70 71 70 68 67 65 70 67 65 67
Public Safety 172 172 172 172 172 172 171 171 194 201
Highway and Streets 31 31 31 30 29 29 29 28 27 28
Health and Welfare 37 36 36 39 41 42 42 42 44 50
Culture and Recreation 41 37 37 36 28 28 28 28 30 33
Economic Development 1 1 1 1 1 1 1 1 1 1
Gas 23 23 23 23 23 23 23 23 25 22
Water 54 54 53 53 52 52 52 53 49 54
Bridge 15 15 16 14 12 12 12 12 12 13
Airport 6 6 6 6 6 6 6 6 6 6
Refuse 15 15 15 15 14 15 6 6 9 9
Municipal Facilities 8 8 8 8 9 10 9 9 9 10
Wastewater 27 27 28 22 21 21 21 21 9 10
Utility Billing 17 16 16 16 17 17 17 17 9 10
Notes: Generally, full-time employees are scheduled to work 80 hours bi-weekly. Full time equivalents were computed by dividing the total hours paid for the year by 2,080 hours for those positions. Firefighters other than administrative personnel are scheduled to work 106 hours bi-weekly. Ful-time equivalents for those firefighters are computed by dividing the total hours paid for the year by 2,756 hours.

CITY OF DEL RIO, TEXAS
OPERATING INDICATORS BY FUNCTION/PROGRAM
LAST TEN FISCAL YEARS
159
TABLE 27
FUNCTION/PROGRAM 2020 2019 2018 2017 2016 2015 2014 2013 2012 2011
General GovernmentFull-time equivalents 70 71 70 68 67 65 70 67 427 617
PolicePhysical arrests 599 746 623 720 1,125 1,027 1,182 1,505 1,728 1,425 Parking violations 4 48 42 97 85 105 302 190 64 76 Traffic violations 1,376 1,969 1,576 2,388 3,733 4,758 6,756 6,824 3,767 4,267
FireEmergency responses 3,103 3,511 2,302 2,321 2,080 1,952 1,798 1,693 1,759 1,511 Fires extinguished 112 105 102 89 69 68 93 57 91 92 Inspections 42 59 65 56 105 40 35 240 1,006 698
Other public worksStreet resurfacing (miles) - - - - - - - 5 10 11 Potholes repaired - - - - - - - 98,044 100,767 2,208
WaterNew connections 144 103 97 117 100 134 99 103 90 116 Water main breaks - - - - - - - 949 1,011 1,112 Average daily consumption (thousands of gallons) - - - - - - - 8,288 8,467 9,834 Peak daily consumption (thousands of gallons) - - - - - - - 12,400 14,400 17,330
WastewaterAverage daily sewage treatment (thousands of gallons) - - - - - - - 2,944 3,308 3,510
Source: Various City departments

CITY OF DEL RIO, TEXAS
CAPITAL ASSET STATISTICS BY FUNCTION/PROGRAM
LAST TEN FISCAL YEARS
160
TABLE 28
FUNCTION/PROGRAM 2020 2019 2018 2017 2016 2015 2014 2013 2012 2011
PoliceStations 1 1 1 1 1 1 1 1 1 1 Patrol Units 52 52 52 52 52 52 52 63 66 53
FireStations 4 4 4 4 4 4 4 4 4 4
Other Public WorksStreets (Miles) 210 210 210 210 210 210 210 224 224 224 Streetlights 1,793 1,793 1,793 1,793 1,793 1,793 1,793 1,869 1,862 1,863 Traffic Signals 16 16 16 16 16 16 16 16 16 16
Parks and RecreationAcreage 203 203 203 203 203 203 203 276 276 276 Swimming Pools 2 2 2 2 2 2 2 2 2 2 Tennis Courts 2 2 2 2 2 2 2 2 2 2 Community Centers 1 1 1 1 1 1 1 1 1 1
Water Water Mains (Miles) 705 705 705 705 705 705 380 250 250 250
Fire Hydrants 1,358 1,358 1,358 1,358 1,358 1,358 1,358 1,200 1,170 1,170 Wastewater
Sanitary Sewers (Miles) 233 233 233 233 233 233 233 224 224 220 Storm Sewers (Miles 1 1 1 1 1 1 1 1 1 1
Source: Various City Departments

COMPLIANCE SECTION

163
INDEPENDENT AUDITOR’S REPORT ON INTERNAL CONTROL OVER FINANCIAL REPORTING AND ON COMPLIANCE AND OTHER MATTERS BASED ON AN AUDIT
OF FINANCIAL STATEMENTS PERFORMED IN ACCORDANCE WITH GOVERNMENT AUDITING STANDARDS
To the Honorable Mayor and Members of the City Council City of Del Rio, Texas We have audited, in accordance with auditing standards generally accepted in the United States of America and the standards applicable to financial audits contained in Government Auditing Standards issued by the Comptroller General of the United States, the financial statements of the governmental activities, the business-type activities, each major fund, and the aggregate remaining fund information of the City of Del Rio, Texas, (the City) as of and for the year ended September 30, 2020, and the related notes to the financial statements, which collectively comprise the City of Del Rio, Texas’ basic financial statements, and have issued our report thereon dated April 30, 2021. Internal Control Over Financial Reporting In planning and performing our audit of the financial statements, we considered the City’s internal control over financial reporting (internal control) to determine the audit procedures that are appropriate in the circumstances for the purpose of expressing our opinions on the financial statements, but not for the purpose of expressing an opinion on the effectiveness of the City’s internal control. Accordingly, we do not express an opinion on the effectiveness of the City’s internal control. A deficiency in internal control exists when the design or operation of a control does not allow management or employees, in the normal course of performing their assigned functions, to prevent, or detect and correct, misstatements on a timely basis. A material weakness is a deficiency, or a combination of deficiencies, in internal control, such that there is a reasonable possibility that a material misstatement of the entity’s financial statements will not be prevented, or detected and corrected on timely basis. A significant deficiency is a deficiency, or a combination of deficiencies, in internal control that is less severe than a material weakness, yet important enough to merit attention by those charged with governance. Our consideration of internal control was for the limited purpose described in the first paragraph of this section and was not designed to identify all deficiencies in internal control that might be material weaknesses or significant deficiencies. Given these limitations, during our audit we did not identify any deficiencies in internal control that we consider to be material weaknesses. However, material weaknesses may exist that have not been identified.
164
Compliance and Other Matters As part of obtaining reasonable assurance about whether the City’s financial statements are free from material misstatement, we performed tests of its compliance with certain provisions of laws, regulations, contracts and grant agreements, noncompliance with which could have a direct and material effect on the determination of financial statement amounts. However, providing an opinion on compliance with those provisions was not an objective of our audit and, accordingly, we do not express such an opinion. The results of our tests disclosed no instances of noncompliance or other matters that are required to be reported under Government Auditing Standards. Purpose of this Report The purpose of this report is solely to describe the scope of our testing of internal control and compliance and the results of that testing, and not to provide an opinion on the effectiveness of the entity’s internal control or on compliance. This report is an integral part of an audit performed in accordance with Government Auditing Standards in considering the entity’s internal control and compliance. Accordingly, this communication is not suitable for any other purpose. San Antonio, Texas April 30, 2021
165
INDEPENDENT AUDITORS’ REPORT ON COMPLIANCE FOR EACH MAJOR FEDERAL PROGRAM AND ON INTERNAL CONTROL OVER COMPLIANCE
REQUIRED BY THE UNIFORM GUIDANCE
To the Honorable Mayor and Members of City Council City of Del Rio, Texas Report on Compliance for Each Major Federal Program We have audited City of Del Rio, Texas’ (the City) compliance with the types of compliance requirements described in the OMB Compliance Supplement that could have a direct and material effect on the City’s major federal programs for the year ended September 30, 2020. The City’s major federal programs are identified in the summary of auditor’s results section of the accompanying schedule of findings and questioned costs. Management’s Responsibility Management is responsible for compliance with federal statutes, regulations, and the terms and conditions of its federal awards applicable to its federal programs. Auditors’ Responsibility Our responsibility is to express an opinion on compliance for the City’s major federal programs based on our audit of the types of compliance requirements referred to above. We conducted our audit of compliance in accordance with auditing standards generally accepted in the United States of America; the standards applicable to financial audits contained in Government Auditing Standards, issued by the Comptroller General of the United States; and the audit requirements of Title 2 U.S. Code of Federal Regulations Part 200, Uniform Administrative Requirements, Cost Principles, and Audit Requirements for Federal Awards (Uniform Guidance). Those standards and the Uniform Guidance require that we plan and perform the audit to obtain reasonable assurance about whether noncompliance with the types of compliance requirements referred to above that could have a direct and material effect on a major federal program occurred. An audit includes examining, on a test basis, evidence about the City’s compliance with those requirements and performing such other procedures as we considered necessary in the circumstances. We believe that our audit provides a reasonable basis for our opinion on compliance for each major federal program. However, our audit does not provide a legal determination of the City’s compliance.

166
Opinion on the Major Federal Program In our opinion, the City complied, in all material respects, with the types of compliance requirements referred to above that could have a direct and material effect on its major federal program for the year ended September 30, 2020. Report on Internal Control over Compliance Management of the City is responsible for establishing and maintaining effective internal control over compliance with the types of compliance requirements referred to above. In planning and performing our audit of compliance, we considered the City’s internal control over compliance with the types of requirements that could have a direct and material effect on each major federal program to determine the auditing procedures that are appropriate in the circumstances for the purpose of expressing an opinion on compliance for each major federal program and to test and report on internal control over compliance in accordance with the Uniform Guidance, but not for the purpose of expressing an opinion on the effectiveness of internal control over compliance. Accordingly, we do not express an opinion on the effectiveness of the City’s internal control over compliance. A deficiency in internal control over compliance exists when the design or operation of a control over compliance does not allow management or employees, in the normal course of performing their assigned functions, to prevent, or detect and correct, noncompliance with a type of compliance requirement of a federal program on a timely basis. A material weakness in internal control over compliance is a deficiency, or a combination of deficiencies, in internal control over compliance, such that there is a reasonable possibility that material noncompliance with a type of compliance requirement of a federal program will not be prevented, or detected and corrected, on a timely basis. A significant deficiency in internal control over compliance is a deficiency, or a combination of deficiencies, in internal control over compliance with a type of compliance requirement of a federal program that is less severe than a material weakness in internal control over compliance, yet important enough to merit attention by those charged with governance. Our consideration of internal control over compliance was for the limited purpose described in the first paragraph of this section and was not designed to identify all deficiencies in internal control over compliance that might be material weaknesses or significant deficiencies and therefore, material weaknesses or significant deficiencies may exist that have not been identified. The purpose of this report on internal control over compliance is solely to describe the scope of our testing of internal control over compliance and the results of that testing based on the requirements of the Uniform Guidance. Accordingly, this report is not suitable for any other purpose. San Antonio, Texas April 30, 2021

CITY OF DEL RIO, TEXAS
SCHEDULE OF FINDINGS AND QUESTIONED COSTS
For the year ended September 30, 2020
167
Section I – Summary of Auditor’s Results
FINANCIAL STATEMENTS
Type of auditor’s report issued: Unmodified
Internal control over financial reporting: Material weakness(es) identified?
Yes
X No
Significant deficiencies identified not considered
to be material weaknesses?
Yes
X None Reported
Noncompliance material to financial statements noted?
Yes
X No
FEDERAL AWARDS
Internal control over financial reporting: Material weakness(es) identified?
Yes
X No
Significant deficiencies identified not considered
to be material weaknesses?
Yes
X None Reported
Type of auditor’s report issued on compliance for Major programs: Unmodified
Any audit findings disclosed that are required to be reported in accordance with 2 CFR section 200.516(a)?
Yes
X No
IDENTIFICATION OF MAJOR PROGRAMS CFDA Number(s) Name of Federal Program or Cluster
20.526
20.509
21.019
20.205
Bus and Bus Facilities Program Rural Areas & Tribal Transit Program Coronavirus Relief Fund Highway Planning & Construction Program
Dollar threshold used to distinguish between Type A and Type B programs:
$750,000
Auditee qualified as low-risk auditee?
Yes
X No

CITY OF DEL RIO, TEXAS
SCHEDULE OF FINDINGS AND QUESTIONED COSTS
For the year ended September 30, 2020
168
Section II: Financial Statement Findings
There were no financial statement findings required to be reported in accordance with Government Auditing Standards.
Section III: Federal Award Findings and Questioned Costs
None.

CITY OF DEL RIO, TEXAS
SUMMARY SCHEDULE OF PRIOR YEAR FINDINGS
For the year ended September 30, 2020
169
Section II: Financial Statement Findings Finding 2019-01 – Government-Wide Financial Records, Accounting and Reporting Type of Finding – Material Weakness Criteria: The City must maintain and utilize adequate internal controls over financial reporting in order to produce reliable and accurate financial reports on a timely basis and conduct the City’s finance operations in accordance with the City’s accounting policies and procedures and requisite best practices. Condition/Cause: Lack of detailed government-wide financial records. Accounting, reporting and related reconciliation to the general ledger. The City has not maintained the detailed records related to the government-wide financial reporting as reported in its external annual audited financial statements for several years. Without the maintenance of these detailed records, the general ledger cannot be reconciled and updated after the results of each annual audit. The City’s finance department management is currently relying on the external auditor’s records and documents. Also, the City’s finance staff is relying solely on the external auditor to prepare all necessary adjustments on a year to year basis in order to record, account and report the annual financial operations results and prepare the government-wide financial statements. Financial reporting is the responsibility of management and not the external auditor. The external auditor may consult, assist and advise on accounting matters; however, all the decisions and financial reporting are the responsibility of the City’s management. The conditions described above are caused by deficient accounting policies and procedures, lack of qualified and competent fiscal supervision, lack of review by fiscal management, lack of fiscal staff training and supervision. Effect: Material misstatements will occur and not be detected or corrected on a timely basis. Weak financial accounting and reporting will result in unreliable internal and external financial reporting. Recommendation: The City must review, revise and ensure compliance with policies and procedures related to its fiscal operations and financial reporting. Accounting best practices, adequate staff training and timely supervision procedures must be implemented. Status: The recommendation was adopted during the fiscal year ended August 31, 2020. No similar findings were noted in the 2020 audit. Finding 2019-02 – Capital Assets Records Type of Finding – Material Weakness and Material Noncompliance Criteria: The City must maintain and utilize adequate internal controls over financial reporting in order to produce reliable and accurate financial reports on a timely basis and conduct the City’s finance operations in accordance with the City’s accounting policies and procedures and requisite best practices. Condition/Cause: Lack of detailed capital assets records and reconciliation to the general ledger. The City did not have current and updated detailed records of their capital assets. Therefore, it could not provide an accurate and detailed record to support the amounts recorded in the general ledger for total capital assets and related accumulated depreciation as of September 30, 2019 or properly and correctly calculate depreciation expense for the year ended September 30, 2019. This material weakness and audit scope limitation has resulted in our disclaimer of opinion related to certain opinion units as of September 30, 2019 and for the year then ended. Also, the City has not updated for several years its detailed capital assets records and reconciled them to the general ledger or to several previous years audited external financial statements.
CITY OF DEL RIO, TEXAS
SUMMARY SCHEDULE OF PRIOR YEAR FINDINGS
For the year ended September 30, 2020
170
Finding 2019-02 – Capital Assets Records Type of Finding – Material Weakness and Material Noncompliance (continued) Condition/Cause (continued): The City has not performed a recent physical inventory of its capital assets. All capital assets purchased with State or Federal funds must have a physical inventory at least every 2 years. The City does not have a formal process to follow to determine when its construction-in-progress is completed and ready to be capitalized and placed into service. We have proposed several material audit adjustments because of material misclassifications made in the prior year when recording completed and placed into service capital assets in the general ledger. These misstatements were in the prior year’s audited financial statements. The conditions described above are caused by deficient accounting principles and procedures, lack of qualified competent fiscal supervision, lack of review by fiscal management, lack of fiscal staff training and supervision. Effect: Material misstatements will occur and not be detected or corrected on a timely basis. Weak financial accounting and reporting will result in misstated and unreliable internal and external financial reporting. Recommendation: The City must review, revise and ensure compliance with policies and procedures related to its fiscal operations and financial reporting. Accounting best practices, adequate staff training and timely supervision procedures must be implemented. Status: The recommendation was adopted during the fiscal year ended September 30, 2020. No similar findings were noted in the 2020 audit. Finding 2019-03 – Net Position Accounting and Financial Reporting Type of Finding – Material Weakness and Material Noncompliance Criteria: The City must maintain and utilize adequate internal controls over financial reporting in order to produce reliable and accurate financial records on a timely basis and conduct the City’s finance operations in accordance with City’s accounting policies and procedures and requisite best practices. Condition/Cause: Lack of timely and correct calculation of net position by the requisite component categories. The City does not have records to correctly calculate on a timely basis its net position by the requisite component categories. We proposed adjustments to adjust and report the net position by the requisite categories; however, due to the lack of records we cannot assure that the amounts are materially correct. This material weakness and scope limitation has resulted in our disclaimer of opinion related to certain opinion units as of September 30, 2019 and for the year then ended. The reporting of a materially accurate net position is extremely critical because the amounts of net investment in capital assets and restricted net assets are vital to your external users of your financial statements and well as necessary to comply with bond covenants and regulatory statues. The conditions described above are caused by deficient accounting policies and procedures, lack of qualified and competent fiscal supervision, lack of review by fiscal management, lack of fiscal staff training and supervision. Effect: Material misstatements will occur and not be detected or corrected on a timely basis. Weak financial accounting and reporting will result in misstated and unreliable internal and external financial reporting. Recommendation: The City must review, revise, and ensure compliance with policies and procedures related to its fiscal operations and financial reporting. Accounting best practices, adequate staff training and timely supervision procedures must be implemented.

CITY OF DEL RIO, TEXAS
SUMMARY SCHEDULE OF PRIOR YEAR FINDINGS
For the year ended September 30, 2020
171
Status: The recommendation was adopted during the fiscal year ended September 30, 2020. No similar findings were noted in the 2020 audit. Section III: Federal Awards Findings and Questioned Costs Finding 2019-04 – Financial Reporting and Accounting Type of Finding – Material Weakness Criteria: The City should have strong financial reporting, accounting procedures and internal controls in order to ensure compliance with grant requirements. Condition/Cause: All findings from 2019-01 – 2019-03, as described above, are causing material weaknesses in internal control over compliance. See section II – financial statement findings for a detailed discussion of the above findings. Lack of adherence to the City’s policies and procedures. Inadequate supervision and review of finance staff, as well as, lack of finance staff training. Effect: By failing to establish proper financial reporting, accounting procedures and internal controls, the City could fail to comply with grant requirements. Recommendation: The City should review and revise their accounting policies and procedures and controls to ensure financial reporting and accounting related to records maintenance and internal controls are adequate to enable material compliance with grant requirements and ensure compliance with such policies and procedures. Status: The recommendation was adopted during the fiscal year ended September 30, 2020. No similar findings were noted in the 2020 audit. Finding 2019-05 – CFDA Numbers: 66.458 and 66.468 Federal Agency: Environmental Protection Agency (EPA) Passed through: Texas Water Development Board (TWDB)
Program Names: Clean Water State Revolving Fund (SWSRF) and Drinking Water State Revolving Fund (DWSRF) Loan Numbers: 120300, L110089, L1000004, P73785, P61580 and P73787 Special Texts and Provisions
Type of Finding – Material Weakness and Material Noncompliance Criteria: In accordance with its borrowing covenants with the TWDB and Texas Local Government Code Section 103, the City must provide the TWDB with its annual audited financial statements within 180 days of its fiscal year end of September 30. Condition/Cause: The City must provide the TWDB with its annual audited financial statements within 180 days of its fiscal year end of September 30. The City is in violation of its borrowing covenants with the TWDB and is also in violation of the Texas Local Government Code Section 103. Lack of timely filing by the City of its annual financial audit with TWDB. Lack of training and awareness of the City’s finance stat with pertinent loan and grant requirements. Effect: By failing to establish proper internal control over compliance, the City is failing to comply with loan and grant requirements

CITY OF DEL RIO, TEXAS
SUMMARY SCHEDULE OF PRIOR YEAR FINDINGS
For the year ended September 30, 2020
172
Questioned Costs: None Finding 2019-05 – CFDA Numbers: 66.458 and 66.468 Federal Agency: Environmental Protection Agency (EPA) Passed through: Texas Water Development Board (TWDB)
Program Names: Clean Water State Revolving Fund (SWSRF) and Drinking Water State Revolving Fund (DWSRF) Loan Numbers: 120300, L110089, L1000004, P73785, P61580 and P73787 Special Texts and Provisions
Type of Finding – Material Weakness and Material Noncompliance Recommendation: The City should review and revise their accounting policies and procedures and controls to ensure that internal control over compliance is adequate to enable material compliance with loan and grant requirements. Status: The recommendation was adopted during the fiscal year ended September 30, 2020. No similar findings were noted in the 2020 audit.

CITY OF DEL RIO, TEXAS
SCHEDULE OF EXPENDITURES OF FEDERAL AWARDS
For the year ended September 30, 2020
173
FEDERAL GRANTOR/ FEDERAL PASS-THROUGH TOTAL PASSED
PASS-THROUGH GRANTOR/ CFDA ENTITY IDENTIFYING FEDERAL THROUGH TO
PROGRAM OR CLUSTER TITLE NUMBER NUMBER EXPENDITURES SUBRECIPIENTS
FEDERAL AWARDS
U.S. DEPARTMENT OF AGRICULTURE
Passed Through Texas Department of State Health Services
Woman, Infants and Children 10.557 2017-049742 543,383$ -$
U.S. DEPARTMENT OF HOUSING AND URBAN DEVELOPMENT
Passed Through Texas Department of Agriculture
Community Development Block Grant: Hunter Subdivision 14.228 7218110 450,000 -
U.S. DEPARTMENT OF TRANSPORTATION
Passed Through Federal Aviation Administration
Airport Improvement Program: CARES 20.106 3-48-0066-019-2020 69,000 -
Passed Through Texas Department of Transportation
Highway Planning & Construction Program: Qualia Relief Route 20.205 CSJ 0922-11-031 957,229 -
Passed Through Federal Transit Administration
Rural Areas & Tribal Transit Program: Rural Public Transportation 20.509 RPT 1902 (15) 39_19 202,049 -
Rural Areas & Tribal Transit Program: CARES Funds 20.509 CAF 2002 (15) 072_20 665,813 -
Rural Areas & Tribal Transit Program: Fleet Replacement 20.509 FR 1901 (22) 051_18 18,000 -
Bus and Bus Facilities Program: Discretionary 20.526 DIS 1901 (06) 018_19 1,001,328 -
Total passed through Federal Transmit Administration 1,887,190 -
TOTAL U.S. Department of Transportation 2,913,419 -
U.S. DEPARTMENT OF TREASURY
Passed Through Texas Division of Emergency Management
Coronavirus Relief Fund 21.019 S#132 1,745,123 -
U.S. ENVIRONMENTAL PROTECTION AGENCY
Passed Through Texas Water Development Board
Capitalization Grants for Drinking Water State Revolving Funds 66.468 2019 A 161,602 -
Capitalization Grants for Drinking Water State Revolving Funds 66.468 2020 B 127,965 -
Capitalization Grants for Drinking Water State Revolving Funds 66.468 2021 C 377,433 -
Total passed through Texas Water Development Board 667,000 -
U.S. DEPARTMENT OF HEALTH AND HUMAN SERVICES
Passed Through Middle Rio Grande Development Council
Special Programs for the Aging, Title III, Part C: Home Delivered Meal 93.045 78,461 -
Special Programs for the Aging, Title III, Part C: Home Delivered Meal COVID- 93.045 157,070 -
Special Programs for the Aging, Title III, Part C: Congregate Meal 93.045 47,945 -
Special Programs for the Aging, Title III, Part C: Congregate Meal COVID-19 93.045 66,927 - Special Programs for the Aging, Title III, Part B: Transportation 93.044 10,096 -
Total passed through Middle Rio Grande Development Council 360,499 -
Passed Through Texas Department of Aging and Disability Services
Social Services Block Grant (Home Delivered Meals), Title XX $4.95 93.667 1001467 64,363 -
Medical Assistance Program (Home Delivered Meals), Title XIX $6.12 93.778 1001468 20,888 -
Total Passed Through Texas Department of Aging and Disability Services 85,251 -
TOTAL U.S. Department of Health and Human Services 445,750 -

CITY OF DEL RIO, TEXAS
SCHEDULE OF EXPENDITURES OF FEDERAL AWARDS
For the year ended September 30, 2020
174
FEDERAL GRANTOR/ FEDERAL PASS-THROUGH TOTAL PASSED
PASS-THROUGH GRANTOR/ CFDA ENTITY IDENTIFYING FEDERAL THROUGH TO
PROGRAM OR CLUSTER TITLE NUMBER NUMBER EXPENDITURES SUBRECIPIENTS
U.S. DEPARTMENT OF HOMELAND SECURITY FEMA
Passed Through United Way of America
Emergency Food & Shelter: Supplemental Funding 97.024 SF-8422-00 022 C1 57,283 -
Passed Through Val Verde County Sheriff's Office
Homeland Security Grant: Operation Stone garden #3158504 97.067 EMW-2018-SS-00022-S01 142,675 -
Passed Through Texas Office of the Governor
Homeland Security Grant: Law Enforcement Terrorism Prevention Activities #36 97.067 EMW-2018-SS-00022-S01 43,367 -
TOTAL U.S. Department of Homeland Security 243,325 -
TOTAL EXPENDITURES OF FEDERAL AWARDS 7,008,000$ -$

CITY OF DEL RIO, TEXAS
NOTES TO SCHEDULE OF EXPENDITURES OF FEDERAL AWARDS
For the year ended September 30, 2020
175
Note 1: Basis of presentation
The accompanying Schedule of Expenditures of Federal Awards (SEFA) includes the federal and state grant activity of the City for the year ended September 30, 2020. The information in the SEFA is presented in accordance with requirements of Title 2, U.S. Code of Federal Regulations Part 200, Uniform Administrative Requirements, Cost Principles, and Audit Requirements for Federal Awards (Uniform Guidance). Because the SEFA presents only a selected portion of the operations of the City, it is not intended to, and does not present, the financial position, changes in net position, or cash flows of the City.
Note 2: Summary of significant accounting policies
Basis of accounting- The Schedule of Expenditures of Federal Awards is prepared on the modified accrual basis of accounting. The modified accrual basis of accounting is described in note 1 of the basic financial statements. Federal grant funds are considered to be earned to the extent of expenditures made under the provisions of the grant, and, accordingly, when such funds are received, they are recorded as deferred revenues until earned. Such expenditures are recognized following the cost principles contained in the Uniform Guidance, wherein certain types of expenditures are not allowable or are limited as to reimbursement. The City has not elected to use the 10 percent de minimis indirect cost rate as allowed under the Uniform Guidance. Pass-through entity identifying numbers are presented where available.


