22
November, 2011 City of Barrie Drainage and Stormwater Master Plan Annexed Lands Draft Hydrologic and Hydraulic Modelling Technical Memorandum #1

November, 2011
City of Barrie Drainage and Stormwater Master Plan Annexed Lands
Draft Hydrologic and Hydraulic Modelling Technical Memorandum #1

DRAINAGE AND STORMWATER MASTER PLAN
ANNEXED LANDS
HYDROLOGIC AND HYDRAULIC MODELLING
TECHNICAL MEMORANDUM #1
D R A F T
Submitted to: The City of Barrie
Submitted by: AMEC Environment & Infrastructure
3215 North Service Road Burlington, ON L7N 3G2
Tel: 905-335-2353 Fax: 905-335-1414
April 2012
110135

April 2012 Page i
TABLE OF CONTENTS PAGE
1.0 INTRODUCTION ............................................................................................................. 2 1.1 Objective .............................................................................................................. 2 1.2 Study Area ........................................................................................................... 2
2.0 BACKGROUND REVIEW ................................................................................................ 3
2.1 Previous Studies .................................................................................................. 3 2.2 Data, Reports and Mapping ................................................................................. 3
3.0 HYDROLOGY ................................................................................................................. 5
3.1 Drainage Area Characteristics ............................................................................. 5 3.2 Land Use Conditions ............................................................................................ 5 3.3 Hydrologic Model Discretization ........................................................................... 5 3.4 Hydrologic Model Parameterization ..................................................................... 6 3.5 Hydrologic Model Calibration and Validation ........................................................ 9 3.6 Design Storms ................................................................................................... 11 3.7 Results (Design Storms) .................................................................................... 12 3.8 Erosion Assessment .......................................................................................... 15 3.9 Duration Analysis ............................................................................................... 15
4.0 HYDRAULICS ............................................................................................................... 17
4.1 Model Development ........................................................................................... 17 4.2 Hydraulic Model Calibration and Validation ........................................................ 17 4.3 Results ............................................................................................................... 18
Appendices
Appendix A Background Appendix B Hydrology Appendix C Hydraulics
Figures
Figure 1 Study Area Location Plan Figure 2 Study Area and Watershed Plan Figure 3 Bear & Thornton Creek Subcatchment Plan Figure 3.1 Variable Slope Method Figure 4 Lover’s Creek Subcatchment Plan Figure 5 Hewitt’s Creek Subcatchment Plan Figure 6 Sandy Cove Creek Subcatchment Plan Figure 7 Regulatory Floodplain Annexed Lands West Figure 8 Regulatory Floodplain Annexed Lands East Figure B1 Existing Land Use Figure C1 Culvert Survey Locations Figure C2 HEC-RAS Section Location Plan – Bear Creek Figure C3 HEC-RAS Section Location Plan – Thornton Creek Figure C4 HEC-RAS Section Location Plan –Lovers Creek Figure C5 HEC-RAS Section Location Plan – Hewitt’s Creek Figure C6 HEC-RAS Section Location Plan –Sandy Cove Creek

City of Barrie Hydrologic and Hydraulic Modelling DRAFT Technical Memorandum #1 April 2012
P:\Work\110135\corr\Report\SWM Master Plan\Tech Memos\H&H\Draft H&H Technical Memorandum #1(Apr 12).docx Page 2
1.0 INTRODUCTION 1.1 Objective The objective of this Technical Memorandum is to provide documentation supporting the hydrologic and hydraulic modelling required to establish constraints related to flooding (Regulatory floodplain) and erosion (flow rates and durations) and in due course provide detail associated with the impact assessment for the future land use conditions proposed for the City of Barrie’s annexed lands. This study component is the core analytical activity underpinning the preparation of the Drainage and Stormwater Management Master Plan. 1.2 Study Area The annexed lands total a land area of approximately 2300 hectares +/- along the southern edge of the previous City of Barrie urban boundary, extending from Townline Road (County Road 27) at the western limit to 20 Sideroad at the eastern limit. The annexed lands form two blocks separated by Huronia Road in the centre; the western and eastern blocks extend the previous urban boundary south to beyond McKay Road East (formerly 10th Line) and Lockhart Road, respectively (ref. Figure 1). The annexed lands span five subwatersheds regulated by two conservation authorities, Nottawasaga Conservation Authority (NVCA) and Lake Simcoe Region Conservation Authority (LSRCA). The westerly end of the western annex block is within the headwaters of Bear Creek and Thornton Creek, both tributaries of the Nottawasaga River and regulated by the NVCA. The easterly end of the western annex block and eastern annex block cut through the middle reaches of Lover’s Creek and Hewitt’s Creek, as well as the headwaters of Sandy Cove Creek, all tributaries to Lake Simcoe and regulated by the LSRCA.

City of Barrie Hydrologic and Hydraulic Modelling DRAFT Technical Memorandum #1 April 2012
P:\Work\110135\corr\Report\SWM Master Plan\Tech Memos\H&H\Draft H&H Technical Memorandum #1(Apr 12).docx Page 3
2.0 BACKGROUND REVIEW 2.1 Previous Studies Several previous modelling studies have been completed for the subwatersheds relevant to the current study, the following provides a synopsis of relevant studies: Hydrologic Modelling, Hewitts, Sandy Cove, Mooselanka, Gilford, Lover’s Creeks and the City of Barrie Annexation Area, URS, July 2011 This study, commissioned by the LSRCA in partnership with the City of Barrie and the Town of Innisfil, focused on the development of hydrologic models for the subject creeks. Hydrologic models were developed in Visual OTTHYMO 2 for existing and future land uses based on City of Barrie and Town of Innisfil Official Plans; peak flows were reported for the 2 to 100 year return periods and the Regional Storm Event (i.e. Hurricane Hazel for LSRCA jurisdiction, Timmins Storm in NVCA jurisdiction). The model for Lover’s Creek was converted to Visual OTTHYMO 2 from a PCSWMM model developed by MMM Group Limited for Lover’s Creek Hydrologic Model Update Report (2010). Peak flows were verified using the Ministry of Natural Resources’ (MNR) Index Flood Method and previous studies. The study area covers all of the City of Barrie annexed lands and has become the starting point for hydrologic modelling for the current study (ref. Appendix ‘A’). 2.2 Data, Reports and Mapping A significant volume of background data, reports and mapping have been provided by the City of Barrie, LSRCA, NVCA, Simcoe County. The following summarizes the relevant data to this assessment: City of Barrie • Various digital GIS base mapping layers including roads, property, storm sewers, ponds,
watercourses, Official Plan • Aerial photography (2007) • Digital terrain mapping (2007, based on 2002 MNR topography) • Stormwater management reports for City of Barrie ponds • Stormwater management Certificates of Approval for City of Barrie ponds • Various precipitation and stream flow gauge data
LSRCA • Various digital GIS mapping layers
o Base layers including watercourses, wetlands, ELC, regulation limits, NHS policy, culverts
o Existing HEC-RAS cross section locations and Regulatory floodplain mapping o Subcatchments
• Geodetic survey data for hydraulic structures (Rudy Mak) • Visual OTTHYMO 2.0 hydrologic models for LSRCA creeks including Lover’s Creek,
Hewitts Creek and Sandy Cove Creek

City of Barrie Hydrologic and Hydraulic Modelling DRAFT Technical Memorandum #1 April 2012
P:\Work\110135\corr\Report\SWM Master Plan\Tech Memos\H&H\Draft H&H Technical Memorandum #1(Apr 12).docx Page 4
• Visual OTTHYMO 2.0 hydrologic models for NVCA creeks including Bear Creek and Thornton Creek (Annexed lands only)
• IDF curves and design storms • HEC-RAS 4.0 hydraulic models for Lover’s Creek, Hewitts Creek and Sandy Cove Creek • HEC-GeoRAS data for Lover’s Creek, Hewitts Creek and Sandy Cove Creek • Lover’s Creek precipitation and stream flow gauge data • Comprehensive Stormwater Management Master Plan Guidelines (LSRCA, April 26,
2011) NVCA • Various digital GIS base mapping layers including contours, watercourses,
subwatersheds, wetlands, land use, ELC, general regulation limits, culverts • Tiffin Centre precipitation gauge data Simcoe County • Various digital GIS base mapping layers including soils • Digital elevation model (2008)

City of Barrie Hydrologic and Hydraulic Modelling DRAFT Technical Memorandum #1 April 2012
P:\Work\110135\corr\Report\SWM Master Plan\Tech Memos\H&H\Draft H&H Technical Memorandum #1(Apr 12).docx Page 5
3.0 HYDROLOGY 3.1 Drainage Area Characteristics The City of Barrie annexed lands lie within portions of two watersheds and five subwatersheds including Bear Creek and Thornton Creek in the Nottawasaga River Watershed, and Lover’s Creek, Hewitts Creek and Sandy Cove Creek in the Lake Simcoe Watershed (ref. Figure 2). Table 3.1 summarizes the drainage area of each subwatershed to its respective outlet and the portion of the annexed lands in each, and the City of Barrie annexed lands.
Table 3.1: Subwatershed Drainage Areas Subwatershed Total Drainage Area (ha) Drainage Area in Annex (ha)
Bear Creek 88631 262 Thornton Creek 40951 474 Lover’s Creek 5940 973 Hewitt’s Creek 1726 290 Sandy Cove Creek 1827 294 Total - 2293 1Total drainage area not considered for hydrologic modelling These subwatersheds are within the municipal boundaries of the City of Barrie, Town of Innisfil, and Township of Essa. Agricultural land uses dominate all subwatersheds with urban development found through the lower reaches of Lover’s Creek, Hewitts Creek and Sandy Cove Creek. The headwaters of Bear Creek also contain urban land uses while Thornton Creek remains predominantly undeveloped. Significant natural heritage features, including woodlots and wetlands, are found throughout all subwatersheds. Soil Conservation Services (SCS) hydrologic soil groups A and B dominate all subwatersheds (generally sandy, silty and clayey loams) indicating soils with generally high rates of infiltration which generate relatively low runoff volumes (as compared to soil groups C and D). 3.2 Land Use Conditions The subwatersheds have been delineated and parameterized for existing land use conditions. Future land use, including three 2031 future land use options for the annexed lands will be completed for future submissions. Existing land use has been determined from multiple sources including ecological land classification mapping available from the LSRCA and NVCA. Future land use has been based on three land use options generated for the Secondary Plan (Pending) with the preferred 2031 land use option and has been simulated in five year increments from 2011 to 2031 (4 scenarios). 3.3 Hydrologic Model Discretization The existing subwatershed discretization developed for the Bear Creek, Thornton Creek, Lover’s Creek, Hewitt’s Creek and Sandy Cove Creek by URS (July 2011) has been maintained without changes for the current submission. The exception is the expansion of the Bear Creek and Thornton Creek models with additional subcatchments for the purpose of establishing downstream flow targets for the forthcoming impact assessment for future land use conditions.

City of Barrie Hydrologic and Hydraulic Modelling DRAFT Technical Memorandum #1 April 2012
P:\Work\110135\corr\Report\SWM Master Plan\Tech Memos\H&H\Draft H&H Technical Memorandum #1(Apr 12).docx Page 6
Figure 3 to Figure 6 identify the current subcatchments used to discretize the hydrologic models. Subsequent submissions will review, verify and refine the existing subcatchments within the annexed lands accounting for future land use options and considering for future siting of stormwater management facilities. It is expected that the refinement of the existing Land Use model will cause some changes to peak flows and runoff volumes when compared to the current URS model, however these changes are not expected to be significant. 3.4 Hydrologic Model Parameterization The approved hydrologic model parameterization completed by URS (July, 2011) has been reviewed by AMEC Environment & Infrastructure staff and is considered to be in keeping with currently accepted practice for the application of Visual OTTHYMO 2.0. As noted, the hydrologic parameters specified for all subcatchments have been maintained for the current submission pending the resolution of future land uses. The objective in this regard will be to remove any potential for modelling bias due to catchment sizing between the existing and future land use results. Additional subcatchments added to the Bear Creek and Thornton Creek models (ref. Section 3.3) have been parameterized in accordance with the methods used by URS and approved by LSRCA. The parameterization methods described in this Section are paraphrased from the Hydrologic Modelling Report (URS, 2011). 3.4.1 Subcatchment Parameters Visual OTTHYMO 2.0 simulates the hydrology of rural and urban subcatchments using two separate subroutines depending on total subcatchment imperviousness. Rural subcatchments are simulated using the NASHYD routine and are defined as having a total imperviousness of less than 20%. Urban subcatchments are simulated using the STANDHYD routine are defined as having a total imperviousness of greater than 20%. The following summarizes the hydrologic parameters required for simulation of the NASHYD and STANDHYD routines:
NASHYD • Drainage area (ha)
STANDHYD
• SCS Curve Number (unitless) • Initial abstraction (mm) • Time-to-peak (hrs)
• Drainage area (ha) • SCS Curve Number (unitless) • Initial abstraction (pervious and
impervious, mm) • Total imperviousness (%) • Directly connected imperviousness
(%) • Slope (pervious and impervious, %) • Overland flow length (pervious and
impervious, m) • Manning’s Roughness Coefficient
(pervious and impervious, unitless) Refer to Appendix ‘B’ for details of the parameterization of subcatchments in Bear Creek and Thornton Creek that have been added for the purpose of the current study (ref. Section 3.3).

City of Barrie Hydrologic and Hydraulic Modelling DRAFT Technical Memorandum #1 April 2012
P:\Work\110135\corr\Report\SWM Master Plan\Tech Memos\H&H\Draft H&H Technical Memorandum #1(Apr 12).docx Page 7
Parameterization of all other subcatchments can be found in the 2011 URS report. Subsequent submissions will include parameterization for all subwatersheds in the Study Area. Imperviousness and SCS Curve Number (CN) Subcatchment imperviousness is defined as the ratio of the total subcatchment area covered by any hardened surfaces including roads, buildings, sidewalks, etc. Directly connected imperviousness is the portion of the total subcatchment area that is hardened and forms a continuous conveyance route to the outlet (i.e. by a storm sewer). Generic percent impervious values are available for all land use types and have been applied for the current study as for the URS 2011 study; these are summarized in Appendix ‘B’. Using GIS based tools, the area for each land use type in a given subcatchment has been determined and the generic percent impervious values have been applied to determine the overall subcatchment imperviousness. SCS Curve Numbers (CN) have been calculated in a similar manner using both land use classification and soils mapping (ref. Appendix ‘B’). Modified Curve Numbers (CN*) have been calculated using the method described in the Visual OTTHYMO User’s Manual (ref. Appendix ‘B’). Initial Abstraction (Ia) Initial abstraction is the depth of precipitation that is “lost” (or abstracted) before runoff begins and includes surface depression storage and losses to vegetation and evaporation, etc. For pervious areas, initial abstraction is calculated using the equation Ia = 0.2*S, where S represents soil storage and is a function of SCS Curve Number. The variability of initial abstraction across subcatchments (resulting from variable Curve Numbers) is then incorporated into the Curve Number value by applying the Modified Curve Number method and fixing the value of initial abstraction (5 mm used for the current study) for all pervious land uses. For a detailed description on the Modified Curve Number method refer to Appendix ‘B’. For impervious areas initial abstraction is assumed to be 2 mm (ref. MTO Drainage Management Manual, 2007). Time-to-peak (tp) Time-to-peak is the time from the beginning of runoff to the peak of the unit hydrograph. Time-to-peak is often expressed as a fraction of time-of-concentration (2/3 has been assumed) which is the time at which the centroid of flow reaches the outlet of the subcatchment. Several equations of time-of-concentration are available including the Bransby-Williams Formula and the Airport Formula which have been applied for the current study in situations where the runoff coefficient would be greater than 0.4 or less than 0.4, respectively. The formulas are as follows:

City of Barrie Hydrologic and Hydraulic Modelling DRAFT Technical Memorandum #1 April 2012
P:\Work\110135\corr\Report\SWM Master Plan\Tech Memos\H&H\Draft H&H Technical Memorandum #1(Apr 12).docx Page 8
Bransby-Williams
𝑡𝑐 = 0.057 × 𝐿
𝑆𝑤0.2 𝐴0.1
where: tc = time-of-concentration (min) L = catchment length (m) Sw = catchment slope (%)
Airport Formula
𝑡𝑐 = 3.26 × (1.1−𝐶)×𝐿0.5
𝑆𝑤0.33
where: tc = time-of-concentration (min) C = runoff coefficient L = catchment length (m) Sw = catchment slope (%)
Slope and Overland Flow Length Slope and overland flow length are calculated directly from topographic mapping and represent averages for the subcatchment. Manning’s Roughness Coefficient Manning’s roughness is an empirically derived coefficient representing the roughness of a surface in which runoff is conveyed. Standard values are available in the literature for both channel flow and sheet flow. Generic values have been applied for pervious (n = 0.25) and impervious (n = 0.013) surfaces. 3.4.2 Channel Routing Channel routing has been simulated with the ROUTE CHANNEL routine and defined using representative cross sections for each reach selected for routing. Cross section, channel length, and slope have been defined using available topographic survey (LSRCA and AMEC) and supplemented with the available Digital Elevation Model (Simcoe County, 2008). 3.4.3 Reservoir Routing Reservoir routing (ROUTE RESERVOIR) has been applied in two instances: • Formal stormwater management facilities, and • Informal online valley storage generated by road or rail embanks which have been
determined to cause significant peak flow attenuation (applied for calibration only). Stormwater Management Facilities Reservoir routing for stormwater management facilities has been developed using stormwater management reporting and MOE Certificates of Approval (CofA’s) available from the City of Barrie and from topographic data where no other source was available. Simulation of individual stormwater management facilities was not necessarily completed for the 2011 URS study. If a subcatchment contained more than one stormwater management facility, the facilities were ‘lumped’ together at the outlet of the subcatchment. Lumping has been completed by summing the 5 year and 100 year storage ordinates from the rating curves of each facility in the

City of Barrie Hydrologic and Hydraulic Modelling DRAFT Technical Memorandum #1 April 2012
P:\Work\110135\corr\Report\SWM Master Plan\Tech Memos\H&H\Draft H&H Technical Memorandum #1(Apr 12).docx Page 9
subcatchment. The discharge ordinates for the 5 year and 100 year event were determined through iteration to utilize the available lumped storage for each ordinate respectively. This method is preferred by the LSRCA and is also supported by the NVCA (where existing SWM is not draining into the annexed lands) and as such has been applied for the current assessment where required by the addition of subcatchments in Bear Creek and Thornton Creek. Informal Online Valley Storage The 2011 URS report determined that three locations in the study area significantly attenuate peak flows behind road and rail embankments as follows: • Lover’s Creek at Innisfil Beach Road (Subcatchment S10); • Hewitts Creek at Mapleview Drive (Catchment 140); and, • Hewitts Creek at GO Crossing near 10th Line (Catchment 115). The reservoir routing elements determined by URS (2011) have been maintained in the current model for calibration and validation purposes only. The reservoir routing elements have been replaced with channel routing elements for the simulation of design peak flows (2 to 100 year return period and Regional Storm) as the attenuation is due to artificial and informal storage; this is in accordance with the River and Stream Systems Flooding Hazard Limit Technical Guide (MNR, 2002). 3.5 Hydrologic Model Calibration and Validation Hydrologic model calibration is completed in order to produce a simulated subwatershed runoff response that approximates the observed subwatershed runoff response, to the extent possible, thereby providing a more accurate tool for sizing stormwater management, hydraulic infrastructure (i.e. storm sewers, culverts, bridges) and natural channels. Calibration and validation exercises are proposed to be completed on the base parameterization of the hydrologic model described in Section 3.4 to verify the hydrologic response of the Visual OTTHYMO 2.0 models against field measured data (i.e. in-stream flow gauges). Calibration is achieved by modifying specific hydrologic parameters (generally empirical parameters not directly measurable) in an iterative fashion and simulating recorded precipitation data until the modeled stream flow response is reasonably comparable to the recorded stream flow response for a selection of rainfall events. The validation exercise uses the calibrated model to simulate a separate selection of rainfall events, comparing them to the recorded data to validate the calibration. If validation is not considered successful, subsequent calibration iterations may be required. For the current study, six discrete rainfall events (three low intensity and three high intensity, if available) will be selected from the months of May to October for the available period of record for calibration and a similar selection for validation. It has been noted in previous studies (URS 2011, MMM Group 2010) and by LSRCA staff that the available stream flow gauge has technical issues for high flow rates (measured as stream flow depth) which may complicate the calibration/validation effort. The quality of stream flow data will be reviewed prior to calibration. An analysis of the spatial variation of rainfall data will be completed to determine if spatially varying rainfall input is required for calibration/validation.

City of Barrie Hydrologic and Hydraulic Modelling DRAFT Technical Memorandum #1 April 2012
P:\Work\110135\corr\Report\SWM Master Plan\Tech Memos\H&H\Draft H&H Technical Memorandum #1(Apr 12).docx Page 10
3.5.1 Gauge Data Calibration and validation exercises rely on field measured data including precipitation gauges and stream flow gauges. Table 3.2 summarizes the precipitation and stream flow data available for the current study.
Table 3.2: Available Gauged Data Station No. of Years Start Year End Year Time Step Source
Precipitation Gauge Data Barrie WPCC 30 1978 2007 1 Hour Environment Canada
Egbert CS 11 1997 2007 1 Hour Environment Canada Egbert CARE 7 1989 1995 1 Hour Environment Canada
RG1 Big Bay Point Rd 7 2004 2011 5 Minutes City of Barrie RG2 Anne St. 7 2004 2011 5 Minutes City of Barrie
RG3 Johnson St. 7 2004 2011 5 Minutes City of Barrie Lover’s Creek 6 2006 2011 15 Minutes LSRCA
Stream Flow Gauge Data Lover’s Creek 10 2001 2011 15 Minutes LSRCA
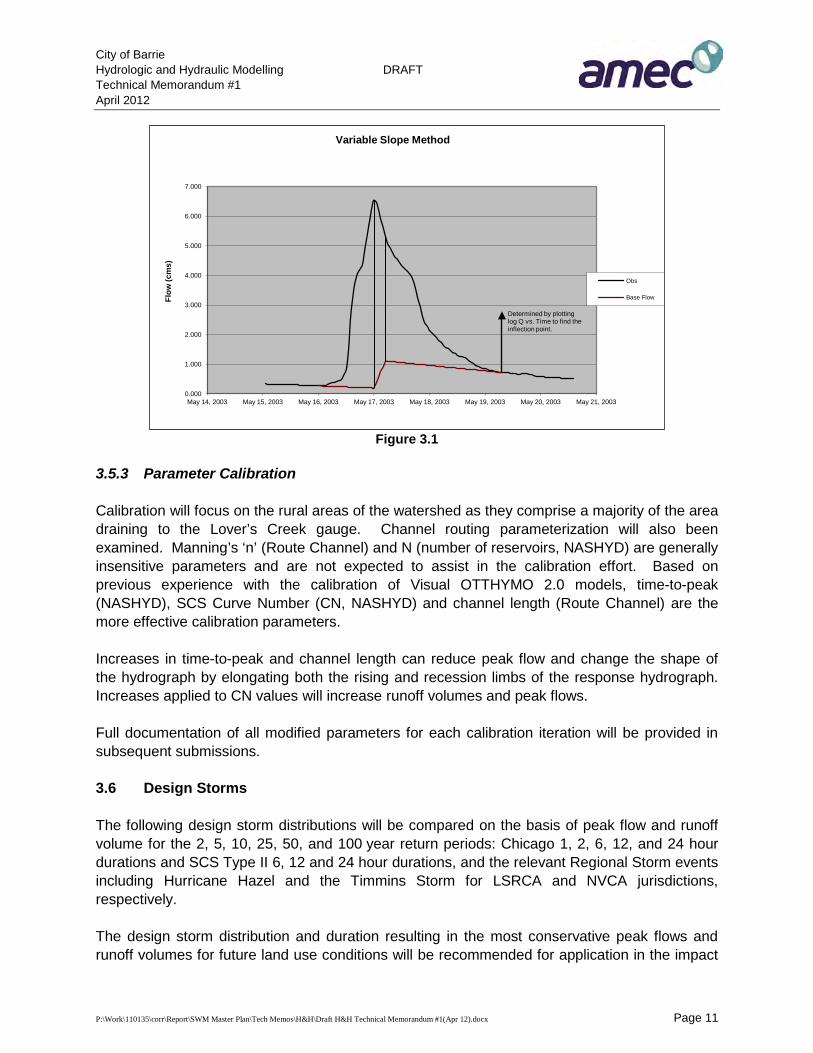
3.5.2 Baseflow Separation Baseflow separation will also be considered upon review of the available streamflow record. Baseflow separation is required when model calibration is carried out by simulation of discrete rainfall events without simulation of other hydrograph impacts, which would make up part of the observed hydrograph data including snow melt, interflow (flow through the soil zone between the surface and the groundwater table), and groundwater. Various baseflow separation techniques were evaluated for the calibration process including the straight line method, the fixed base method (Linsley et al) and the variable slope method. The fixed base method assumes runoff characteristics based on watershed area. The variable slope method accounts for individual storm responses for a given watershed; the separation technique is based on the characteristics of the recession curve (i.e. the runoff hydrograph inflection point and baseflow recession curves). Given the variability in runoff response expected for the individual events, the variable slope method is expected to be the most appropriate since it considers the differences in event response. In the variable slope method, the baseflow curve, prior to surface runoff response, is extrapolated forward to the time of peak discharge, and the baseflow curve after surface runoff ceases is extrapolated backward to the time of the point of inflection on the recession limb. A straight line is used to connect the endpoints of the extrapolated curves. Figure 3.1 illustrates the variable slope method.
City of Barrie Hydrologic and Hydraulic Modelling DRAFT Technical Memorandum #1 April 2012
P:\Work\110135\corr\Report\SWM Master Plan\Tech Memos\H&H\Draft H&H Technical Memorandum #1(Apr 12).docx Page 11
Figure 3.1
3.5.3 Parameter Calibration Calibration will focus on the rural areas of the watershed as they comprise a majority of the area draining to the Lover’s Creek gauge. Channel routing parameterization will also been examined. Manning’s ‘n’ (Route Channel) and N (number of reservoirs, NASHYD) are generally insensitive parameters and are not expected to assist in the calibration effort. Based on previous experience with the calibration of Visual OTTHYMO 2.0 models, time-to-peak (NASHYD), SCS Curve Number (CN, NASHYD) and channel length (Route Channel) are the more effective calibration parameters. Increases in time-to-peak and channel length can reduce peak flow and change the shape of the hydrograph by elongating both the rising and recession limbs of the response hydrograph. Increases applied to CN values will increase runoff volumes and peak flows. Full documentation of all modified parameters for each calibration iteration will be provided in subsequent submissions. 3.6 Design Storms The following design storm distributions will be compared on the basis of peak flow and runoff volume for the 2, 5, 10, 25, 50, and 100 year return periods: Chicago 1, 2, 6, 12, and 24 hour durations and SCS Type II 6, 12 and 24 hour durations, and the relevant Regional Storm events including Hurricane Hazel and the Timmins Storm for LSRCA and NVCA jurisdictions, respectively. The design storm distribution and duration resulting in the most conservative peak flows and runoff volumes for future land use conditions will be recommended for application in the impact
0.000
1.000
2.000
3.000
4.000
5.000
6.000
7.000
May 14, 2003 May 15, 2003 May 16, 2003 May 17, 2003 May 18, 2003 May 19, 2003 May 20, 2003 May 21, 2003
Flow
(cm
s)
Variable Slope Method
Obs
Base Flow
Determined by plotting log Q vs. Time to find the inflection point.

City of Barrie Hydrologic and Hydraulic Modelling DRAFT Technical Memorandum #1 April 2012
P:\Work\110135\corr\Report\SWM Master Plan\Tech Memos\H&H\Draft H&H Technical Memorandum #1(Apr 12).docx Page 12
assessment for the three (3) future land use options and the stormwater management assessment. The Regulatory event for each watercourse will be determined as the larger of the uncontrolled 100 year return period peak flow or the relevant Regional Storm event peak flow. The Regional Storm for LSRCA jurisdiction (Hurricane Hazel) has been simulated under AMC III conditions with Areal Reduction factors applied and the Regional Storm for NVCA jurisdiction (Timmins Storm) has been simulated under AMC II conditions, both in accordance with the Flood Plain Management Technical Guidelines (MNR, 1986). For the current submission, the SCS Type II 24 hour event has been simulated as it was determined to be the most conservative distribution in the 2011 URS study. 3.7 Results (Design Storms) The Visual OTTHYMO 2.0 hydrologic models have been simulated using the 2, 5, 10, 25, 50 and 100 year SCS Type II 24 hour design storms (1, 2, 6, and 12 hour durations will be computed for future submissions) and the 25 mm event and Regional Storms (Hurricane Hazel and Timmins storm for LSRCA and NVCA jurisdictions, respectively) to determine peak flow rates at key locations within the Bear Creek, Thornton Creek, Lover’s Creek, Hewitts Creek and Sandy Cove Creek subwatersheds for existing land use conditions. Tables 3.3 to 3.7 summarize design flows for the subject subwatersheds.

City of Barrie Hydrologic and Hydraulic Modelling DRAFT Technical Memorandum #1 April 2012
P:\Work\110135\corr\Report\SWM Master Plan\Tech Memos\H&H\Draft H&H Technical Memorandum #1(Apr 12).docx Page 13
Table 3.3: Bear Creek Peak Flows, Existing Land Use Conditions (m3/s)
Tributary Location Node
VO2 Node #
ARF1 (%) Area (ha)
Return Period (year)
2 5 10 25 50 100 100 UC Reg
East
Salem Road 508 1 42.96 0.12 0.24 0.33 0.47 0.59 0.72 0.72 0.97 Essa Road 9010 1 196.97 0.59 1.12 1.62 2.42 3.12 3.87 4.94 5.04
Annexation Boundary 9005 1 232.89 0.75 1.41 1.98 2.95 3.81 4.78 5.45 5.99 County Road 27 9543 1 535.09 8.82 13.35 16.97 22.67 27.01 33.16 54.21 29.46
West Salem Road 506 1 22.70 0.08 0.15 0.21 0.3 0.38 0.46 0.46 0.49
County Road 27, Annexation Boundary 9001 1 63.68 0.4 0.78 1.08 1.52 1.89 2.29 2.29 2.24
Confluence Confluence (limit of model) 9521 1 702.96 9.64 15.22 19.84 26.19 32.12 38.71 56.24 37.08 1 Areal Reduction Factor, UC = Uncontrolled
Table 3.4-Thornton Creek: Peak Flows, Existing Land Use Conditions (m3/s)
Tributary Location Node
VO2 Node #
ARF1 (%) Area (ha)
Return Period (year)
2 5 10 25 50 100 100 UC Reg
West McKay Rd East 9025 1 202.44 0.56 1.09 1.52 2.15 2.68 3.24 3.24 5.12
Annexation Boundary 9024 1 301.13 1.11 2.18 3.1 4.34 5.33 6.41 6.41 8.87
East McKay Rd East 9014 1 82.08 0.45 0.85 1.17 1.61 1.98 2.36 2.36 3.00
9th Line 9545 1 242.20 1.18 2.48 3.49 5.12 6.28 7.58 7.58 9.55
Main Branch
Annexation Boundary 9017 1 181.52 0.99 1.94 2.72 3.79 4.68 5.61 5.61 6.99 9th Line 9554 1 397.77 1.66 3.40 4.73 6.68 8.29 10.06 10.06 12.54
County Road 27 (limit of model) 9558 1 1233.76 5.17 10.67 15.27 22.42 27.98 34.17 34.17 46.80
1 Areal Reduction Factor, UC = Uncontrolled

City of Barrie Hydrologic and Hydraulic Modelling DRAFT Technical Memorandum #1 April 2012
P:\Work\110135\corr\Report\SWM Master Plan\Tech Memos\H&H\Draft H&H Technical Memorandum #1(Apr 12).docx Page 14
Table 3.5:-Lovers Creek Peak Flows, Existing Land Use Conditions (m3/s)
Tributary Location Node
VO2 Node #
ARF1 (%) Area (ha)
Return Period (year)
2 5 10 25 50 100 100 UC Reg
North (South of Salem Rd.)
Huronia Road 9350 1 384.53 3.89 6.37 11.56 18.5 24.1 30.63 50.5 49.71 Railway 9351 1 334.72 3.39 5.54 10.06 16.10 20.98 26.66 26.66 24.02
Highway 400 9352 1 209.78 2.12 3.48 6.31 10.09 13.15 16.71 16.71 15.05 Middle (North of McKay Rd.)
Huronia Road 200 1 88.13 0.74 1.39 1.79 2.6 3.17 3.76 3.76 8.40 Railway 201 1 43.25 0.36 0.68 0.88 1.28 1.56 1.85 1.85 4.12
South (South of McKay Rd.)
Huronia Road 140 1 253.93 1.39 2.63 3.61 4.99 6.11 7.29 7.29 19.86 Railway 141 1 189.23 1.04 1.96 2.69 3.72 4.55 5.43 5.43 14.80
Main Branch
Lockhart Road 9200 0.992 4355.69 16.19 30.74 42.03 58.80 70.26 86.19 85.09 258.64 Mapleview Drive East 9240 0.982 5078.34 17.20 33.21 43.23 62.81 76.01 90.86 89.42 299.74 Big Bay Point Road 9002 0.971 5703.02 20.06 37.24 48.13 68.10 82.38 96.85 94.44 311.80
Lakeshore Drive 9418 0.963 5822.39 20.30 37.59 48.66 68.64 83.11 97.58 97.82 319.33 Lake Simcoe 9999 0.963 5940.66 20.54 37.83 49.10 69.11 79.82 98.14 99.41 320.95
1 Areal Reduction Factor, UC = Uncontrolled
Table 3.6: Hewitts Creek Peak Flows, Existing Land Use Conditions (m3/s)
Tributary Location Node
VO2 Node #
ARF1 (%) Area (ha)
Return Period (year)
2 5 10 25 50 100 100 UC Reg
Main Branch
Lockhart Road 9130 1 895.61 4.02 8.90 12.78 18.00 22.07 26.64 26.64 66.78 Mapleview Dr. East 9140 0.992 1228.46 5.79 11.94 16.78 23.39 28.69 34.63 34.63 91.12
Big Bay Pt Road 9165 0.992 1625.06 8.07 15.00 20.54 28.36 34.54 41.44 45.13 113.04 Lake Simcoe 9170 0.982 1726.09 8.29 15.42 20.99 28.78 34.94 41.89 50.04 119.52
1 Areal Reduction Factor, UC = Uncontrolled
Table 3.7: Sandy Cove Creek Peak Flows, Existing Land Use Conditions (m3/s)
Tributary Location Node
VO2 Node #
ARF1 (%) Area (ha)
Return Period (year)
2 5 10 25 50 100 100 UC Reg
North (South of Mapleview Dr.) 20th Side Road 220 1 91.85 0.66 1.22 1.65 2.25 2.73 3.24 3.24 7.76
South 20th Side Road 225 1 87.86 0.73 1.37 1.87 2.57 3.13 3.73 3.73 7.55
Main Branch Confluence 9257 1 346.61 2.44 4.81 6.64 9.24 11.34 13.57 13.57 30.72 Sideroad 25 9250 1 1736.83 6.47 13.84 19.89 28.64 36.05 44.13 44.13 125.21 Lake Simcoe 9255 0.992 1827.06 6.28 13.43 19.33 27.84 35.24 43.22 43.22 125.81
1 Areal Reduction Factor, UC = Uncontrolled

City of Barrie Hydrologic and Hydraulic Modelling DRAFT Technical Memorandum #1 April 2012
P:\Work\110135\corr\Report\SWM Master Plan\Tech Memos\H&H\Draft H&H Technical Memorandum #1(Apr 12).docx Page 15
The results in Tables 3.3 to 3.7 demonstrate that under existing (uncontrolled) conditions the Regional Storms (Hurricane Hazel and Timmins Storm) produce higher flows than the 100 year storm for all nodes containing drainage area in the annexed lands only (i.e. undeveloped), and thus should be used in the hydraulic model for determining the existing Regulatory Floodplain. The 100 year event has been determined to govern at the following nodes: 9543, 9001 and 9521 in Bear Creek, and 9350, 9351 and 9352 in Lover’s Creek; these are typically nodes with fully urbanized drainage areas. This assessment will be re-evaluated for other design events and future land use scenarios in subsequent submissions. It is noted that the results reported here are consistent with the 2011 URS study with the exception of peak flows (2 to 100 year return period storms and the Regional storm) for nodes downstream of the online natural storage elements included in the 2011 URS model (i.e. on Lover’s and Hewitts Creeks); the storage elements have been removed from the current model to comply with MNR guidelines. 3.8 Erosion Assessment To address erosion impacts related to the proposed development in the annexed lands, a continuous simulation will be conducted. Continuous simulation has long been demonstrated to be a superior and more accurate method to assess instream erosion. The rationale and reason for this is that erosion tends to be an on-going process which occurs as a result of many different types of precipitation events over all seasons in a multi-year setting. Design event methodologies do no lend themselves to allowing for the assessment of these types of processes. Visual OTTHYMO 2 does not have a continuous modelling algorithm, therefore an alternate model will be developed using QUALHYMO. To achieve continuity between the two models the Visual OTTHYMO 2 parameters will be converted for use in QUALHYMO. The process includes parameter conversion, model set up and validation using Design Events and discrete events used in the calibration of the Visual OTTHYMO 2 model. While a ‘perfect’ match is never realized, experience has shown that a reasonably close comparison (<20% differences in peak flows) can be achieved with this technique. Once assembled and validated, the meteorological record needs to be prepared for use in the long term simulation. Frequency analysis of annual peaks is not proposed as the emphasis in this case will be on erosion assessment. 3.9 Duration Analysis Maximum permissible velocities will be calculated at selected erosion sites based upon existing substrate, channel geometry and longitudinal slope. The erosion potential within the channel bed and banks will be determined based upon the shear force caused by flowing water (also referred to as the tractive force), which is calculated based upon the channel slope and hydraulic radius (flow area divided by wetted perimeter). The tractive force will be compared to a maximum permissible tractive force (i.e. prior to erosion being caused), in order to determine the potential for erosion to occur. The excess shear (i.e. the amount of shear in excess of the critical shear threshold at each location) is calculated for various flow rates and flow depths. The maximum permissible velocity at each site will be converted to an equivalent maximum permissible shear force based upon the methods developed by MacCrae and Rowney (ref. The Role of Moderate Flow Events and Bank Structure in the Determination of Channel Response to Urbanization, 1992) and shear force relationships outlined by Lorant (ref. Vulnerability of Natural Watercourses to Erosion due to Different Flow Rates, 1982); the corresponding maximum

City of Barrie Hydrologic and Hydraulic Modelling DRAFT Technical Memorandum #1 April 2012
P:\Work\110135\corr\Report\SWM Master Plan\Tech Memos\H&H\Draft H&H Technical Memorandum #1(Apr 12).docx Page 16
permissible flow rate will be determined based upon the maximum permissible velocity and the hydraulic characteristics of the channel at each selected for the erosion assessment. The QUALHYMO model will be used for the erosion assessment. Continuous simulation will be completed using the available rainfall data and duration analyses will be completed in order to determine the duration (i.e. number of hours) of flows within specific ranges. Representative flow rates will be defined for each range, as well as the corresponding tractive force and shear exceedance above the critical shear, for the channel bed and banks. Comparison of shear exceedance between existing and future land uses will be completed to determine the impact related to development of the annexed lands.

City of Barrie Hydrologic and Hydraulic Modelling DRAFT Technical Memorandum #1 April 2012
P:\Work\110135\corr\Report\SWM Master Plan\Tech Memos\H&H\Draft H&H Technical Memorandum #1(Apr 12).docx Page 17
4.0 HYDRAULICS Hydraulics relates to the calculation of water surface elevations for the design storm peak flows generated by the hydrologic models and the delineation of the Regulatory floodplain. 4.1 Model Development Hydraulic models have been developed for Bear Creek, Thornton Creek, Lover’s Creek, Hewitts Creek and Sandy Cove Creek using HEC-RAS Version 4.0. The base hydraulic models for creeks under LSRCA jurisdiction have been developed and provided by LSRCA (i.e. Lover’s Creek, Hewitts Creek, Sandy Cove Creek). The geometry data has been developed using HEC-GeoRAS which is GIS-based tool that streamlines the task of defining cross-sections and reach lengths by generating raw geometry files which are compatible with HEC-RAS. Hydraulic structures (i.e. culverts, bridges, etc.) have been manually added from data collected by geodetic survey (completed by Rudy Mak, 2010) and field measurement by LSRCA staff. Manning’s ‘n’ values have been determined through review of aerial photography and field investigation. Various reaches have been added or extended for the current study to capture all watercourses with a drainage area greater than 50 hectares. Additional geodetic survey has been completed by AMEC to establish geometry for hydraulic structures (inverts and opening sizes) in the annexed lands not captured in the Rudy Mak survey. Figure C1 (Appendix ‘C’) identifies the hydraulic structures surveyed by both Rudy Mak and AMEC. The hydraulic models for creeks under NVCA jurisdiction have been developed for the current study using the methodology discussed above. Reference Figures C2 to C6 (Appendix ‘C’) for HEC-RAS cross section location plans for all creeks. 4.2 Hydraulic Model Calibration and Validation Calibration of hydraulic models relies on measured or observed peak water surface elevations for storm event flows. Successful hydraulic calibration is dependent on simulated peak flows matching observed peak flows as such is reliant on accurate hydrologic calibration. Steady state simulations (i.e. typically applied for calculation of Regulatory floodplains) may overestimate water surface elevations upstream of hydraulic structures where large volumes of valley storage are available since steady state simulations make no account for runoff volume associated with the design event. This can be partially addressed by including routing elements in the hydrologic model to account for flow attenuation behind hydraulic structures. If observed water surface elevation data is upstream of hydraulic crossings, it may also be beneficial to calibrate hydraulic models using unsteady state simulations (i.e. simulating hydrographs) in order to more accurately calculate backwater conditions. Often reliable long-term gauged data is not available to thoroughly calibrate and validate hydraulic models. However, observed high-water marks can be useful in verifying hydraulic modelling results if precipitation data is available for the observed event.

City of Barrie Hydrologic and Hydraulic Modelling DRAFT Technical Memorandum #1 April 2012
P:\Work\110135\corr\Report\SWM Master Plan\Tech Memos\H&H\Draft H&H Technical Memorandum #1(Apr 12).docx Page 18
No observed data is currently available – a request for this type of data will be formally made to the City of Barrie, LSRCA and NVCA. 4.3 Results The HEC-RAS hydraulic models have been simulated for the 2, 5, 10, 25, 50 and 100 year SCS Type II 24 hour design storms and the Regional Storm (Hurricane Hazel and Timmins storm for LSRCA and NVCA jurisdictions, respectively) to determine water surface elevations along Bear Creek, Thornton Creek, Lover’s Creek, Hewitts Creek and Sandy Cove Creek for existing land use conditions. Tables 4.1 to 4.5 summarize the simulated instantaneous peak flow water surface elevations at key locations for the subject watercourses in the reaches within the annexed lands.
Table 4.1: Existing Condition Water Surface Elevations (m) for Bear Creek
Location Section No.
Frequency (Years) 2 5 10 25 50 100 Regional
Salem Road 4101.763 309.3 309.34 309.36 309.39 309.4 309.42 309.45 Essa Road 3155.997 301.72 302.17 302.76 302.89 302.91 302.93 302.95 Annexation Boundary 2391 287.02 287.20 287.33 287.52 287.67 287.8 287.95
County Road 27 1784 278.22 278.87 279.52 280.74 282.05 282.15 282.12 Salem Road 1953.891 304.4 304.41 304.43 304.44 304.43 304.44 304.44
County Road 27, Annexation Boundary
1271 288.77 288.95 289.07 289.23 289.35 289.48 289.46
Confluence (limit of model) 106.5739 252.72 252.82 252.90 252.99 253.06 253.14 253.05
Table 4.2: Existing Condition Water Surface Elevations (m) for Thornton Creek
Location Section No.
Frequency (Years) 2 5 10 25 50 100 Regional
McKay Rd East 2644.868 305.16 305.47 305.74 305.91 305.92 305.91 305.93 Annexation Boundary 1706.967 299.85 299.91 299.95 299.99 300.02 300.05 300.11
McKay Rd East 8099.509 307.81 307.82 307.83 307.85 307.85 307.86 307.88 9th Line 6347.604 303.62 304.19 304.72 305.71 305.77 305.79 305.84
Annexation Boundary 7283.705 306.13 306.25 306.32 306.42 306.49 306.56 306.66
9th Line 882.5558 296.35 297.12 297.33 297.38 297.43 297.5 297.56 County Road 27 (limit of model) 193.3641 282.73 282.97 283.13 283.33 283.46 283.59 283.83

City of Barrie Hydrologic and Hydraulic Modelling DRAFT Technical Memorandum #1 April 2012
P:\Work\110135\corr\Report\SWM Master Plan\Tech Memos\H&H\Draft H&H Technical Memorandum #1(Apr 12).docx Page 19
Table 4.3: Existing Condition Water Surface Elevations (m) for Lovers Creek
Location Section No. Frequency (Years)
2 5 10 25 50 100 Regional Upper Trib-
Huronia Road 271.5753 247.51 247.8 249.2 249.53 249.53 249.61 249.76
Upper Trib-Railway 1369 264.45 266.42 268.87 273.58 274.87 274.92 275.11
Upper Trib-Hwy 400 2938.885 276.44 276.80 277.07 277.56 278.07 278.75 280.19
Middle Trib-Huronia Road 100 250.07 250.10 250.13 250.14 250.14 250.16 250.22
Middle Trib-Railway 400 275.02 275.05 275.06 275.09 275.11 275.12 275.22
Lower Trib-Huronia Road 722 257.00 257.69 258.39 258.49 258.53 258.58 258.74
Lower Trib-Railway 2042 281.63 281.97 282.19 282.49 282.72 282.98 287.33
Table 4.4: Existing Condition Water Surface Elevations (m) for Hewitts Cove
Location Section No. Frequency (Years) 2 5 10 25 50 100 Regional
Lockhart Road 5605.709 254.02 254.51 255.37 255.4 255.32 255.54 256.46
Mapleview Dr. East 3445.696 245.88 246.2 246.54 247.12 247.54 247.72 247.85
Big Bay Pt Road 1460.708 239.74 240.23 240.4 240.59 240.74 240.9 242.71
Lake Simcoe 46.29602 219.51 219.58 219.61 219.67 219.73 219.80 220.30
Table 4.5: Existing Condition Water Surface Elevations (m) for Sandy Cove
Location Section No. Frequency (Years) 2 5 10 25 50 100 Regional
20th Side Road 5509.02 245.83 246.07 246.24 246.46 246.66 246.92 247.86
20th Side Road 713.9764 247.92 248.18 248.35 248.58 248.76 249 249.18
Confluence 4758.110 238.98 239.14 239.1 239.14 239.18 239.19 239.41 Sideroad 25 1850.782 228.51 228.83 229.05 229.33 229.55 229.77 232.83 Lake Simcoe 11.93202 219.62 219.68 219.73 219.78 219.82 219.87 220.23 The Regional Storm event water surface elevations have been used to generate the Regulatory floodplain for all creeks with the exception of the lower reach of Bear Creek for which the 100 year water surface elevations have been used as the 100 year event is greater than the hydrology and hydraulics for this reach. The accuracy of the ultimate Regulatory floodline is a function of the accuracy of available data and modelling assumptions related to the hydrology and hydraulics. Accuracy of the hydrologic calibration or parameterization variation where calibration is not completed, contributes to some uncertainty in the simulated Regulatory peak flows. Similarly, parametric assumptions in the hydraulic model compound the range in peak flows when used to determine water surface elevations. Generally, conservatism is built into both the hydrologic and hydraulic models and the applied methodologies (i.e. steady state flow simulation in the hydraulic modelling) to generate Regulatory water surface elevations that will

City of Barrie Hydrologic and Hydraulic Modelling DRAFT Technical Memorandum #1 April 2012
P:\Work\110135\corr\Report\SWM Master Plan\Tech Memos\H&H\Draft H&H Technical Memorandum #1(Apr 12).docx Page 20
safely guide future development. Additional uncertainty is introduced when simulated water surface elevations are translated into the Regulatory floodplain using topographic mapping (the level of this accuracy depends on how the topographical information was generated). Figures 7 and 8 illustrate the existing land use Regulatory floodplain within the Annexed lands.


